
Disclaimer - Main Page | Al Ahli Bank of Kuwait … Presentation...May 1967, Al Ahli Bank of Kuwait...
23
0
Transcript of Disclaimer - Main Page | Al Ahli Bank of Kuwait … Presentation...May 1967, Al Ahli Bank of Kuwait...

0

DisclaimerTHE INFORMATION SET OUT IN THIS PRESENTATION AND PROVIDED IN THE DISCUSSION SUBSEQUENT THERETO DOES NOT CONSTITUTE AN OFFER OR SOLICITATIONOF AN OFFER TO BUY OR SELL SECURITIES. IT IS SOLELY FOR USE AT AN INVESTOR PRESENTATION AND IS PROVIDED AS INFORMATION ONLY. THIS PRESENTATIONDOES NOT CONTAIN ALL OF THE INFORMATION THAT IS MATERIAL TO AN INVESTOR. This presentation has been prepared by (and is the sole responsibility of) Al AhliBank of Kuwait K.S.C.P. (the “Bank”).The information herein may be amended and supplemented and may not as such be relied upon for the purposes of entering into any transaction. This presentation maynot be reproduced (in whole or in part), distributed or transmitted to any other person without the Bank's prior written consent.
The information in this presentation and the views reflected therein are those of the Bank and are subject to change without notice. All projections, valuations andstatistical analyses are provided to assist the recipient in the evaluation of the matters described herein. They may be based on subjective assessments and assumptionsand may use one among alternative methodologies that produce different results and, to the extent that they are based on historical information, they should not berelied upon as an accurate prediction of future performance. These materials are not intended to provide the basis for any recommendation that any investor shouldsubscribe for or purchase any securities.
This presentation does not disclose all the risks and other significant issues related to an investment in any securities/transaction.
Past performance is not indicative of future results. Al Ahli Bank of Kuwait is under no obligation to update or keep current the information contained herein. No personshall have any right of action against the Bank or any other person in relation to the accuracy or completeness of the information contained in this presentation. Noperson is authorized to give any information or to make any representation not contained in and not consistent with this presentation, and, if given or made, suchinformation or representation must not be relied upon as having been authorized by or on behalf of the Bank.
This presentation does not constitute an offer or an agreement, or a solicitation of an offer or an agreement, to enter into any transaction (including for the provision ofany services). No assurance is given that any such transaction can or will be arranged or agreed.
Certain statements in this presentation may constitute forward-looking statements. These statements reflect the Bank’s expectations and are subject to risks anduncertainties that may cause actual results to differ materially and may adversely affect the outcome and financial effects of the plans described herein. You arecautioned not to rely on such forward-looking statements. The Bank does not assume any obligation to update its view of such risks and uncertainties or to publiclyannounce the result of any revisions to the forward-looking statements made herein.
2

Table of Contents
Section 1 ABK Introduction & Key Highlights
Section 2 Kuwait Country and Banking Snapshot
Section 3 ABK Strategy and Business Overview
Section 4 Financial Performance
x
x
x
x
4
7
11
17
Page #
Section 5 Appendix 21
3
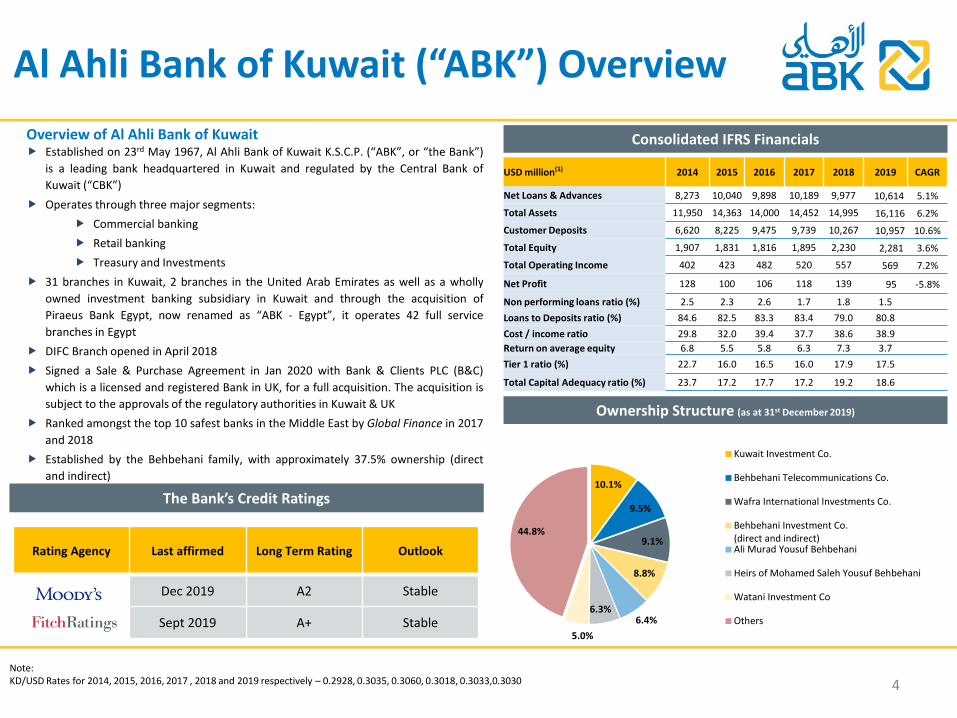
USD million(1) 2014 2015 2016 2017 2018 2019 CAGR
Net Loans & Advances 8,273 10,040 9,898 10,189 9,977 10,614 5.1%Total Assets 11,950 14,363 14,000 14,452 14,995 16,116 6.2%
Customer Deposits 6,620 8,225 9,475 9,739 10,267 10,957 10.6%
Total Equity 1,907 1,831 1,816 1,895 2,230 2,281 3.6%Total Operating Income 402 423 482 520 557 569 7.2%
Net Profit 128 100 106 118 139 95 -5.8%
Non performing loans ratio (%) 2.5 2.3 2.6 1.7 1.8 1.5Loans to Deposits ratio (%) 84.6 82.5 83.3 83.4 79.0 80.8Cost / income ratio 29.8 32.0 39.4 37.7 38.6 38.9Return on average equity 6.8 5.5 5.8 6.3 7.3 3.7Tier 1 ratio (%) 22.7 16.0 16.5 16.0 17.9 17.5
Total Capital Adequacy ratio (%) 23.7 17.2 17.7 17.2 19.2 18.6
Established on 23rd May 1967, Al Ahli Bank of Kuwait K.S.C.P. (“ABK”, or “the Bank”)is a leading bank headquartered in Kuwait and regulated by the Central Bank ofKuwait (“CBK”)
Operates through three major segments: Commercial banking Retail banking Treasury and Investments
31 branches in Kuwait, 2 branches in the United Arab Emirates as well as a whollyowned investment banking subsidiary in Kuwait and through the acquisition ofPiraeus Bank Egypt, now renamed as “ABK - Egypt”, it operates 42 full servicebranches in Egypt
DIFC Branch opened in April 2018 Signed a Sale & Purchase Agreement in Jan 2020 with Bank & Clients PLC (B&C)
which is a licensed and registered Bank in UK, for a full acquisition. The acquisition issubject to the approvals of the regulatory authorities in Kuwait & UK
Ranked amongst the top 10 safest banks in the Middle East by Global Finance in 2017and 2018
Established by the Behbehani family, with approximately 37.5% ownership (directand indirect)
4
Al Ahli Bank of Kuwait (“ABK”) OverviewConsolidated IFRS Financials
The Bank’s Credit Ratings
Rating Agency Last affirmed Long Term Rating Outlook
Dec 2019 A2 Stable
Sept 2019 A+ Stable
Overview of Al Ahli Bank of Kuwait
Note: KD/USD Rates for 2014, 2015, 2016, 2017 , 2018 and 2019 respectively – 0.2928, 0.3035, 0.3060, 0.3018, 0.3033,0.3030
Ownership Structure (as at 31st December 2019)
10.1%
9.5%
9.1%
8.8%
6.4%6.3%
5.0%
44.8%
Kuwait Investment Co.
Behbehani Telecommunications Co.
Wafra International Investments Co.
Behbehani Investment Co.(direct and indirect)Ali Murad Yousuf Behbehani
Heirs of Mohamed Saleh Yousuf Behbehani
Watani Investment Co
Others

5
ABK Key Highlights
• 79% of the total liabilities consist of customer deposits • Liquidity coverage ratio 315% & Net Stable Funding Ratio
of 108%• Leverage of 12%, above the 3% required by the CBK Basel
III leverage ratio
• 2% Growth in Operating Income• Total Assets reached KD 4.9 billion ,up 7% from Dec
2018• Customer Deposits at KD 3.3 billon , up 7% from Dec
2018• NPL ratio at 1.46% and provision coverage at 365%• Excess credit provisions of KD 77.2 million over and
above CBK prescribed IFRS 9 requirements• Pre-provision income to average asset ratio at 2.24%• One of the highest NIM’s among all conventional banks
in Kuwait • Second best rated conventional bank in Kuwait
• Tier 1 ratio of 17.5% & CAR of 18.6% • In September 2018 the Bank issued a US$ 300 Million
Perpetual Tier 1 capital bond on the International Capital Markets, which was oversubscribed with very strong interest from investors outside the MENA region
• Established in 1967 by the Behbehani family, ABK has retained the same core shareholder base since then
• Has a strong and stable Board and a long-serving executive team with a proven track record in Kuwait
• Kuwait represents one of the strongest macro profiles with solid fundamentals in the GCC, stable Aa2/AA rating
• Stable banking sector with prudent regulatory environment
• Highly liquid banking system supported by government spending, enabling healthy operating conditions
Robust capitalization & strong balance sheetStable funding base & good liquidity buffers
Committed shareholder base and a well-experienced management team
Strong Profitability & sound asset qualityStable macro environment & solid banking system

Agenda
Section 1
Section 2
Section 3
Section 4
Section 5
Introduction to ABK & Key Highlights
Kuwait Country and Banking Snapshot
ABK Strategy and Business Overview
Financial Performance
Appendix
x
x
x
x
x
4
7
11
17
21
Page #
6

7
Overview of Kuwait
Key Economic Indicators
Stable
StableAA
StableAA
Rating Outlook
Aa2
Current Account Balance (USD billions)Stable Production, amongst the top 10 globally
Source: (1) Public Authority for Civil Information (2) Kuwait Central Statistical Bureau (3) Rating agencies (4) Organization for petroleum Exporting countries (5) Sovereign Wealth Fund Institute
Population 4.4 million
Nominal GDP (2019E) USD 130 billion / KD 40 billion
Oil Revenues as % of GDP (2019 E) 44.7%
Oil Reserves (2018)5th largest in the world at 101.5bn barrels;
more than 8% of the world’s total oil reserve
Public Debt/GDP (2019E) 14.4%
Sovereign Wealth Fund AUM USD 592 billion
2.9 2.9 2.9 3.02.7 2.7
2013 2014 2015 2016 2017 2018
Average Crude Oil production (millions bbl/day)
-5.10
7.60
22.00
13.80
2016 2017 2018 (P) 2019 (P)
Kuwait

23Banks
All banks regulated by the Central
Bank of Kuwait 12
foreign bank branches
USD
234bn(1)
of banking assets
100%(2)
Principal Deposit
Guarantee Law in effect
Stringent
Basel III requirements
5 local
Islamic Banks
6Conventional
Banks
• The Kuwaiti banking sector comprises of 23 banks, including sixconventional banks ( one specialised bank), five Shari’a-compliantlocal banks and branches of 12 international banks which includes anon-Kuwaiti Islamic bank.
• Highly regulated sector by the CBK with a number of regulations andsupervisory practices in place monitoring interest rates charged,lending limits and concentrations, investment limits, liquidity andcapital adequacy.
• The government’s financial strength underpins its capacity toprovide support to the banking sector with historical evidence ofsupport. Most recently, in 2008, the State of Kuwait offered capitalsupport to a bank as well as introduced a guarantee on customerdeposits under the Deposits Guarantee Law following the globalfinancial crisis.
• Capital adequacy standards under the Basel III framework wereimplemented by CBK In June 2014. The Tier I ratio and the total capitaladequacy ratio required by the CBK are 11% and 13% respectivelyfrom December 31, 2016. ABK has been designated as a domesticallysystemic important bank (“D-SIB”) with an additional Common EquityTier 1 D-SIB surcharge of 0.5% required from December 31, 2016.
Kuwaiti banking sector snapshot
Overview of KuwaitBanking Sector
(1) Central Bank of Kuwait , KD/USD = 0.3030 as of 31 December 2019(2) The Kuwaiti government passed Law No.30 of 2008 (the “Deposits Guarantee Law”) to guarantee deposits held with local banks. Under the Deposit Guarantee Law, the Kuwaiti
government has undertaken to guarantee the principal, but not interest, of all deposits held with local banks in Kuwait, including savings and current accounts 8

Peer ComparisonA well established Kuwaiti Bank
9
15.8%
16.5%
16.6%
18.2%
18.3%
NBK
GBK
BB
CBK
ABK
Total Assets (USD billions) Loans and Advances (USD billions)
Customer Deposits (USD billions) Capital Adequacy Ratio
95.1
22.2
20.2
15.9
15.5
51.9
13.0
12.5
10.7
7.9
53.8
13.9
13.6
10.5
7.4
All financials are as of 30 Sept ’19Using KD/USD = 0.3040, as of 30 Sept 2019
* As of 31st March 2019
*

Agenda
Section 1
Section 2
Section 3
Section 4
Section 5
Introduction to ABK & Key Highlights
Kuwait Country and Banking Snapshot
ABK Strategy and Business Overview
Financial Performance
Appendix
x
x
x
x
4
7
11
17
21
Page #
10

11
ABK’s Strategy
The Group’s Vision is “reimagining a simpler bank” and itsMission is “to consistently provide experiences that simplify and enrich people’s lives”
Transparency Integrity Simplicity Excellence| | |
Simplification New Productsand Segments
Retail Banking• SME & Wealth Management• Cross Border offerings• Footprint expansion ( ATMs, Kiosks,
Direct Sales agents)• Introduce Digital Wallet
Wholesale Banking
• Cash Management and Global TradeServices
• Corporate Finance and Advisory• UAE Commercial Business
Redefine our core competencies
• Exit or curtail non-core businesses• Outsource non-core activities• Rationalize retail product offerings• Remodel ACIC around Issuers and
Investors
Re-engineer our credit approval process
• Redesigned CAR and CreditApproval process
• Standardized ORR and FRR models
Best-in-class turnaround times “make banking easy”
• Account Opening• Loans and Cards• All other services at Branch levels
Growing regional and domestic business
• Investing outside Kuwait fordiversification and increased revenues
• DIFC Branch• Cross border products• Wealth/Private Bank
Key EnablersUpgrade our Infrastructure:• AML System, Risk Monitoring & Reporting Tools Empower our People:• Performance Management (“Pay for Performance”) • Talent Management (“Promote the High Potential”)Digital Transformation :• Data Repository & Analytics• Robotic Process automation• Best in Class cyber- security

12
Overview of ABK’s Business Segments
comprises a full range of products and servicesto retail customers, including loans, credit cards,deposits and wealth management services
Retail Banking
comprises treasury services provided tocustomers and balance sheet managementactivities, including money market, derivatives,proprietary investment activities and theresidual impact of inter-segment fund transferpricing
Treasury &Investment
Breakdown by Assets1,2 (KD million)
64% 64% 61% 56% 56%
12% 13% 14% 15% 15%
24% 23% 25% 29% 29%4,280 4,215 4,281 4,477 4,795
2015 2016 2017 2018 2019
Commercial banking Retail banking Treasury & Investments
comprises a full range of credit, deposit andrelated banking services provided to itscorporate and institutional customers
CommercialBanking
Note: (1) International results included under Commercial Banking, Retail Banking and Treasury & Investment based on segmental regrouping undertaken by the bank in 2017(2) Excludes unallocated assets for 2015, 2016, 2017, 2018 &2019 respectively - KD 79 million, KD 70 million, KD 80 million, KD 71 million & KD 88 million respectively
Breakdown by Operating Income
55%36%
9%
KD 168.8 million
FY 2018
56%37%
7%
FY 2019
KD 172.5 million

Segment Assets1 (KD million)
Corporate Banking:• Split into 8 specialized business units, each with a broad product range for
corporate clients• Services range from traditional working capital finance to complex structured
financial products for large projects and multinational companies
International Banking:• Operates from the Group’s head office in Kuwait is responsible for the Group’s
relationship with major international banks and correspondent banks aroundthe world, including the Nostro and Vostro accounts for and within the Group
• The international banking division manages the Group’s institutional and multi-national corporate loan portfolio through relationship managers
Operating Income1 (KD million)
13
Commercial & Retail Banking
Commercial Banking
70% 66% 63%61%
60%
30% 34% 37% 39% 40% 116
146 144 153 160
2015 2016 2017 2018 2019
Commercial banking Retail banking
84% 83% 81% 79% 79%
16% 17% 19% 21% 21%
3,235 3,247 3,193 3,187 3,379
2015 2016 2017 2018 2019
Commercial banking Retail banking
• Target additional growth through acquisition of retail portfolios, enhanced digitalofferings & continued focus on simplicity
• Co-branding arrangement with Emirates Airlines in place for its credit and prepaidcards as well as the first bank in Kuwait to offer a single multi-currency card
Key Stats - Kuwait• 31 branches , 160 ATMs & 3 ITMs (interactive teller machines) as of 31 December
2019• 165,290 Retail Banking customers as of 31 December 2019• 166,665 active cards in circulation with a total spend of KD 957mn in 2019• 96,614 registered SMS and mobile application banking customers• 317,695 transaction executed for such subscribers during 2019• 2,35,183 telebanking calls in 2019• 41-member direct sales force in Kuwait
Key Stats - Egypt• 42 branches and 108 ATMs across major cities as of 31 December 2019
Retail Banking
Note: (1) International results included under Commercial Banking, Retail Banking and Treasury & Investment based on segmental regrouping undertaken by the bank in 2017

14
Treasury and Investments & Ahli CapitalTreasury and Investments• The Group’s Treasury manages the Group’s assets and liabilities and liquidity
requirements under the supervision of the Assets and Liabilities Committee
• Manages the money market books and money market funding positions forthe Group’s own account to fund its domestic and international foreign-currency assets;
• Undertakes a range of foreign exchange business, across both spot andforward markets, largely on behalf of the Group’s customer base, andconducts a limited amount of proprietary foreign exchange trading withinthe constraints of what the Group considers to be prudent risk guidelines;
• Maintains a portfolio of Kuwaiti government treasury bills and bonds tomeet relevant CBK requirements and to manage surplus domestic currencyliquidity
• The Group’s investment unit is responsible for managing the Group’s fixedincome proprietary portfolio with the objective of realising income whileminimizing the risk of default
Segment Assets1 (KD million)
Ahli Capital• Established in June 2006 to be the main investment arm of the Group• Currently manages the Al Ahli Kuwaiti Fund , Al Ahli International Multi asset holding fund, Al Ahli Gulf Fund and also manages client investment
portfolios. As at 31 December 2019, Ahli Capital had KD 537 million of assets under management• The Al Ahli Kuwait Fund aims to achieve capital growth through active investment management, targeting the securities of companies listed on
the Kuwait Stock Exchange• The Al Ahli Gulf Fund aims to achieve capital growth through investment in the securities of companies listed on GCC stock exchanges• Ahli Capital has recently partnered with BlackRock to manage Ahli International Multi – Assets Holding Fund which aims to provide long term
capital appreciation while diversifying risk globally with International investment spread across different asset classes
1,046 969 1,089 1,290 1,416
2015 2016 2017 2018 2019
Source: ABKNote: (1) International results included under Commercial Banking, Retail Banking and Treasury & Investment based on segmental regrouping undertaken by the bank in 2017

The Group’s International operations encompass the operations of its UAE branches and its ABK Egypt subsidiary contributing around 30% of Operating income and 25% of assets
15
International operations
• Acquired Piraeus Bank Egypt in November 2015, since renamed Al Ahli Bank of Kuwait –Egypt
• Provides revenue and asset diversification and an opportunity to leverage economic linksbetween Kuwait and Egypt
• Higher margins and growth rate potential in Egypt vis-à-vis Kuwait• 42 Branches and 108 ATMS spread across major cities in Egypt as of 31 December 2019• Over 176,000 retail customers as of 31 December 2019• Retail Banking accounts for 36% of total deposits and 31% of total loans as of 31
December 2019• Corporate Banking accounts for 64% of total deposits and 69% of total loans as of 31
December 2019• Assets attributable to ABK Egypt constituted 14.5% of the Group’s total assets as of 31
December 2019
• First Kuwaiti bank in the UAE and currently has three branches, located in Dubai, AbuDhabi and DIFC, respectively
• Operating for over 40 years in Dubai where its branch was originally opened to supportthe needs of Kuwaiti businesses in Dubai
• Abu Dhabi branch opened in 2009, since then the Group has expanded its UAE activities toprovide retail deposit taking services to customers in the UAE, as well as a range offinancing and treasury solutions to corporate customers
• DIFC Branch opened in April 2018
Al Ahli Bank of Kuwait - UAE
Al Ahli Bank of Kuwait - Egypt
Total Assets1 (KD million)
Operating Income1 (KD million)
15
3732
3949
2015 2016 2017 2018 2019
835 875 909 1,013 1,168
2015 2016 2017 2018 2019
Note: (1) International results included under Commercial Banking, Retail Banking and Treasury & Investment based on segmental regrouping undertaken by the bank in 2017

Agenda
Section 1
Section 2
Section 3
Section 4
Section 5
Introduction to ABK & Key Highlights
Kuwait Country and Banking Snapshot
ABK Strategy and Business Overview
Financial Performance
Appendix
x
x
x
x
x
4
7
11
17
21
Page #
16

Equity
17
Loans portfolio, Funding and Liquidity
Loan Growth (KD million) Gross Maximum Exposure by Credit Risk1
(as at 31 December 2019)
2,059 2,538 2,493 2,488 2,399 2,544 363 509 536 587 627 672
2.45% 2.28% 2.55% 1.67% 1.78%
5.9%6.5%
7.1% 6.8%7.8%
6.2%
2014 2015 2016 2017 2018 2019Corporate and Banks RetailNon Performing Loans Ratio Provision for credit losses
1.46%
Funding Profile (KD million)
2
Maturity Profile for Liabilities
31%
45%
24%
Less than one month One month to one year Over one year
FY 2018
Due to banks and other financial institutionsCustomer DepositsMedium term notes
Note: (1) Gross Maximum Exposure includes Loans and advances, Inter bank placement, Investments and Un-funded exposures(2) Attributable to shareholders of the Bank excluding non-controlling interests and includes Perpetual Tier 1 capital securities of KD 91m issued in Sep 18
1,938 2,496 2,900 2,939 3,115 3,320
9241,199 735 596 501 600150 151 151
558
556 555 572 676690
3,420
4,251 4,190 4,258 4,443 4,761
2014 2015 2016 2017 2018 2019
30%
45%
25%
FY 2019
FY 2018 FY 2019
18%
16%
19%18%
13%
16%18%
19%
20%
15%
12%
16%
Personal Government and related entitiesConstruction and real estate Banks and financial institutionsTrading and manufacturing Others

18
Operating Performance
Note: (1) Includes Net foreign exchange gain, Net (loss)/gain on investment securities , Dividend income, Share of results of associate & Other income
117.6 128.5 147.5 157.0 168.8 172.5
29.8% 32.0%39.4% 37.7% 38.6% 38.9%
2014 2015 2016 2017 2018 2019
Operating income Cost to income ratio (%)
Profitability (KD million) Operating metrics (%)
Operating Income (KD million) & Cost to Income (%) Breakdown of Operating Income
37.630.4 32.5 35.7
42.128.7
32.0%
23.6% 22.0% 22.7%
25.0%
16.6%
2014 2015 2016 2017 2018 2019
Net profit Net profit margin
72% 73% 74% 72% 71% 71%
20% 20%21% 19% 20% 18%
8%7%
5% 10%9% 11%
2014 2015 2016 2017 2018 2019
Net interest income Net fee and commission incomeOther income¹
1.10% 0.80% 0.80% 0.82% 0.95%0.47%
6.8%
5.5% 5.8%6.3%
7.3%
3.7%
2014 2015 2016 2017 2018 2019
RoAA RoAE

Basel III
Capital Adequacy Ratio Regulatory Capital (KD, million)
19
Capitalisation Overview
• *Including D-SIB charge. The Group has been designated as a domestically systemic importantbank (“D-SIB”) with an additional Common Equity Tier 1 D-SIB surcharge of 0.5 per cent. requiredfrom 31 December 2016. As a result, the Group’s total minimum capital requirement from thatdate is 13.5 per cent., which includes a capital conservation buffer.
• The principal factor behind the Group’s falling capital ratios in 2015 was the significant increasein its risk weighted exposures, reflecting the increase in its portfolio of loans and advances in2015 and to a lesser extent a decrease in the available capital as a result of the acquisition ofPireaus Bank Egypt. 2018 Capital ratio increase is driven by issuance of Additional Tier 1 capitalsecurities of KD 91m
10.5%11.0% 11.5% 11.5% 11.5%
12.5%13.0% 13.5% 13.5% 13.5%16.0% 16.5% 16.0%
17.9% 17.5%17.2% 17.7% 17.2%
19.2% 18.6%
2015 2016 2017 2018 2019
Min Required Tier 1 Min. Required CAR* Tier 1 CAR
508 524 535
640 66038
38 40
43
546 562
576
450
500
550
600
650
2015 2016 2017 2018 2019
Tier 1 Tier 2 capital
683
Key Central Bank of Kuwait Regulations & Requirements*
Common Equity Tier 1 9.5%Tier 1 Capital Ratio 11.0%Capital Adequacy Ratio 13.0%D-SIB surcharge 0.5%
Net Stable Funding Ratio Equal to at least 100% on an ongoing basis effective from 1st January 2018
Liquidity Coverage Ratio Minimum of 70% which will later reach 100% by 2019
Loan to Deposit Ratio Capped at 90%
Investment LimitsTotal ratio of securities portfolio excluding
government bonds shouldn’t exceed 50% of bank’s capital base
Increase is because of issuance of Additional Tier 1 capital of USD 300m in September 2018
70545

Agenda
Section 1
Section 2
Section 3
Section 4
Section 5 Appendix
x
x
x
x
x
4
7
11
17
21
Page #
Introduction to ABK & Key Highlights
Kuwait Country and Banking Snapshot
ABK Strategy and Business Overview
Financial Performance
20

21
Awards and Accolades
‘Bank of the Year’ by Arabian Business for four consecutive years
‘Best Commercial Bank in Kuwait’ for three consecutive years and‘Best New Brand in Egypt 2017 ’ & Fastest Growing Bank in Egypt 2017
‘Best Bank Transformation in the Middle East’ by Euromoney
‘Deal of the Year’ 2017 & 2019 by The Banker – an FT Affiliate
‘Best Retail Bank in Kuwait’ by Asian Banker for three consecutive years
‘Employer of the Year’ by NASEBA for three consecutive years
One of the top 10 safest banks in Middle East by Global Finance for two consecutive years
‘Most Innovative Bank in Egypt 2018’ and ‘Fastest Growing Bank in Egypt 2018 & 2019’ by International Finance Magazine
‘Best Digital Transformation 2019’ by International Finance Magazine
‘Deal of the Year Asian Banking & Finance - 2019
‘Best Digital Transformation ’ by Asian Banker
‘Most innovative bank in Egypt ’ by The European’ a Thomson Reuters Affiliate
‘ Best Retail Bank ’ by The European a Thomson Reuters Affiliate for two consecutive years
Best Mobile Banking – Kuwait 2018
‘ Fastest Growing Bank – Egypt’ by International Finance Magazine

22
4 Dec-14 Dec-15 Dec-16 Dec-17 Dec-18 Dec-19 CAGR(KD, 000) (%)
AssetsCash and balances with banks 144,825 432,173 494,678 495,519 702,233 883,129 43.56%Kuwait Government treasury bonds 279,831 204,246 223,142 344,590 257,161 173,235 -9.15%Central Bank of Kuwait bonds 221,228 179,713 173,715 125,595 127,646 136,621 -9.19%Loans and advances 2,422,297 3,047,143 3,029,384 3,075,065 3,025,992 3,215,696 5.83%Investment securities 345,011 343,809 237,905 182,545 289,917 302,165 -2.62%Investment in an associate 14,865 16,572 18,263 19,556 21,896 23,830 9.90%Premises and equipment 33,826 53,125 46,695 53,675 55,710 65,615 14.17%Intangible assets — 41,217 17,698 17,294 16,865 18,340 n.m*Other assets 37,156 41,066 43,333 47,887 51,008 64,464 11.65%Total assets 3,499,039 4,359,064 4,284,813 4,361,726 4,548,428 4,883,095 6.89%Liabilities and shareholders’ equityLiabilitiesDue to banks and other financial institutions 923,752 1,199,192 734,771 596,444 501,134 600,057 -8.27%Customers’ deposits 1,938,297 2,496,278 2,899,908 2,939,349 3,114,504 3,319,771 11.36%Medium-term borrowing — — — 149,712 150,612 151,230 -Other liabilities 78,642 107,135 94,331 103,482 105,813 121,076 9.01%Total liabilities 2,940,691 3,802,605 3,729,010 3,788,987 3,872,063 4,192,134 7.35%Shareholders’ equityShare capital 161,917 161,917 161,917 161,917 161,917 161,917 0.00%Share premium 108,897 108,897 108,897 108,897 108,897 108,897 0.00%Treasury shares (2,303) (4,528) (4,958) (5,053) (5,053) (5,135) 17.39%Reserves 289,837 289,314 289,301 306,249 319,042 333,435 2.84%
Equity attributable to shareholders of the Bank 558,348 555,600 555,157 572,010 584,803 599,114 1.42%
Perpetual Tier 1 Capital Securities - - - - 90,750 90,750 -Non-controlling interests — 859 646 729 812 1,097 -Total equity 558,348 556,459 555,803 572,739 676,365 690,961 4.35%Total liabilities and shareholders’ equity 3,499,039 4,359,064 4,284,813 4,361,726 4,548,428 4,883,095 6.89%
Balance SheetBased on consolidated IFRS financials
* Not measurable

23
2014 2015 2016 2017 2018 2019 CAGR(KD, 000) %
Interest income 111,829 127,003 179,408 188,965 221,067 247,889 17.26%Interest expense (27,469) (32,610) (70,222) (76,533) (99,285) (120,258) 34.36%Net interest income 84,360 94,393 109,186 112,432 121,782 127,631 8.63%Net fee and commission income 22,030 25,228 30,317 29,047 31,148 32,387 8.01%Net foreign exchange gain 2,973 3,134 3,970 4,625 5,053 4,910 10.55%Net (loss)/gain on investment securities 1,860 (1,008) (2,549) 4,943 3,922 2,103 2.49%Dividend income 2,671 3,478 2,162 1,999 2,614 1,739 -8.22%Share of results of associate 1,976 2,506 2,571 2,173 3,220 2,894 7.93%Other income 1,740 801 1,860 1,773 1,076 840 -13.55%Operating income 117,610 128,532 147,517 156,992 168,815 172,504 7.96%Staff expenses (22,181) (25,608) (34,236) (34,161) (35,327) (37,222) 10.91%Other operating expenses (11,524) (13,849) (19,435) (21,182) (24,882) (22,582) 14.40%Depreciation and amortisation (1,366) (1,729) (4,417) (3,835) (4,932) (7,219) 39.51%Operating expenses (35,071) (41,186) (58,088) (59,178) (65,141) (67,023) 13.83%Operating profit for the year 82,539 87,346 89,429 97,814 103,674 105,481 5.03%Net gain from business combination — 8,005 — — — — —Provisions onCredit Facilities (41,800) (58,679) (50,813) (57,522) (56,261) (71,134) 11.22%Net (impairment)/release on investment securities and others (581) (2,750) (1,626) (431) 82 (507) -2.69%
Profit for the year 40,158 33,922 36,990 39,861 47,495 33,840 -3.37%Directors’ fees (360) (480) (375) (495) (593) (395) 1.87%Taxation (2,212) (3,074) (4,103) (3,616) (4,693) (4,620) 15.87%Net profit for the year 37,586 30,368 32,512 35,750 42,209 28,825 -5.17%Attributable to:Shareholders of the Bank 37,586 30,360 32,472 35,661 42,115 28,678 -5.27%Non-controlling interests — 8 40 89 94 147
Income StatementBased on consolidated IFRS financials


