KSP Reference Manual - Native Instruments...1. DISCLAIMER. GmbH. Disclaimer
i
i
Disclaimer
This report was prepared as an account of work sponsored by an agency of the United States government.
Neither the United States government nor any agency thereof, nor any of their employees, makes any warranty,
express or implied, or assumes any legal liability or responsibility for the accuracy, completeness, or
usefulness of any information, apparatus, product, or process disclosed or represents that its use would not
infringe privately owned rights. Reference herein to any specific commercial product, process, or service by
trade name, trademark, manufacturer, or otherwise does not necessarily constitute or imply its endorsement,
recommendation, or favoring by the United States government or any agency thereof. The views and opinions
of authors expressed herein do not necessarily state or reflect those of the United States government or any
agency thereof.
DOCUMENT AVAILABILITY
Reports produced after January 1, 1996, are generally available free via US Department of Energy
(DOE) SciTech Connect.
Website http://www.osti.gov/scitech/
Reports Produced before January 1, 1996, may be purchased by members of the public from the
following source:
National Technical Information Service
5285 Port Royal Road
Springfield, VA 22161
Telephone 703-605-6000 (1-800-553-6847
TDD 703-487-4639
Fax 703-605-6900
E-mail [email protected]
Website http://www.ntis.gov/help/ordermethods.aspx
Reports are available to DOE employees, DOE contractors, Energy Technology Data Exchange
representatives, and International Nuclear Information System representatives from the following
source:
Office of Science and Technical Information
PO Box 62
Oak Ridge, TN 37831
Telephone 865-576-8401
Fax 865-576-5728
Email reports2osti.gov
Website http://www.osti.gov/contact.html

ii
Foreword
Oak Ridge National Laboratory (ORNL), Argonne National Laboratory (ANL), Lawrence Berkeley National
Laboratory (LBNL), and the National Renewable Energy Laboratory (NREL) performed as a collaborative
Roll-to-Roll Advanced Materials Manufacturing (R2R AMM) Department of Energy (DOE) Laboratory
Consortium in Fiscal Year (FY) 2016 through FY 2018. In June 2018, the Consortium responded to a FY 2019
Advanced Manufacturing Office (AMO) Lab Call, DE-LC-000L059, for Topic 3 titled “Roll-to-Roll
Processing” with a proposal “Early-stage advanced national multi-laboratory roll-to-roll research and
development collaboration with industrial Cooperative Research and Development Agreement (CRADA)
collaboration”. Over 50 white papers were solicited from multiple national laboratories, including the four
Consortium laboratories, and five were selected for including in the proposal to the Lab Call. One paper from
Sandia National Laboratories (SNL), Albuquerque, NM was selected, so SNL was added to the multi-
laboratory collaboration. The R2R AMM DOE Laboratory Collaboration (i.e. R2R Collaboration) proposal
was accepted for funding in FY 2019 through FY 2021 contingent on annual budget authorizations.
This R2R Collaboration’s goal is to advance our understanding of R2R processing for high-throughput
advanced manufacturing through an early-stage research approach to enable new devices and lower the cost of
existing processing routes for competitive U.S. manufacturing. The projects directly address the AMO’s Multi-
Year Program Plan challenges for the use of multilayer coating technologies applicable to flexible and
integrated electronics, separation membranes, photovoltaics (PV), and selective barrier materials addressing
both of the AMO identified targets of technologies with a 10x production capacity increase and in-line
instrumentation tools to evaluate the performance and functionality. Working with industry partners through
CRADA projects, the R2R Collaboration is addressing challenges and barriers for continuous R2R processing,
registration and alignment, scalability, materials compatibility and defects, stoichiometry control and the
availability of materials data for R2R processing. The R2R Collaboration targets the development of
technologies that reduce the cost per manufactured throughput of continuous R2R manufacturing processes,
and the development of in-line instrumentation tools that will evaluate the quality of single and multilayer
materials on process weblines.
The FY 2019 core program consisted of a broad range of research task areas focused on colloidal chemistry
and slurry formulation, novel R2R deposition systems based on electrospinning (ES) technology, in-line real-
time non-destructive evaluation (NDE) and advanced in-situ testing capabilities, physics and methodologies
for multilayer coatings, ink formulations and rheology, modeling and simulation of drying and curing
processes, and continuum-scale models for the capillary hydrodynamics of coating deposition . Three CRADA
projects that were initiated in FY 2018 continued into FY 2019 with one completing in May 2019. The primary
applications of the research in the CRADA projects include freeze casting studies, advanced separator for
flexible solid-state lithium ion batteries, diffractive multiplexing laser patterning of flexible organic PV
modules, and electrodes for low-cost hydrogen production. The Collaboration laboratories have unique assets
that complement each other for the research, development, testing and evaluation of these energy saving
technologies. These include the following infrastructure, testing, operations, characterization, and analysis
capabilities:
• Precision coating equipment
• Pilot-scale R2R operations support
• Device assembly assistance
• Electrochemical and cell performance evaluation
• State-of-the-art microscopy and tomography
• Surface characterization
• X-ray and neutron characterization facilities
• Computational science

iii
• Process modeling and characterization capabilities
• World-class data analysis
• In-line quality control (QC)
DOE cost targets for advanced energy storage and conversion applications will not be met without significant
and timely advancements in R2R manufacturing. Required R2R advances include adaptation of existing
processing methods (gravure, slot die, slide die) and development of novel methods (simultaneous multilayer
coatings) that have the potential to significantly impact U.S. manufacturing sector recovery, environmental
applications in clean water, energy security, and sustainable transportation. Economies of scale through
increased manufacturing volumes based on traditional assembly and processing methods will not suffice. For
example, current baseline technology cell costs in the lithium ion battery industry are about 2.5× the
$100/kilowatt-hour ultimate target of DOE Vehicle Technologies Office (VTO). [1] To increase the capacity
from 250 Wh/kg to 1000 Wh/kg for anode materials, novel R2R processing technologies will be required.
Furthermore, polymer electrolyte membrane fuel cell (PEMFC) stacks currently cost almost 10× in low
volumes compared to the ultimate cost of the DOE Fuel Cells Technology Office (FCTO) target of
$20/kilowatt by the year 2020. [2] Water consumption for renewable energy technologies can be as high as a
medium value 4,500 gallons/megawatt-hours and more than 44,000 gallons/megawatt-hours for non-renewable
energy applications. [3] New technologies are needed to increase the capacity of these systems to meet future
needs. Other examples of the Energy Efficiency and Renewable Energy (EERE) Office funded technologies
that have a similar cost-target issue are chemical-process industry membranes, window films, PV films, and
electronic films. The EERE AMO is poised to assist in reaching the low dollars per unit costs of these various
critical energy related applications through addressing R2R manufacturing problems common to each
application.

iv
Preface
The following report provides a description of the program structure and technical accomplishments made
during FY 2019 to overcome challenges for expanding use of R2R technologies and processes for clean energy
applications. Areas of interest encompass colloidal chemistry, surfactant research, slurry processing, and
drying and curing; novel R2R deposition using ES; methodologies for ink formulations, multilayer coatings,
rheology and deposition; fabrication and in situ characterization of prototype components and devices; and in-
line real-time NDE. The particle- and continuum-scale modeling and simulations for these layered materials,
energy storage technologies and continuous manufacturing processes being developed will allow for
improvements and advances in R2R manufacturing applications, particularly for design and scale-up. This
report documents the research conducted by five DOE national laboratories as a collaborative group with
participation from industry partnerships. The approach is to develop advanced and novel materials, methods
and techniques for multilayer coatings and depositions that can be used for R2R processes that are applicable
to enhancing the performance of renewable energy technologies and systems. This effort supports building the
foundation of technologies, processes and a U.S. manufacturing base that will enable an order of magnitude in
shorter process development cycles with the pathway for initial commercialization within months instead of
years.

v
Acknowledgements
First and foremost, the following scientists, investigators and technical support who are working diligently to
realize their innovative ideas and technological developments in R2R processing and their desire to deploy
them broadly for energy storage applications are acknowledged for their contributions:
ANL: Deborah Myers, Jae Hyung Park, Albert Lipson, Donna Brunner, Yuepeng Zhang, Erik Dahl,
Devon Powers, Brian Ingram, Lei Cheng
ORNL: David Wood, Jianlin Li, Marissa Wood, Jaswinder Sharma, Georgios Polyzos, Erin Creel,
Kelsey Grady, Ritu Sahore, Charl Jafta
NREL: Peter Rupnowski, Brian Green, Scott Mauger, KC Neyerlin, Sunil Khandavalli, Jason
Pfeilsticker, Min Wang, Janghoon Park, Nisha Sharma, Maikel van Hest, Bertrand Tremolet deVillers
LBNL: Fuduo Ma, Vince Battaglia, Kenny Higa, Ravi Prasher, Zhi Huang
SNL/University of New Mexico: Kristianto Tjiptowidjojo, Chris Wall, Ben Wall, Robert Malakhov
DOE EERE AMO: Brian Valentine and Bob Gemmer (Technical Project Management)
DOE EERE FCTO: Nancy Garland (Technical Project Management)
We would also like to acknowledge the principal investigators and project managers at Fisker, Inc.; Navitas
Systems, LLC; SolarWindow Technologies, Inc.; General Motors, Nel Hydrogen/Proton OnSite, Giner, Plug
Power, Eastman Kodak, and Saint-Gobain for their coordination and collaboration on the R2R projects.
Finally, we would also like to acknowledge the contributions of Fred Crowson, Energetics, for his project
management assistance and involvement in preparing and publishing this report.
The research at
• Oak Ridge National Laboratory, managed by UT Battelle, LLC for the U.S. Department of Energy,
under contract DE-AC05-00OR22725
• Argonne National Laboratory, managed by University of Chicago Argonne, LLC for the U.S.
Department of Energy, under contract DE-AC02-06CH11357
• Lawrence Berkeley National Laboratory, managed by University of California for the U.S.
Department of Energy, under contract DE-AC02-05CH11231
• National Renewable Energy Laboratory, managed by Alliance for Sustainable Energy, LLC for the
U.S. Department of Energy, under contract DE-AC36-08GO28308
• Sandia National Laboratories managed and operated by National Technology and Engineering
Solutions of Sandia, LLC., a wholly owned subsidiary of Honeywell International, Inc., for the U.S.
Department of Energy’s National Nuclear Security Administration under contract DE-NA-0003525.
was sponsored by EERE AMO, Valri Lightner and Brian Valentine.

vi
Acronyms and Abbreviations
°C degrees Centigrade
µm or µ micrometers or microns
1C, 2C etc. a charge current of 1, 2, etc. time the rated capacity
A amp
A/cm2 amps per centimeter squared
AFM atomic force microscopy
AMM Advanced Materials Manufacturing
AMO Advanced Manufacturing Office
ANL Argonne National Laboratory
APS Advanced Photon Source
at% atomic percent
BET Brunauer-Emmett-Teller
C chemical symbol for carbon
CA California
cm2 centimeter squared
CMC carboxymethyl cellulose
CO Colorado
CRADA Cooperative Research and Development Agreement
c-LLZO cubic phase lithium lanthanum zirconium oxide
Df fractal dimension
DC District of Columbia
DMF dimethylformamide
DOE U.S. Department of Energy (when referring to the agency)
DOE diffractive optical element (when referring to laser scribing)
DOL diffractive optics-based laser
EDS energy dispersive X-ray spectroscopy
EERE Energy Efficiency and Renewable Energy
e.g. abbreviation meaning “for example”; a Latin phrase, “exempli gratia” meaning “for the
sake of example”
ES electrospinning
etc. abbreviation for the Latin phrase “et cetera” which means “and so forth”
FCTO Fuel Cell Technologies Office
FY fiscal year
g gram or grams
GDE gas diffusion electrode
h or hr hour
HFP hexafluoropropylene
Hg chemical symbol mercury
HSC high surface-area carbon
I/C or I:C ionomer-to-carbon ratio
IL Illinois
IPA isopropyl alcohol
IrOx iridium oxohydroxide
IrO2 iridium oxide
kg kilogram
LBNL Lawrence Berkeley National Laboratory
Li chemical symbol for lithium

vii
LLZO lithium lanthanum zirconium oxide, Li7La3Zr2O12
LSC low surface-area carbon
LSCF lanthanum strontium cobalt iron oxide, La0.6Sr0.4Co0.2Fe0.8O3
mAh/g milliamp-hour per gram
MERF Materials Engineering Research Facility
mg/cm2 milligram per square centimeter
MgO magnesium oxide
min(s) minute(s)
mm millimeters
mmol millimole
Mn chemical symbol for manganese
MW molecular weight
MWh megawatt-hour
NDE non-destructive evaluation
ml or mL milliliter
nm nanometer
NMC nickel-manganese-cobalt
NMP N-Methyl-2-pyrrolidone
nPA normal propyl alcohol (or normal propanol)
NREL National Renewable Energy Laboratory
OCV open circuit voltage
ORNL Oak Ridge National Laboratory
PAA polyacrylic acid
PAN polyacrylonitrile
PEM polymer electrolyte membrane
PEMFC polymer electrolyte membrane fuel cell
PEO polyethylene oxide
pH the negative logarithm of the effective hydrogen-ion concentration or hydrogen-ion activity
in gram equivalents per liter of the solution
Pt chemical symbol for platinum
Pt/C platinum to carbon ratio
PV photovoltaic
PVDF polyvinylidene fluoride
PVP polyvinylpyrrolidone
QC quality control
R2R roll-to-roll
rpm revolutions per minute
s second(s)
SAXS small-angle X-ray scattering
SEM scanning electron microscope (or microscopy)
SLC designation by Superior Graphite for a natural graphite surface treated with an amorphous
carbon coating
SNL Sandia National Laboratories
STEM scanning transmission electron microscopy
TEM transmission electron microscopy
Tg glass transition temperature
TN Tennessee
U.S. United States
USAXS ultra-small angle X-ray scattering

viii
vs. versus
VTO Vehicle Technologies Office
wt% percent by weight
XPS X-ray photoelectron spectroscopy
XRD X-ray diffraction
XRF X-ray fluorescence spectroscopy

ix
Table of Contents
Disclaimer .............................................................................................................................................................. i
Foreword ............................................................................................................................................................... ii
Preface ................................................................................................................................................................. iv
Acknowledgements ............................................................................................................................................... v
Acronyms and Abbreviations .............................................................................................................................. vi
Table of Contents ................................................................................................................................................. ix
List of Figures ...................................................................................................................................................... xi
List of Tables .................................................................................................................................................... xvii
Executive Summary .............................................................................................................................................. 1
Accomplishments ............................................................................................................................................ 3
Technology Assessment .................................................................................................................................. 5
Roll-to-Roll Advanced Materials Manufacturing DOE Laboratory Collaboration Project Overview ................. 6
Collaboration Contacts .................................................................................................................................... 6
Annual Operating Plan Title and Corporate Planning System (CPS) Agreement Numbers ........................... 7
Project Introduction .............................................................................................................................................. 8
Objectives ............................................................................................................................................................. 8
Approach ............................................................................................................................................................... 8
Core Program .................................................................................................................................................. 8
FY 2020 Plans ............................................................................................................................................... 12
Technology Transfer Paths ............................................................................................................................ 15
Results................................................................................................................................................................. 15
Novel R2R Deposition System Based on ES Technology and Advanced/In Situ Characterization and
Testing (ANL Lead Laboratory) ................................................................................................................... 15
R2R ES Platform Development ............................................................................................................... 15
Advanced Materials and ES Recipe Development .................................................................................. 18
In-situ X-ray Study of the ES Process ..................................................................................................... 20
Fabrication Toward Prototype Components and Devices ........................................................................ 21
Advanced Ink and Membrane Characterization ....................................................................................... 22
Colloidal Chemistry, Surfactant Research, Slurry Processing, Deposition and Drying/Curing Methods
(ORNL Lead Laboratory) .............................................................................................................................. 27
Colloidal Chemistry and Slurry Processing ............................................................................................. 27

x
Deposition and Drying/Curing ................................................................................................................. 30
R2R ES Platform Development Support ................................................................................................. 45
Physics and Methodologies for Multilayer Coatings/Deposition; Fabrication and In Situ Testing of
Prototype Components and Devices; and Novel Non-Destructive Evaluation, Quality Control and
Metrology (NREL Lead Laboratory) ............................................................................................................ 54
Cutting-Edge Coating and Deposition Science for R2R Applications..................................................... 54
Fabrication and In Situ Testing of Prototype Components and Devices ................................................. 65
Novel NDE, QC, and Metrology Methods............................................................................................... 67
Macroscopic Mathematical Model of the Drying of a Single Layer Generic Slurry Containing
Monodispersed Colloidal Particles, Binder and Solvent (LBNL Lead Laboratory) ..................................... 69
Slurry Drying Model ................................................................................................................................ 69
Validated Continuum-Scale Models to Accelerate Design and Scale-up of Simultaneous Die Coating
Process Technology (SNL Lead Laboratory) ................................................................................................ 71
Model Development and Validation for Multilayer R2R Applications ................................................... 71
Collaboration/Coordination/Outreach/CRADA Projects .............................................................................. 73
Core Program ........................................................................................................................................... 73
CRADA Projects ...................................................................................................................................... 73
Fisker, Inc .............................................................................................................................................. 73
Navitas Systems, LLC ........................................................................................................................... 83
SolarWindow Technologies, Inc. (SWT) .............................................................................................. 94
Nel/Proton OnSite ................................................................................................................................. 98
Workforce Development/Educational Outreach ........................................................................................... 98
Challenges/Contingencies ............................................................................................................................. 99
Risks and Risk Handling ............................................................................................................................... 99
Project Ratings ............................................................................................................................................ 101
Conclusions ....................................................................................................................................................... 102
Key Publications ............................................................................................................................................... 103
References ......................................................................................................................................................... 104

xi
List of Figures
Figure 1. The R2R AMM DOE Laboratory Collaboration team and major research efforts. Source: ORNL ..... 1
Figure 2 ES configurations of (a) bottom-up spinning where nanofibers are projected upward and (b) top-down
spinning where droplets fall onto the already-made nanofiber products under gravity. Source: ANL. .............. 16
Figure 3 A picture of the ES process for the R2R ES system implemented at the ANL MERF, which shows
simultaneous fiber deposition from 56 needles on a moving web. Source: ANL ............................................... 16
Figure 4 Fiber diameter as a function of evaporation rate for different concentrations of IPA in solution.
Source: ANL ....................................................................................................................................................... 17
Figure 5 Comparison of fibers produced from precursors with and without IPA at different voltages and
working distances for R2R ES process optimization. Source: ANL................................................................... 17
Figure 6 LLZO precursor nanofibers deposited on an aluminum web at scale using R2R ES module. Source:
ANL .................................................................................................................................................................... 18
Figure 7 SEM images of the as-spun LLZO polymer precursor nanofibers that were synthesized under the
different voltages shown. Source: ANL .............................................................................................................. 18
Figure 8 SEM images of as-spun LLZO polymer precursor nanofibers fabricated with optimum ES conditions.
Source: ANL ....................................................................................................................................................... 19
Figure 9 SEM images of LSCF precursor nanofibers fabricated at different voltages. Source: ANL ................ 19
Figure 10 (a) ES unit mounted at 12-ID-B beamline of APS for in-situ SAXS study and (b) generation of FeNi
polymer precursor nanofibers recorded by a high-resolution camera at the beamline. Source: ANL ................ 20
Figure 11 (a) 2D-SAXS data of FeNi nanofibers, (b) intensity vs. scattering vector (I(q)-q) plots obtained from
2D-SAXS data (blue) and simulation (purple) and (c) SEM image of the studied nanofibers. Source: ANL .... 21
Figure 12 (a) TEM image and (b) X-ray profile of LLZO fibers after 700°C annealing. Source: ANL ............ 22
Figure 13 PVDF-based polymer nonwoven structure for water filtration membrane application viewed from (a)
top and (b) side. Source: ANL ............................................................................................................................ 22
Figure 14 USAXS profiles and fitting results for IrOx inks with and without ionomer. IR2: 25wt% IrOx, 0.2
Ionomer/Catalyst (I/C). IR1: 25wt% IrOx, 0 I/C. Source: ANL ........................................................................ 24
Figure 15 (a) USAXS scattering curves for 35wt% IrO2 dispersions both without and with ionomer (2.4 wt%)
in the inks. (b) The corresponding volume size distribution of the inks without and with ionomer. Source: ANL
............................................................................................................................................................................ 25
Figure 16 USAXS results for 2.5wt% Nafion ionomer solution for N1: 10/90 nPA/ H2O, N2: 25/75 nPA/H2O,
N3: 50/50 nPA/H2O, N4: 75/25 nPA/H2O, and N5: 90/10 nPA/H2O dispersions listed in Table 1. Source: ANL
............................................................................................................................................................................ 26
Figure 17 USAXS profiles for Pt/Vulcan-ionomer-solvent inks as a function of solvent mixture and ionomer.
Source: ANL ....................................................................................................................................................... 27
Figure 18 SEM images of the carbon particles coated with Pt catalyst; carbon primary particle size is
approximately 50 nm. Source: ORNL ................................................................................................................ 28
Figure 19 (a) Area where EDS measurements were taken and the element maps for (b) platinum and (b) carbon
atoms on the surface of the coated particles. Source: ORNL ............................................................................. 28
xii
Figure 20 (a) Survey XPS spectrum of the Pt/C particles and (b) XPS core data analysis and the element at%
on the surface of the particles. Source: ORNL ................................................................................................... 29
Figure 21 Zeta potential measurements of Pt/C particles dispersed in water having 5% KNO3. Source: ORNL
............................................................................................................................................................................ 29
Figure 22 Zeta potential measurements of Pt/C particles dispersed in water, IPA and Nafion. Source: ORNL 30
Figure 23 Rheological properties of the slurries with 8 wt% and 10 wt% Pt/C content. Source: ORNL ........... 31
Figure 24 SEM cross-section images of the GDE coated with 8 wt% slurry formulation at different
magnifications. Source: ORNL ........................................................................................................................... 31
Figure 25 The area where EDS measurements were taken and the element maps according to EDS analysis of
the 8 wt% coating on the GDE substrate. Source: ORNL .................................................................................. 32
Figure 26 Optical microscope images of the coatings based on (a) and (b) for the 8 wt% and (c) and (d) 10
wt% formulations. Source: ORNL ..................................................................................................................... 32
Figure 27 Thickness profile measurements for the (a) and (b) 8 wt% and (c) and (d) 10 wt% coatings. Source:
ORNL ................................................................................................................................................................. 33
Figure 28 Surface topography of the 8 wt% coating under (a) an optical microscope and (b) according to AFM
imaging measurements. Source: ORNL.............................................................................................................. 33
Figure 29 AFM surface profile of an area with well dispersed particles on the surface of the 8 wt% coating.
Source: ORNL .................................................................................................................................................... 34
Figure 30 AFM surface profile of an area with particle agglomeration on the surface of the 8 wt% coating.
Source: ORNL .................................................................................................................................................... 34
Figure 31 SEM images at different magnifications of the coated GDE using a slot-die technique. Source:
ORNL ................................................................................................................................................................. 35
Figure 32 SEM cross-section image of the slot-die coated GDE. Source: ONRL .............................................. 35
Figure 33 EDS analysis of the cross-section of the slot-die coated GDE. Source: ONRL ................................. 36
Figure 34 GDEs (4.5 inches x 2.5 inches) coated with slurries prepared at different mixing times. Source:
ORNL ................................................................................................................................................................. 37
Figure 35 SEM images of the coated GDE for the slurry mixed for 15 min at 10,000 rpm. Source: ORNL ..... 38
Figure 36 (a) EDS element map of the slurry according to (b) the EDS analysis for mixing 15 min at 10,000
rpm. Source: ORNL ............................................................................................................................................ 39
Figure 37 SEM images for the coated GDE slurry mixed for 30 min at 10,000 rpm. Source: ORNL ............... 41
Figure 38 SEM images for the coated GDE slurry mixed for 60 min at 10,000 rpm. Source: ORNL ............... 42
Figure 39 SEM cross section images of the GDE with a Pt loading of 0.179 mg/cm2. Source: ORNL ............. 44
Figure 40 EDS element analysis of GDE cross section with a Pt loading of 0.179 mg/cm2. Source: ORNL .... 44
Figure 41 SEM images of the coated GDE showing pronounced particle agglomeration. Source: ORNL ........ 45
Figure 42 Schematic illustration of the experimental setup used for the nanofiber ES. Source: ORNL. ........... 45
Figure 43 SEM image of electrospun LLZO nanofibers according to recipe 1. Source: ORNL ........................ 46
Figure 44 SEM image of electrospun LLZO nanofibers according to recipe 2. Source: ORNL ........................ 46
xiii
Figure 45 SEM image of electrospun LLZO nanofibers according to recipe 3. Source: ORNL ........................ 47
Figure 46 XRD plot of the annealed LLZO nanofibers. Source: ORNL ............................................................ 47
Figure 47 (a) Electrospun PAN fibers from Recipe 1 and (b) 10X magnification. Source: ORNL................... 48
Figure 48 (a) Electrospun PAN fibers according to recipe 2 and (b) at 20x magnification. Source: ORNL ...... 49
Figure 49 Carbonization setup that was used to carbonize the PAN fibers. Source: ORNL .............................. 50
Figure 50 SEM images of the synthesized carbon nanofibers with diameters of 200-300 nm. Source: ORNL . 51
Figure 51 SEM images of the aluminum-LLZO nanofibers prior to their annealing with a diameter of
approximately 200 nm. Source: ORNL .............................................................................................................. 52
Figure 52 (a) XRD of the aluminum-LLZO powder mixed with MgO powder at several temperatures. (b) Peak
assignment where the blue vertical lines correspond to the c-LLZO phase and the green vertical lines
correspond to the MgO peaks. Source: ORNL ................................................................................................... 53
Figure 53 Heterogeneous ink rheology as a function of solids loading and solvent ratio. Source: NREL ......... 54
Figure 54 (a) 2 wt% and (b) 5 wt% catalyst ink rheology as a function of ionomer addition for 50:50 water-to-
nPA solvent ratio. Source: NREL ....................................................................................................................... 55
Figure 55 Results of empirical process window model for total dry thickness (assuming 5 wt% solids
solutions) of a two-layer slide die coating as a function of flow rate. Source: NREL ........................................ 55
Figure 56 Target dry thickness validation of three-layer configuration using analytical slide die model. Source:
NREL .................................................................................................................................................................. 56
Figure 57 Factor impact contour plots for (a) the density and (b) the viscosity of the top layer ink. Source:
NREL .................................................................................................................................................................. 56
Figure 58 Pt/LSC quadratic model outputs for (a) ink density, (b) viscosity at shear rates of 1/s, (c) surface
tension and (d) viscosity at shear rates of 100/s. Source: NREL ........................................................................ 58
Figure 59 (a) Cast membrane thickness as a function of coating gap and (b) proton conductivity of the cast
membranes compared to a commercially available membrane. Source: NREL ................................................. 59
Figure 60 (a) Simulated multilayer structures via ultrasonic spray and (b) standard individual-layer structures.
Source: NREL ..................................................................................................................................................... 59
Figure 61 (a) Dummy ink rheology for catalyst ink and (b) ionomer solution (actual target inks in black).
Source: NREL ..................................................................................................................................................... 60
Figure 62 Computer-aided design drawing of 3-layer slide die from Allied Die. Source: NREL ...................... 60
Figure 63 Steady-shear rheology of ionomer/PAA and ionomer/particle/PAA slurries over a PAA range of 5-
20 wt%. Source: NREL ...................................................................................................................................... 61
Figure 64 Amplitude sweep shear rheology data for carrier-ionomer-particle slurries as a function of carrier
(PAA) solids loading from 5-20 wt%. Source: NREL ........................................................................................ 62
Figure 65 (a) Extensional viscosity and (b) shear viscosity data for carrier-ionomer and carrier-ionomer-
particle slurries. Source: NREL .......................................................................................................................... 62
Figure 66 Summary of fiber diameter as a function of PAA concentration for the process window study.
Source: NREL ..................................................................................................................................................... 63

xiv
Figure 67 PAA spinning process window depiction; inset images show examples of droplets (no fibers),
spinning mostly beads, and spinning good fibers, as well as viscous instability of the Taylor cone at high PAA
wt%. Source: NREL ........................................................................................................................................... 64
Figure 68 Full PEM electrode ink process window depiction with SEM insets showing resulting materials.
Source: NREL ..................................................................................................................................................... 64
Figure 69 (a) Polarization performance of two multilayer sprayed cells (for comparison, performance should be
at least 0.8 A/cm2 at 0.6 volts) and (b) optical microscopy of the sprayed membrane layer. Source: NREL ..... 65
Figure 70 (a) Typical catalyst coated membrane cell structure with membrane (Nafion 211) sealing area and
(b) the new structure for three-layer target construction (Cathode-D2020-Anode). Source: NREL .................. 66
Figure 71 (a) Polarization performance of the ORNL cell without and with ionomer overlayer, and (b) ORNL
cells compared to NREL R2R GDE cells. Source: ORNL ................................................................................. 66
Figure 72 Optical micrographs for (a) a particle-polymer electrode, (b) an anionic membrane, (c) a cationic
membrane and (d) a reverse osmosis membrane. Source: NREL ....................................................................... 68
Figure 73 Attenuated total reflectance-infrared spectroscopy of polymer-particle inks during drying, with
characteristic polymer peaks indicated, at (a) higher polymer content and (b) lower polymer content. Source:
NREL .................................................................................................................................................................. 69
Figure 74 (a) Relative and (b) absolute particle positions in settling particle network submodel. Source: LBNL
............................................................................................................................................................................ 70
Figure 75 Solid model in a finite element mesh. Source: SNL ........................................................................... 71
Figure 76 Single layer mesh and pattern of pressure (color map) and flow (streamlines). Source: SNL ........... 72
Figure 77 Two-layer pattern of pressure (color map) and flow (streamlines) for ORNL slot die geometry.
Source: SNL ........................................................................................................................................................ 72
Figure 78 SEM fracture surface images of freeze tape cast (10 vol.% LLZO slurry) produced at thicknesses of
300 μm, 220 μm and 160 μm and at various casting speeds. Source: LBNL ................................................... 733
Figure 79 (a) Sintered dense/porous LLZO bilayer and (b) and (c) the cathode component infiltrated bilayer.
Source: LBNL ..................................................................................................................................................... 74
Figure 80 (a) and (b) SEM images and (c) XRD analyses of as-received LLZO power and LLZO powder
compacted (pellet) and heated to 1090°C for 3 hours where blue arrows indicate t-LLZO peaks. (d) Zeta
potentials of as-received LLZO with selected dispersants at varying pH. Source: LBNL ................................. 75
Figure 81 (a) and (b) Fracture surface SEM images of freeze tape cast LLZO green tapes produced at LBNL,
and (c) and (d) surface SEM images of green tapes produced at ORNL. Sources: LBNL and ORNL .............. 76
Figure 82 Photographs of a water-based LLZO slurry (a) after mixing and (b) after ~30 mins. Source: ORNL
............................................................................................................................................................................ 76
Figure 83 Zeta potential of LLZO in the presence/absence of dispersants. Source: ORNL ............................... 77
Figure 84 (a) SEM fracture surface image of freeze tape cast NEI LLZO green tape and (b) at 10x
magnification. Source: LBNL ............................................................................................................................. 77
Figure 85 SEM fracture surface images of (a) a sintered porous/dense LLZO bilayer and (b) at 10x
magnification. Source: LBNL ............................................................................................................................. 78
Figure 86 SEM images of the cross sections of the freeze tape cast porous tapes obtained with slurries that
have either (a) double the amount of PAA or (b) double the amount of VANZAN compared to the original
recipe shown in Table V. Source: ORNL ........................................................................................................... 79

xv
Figure 87 Schematic showing the areas of the tape that were characterized via SEM. Source: ORNL ............. 80
Figure 88 SEM of the cross-sections from three different areas of the LLZO freeze tape cast green tape from
the first run. Source: ORNL ................................................................................................................................ 81
Figure 89 Schematic highlighting the difference in the way the freeze tape cast was fractured for SEM imaging
the cross-sections for the second run. Source: ORNL ........................................................................................ 82
Figure 90 SEM of the cross-sections from three different areas of the LLZO freeze tape cast green tape
obtained from the second run. Source: ORNL .................................................................................................... 82
Figure 91 Voltage profiles for various separators: (a) Celgard, (b) Separator B and (c) Separator C. Source:
ORNL ................................................................................................................................................................. 84
Figure 92 Rate performance comparison for three separators: (a) capacity and (b) normalized discharge
capacity vs C-rate. Source: ORNL ...................................................................................................................... 84
Figure 93 OCV of cells with various separators during a 24-hour rest. Source: ORNL ..................................... 85
Figure 94 Top view of the mechanical design for lines in the 3D-printed prototype mask. Source: ORNL ...... 85
Figure 95 Substrate sprayed with the mask showing a cross-hatched line pattern . Source: ORNL .................. 86
Figure 96 XRF data showing uniformity and shape of the sprayed lines. Source: ORNL ................................. 86
Figure 97 Ceramic coating on separators with various binders. (a) PVDF-HFP, (b) CMC and (c) PVDF-HFP
and CMC. Source: ORNL ................................................................................................................................... 87
Figure 98 SEM images of (a) the Al2O3 coated separator and the (b) TiO2 coated separator showing completely
covered surfaces. Source: ORNL ........................................................................................................................ 88
Figure 99 Electrochemical impedance spectroscopy results for the Separator B separator with different
thicknesses of Al2O3 coatings. Source: ORNL ................................................................................................... 88
Figure 100 Electrochemical impedance spectroscopy results for the separators coated with the different ratios
of Al2O3 and TiO2. Source: ORNL ..................................................................................................................... 89
Figure 101 (a) 3D-printed spray mask and (b) alumina/crosshatch pattern-sprayed coating. Source: NREL .... 89
Figure 102 Separator with full interdigitated patterned coating showing spatial non-uniformities (e.g. lower left
side of the image). Source: NREL ...................................................................................................................... 90
Figure 103 (a) N2 physisorption isotherms of the uncoated and the differently coated separators with their
corresponding BET surface areas and (b) their pore size distribution as calculated from the desorption data.
Source: ORNL .................................................................................................................................................... 91
Figure 104 The average contact angle formed from water droplets on five separators with different coatings
and from Generation II electrolyte on the uncoated separator. Source: ORNL ................................................. 91
Figure 105 Voltage profile and rate performance with various separators at rates of (a) C/10, (b) C/2, (c) 1C,
and (d) 2C. (e) The performance for all separators at all rates from 0 to 45 cycles. Source: ORNL .................. 92
Figure 106 OCV of cells with various separators. Source: ORNL ..................................................................... 93
Figure 107 Side view of forward gravure setup. Source NREL ......................................................................... 94
Figure 108 Patterned gravure rollers with a crosshatch pattern (top) and a diamond pattern (bottom). Source:
NREL .................................................................................................................................................................. 94

xvi
Figure 109 (a) Annotated photo showing the proposed location of the laser and multiplexing optics on NREL
diagnostic R2R line; (b) the R2R system for the multi-spot DOE scribing with the finished safety enclosure.
Source: NREL ..................................................................................................................................................... 96
Figure 110 Optical microscope images of multiplexed DOL scribes in ZnO/ITO/PET as a function of laser spot
focal distance. Source: NREL ............................................................................................................................. 97

xvii
List of Tables
Table I List of USAXS-SAXS Samples ............................................................................................................. 23
Table II Unified Fitting Results of 2.5wt% Nafion Ionomer Solutions .............................................................. 26
Table III Sample List and Unified Fitting Results of Pt/Vulcan Inks ................................................................. 27
Table IV ES Process Conditions for PAA Process Window Study .................................................................... 63
Table V NEI LLZO Slurry Recipe for Freeze Tape Casting Transferred from LBNL to ORNL ....................... 78
Table VI Modified NEI LLZO Slurry Recipe for Freeze Tape Casting ............................................................. 80
Table VII Coin Cell Electrode Areal Loading and Composition ........................................................................ 83
Table VIII Formulations of the Al2O3 Slurries ................................................................................................... 86
Table IX Educational Development at the Collaboration Laboratories .............................................................. 98
Table X Risks Identified During FY 2019 and Their Mitigation ........................................................................ 99
Table XI R2R AMM Laboratory Collaboration Project Ratings ...................................................................... 101

1
Executive Summary
R2R processing is used to manufacture a wide range of products for various applications which span many
industrial business sectors. The overall R2R methodology has been in use for decades and this continuous
technique traditionally involves deposition of material(s) onto moving webs, carriers or other continuous belt-
fed or conveyor-based processes that enable successive steps to build a final version which serves to support
the deposited materials. Established methods that typify R2R include tape casting, silk-screen printing, reel-to-
reel vacuum deposition/coating and R2R lithography. Products supported by R2R manufacturing include
micro-electronics, electro-chromic window films, PVs, fuel cells for energy conversion, battery electrodes for
energy storage, and barrier and membrane materials. Due to innovation in materials and process equipment,
high-quality yet very low-cost multilayer technologies have the potential to be manufactured on a very cost-
competitive basis. To move energy-related products from high-cost niche applications to the commercial
sector, a means must be available to enable manufacture of these products in a cost-competitive manner that is
affordable. Fortunately, products such as fuel cells, thin- and mid-film PVs, batteries, electrochromic and
piezoelectric films, water separation membranes, and other energy saving technologies readily lend themselves
to manufacture using R2R approaches. However, more early-stage research is needed to solve the challenge of
linking the materials (particles, polymers, solvents, additives) used in ink and slurry formulations, though the
ink processing, coating and drying processes, to the ultimate performance of the final R2R product, especially
for a process that uses multiple layers of deposition to achieve the end product.
To solve the problems associated with this R2R “Grand Challenge”, the R2R AMM DOE Laboratory
Collaboration is executing a research program with outcomes that will ultimately link modeling, processing,
metrology and defect detection tools, thereby directly relating the properties of constituent particles and
processing conditions to the performance of final devices. The Collaboration team and their research efforts
with industry involvement are illustrated schematically in Figure 1. This collaborative approach was designed
to foster identification and development of materials and processes related to R2R for clean-energy materials
development. Using computational and experimental capabilities by acknowledged subject matter experts
within the supported National Laboratory system, this project leverages the capabilities and expertise at each
of five national laboratories to further the development of multilayer technologies that will enable high-
volume, cost-competitive platforms.
Figure 1. The R2R AMM DOE Laboratory Collaboration team and major research efforts. Source: ORNL

2
A typical R2R process has three steps: 1) mixing of particles and various constituents in a slurry, 2) coating of
the ink/slurry mixture on a substrate, and 3) drying/curing and processing of the coating. Final performance of
devices made via R2R processes is dependent on the active materials (e.g. electrochemical particles in battery
or fuel cell electrodes) and the device structure that stems from the governing component interactions within
the various steps. However, a fundamental understanding of the underlying mechanisms and phenomena is still
lacking, which is why industrial-scale R2R process development and manufacturing is still largely empirical in
nature.
The FY 2019 through FY 2021 program addresses aspects of the following two targets from the AMO Multi-
Year Program Plan:
• Target 8.1 Develop technologies to reduce the cost per manufactured throughput of continuous R2R
manufacturing processes.
o Increasing throughput of R2R processes by 5 times for batteries (to 50 square feet per minute
(50 ft2/min)) and capacitors and 10 times for printed electronics and the manufacture of other
substrates and MEs used in support of these products.
o Developing resolution capabilities to enable registration and alignment that will detect, align,
and co-deposit multiple layers of coatings and print < 1-micron (1 µm) features using
continuous process scalable for commercial production.
o Developing scalable and reliable R2R processes for solution deposition of ultra-thin (<10 nm)
films for active and passive materials.
o Develop in-line multilayer coating technology on thin films with yields greater than 95%.
• Target 8.2 Develop in-line instrumentation tools that will evaluate the quality of single and multilayer
materials in-process.
o Developing in-line QC technologies and methodologies for real-time identification of defects
and expected product properties “in-use/application” during continuous processing at all size-
scales with a focus on the “micro” and “nano” scale traces, lines, and devices
o Developing technologies to increase the measurement frequency of surface rheology without
significant cost increases with a goal of a 10-nanometer in-line profilometry at a production
rate of 100,000 square millimeters per minute (100,000 mm2/min).
The category of electrochemical conversion devices that apply to fuel cells was selected to begin the FY 2019
efforts; however, research was kept general enough that other applications could include low-temperature
water electrolysis, CO2 separation/reduction and water filtration/purification. Of specific interest was ES
technology. ES is a technology platform that is capable of fabricating advanced nanofiber-based materials
across a wide range of applications and industrial domains. It offers high surface-to-volume ratio which makes
nanofibers the ideal candidate for various applications where high porosity and high surface areas are
desirable. There are currently a few barriers to commercialization of ES. It is limited to filtration applications
produced in single-step, batch processes; advanced materials used in electronics, fuel cells and batteries require
continuous, post-ES processing; complex multi-step physiochemical processes create challenges transferring
technology from the bench to commercial production; and material transfer between process steps is time
consuming. However, integration of R2R processing can enable the adoption of electrospun advanced
materials into a wider range of applications
The FY 2019 collaborative effort successfully completed all tasks to develop an ES method using a R2R
manufacturing process and to provide continuum-scale modeling, simulation, processing, and manufacturing
techniques and metrology that demonstrate the feasibility and potential for scale-up. A R2R ES capability was
established at ANL, which demonstrated fabrication of polymer nanofiber membranes on a 0.5 meter wide
moving web using 56 nozzles. Nanofibers were produced using the ES system at ANL for three applications:
(1) Li7La3Zr2O12 (LLZO) solid electrolyte, (2) La0.6Sr0.4Co0.2Fe0.8O3 (LSCF) oxide fuel cell electrode,

3
and polyvinylidene fluoride (PVDF) water filtration membrane. In-situ small angle X-ray scattering (SAXS)
was conducted at ANL’s Advanced Photon Source (APS) to accelerate ES process optimization. ANL and
ORNL both fabricated cubic phase LLZO (c-LLZO) from the electrospun precursors through post-annealing at
temperatures well below the powder LLZO sintering temperatures (1100 °C), showing the benefit of the ES
technology.
ORNL produced uniform PEMFC cathode gas diffusion electrode (GDE) coatings of uniform thickness on
their pilot slot-die coating line and a membrane electrode assembly without an overlayer on the cathode with
reasonable performance. NREL developed an empirical slide die coating window model and full-quadratic ink
models for catalyst ink surface tension using the Box-Behnken methodology and completed a study for a
multi-region process window. LBNL developed a generic particle network settling model as part of its longer-
term coating drying modeling efforts but recognizing the deep lack of fundamental knowledge about the
concentrated dispersions of interest, proposed a set of novel experiments for probing the influence of
component interactions on macroscopic dispersion behavior. LBNL proposed to design and execute these
experiments in order to obtain information that will be incorporated into its dispersion mixing and multilayer
coating drying models. SNL completed two-layer slide and slot coating models using Goma 6.0. The models
are equipped for slot- and slide-deposition systems with accommodation for three or more simultaneous
miscible layers. SNL also advanced a user-interface that will greatly ease analysis of slide and slot-die coating
head design.
Technology transfer for these and other technologies applicable to R2R manufacturing was initiated through
collaboration with industry partners and through the continuation of three CRADA projects with industry and
completion of one of those projects.
Accomplishments
Highlights of the FY 2019 accomplishments for the primary tasks at each laboratory are listed below.
Core Program Projects
ANL Novel R2R Deposition System Based on ES Technology and Advanced/In Situ Characterization and
Testing Capabilities
• Fabricated nanofibers for three applications: (1) LLZO solid electrolyte, (2) LSCF oxide fuel cell
electrode, and PVDF water filtration membrane.
• Developed R2R ES capabilities that include a 0.55 m x 30 m (width x length) moving web, 56 nozzle
spinnerets running at a maximum homogeneous coating speed of 3 m/min, and ES recipes that are
tailored for a high deposition rate. R2R fabrication of PVDF fibers was demonstrated.
• Achieved optimum ES recipes for LLZO precursor fiber fabrication using in-situ SAXS, which
accelerated the development speed of LLZO. Fabricated nanocrystalline high-ionic-conductivity c-
LLZO fibers out of the polymer precursor fibers at 700°C.
ORNL Colloidal Chemistry, Surfactant Research, Slurry Processing, Deposition and Drying and Curing
and Curing Methods
• Optimized PEMFC cathode catalyst ink formulations by developing standard mixing protocol and
equipment with NREL, quantifying zeta potentials of ink components, and measuring ink rheological
properties for high-solids-loading slot-die coating formulation.

4
• Produced uniform PEMFC cathode GDE coatings with an ink composition of 12.16% Solids, 8 wt%
platinum to carbon (Pt/C) on the ORNL pilot slot-die coating line with a uniform coating thickness ≈
20 µm and micron-size cracks.
• Coated cathode GDEs without an ionomer overlayer (0.38 and 0.18 mg-Pt/cm2) resulting in
performance comparable to the NREL baseline GDE spraying and slot-die coating approaches with
loadings of 0.1 mg Pt/cm2.
• Fabricated c-LLZO, which is several orders of magnitude more conductive than the tetragonal phase,
after annealing at 700°C for two hours using a scalable recipe for the R2R system at ANL.
NREL Physics and Methodologies for Multilayer Coatings/Deposition; Fabrication and In Situ Testing of
Prototype Components and Devices; and Novel NDE, Quality Control and Metrology
• Leveraged an empirical slide die coating window model to predict target multi-layer coating structures
and coatability and inform continuum-scale model development
• Developed full-quadratic ink models for target multi-layer ink surface tension, viscosity and density
using the Box-Behnken methodology
• Provided ink and coating models and property measurements to SNL to coordinate on the
development of multi-layer slide die continuum models
• Specified and ordered three-layer slide die for upcoming experiments
• Completed a study showing a multi-region ES process window for a widely used polyacrylic acid
(PAA) carrier polymer characterized by droplet spraying, spinning of fibers and beads (mostly fibers),
and an unstable flow region with viscous instability in the Taylor cone.
LBNL Macroscopic Mathematical Model of the Drying of a Single Layer Generic Slurry Containing
Monodisperse Colloidal Particles, Binder, and Solvent
• Developed generic particle network settling model with intuitively reasonable results; however,
limited available information on dense, multicomponent suspensions, along with assumptions made to
build model, suggested that greater understanding of component-level interactions during drying is
needed.
• Began planning for experiments to obtain information needed for model development using a wide
array of analytical tools, including those at the Advanced Light Source (ALS).
SNL Validated Continuum-Scale Models to Accelerate Design and Scale-Up of Simultaneous Die Coating
Process Technology
• Completed two-layer slide coating models using Goma 6.0. The Goma 6.0 software was a 2014
Research and Development 100 Award Winner, with the award in part due to prior successes in
applying the software for process modeling of pre-metered coating flow deposition.
• Designed models for slot- and slide-deposition systems with accommodation for three or more
simultaneous miscible layers (multiple layers of varying rheology).
• Analyzed the one- and two-layer coating geometries for the as-drawn NREL slide die and ongoing
single and two-layer slot-die coating work at ORNL. For two-layer systems, the model can predict
5
interlayer and free surface shape at varying flowrates and web speeds. Current work focused on
minimizing flow recirculation near interlayer and preventing interlayer mixing.
• Advanced a continuum scale drying and solidification model for polymer-solvent systems and verified
the implementation in Goma 6.0 with published literature studies.
CRADA Projects
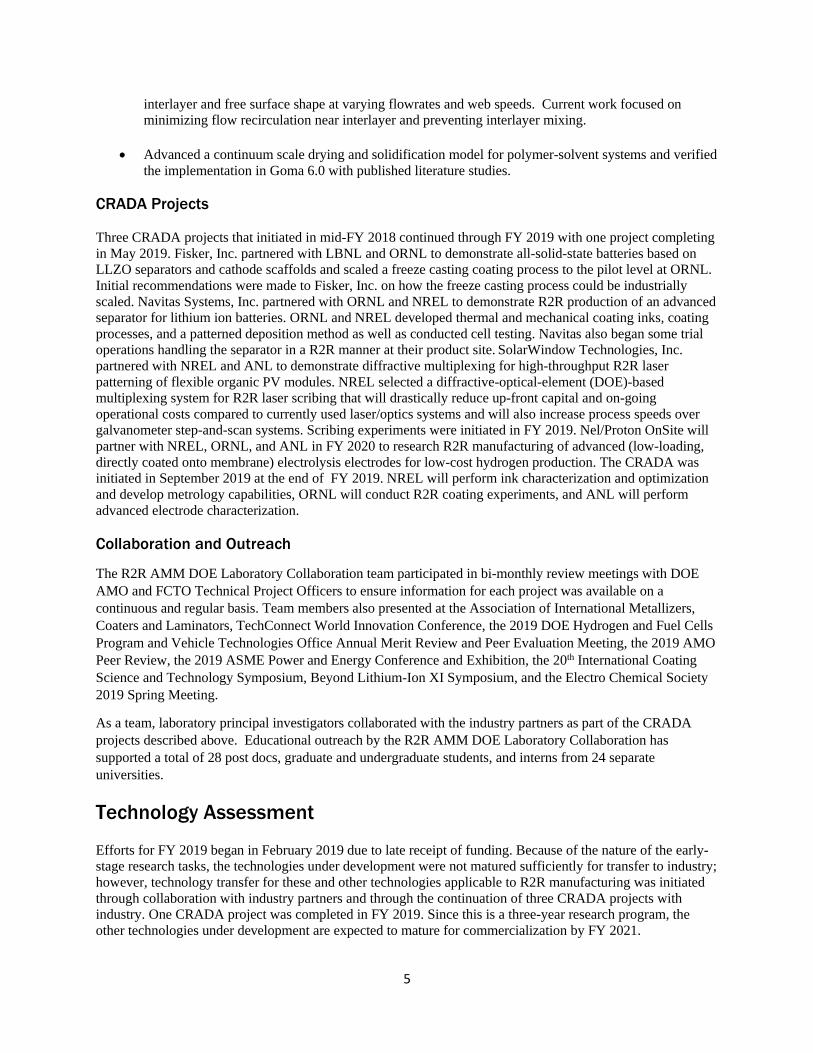
Three CRADA projects that initiated in mid-FY 2018 continued through FY 2019 with one project completing
in May 2019. Fisker, Inc. partnered with LBNL and ORNL to demonstrate all-solid-state batteries based on
LLZO separators and cathode scaffolds and scaled a freeze casting coating process to the pilot level at ORNL.
Initial recommendations were made to Fisker, Inc. on how the freeze casting process could be industrially
scaled. Navitas Systems, Inc. partnered with ORNL and NREL to demonstrate R2R production of an advanced
separator for lithium ion batteries. ORNL and NREL developed thermal and mechanical coating inks, coating
processes, and a patterned deposition method as well as conducted cell testing. Navitas also began some trial
operations handling the separator in a R2R manner at their product site. SolarWindow Technologies, Inc.
partnered with NREL and ANL to demonstrate diffractive multiplexing for high-throughput R2R laser
patterning of flexible organic PV modules. NREL selected a diffractive-optical-element (DOE)-based
multiplexing system for R2R laser scribing that will drastically reduce up-front capital and on-going
operational costs compared to currently used laser/optics systems and will also increase process speeds over
galvanometer step-and-scan systems. Scribing experiments were initiated in FY 2019. Nel/Proton OnSite will
partner with NREL, ORNL, and ANL in FY 2020 to research R2R manufacturing of advanced (low-loading,
directly coated onto membrane) electrolysis electrodes for low-cost hydrogen production. The CRADA was
initiated in September 2019 at the end of FY 2019. NREL will perform ink characterization and optimization
and develop metrology capabilities, ORNL will conduct R2R coating experiments, and ANL will perform
advanced electrode characterization.
Collaboration and Outreach
The R2R AMM DOE Laboratory Collaboration team participated in bi-monthly review meetings with DOE
AMO and FCTO Technical Project Officers to ensure information for each project was available on a
continuous and regular basis. Team members also presented at the Association of International Metallizers,
Coaters and Laminators, TechConnect World Innovation Conference, the 2019 DOE Hydrogen and Fuel Cells
Program and Vehicle Technologies Office Annual Merit Review and Peer Evaluation Meeting, the 2019 AMO
Peer Review, the 2019 ASME Power and Energy Conference and Exhibition, the 20th International Coating
Science and Technology Symposium, Beyond Lithium-Ion XI Symposium, and the Electro Chemical Society
2019 Spring Meeting.
As a team, laboratory principal investigators collaborated with the industry partners as part of the CRADA
projects described above. Educational outreach by the R2R AMM DOE Laboratory Collaboration has
supported a total of 28 post docs, graduate and undergraduate students, and interns from 24 separate
universities.
Technology Assessment
Efforts for FY 2019 began in February 2019 due to late receipt of funding. Because of the nature of the early-
stage research tasks, the technologies under development were not matured sufficiently for transfer to industry;
however, technology transfer for these and other technologies applicable to R2R manufacturing was initiated
through collaboration with industry partners and through the continuation of three CRADA projects with
industry. One CRADA project was completed in FY 2019. Since this is a three-year research program, the
other technologies under development are expected to mature for commercialization by FY 2021.

6
Roll-to-Roll Advanced Materials Manufacturing DOE
Laboratory Collaboration Project Overview
Collaboration Contacts
Claus Daniel, Project and Collaboration Team Lead
Oak Ridge National Laboratory (ORNL)
National Transportation Research Center
2360 Cherahala Blvd.
Knoxville, TN 37932
Phone: 865-946-1544
Email: [email protected]
David L. Wood III, ORNL Project Team Lead
Oak Ridge National Laboratory (ORNL)
National Transportation Research Center
2360 Cherahala Blvd.
Knoxville, TN 37932
Phone: 865-574-1157
Email: [email protected]
Gregory K. Krumdick, ANL Project Team Lead
Argonne National Laboratory (ANL)
9700 S. Cass Avenue
Building 362
Argonne, IL 60439-4844
Phone: 630-252-3952
Email: [email protected]
Michael Ulsh, NREL Project Team Lead
National Renewable Energy Laboratory (NREL)
15013 Denver West Parkway
Golden, CO 80401
Phone: 303-275-3842
Email: [email protected]
Vince Battaglia, LBNL Project Team Lead
Lawrence Berkeley National Laboratory (LBNL)
1 Cyclotron Road
MS 70R 0108B
Berkeley, CA 94720
Phone: 510-495-2679
Email: [email protected]
P. Randall (Randy) Schunk, SNL Project Team Lead
Sandia National Laboratories (SNL)
Advanced Materials Laboratory
1001 University Blvd., SE
Albuquerque, NM 87106

7
Phone: 505-272-7603
Email: [email protected]
Brian Valentine, DOE Roll-to-Roll Technical Project Officer
Department of Energy (DOE)
Energy Efficiency and Renewable Energy (EERE), EE-5A
Advanced Manufacturing Office (AMO)
1000 Independence Ave., S.W., Suite 5F-063
Washington, DC 20585-0121
Phone: 202-586-9741
E-mail: [email protected]
Technical Contacts:
ORNL: Jianlin Li, Yarom Polsky, Georgios Polyzos, Jaswinder Sharma, Erin Creel
ANL:, Deborah Myers, Yuepeng Zhang, Erik Dahl
NREL: Scott Mauger, Peter Rupnowski, Maikel Van Hest
LBNL: Kenny Higa, Marca Doeff
Industry Partners:
Fisker, Inc.
Navitas Systems LLC
SolarWindow Technologies, Inc.
Nel/Proton OnSite
General Motors
Giner
Plug Power
Saint-Gobain
Eastman Kodak
Annual Operating Plan Title and Corporate Planning System (CPS)
Agreement Numbers
Roll-to-Roll Manufacturing Science and Applications: From Ideal Materials to Real-World Devices
ORNL CPS# 97995
ANL CPS #s 29915, 32553 and 32681
NREL CPS #97995
LBNL CPS #31112
SNL CPS #35102
8
Project Introduction
Modern variants of proven, classical R2R coating technologies, as well as new coating methods, are needed for
enabling widespread commercialization of renewable energy storage and conversion technologies. Established
coating methods, such as multilayer slot-die, gravure, reverse comma, tape casting, etc. with homogeneity and
uniformity superior to spraying methods need to be further adapted for improving performance of various
technologies. The shape, size, and morphology of the materials, the chemistry of the formulation, the nature of
slurries, their coating rate, the rate of drying etc. all play a role in determining the final coating architecture,
quality, and performance. In addition, NDE of the produced coatings for improving in-line QC and
identification of defects, prior to down-stream value added steps being performed, is of paramount importance.
More early-stage research is required to solve the challenge of linking particles used in material formulations
to the performance of the final R2R product, especially for a process that uses multiple layers of deposition to
achieve the end product. This activity brought together expertise from five national laboratories to understand
the complex nature of the R2R process and develop methods to improve existing production capabilities.
Objectives
The overall objective of this collaborative effort is to advance technologies applicable to continuous
manufacturing to reduce cost, increase precision, and enable in-line QC and defect detection that will result in
expanded use of R2R processing to produce clean energy technologies. Modeling and simulation of the
materials and processes being developed will be used to understand the fundamental physics and particle
interactions of those materials as they relate to the manufacturing process on both a macroscopic scale and a
continuum scale.
A specific objective is to develop methodologies for multilayer coatings, including those achieved by a single
layer (or single process) construction, with the same performance as structures fabricated in multiple process
steps, thus reducing the number of process steps and reducing manufacturing cost. Another objective is to
advance ES and casting technologies to enable functional multilayer coating approaches for a variety of
applications. Metrology and analytic tools and methods will be developed to further enable identification of
process defects and impacts on a real-time basis. The sum of these efforts that are applicable to flow batteries
for grid applications, filtration applications, electrochemical applications, fuel cell and electrolysis membranes,
catalysts free of Pt group metals, electrodes for electrochemical carbon dioxide reduction concepts, water
manufacturing, and others will serve to advance the state-of-the-art processing science related to these
technologies.
Approach
Core Program
This early stage research and development project on R2R advanced technologies in a national multi-lab
collaboration will deliver advances in the fundamental understanding of R2R processing on moving webs,
carriers, or other substrates and develop tools, metrology approaches, processes, and new materials to improve
yields, overall quality, processing rates and reduce cost. It will overcome the lack of scalability and
understanding of fundamental chemistry and materials properties demonstrated on selected key technology
applications with cross-cutting impacts. The collaboration will explore and execute new methods to engage
with industry and other R2R stakeholders that will enable pre-commercial, low technology readiness level
activities.

9
Technology focus will be on the process science of multilayered coating deposition and drying and curing, its
associated fundamental kinetics, modeling and simulation, and metrology to understand quality and defects.
An advanced mathematical modeling approach will be implemented where LBNL develops particle-scale
colloidal and slurry optimization models that enables understanding of particle effects on mixing. This
information will be subsequently provided to SNL for developing more accurate rheology constitutive
relationships for the continuum-scale coating deposition and drying models. In turn, this latter information will
be provided to LBNL for developing models for wet coating consolidation and drying processes. ORNL, ANL,
and NREL will support the overall three-phase modeling effort by providing experimental data for materials,
components, processing parameters, and devices.
Novel R2R Deposition System Based on ES Technology and Advanced/In Situ
Characterization and Testing (ANL Lead Laboratory)
ANL will perform tasks in coordination with ORNL, LBNL, NREL, and SNL, with a focus on the
development of a novel R2R deposition system based on ES technology, as well as advanced and in-situ
characterization and testing capabilities. Materials developed through this pathway are applicable to fuel
cell/electrolysis, air and water filtration/purification, solid-state battery electrolytes, organic PVs, and CO2
separation/reduction when integrated with multilayer coating techniques. The development of this highly
versatile deposition process will enable significantly improved productivity and device quality (as compared to
conventional deposition methods) for a wide range of high performance applications. In addition to toolsets,
ANL will also develop recipes and processing parameters that are suitable for high throughput R2R ES
processes. ANL will also collaborate with ORNL and NREL to develop innovative nanofiber material systems
as an effort to demonstrate the benefit of R2R ES manufacturing. Three model material systems will be
developed under this context.
ANL will also support NREL’s in-situ metrology development by providing electrospun fiber mats of different
materials, thicknesses, and fiber morphologies for NREL to perform characterization tool design and testing. In
addition, ANL will contribute to modeling and simulation work related to inks and multilayer coatings by
providing ink data to partner labs to enable theoretical studies of correlations between ink compositional
properties (e.g., ingredients, solvents, viscosity) and ink flow, deformation, and drying behavior.
Advanced and in situ testing and characterization of prototype components and devices will be a collaborative
effort between ANL, ORNL, and NREL and will focus on fabricating components and devices prevalent
within water, fuel cell, and energy storage applications. ANL will provide nanofiber materials, ink solutions,
and solvents for distribution to the other laboratory partners for slurry and multilayer composite membrane
synthesis and testing. Advanced ink and electrode characterization will focus on obtaining ink and electrode
microscopic and tomographic properties using high-resolution synchrotron-based diffraction and imaging
techniques, to enable a more in-depth understanding of structure properties of multilayer coatings. ANL will
conduct ultra-small-angle X-ray scattering (USAXS), SAXS and X-ray computed tomography (XCT) studies
of the ink and electrodes provided by ORNL and NREL.
Colloidal Chemistry, Surfactant Research, Slurry Processing, Deposition and
Drying/Curing Methods (ORNL Lead Laboratory)
ORNL will utilize materials provided by ANL and other collaboration partners and provide R2R processed
materials to ANL and NREL for characterization. ORNL will also work with SNL on advanced modeling and
simulation and processing science for special coating operations such as slot die. ORNL will work with LBNL
to provide data for modeling and simulation of the drying behavior with a special focus on interfaces and
solvent/curing agent behavior and relevant defect structures. LBNL staff will spend research time at ORNL to

10
understand processing science with hands-on experiments and enable a close integration of modeling and
simulation into the results guiding the experiments.
Materials will be received from other project partners and integrated into a fully-controlled and optimized
multilayer coating operation. Slurry processing efforts will focus on understanding particle interactions,
receiving experimental guidance from the modeling and simulation tasks at LBNL and SNL, measuring zeta-
potential of individual slurry constituents, optimizing multi-component mixing and long-term stabilization of
slurries. Advanced characterization methods such as transmission electron microscopy (TEM) and X-ray
photoelectron spectroscopy (XPS) will be utilized to determine the material properties.
Optimized slurries in single and multi-slurry systems will be deposited in multiple steps and single steps (dry
on wet and wet on wet) to create multilayer coatings. During drying and curing operations, phase separations
and phase intermixing phenomena will be studied and resulting interfacial behavior and their effects on
functional properties will be determined and optimized. This methodology will be conducted in close
collaboration with the modeling and simulation tasks at LBNL and SNL. Coated materials will also be
distributed to the other laboratory partners to study defect structures and functional device performance.
To support R2R ES platform development by ANL, ORNL will provide lab-scale support of collaboration
advancements in the fundamental understanding of R2R processing on moving webs, carriers, and other
substrates. ORNL will assist in development of tools, metrology approaches, processes, and new materials to
improve yields, overall quality, processing rates, while also reducing cost. Benchtop experiments will be
performed that are aimed at overcoming the lack of scalability and understanding of fundamental chemistry
and materials properties demonstrated on multiple selected key applications with cross-cutting benefits and
impacts.
Physics and Methodologies for Multilayer Coatings/Deposition; Fabrication and In Situ
Testing of Prototype Components and Devices; and Novel Non-Destructive Evaluation,
Quality Control and Metrology (NREL Lead Laboratory)
The NREL effort for multilayer coatings and deposition will focus on the physics, methodologies, and
equipment for multilayer coatings, which are applicable across a vast range of materials, including
functionalized membranes and porous media, ion transport media, catalytic membranes, water filtration and
purification media, electrochemical active layers, and opto-electronic films. Multilayer structures can be
implemented in various forms, including being coated or deposited in simultaneous but discrete layers, or by
being coated in a single layer but taking advantage of consolidation physics to stratify individual constituents.
A particular focus will be exploration of multilayer coating technologies that generally are not or have not been
applied to these applications, but may provide great improvements in throughput, energy consumption, or
quality, and could lead to novel structures. Examples are slide coating and ES. In support of a process-focused
study, detailed exploration of particle-polymer-solvent interactions in the subject inks and slurries will be
undertaken, with advanced characterization, modeling and/or visualization support from other labs. It is
expected that close coordination with SNL and LBNL on slurry, coating and drying modeling will be pursued
to achieve fundamental understandings of these processes and materials. Small-scale ES fabrication
capabilities will be leveraged to pursue basic process understandings for the ES process, including the
development of detailed process windows. NREL will collaborate with ANL to explore scale-up of ES
formulations at ANL’s R2R ES facility.
Fabrication and in-situ testing of prototype components and devices, representative of potential commercial
products, is critical to understand the impact of novel R2R processing techniques on new material

11
technologies. NREL will bring to bear a wide range of application-specific device fabrication and testing
capabilities to support the breadth of material technologies within the multi-lab collaboration.
Real-time in-line and in-process measurement techniques for NDE, QC and metrology are a ubiquitous and
cross-cutting need for novel R2R materials, as identified in the AMO MYPP. In close coordination with
industry and Collaboration partners, NREL will develop and demonstrate real-time inspection techniques that
are broadly applicable. A particular focus of this effort at NREL will be thermal and multispectral imaging
techniques to measure material properties or detect defects in multilayer structures. This work will leverage
existing thermographic, optical, electro-optical, and fluorescence test-beds, at various scales, and a full-scale
industrial web-line, in order to explore excitation physics, impact of material motion, and optimization of
sensitivity and resolution, as well as to demonstrate methods on the web-line using sheet or roll materials from
industry or fabricated at NREL or partner labs.
Macroscopic Mathematical Model of the Drying of a Single Layer Generic Slurry
Containing Monodispersed Colloidal Particles, Binder and Solvent (LBNL Lead
Laboratory)
LBNL will produce mathematical models of component association and aggregation in mixing and for drying
and consolidation of dispersion coatings. As the component interactions and their effects on macroscopic
behavior for these concentrated dispersions of interest are poorly understood, LBNL will design and execute
novel experiments needed to provide the necessary physical insight into these processes. These experiments
will include computer-controlled mixing and monitoring of component sizes, as well as computer-controlled
drying of cast dispersion films.
The modeling approach for drying of multilayer coatings will consider the selection and processing affect for
the arrangement and interaction of dispersion components, how the dispersion formulation and processing
affect the dynamics of film drying, and the component interactions that determine the final product quality.
Models for the drying of coatings will ultimately address the following factors: (1) the dispersion composition
including preparation of components, (2) component mixing order (potentially mixing conditions, mixing
times, mixing rates, temperatures, disperser tool geometry, container geometry and positioning or movement
of disperser tool in container, etc.), (3) coating conditions (potentially dispersion handling, thickness,
deposition mechanism and rate, number of layers, layer composition, and substrate) and (4) drying conditions
(potentially atmosphere, heating mechanisms, heating rate, and drying times).
Validated Continuum-Scale Models to Accelerate Design and Scale-up of Simultaneous
Die Coating Process Technology (SNL Lead Laboratory)
Continuous liquid film coating process technology is one manufacturing sector that has arguably benefitted the
most from continuum scale models of the underpinning capillary hydrodynamics of deposition and subsequent
drying/solidification. SNL will focus on building and validating continuum-scale models that support the R2R
Collaboration multi-laboratory effort to accelerate design and scale-up of coating process technology
underpinning target applications, with a specific focus on simultaneous multilayer coating die/process
technology in FY 2019. Model development will also be aimed at drying and solidification of multiple layers,
simultaneously, so as to understand the underpinning mechanisms of defect formation and prevention.
SNL will coordinate with ORNL (for processing and characterization), LBNL (for materials/microstructure
modeling), and will leverage existing NREL test-beds, platforms and capabilities in solution processing, R2R
processing, and metrology. The aim of the coordinated activities will be model validation (including the

12
sensitivity analysis of the most relevant coating and drying success/failure factors, e.g. rheology, particulate
uniformity and microstructure, wettability and hydrodynamic defect detection at process-envelope boundaries.
The focus will be to develop continuum finite element coating and drying process models of sufficient fidelity
to address the range of materials and breadth of processing routes of the collaboration. In these models,
material variability manifests in the chosen rheological constitutive relationships, capillary wetting models
(static and dynamic), process-model boundary conditions, and composition/microstructural representations
during solidification. As such, close collaboration with the other laboratories for ink/solution characterization
and metrology will be maintained. Extra focus will be on multilayer coating systems, and model fidelity will
be sufficient to capture layer-to-layer stability, process operating window defined by boundaries of
hydrodynamic defect formation and drying/solidification defect rate-processes (drying, curing, fluid flow). All
these aspects will be examined with varying ink/solution rheology (purely viscous behavior and viscoelastic
behavior), process parameters (die-lip/face geometry), wetting/surface energies of die/substrate, and other
factors as defined by the collaboration’s examples.
FY 2020 Plans
Core Projects
The core program tasks that were initiated in FY 2019 will continue by conducting further research on some of
the work completed. ANL will perform battery and fuel cell nanofiber property optimization through
characterization of material concentration, doping effect, and thermal treatment conditions such as polymer
calcination, metal ion oxidation, phase formation and transformation, and microstructure change. Nanofiber
material property optimization will be obtained through in-situ characterization at the ANL APS, which
conduct simultaneous structural and chemical analysis during nanofiber annealing and calcination. A new
nanofiber-based ion-exchange membrane will be developed using a co-electrospinning method to address the
issues of functional moiety aggregation and poor membrane porosity control associated with the current
electrodeionization membranes.
ORNL will perform relevant ink studies, e.g. rheology, surface tension, and zeta potential to support multi-
layer coating of PEMFC electrodes with bilayer cathodes (produced with dual slot-die coating). Studies will be
performed on GDE coatings for photoelectrochemical hydrogen production.
Coordination with ORNL, LBNL, and NREL on ink modeling to enable simultaneous multi-layer coating will
provide data and contribute to model validation. ORNL will continue to collaborate with ANL on USAXS and
complete the small-angle neutron scattering ink study. General purpose SANS experiments at ORNL on
cathode ink colloidal stability will be completed. Simultaneous multi-layer coating studies will be performed
with different particle sizes and pore-size distributions exploring coating physics and parametric effects.
ORNL will continue to coordinate (provide data and contribute to model validation) with SNL and NREL on
multi-layer coating modeling to understand flow interaction of multiple simultaneous wet ink layers, and
collaboration will continue between ORNL and ANL on X-ray computed tomography as well as completing
TEM at ORNL for morphology of coated functional layers. Detailed drying protocol studies will be performed
with the 9-zone (infrared and convective air) ORNL drying oven and the two-stage NREL drying oven as a
function of line speed and temperature ramping to address applications for PEMFC cathodes and PEM
electrodes.
NREL will pursue widely applicable multi-layer coating development and process window understandings, in
coordination with ORNL, with a focus on slide die coating. NREL will continue to receive coated samples
from ORNL and, with these materials as well as materials coated at NREL, will fabricate cells and perform in
13
situ device testing as necessary to understand the impact of ink and process parameters on performance.
Coordination will continue with LBNL and SNL on the development of particle- and continuum-scale models
for these inks and coatings. NREL will perform small-scale ES processing studies, and coordinate with ANL
on exploration of R2R ES of target formulations. Metrology development for further process efficiency
improvement and in-line material and device manufacturing that leads to further improvement in scalability
and efficiency will continue. Development of multi-layer membrane thickness imaging diagnostics will
continue and scoping work for a multi-layer functional layer (i.e. heterogeneous, non-transparent layers where
optical interference is not likely measurable) diagnostic, e.g. for ES/porous structures, will begin.
LBNL’s initial model development work in FY 2019 for drying coatings suggested that there is a deep lack of
understanding about the physics for the concentrated dispersion systems that are the focus of this
Collaboration’s efforts. For this reason, LBNL has proposed to design and construct novel setups for
experiments that will provide needed insight into dispersion mixing and drying, which LBNL will later
summarize in the form of mathematical models, as previously planned. While models for specific experimental
samples will be developed, LBNL’s efforts are meant more generally to develop a methodology for taking
experimental observations and subsequently creating models for new dispersion compositions. Experiments
will start in FY 2020 with a focus on component-level interactions and future work will combine sample
processing and coating drying setups in conjunction with a range of analytical tools.
Component-level interactions will be initially explored in dilute mixtures by combining customized computer-
controlled mixers, a computer-controlled pump, custom control software, a temperature bath, and a particle
size analyzer for rapid measurements of particle size distribution evolution. By varying mixing and pumping
parameters as well as dispersion composition, LBNL seeks to estimate component association strength and
agglomeration rates. This information might be supplemented by similar experiments using techniques such as
Fourier-transform infrared or Raman spectroscopy that are expected to show the degree of polymer adsorption,
possibly in more concentrated dispersions. LBNL then expects to summarize this component interaction
information in the form of a mathematical model of mixing.
The experimental setup for coating and drying is planned to mimic the R2R environment, but with small
samples, allowing the setup to be readily combined with various analytical tools; for example, it will be
portable for transport between the laboratory and the LBNL ALS. An enclosed coating and drying “table” with
a controllable atmosphere will be fabricated. Initial plans are to perform experiments for doctor blading and
possibly spray coating. The setup will be designed for rapid restoration of the initial state for subsequent
experiments. Outside of the ALS, cameras and/or a profilometer will be used to monitor drying film height.
Computer control of substrate tension, coating, and heating should also aid in reproducibility. Experimental
inputs and outputs will be used to guide development of LBNL’s drying coating models. As remote control
will be necessary for work in ALS hutches, which is expected to initially be most readily performed for battery
materials, these functions are being implemented by leveraging funding from the DOE Vehicle Technologies
office. Experiments at the ALS could include X-ray diffraction (XRD) to monitor polymer crystallization
during film drying and/or X-ray radiography/tomography to monitor spatial distribution of high-Z material.
SNL will complete a three-layer test case for the NREL slide-coating trials on membrane electrode assembly
candidate constructions. This will require working closely with the NREL team to determine factor space of
options and reduce the number of trials. Limits of operability with respect to a select parameter set will be
determined and a complete user-interface will demonstrate following features: parameterization – web-speed,
slide angle, layer(s) film thicknesses, vacuum pressure, rheology/layer selection, user-specified parameter
continuations, continuously updated visual of finite element model mesh for indications of mesh distortion,
and automated remeshing and remapping. SNL will also complete and validate a single-, two-, and three-layer
drying model accounting for binder, solvent, and active particulate component from the polymer electrolyte
membrane (PEM) exemplar. The hope is that proper instrumentation can be added to NREL and ORNL
14
drying ovens to help with validation of the model (temperature vs. time in the coating, etc.). At a minimum,
the planned work from the drying table being developed at LBNL with SNL-assistance will be used for
validation.
Other Collaboration efforts may include expanded predictive modeling and simulation, advanced flexible
electronics and opto-electronics, and advanced CO2 conversion electrodes. The Collaboration laboratories will
coordinate to define and develop an industry stakeholder council (or similar activity approved by AMO) to
include companies such as Saint-Gobain, FLEXcon, and Eastman Kodak as examples. The goal is to organize
and hold an R2R stakeholder technical meeting to gather information on current R2R technology needs and
barriers in the areas of study of the multi-lab collaboration.
CRADA projects
Efforts for the CRADA projects with agreements negotiated in FY 2018 continued through FY 2019 to meet
contractual and programmatic requirements. This includes the following efforts:
• Fisker, Inc. - Fisker, Inc. partnered with LBNL and ORNL to demonstrate all-solid-state batteries
based on LLZO separators and cathode scaffolds that will allow scaling a freeze casting process to the
pilot level at ORNL. This project completed in May 2019.
• Navitas Systems, Inc. - Navitas Systems, Inc. partnered with ORNL and NREL to demonstrate R2R
production of an advanced separator for lithium ion batteries.
• SolarWindow Technologies, Inc. – SolarWindow Technologies, Inc. partnered with NREL and ANL
to demonstrate diffractive multiplexing for high-throughput R2R laser patterning of flexible organic
PV modules.
• Nel Hydrogen/Proton OnSite - Proton OnSite will partner with NREL, ORNL and ANL to research
R2R manufacturing of advanced (low loading, direct coated onto membrane) electrolysis anodes for
low-cost hydrogen production. This project remained in the approval process at the end of FY 2019.
The project is expected to start early in FY 2020.
Potential New Efforts
ANL ES
• R2R demonstration of ES recipes developed by ORNL and NREL
• Tool development for process efficiency improvement: in-line ES and annealing
• Demonstrate devices for battery, fuel cell, and ion-exchange membrane applications
• Perform in-situ APS experiments to accelerate material and process optimization
• Feasibility study on R2R printed electronics
NREL Multilayer Coatings
• Understand the miscibility of adjacent layers in multi-layer coatings during coating and drying
• Determine the impact of interfacial tension
• Determine the impact of particle size, viscosity, drying time, etc. on interlayer diffusion during drying
• Determine the impact of relative volatility of solvents between adjacent layers
• Study the effects of shear rate and time of deformation during coating on resulting microstructure in
weakly agglomerated systems
• Evaluate the possible range of thicknesses for two-layer and three-layer slide die coatings based on die
design and flow conditions

15
• Model interparticle interactions and resulting macro properties (e.g. rheology) in inks, based on
constituent properties
• Demonstrate novel multi-layer structures in specific applications that have the same or improved
performance and reduced manufacturing cost by reducing process steps, CAPEX, energy
consumption, floor space
Technology Transfer Paths
For the core program tasks, technology will be transferred through collaboration with industry and companies
with CRADA contracts and the DOE team will work closely with any companies to ensure technologies are
accepted for commercialization. Various aspects of the R2R AMM program were presented at conferences,
symposia, peer reviews and during direct contact with industry and the commercial sector. Specific research
was reported in technical journals and through patent applications.
The models and simulations will be extended to encompass not only materials discovery, but also to accelerate
materials synthesis and fabrication applicable to industry. This effort leverages the R2R processes and
technologies at ORNL, the engineering expertise and research facilities such as the APS and the Materials
Engineering Research Facility (MERF) at ANL, and the metrology, R2R processing, and device fabrication
and testing capabilities at NREL, in conjunction with the materials design computational efforts of SNL and
LBNL. SNL will also conduct training courses for the modeling and simulation tools that will be open to
industry, national lab, and academic partners.
Results
Novel R2R Deposition System Based on ES Technology and
Advanced/In Situ Characterization and Testing (ANL Lead
Laboratory)
R2R ES Platform Development
The overall goal is to develop a R2R ES platform that is applicable to a truly vast range of materials, such as
functionalized membranes and ion transport media for fabrication of water filtration membranes, fuel cell
membranes, and battery electrodes. One of the subtasks was the identification of the best-of-practice R2R
modules and its configuration relative to the ES modules.
Comparative studies of various R2R configurations and designs were conducted, with the focus on the
positions of the R2R modules relative to the ES modules. Two popular configurations were investigated. One
is bottom-up spinning as illustrated in Figure 2 (a) and the other is top-down spinning as illustrated in Figure 2
(b). With the bottom-up spinning, the moving substrate (R2R module) is facing down to the spinnerets;
therefore, the microjets and in turn nanofibers generated from the spinning process are projected upward from
the spinnerets towards the substrate. Hence, droplets from the needle tips will not contaminate the nanofiber
products. On the other hand, with a top-down spinning geometry, the precursor droplets at the spinneret tip can
fall down to the existing nanofibers, damaging nanofiber structures. Based on the above consideration, bottom-
up configuration was selected for R2R ES development.
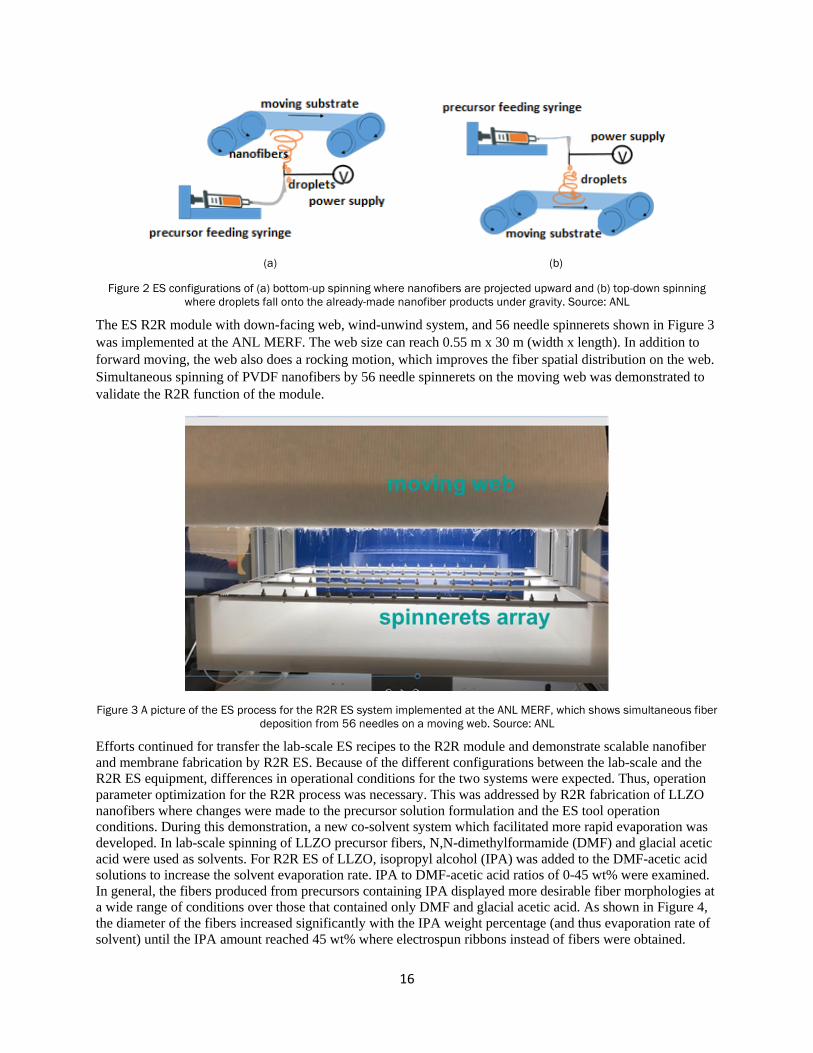
16
(a) (b)
Figure 2 ES configurations of (a) bottom-up spinning where nanofibers are projected upward and (b) top-down spinning
where droplets fall onto the already-made nanofiber products under gravity. Source: ANL
The ES R2R module with down-facing web, wind-unwind system, and 56 needle spinnerets shown in Figure 3
was implemented at the ANL MERF. The web size can reach 0.55 m x 30 m (width x length). In addition to
forward moving, the web also does a rocking motion, which improves the fiber spatial distribution on the web.
Simultaneous spinning of PVDF nanofibers by 56 needle spinnerets on the moving web was demonstrated to
validate the R2R function of the module.
Figure 3 A picture of the ES process for the R2R ES system implemented at the ANL MERF, which shows simultaneous fiber
deposition from 56 needles on a moving web. Source: ANL
Efforts continued for transfer the lab-scale ES recipes to the R2R module and demonstrate scalable nanofiber
and membrane fabrication by R2R ES. Because of the different configurations between the lab-scale and the
R2R ES equipment, differences in operational conditions for the two systems were expected. Thus, operation
parameter optimization for the R2R process was necessary. This was addressed by R2R fabrication of LLZO
nanofibers where changes were made to the precursor solution formulation and the ES tool operation
conditions. During this demonstration, a new co-solvent system which facilitated more rapid evaporation was
developed. In lab-scale spinning of LLZO precursor fibers, N,N-dimethylformamide (DMF) and glacial acetic
acid were used as solvents. For R2R ES of LLZO, isopropyl alcohol (IPA) was added to the DMF-acetic acid
solutions to increase the solvent evaporation rate. IPA to DMF-acetic acid ratios of 0-45 wt% were examined.
In general, the fibers produced from precursors containing IPA displayed more desirable fiber morphologies at
a wide range of conditions over those that contained only DMF and glacial acetic acid. As shown in Figure 4,
the diameter of the fibers increased significantly with the IPA weight percentage (and thus evaporation rate of
solvent) until the IPA amount reached 45 wt% where electrospun ribbons instead of fibers were obtained.

17
Figure 4 Fiber diameter as a function of evaporation rate for different concentrations of IPA in solution. Source: ANL
In addition to solvent evaporation rate, optimization of the solvent viscosity, ES voltage, and the spinneret-web
distance was performed using the Design of Experiment depicted in Figure 5. The optimized recipe was
produced at scale as shown in Figure 6 to validate R2R ES production of electrospun battery materials.
Figure 5 Comparison of fibers produced from precursors with and without IPA at different voltages and working distances
for R2R ES process optimization. Source: ANL

18
Figure 6 LLZO precursor nanofibers deposited on an aluminum web at scale using R2R ES module. Source: ANL
Advanced Materials and ES Recipe Development
Design work to develop material systems and ES processes for fabrication of battery electrolyte and fuel cell
electrodes was performed collaboratively amongst ANL, ORNL, and NREL on the existing in-house benchtop
ES tools. Based on discussion by each lab’s teams, ANL and ORNL teams focused on advanced materials and
recipes applicable to ES processes for solid lithium battery applications. Both teams developed the same
electrolyte materials with each team optimizing a different set of process parameters to accelerate the
development process. ANL and NREL teams developed fuel cell materials where the ANL team focused on
solid oxide fuel cell applications while the NREL team focused on low-temperature polymer fuel cell
applications. The two teams shared the results regularly throughout the development process. These efforts can
expand the application domains of ES fuel cell materials.
ANL chose LLZO and LSCF as the representative battery and oxide fuel cell materials, respectively. ES
recipes of LLZO and LSCF were developed through several iterations of ES experiments. For the LLZO,
process optimization was performed to improve nanofiber quality, such as morphology and diameter
distribution. Figure 7 shows an example of ES process optimization for LLZO precursor nanofiber from
scanning electron microscope (SEM) images. The influence of applied voltage on the nanofiber morphology
was clearly observed – higher voltage leading to larger nanofiber diameter distribution.
Figure 7 SEM images of the as-spun LLZO polymer precursor nanofibers that were synthesized under the different voltages
shown. Source: ANL
Other fabrication parameters, such as working distance and precursor solution viscosity, were also examined to
achieve feasible process window. Figure 8 shows an SEM image of LLZO fibers after optimization. Average
fiber diameters of 220 nm were observed with a narrow diameter distribution of 12%.
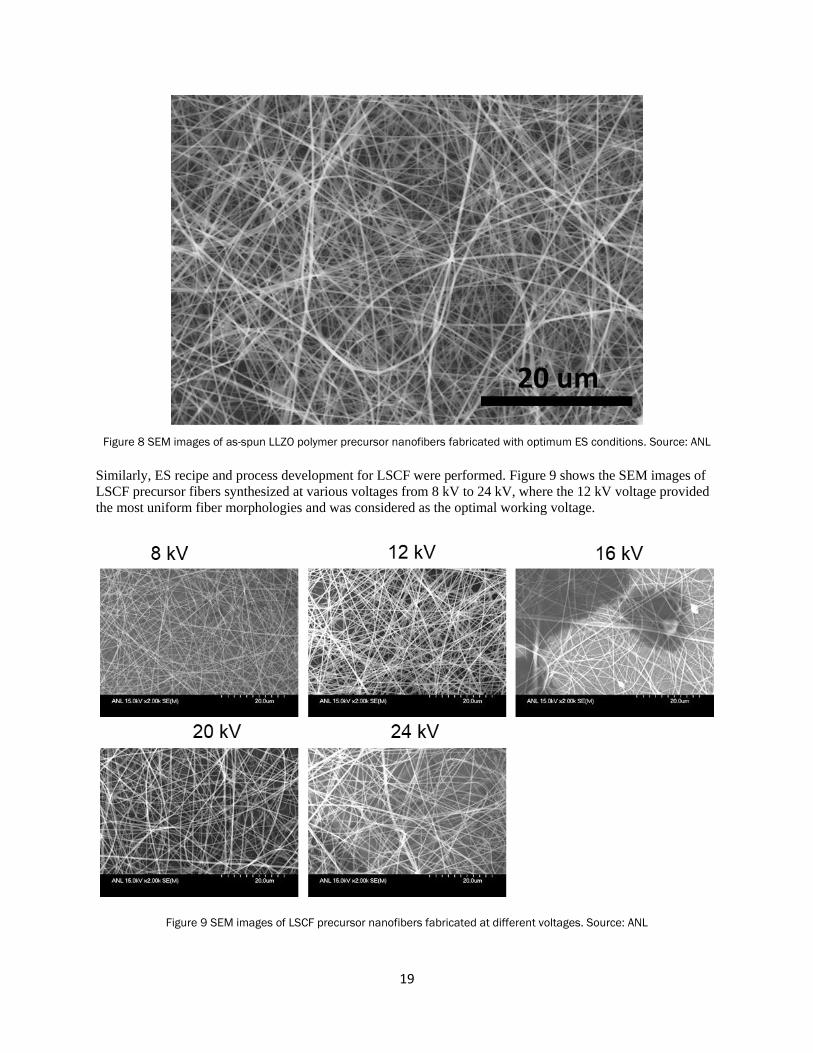
19
Figure 8 SEM images of as-spun LLZO polymer precursor nanofibers fabricated with optimum ES conditions. Source: ANL
Similarly, ES recipe and process development for LSCF were performed. Figure 9 shows the SEM images of
LSCF precursor fibers synthesized at various voltages from 8 kV to 24 kV, where the 12 kV voltage provided
the most uniform fiber morphologies and was considered as the optimal working voltage.
Figure 9 SEM images of LSCF precursor nanofibers fabricated at different voltages. Source: ANL
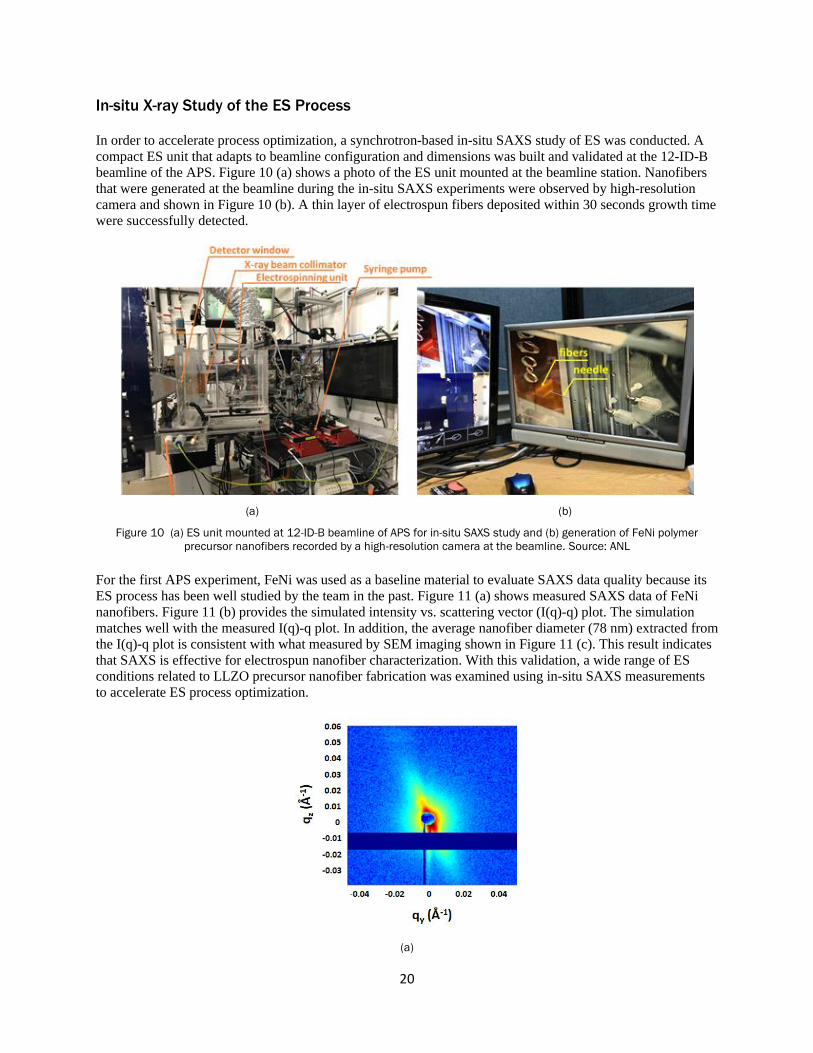
20
In-situ X-ray Study of the ES Process
In order to accelerate process optimization, a synchrotron-based in-situ SAXS study of ES was conducted. A
compact ES unit that adapts to beamline configuration and dimensions was built and validated at the 12-ID-B
beamline of the APS. Figure 10 (a) shows a photo of the ES unit mounted at the beamline station. Nanofibers
that were generated at the beamline during the in-situ SAXS experiments were observed by high-resolution
camera and shown in Figure 10 (b). A thin layer of electrospun fibers deposited within 30 seconds growth time
were successfully detected.
(a) (b)
Figure 10 (a) ES unit mounted at 12-ID-B beamline of APS for in-situ SAXS study and (b) generation of FeNi polymer
precursor nanofibers recorded by a high-resolution camera at the beamline. Source: ANL
For the first APS experiment, FeNi was used as a baseline material to evaluate SAXS data quality because its
ES process has been well studied by the team in the past. Figure 11 (a) shows measured SAXS data of FeNi
nanofibers. Figure 11 (b) provides the simulated intensity vs. scattering vector (I(q)-q) plot. The simulation
matches well with the measured I(q)-q plot. In addition, the average nanofiber diameter (78 nm) extracted from
the I(q)-q plot is consistent with what measured by SEM imaging shown in Figure 11 (c). This result indicates
that SAXS is effective for electrospun nanofiber characterization. With this validation, a wide range of ES
conditions related to LLZO precursor nanofiber fabrication was examined using in-situ SAXS measurements
to accelerate ES process optimization.
(a)
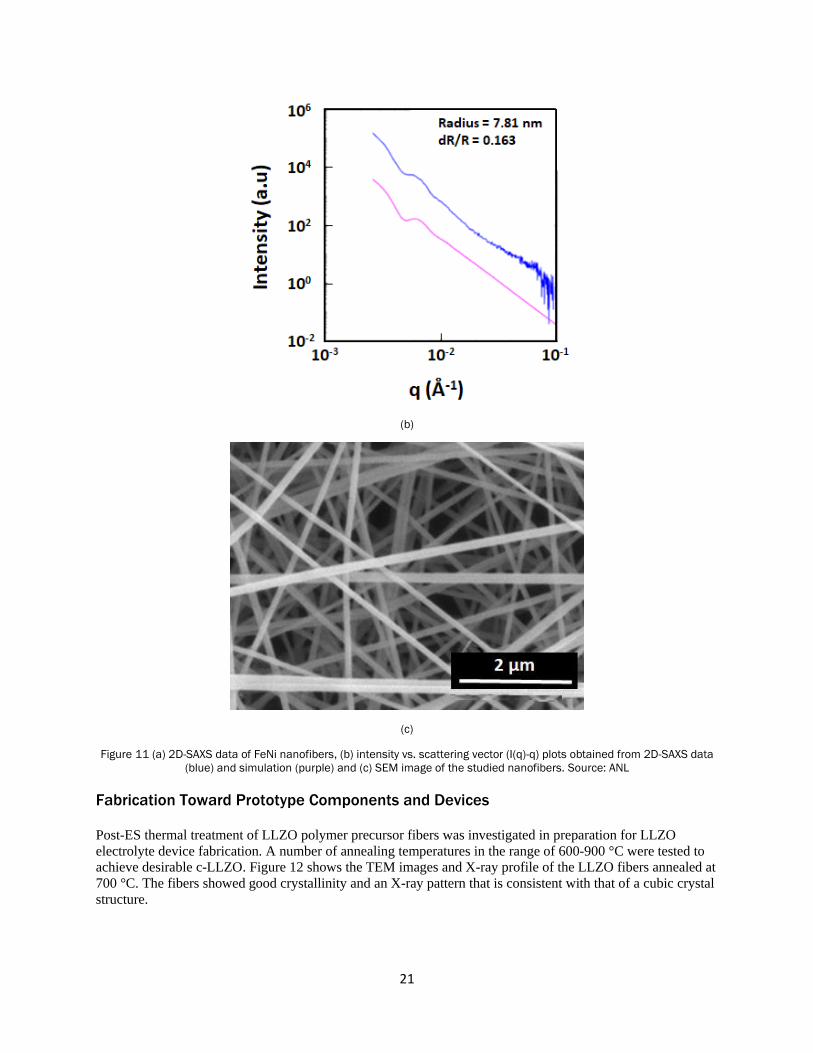
21
(b)
(c)
Figure 11 (a) 2D-SAXS data of FeNi nanofibers, (b) intensity vs. scattering vector (I(q)-q) plots obtained from 2D-SAXS data
(blue) and simulation (purple) and (c) SEM image of the studied nanofibers. Source: ANL
Fabrication Toward Prototype Components and Devices
Post-ES thermal treatment of LLZO polymer precursor fibers was investigated in preparation for LLZO
electrolyte device fabrication. A number of annealing temperatures in the range of 600-900 °C were tested to
achieve desirable c-LLZO. Figure 12 shows the TEM images and X-ray profile of the LLZO fibers annealed at
700 °C. The fibers showed good crystallinity and an X-ray pattern that is consistent with that of a cubic crystal
structure.

22
(a) (b)
Figure 12 (a) TEM image and (b) X-ray profile of LLZO fibers after 700°C annealing. Source: ANL
In addition to the fuel cell and battery materials, the PVDF-based polymer fibers were also developed for water
filtration membrane applications. Figure 13 shows the pictures of the polymer membranes viewed from top
and side.
(a) (b)
Figure 13 PVDF-based polymer nonwoven structure for water filtration membrane application viewed from (a) top and (b)
side. Source: ANL
Advanced Ink and Membrane Characterization
Capabilities at ANL were used for USAXS characterizations of inks under different ultrasonic and shear
mixing conditions. The overall goal was for ANL to provide support to NREL during the development of
catalyst-ionomer-solvent ink compositions and processing techniques for efficient R2R fabrication of GDEs.
The collaborative effort focused on optimizing cell performance and cell lifetime and minimizing ink
processing time and cost by using USAXS to analyze the ink agglomerate structure during the mixing process.
The specific purpose of the USAXS experiments was to study the ink microstructure evolution as a function of
ink composition, ink mixing method, and time. These data complemented the rheology and performance data
from NREL for inks and membrane-electrode assemblies. USAXS data was acquired and analyzed for more
than 20 catalyst-ionomer inks with different dispersion formulations (25wt% IrOx-0.2 ionomer-to-carbon ratio,
ionomer only, Pt-high surface-area carbon (HSC), Pt Vulcan, etc.) and solvent compositions. A manuscript
titled “The Impact of Catalyst Ink Dispersing Methodology on Fuel Cell Performance Using In-situ X-ray
Scattering” was published in ACS Applied Energy Materials (see Key Publications at end of report). The
formulations of all the inks studied are shown in Table I.

23
Table I List of USAXS-SAXS Samples
Label Dispersion Formulation Solvent
1 H1 1.5wt%Pt-HSC-0 I/C (no ionomer) 10/90 nPA/H2O
2 H2 1.5wt%Pt-HSC-0 I/C (no ionomer) 50/50 nPA/H2O
3 H3 1.5wt%Pt-HSC-0 I/C (no ionomer) 75/25 nPA/H2O
4 H4 1.5wt%Pt-HSC-0 I/C (no ionomer) 90/10 nPA/H2O
5 HAI 1.5wt%Pt-HSC-0.9 I/C (PFAEM) 75/25 nPA/H2O
6 HI1 1.5wt%Pt-HSC-0.9 I/C 10/90 nPA/H2O
7 HI2 1.5wt%Pt-HSC-0.9 I/C 25/75 nPA/H2O
8 HI3 1.5wt%Pt-HSC-0.9 I/C 50/50 nPA/H2O
9 HI4 1.5wt%Pt-HSC-0.9 I/C 75/25 nPA/H2O
10 HI5 1.5wt%Pt-HSC-0.9 I/C 90/10 nPA/H2O
11 IR1 25wt% IrOx-0 IC (no ionomer) 50/50 nPA/H2O
12 IR2 25wt% IrOx-0.2 I/C 50/50 nPA/H2O
13 N1 2.5wt% NafionD2020 (ionomer only) 10/90 nPA/H2O
14 N2 2.5wt% NafionD2020 (ionomer only) 25/75 nPA/H2O
15 N3 2.5wt% NafionD2020 (ionomer only) 50/50 nPA/H2O
16 N4 2.5wt% NafionD2020 (ionomer only) 75/25 nPA/H2O
17 N5 2.5wt% NafionD2020 (ionomer only) 90/10 nPA/H2O
18 V1 5wt%Pt-VULCAN-0 I/C (no ionomer) 10/90 nPA/H2O
19 V2 5wt%Pt-VULCAN-0 I/C (no ionomer) 50/50 nPA/H2O
20 V3 5wt%Pt-VULCAN-0 I/C (no ionomer) 90/10 nPA/H2O
21 VI1 5wt%Pt-VULCAN-0.5 I/C 10/90 nPA/H2O
22 VI2 5wt%Pt-VULCAN-0.5 I/C 25/75 nPA/H2O
23 VI3 5wt%Pt-VULCAN-0.5 I/C 50/50 nPA/H2O
24 VI4 5wt%Pt-VULCAN-0.5 I/C 75/25 nPA/H2O
25 VI5 5wt%Pt-VULCAN-0.5 I/C 90/10 nPA/H2O
Iridium oxohydroxide (IrOx) catalyst ink studies
IrOx catalyst inks with and without ionomer were characterized using USAXS to determine the impact of
ionomer on the catalyst agglomerate size. The analysis results for the IrOx USAXS data, using global unified
fit, are shown in Figure 14. The unified fitting results for the IrOx ink without ionomer shows a larger radius
of gyration of the primary particles and a larger power law slope compared to those from the IrOx ink with
ionomer. A decrease in the power law slope is generally correlated with a lower population of agglomerates as
the aggregates are uniformly distributed in the catalyst ink. This indicates that there is a reduction in the
agglomerate size with the addition of ionomer, which correlates with the rheological behavior showing that the
unsupported catalyst ink is stabilized against agglomeration by ionomer.
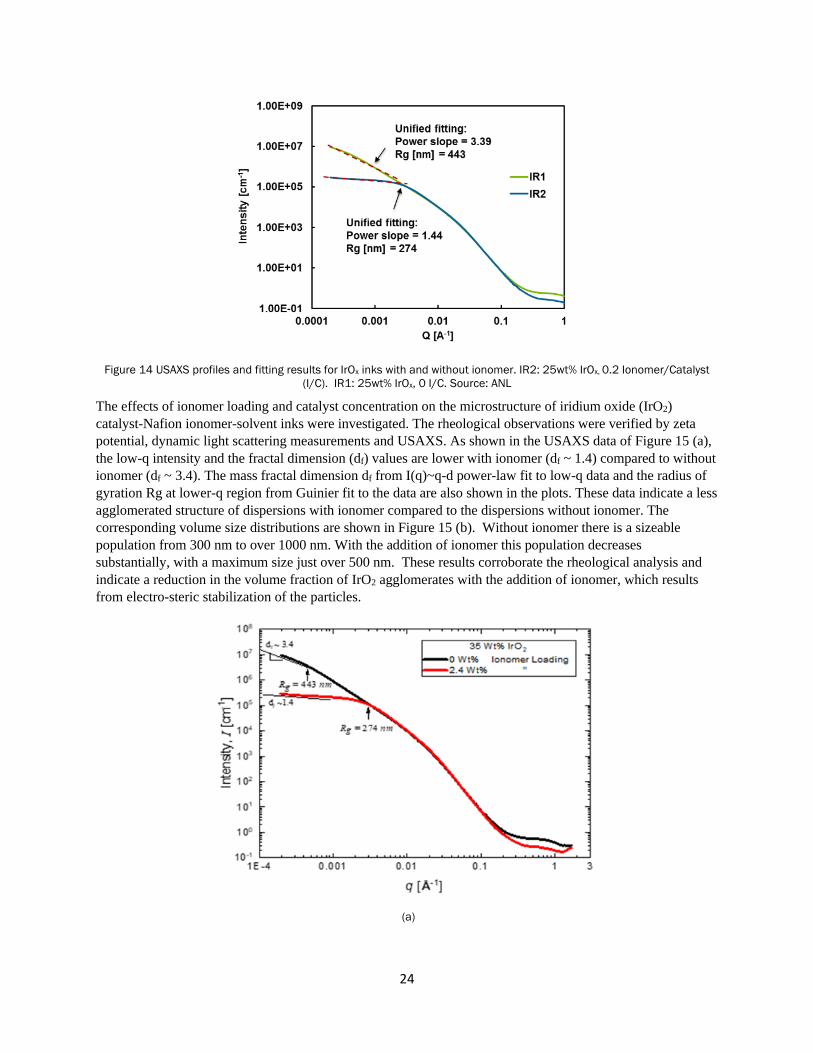
24
Figure 14 USAXS profiles and fitting results for IrOx inks with and without ionomer. IR2: 25wt% IrOx, 0.2 Ionomer/Catalyst
(I/C). IR1: 25wt% IrOx, 0 I/C. Source: ANL
The effects of ionomer loading and catalyst concentration on the microstructure of iridium oxide (IrO2)
catalyst-Nafion ionomer-solvent inks were investigated. The rheological observations were verified by zeta
potential, dynamic light scattering measurements and USAXS. As shown in the USAXS data of Figure 15 (a),
the low-q intensity and the fractal dimension (df) values are lower with ionomer (df ~ 1.4) compared to without
ionomer (df ~ 3.4). The mass fractal dimension df from I(q)~q-d power-law fit to low-q data and the radius of
gyration Rg at lower-q region from Guinier fit to the data are also shown in the plots. These data indicate a less
agglomerated structure of dispersions with ionomer compared to the dispersions without ionomer. The
corresponding volume size distributions are shown in Figure 15 (b). Without ionomer there is a sizeable
population from 300 nm to over 1000 nm. With the addition of ionomer this population decreases
substantially, with a maximum size just over 500 nm. These results corroborate the rheological analysis and
indicate a reduction in the volume fraction of IrO2 agglomerates with the addition of ionomer, which results
from electro-steric stabilization of the particles.
(a)

25
(b)
Figure 15 (a) USAXS scattering curves for 35wt% IrO2 dispersions both without and with ionomer (2.4 wt%) in the inks. (b)
The corresponding volume size distribution of the inks without and with ionomer. Source: ANL
Pt/C catalyst ink studies
USAXS data were taken on Pt/Vulcan and Pt/HSC-ionomer-solvent inks and ionomer-solvent dispersions
described in Table I. This data series investigated the effect of solvent and ionomer on the agglomerate-
aggregate structure-rheology correlation for ionomer, Pt/Vulcan, and Pt/HSC inks. Figure 16 shows the
USAXS scattering curves for 2.5wt% Nafion ionomer solutions that were used to investigate the effect of
solvent ratio. As can be seen in Figure 16, the structure of the ionomer solution is governed by the ratio of n-
propanol (nPA) and water in the solvent. The two peaks evident in the USAXS profiles generally correspond
to the Teflon-like backbone matrix peaks at >0.3 Å-1 knee and a sharp constructive interference peak due to the
clustering/alignment of the ionomer clusters or rods at ˜0.03 Å-1. The curved region between the two peaks is
associated with scattering from the individual clusters/rods. This scattering maximum is most pronounced for
ionomer in high dielectric constant solvents, such as water, due to the increase in electrostatic repulsions
between the ionomer clusters/rods versus lower dielectric constant solvents, such as nPA. The scattering
maximum sharpens, and its intensity increases from nPA-rich to water-rich solutions, indicating an increase in
association of the ionomer clusters/rods. Association or formation agglomerates of ionomer rods has been
proposed to affect the ability of the ionomer to break up carbon agglomerates. A summary of the results of the
fitting of the USAXS data for these dispersions is shown in Table II.
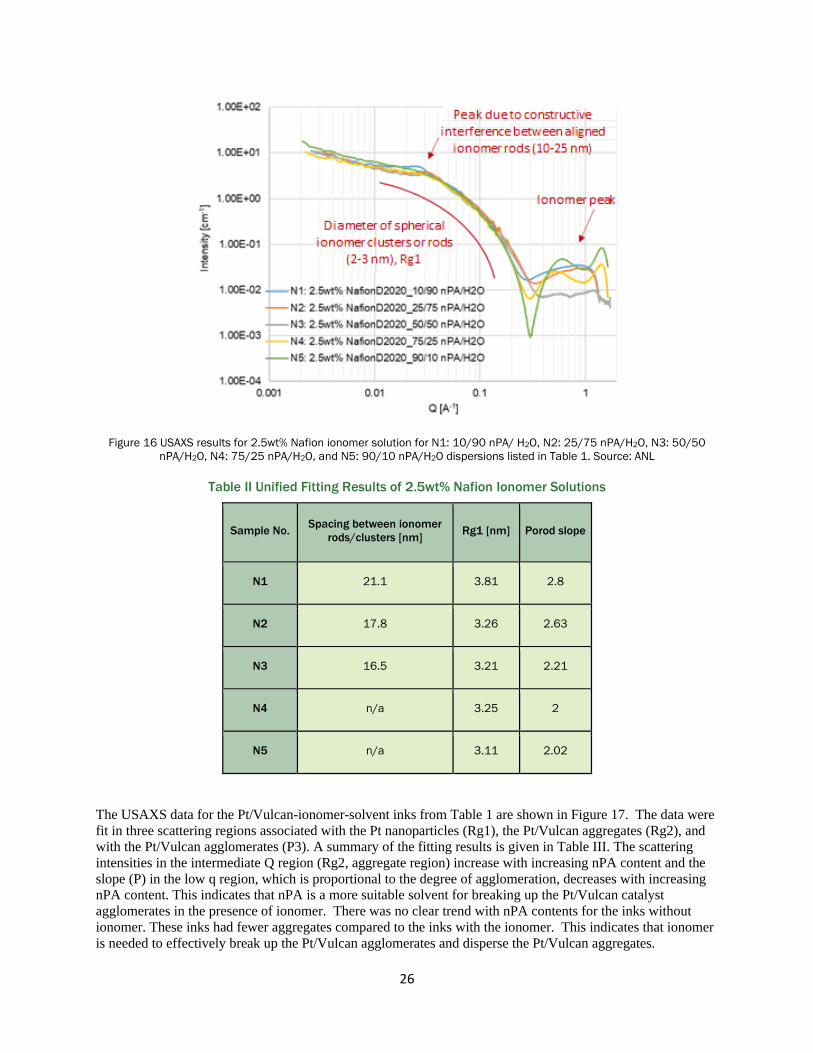
26
Figure 16 USAXS results for 2.5wt% Nafion ionomer solution for N1: 10/90 nPA/ H2O, N2: 25/75 nPA/H2O, N3: 50/50
nPA/H2O, N4: 75/25 nPA/H2O, and N5: 90/10 nPA/H2O dispersions listed in Table 1. Source: ANL
Table II Unified Fitting Results of 2.5wt% Nafion Ionomer Solutions
Sample No. Spacing between ionomer
rods/clusters [nm] Rg1 [nm] Porod slope
N1 21.1 3.81 2.8
N2 17.8 3.26 2.63
N3 16.5 3.21 2.21
N4 n/a 3.25 2
N5 n/a 3.11 2.02
The USAXS data for the Pt/Vulcan-ionomer-solvent inks from Table 1 are shown in Figure 17. The data were
fit in three scattering regions associated with the Pt nanoparticles (Rg1), the Pt/Vulcan aggregates (Rg2), and
with the Pt/Vulcan agglomerates (P3). A summary of the fitting results is given in Table III. The scattering
intensities in the intermediate Q region (Rg2, aggregate region) increase with increasing nPA content and the
slope (P) in the low q region, which is proportional to the degree of agglomeration, decreases with increasing
nPA content. This indicates that nPA is a more suitable solvent for breaking up the Pt/Vulcan catalyst
agglomerates in the presence of ionomer. There was no clear trend with nPA contents for the inks without
ionomer. These inks had fewer aggregates compared to the inks with the ionomer. This indicates that ionomer
is needed to effectively break up the Pt/Vulcan agglomerates and disperse the Pt/Vulcan aggregates.
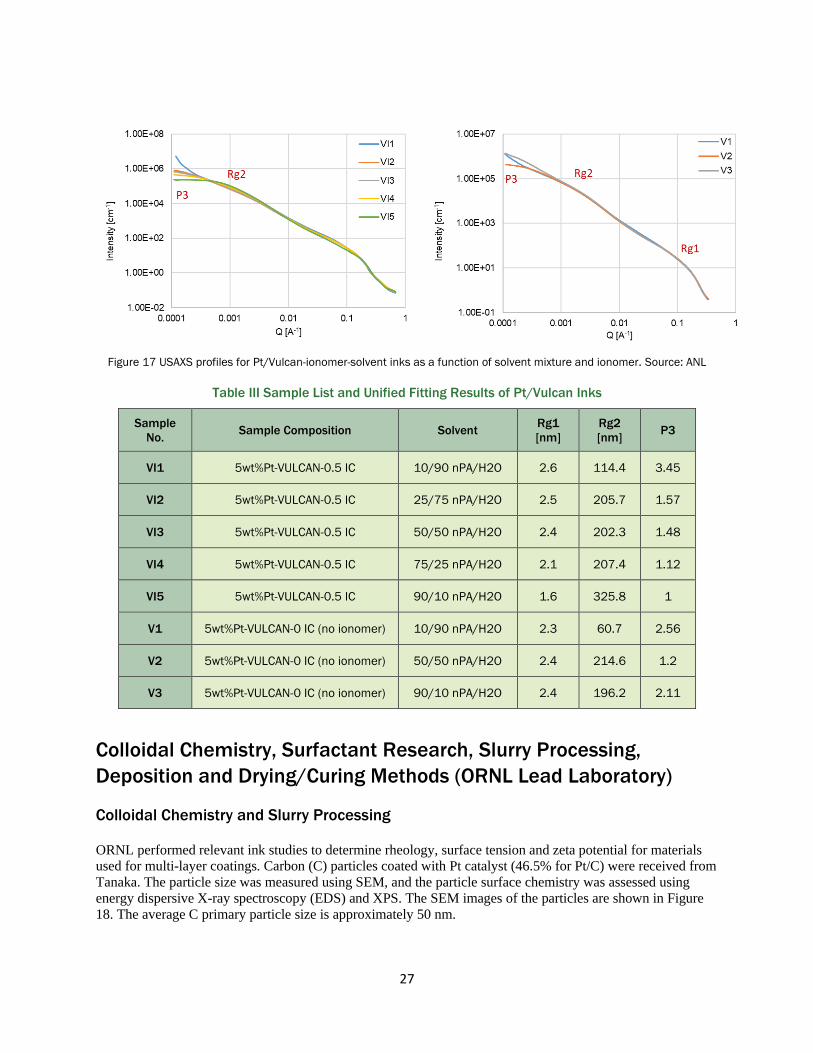
27
Figure 17 USAXS profiles for Pt/Vulcan-ionomer-solvent inks as a function of solvent mixture and ionomer. Source: ANL
Table III Sample List and Unified Fitting Results of Pt/Vulcan Inks
Sample
No. Sample Composition Solvent
Rg1
[nm]
Rg2
[nm] P3
VI1 5wt%Pt-VULCAN-0.5 IC 10/90 nPA/H2O 2.6 114.4 3.45
VI2 5wt%Pt-VULCAN-0.5 IC 25/75 nPA/H2O 2.5 205.7 1.57
VI3 5wt%Pt-VULCAN-0.5 IC 50/50 nPA/H2O 2.4 202.3 1.48
VI4 5wt%Pt-VULCAN-0.5 IC 75/25 nPA/H2O 2.1 207.4 1.12
VI5 5wt%Pt-VULCAN-0.5 IC 90/10 nPA/H2O 1.6 325.8 1
V1 5wt%Pt-VULCAN-0 IC (no ionomer) 10/90 nPA/H2O 2.3 60.7 2.56
V2 5wt%Pt-VULCAN-0 IC (no ionomer) 50/50 nPA/H2O 2.4 214.6 1.2
V3 5wt%Pt-VULCAN-0 IC (no ionomer) 90/10 nPA/H2O 2.4 196.2 2.11
Colloidal Chemistry, Surfactant Research, Slurry Processing,
Deposition and Drying/Curing Methods (ORNL Lead Laboratory)
Colloidal Chemistry and Slurry Processing
ORNL performed relevant ink studies to determine rheology, surface tension and zeta potential for materials
used for multi-layer coatings. Carbon (C) particles coated with Pt catalyst (46.5% for Pt/C) were received from
Tanaka. The particle size was measured using SEM, and the particle surface chemistry was assessed using
energy dispersive X-ray spectroscopy (EDS) and XPS. The SEM images of the particles are shown in Figure
18. The average C primary particle size is approximately 50 nm.

28
Figure 18 SEM images of the carbon particles coated with Pt catalyst; carbon primary particle size is approximately 50 nm.
Source: ORNL
The element analysis was performed using EDS measurements as shown for the area in Figure 19 (a) and the
element maps are shown in Figure 19 (b) for Pt and Figure 2 (c) for carbon. The measurements showed a
uniform distribution of Pt on the surface of the carbon particles.
(a) (b) (c)
Figure 19 (a) Area where EDS measurements were taken and the element maps for (b) platinum and (b) carbon atoms on
the surface of the coated particles. Source: ORNL
XPS analysis was performed on the Pt/C powder to calculate the element atomic percent (at%) on the surface
of the particles. The powder was dispersed onto double-sided tape fixed to a glass slide. After inserting the
sample into the XPS analysis chamber, a wide energy range survey scan was acquired to determine all
elements present. The measurement results and the fitting analysis of the spectra are summarized in Figures 20
(a) and (b) respectively. Along with C and Pt, O was observed as well as a near-trace amount of nitrogen. The
line shape of the C 1s indicates that the carbon is primarily graphitic in nature (sp2). The Pt 4f was primarily
metallic, but a small doublet assigned to Pt-oxide (likely PtO2) was needed to get a good peak fit. The Pt
content is 5.5 at% according to the spectra analysis in Figure 20 (b).

29
(a) (b)
Figure 20 (a) Survey XPS spectrum of the Pt/C particles and (b) XPS core data analysis and the element at% on the surface
of the particles. Source: ORNL
Zeta potential measurements were performed on colloidal suspensions of the Pt/C particles dispersed in
mixtures of water and IPA at various pH values. The surface potential of the particles was measured in order to
optimize the dispersion during slurry processing. A representative plot of these zeta potentials at different pH
values is shown in Figure 21.
Figure 21 Zeta potential measurements of Pt/C particles dispersed in water having 5% KNO3. Source: ORNL
Zeta potential measurements were also performed on colloidal suspensions of Pt/C particles dispersed in water,
IPA, and Nafion D2020. A representative plot of the zeta potential variation at different IPA vol% is shown in
Figure 22. The zeta potential decreases when the IPA content is increased. Slurries based on optimum particle
dispersion conditions will be formulated and their rheological properties will be measured in upcoming work.

30
Figure 22 Zeta potential measurements of Pt/C particles dispersed in water, IPA and Nafion. Source: ORNL
Deposition and Drying/Curing
NREL and ORNL consulted on coating methodologies, such as combined gravure and slot-die and dual slot-
die, and key parameters to achieve deposition of an ionomer overlayer on a PEMFC cathode. ORNL’s
objective was to either complete the ionomer overlayer deposition step at the same time as the cathode
electrocatalyst layer or eliminate the need for it altogether. Technical drawings of the ORNL pilot slot-die
coating head were supplied to SNL for implementation into the coating deposition physics model. A spinoff
from one of the CRADA projects was that the design for pattern gravure rollers was completed. ORNL and
NREL also agreed on separator and coating materials for the patterned coatings; however, the formulations for
the ceramic coatings need to be redesigned due to poor wetting of the separator.
It is desirable from a high-volume manufacturing standpoint to minimize the amount of organic solvent used in
the PEMFC inks and maximize the solids loading. The former goal reduces the amount of solvent that must be
recovered (i.e. through vacuum distillation, etc.), and the latter goal reduces the total thermal budget and dryer
length needed to remove water and organic solvent from the coated ink. The conventional spraying approach
typically uses solids loadings of 0.1-0.3 wt% to avoid nozzle clogging, but the AMO R2R Collaboration is
attempting to increase this level by two orders of magnitude for slot-die and gravure coating. Certain
challenges that arise when increasing the solids loading are re-optimization of the ink mixing protocol and
preventing agglomeration of ionomer and secondary catalyst particles. High-shear mixing and adjustment of
the formulation chemistry through surfactant addition or solvent composition modification may be necessary
to implement these much higher ink solids loadings.
ORNL prepared slurries of 8, 10, and 12 wt% Pt/C particles for rheological measurements. The 12 wt% slurry
was not homogeneous, and the particles were agglomerated due to the high particle content. The viscosity and
the storage modulus of the 8 wt% and 10 wt% slurries as a function of the shear rate and angular frequency are
shown in Figures 23 (a) and (b), respectively. The 8 wt% slurry has lower viscosity and was easier to process.

31
Figure 23 Rheological properties of the slurries with 8 wt% and 10 wt% Pt/C content. Source: ORNL
GDEs were coated with the 8 wt% and 10 wt% slurry formulations and their surface structure and chemistry
were characterized. The coatings were applied using a doctor-blade technique. SEM images of the coating
cross-section with the 8 wt% formulation are shown in Figure 24. The catalyst coating layer can be clearly
seen on the surface of the GDE substrate. The thickness of the coating is approximately 25-50 µm. The
element map according to the EDS analysis is shown in Figure 25. The Pt/C particles are restricted on the
surface of the coating and did not diffuse into the GDE substrate.
Figure 24 SEM cross-section images of the GDE coated with 8 wt% slurry formulation at different magnifications. Source:
ORNL

32
Figure 25 The area where EDS measurements were taken and the element maps according to EDS analysis of the 8 wt%
coating on the GDE substrate. Source: ORNL
Optical microscope images of the coating’s surface for the 8 and 10wt% slurry formulations are shown in Figure
26. For comparison, the images were obtained under the same magnification. Streaks were formed on the surface
of both coatings during the drying process. However, the streaks are less pronounced in the 8 wt% coating.
Figure 26 Optical microscope images of the coatings based on (a) and (b) for the 8 wt% and (c) and (d) 10 wt%
formulations. Source: ORNL
The thicknesses of the coatings were also measured using confocal microscope techniques. The measured
thicknesses of both coatings were approximately 25-50 µm which is in good agreement with the SEM cross-section measurements. Representative images of the surface profile according to the optical microscope are
shown in Figure 27.
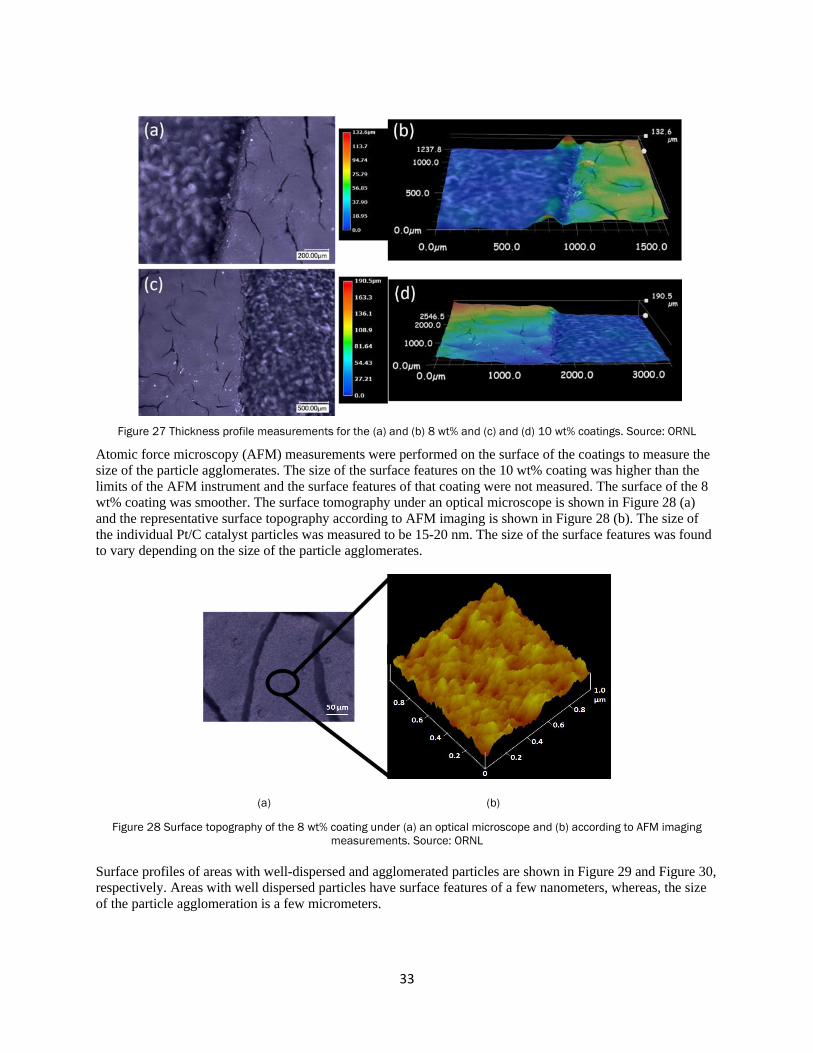
33
Figure 27 Thickness profile measurements for the (a) and (b) 8 wt% and (c) and (d) 10 wt% coatings. Source: ORNL
Atomic force microscopy (AFM) measurements were performed on the surface of the coatings to measure the
size of the particle agglomerates. The size of the surface features on the 10 wt% coating was higher than the
limits of the AFM instrument and the surface features of that coating were not measured. The surface of the 8
wt% coating was smoother. The surface tomography under an optical microscope is shown in Figure 28 (a)
and the representative surface topography according to AFM imaging is shown in Figure 28 (b). The size of
the individual Pt/C catalyst particles was measured to be 15-20 nm. The size of the surface features was found
to vary depending on the size of the particle agglomerates.
(a) (b)
Figure 28 Surface topography of the 8 wt% coating under (a) an optical microscope and (b) according to AFM imaging
measurements. Source: ORNL
Surface profiles of areas with well-dispersed and agglomerated particles are shown in Figure 29 and Figure 30,
respectively. Areas with well dispersed particles have surface features of a few nanometers, whereas, the size
of the particle agglomeration is a few micrometers.

34
Figure 29 AFM surface profile of an area with well dispersed particles on the surface of the 8 wt% coating. Source: ORNL
Figure 30 AFM surface profile of an area with particle agglomeration on the surface of the 8 wt% coating. Source: ORNL
A 6 wt% slurry was also used to coat a GDE. The slurry was dilute and diffused through the GDE layer. The 8
wt% slurry was found to give the best results. The formulation was scaled and was used to coat several feet of
GDE with a slot-die technique.

35
The 8 wt% slurry with a 12.16 wt% total solid content was scaled and used to coat a GDE with a slot-die
technique. SEM images of the coated GDE are shown in Figure 31. Micrometer size cracks were formed on
the surface of the coating during the drying process.
Figure 31 SEM images at different magnifications of the coated GDE using a slot-die technique. Source: ORNL
The thickness of the coating was measured using SEM imaging on the cross-section of the coating as shown in
Figure 32. The thickness of the coating was approximately 20 µm which was comparable to the thickness of
the coating using a doctor-blade technique. The EDS element map of the cross-section is shown in Figure 33.
The Pt/C particles did not diffuse in the GDE; however, Pt was detected only on the top (coated) surface of the
GDE.
Figure 32 SEM cross-section image of the slot-die coated GDE. Source: ONRL
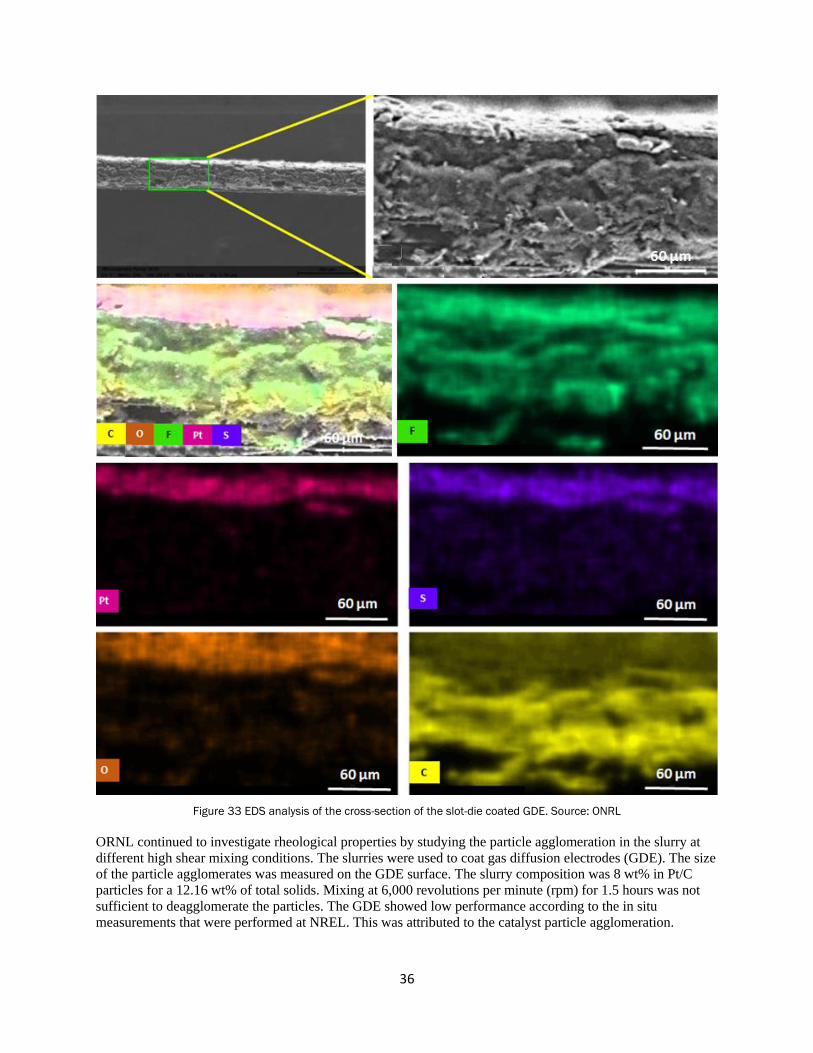
36
Figure 33 EDS analysis of the cross-section of the slot-die coated GDE. Source: ONRL
ORNL continued to investigate rheological properties by studying the particle agglomeration in the slurry at
different high shear mixing conditions. The slurries were used to coat gas diffusion electrodes (GDE). The size
of the particle agglomerates was measured on the GDE surface. The slurry composition was 8 wt% in Pt/C
particles for a 12.16 wt% of total solids. Mixing at 6,000 revolutions per minute (rpm) for 1.5 hours was not
sufficient to deagglomerate the particles. The GDE showed low performance according to the in situ
measurements that were performed at NREL. This was attributed to the catalyst particle agglomeration.

37
The high shear mixing speed was increased to 10,000 rpm and slurries were prepared at different mixing times
of 15, 30 and 60 minutes. The slurry composition consisted of 8 g of Pt/C, 56.25 g of deionized water, 19.16 g
of Nafion D2020 solution, and 16.59 g of 1-propanol. A doctor blade was used to cast the slurries on the gas
diffusion layer. The slurries were dried overnight at room temperature and the resulting coated GDEs are
shown in Figure 34. SEM images of the GDE top surface at several magnifications are shown in Figure 35 for
the slurry prepared at the mixing conditions of 15 minutes at 10,000 rpm. The size of the particle agglomerates
varies from 15 to 80 micrometers.
Figure 34 GDEs (4.5 inches x 2.5 inches) coated with slurries prepared at different mixing times. Source: ORNL

38
Figure 35 SEM images of the coated GDE for the slurry mixed for 15 min at 10,000 rpm. Source: ORNL
EDS element maps for the are shown in Figure 36 (a) and the element distribution on the GDE surface is
uniform according to the EDS analysis shown in Figure 36 (b).
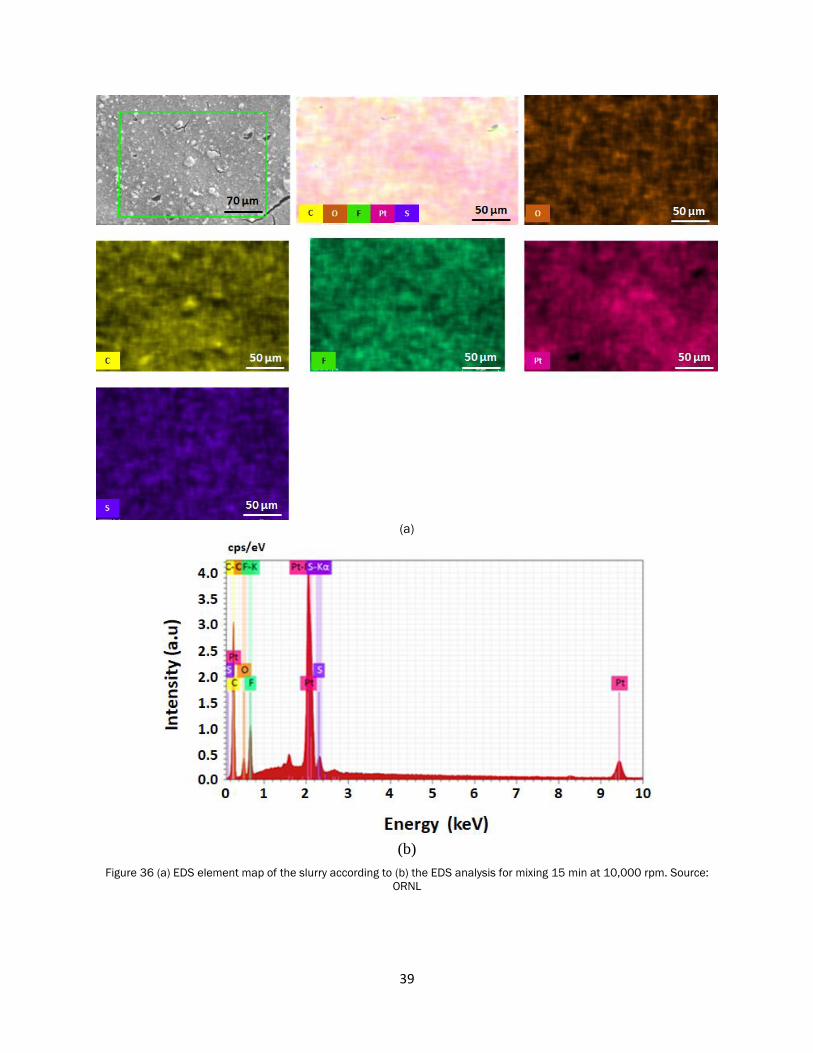
39
(a)
(b)
Figure 36 (a) EDS element map of the slurry according to (b) the EDS analysis for mixing 15 min at 10,000 rpm. Source:
ORNL

40
SEM images of the GDE surface at several magnifications are shown in Figure 37 for the slurry prepared at the
mixing conditions of 30 minutes at 10,000 rpm. The size of the particle agglomerates varies from 12 to 25
micrometers.

41
Figure 37 SEM images for the coated GDE slurry mixed for 30 min at 10,000 rpm. Source: ORNL
SEM images of the GDE surface at several magnifications are shown in Figure 38 for the slurry prepared at the
mixing conditions of 60 minutes at 10,000 rpm. The size of the particle agglomerates varies from 25 to 50
micrometers.

42
Figure 38 SEM images for the coated GDE slurry mixed for 60 min at 10,000 rpm. Source: ORNL
The mixing for 30 min at 10,000 rpm resulted in smaller size agglomerates. To further reduce the agglomerate
size, a more dilute slurry must be synthesized and tested.
ORNL collaborated with NREL and fabricated a GDE with lower Pt loading. The target value was
approximately 0.1 mg/cm2. To achieve the target value, the slot-die coating parameters were modified. The
slurry formulation and coating conditions were as follows for an 8% Pt/C slurry:
Pt/C: 32 g
Nafion: 76.64 g ᵙ solids content = 76.64 g x 0.217 = 16.63 g
Water: 225 g
1-propanol: 66.36 g
Total Weight ᵙ 400 g
Total solid content: Pt/C + solid Nafion = 32 + 16.66 = 48.63 g
% of solid content = 48.63/400 = 12.16%
Preparation: Shear mixed by using a small shear mixture in ORNL dry room for 1.5 hours at 6000 rpm
Slot-die coating conditions:
Pump speed (small pump cart) = 20 rpm
Dynacoat line speed: 3ft/min
0.584 mg-coating/cm2 = 0.179 mg-Pt/cm2
The Pt loading using this formulation was 0.179 mg/cm2 which is very close to the target value. The fabricated
GDE was sent to NREL for electrochemical measurements.
SEM images of the GDE cross-section for the GDE with a Pt loading of 0.179 mg/cm2 are shown in Figure 39
for different magnifications. The catalyst coating is uniform, and the thickness is 7 to 10 micrometers. The
thinner coating resulted in significant lower Pt loading compared to the coating that was prepared earlier (20
micrometers with 0.554 mg-Pt/cm2).

43

44
Figure 39 SEM cross section images of the GDE with a Pt loading of 0.179 mg/cm2. Source: ORNL
The EDS element analysis of the GDE cross-section is shown in Figure 40. The Pt is mainly in the top coated
layer indicating that the Pt/C particles are restricted in the top layer and did not diffuse in the GDE.
Figure 40 EDS element analysis of GDE cross section with a Pt loading of 0.179 mg/cm2. Source: ORNL
SEM images of the coated top surface of the GDE at different magnifications are shown in Figure 41. The
particle agglomeration is significant. Electrochemical measurements on the GDE were performed at NREL.
The performance was limited by the reduced Pt/C surface area due to the particle agglomeration. To address
this issue, ORNL investigated the particle aggregation at different high shear mixing conditions.

45
Figure 41 SEM images of the coated GDE showing pronounced particle agglomeration. Source: ORNL
R2R ES Platform Development Support
LLZO nanofibers were electrospun using the experimental setup in Figure 42. LLZO precursors in a
stoichiometric ratio were dissolved in aqueous and non-aqueous polymer solutions.
Figure 42 Schematic illustration of the experimental setup used for the nanofiber ES. Source: ORNL.
The recipes that were used for the nanofiber synthesis are described below.
Recipe 1. Fiber synthesis using water and acetic acid
In this recipe, water and acetic acid were used as solvents. No organic solvent such as DMF was employed. A
solution was made by dissolving 0.465 g zirconium nitrate, 0.535 g lithium nitrate, and 1.29 g of lanthanum
nitrate in 25 mL water. The reactants were mixed overnight, and this solution was named as SOLUTION 1.
Then, 1.5 g of polyvinylpyrrolidone (PVP; MW: 1,300,000) was dissolved in 8.5 mL of acetic acid using
magnetic stirring overnight, and this solution was named as SOLUTION 2. Equal volumetric amounts of
SOLUTION 1 and SOLUTION 2 were mixed for 12 hours before ES (feed rate: 0.16 mL/hour, voltage: 18 kV;
distance: 13 cm) on an inhouse ES instrument. The SEM image in Figure 45 shows thin and uniform
nanofibers with a diameter 50 to 100 nm.
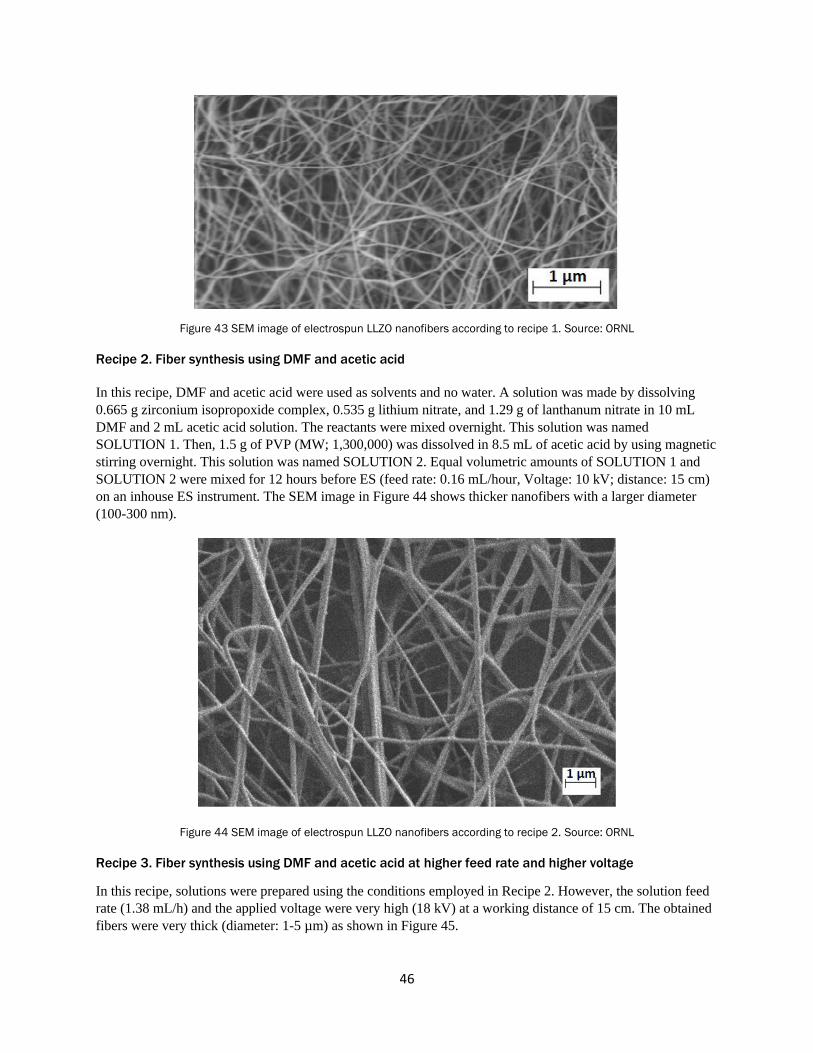
46
Figure 43 SEM image of electrospun LLZO nanofibers according to recipe 1. Source: ORNL
Recipe 2. Fiber synthesis using DMF and acetic acid
In this recipe, DMF and acetic acid were used as solvents and no water. A solution was made by dissolving
0.665 g zirconium isopropoxide complex, 0.535 g lithium nitrate, and 1.29 g of lanthanum nitrate in 10 mL
DMF and 2 mL acetic acid solution. The reactants were mixed overnight. This solution was named
SOLUTION 1. Then, 1.5 g of PVP (MW; 1,300,000) was dissolved in 8.5 mL of acetic acid by using magnetic
stirring overnight. This solution was named SOLUTION 2. Equal volumetric amounts of SOLUTION 1 and
SOLUTION 2 were mixed for 12 hours before ES (feed rate: 0.16 mL/hour, Voltage: 10 kV; distance: 15 cm)
on an inhouse ES instrument. The SEM image in Figure 44 shows thicker nanofibers with a larger diameter
(100-300 nm).
Figure 44 SEM image of electrospun LLZO nanofibers according to recipe 2. Source: ORNL
Recipe 3. Fiber synthesis using DMF and acetic acid at higher feed rate and higher voltage
In this recipe, solutions were prepared using the conditions employed in Recipe 2. However, the solution feed
rate (1.38 mL/h) and the applied voltage were very high (18 kV) at a working distance of 15 cm. The obtained
fibers were very thick (diameter: 1-5 µm) as shown in Figure 45.
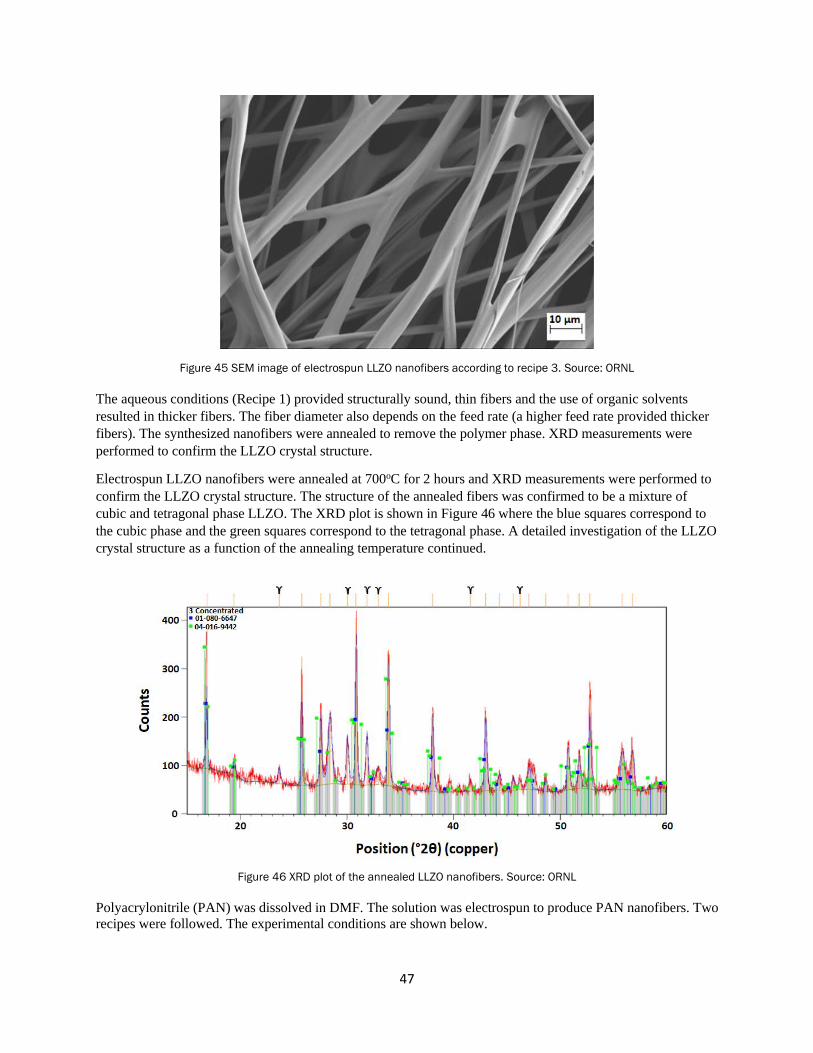
47
Figure 45 SEM image of electrospun LLZO nanofibers according to recipe 3. Source: ORNL
The aqueous conditions (Recipe 1) provided structurally sound, thin fibers and the use of organic solvents
resulted in thicker fibers. The fiber diameter also depends on the feed rate (a higher feed rate provided thicker
fibers). The synthesized nanofibers were annealed to remove the polymer phase. XRD measurements were
performed to confirm the LLZO crystal structure.
Electrospun LLZO nanofibers were annealed at 700oC for 2 hours and XRD measurements were performed to
confirm the LLZO crystal structure. The structure of the annealed fibers was confirmed to be a mixture of
cubic and tetragonal phase LLZO. The XRD plot is shown in Figure 46 where the blue squares correspond to
the cubic phase and the green squares correspond to the tetragonal phase. A detailed investigation of the LLZO
crystal structure as a function of the annealing temperature continued.
Figure 46 XRD plot of the annealed LLZO nanofibers. Source: ORNL
Polyacrylonitrile (PAN) was dissolved in DMF. The solution was electrospun to produce PAN nanofibers. Two
recipes were followed. The experimental conditions are shown below.

48
Recipe 1:
PAN MW 150,000 was dissolved in DMF (10 wt% solution)
ES conditions: Needle diameter: 0.6 mm, rate 1.0 ml/h, distance: 12 cm, voltage: 18 kV
Recipe 2:
PAN MW 150,000 was dissolved in DMF (7 wt% solution)
ES conditions: Needle diameter: 0.6 mm, rate 0.5 ml/h, distance: 12 cm, voltage: 18 kV
SEM images of the PAN nanofibers are shown in Figure 47 and Figure 48. The fibers produced with the
second recipe were thinner and their diameter was approximately 400-500 nm. LLZO and PAN was co-spun at
different coaxial configurations and the coaxial fibers were annealed to produce carbon-fiber/LLZO composite
and flexible nanofibers.
(a)
(b)
Figure 47 (a) Electrospun PAN fibers from Recipe 1 and (b) 10X magnification. Source: ORNL

49
(a)
(b)
Figure 48 (a) Electrospun PAN fibers according to recipe 2 and (b) at 20x magnification. Source: ORNL
ORNL synthesized PAN nanofibers using ES techniques. The PAN nanofibers were carbonized and converted
them into carbon nanofibers. The final objective is to synthesize hybrid carbon nanofibers with LLZO. The
LLZO nanofibers are very brittle and, therefore, it is difficult to synthesize and scale flexible LLZO nanofiber
substrates. The carbon nanofibers can potentially provide a flexible and electrically conductive substrate (mat)
that can host the brittle LLZO phase. The experimental setup that was developed by ORNL to carbonize the
PAN fibers is shown in Figure 49. Air and argon gas can flow through the tube furnace at controlled flow
rates. The annealing temperature and the heating rate can also be controlled. The setup was in a fume hood.

50
Carbon nanofibers were synthesized in a two-step process (stabilization and carbonization). The experimental
parameters are as follows:
• PAN stabilization at 280 oC for 3h (air flow 2 L/min, rate 5 oC/min)
• Carbonization at 700 oC for 1 h and 1100 oC for 1h (argon flow 2 L/min, rate 20 oC/min)
Figure 49 Carbonization setup that was used to carbonize the PAN fibers. Source: ORNL
The synthesized carbon nanofibers are shown in the SEM images in Figure 50. Their thickness is 200-300 nm.
The carbon nanofiber mat is flexible and conductive. The two-point resistance is approximately 30 Ohms.
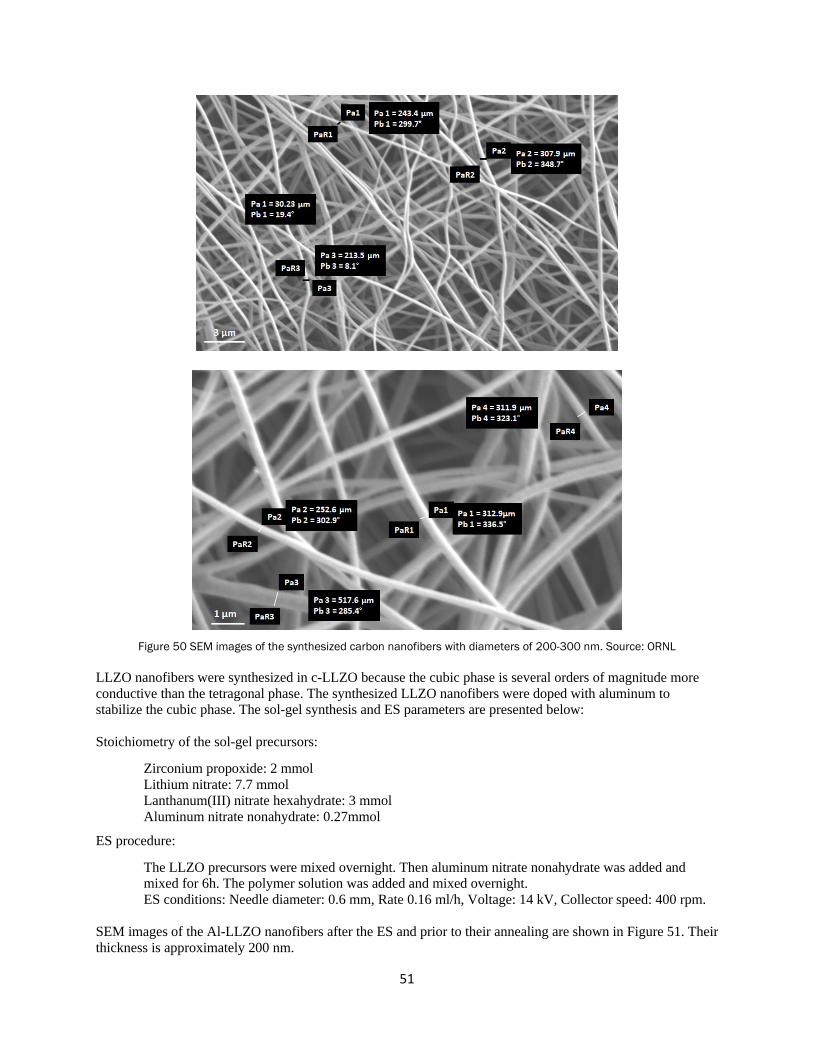
51
Figure 50 SEM images of the synthesized carbon nanofibers with diameters of 200-300 nm. Source: ORNL
LLZO nanofibers were synthesized in c-LLZO because the cubic phase is several orders of magnitude more
conductive than the tetragonal phase. The synthesized LLZO nanofibers were doped with aluminum to
stabilize the cubic phase. The sol-gel synthesis and ES parameters are presented below:
Stoichiometry of the sol-gel precursors:
Zirconium propoxide: 2 mmol
Lithium nitrate: 7.7 mmol
Lanthanum(III) nitrate hexahydrate: 3 mmol
Aluminum nitrate nonahydrate: 0.27mmol
ES procedure:
The LLZO precursors were mixed overnight. Then aluminum nitrate nonahydrate was added and
mixed for 6h. The polymer solution was added and mixed overnight.
ES conditions: Needle diameter: 0.6 mm, Rate 0.16 ml/h, Voltage: 14 kV, Collector speed: 400 rpm.
SEM images of the Al-LLZO nanofibers after the ES and prior to their annealing are shown in Figure 51. Their
thickness is approximately 200 nm.
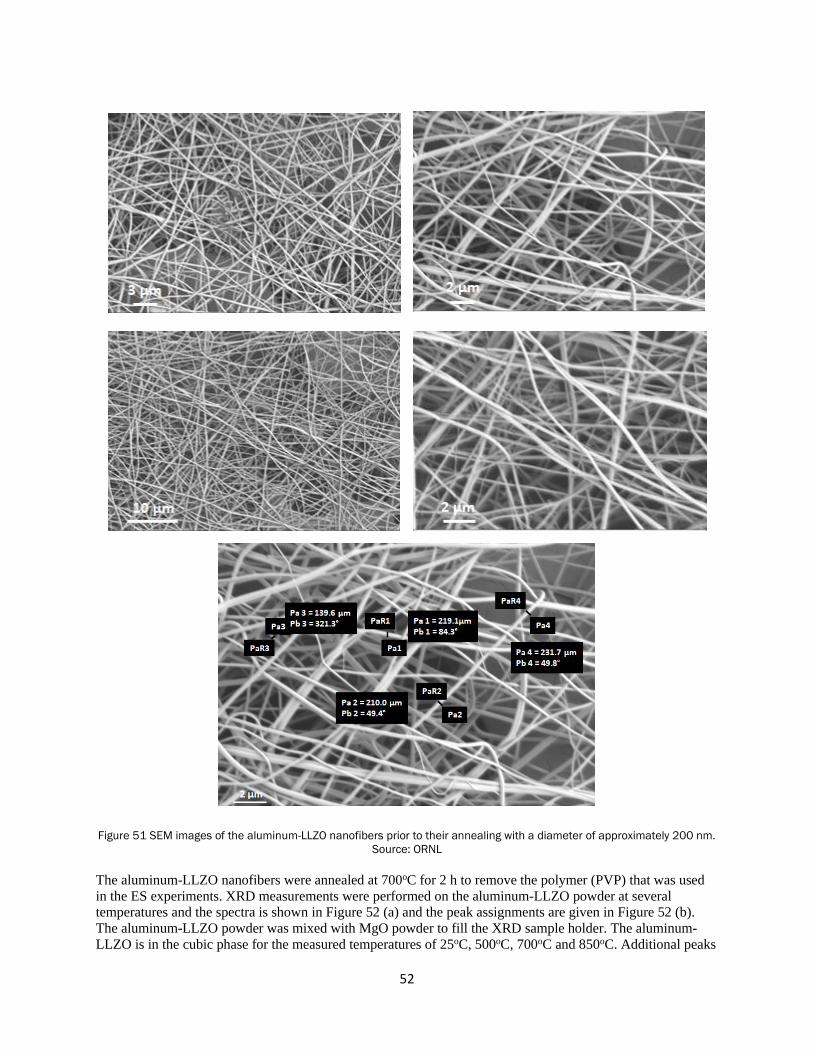
52
Figure 51 SEM images of the aluminum-LLZO nanofibers prior to their annealing with a diameter of approximately 200 nm.
Source: ORNL
The aluminum-LLZO nanofibers were annealed at 700oC for 2 h to remove the polymer (PVP) that was used
in the ES experiments. XRD measurements were performed on the aluminum-LLZO powder at several
temperatures and the spectra is shown in Figure 52 (a) and the peak assignments are given in Figure 52 (b).
The aluminum-LLZO powder was mixed with MgO powder to fill the XRD sample holder. The aluminum-
LLZO is in the cubic phase for the measured temperatures of 25oC, 500oC, 700oC and 850oC. Additional peaks

53
due to impurities or unreacted materials are also present in the spectra. The spectra at different temperatures
are overlapped to determine if there are any phase changes. The overlapped spectra are identical. The cubic
phase is stable at the measured temperatures.
(a)
(b)
Figure 52 (a) XRD of the aluminum-LLZO powder mixed with MgO powder at several temperatures. (b) Peak assignment
where the blue vertical lines correspond to the c-LLZO phase and the green vertical lines correspond to the MgO peaks.
Source: ORNL
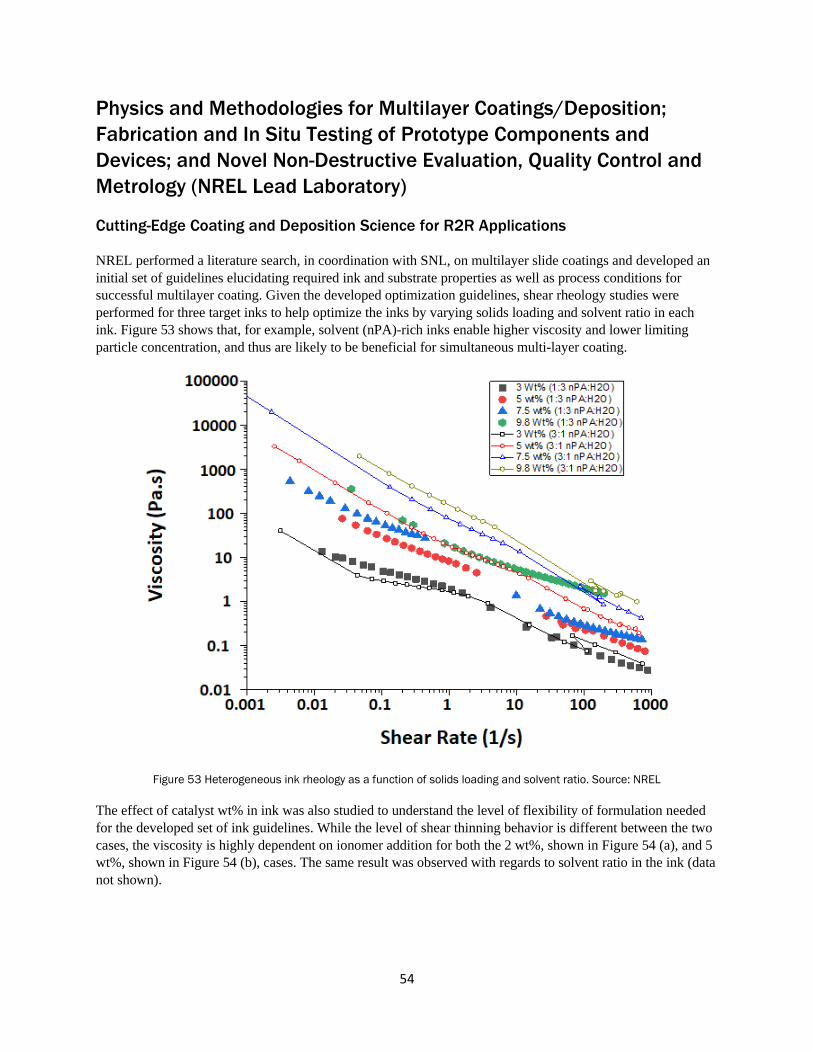
54
Physics and Methodologies for Multilayer Coatings/Deposition;
Fabrication and In Situ Testing of Prototype Components and
Devices; and Novel Non-Destructive Evaluation, Quality Control and
Metrology (NREL Lead Laboratory)
Cutting-Edge Coating and Deposition Science for R2R Applications
NREL performed a literature search, in coordination with SNL, on multilayer slide coatings and developed an
initial set of guidelines elucidating required ink and substrate properties as well as process conditions for
successful multilayer coating. Given the developed optimization guidelines, shear rheology studies were
performed for three target inks to help optimize the inks by varying solids loading and solvent ratio in each
ink. Figure 53 shows that, for example, solvent (nPA)-rich inks enable higher viscosity and lower limiting
particle concentration, and thus are likely to be beneficial for simultaneous multi-layer coating.
Figure 53 Heterogeneous ink rheology as a function of solids loading and solvent ratio. Source: NREL
The effect of catalyst wt% in ink was also studied to understand the level of flexibility of formulation needed
for the developed set of ink guidelines. While the level of shear thinning behavior is different between the two
cases, the viscosity is highly dependent on ionomer addition for both the 2 wt%, shown in Figure 54 (a), and 5
wt%, shown in Figure 54 (b), cases. The same result was observed with regards to solvent ratio in the ink (data
not shown).
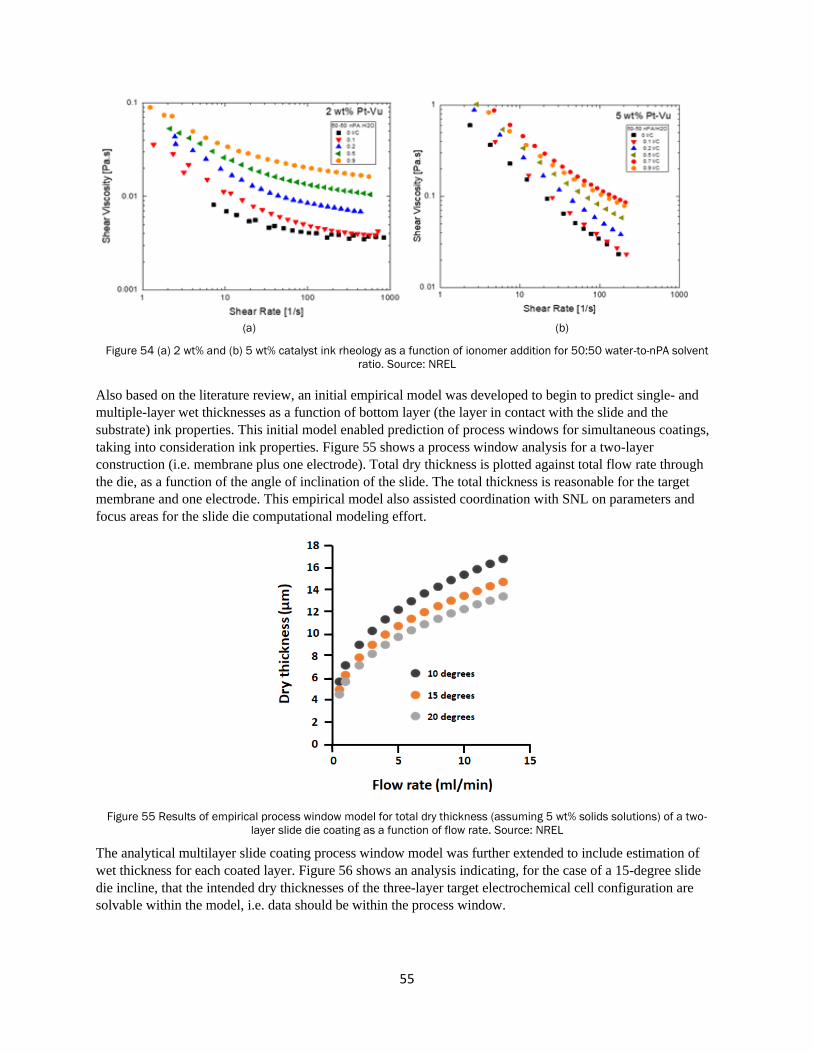
55
(a) (b)
Figure 54 (a) 2 wt% and (b) 5 wt% catalyst ink rheology as a function of ionomer addition for 50:50 water-to-nPA solvent
ratio. Source: NREL
Also based on the literature review, an initial empirical model was developed to begin to predict single- and
multiple-layer wet thicknesses as a function of bottom layer (the layer in contact with the slide and the
substrate) ink properties. This initial model enabled prediction of process windows for simultaneous coatings,
taking into consideration ink properties. Figure 55 shows a process window analysis for a two-layer
construction (i.e. membrane plus one electrode). Total dry thickness is plotted against total flow rate through
the die, as a function of the angle of inclination of the slide. The total thickness is reasonable for the target
membrane and one electrode. This empirical model also assisted coordination with SNL on parameters and
focus areas for the slide die computational modeling effort.
Figure 55 Results of empirical process window model for total dry thickness (assuming 5 wt% solids solutions) of a two-
layer slide die coating as a function of flow rate. Source: NREL
The analytical multilayer slide coating process window model was further extended to include estimation of
wet thickness for each coated layer. Figure 56 shows an analysis indicating, for the case of a 15-degree slide
die incline, that the intended dry thicknesses of the three-layer target electrochemical cell configuration are
solvable within the model, i.e. data should be within the process window.
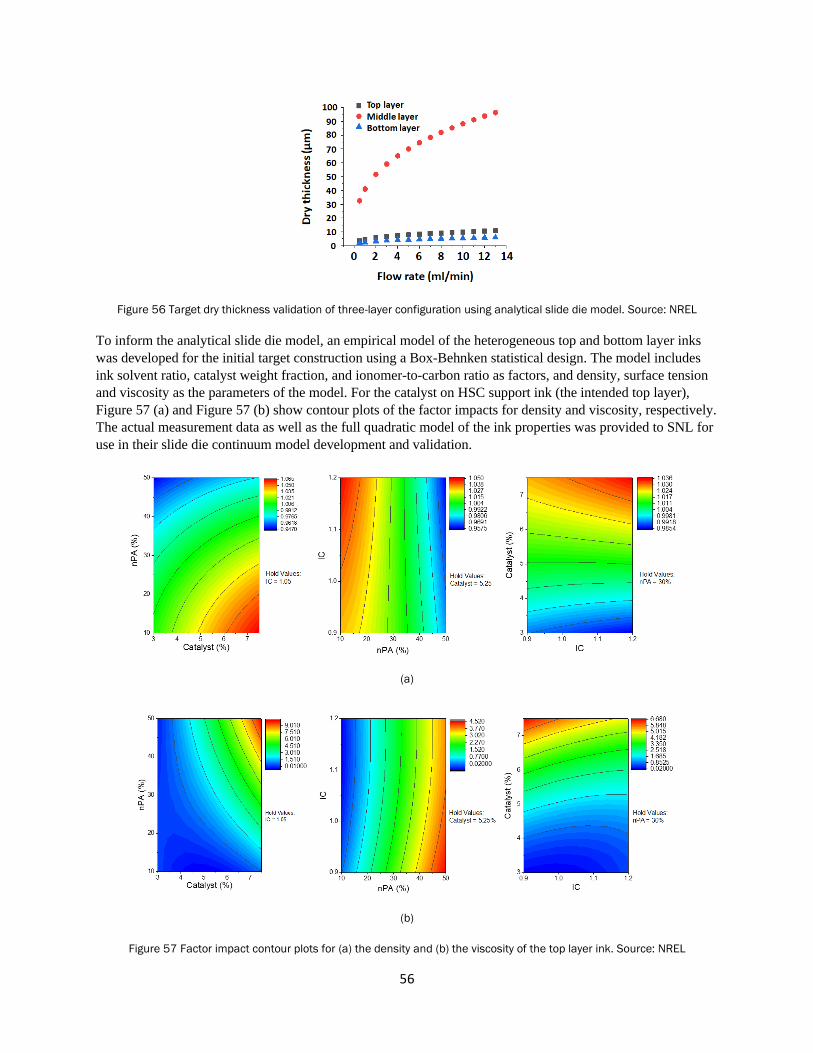
56
Figure 56 Target dry thickness validation of three-layer configuration using analytical slide die model. Source: NREL
To inform the analytical slide die model, an empirical model of the heterogeneous top and bottom layer inks
was developed for the initial target construction using a Box-Behnken statistical design. The model includes
ink solvent ratio, catalyst weight fraction, and ionomer-to-carbon ratio as factors, and density, surface tension
and viscosity as the parameters of the model. For the catalyst on HSC support ink (the intended top layer),
Figure 57 (a) and Figure 57 (b) show contour plots of the factor impacts for density and viscosity, respectively.
The actual measurement data as well as the full quadratic model of the ink properties was provided to SNL for
use in their slide die continuum model development and validation.
(a)
(b)
Figure 57 Factor impact contour plots for (a) the density and (b) the viscosity of the top layer ink. Source: NREL

57
NREL also completed the empirical full-quadratic model for our target Pt/low-surface-area-carbon support
(LSC) inks, based on a Box-Behnken design, and provided the model to SNL for further predictive modeling
of our 2L and 3L slide die target structures. Figure 58 shows Pt/LSC quadratic model outputs for ink density,
surface tension, and viscosity at shear rates of 1/s and 100/s.
(a)
(b)

58
(c)
(d)
Figure 58 Pt/LSC quadratic model outputs for (a) ink density, (b) viscosity at shear rates of 1/s, (c) surface tension and (d)
viscosity at shear rates of 100/s. Source: NREL
NREL performed blade coatings of single-layer membranes to support the initial target multi-layer coating
construction (three-layer: electrode-membrane-electrode). The objective was to understand the efficacy of
coated ionomer layers with respect to membrane functionality, in particular (initially), proton conductivity.
Figure 59 (a) shows the estimated and measured dry thickness of the coated membranes as a function of the
coating gap and the resulting proton conductivity for Nafion 211 and four test samples in Figure 59 (b). The
thicknesses are within the intended range for several electrochemical applications. The conductivities of the
cast membranes are within a reasonable range of the commercially available comparator case (Nafion).

59
(a) (b)
Figure 59 (a) Cast membrane thickness as a function of coating gap and (b) proton conductivity of the cast membranes
compared to a commercially available membrane. Source: NREL
To support the understanding of the potential implication of simultaneous two- and three-layer coatings on the
performance of the target electrochemical cell construction, multilayer structures were simulated using
ultrasonic spray coating. As described above, these are combinations of heterogeneous particle-polymer layers
and polymer-only layers, as depicted in Figure 60 (a) for the intended 3-layer and two permutations of 2-layer
structures, and in Figure 60 (b) the standard individual-layer constructions. Both two- and three-layer
simulated multilayer structures were sprayed; however, issues with uniform spraying of the membrane (D2020
ionomer) layer were encountered, but were resolved, and in situ testing of the simulated multilayer structures
was initiated.
(a)
(b)
Figure 60 (a) Simulated multilayer structures via ultrasonic spray and (b) standard individual-layer structures. Source: NREL
In further preparation for initial slide die startup as well as broad application-agnostic process window studies,
NREL initiated the formulation of “dummy inks” with widely tunable properties. Figures 61 (a) and (b) show
that, with either carbon-only inks or polyethylene oxide (PEO) inks respectively, we can reasonably well
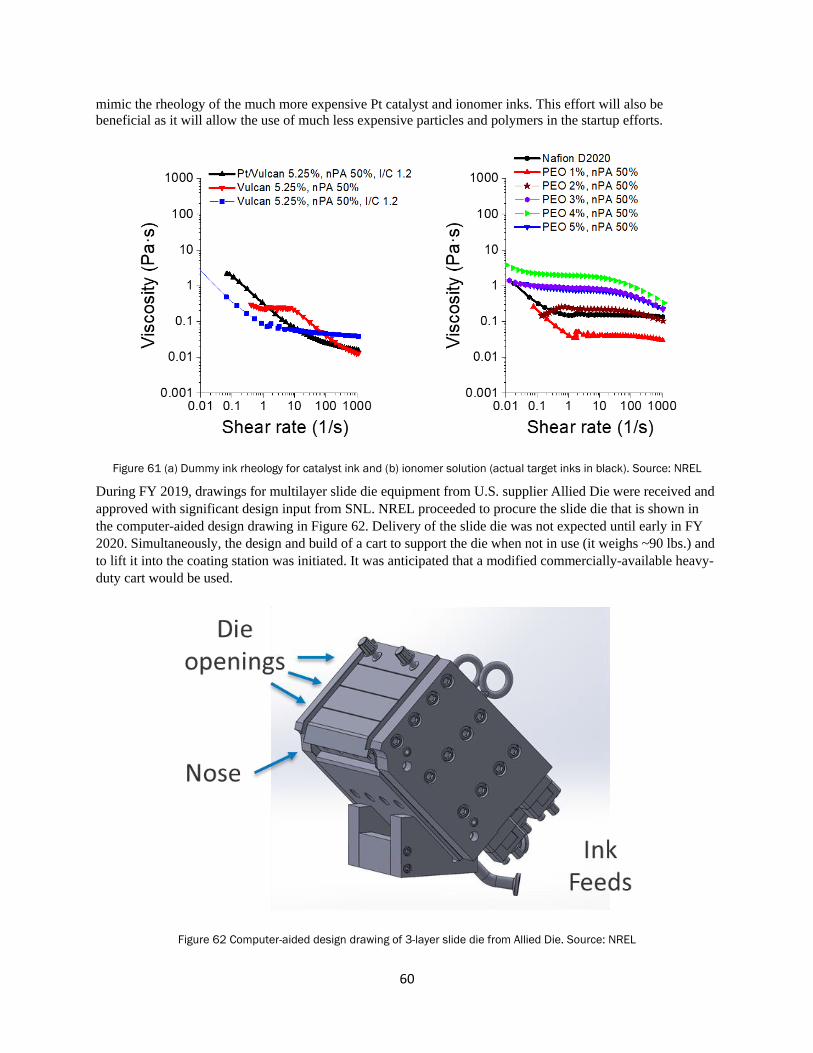
60
mimic the rheology of the much more expensive Pt catalyst and ionomer inks. This effort will also be
beneficial as it will allow the use of much less expensive particles and polymers in the startup efforts.
Figure 61 (a) Dummy ink rheology for catalyst ink and (b) ionomer solution (actual target inks in black). Source: NREL
During FY 2019, drawings for multilayer slide die equipment from U.S. supplier Allied Die were received and
approved with significant design input from SNL. NREL proceeded to procure the slide die that is shown in
the computer-aided design drawing in Figure 62. Delivery of the slide die was not expected until early in FY
2020. Simultaneously, the design and build of a cart to support the die when not in use (it weighs ~90 lbs.) and
to lift it into the coating station was initiated. It was anticipated that a modified commercially-available heavy-
duty cart would be used.
Figure 62 Computer-aided design drawing of 3-layer slide die from Allied Die. Source: NREL
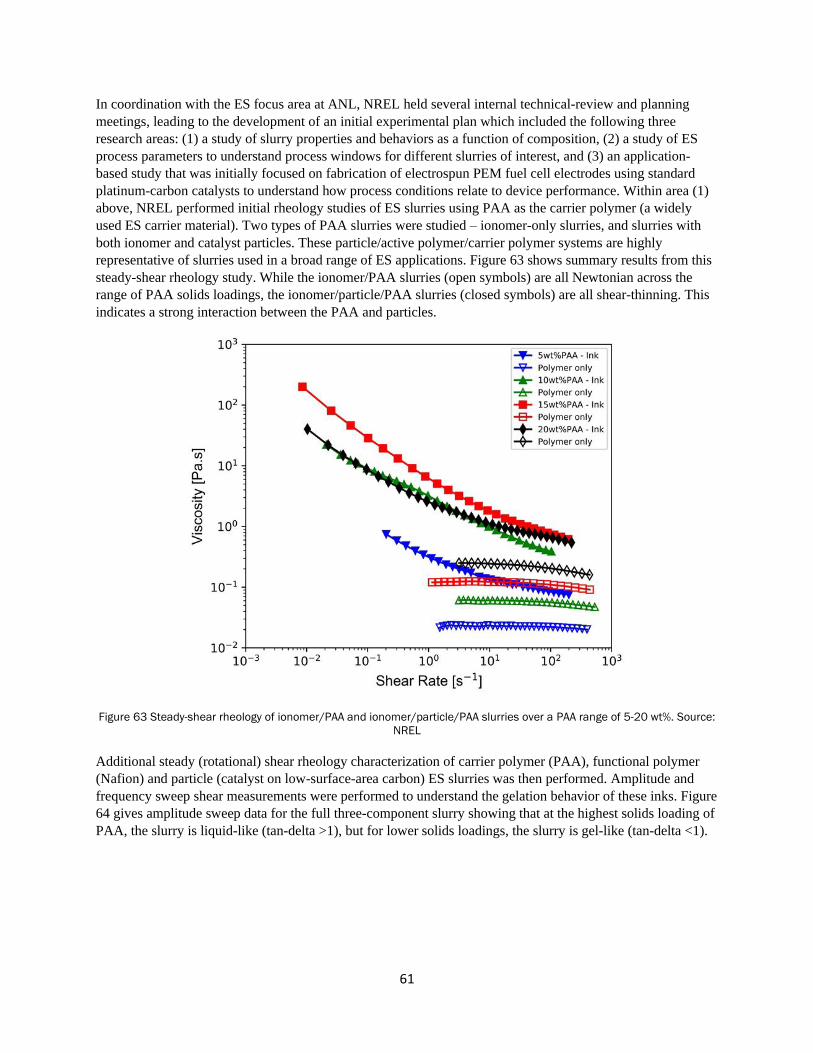
61
In coordination with the ES focus area at ANL, NREL held several internal technical-review and planning
meetings, leading to the development of an initial experimental plan which included the following three
research areas: (1) a study of slurry properties and behaviors as a function of composition, (2) a study of ES
process parameters to understand process windows for different slurries of interest, and (3) an application-
based study that was initially focused on fabrication of electrospun PEM fuel cell electrodes using standard
platinum-carbon catalysts to understand how process conditions relate to device performance. Within area (1)
above, NREL performed initial rheology studies of ES slurries using PAA as the carrier polymer (a widely
used ES carrier material). Two types of PAA slurries were studied – ionomer-only slurries, and slurries with
both ionomer and catalyst particles. These particle/active polymer/carrier polymer systems are highly
representative of slurries used in a broad range of ES applications. Figure 63 shows summary results from this
steady-shear rheology study. While the ionomer/PAA slurries (open symbols) are all Newtonian across the
range of PAA solids loadings, the ionomer/particle/PAA slurries (closed symbols) are all shear-thinning. This
indicates a strong interaction between the PAA and particles.
Figure 63 Steady-shear rheology of ionomer/PAA and ionomer/particle/PAA slurries over a PAA range of 5-20 wt%. Source:
NREL
Additional steady (rotational) shear rheology characterization of carrier polymer (PAA), functional polymer
(Nafion) and particle (catalyst on low-surface-area carbon) ES slurries was then performed. Amplitude and
frequency sweep shear measurements were performed to understand the gelation behavior of these inks. Figure
64 gives amplitude sweep data for the full three-component slurry showing that at the highest solids loading of
PAA, the slurry is liquid-like (tan-delta >1), but for lower solids loadings, the slurry is gel-like (tan-delta <1).

62
Figure 64 Amplitude sweep shear rheology data for carrier-ionomer-particle slurries as a function of carrier (PAA) solids
loading from 5-20 wt%. Source: NREL
Leveraging NREL’s collaboration with University of Massachusetts Amherst, extensional rheology was
performed using the DoS-CaBER method, which is highly indicative of ES process physics. Figure 65 shows a
comparison between extensional and shear rheology data for carrier-ionomer and carrier-ionomer-particle
slurries. Of specific note is that the extensional viscosity data in Figure 65 (a) is much higher magnitude than
the high-shear-rate shear viscosity data (right side of Figure 65 (b)) indicating the value of the extensional
rheology in providing unique, process-relevant data for these slurries. The actual viscosity of the slurries is
much higher during the spinning process than would be indicated by the high-shear region of the shear
rheology data.
(a) (b)
Figure 65 (a) Extensional viscosity and (b) shear viscosity data for carrier-ionomer and carrier-ionomer-particle slurries.
Source: NREL
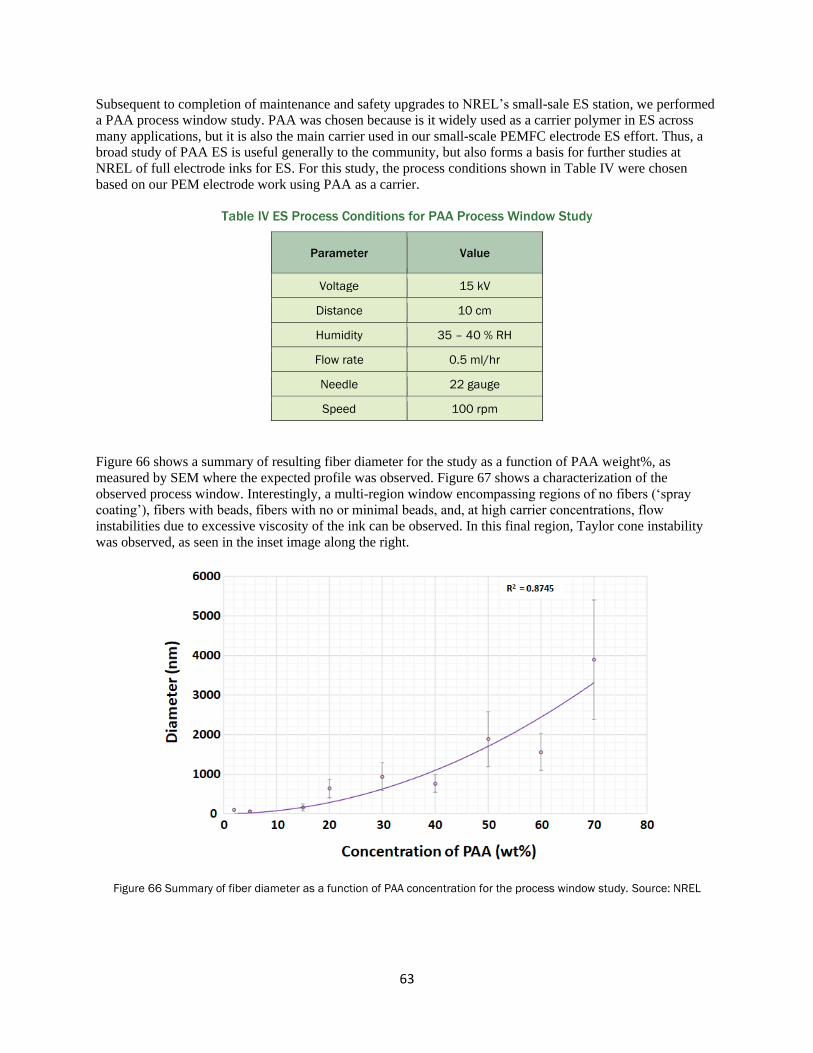
63
Subsequent to completion of maintenance and safety upgrades to NREL’s small-sale ES station, we performed
a PAA process window study. PAA was chosen because is it widely used as a carrier polymer in ES across
many applications, but it is also the main carrier used in our small-scale PEMFC electrode ES effort. Thus, a
broad study of PAA ES is useful generally to the community, but also forms a basis for further studies at
NREL of full electrode inks for ES. For this study, the process conditions shown in Table IV were chosen
based on our PEM electrode work using PAA as a carrier.
Table IV ES Process Conditions for PAA Process Window Study
Parameter Value
Voltage 15 kV
Distance 10 cm
Humidity 35 – 40 % RH
Flow rate 0.5 ml/hr
Needle 22 gauge
Speed 100 rpm
Figure 66 shows a summary of resulting fiber diameter for the study as a function of PAA weight%, as
measured by SEM where the expected profile was observed. Figure 67 shows a characterization of the
observed process window. Interestingly, a multi-region window encompassing regions of no fibers (‘spray
coating’), fibers with beads, fibers with no or minimal beads, and, at high carrier concentrations, flow
instabilities due to excessive viscosity of the ink can be observed. In this final region, Taylor cone instability
was observed, as seen in the inset image along the right.
Figure 66 Summary of fiber diameter as a function of PAA concentration for the process window study. Source: NREL

64
Figure 67 PAA spinning process window depiction; inset images show examples of droplets (no fibers), spinning mostly
beads, and spinning good fibers, as well as viscous instability of the Taylor cone at high PAA wt%. Source: NREL
In addition, and initial process window study was performed on a full electrode ink (PAA + ionomer + catalyst
particles). As depicted in Figure 68, sprayed droplets at 5 wt% PAA in the ink, spinning of fibers at 10 wt%
PAA although the fibers had poor strength and were not continuous, spinning of good fibers at 15 wt% PAA
with some beads (this is the standard condition for electrode spinning and testing) and larger fibers with more
beads at 20 wt% PAA with some fiber agglomeration can all be observed. Given the addition of particles and a
volume fraction of a polymer (the ionomer) that has much less propensity to entangle compared to the carrier
polymer, the narrowing of the process window (compared to the PAA only case) was expected.
Figure 68 Full PEM electrode ink process window depiction with SEM insets showing resulting materials. Source: NREL

65
Fabrication and In Situ Testing of Prototype Components and Devices
A study of spray-coated multilayer cell structures was initiated in hopes of understanding interfacial behaviors
relevant to our eventual multilayer slide die coated structures, as described above. Unfortunately, overall, poor
performance of cells fabricated with these structures was observed including low open circuit voltage (OCV)
and high hydrogen crossover. Based on surface microscopy, this may be due to poor uniformity of the sprayed
membrane layer. Figure 69 (a) shows the poor polarization performance of two of the multilayer sprayed cells
and Figure 69 (b) is an image from optical microscopy of the sprayed membrane.
(a)
(b)
Figure 69 (a) Polarization performance of two multilayer sprayed cells (for comparison, performance should be at least 0.8
A/cm2 at 0.6 volts) and (b) optical microscopy of the sprayed membrane layer. Source: NREL
However, a positive result was obtained. This was the confirmation of a new cell sealing methodology for
simultaneous-coated constructions that do not have a membrane surface area larger than the active (catalyst)
area for sealing, which is the typically used methodology. Figure 70 (a) shows an example of the typical cell
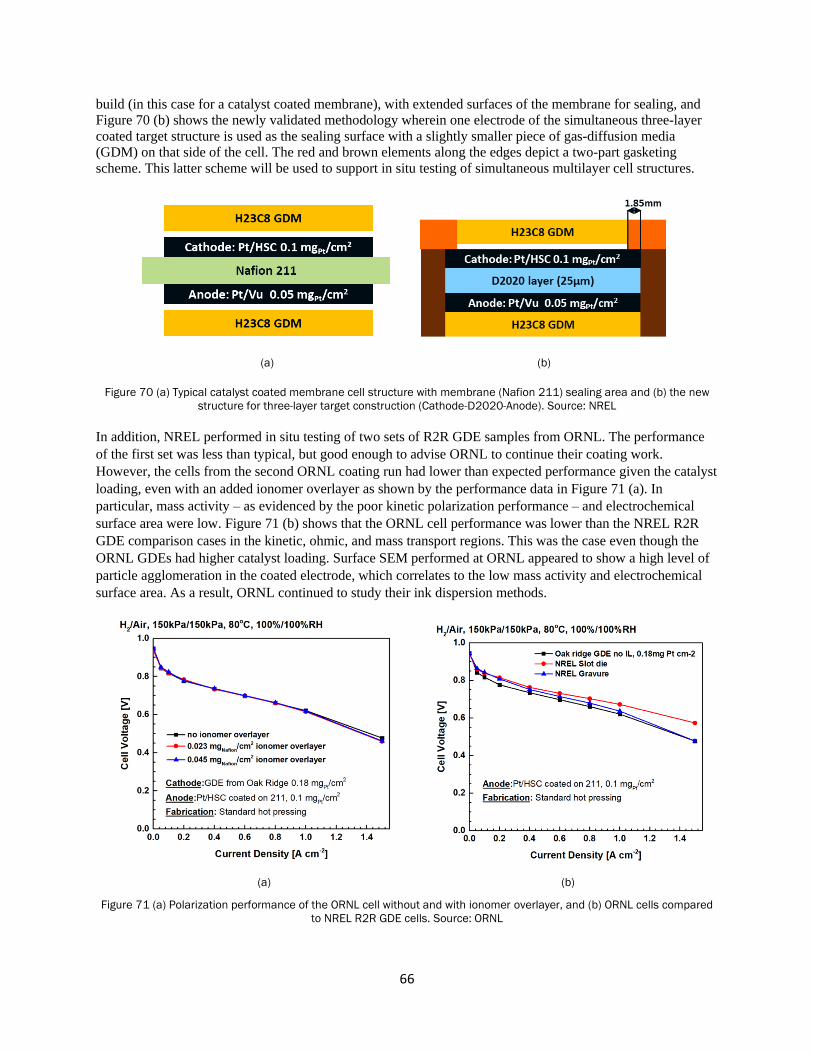
66
build (in this case for a catalyst coated membrane), with extended surfaces of the membrane for sealing, and
Figure 70 (b) shows the newly validated methodology wherein one electrode of the simultaneous three-layer
coated target structure is used as the sealing surface with a slightly smaller piece of gas-diffusion media
(GDM) on that side of the cell. The red and brown elements along the edges depict a two-part gasketing
scheme. This latter scheme will be used to support in situ testing of simultaneous multilayer cell structures.
(a) (b)
Figure 70 (a) Typical catalyst coated membrane cell structure with membrane (Nafion 211) sealing area and (b) the new
structure for three-layer target construction (Cathode-D2020-Anode). Source: NREL
In addition, NREL performed in situ testing of two sets of R2R GDE samples from ORNL. The performance
of the first set was less than typical, but good enough to advise ORNL to continue their coating work.
However, the cells from the second ORNL coating run had lower than expected performance given the catalyst
loading, even with an added ionomer overlayer as shown by the performance data in Figure 71 (a). In
particular, mass activity – as evidenced by the poor kinetic polarization performance – and electrochemical
surface area were low. Figure 71 (b) shows that the ORNL cell performance was lower than the NREL R2R
GDE comparison cases in the kinetic, ohmic, and mass transport regions. This was the case even though the
ORNL GDEs had higher catalyst loading. Surface SEM performed at ORNL appeared to show a high level of
particle agglomeration in the coated electrode, which correlates to the low mass activity and electrochemical
surface area. As a result, ORNL continued to study their ink dispersion methods.
(a) (b)
Figure 71 (a) Polarization performance of the ORNL cell without and with ionomer overlayer, and (b) ORNL cells compared
to NREL R2R GDE cells. Source: ORNL

67
Novel NDE, QC, and Metrology Methods
NREL performed several experiments to demonstrate real-time NDE technology applicable to multilayer
electrochemical cell materials that culminated in an experiment of many single- and multilayer membrane
webs on the NREL metrology web-line using multi-spectral imaging. These experiments included energy
conversion membranes as well as commercial barrier films. Multilayer constructions (e.g. constructions with a
protective layer, a functional layer, and a casting liner) were run at different line speeds and the thickness of
each layer was imaged in the cross- and down-web directions to start to understand the parameter impact of
speed on down-web resolution.
Associated with the development of in-line membrane thickness imaging techniques for multilayer films and in
collaboration with the NREL High Performance Computing group, NREL developed an algorithm that enabled
a processing time improvement of up to 165x (compared to the original software) of massive hyperspectral
cube videos. The technique leverages the parallel computing capabilities of graphics processing units (graphics
cards), rather than using standard central processing units. A software record was submitted for the
development.
NREL purchased commercially available reverse osmosis membranes to assist in its exploratory effort to
evaluate materials and methods for in-line inspection of ES and multilayer structures. These are multi-
layer/multi-functional membranes relevant to AMO’s strong emphasis on advancing manufacturing
technologies for water processing. Using these membranes, as well as ES membrane and electrode mats
fabricated at NREL, initial microscopy studies were performed to characterize the thickness, porosity, layer
interfaces, and other properties to inform our plan for development of relevant in-line methods. Figure 72
shows optical microscopy of four examples from the initial sample set. Vast differences in porosity and
morphology are evident.
(a) (b)

68
(c) (d)
Figure 72 Optical micrographs for (a) a particle-polymer electrode, (b) an anionic membrane, (c) a cationic membrane and
(d) a reverse osmosis membrane. Source: NREL
In an effort to more fundamentally explore the use of spectroscopy methods for in-line NDE, NREL, in
collaboration with the Colorado School of Mines, performed studies of polymer- and polymer-particle inks and
dried layers using several techniques, including attenuated total reflectance-infrared spectroscopy, ultraviolet
absorption spectroscopy and ultraviolet fluorescence spectroscopy. Figure 73 (a) shows temporal attenuated
total reflectance-infrared spectroscopy results of polymer-particle inks with higher polymer loadings and
Figure 73 (b) for lower polymer loadings during the drying process. In this experiment, the ink is on a diamond
sample tip during the measurement (not a functional substrate, e.g. a membrane or gas diffusion membrane for
fuel cells). Circled in blue are the evolution of peaks characteristic of the polymer as the ink dries, of
magnitude proportional to polymer loading, indicating potential to perform compositional measurements of
both liquid and dried heterogeneous layers. Further studies are required to understand the sensitivity of the
technique to small variations in polymer loading. This could also be an interesting diagnostic method to
understand drying physics of heterogeneous inks.
(a)

69
(b)
Figure 73 Attenuated total reflectance-infrared spectroscopy of polymer-particle inks during drying, with characteristic
polymer peaks indicated, at (a) higher polymer content and (b) lower polymer content. Source: NREL
Macroscopic Mathematical Model of the Drying of a Single Layer
Generic Slurry Containing Monodispersed Colloidal Particles, Binder
and Solvent (LBNL Lead Laboratory)
Slurry Drying Model
Due to very late availability of funding, milestones were established late in FY 2019 (essentially for FY 2020)
after meetings with and visits to the other Collaboration labs. An initial literature search and early work on a
particle settling model as a first step toward a dispersion film drying model was performed. This model
considered the settling of particles that are subject to buoyancy, gravity, polymer “spring” connections to other
particles, and a particle network that is settling faster than surface recedes. Figure 74 (a) and Figure 74 (b)
show intuitively-reasonable particle separation and particle network height under mechanical equilibrium.
However, during this initial development work, it became clear that component interactions in the concentrated
dispersions of interest to this Collaboration are poorly understood. Constructing a model of suspension drying
that meaningfully incorporates component-level information will require the development of novel
experiments for probing the behavior of these dense dispersions. LBNL has proposed to design and undertake
these experiments in order to understand the physics that will be needed for further work on our film drying
model.
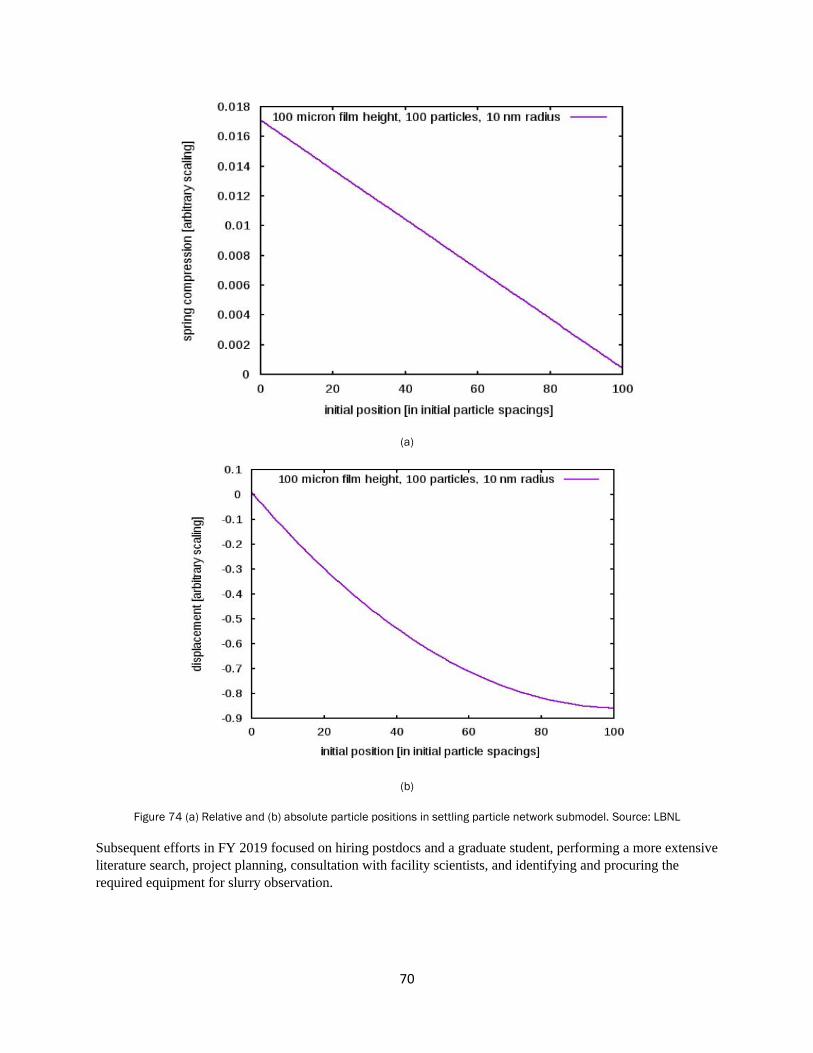
70
(a)
(b)
Figure 74 (a) Relative and (b) absolute particle positions in settling particle network submodel. Source: LBNL
Subsequent efforts in FY 2019 focused on hiring postdocs and a graduate student, performing a more extensive
literature search, project planning, consultation with facility scientists, and identifying and procuring the
required equipment for slurry observation.

71
Validated Continuum-Scale Models to Accelerate Design and Scale-
up of Simultaneous Die Coating Process Technology (SNL Lead
Laboratory)
Model Development and Validation for Multilayer R2R Applications
Work on the model development began in late February and early March 2019 with discussions of multilayer
slot- and slide-die specifications with ORNL and NREL researchers. Sandia and UNM completed the
deposition model of single-layer slide coating flow using Goma 6.0 solver and began work on the multilayer
slide-die model, given the specifications and range of conditions articulated by NREL. The slot-die model was
planned based on the feedback from ORNL. The approach was to solve partial differential equations of
capillary hydrodynamics (Navier-Stokes, coupled mesh motion and relevant constitutive equations) in a
successful 2D coating process. The starting geometry for the slot-die model was for the ORNL Dynacoat Lab
Coater. An example of the solid model in a finite element mesh is shown in Figure 75. In support of the SNL
slide die modeling effort, NREL provided initial information on expected ink properties, slide die geometry,
and process conditions for our initial target multi-layer coatings.
Figure 75 Solid model in a finite element mesh. Source: SNL
Procedures were needed for modeling of the physical properties and operating conditions. Experience in
capillary hydrodynamic modeling is essential. The system is highly nonlinear system with a capillary force at
free surface for a shear thinning liquid and a pseudo solid mesh. To obtain a direct approach to steady-state
conditions with a Newton method required a “good” initial guess to stay in the ball of convergence. A free
surface based solution was obtained in a strategic continuation from fixed mesh solution. A similar procedure
to obtain solutions at different operating conditions and physical properties required remeshing.
SNL and UNM completed the deposition models of single- and two-layer slide coating flow using NREL’s
multilayer slide-die design as a simple Newtonian base case, and the single and two-layer slot-die coating flow
using ORNL’s two-layer die design as a base case. These models have a working user interface to improve
usability by the partners and industry. An example of a single-layer mesh and pattern simulating pressure and
flow is presented in Figure 76. NREL provided SNL with rheological data for a representative multilayer slide
coating stack, and the data have been fit with standard constitutive equations and implemented in the models.
Simulations with Newtonian and shear-thinning fluid layers were developed, and SNL improved the multilayer
slot-die model with the specifications and range of conditions articulated by ORNL.
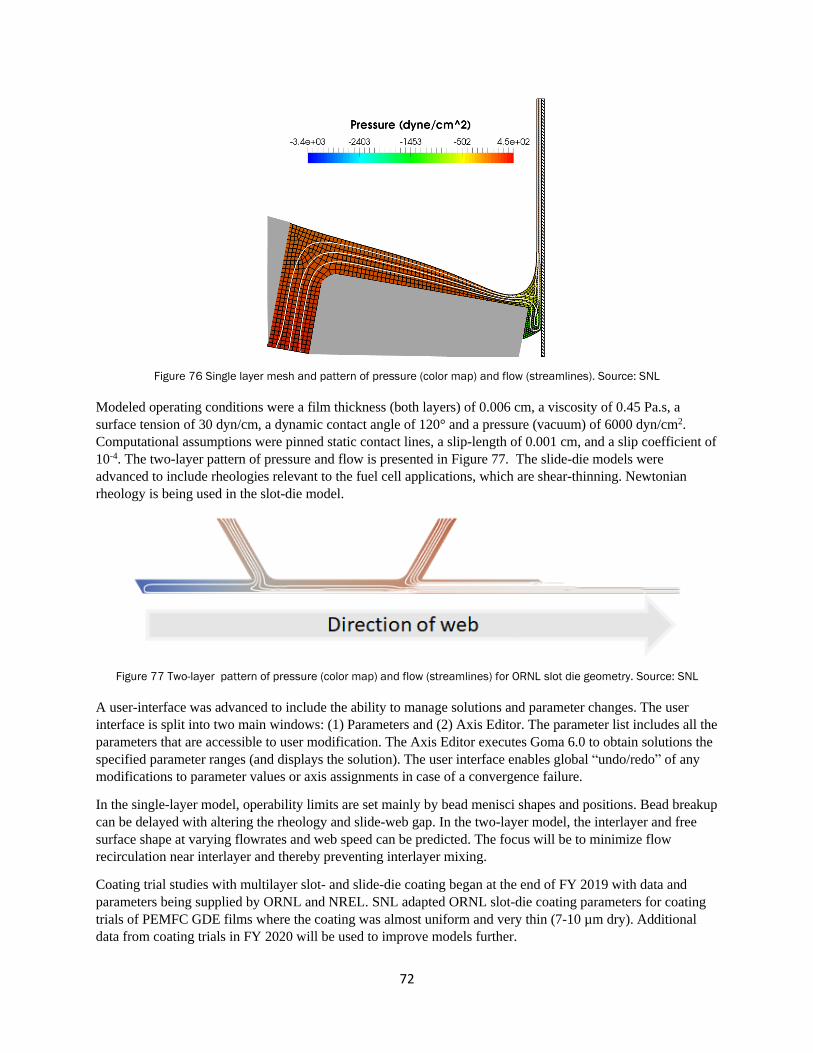
72
Figure 76 Single layer mesh and pattern of pressure (color map) and flow (streamlines). Source: SNL
Modeled operating conditions were a film thickness (both layers) of 0.006 cm, a viscosity of 0.45 Pa.s, a
surface tension of 30 dyn/cm, a dynamic contact angle of 120° and a pressure (vacuum) of 6000 dyn/cm2.
Computational assumptions were pinned static contact lines, a slip-length of 0.001 cm, and a slip coefficient of
10-4. The two-layer pattern of pressure and flow is presented in Figure 77. The slide-die models were
advanced to include rheologies relevant to the fuel cell applications, which are shear-thinning. Newtonian
rheology is being used in the slot-die model.
Figure 77 Two-layer pattern of pressure (color map) and flow (streamlines) for ORNL slot die geometry. Source: SNL
A user-interface was advanced to include the ability to manage solutions and parameter changes. The user
interface is split into two main windows: (1) Parameters and (2) Axis Editor. The parameter list includes all the
parameters that are accessible to user modification. The Axis Editor executes Goma 6.0 to obtain solutions the
specified parameter ranges (and displays the solution). The user interface enables global “undo/redo” of any
modifications to parameter values or axis assignments in case of a convergence failure.
In the single-layer model, operability limits are set mainly by bead menisci shapes and positions. Bead breakup
can be delayed with altering the rheology and slide-web gap. In the two-layer model, the interlayer and free
surface shape at varying flowrates and web speed can be predicted. The focus will be to minimize flow
recirculation near interlayer and thereby preventing interlayer mixing.
Coating trial studies with multilayer slot- and slide-die coating began at the end of FY 2019 with data and
parameters being supplied by ORNL and NREL. SNL adapted ORNL slot-die coating parameters for coating
trials of PEMFC GDE films where the coating was almost uniform and very thin (7-10 µm dry). Additional
data from coating trials in FY 2020 will be used to improve models further.

73
Collaboration/Coordination/Outreach/CRADA Projects
Core Program
The Collaboration laboratories collaborated and with each other on a weekly basis, either through visits or via
telecommunications. Team meetings involving the laboratory leads and principal investigators occurred bi-
weekly and included the DOE Technical Managers at one meeting every month. Outreach continued through
the principal investigators and researchers presenting at conferences, symposia, peer reviews and during direct
contact with industry and the commercial sector. Specific research was reported in technical journals and
through patent applications.
CRADA Projects
USC Title 15, Chapter 63, Section 3710c, paragraph 7(A) allows for non-disclosure of trade secrets or
commercial or financial information that is privileged or confidential, which is obtained in the conduct of
research or as a result of activities from a non-Federal party participating in a CRADA. The government
agency may provide appropriate protections against the dissemination of such information for a period of up to
5 years after development of information. As such, some technical information on the CRADA projects will
not be included in this report. The following information for each CRADA project was approved or provided
by the CRADA partner.
Fisker, Inc
Fisker, Inc. partnered with LBNL and ORNL to demonstrate all-solid-state batteries based on LLZO separators
and cathode scaffolds and scale the freeze casting process to the pilot level at ORNL. ORNL and LBNL
worked with Fisker to purchase 1.5 kg of LLZO powder for freeze casting and sintering experiments. The 1.5
kg will be split between the two labs with 1.0 kg going to ORNL for scale-up processing and 0.5 kg going to
LBNL for formulation and deposition development.
Through processing variable optimization, LBNL produced freeze tape cast green tapes at < 200 µm which is a
layer thicknesses suitable for practical applications. In order to mitigate the green tape cracking issue during
freeze drying, 10 vol.% LLZO slurries were mainly cast for easier handling. Other processing parameters were
further optimized. The slurry stability was improved by introducing a PAA dispersant which allowed the slurry
to stay well dispersed throughout the entire casting period. By adjusting the casting speed and the freezing bed
temperature, a range of pore sizes could be obtained as shown in the SEM fracture surfaces of Figure 78.
Vertical pore alignment is obvious. Smaller pore sizes resulted in higher specific surface area, a key factor in
mitigating the cathode/electrolyte interfacial impedance. However, optimal usable pore size is dependent on
the infiltration process of the cathode components which requires further exploration.
Figure 78 SEM fracture surface images of freeze tape cast (10 vol.% LLZO slurry) produced at thicknesses of 300 μm, 220
μm and 160 μm and at various casting speeds. Source: LBNL

74
Freeze tape cast and tape cast LLZO green tapes were stacked and sintered to produce dense/porous bilayers of
LLZO as shown in Figure 79 (a). Cathode components were dispersed in an organic solvent and drop cast onto
the porous layer as shown in Figures 79 (b) and Figure 79 (c). Red arrows in Figure 79 (c) indicate the nickel-
manganese-cobalt (NMC) 622 (LiNi0.6Mn0.2Co0.2O2) was infiltrated to the porous layer in a slurry form of the
cathode components. The cathode components occupy only a small fraction of the total porosity and mostly
exist as deposits on the interior pore wall.
(a) (b) (c)
Figure 79 (a) Sintered dense/porous LLZO bilayer and (b) and (c) the cathode component infiltrated bilayer. Source: LBNL
ORNL confirmed the status of the sputter coater that will be used for depositing LiPON onto the dense LLZO
layer. LBNL and ORNL collaborated on the deposition of LiPON onto the dense LLZO layer. It was decided
to first deposit LiPON by itself to characterize its quality. LLZO powder was purchased from a different
vendor due to difficulties in receiving commercial LLZO power from Fisker and costs from the vendor that
was previously used. This required adjustments to the slurry formulation and freeze tape casting parameters.
With stable production of the bilayers, research was focused on the cathode infiltration process. Little work
has been done previously on the Li deposition onto LLZO, other than a gold interfacial coating. At ORNL, the
clean room deposition chamber, which will be used to make Li and LiPON films, is fully contained within a
glovebox having an argon atmosphere. Nitrogen will also be used for LiPON deposition. Both radio-frequency
sputtering and thermal evaporation of Li can be performed in this setup. The minimum pressures that the
chamber can hold are about 1 µ Torr.
Powder characterization and freeze tape casting experiments were conducted using commercial Al3+ doped
LLZO. As-received powders were several microns in size with majority of them showing necking from
calcination as can be seen in Figure 80 (a) and Figure 80 (b). The XRD analysis in Figure 80 (c) showed a
mixture of cubic and tetragonal LLZO suggesting the powder is Li rich. It also had a thick (>160 nm) Li2CO3
surface coating layer, as confirmed by XPS, likely due to reaction with atmospheric air. XRD of powder
compacts (pellets) heated to 1090 °C/3 h showed smaller t-LLZO peaks, suggesting that c-LLZO can be
obtained by blowing off excess lithium while sintering, also shown in Figure 80 (c). Zeta potentials of the
powder were measured in the pH range of 3-11 using two dispersants polyethylenimine (PEI) and PAA and the
plot of the data is presented in Figure 80 (d). The results suggested that PAA is a great dispersant for slurry
formulation as the LLZO slurry is highly basic (pH 14+) due to the protonation of LLZO in water. However,
the formulated slurry showed rapid powder flocculation and it was empirically determined that the xanthan
gum, the thickener, was affecting surface chemistry of the dispersed LLZO powder.

75
(a) (b)
(c) (d)
Figure 80 (a) and (b) SEM images and (c) XRD analyses of as-received LLZO power and LLZO powder compacted (pellet)
and heated to 1090°C for 3 hours where blue arrows indicate t-LLZO peaks. (d) Zeta potentials of as-received LLZO with
selected dispersants at varying pH. Source: LBNL
In order to achieve viscosities suitable for freeze tape casting, the LLZO fraction was increased from 10 to 14
vol.% in the slurry. Well aligned LLZO struts are observed in the fracture surface SEM images of the freeze
tape cast green tape as seen in Figure 81 (a) and Figure 81 (b). The slurry formulation was transferred to
ORNL and initial results showed similar pore structures shown in Figure 81 (c) and Figure 81 (d).

76
Figure 81 (a) and (b) Fracture surface SEM images of freeze tape cast LLZO green tapes produced at LBNL, and (c) and (d)
surface SEM images of green tapes produced at ORNL. Sources: LBNL and ORNL
Preliminary LLZO (from NEI) slurry formulations were received from LBNL and evaluated at ORNL. Slurries
were initially made (both at LBNL and ORNL) on a small scale (with 4-6 g of LLZO powder) to produce
freeze tape cast porous layers which are only two to three inches long. Slurry stability was assessed visually,
and the final pore structure obtained was characterized via SEM imaging.
As can be seen in Figure 82 (a) and Figure 82 (b), the water-based slurry of LLZO had stability issues. The
solids tended to separate from the solvent (water) to form a two-phase mixture with time. This is an issue for
scaling-up of the freeze tape casting process, as the slurry needs to be stable for several hours, given the slow
speed freeze tape casting. A non-homogenous slurry would lead to segregation of LLZO and binder in the final
porous layer.
(a) (b)
Figure 82 Photographs of a water-based LLZO slurry (a) after mixing and (b) after ~30 mins. Source: ORNL
Right after mixing ~30 mins into coating

77
One important characteristic that determines the slurry stability is the surface charge of particles in a dispersion
as it provides electrostatic hinderance towards flocculation. To identify a suitable dispersant for the LLZO
particles, ORNL measured surface charge of LLZO particles (from NEI) dispersed in water with and without
the presence of various dispersants via zeta potential measurements as a function of pH as shown in Figure 83.
A cationic dispersant (polyethyleneimine (PEI)), and an anionic dispersant (PAA) were chosen for the
measurements. PAA was also the dispersant in the LBNL slurry recipe. Due to leaching of Li+-ions from
LLZO when in contact with water, the LLZO slurry is very basic (pH >12). Therefore, a high surface charge at
this pH value of 12 would be favorable. As can be seen from the results in Figure 83, PAA would be better
than PEI, as the surface charge of LLZO in its presence is < -90 mV. PEI on the other hand would be a better
dispersant at a lower pH. These results were communicated to LBNL to help make guided decisions for
improving the slurry stability.
Figure 83 Zeta potential of LLZO in the presence/absence of dispersants. Source: ORNL
Various parameters such as the amount and type of dispersant, thickener amount/type, and binder as well as the
mixing method were tuned to improve the long-term stability of the slurry.
Freeze tape casting formulations were further developed using the NEI LLZO powder to achieve improved
stability, ice structure, flexibility, and sample uniformity. Acrylic latex emulsion binder with a low Tg (-45°C)
was introduced to impart flexibility while frozen to prevent sample cracking during freeze drying. It was
possible to freeze tape cast a 4’’ x 4’’ porous LLZO scaffold through slurry viscosity and additive content
optimization which showed good sample uniformity. LBNL was able to consistently freeze tape cast LLZO
powders from two different vendors. Figure 84 (a) shows the SEM fracture surface image of freeze tape cast
NEI LLZO green tape and Figure 84 (b) is a higher magnification clearly showing the vertical pore structures.
(a) (b)
Figure 84 (a) SEM fracture surface image of freeze tape cast NEI LLZO green tape and (b) at 10x magnification. Source:
LBNL

78
The freeze tape cast green tape from the LBNL process was combined with tape cast green tape provided by
Fisker to sinter a porous/dense bilayer LLZO architecture. On sintering to 1090°C for 3 hours, the two layers
were well bonded as can be seen in Figure 85 (a) and Figure 85 (b). The tape cast green tape sintered to high
densities with no open pores.
(a) (b)
Figure 85 SEM fracture surface images of (a) a sintered porous/dense LLZO bilayer and (b) at 10x magnification. Source:
LBNL
LBNL scientists visited ORNL to assist with freeze tape casting because there were inconsistencies in the ice
structures between the two labs. Two postdocs worked side by side along the entire slurry formulation to
freeze tape casting process and was able to reproduce the freeze tape casting results of LBNL at ORNL.
Several factors including additive content, mixing method, freeze tape casting parameters were adjusted to fit
the ORNL lab condition (e.g. humidity, room temperature, etc.)
Preliminary NEI LLZO slurry formulations were received from LBNL and ORNL attempted to use them on
their freeze tape caster. Table V shows the detailed slurry formulation. Initially, the slurries were made at
LBNL and ORNL on a small scale with 4-6 g of LLZO powder to produce freeze tape cast porous layers
which are only two to three inches long. Slurry stability was assessed visually, and the final pore structure
obtained was characterized via SEM imaging.
Table V NEI LLZO Slurry Recipe for Freeze Tape Casting Transferred from LBNL to ORNL
Component Solids Weight (g) Solution Weight (g)
NEI LLZO 6 N.A.
Li2CO3 (20% excess) 0.33 N.A.
PAA MW: 450,000 0.032 N.A.
HA-12 0.72 1.6
VANZAN (0.2wt%) 0.00545 5.45
Flocculation in a dispersion could also be retarded sterically by increasing the viscosity. High molecular
weight PAA (MW 450,000) can act both as a dispersant (discussed above) and a thickener. Xanthan gum
(VANZAN) is the primary thickener in the formulation shown in Table V. In order to improve slurry stability,
ORNL modified the recipe in Table V in two ways and observed the slurry stability with time visually. In one
case, the amount of PAA as doubled, while in the other case, the amount of VANZAN was doubled while
keeping the rest of the formulation same. In both cases, slurry stability was significantly improved, and no

79
flocculation was observed after 30 mins. Figure 86 (a) and Figure 86 (b) show SEM images of the cross-
sections of the freeze tape cast porous tapes obtained with the above two slurry modifications.
(a)
(b)
Figure 86 SEM images of the cross sections of the freeze tape cast porous tapes obtained with slurries that have either (a)
double the amount of PAA or (b) double the amount of VANZAN compared to the original recipe shown in Table V. Source:
ORNL
Even though the slurry stability was improved for these cases, the resulting porosity in the freeze-dried tapes
was not satisfactory. Pores alignment was not vertical, pore-size was smaller than what LBNL demonstrated
for their recipe, and pore walls were thicker. An ideal case scenario demands vertical pores with almost zero
tortuosity and high pore volume with large pores (>20 µm) for easier cathode infiltration.
LBNL personnel visited ORNL to observe each step during the freeze tape casting and to point out things that
ORNL might have been doing differently that resulted in not being able to reproduce the porous tape structures
at ORNL. The LLZO slurry recipe shown in Table VI was freeze tape cast. This formulation was more stable
towards flocculation and resulted in more flexible freeze-dried green tapes compared to the previous recipe in
Table V. Specifically, this slurry recipe is different in the following aspects: (1) a higher Li2CO3 content (30%
excess vs. 20% excess earlier), (2) use of a different emulsion binder (Rovene 97982) in combination with the
previously used HA-12 emulsion binder (60:40 ratio), and (3) double the amount of PAA and VANZAN.
Rovene 97982 is a soft acrylic emulsion known for its flexibility. Improvement in the slurry stability by
doubling the amounts of PAA and VANZAN was observed at ORNL as well. Indeed, during freeze tape
casting no visible flocculation was observed for 30-60 mins.

80
Table VI Modified NEI LLZO Slurry Recipe for Freeze Tape Casting
Component Solids Weight (g) Solution Weight (g)
NEI LLZO 6 N.A.
Li2CO3 (30% excess) 0.495 N.A.
PAA MW: 450,000 0.065 N.A.
HA-12 0.36 0.96
Rovene 97982 0.36 0.64
VANZAN (0.2wt%) 0.011 5.5
Overall, several differences were noted in the way of mixing the slurry components as well as seemingly
insignificant things during the casting step, which likely resulted in the inconsistency in the final porous tape
structure obtained at LBNL versus at ORNL for the same slurry recipe. Two freeze tape casting runs were
performed for the slurry in Table VI but at different freezing temperatures and line speed.
The first freeze tape casting run was made at 20% of the line speed and a freezing bed temperature of minus
13°C. Figure 87 schematically shows the areas that were characterized via SEM. A thin strip parallel to the
freeze tape casting direction was cut from the middle of the dried tape. The tape was fractured by bending at
three locations, more and more further from the front edge of the tape. This was done to assess the areal
uniformity of the porosity. It is typically expected that the area further from the front edge would have much
less developed porosity as it would be freeze cast later compared to the area closer to the front due to slurry
stability/drying issues.
Figure 87 Schematic showing the areas of the tape that were characterized via SEM. Source: ORNL

81
Figure 88 shows the SEM of the three cross-section areas at 50× and 100× magnifications. Porosity can be
seen throughout the width of the tape. However, it was uncertain why the pores are still at an angle (similar to
Figure 86). NREL suggested that it may have to do with angle between the direction of the fracture and
direction of the ice lamella growth in that region. To see perfectly vertical columnar walls, the fracture should
be perpendicular to the lamellar growth. Ideally, the ice lamellar growth should occur in the freeze tape casting
direction; however, for variety of reasons, ice growth occurs in random directions throughout the tape.
Figure 88 SEM of the cross-sections from three different areas of the LLZO freeze tape cast green tape from the first run.
Source: ORNL
The second freeze tape casting run was made at 15% of the line speed and a freezing bed temperature of minus
11°C. The same slurry recipe as in Table VI was used. Freeze tape casting conditions were changed to have
higher freezing bed temperature (-11°C vs. -13°C) and slower line speed (15% vs. 20%). A higher temperature
was used to get larger ice crystals and, therefore, larger pores. For SEM imaging, the sample was fractured
differently this time. Fracture was done in the direction perpendicular to the ice lamella growth to observe the
columnar structure. This is shown schematically in Figure 89.

82
Figure 89 Schematic highlighting the difference in the way the freeze tape cast was fractured for SEM imaging the cross-
sections for the second run. Source: ORNL
Three such perpendicular fractures were made, and the SEM cross-sections are shown in Figure 90. As can be
seen, the vertical columnar structure can be observed in some areas; however, the areal uniformity of such
porosity still needs to be greatly improved. For example, fracture #3 does not have the similar columnar
porosity.
Figure 90 SEM of the cross-sections from three different areas of the LLZO freeze tape cast green tape obtained from the
second run. Source: ORNL

83
Navitas Systems, LLC
Navitas Systems, Inc. partnered with ORNL and NREL to demonstrate R2R production of advanced separator
for lithium ion batteries. A R2R method was developed to fabricate the separator, which replaces the
conventional discrete operations and enables superior safety, high throughput and low manufacturing cost.
Selection of Baseline Commercially-Available Separators
Initially, ORNL evaluated rate performance of two separators along with standard full coin cells and estimated
the cost savings that could be achieved from the new technology. Most of the benefits will be seen in the heat
pressing portion of the process, which has a ~90 sec cycle time. Substantial decreases in cycle time (>20%)
will decrease the number of heat presses that Navitas will ultimately have to purchase and operate. Cycle time
improvements could result in savings of up to $1M in capital equipment investments and corresponding
savings in facility floor space and utilities use as well as direct labor burden. At 1.5M cells/year, savings will
be on the order of ~0.10/cell (0.5% of cell cost) per reduced heat press. There would be up to a ~2% cost
savings on the cell product for Navitas.
NREL and ORNL collaborated with Navitas on the designs for patterning new gravure rollers, the separators,
and materials for the patterned coating. Full coin cells consisting of NMC622 and graphite from Superior
Graphite (SLC 1520T) were assembled. The electrodes as fabricated with the composition in Table VII were
coated by a slot-die coater. The electrodes were assembled as coated after a secondary drying at 110 oC under a
vacuum oven at 30-inch Hg vacuum overnight. Triplet cells were assembled with each separator. The cells
went through constant current charge to 4.2V and constant voltage charge until current dropped C/20 where 1C
= 175 mA/g of NMC622. The charge rate was the same as the discharge rate when discharge rate was below
C/3 and was kept at C/3 at the higher discharge rate. A series of discharge rates from 0.1C to 10C and six
cycles for each rate were evaluated.
Table VII Coin Cell Electrode Areal Loading and Composition
Areal Loading (mg/cm2) Electrode Composition
11.9 NMC622/Denka CB/5130 PVDF in 90/5/5 wt%
6.4 SLC1520T/C65 CB/9300 PVDF in 92/2/6 wt%
Voltage profiles under various C-rates for the three separators are shown in Figure 91 (a) for Celgard, Figure
91 (b) for Laminable Separator B, and Figure 91 (c) for Laminable Separator C where the solid lines and dash
lines represent charge and discharge capacity, respectively.
(a)

84
(b)
(c)
Figure 91 Voltage profiles for various separators: (a) Celgard, (b) Separator B and (c) Separator C. Source: ORNL
Rate performance is compared for capacity in Figure 92 (a) and C-rate in Figure 92 (b) where cells with three
separators show great performance with >160 mAh/g at C/10. Among the three separators, Separator B shows
slightly better rate performance than the other two. For example, the normalized discharge capacity was 82%
at 2C compared to 75% and 79% for Celgard 2325 and Separator C, respectively.
(a) (b)
Figure 92 Rate performance comparison for three separators: (a) capacity and (b) normalized discharge capacity vs C-rate.
Source: ORNL
20
40
60
80
100
120
140
160
180
0.1 1 10
CH-CelgardDCH-CelgardCH-Separator BDCH-Separator BCH-Separator CDCH-Separator C
Cap
ac
ity (
mA
h/g
)
C-rate (C)
0
20
40
60
80
100
0.1 1 10
CelgardSeparator BSeparator C
No
rma
lized
Dis
ch
arg
e C
ap
acit
y (
%)
C-rate (C)

85
The self-discharge phenomenon was also investigated by recording the OCV during 24 hours of rest after fully
charging the cells to 4.2C at C/3. As shown in Figure 93, the OCV dropped gradually as time went on which is
normal. The initial voltage drop was due to the polarization in the cells and the subsequent voltage drop would
be attributed to leakage current between cathode and anode and any side reactions. Since the cells are identical
except for the separator, we could ascribe the difference to the separator. The cell with Separator B separator
demonstrated less voltage drop, which indicates lower self-discharge rate.
Figure 93 OCV of cells with various separators during a 24-hour rest. Source: ORNL
ORNL and NREL coordinated the design of the patch coating of separators. NREL designed and 3D-printed
prototype masks for the small-scale ultrasonic spraying of the patterned coatings of interest. The pattern of
interest is cross-hatched lines (for one coating) and the interior squares of the cross-hatch (for the second
coating). The mask for the square pattern is simple. However, the mask for the lines involves “floating”
squares that must be supported by raised elements. Using the second mask, we sprayed substrates with Pt-
containing inks (i.e. fuel cell electrode inks) to understand the impact of various design aspects of the mask
geometry on the uniformity of the patterning. Figure 94 provides a top view of one of the prototype masks
showing the mechanical design of lines in the mask. Figure 95 is an image of the substrate sprayed with this
mask showing the cross-hatched line pattern. Figure 96 is X-ray fluorescence spectroscopy (XRF) data across
a square element of the mask (no coating) and two adjacent lines (with coating), using the Pt signal to indicate
the uniformity and shape of each coated line. These initial experiments provided feedback on the different
mask design elements and was informative for full-size mask design and printing.
Figure 94 Top view of the mechanical design for lines in the 3D-printed prototype mask. Source: ORNL
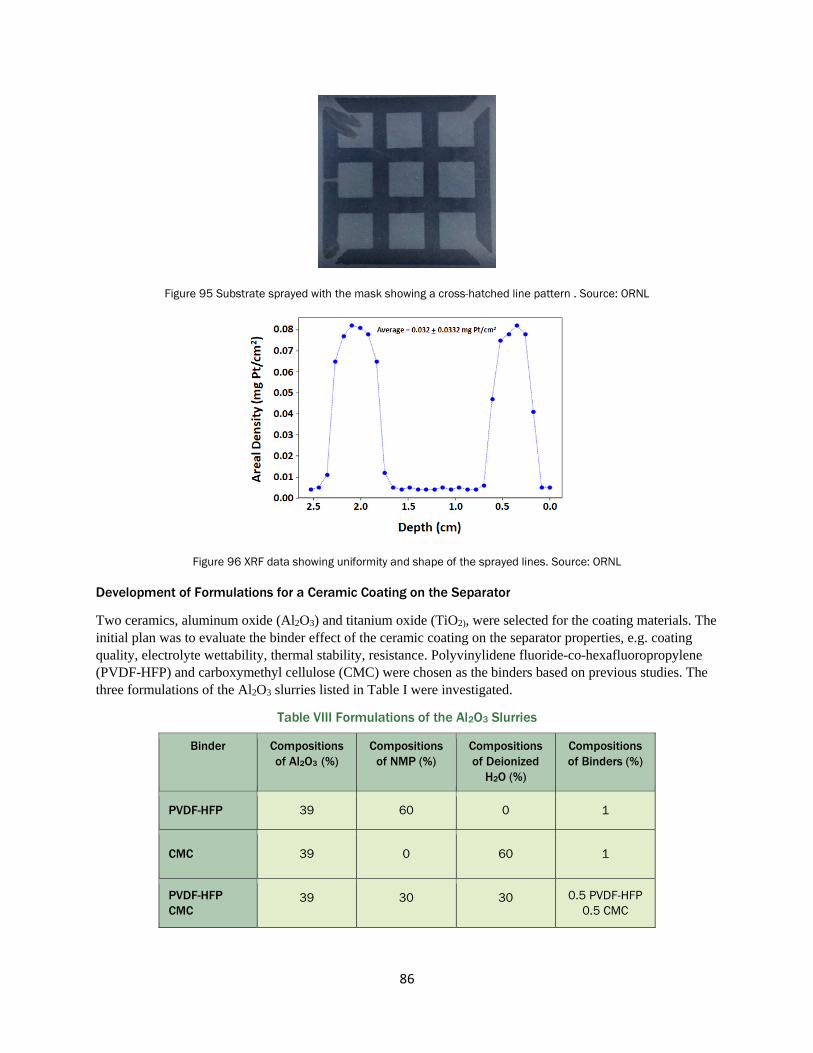
86
Figure 95 Substrate sprayed with the mask showing a cross-hatched line pattern . Source: ORNL
Figure 96 XRF data showing uniformity and shape of the sprayed lines. Source: ORNL
Development of Formulations for a Ceramic Coating on the Separator
Two ceramics, aluminum oxide (Al2O3) and titanium oxide (TiO2), were selected for the coating materials. The
initial plan was to evaluate the binder effect of the ceramic coating on the separator properties, e.g. coating
quality, electrolyte wettability, thermal stability, resistance. Polyvinylidene fluoride-co-hexafluoropropylene
(PVDF-HFP) and carboxymethyl cellulose (CMC) were chosen as the binders based on previous studies. The
three formulations of the Al2O3 slurries listed in Table I were investigated.
Table VIII Formulations of the Al2O3 Slurries
Binder Compositions
of Al2O3 (%)
Compositions
of NMP (%)
Compositions
of Deionized
H2O (%)
Compositions
of Binders (%)
PVDF-HFP 39 60 0 1
CMC 39 0 60 1
PVDF-HFP
CMC 39 30 30 0.5 PVDF-HFP
0.5 CMC

87
When preparing the slurry, the binder (PVDF-HFP, CMC, or a combination of the two) was dissolved in
solvent (N-Methyl-2-pyrrolidone (NMP), deionized H2O or a mixture of the two) to form a binder solution
first. Then the ceramic (Al2O3) was dispersed in the binder solution. Additional solvent was added as needed to
adjust the viscosity. The ceramic coating was applied to the uncoated separator via a doctor blade with a 50 µm
gap. For the slurry with mixed binders, an individual binder was dissolved in the corresponding solvent first.
The appropriate amount of each binder solution was measured and mixed followed by dispersion of the
ceramic. The coating was dried at 50°C. Photographs of the coatings are shown in Figure 97 (a) for PVDF-
HFP, Figure 97 (b) for CMC and Figure 97 (c) for PVDF-HFP and CMC.
(a) (b) (c)
Figure 97 Ceramic coating on separators with various binders. (a) PVDF-HFP, (b) CMC and (c) PVDF-HFP and CMC. Source:
ORNL
The separator with PVDF-HFP in NMP solvent had no significant agglomeration and its shape was good. In
contrast, the separator with CMC exhibited binder wrinkling, indicating significant stress induced by the
coating. The separator with mixed PVDF-HFP and CMC was the worst in terms of coating wetting and
adhesion. Many ceramic particles fell off the surface, which could have been due to the low solubility of
PVDF-HFP in the NMP/H2O at a 50/50 weight fraction. Based on these observations, the experimental plan
was slightly modified to investigate the composition of ceramics, Al2O3 and TiO2, instead of binder effect.
NREL identified Carpe Diem, a supplier of specialized R2R equipment, as a suitable manufacturer for
patterned gravure rolls. ORNL and NREL developed the final specification for the roll sizes and patterns.
NREL also coordinated with ORNL on their development of titania and alumina slurries for the separator
coatings. ORNL and NREL developed ink formulations of suitable viscosity for patterned spray coatings using
the previously developed 3D printed masks for the separator substrate provided by Navitas. Additionally,
NREL worked with the NREL Environmental Health and Safety group to develop a safe work procedure to
enable the mixing and spraying of the ceramic nanoparticle inks.
The two ceramics, Al2O3 and TiO2, were mixed in different Al2O3:TiO2 ratios (1/0, 0/1, 1/1, 3/1, and 1/3) and
coated onto the Navitas separator. The mixtures were 39 wt% of the ceramic, 1 wt% PVDF-HFP and 60wt.%
NMP, mixed to a homogeneous slurry and coated onto the Navitas separator. Figure 98 (a) is the SEM image
of the Al2O3 coated separator and Figure 98 (b) is the SEM for the TiO2 coated separator. When preparing the
slurry, the PVDF-HFP binder was dissolved in the NMP solvent to form a binder solution first, then the
ceramic (Al2O3 or TiO2) was dispersed in the binder solution. For the different ratios of ceramic, the two
slurries were mixed in the required ratio and thoroughly stirred. Additional solvent was added as needed to
adjust the viscosity of the slurries. Before coating, the slurries were filtered to get rid of agglomerates bigger

88
than 10 μm. The ceramic coatings were then applied to the uncoated Separator B separator via a doctor blade
with a 10 µm gap resulting in a coated thickness of ~ 8 μm after drying at 80 ° overnight to remove the solvent.
(a) (b)
Figure 98 SEM images of (a) the Al2O3 coated separator and the (b) TiO2 coated separator showing completely covered
surfaces. Source: ORNL
The electrochemical impedance spectroscopy measurements were done by assembling a coin cell with each
separator sandwiched between two stainless steel spacers and a single spring. The separators were soaked in
the electrolyte and drip-dried before coin cell assembly. The resistance as a function of the thickness of the
Al2O3 coating was recorded where an increase in the coating thickness produced an increase in the resistance
as shown in Figure 99. The coating thickness of 30 μm shows a very high impedance of ~78 Ω as compared to
< 10 Ω for the thinner coatings with 2.01 cm2.
Figure 99 Electrochemical impedance spectroscopy results for the Separator B separator with different thicknesses of
Al2O3 coatings. Source: ORNL
All the ceramics were then coated with a thickness of ~8 μm, giving impedance values of 0.85 Ω/cm2,
1.79 Ω/cm2, 1.44 Ω/cm2, 1.19 Ω/cm2 and 1.79 Ω/cm2 for ceramic coatings Al2O3, TiO2, Al2O3 / TiO2 (1:1),
Al2O3 / TiO2 (3:1) and Al2O3 / TiO2 (1:3), respectively as shown in Figure 100.

89
Figure 100 Electrochemical impedance spectroscopy results for the separators coated with the different ratios of Al2O3 and
TiO2. Source: ORNL
The Al2O3 coating results in a relatively low impedance and the TiO2 coating in higher impedance. For the
ceramics in a ratio of 75:25 (Al2O3 / TiO2) that were coated on the separator, the result was the lowest
impedance for the coated separators.
NREL performed initial patterned-spray-coating experiments using an initial alumina slurry formulation from
ORNL, separator material from Navitas, and full-sized 3D-printed pattern masks. As a first test, the alumina
slurry/crosshatch pattern was sprayed. Figure 101 (a) shows one of the spray masks on the substrate prior to
spraying and Figure 101 (b) shows the resulting alumina crosshatch pattern-sprayed separator. With this
positive result, NREL then sprayed the full interdigitated pattern, i.e. titania/diamonds and alumina/crosshatch.
In this second experiment, spatial non-uniformities in the coating thickness were observed as shown in Figure
102.
Figure 101 (a) 3D-printed spray mask and (b) alumina/crosshatch pattern-sprayed coating. Source: NREL
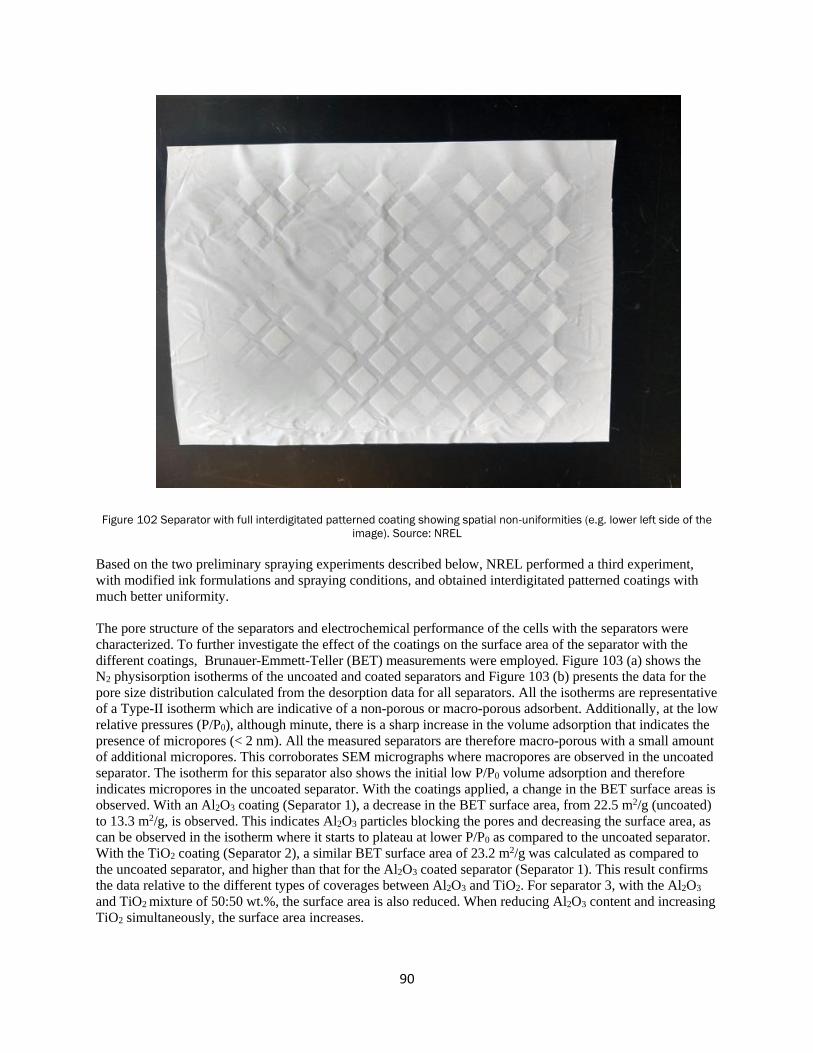
90
Figure 102 Separator with full interdigitated patterned coating showing spatial non-uniformities (e.g. lower left side of the
image). Source: NREL
Based on the two preliminary spraying experiments described below, NREL performed a third experiment,
with modified ink formulations and spraying conditions, and obtained interdigitated patterned coatings with
much better uniformity.
The pore structure of the separators and electrochemical performance of the cells with the separators were
characterized. To further investigate the effect of the coatings on the surface area of the separator with the
different coatings, Brunauer-Emmett-Teller (BET) measurements were employed. Figure 103 (a) shows the
N2 physisorption isotherms of the uncoated and coated separators and Figure 103 (b) presents the data for the
pore size distribution calculated from the desorption data for all separators. All the isotherms are representative
of a Type-II isotherm which are indicative of a non-porous or macro-porous adsorbent. Additionally, at the low
relative pressures (P/P0), although minute, there is a sharp increase in the volume adsorption that indicates the
presence of micropores (< 2 nm). All the measured separators are therefore macro-porous with a small amount
of additional micropores. This corroborates SEM micrographs where macropores are observed in the uncoated
separator. The isotherm for this separator also shows the initial low P/P0 volume adsorption and therefore
indicates micropores in the uncoated separator. With the coatings applied, a change in the BET surface areas is
observed. With an Al2O3 coating (Separator 1), a decrease in the BET surface area, from 22.5 m2/g (uncoated)
to 13.3 m2/g, is observed. This indicates Al2O3 particles blocking the pores and decreasing the surface area, as
can be observed in the isotherm where it starts to plateau at lower P/P0 as compared to the uncoated separator.
With the TiO2 coating (Separator 2), a similar BET surface area of 23.2 m2/g was calculated as compared to
the uncoated separator, and higher than that for the Al2O3 coated separator (Separator 1). This result confirms
the data relative to the different types of coverages between Al2O3 and TiO2. For separator 3, with the Al2O3
and TiO2 mixture of 50:50 wt.%, the surface area is also reduced. When reducing Al2O3 content and increasing
TiO2 simultaneously, the surface area increases.
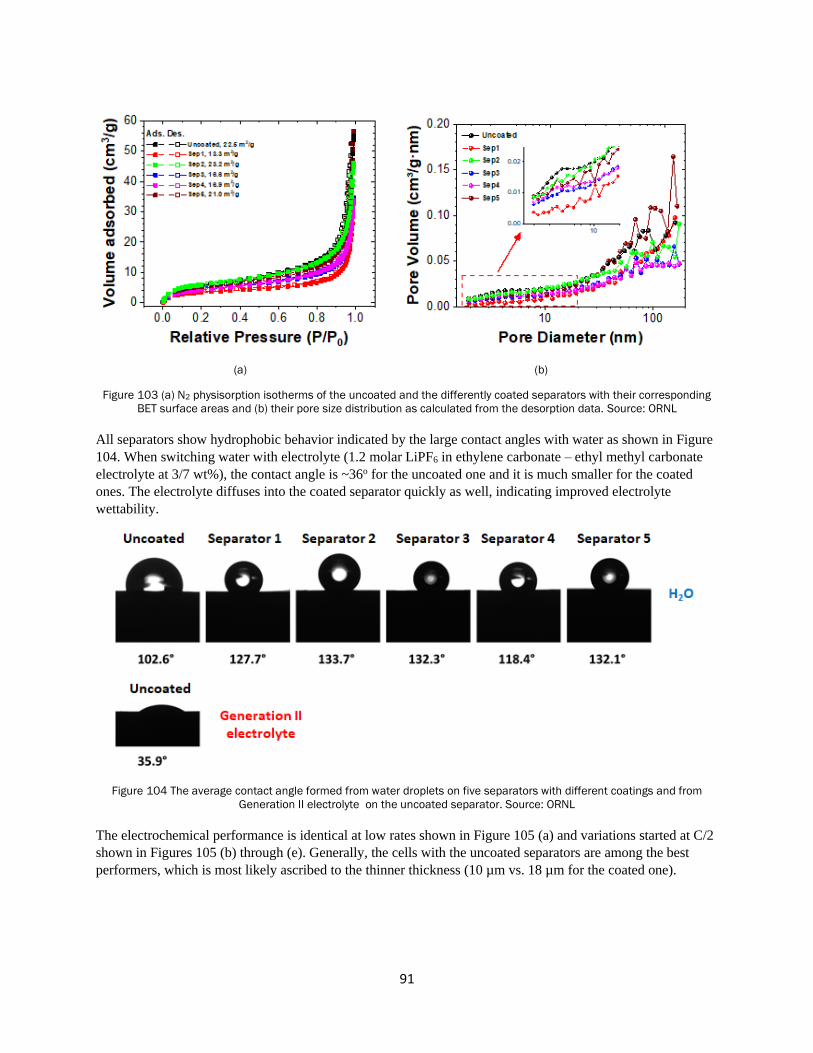
91
(a) (b)
Figure 103 (a) N2 physisorption isotherms of the uncoated and the differently coated separators with their corresponding
BET surface areas and (b) their pore size distribution as calculated from the desorption data. Source: ORNL
All separators show hydrophobic behavior indicated by the large contact angles with water as shown in Figure
104. When switching water with electrolyte (1.2 molar LiPF6 in ethylene carbonate – ethyl methyl carbonate
electrolyte at 3/7 wt%), the contact angle is ~36o for the uncoated one and it is much smaller for the coated
ones. The electrolyte diffuses into the coated separator quickly as well, indicating improved electrolyte
wettability.
Figure 104 The average contact angle formed from water droplets on five separators with different coatings and from
Generation II electrolyte on the uncoated separator. Source: ORNL
The electrochemical performance is identical at low rates shown in Figure 105 (a) and variations started at C/2
shown in Figures 105 (b) through (e). Generally, the cells with the uncoated separators are among the best
performers, which is most likely ascribed to the thinner thickness (10 µm vs. 18 µm for the coated one).

92
(a) (b)
(c) (d)
(e)
Figure 105 Voltage profile and rate performance with various separators at rates of (a) C/10, (b) C/2, (c) 1C, and (d) 2C. (e)
The performance for all separators at all rates from 0 to 45 cycles. Source: ORNL
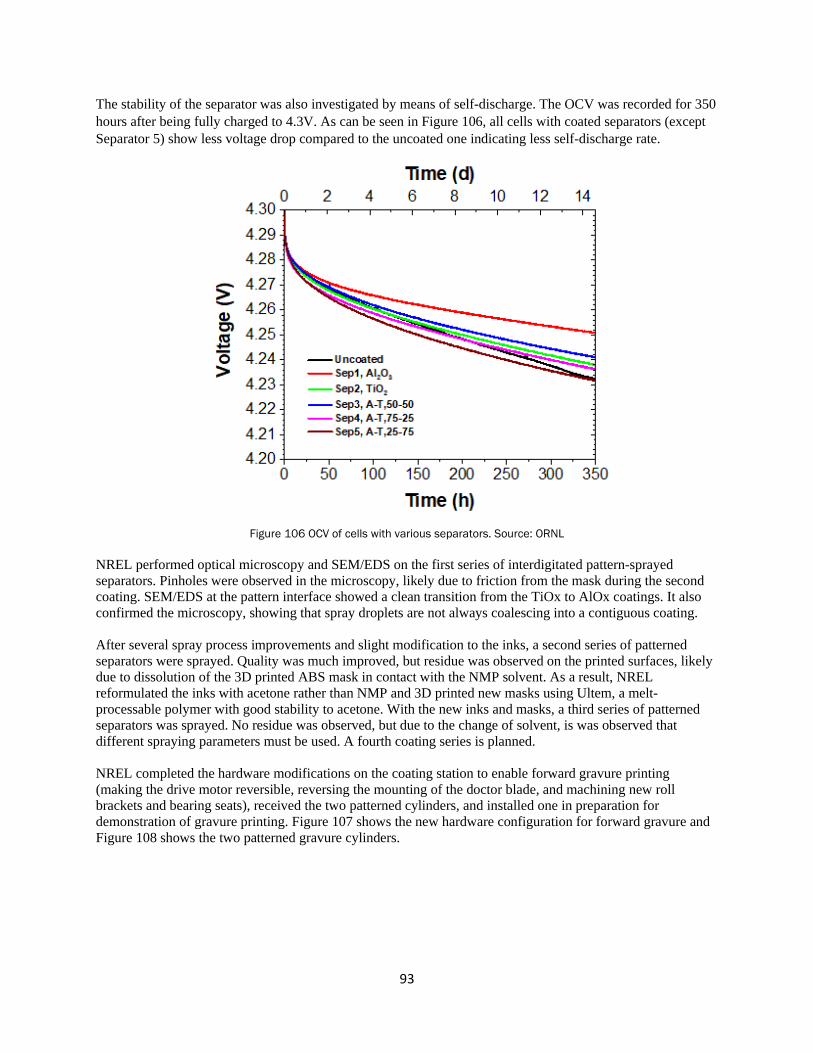
93
The stability of the separator was also investigated by means of self-discharge. The OCV was recorded for 350
hours after being fully charged to 4.3V. As can be seen in Figure 106, all cells with coated separators (except
Separator 5) show less voltage drop compared to the uncoated one indicating less self-discharge rate.
Figure 106 OCV of cells with various separators. Source: ORNL
NREL performed optical microscopy and SEM/EDS on the first series of interdigitated pattern-sprayed
separators. Pinholes were observed in the microscopy, likely due to friction from the mask during the second
coating. SEM/EDS at the pattern interface showed a clean transition from the TiOx to AlOx coatings. It also
confirmed the microscopy, showing that spray droplets are not always coalescing into a contiguous coating.
After several spray process improvements and slight modification to the inks, a second series of patterned
separators were sprayed. Quality was much improved, but residue was observed on the printed surfaces, likely
due to dissolution of the 3D printed ABS mask in contact with the NMP solvent. As a result, NREL
reformulated the inks with acetone rather than NMP and 3D printed new masks using Ultem, a melt-
processable polymer with good stability to acetone. With the new inks and masks, a third series of patterned
separators was sprayed. No residue was observed, but due to the change of solvent, is was observed that
different spraying parameters must be used. A fourth coating series is planned.
NREL completed the hardware modifications on the coating station to enable forward gravure printing
(making the drive motor reversible, reversing the mounting of the doctor blade, and machining new roll
brackets and bearing seats), received the two patterned cylinders, and installed one in preparation for
demonstration of gravure printing. Figure 107 shows the new hardware configuration for forward gravure and
Figure 108 shows the two patterned gravure cylinders.
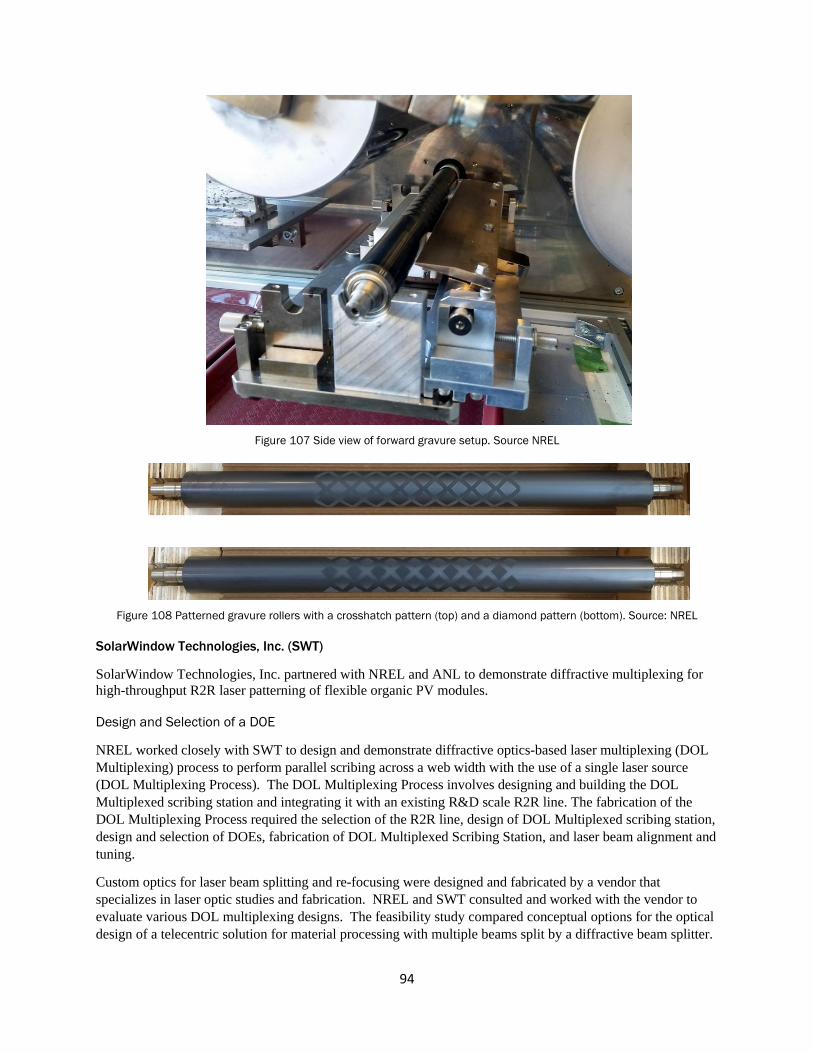
94
Figure 107 Side view of forward gravure setup. Source NREL
Figure 108 Patterned gravure rollers with a crosshatch pattern (top) and a diamond pattern (bottom). Source: NREL
SolarWindow Technologies, Inc. (SWT)
SolarWindow Technologies, Inc. partnered with NREL and ANL to demonstrate diffractive multiplexing for
high-throughput R2R laser patterning of flexible organic PV modules.
Design and Selection of a DOE
NREL worked closely with SWT to design and demonstrate diffractive optics-based laser multiplexing (DOL
Multiplexing) process to perform parallel scribing across a web width with the use of a single laser source
(DOL Multiplexing Process). The DOL Multiplexing Process involves designing and building the DOL
Multiplexed scribing station and integrating it with an existing R&D scale R2R line. The fabrication of the
DOL Multiplexing Process required the selection of the R2R line, design of DOL Multiplexed scribing station,
design and selection of DOEs, fabrication of DOL Multiplexed Scribing Station, and laser beam alignment and
tuning.
Custom optics for laser beam splitting and re-focusing were designed and fabricated by a vendor that
specializes in laser optic studies and fabrication. NREL and SWT consulted and worked with the vendor to
evaluate various DOL multiplexing designs. The feasibility study compared conceptual options for the optical
design of a telecentric solution for material processing with multiple beams split by a diffractive beam splitter.

95
Each concept adhered to NREL and SWT specified parameters for wavelength, laser beam spots at the sample
plane, beam spot separation distance, and 95% uniformity between spots. Based on the vendor study and
recommendations, the most promising concept was chosen, and a more-detailed simulation of that optical
configuration for the DOE was performed. SWT purchased custom diffractive optics and additional optical
components (mirrors, power meter, etc.) and materials required for the fabrication of a laser safety enclosure.
Design of the DOL Multiplexing Scribing Station
The NREL R2R metrology line was selected as the system for integration of the R2R DOL multiplex scribing
technology. Figure 109 (a) shows the metrology line and the planned locations of the laser system and the area
on the web line where materials processing/scribing will occur. A laser safety enclosure was required by the
NREL Environmental Health and Safety group to be integrated onto R2R metrology line as shown in Figure
109 (b). In addition to anodizing the entire enclosure to reduce light reflections, a custom ventilation system
was installed into the enclosure that removes any material ablated from the web by the laser during the
scribing. The laser ablation ventilation system was required by NREL Environmental Health and Safety to
obtain “readiness verification” approval to operate the system.
(a)

96
(b)
Figure 109 (a) Annotated photo showing the proposed location of the laser and multiplexing optics on NREL diagnostic R2R
line; (b) the R2R system for the multi-spot DOE scribing with the finished safety enclosure. Source: NREL
One task for the SWT CRADA project was the optimization of PV module coatings and subsequent scribing.
Initially, about six meters of material with several layers, or thin films, of SWT device architecture were
coated on NREL’s R2R coating webline. The first film coating applied to the 12-in wide polyethylene
terephthalate web was the bottom transparent electrode. This was followed by coating the photoactive and
charge-selective layers of the solar cell stack that was 6-in. wide. This resulted in about two meters of each
combination of layers—layer 1 for P1 scribing, layers 1+2+3 for P2 scribing and layers 1+2 for diagnostic
purposes.
The P1 laser scribe was dialed in using the single-scribe laser system in NREL’s Process Development and
Integration Laboratory (PDIL). The laser power and the platform speed were adjusted to give a range of power
densities. The stage was moved between 0.3 – 3.0 meter/min. Initial results showed a sizeable “processing
window” that yields electrically-isolated P1 scribes that varied from low power and slow speeds to higher
power and fast speeds. Next, the P2 scribing was dialed in to isolate the photoactive layers while preserving
and exposing the bottom conductor.
Custom optics holders were fabricated for all optical components. A diffractive optic beam splitter is utilized
to form uniform laser spots. A collimation lens parallelizes the beams, and each beam goes through a focusing
lens to direct the split beams onto the surface of the R2R web sample. The laser ablation ventilation system is
located below the web scribing to remove material ablated during scribing. To maintain compliance with
NREL Environmental Health and Safety Regulations, all alignments, power adjustments, and scribing
adjustments are monitored and performed remotely using a “web cam” within the enclosure while the laser is
operating.
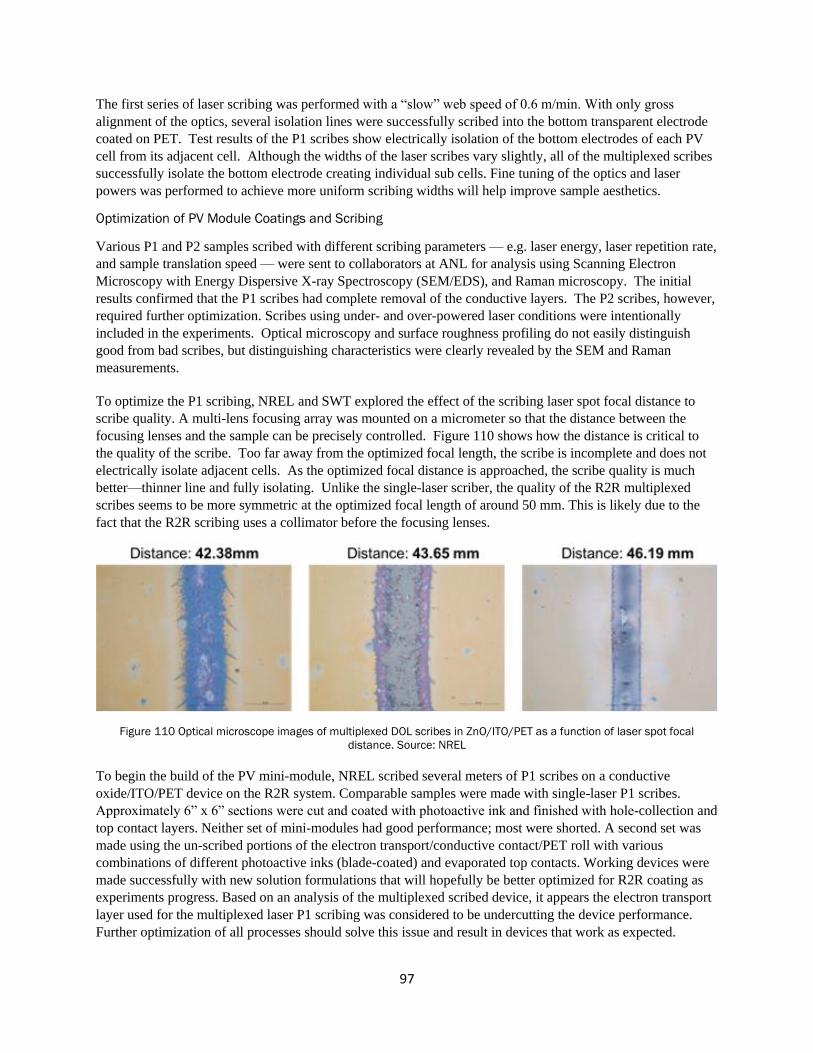
97
The first series of laser scribing was performed with a “slow” web speed of 0.6 m/min. With only gross
alignment of the optics, several isolation lines were successfully scribed into the bottom transparent electrode
coated on PET. Test results of the P1 scribes show electrically isolation of the bottom electrodes of each PV
cell from its adjacent cell. Although the widths of the laser scribes vary slightly, all of the multiplexed scribes
successfully isolate the bottom electrode creating individual sub cells. Fine tuning of the optics and laser
powers was performed to achieve more uniform scribing widths will help improve sample aesthetics.
Optimization of PV Module Coatings and Scribing
Various P1 and P2 samples scribed with different scribing parameters — e.g. laser energy, laser repetition rate,
and sample translation speed — were sent to collaborators at ANL for analysis using Scanning Electron
Microscopy with Energy Dispersive X-ray Spectroscopy (SEM/EDS), and Raman microscopy. The initial
results confirmed that the P1 scribes had complete removal of the conductive layers. The P2 scribes, however,
required further optimization. Scribes using under- and over-powered laser conditions were intentionally
included in the experiments. Optical microscopy and surface roughness profiling do not easily distinguish
good from bad scribes, but distinguishing characteristics were clearly revealed by the SEM and Raman
measurements.
To optimize the P1 scribing, NREL and SWT explored the effect of the scribing laser spot focal distance to
scribe quality. A multi-lens focusing array was mounted on a micrometer so that the distance between the
focusing lenses and the sample can be precisely controlled. Figure 110 shows how the distance is critical to
the quality of the scribe. Too far away from the optimized focal length, the scribe is incomplete and does not
electrically isolate adjacent cells. As the optimized focal distance is approached, the scribe quality is much
better—thinner line and fully isolating. Unlike the single-laser scriber, the quality of the R2R multiplexed
scribes seems to be more symmetric at the optimized focal length of around 50 mm. This is likely due to the
fact that the R2R scribing uses a collimator before the focusing lenses.
Figure 110 Optical microscope images of multiplexed DOL scribes in ZnO/ITO/PET as a function of laser spot focal
distance. Source: NREL
To begin the build of the PV mini-module, NREL scribed several meters of P1 scribes on a conductive
oxide/ITO/PET device on the R2R system. Comparable samples were made with single-laser P1 scribes.
Approximately 6” x 6” sections were cut and coated with photoactive ink and finished with hole-collection and
top contact layers. Neither set of mini-modules had good performance; most were shorted. A second set was
made using the un-scribed portions of the electron transport/conductive contact/PET roll with various
combinations of different photoactive inks (blade-coated) and evaporated top contacts. Working devices were
made successfully with new solution formulations that will hopefully be better optimized for R2R coating as
experiments progress. Based on an analysis of the multiplexed scribed device, it appears the electron transport
layer used for the multiplexed laser P1 scribing was considered to be undercutting the device performance.
Further optimization of all processes should solve this issue and result in devices that work as expected.

98
Nel/Proton OnSite
Nel/Proton OnSite has partnered with NREL, ORNL, and ANL to conduct research on R2R manufacturing of
advanced (low loading, direct coated onto membrane) electrolysis electrodes for low-cost hydrogen
production. Ink characterization and optimization, R2R coating, advanced electrode characterization, and
metrology development capabilities at the labs will be used to support the overall goals of reducing the
manufacturing labor for the membrane electrode assembly (MEA) by a factor of 15-20 and the overall cost of
the MEA by over 60%.
In late in FY 2019, NREL, ORNL and ANL received foreign engagement approval from the DOE Office of
International Affairs (IA) and received DOE site office approval for their roles in the project. As a result of IA
coordination with FCTO, a joint work statement was coordinated with the FCTO Technology Manager and
Proton OnSite. FCTO approved the final joint work statement for the CRADA which completed all approvals
needed. The CRADA was executed in September 2019 and NREL has received project funds from ORNL.
Project initiation is waiting receipt of project funds at ANL which is expected in the first quarter of FY 2020.
Workforce Development/Educational Outreach
The Collaboration laboratories integrated students and postdocs into all aspects of the program and ensured
proper education and dissemination of information from the program thereby promoting a workforce with skill
sets that support research, development and modeling for manufacturing technologies and processes. The R2R
AMM DOE Laboratory Collaboration expanded its workforce development and educational outreach efforts in
FY 2019 for the laboratories and universities listed in Table IX.
Table IX Educational Development at the Collaboration Laboratories
Collaboration Lab Post Doc/Student/Intern University
LBNL Eongyu Yi, Post Doc
Zhi Huang, Post Doc
University of Michigan
Purdue University
ANL Patrick Yang, Associate
Devon Powers, Post Doc
Stony Brook University
Vanderbilt University
ORNL
Ritu Sahore, Post Doc
Anand Parejiya, PhD Student
TJ Christensen, Tech Intern
Erin Creel, Post Doc
Cornell University
University of Tennessee Bredesen Center
N/A
University of California Berkeley
NREL
Sunil Khandavalli, Post Doc
Min Wang, Post Doc
Brian Green, Undergraduate
Derek, Jacobson, Graduate Intern
Mason Liu, Graduate Intern
Radhika Iyer, Undergraduate Intern
Janghoon Park, Post Doc
Nisha Sharma, Post Doc
University of Massachusetts Amherst
Case Western Reserve University
University of Denver
Colorado School of Mines
University of Colorado at Boulder
Northern Illinois University
University of Massachusetts Amherst
Western University (Ontario)
SNL
Chris Wall, Graduate Student
Ben Wall, Graduate Student
Lena Hoover, Graduate Student
Sebastian Valencia, Graduate Student
New Mexico Tech (Albuquerque, NM)
New Mexico Tech (Socorro, NM)
University of New Mexico
Georgia Institute of Technology
Total 20 18 different universities

99
Results of the research will be published and where applicable intellectual property be filed in collaboration
with all contributing laboratories. The collaboration continued to reach out to industry to ensure technology
transfer.
Challenges/Contingencies
The R2R AMM DOE Laboratory Collaboration built upon successes from the previous three-year consortium
efforts in battery and fuel cell materials research and development. Because the FY 2020 projects began late in
FY 2019 due to receipt of funding and there were new starts for early stage research program, the biggest
programmatic challenge was to meet established and approved milestones after a delayed start. Task schedules
and milestone dates were adjusted contingent on receipt of funding. An example of a technical challenge that
occurred was having to redevelop the freeze tape casting parameters because of the different surface chemistry
of the new LLZO powder. The contingency was that the industry partner was able to develop and share
samples of LLZO dense layers which LBNL and ORNL used for producing bi-layers to mitigate project
delays. Typical challenges occur when additional time is needed to get test equipment operational (downtime)
or to receive new equipment and materials from vendors as well as negotiating contractual agreements which
creates delays. One technical challenge that occurred in FY 2019 was that a coating layer in a PV stack—the
ZnO electron transport layer—had unexpectedly poor performance. This challenge was met by developing new
ZnO precursor solution chemistry that was more reliable.
Risks and Risk Handling
Early stage research usually has higher risks for the outcome of successful technologies compared to advanced
development because of the nature of the basic science and phenomenology being investigated. Certain risks
occur when funding or materials/equipment are not readily available to begin experimentation. Table X list
some risks and their mitigation during FY 2019. When risks are identified as the project continues through FY
2021, research plans will be modified, and the appropriate risk management procedures will be used to
eliminate or mitigate those risks in accordance with the DOE Risk Management Guide [4].
Table X Risks Identified During FY 2019 and Their Mitigation
Risks Frequency Impact Rank Mitigation
Novel R2R Deposition System Based on Electrospinning Technology and Advanced / In Situ Characterization and
Testing Capabilities
The vendor generates a
delay in R2R module for ES
system
low
Risk may cause delays in
R2R ES machine
customization and recipe
implementation
high
(1) Communicate with the
vendor in a biweekly basis to
ensure the tool lead time
(2) Start tool customization
design in advance to reduce
the overall customization time
Colloidal Chemistry, Surfactant Research, Slurry Processing, Deposition and Drying and Curing and Curing
Methods
FY19 funding delay of four
months will put timing for
initiating experiments in
jeopardy
high Four months of milestone
slippage high
Communicate the need to
receive funding to the program
sponsor

100
Physics and Methodologies for Multilayer Coatings/Deposition; Fabrication and In Situ Testing of Prototype
Components and Devices; and Novel Non-Destructive Evaluation, Quality Control and Metrology
The multi-layer slide die
fabrication and delivery
takes longer than quoted
low
Could delay FY 2019 and FY
2020 milestones related to
the slide die
low
Various sequential multi-layer
experiments can be performed
to advance knowledge prior to
receipt of the slide die. Also,
as the project duration is 3-
years, any slippage will be
accommodated during the
remainder of the project
Macroscopic Mathematical Model of the Drying of a Single Layer Generic Slurry Containing Monodisperse
Colloidal Particles, Binder, and Solvent
Accurate measurement of
the fractal dimension of
carbon black aggregations
in polymer solution of
different molecular weights
low Accuracy of slurry model will
be affected low
Obtain SEM images of the
carbon black structures and
then modify the tool in ImageJ
to get more accurate value of
the fractal dimension
In-situ visualization of
aggregates structures
during mixing by using the
new experimental setup
low Data obtained will not be
useful low
Obtain a better digital optical
microscope and then dilute
the slurry solution to improve
the visibility
Accurate tokenization of
sentences and
identification of materials
entries
low Accuracy of synthesis model
will be affected low
Develop heuristic algorithms to
treat most common cases of
incorrect tokenization and
then create the algorithm for
words/sentence tokenization
in scientific texts
Validated Continuum-Scale Models to Accelerate Design and Scale-Up of Simultaneous Die Coating Process
Technology
Receipt of data from other
labs to create/improve
continuum models
low
Delay in providing models to
other labs for developing
their R2R processes
low
Communicate with the other
labs on a regular basis to
receive the data as soon as
available
CRADA Projects
The industry partner is
unable to provide
commercial LLZO powder
for conducting the freeze
tape casting experiments
low
Delay in obtaining the
needed data by the end of
the agreement period.
low
Labs will purchase a new
commercially available LLZO
powder from a different vendor
Slurry formulation and freeze
tape casting parameters will
have to be adjusted for the
new powder possibly causing
unknown delay for obtaining
results

101
Project Ratings
Project performance assessments are determined through quantitative and qualitative methods in accordance
with DOE Program and Project Management for the Acquisition of Capital Assets. [5] Programs are assessed
by the following definitions: green – project is expected to meet its current performance baseline; yellow –
project is potentially at risk of not meeting an element of the current performance baseline; red – project is
highly at risk of requiring a change to the performance baseline by the Acquisition Executive or is not being
executed within the acquisition strategy and Project Execution Plan.
Table XI provides the project overview for each laboratory and the overall program performance for FY 2019.
Table XI R2R AMM Laboratory Collaboration Project Ratings
ANL
Key Performance Indicator Rating
(red/green/yellow) Status/Corrective Action
Performance All performance targets were met.
Cost
Project cost was within FY 2019 budget.
Schedule
All tasks and milestones were met on schedule.
ORNL
Key Performance Indicator Rating
(red/green/yellow) Status/Corrective Action
Performance
All performance targets were met.
Cost
Project cost was within FY 2019 budget.
Schedule
All tasks and milestones were met on schedule.
NREL
Key Performance Indicator Rating
(red/green/yellow) Status/Corrective Action
Performance All performance targets were met.
Cost Project cost was within FY 2019 budget.
Schedule All tasks and milestones were met on schedule.
LBNL
Key Performance Indicator Rating
(red/green/yellow) Status/Corrective Action
Performance
All performance targets were met.
Cost
Project cost was within FY 2019 budget with carryover.

102
Schedule
All tasks and milestones were met on schedule.
SNL
Key Performance Indicator Rating
(red/green/yellow) Status/Corrective Action
Performance
All performance targets were met.
Cost
Project cost was within FY 2019 budget with carryover.
Schedule
All tasks and milestones were met on schedule.
OVERALL PROJECT
Key Performance Indicator Rating
(red/green/yellow)
Status/Corrective Action
Performance
All performance targets were met.
Cost
Project cost was within FY 2019 budget.
Schedule
All tasks and milestones were met on schedule.
Conclusions
FY 2019 was the first year of a three-year project for early stage research and development on R2R advanced
technologies in a national multi-laboratory collaboration that will deliver advances in the fundamental
understanding of R2R processing on moving webs, carriers, or other substrates and develop tools, metrology
approaches, processes, and new materials to improve yields, overall quality, processing rates and reduce cost.
Technologies under development will overcome the lack of scalability and understanding of fundamental
chemistry and materials properties demonstrated on selected key technology applications with cross-cutting
impacts. Nanofibers applicable to solid electrolytes, fuel cell electrodes and water filtration membranes were
fabricated and a prototype ES system with 56 specially-designed nozzles that enable multiple jets of
electrospun fibers to be applied on a R2R web was developed by ANL. PEMFC cathode GDE coatings of
uniform thickness were produced on the ORNL pilot slot-die coating line and a membrane electrode assembly
of the slot-die coated GDE was fabricated and tested at NREL. Cubic-phase LLZO with orders of magnitude
more conductivity was processed by ORNL using improved annealing conditions.
Multiple modeling and simulation efforts were completed in FY 2019. NREL leveraged an empirical slide die
coating window model and developed full-quadratic ink models for catalyst ink surface tension. These models
were provided to SNL for further development of multi-layer slide die continuum models. NREL also
completed a study showing a multi-region process window characterized by droplet spraying, spinning of
fibers and beads, and an unstable flow region with viscous instability in the Taylor cone. LBNL developed a
generic particle network settling model as part of its longer-term coating drying modeling efforts; however,
recognizing the deep lack of fundamental knowledge about the concentrated dispersions of interest, proposed a
set of novel experiments for probing the influence of component interactions on macroscopic dispersion
behavior. LBNL proposes to design and execute these experiments in order to obtain information that will be
incorporated into its multilayer coating drying models. SNL completed their two-layer slide coating and slot
coating models using Goma 6.0 that will allow for accelerated process development. The capillary
hydrodynamic slide-die coating model was designed using the geometry of the NREL slide die. For two-layer
103
systems, the model can predict interlayer and free surface shape at varying flowrates and web speeds focused
on minimizing flow recirculation near interlayer and preventing interlayer mixing. Additionally, models for
slot- and slide-deposition systems with accommodation for three or more simultaneous miscible layers
(multiple layers of varying rheology) were developed.
Three CRADA projects that initiated in mid-FY 2018 continued through FY 2019 with one project completing
in May 2019. One project demonstrated the feasibility of a pilot-scale freeze-casting coating and made initial
recommendations to the industry partner on how the freeze casting process could be industrially scaled. A
second project resulted in a down-selection of an improved separator material and trial operations handling the
separator in a R2R manner began at the industry partner product site. The third project selected a DOE-based
multiplexing system for R2R laser scribing that will drastically reduce up-front capital and on-going
operational costs compared to currently used laser/optics systems and will also increase process speeds over
galvanometer step-and-scan systems. Scribing experiments were initiated, and optimization of the scribing
process continued through FY 2019.
Efforts will continue for the projects that began in FY 2019 with the goal of advancing our understanding of
R2R processing for high-throughput advanced manufacturing to enable new devices and lower the cost of
existing processing routes for competitive U.S. manufacturing. The projects directly support the AMO’s Multi-
Year Program Plan challenges for the use of multilayer coating technologies applicable to flexible and
integrated electronics, separation membranes, PVs, and selective barrier materials addressing the AMO
identified targets of technologies with a 10x production capacity increase and in-line instrumentation tools to
evaluate the performance and functionality.
Key Publications
Doeff, M.M; Yi, E.; Shen, H., Chen, G.; Sofie, S. “Towards Scalable Manufacturing of Solid State Batteries”,
Presentation at the 236th meeting of the Electrochemical Society, Atlanta GA, Oct. 13-17th, 2019.
Khandavalli S.; Park, J.H., Kariuki, N.N.; Myers, D.J.; Stickel, J.J.; Hurst, K.; Neyerlin, K.C.; Ulsh, M.;
Mauger, S.A. “Rheological investigation of fuel cell catalyst inks.” Presentation at the Society of Rheology
meeting, Houston, TX; October 2018.
Khandavalli, S.; Park, J.H.; Kariuki, N.N., Myers, D.J.; Stickel, J.J.; Hurst, K.; Neyerlin, K.C. Ulsh, M.;
Mauger, S.A. 2018. “Rheological Investigation on the Microstructure of Fuel Cell Catalyst Inks”, ACS Appl.
Mater. Interfaces, Vol. 10, pp 43610−43622.
Khandavalli S., Park J.H., Kariuki N.N., Zaccarine S.F., Pylypenko S., Myers D.J., Ulsh M., Mauger S. 2019
“Investigation of the microstructure and rheology of iridium oxide catalyst inks for low-temperature
PEMWE.” ACS Appl Mater Interfaces, 11 (48) 45068-45079.
Wang, M.; Park, J.H.; Kabir, S.; Neyerlin, K.C.; Kariuki, N.N; Lv, H.; Stamenkovic, V.R; Myers, D.J.; Ulsh,
M.; Mauger, S.A. 2019. “The Impact of Catalyst Ink Dispersing Methodology on Fuel Cell Performance Using
In-situ X-ray Scattering”, ACS Appl. Energy Mater. July 26, 2019, 2, 9, 6417-6427
https://doi.org/10.1021/acsaem.9b01037
Wood, III, D.L; M. Wood, Z. Du, J. Li, I. Belharouak, R. Rao, and S. Solberg, “Materials Processing and
Performance Challenges of Thick Electrodes for High Energy Density Li-Ion Batteries,” 70th Southeastern
Regional Meeting of the American Chemical Society (SERMACS 2018), Augusta, Georgia, October 31 –
November 3, 2018. (Invited)
Wood, III, D.L.; M. Wood, J. Li, Z. Du, C. Daniel, A. Dunlop, B. Polzin, A. Jansen, G. Krumdick, P.
Rupnowski, M. Ulsh, F, Ma, V. Battaglia, and R. Prasher, “Advanced Processing Considerations for Lithium-
104
Ion and Polymer Electrolyte Fuel Cell Electrode Coatings,” AIMCAL R2R Conference, Phoenix, Arizona,
October 28-31, 2018. (Invited)
References
1. Howell, D. “Vehicle Technologies Office Electrochemical Energy Storage R&D Overview”. (2017), The
2017 U.S. Department of Energy (DOE) Fuel Cell Technologies Office (FCTO) and Vehicle Technologies
Office (VTO) Annual Merit Review and Peer Evaluation Meeting (AMR), Washington, DC, June 6, 2017.
https://www.energy.gov/sites/prod/files/2017/06/f34/es000_howell_2017_o.pdf
2. Garland, N. “Manufacturing R&D Program Area - Plenary Presentation”. (2017), The 2017 U.S.
Department of Energy (DOE) Fuel Cell Technologies Office (FCTO) and Vehicle Technologies Office
(VTO) Annual Merit Review and Peer Evaluation Meeting (AMR), Washington, DC, June 6, 2017.
https://www.hydrogen.energy.gov/pdfs/review17/mn000_garland_2017_o.pdf
3. Macknick, J.; Newmark, R.; Heath, G.; Hallett, KC. “A Review of Operational Water Consumption and
Withdrawal Factors for Electricity Generating Technologies”. (2011) Technical Report NREL/TP-6A20-
50900, March 2011. https://www.nrel.gov/docs/fy11osti/50900.pdf
4. DOE Risk Management Guide, DOE G 413.3-7A 1-12-2011, updated October 22, 2015
https://www.energy.gov/projectmanagement/directives
5. DOE Program and Project Management for the Acquisition of Capital Assets, DOE 413.3B updated April
12, 2018. https://www.energy.gov/projectmanagement/directives

105