Disclaimer - figeac-aero.com · Disclaimer Before reading these ... Figeac Aero, a pure aerospace...
32
1
Transcript of Disclaimer - figeac-aero.com · Disclaimer Before reading these ... Figeac Aero, a pure aerospace...

1
2
Disclaimer
Before reading these presentation slides (the "Presentation"), you acknowledge that you are fully informed of the limitations and qualifications below:
This document was prepared by Figeac Aéro (the "Company") exclusively for information purposes.
The information and opinions contained in the document could be updated, complemented, revised, reviewed and amended, and this information could be substantially modified. The Company is not subject to any obligation to update the information contained in this document, and any opinions expressed therein can be amended without prior notice.
The information contained in this document was not submitted for an independent review. No declaration, guarantee or commitment, express or implied, has been made and cannot be used as the basis of a claim pertaining to the exactitude, exhaustiveness or adequate nature of the information or opinions contained in this document. The Company, its advisors or its representatives accept no responsibility for the use of this document or its content, or in relation to this document in any way.
This document contains information regarding the Company's markets, as well as its competitive positions, notably the size of its markets. The information it contains is drawn from a number of sources or from estimates made by the Company itself. Investors cannot base their investment decisions on this information.
Some of the information contained in this document includes forward-looking statements. These statements are not guarantees as regards the future performance of the Company. This forward-looking information relates to the Company's future outlook, to its evolution and to its commercial strategy, and is based on the analysis of forecasts of future results and estimations of amounts which cannot yet be determined.
By its nature, forward-looking information entails risks and uncertainties because it relates to events and depends on circumstances which might or might not occur in the future. The Company draws your attention to the fact that the forward-looking statements do not constitute under any circumstance a
guarantee of its future performance and that of its actual financial position, results and cash flow, as well as changes in the sector in which the Company operates, might differ significantly from those proposed or suggested in the forward-looking statements contained in this document. Moreover, even if the Company's financial position, results and cash flow or the changes in the sector in which the Company operates were consistent with the forward-looking information contained in this document, said results or said changes might not be reliable indications of the Company's future results or changes. The Company does not commit in any way to updating or meeting the expectations or estimates of analysts, or to making public any correction or any forward-looking information in order to reflect an event or occurrence taking place after the date on which this document was published.
This presentation does not represent an offer of sale or subscription, or a request for a purchase or subscription order for securities in France, the United States or any other country. The Company's shares, or any other marketable security, cannot be offered or sold in the United States other than after registration pursuant to the U.S. Securities Act of 1933, as amended, or in the framework of an exemption from this registration requirement. No public offering of financial securities will be made in France or abroad prior to the issuance of a prospectus visa by the French Financial Markets Authority pursuant to the provisions of Directive 2003/71/EC, as amended. The Company does not intend to make any kind of share offering in France or in another country.

FIGEAC AÉRO Group
4
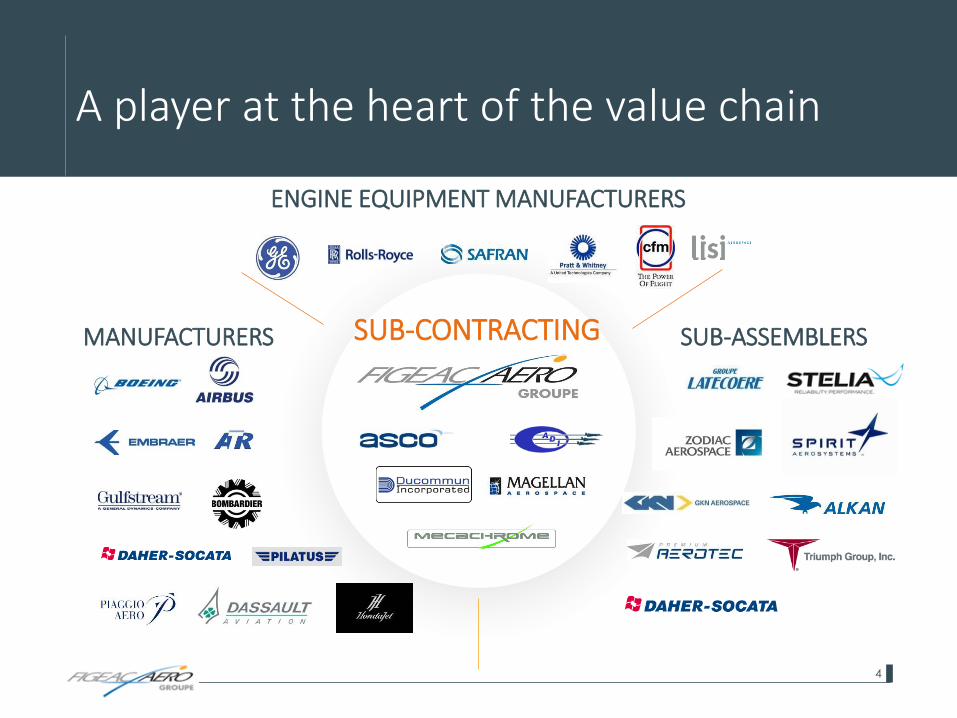
A player at the heart of the value chain
SUB-CONTRACTINGMANUFACTURERS SUB-ASSEMBLERS
ENGINE EQUIPMENT MANUFACTURERS
5
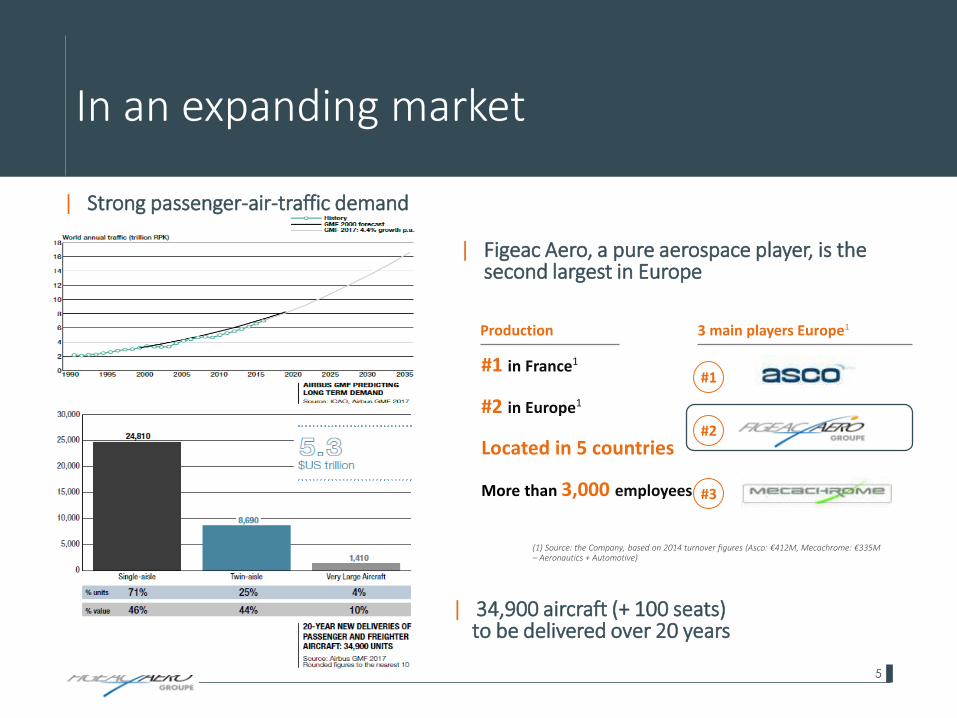
In an expanding market
| Strong passenger-air-traffic demand
| Figeac Aero, a pure aerospace player, is the second largest in Europe
(1) Source: the Company, based on 2014 turnover figures (Asco: €412M, Mecachrome: €335M – Aeronautics + Automotive)
3 main players Europe1
#1
#2
#3
#1 in France1
#2 in Europe1
Located in 5 countries
More than 3,000 employees
Production
| 34,900 aircraft (+ 100 seats) to be delivered over 20 years
6
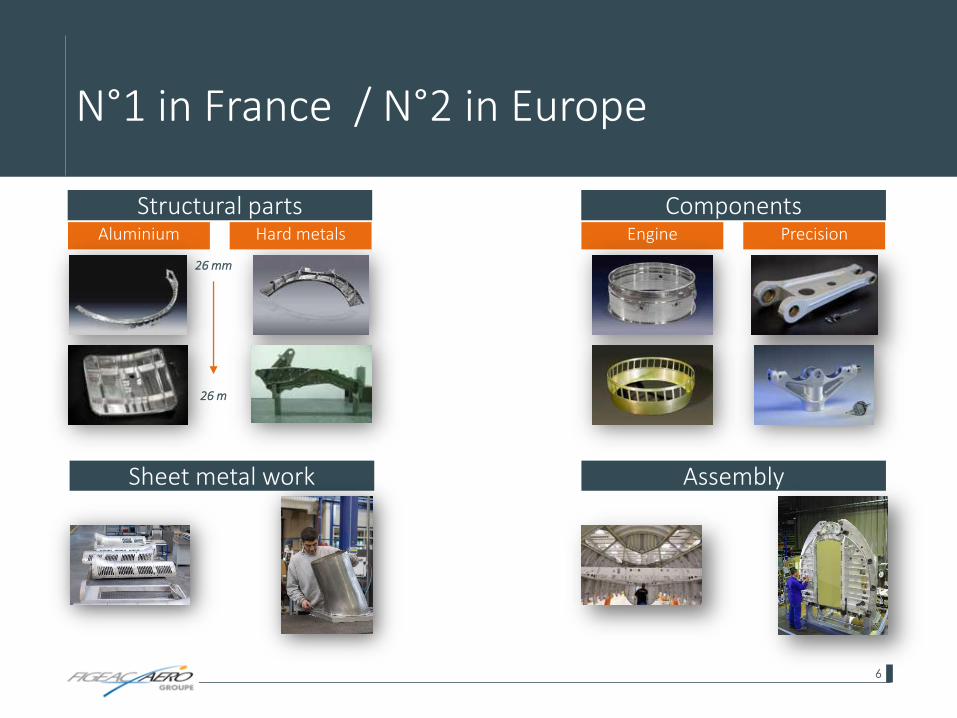
N°1 in France / N°2 in Europe
Structural partsAluminium Hard metals
26 mm
26 m
ComponentsEngine Precision
AssemblySheet metal work

7
Awarded the "Factory of the Future Showcase" label
| Dedicated to the LEAP contract (Long Term Agreement valued at USD 500 million)
| €37 million investment in a 7,500 m², robotised and fully connected plant delivering optimised costs and reducing cycles from 10 weeks to 10 days
8
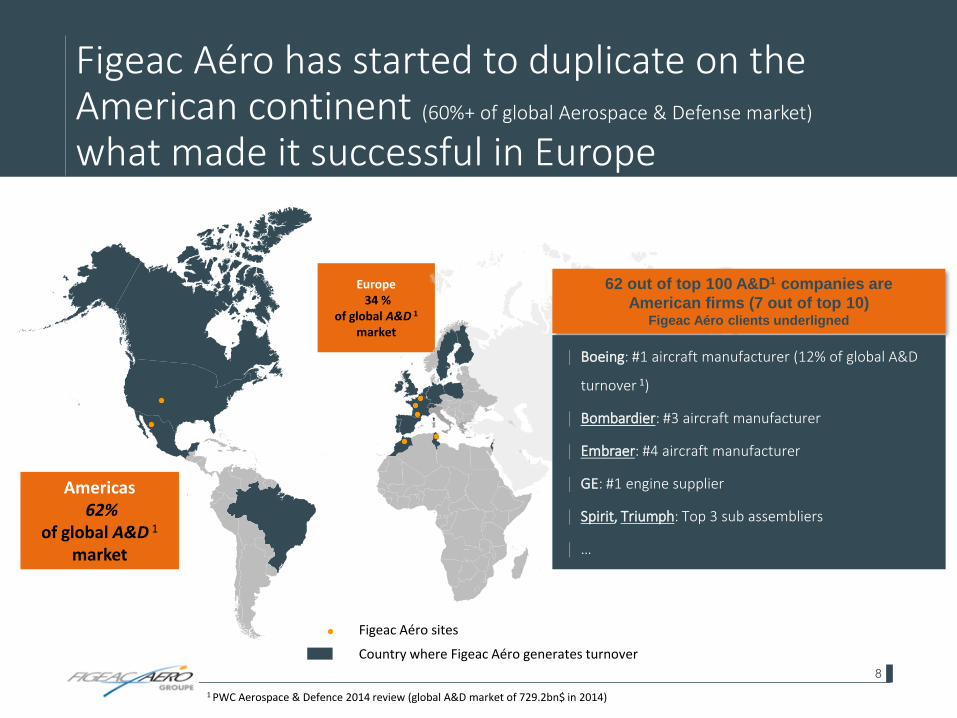
Figeac Aéro has started to duplicate on the American continent (60%+ of global Aerospace & Defense market)
what made it successful in Europe
Figeac Aéro sites
Country where Figeac Aéro generates turnover
1 PWC Aerospace & Defence 2014 review (global A&D market of 729.2bn$ in 2014)
Americas62%
of global A&D 1
market
Europe34 %
of global A&D 1
market
62 out of top 100 A&D1 companies are
American firms (7 out of top 10) Figeac Aéro clients underligned
│ Boeing: #1 aircraft manufacturer (12% of global A&D
turnover 1)
│ Bombardier: #3 aircraft manufacturer
│ Embraer: #4 aircraft manufacturer
│ GE: #1 engine supplier
│ Spirit, Triumph: Top 3 sub assembliers
│ …

2016/2017 highlights
10
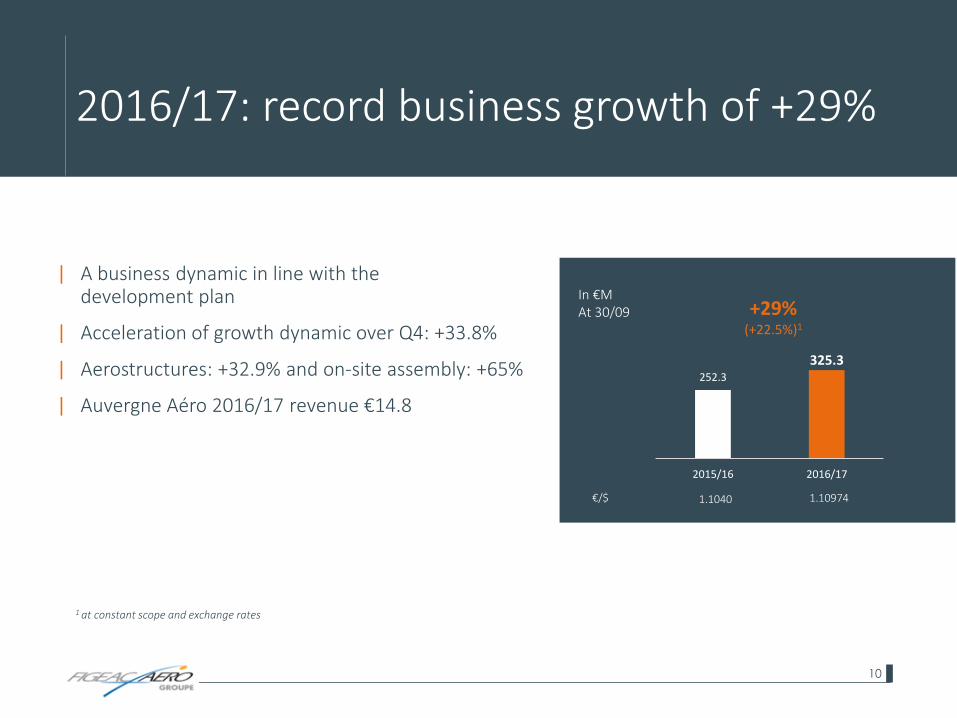
| A business dynamic in line with the development plan
| Acceleration of growth dynamic over Q4: +33.8%
| Aerostructures: +32.9% and on-site assembly: +65%
| Auvergne Aéro 2016/17 revenue €14.8
2016/17: record business growth of +29%
€/$
252.3
325.3
2015/16 2016/17
1.1040 1.10974
+29%(+22.5%)1
In €MAt 30/09
1 at constant scope and exchange rates

11
TIER 1 SUPPLIERS
A good commercial dynamic
Production of titanium structural engine parts
Delivery
│ 2017: first parts
│ 2022: full capacity
| A contract valued at US$16M
BOEING 777X
| 1 "Long-term agreement" contract
Complete production of aerospace parts > up to 10 metres long
12
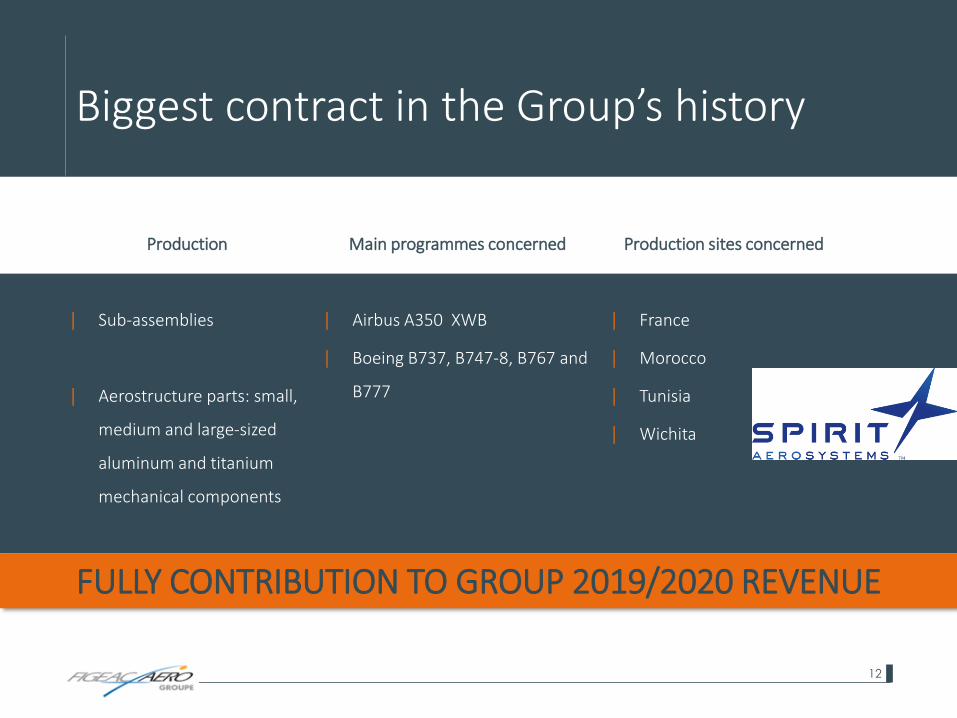
Biggest contract in the Group’s history
Production
│ Sub-assemblies
│ Aerostructure parts: small,
medium and large-sized
aluminum and titanium
mechanical components
Main programmes concerned
│ Airbus A350 XWB
│ Boeing B737, B747-8, B767 and
B777
Production sites concerned
│ France
│ Morocco
│ Tunisia
│ Wichita
FULLY CONTRIBUTION TO GROUP 2019/2020 REVENUE

13
Boost capacity production in Morocco
Acquisition of Auvergne Aéro Group
Reinforcement in best cost zone Mutualisation of clients
Capacity-building More ambitious work-packages
Addressable market expansion from €15bn to €20bn
Expansion of new opportunities – Airbus Helicopters/AVIC
(China)
Acquisition of proven know-how in forming activities and metal sheet engineering
Synergies for public tenders combining machining and metal
sheets work
CURRENTLY BECOMING THE EUROPEAN LEADER IN AEROSPACE SUB-CONTRACTING

14
The keys to growth
Renewing the top management team and taking over 97% of its employees
Reorganisation of production with synergies among certain business units
Investment of €5M over the next 3 years
Support for a Best Cost site already under operation and profitable with integrated surface treatment
Streamlining of purchases and production costs
Auvergne Aéro benefits from the Group's commercial dynamic
Outlook and strategy
16
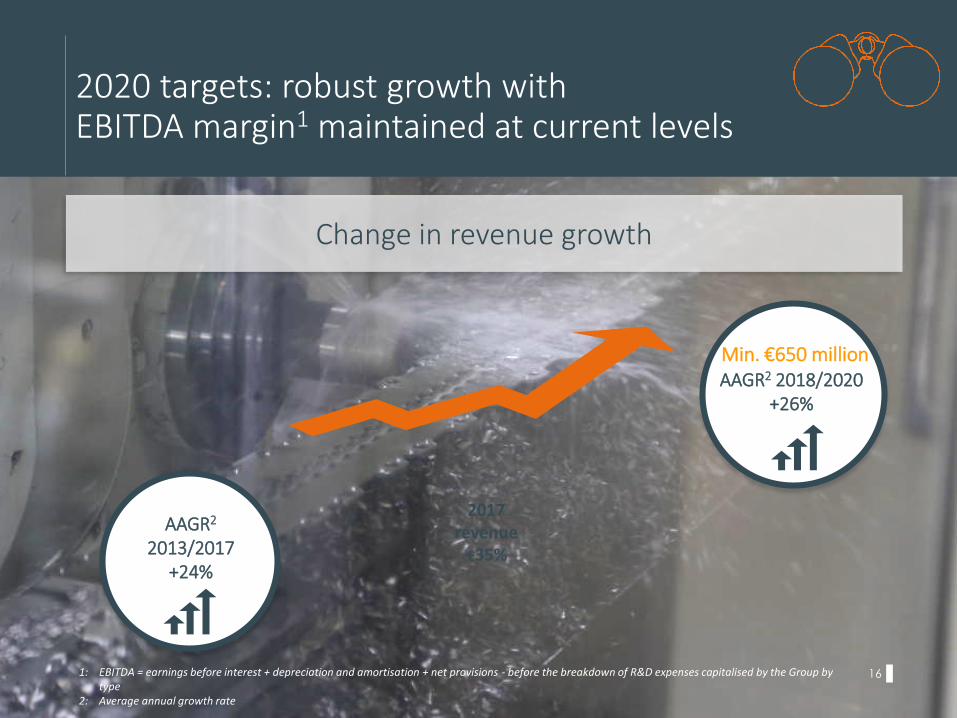
2020 targets: robust growth with EBITDA margin1 maintained at current levels
1: EBITDA = earnings before interest + depreciation and amortisation + net provisions - before the breakdown of R&D expenses capitalised by the Group by type
2: Average annual growth rate
AAGR2 2018/2020 +26%
AAGR2
2013/2017 +24%
2017 revenue
+35%
Min. €650 million
Change in revenue growth
17
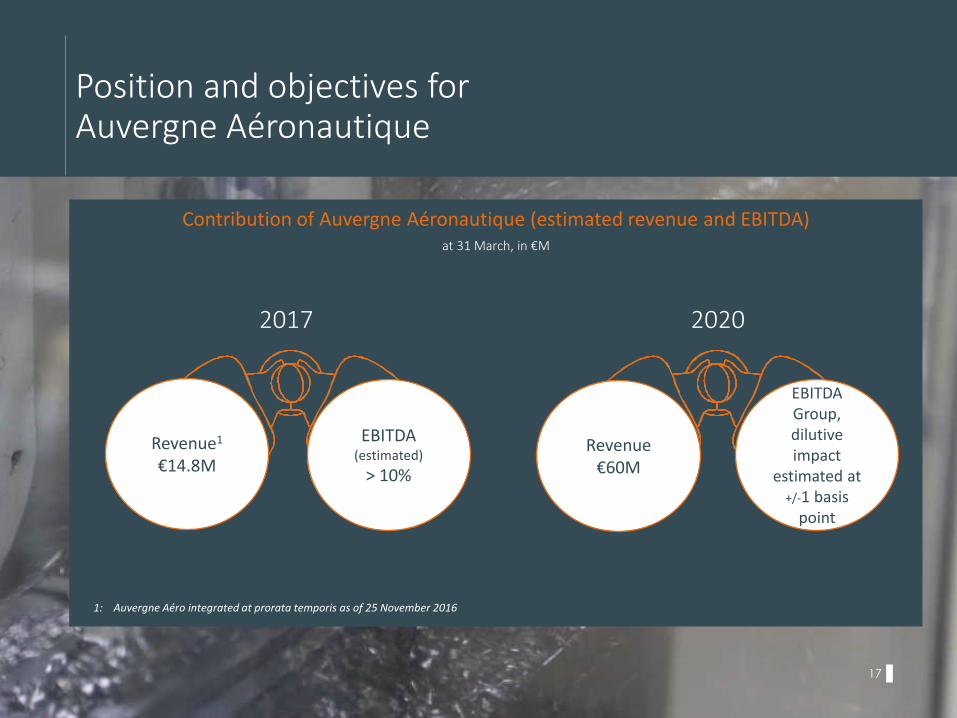
Position and objectives for Auvergne Aéronautique
1: Auvergne Aéro integrated at prorata temporis as of 25 November 2016
EBITDA(estimated)
> 10%
Contribution of Auvergne Aéronautique (estimated revenue and EBITDA)at 31 March, in €M
Revenue1
€14.8M
EBITDAGroup, dilutive impact
estimated at +/-1 basis
point
Revenue€60M
2017 2020

18
Drivers to improve cash flow
WCR improvement of €5.4 million/year from 2018
Industrial partnership with Bodycote plc for thermal treatment and welding operations
WCR improvement of 1.5 to 2 weeks of revenue from 2018
Insourcing of surface treatment function
WCR improvement of €5 million at full capacity
Set-up of the new integrated plant dedicated to LEAP housing units
TARGET: POSITIVE FREE CASH FLOW IN 2019
WCR improvement across all BLs equivalent to 1 week of revenue from 2017
New Business Line for the A380
19
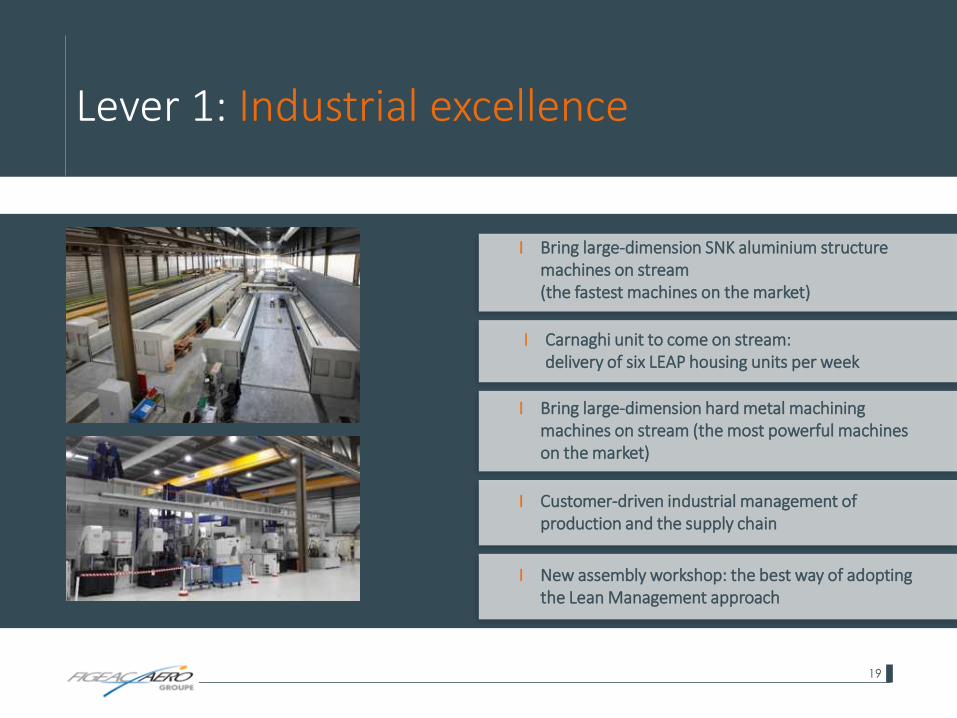
Lever 1: Industrial excellence
I Carnaghi unit to come on stream: delivery of six LEAP housing units per week
I Bring large-dimension SNK aluminium structure machines on stream (the fastest machines on the market)
I Bring large-dimension hard metal machining machines on stream (the most powerful machines on the market)
I Customer-driven industrial management of production and the supply chain
I New assembly workshop: the best way of adopting the Lean Management approach
20
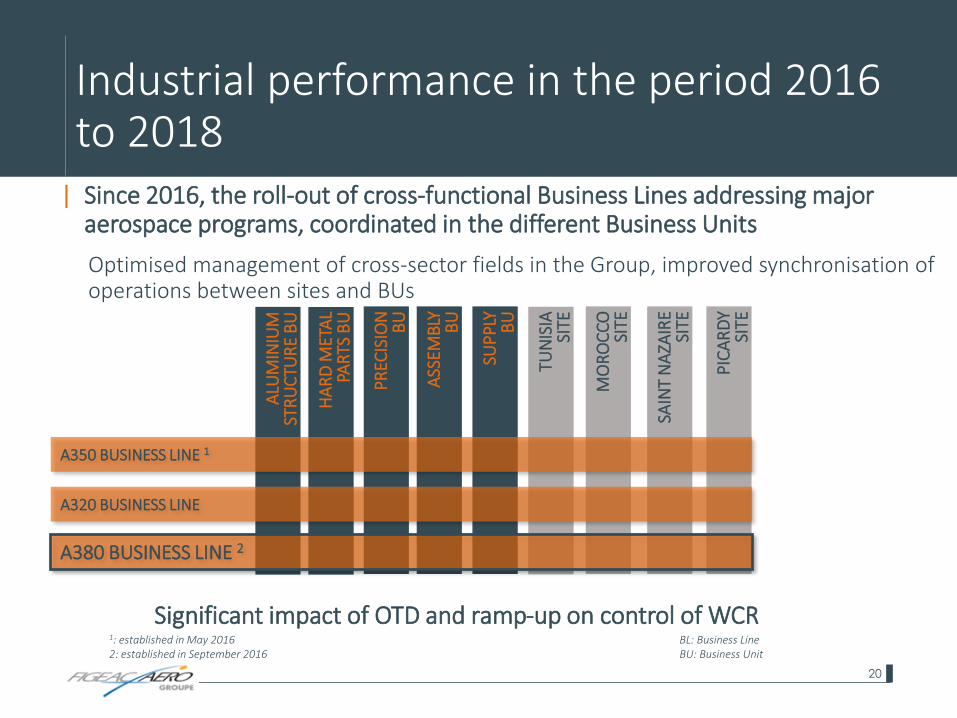
Industrial performance in the period 2016 to 2018
| Since 2016, the roll-out of cross-functional Business Lines addressing major aerospace programs, coordinated in the different Business Units
Optimised management of cross-sector fields in the Group, improved synchronisation of operations between sites and BUs
ALU
MIN
IUM
ST
RU
CTU
RE
BU
HA
RD
MET
AL
PAR
TS B
U
PR
ECIS
ION
B
U
ASS
EMB
LY
BU
SUP
PLY
BU
TUN
ISIA
SI
TE
MO
RO
CC
O
SITE
SAIN
T N
AZA
IRE
SITE
PIC
AR
DY
SITE
A350 BUSINESS LINE 1
A320 BUSINESS LINE
1: established in May 20162: established in September 2016
Significant impact of OTD and ramp-up on control of WCRBL: Business Line BU: Business Unit
A380 BUSINESS LINE 2
21
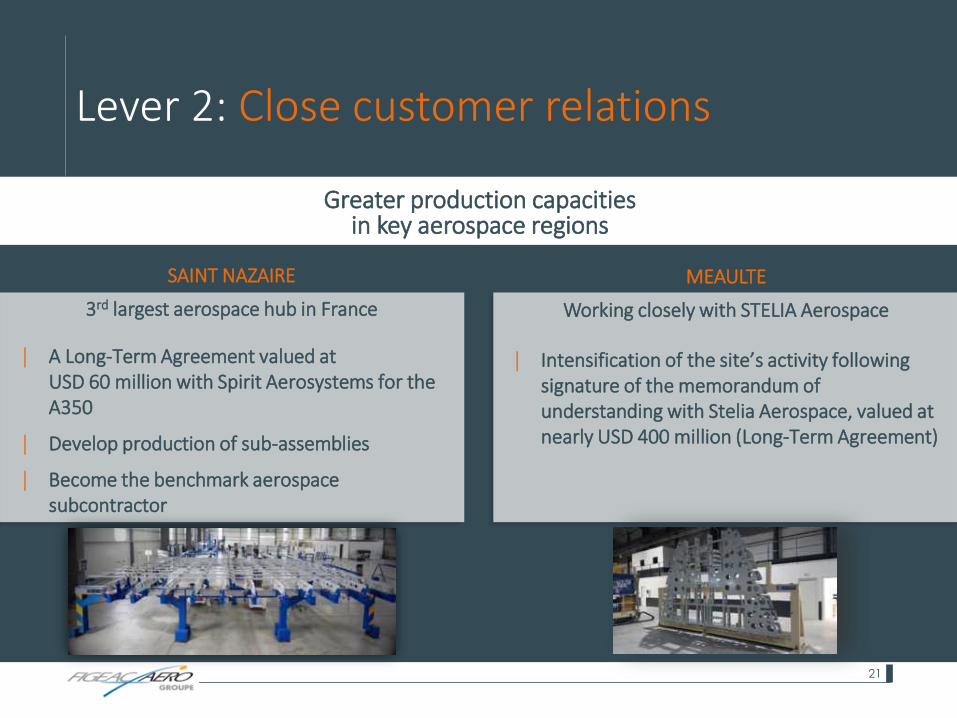
Lever 2: Close customer relations
Greater production capacitiesin key aerospace regions
SAINT NAZAIRE
3rd largest aerospace hub in France
│ A Long-Term Agreement valued at USD 60 million with Spirit Aerosystems for the A350
│ Develop production of sub-assemblies
│ Become the benchmark aerospace subcontractor
MEAULTE
Working closely with STELIA Aerospace
│ Intensification of the site’s activity following signature of the memorandum of understanding with Stelia Aerospace, valued at nearly USD 400 million (Long-Term Agreement)
22
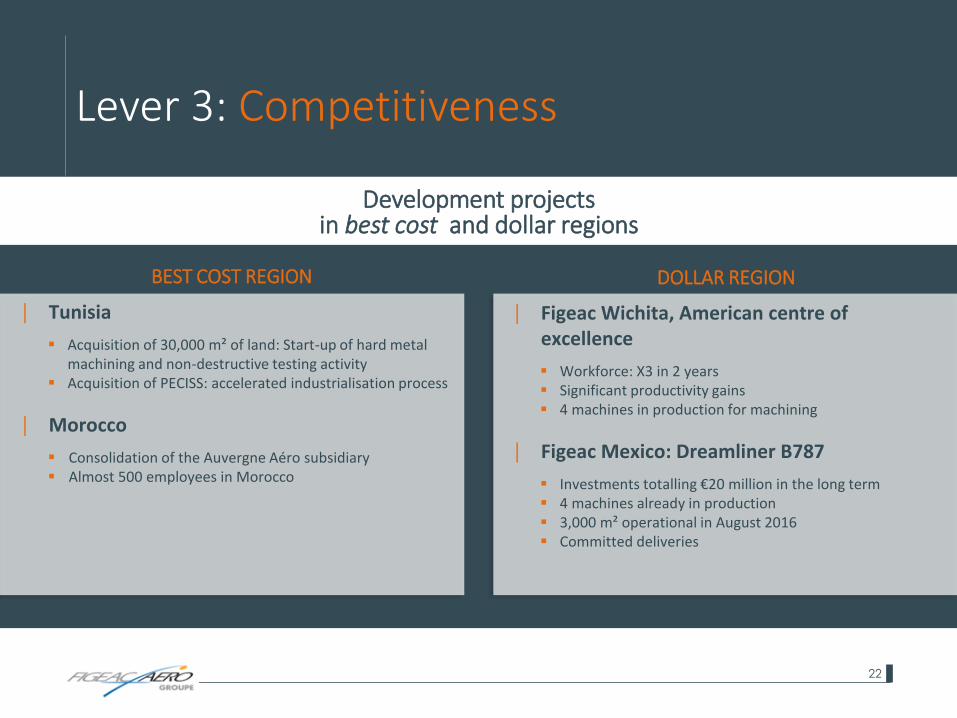
Lever 3: Competitiveness
Development projects in best cost and dollar regions
BEST COST REGION
│ Tunisia
▪ Acquisition of 30,000 m² of land: Start-up of hard metal machining and non-destructive testing activity
▪ Acquisition of PECISS: accelerated industrialisation process
│ Morocco
▪ Consolidation of the Auvergne Aéro subsidiary▪ Almost 500 employees in Morocco
DOLLAR REGION
│ Figeac Wichita, American centre of excellence
▪ Workforce: X3 in 2 years▪ Significant productivity gains▪ 4 machines in production for machining
│ Figeac Mexico: Dreamliner B787
▪ Investments totalling €20 million in the long term▪ 4 machines already in production▪ 3,000 m² operational in August 2016▪ Committed deliveries

First-half 2016/2017 results
Financial statements approved by the Board of Directors' meeting on 23 December 2016 A limited review of these financial statements has been conducted by the Statutory Auditors

24
H1 2016/2017: Highlights
| A new period of growth• H1 2016/2017 revenue up 23% (up 24% at constant
exchange rates)• Business volume reflects the slowdown in the production
rate (A350, A380 and 7X)
| Profitability remains high, with an EBITDA margin1 of 23%, or €33 million, despite:• An unfavourable base effect in the US zone due to non-
recurring billing• Activity in Morocco in start-up phase• An oil crisis impact for our MTI subsidiary• An adverse foreign exchange impact of 0.5 pt• A negative one-time adjustment of €2.8 million related to
the revision of margin on completion
1 EBITDA = current operating income + depreciation and amortisation + net provisions -before the breakdown of R&D expenses capitalised by the Group by type
14.1 16.422.9
30.9 33
H1 12/13 H1 13/14 H1 14/15 H1 15/16 H1 16/17
Change in H1 EBITDA1 - In € millions
€/$ 1.256 1.31 1.348 1.109 1.123
63.8 74.2100.8
118.9146.2
H1 12/13 H1 13/14 H1 14/15 H1 15/16 H1 16/17
Change in H1 Revenue - In € millions
€/$ 1.256 1.31 1.348 1.109 1.123
X2.3
X2.3
25
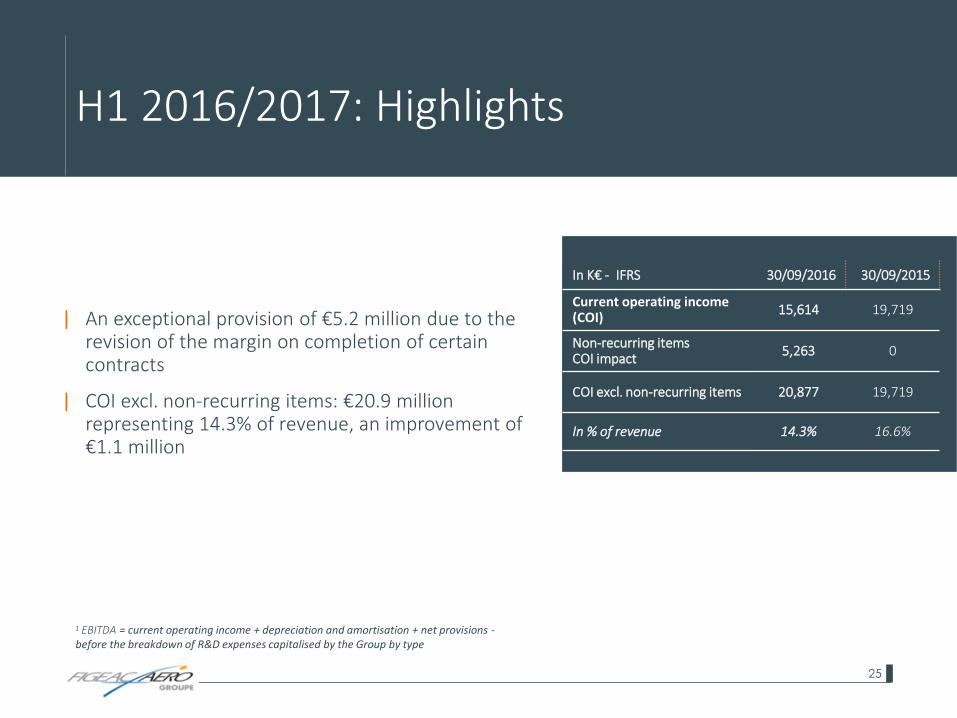
H1 2016/2017: Highlights
| An exceptional provision of €5.2 million due to the revision of the margin on completion of certain contracts
| COI excl. non-recurring items: €20.9 million representing 14.3% of revenue, an improvement of€1.1 million
1 EBITDA = current operating income + depreciation and amortisation + net provisions -before the breakdown of R&D expenses capitalised by the Group by type
In K€ - IFRS 30/09/2016 30/09/2015
Current operating income (COI)
15,614 19,719
Non-recurring items COI impact
5,263 0
COI excl. non-recurring items 20,877 19,719
In % of revenue 14.3% 16.6%
26
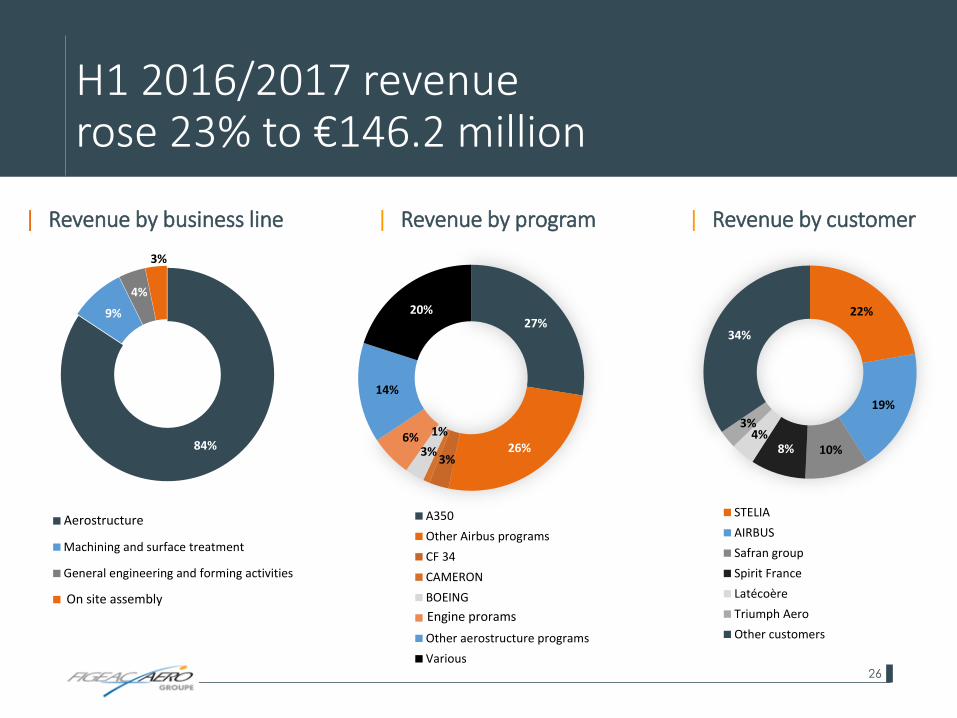
H1 2016/2017 revenue rose 23% to €146.2 million
84%
9%
4%
3%
Aerostructures
Machining and surface treatment
General engineering and forming activities
Assembly on site
| Revenue by business line
27%
26%3%
1%
3%6%
14%
20%
A350
Other Airbus programs
CF 34
CAMERON
BOEING
Engines program
Other aerostructure programs
Various
| Revenue by program
22%
19%
10%8%4%
3%
34%
STELIA
AIRBUS
Safran group
Spirit France
Latécoère
Triumph Aero
Other customers
| Revenue by customer
Aerostructure
On site assemblyEngine prorams
27
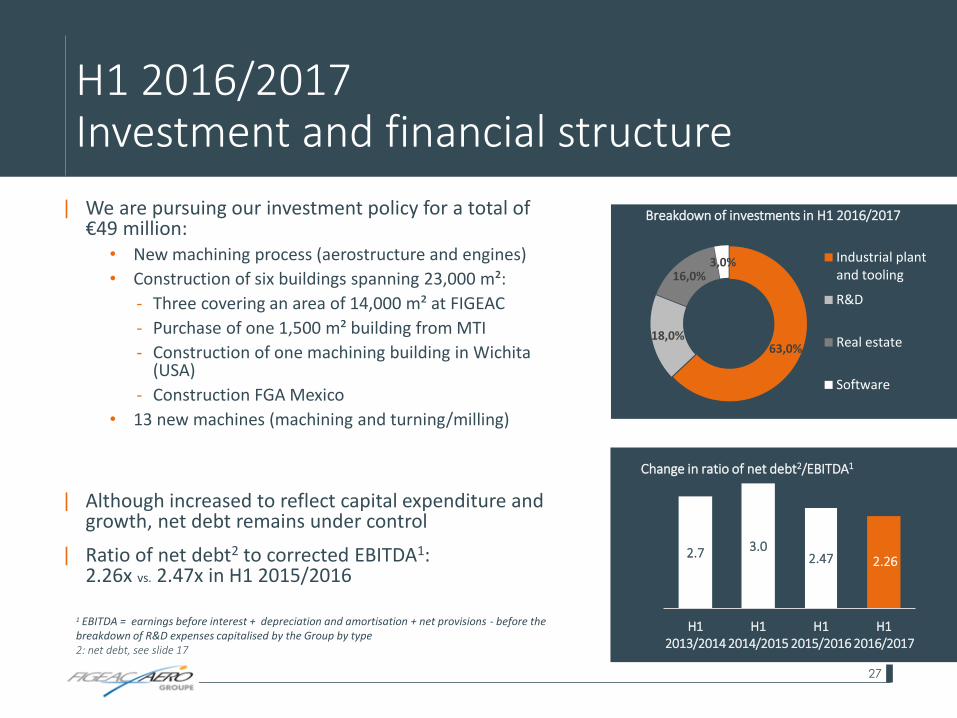
H1 2016/2017Investment and financial structure
| We are pursuing our investment policy for a total of €49 million:
• New machining process (aerostructure and engines)
• Construction of six buildings spanning 23,000 m²:
- Three covering an area of 14,000 m² at FIGEAC
- Purchase of one 1,500 m² building from MTI
- Construction of one machining building in Wichita (USA)
- Construction FGA Mexico
• 13 new machines (machining and turning/milling)
| Although increased to reflect capital expenditure and growth, net debt remains under control
| Ratio of net debt2 to corrected EBITDA1: 2.26x vs. 2.47x in H1 2015/2016
63,0%18,0%
16,0%3,0% Industrial plant
and tooling
R&D
Real estate
Software
Breakdown of investments in H1 2016/2017
2.7 3.02.47 2.26
H12013/2014
H12014/2015
H12015/2016
H12016/2017
Change in ratio of net debt2/EBITDA1
1 EBITDA = earnings before interest + depreciation and amortisation + net provisions - before the breakdown of R&D expenses capitalised by the Group by type 2: net debt, see slide 17

28
H1 2016/2017Simplified income statement
In €K - IFRS 30/09/2016 30/09/2015
Revenue1 146,234 118,930
corrected3 EBITDA2 32,996 30,869
Corrected EBITDA/revenue 22.6% 26.0%
EBITDA 31,873 30,869
EBITDA/revenue 21.8% 26.0%
Current operating income 15,614 19,719
COI/revenue 10.7% 16.6%
Operating income 15,637 19,003
Cost of net financial debt (2,062) (1,667)
Foreign exchange gains and losses (10,809) (8,462)
Unrealized gains and losses on financial instruments 16,394 22,267
Realized other financial charges and income (257) (23)
Income tax expense (5,795) (10,069)
Net income (Group share) 13,016 21,048
Net income attributable to non controlling interests 93 771 2016/2017 revenue is calculated using the average monthly EUR/USD rate of 1.1230 for the period, and 2016/2017 revenue is calculated using the average monthly EUR/USD rate of 1.109 for the period2: EBITDA = curreng income + depreciation and amortisation + net provisions3 : before the breakdown of R&D expenses capitalised by the Group by type
| The after-tax impact of foreign exchange income was +€9.2 million in H1 2015 compared to +€3.4 million in H1 2016
| The EBITDA supported a negative one-time adjustment of €2.8 million relating to the revision of margin on completion and an adverse foreign exchange impact of 0.5 pt
| . | COI excl. non-recurring items
(€5.3 million) of € 20.9 million, representing 14.3% of revenue

29
Financial structure
30/09/15 30/09/16
Shareholders' equity with mark to market (MTM)1 85,985 196,818Shareholders' equity restated for MTM 118,335 209,800
Net financial liabilities 152,817 149,099
Gearing 1.78 0.76
Gearing restated for MTM 1.29 0.71
Net debt/corrected EBITDA2 2.47 2.26
1: shareholders' equity after eliminating the impact of the value of financial instruments (restated in accordance with IAS 39 with no impact on cash)2 : Corrected EBITDA = earnings before interest + depreciation and amortisation + net provisions, before the breakdown of R&D expenses capitalised by the Group by type
| Improved gearing and net debt/corrected EBITDA2 ratio
Change in net debt
In € thousands
Net debt31/03/2016
Changein WCR
Net Invest.
Cash Flow Change in capital
Other Net debt30/09/2016
In € million0.13
-96.61
-29.26-36.25
20.3 0,13
-149.10
-7.41
30
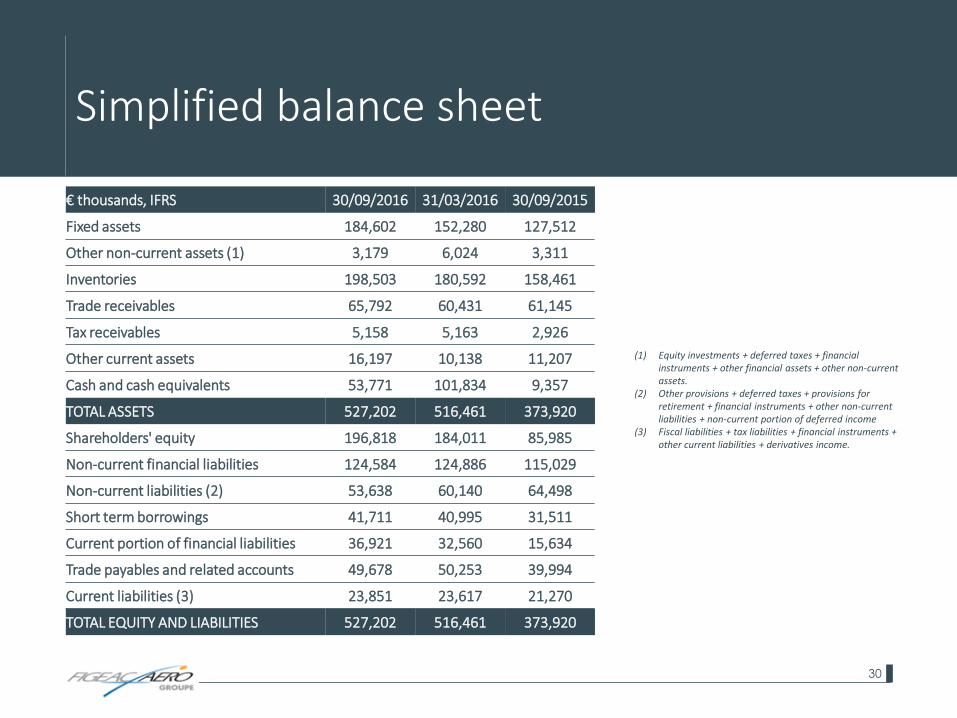
Simplified balance sheet
€ thousands, IFRS 30/09/2016 31/03/2016 30/09/2015
Fixed assets 184,602 152,280 127,512
Other non-current assets (1) 3,179 6,024 3,311
Inventories 198,503 180,592 158,461
Trade receivables 65,792 60,431 61,145
Tax receivables 5,158 5,163 2,926
Other current assets 16,197 10,138 11,207
Cash and cash equivalents 53,771 101,834 9,357
TOTAL ASSETS 527,202 516,461 373,920
Shareholders' equity 196,818 184,011 85,985
Non-current financial liabilities 124,584 124,886 115,029
Non-current liabilities (2) 53,638 60,140 64,498
Short term borrowings 41,711 40,995 31,511
Current portion of financial liabilities 36,921 32,560 15,634
Trade payables and related accounts 49,678 50,253 39,994
Current liabilities (3) 23,851 23,617 21,270
TOTAL EQUITY AND LIABILITIES 527,202 516,461 373,920
(1) Equity investments + deferred taxes + financial instruments + other financial assets + other non-current assets.
(2) Other provisions + deferred taxes + provisions for retirement + financial instruments + other non-current liabilities + non-current portion of deferred income
(3) Fiscal liabilities + tax liabilities + financial instruments + other current liabilities + derivatives income.
31
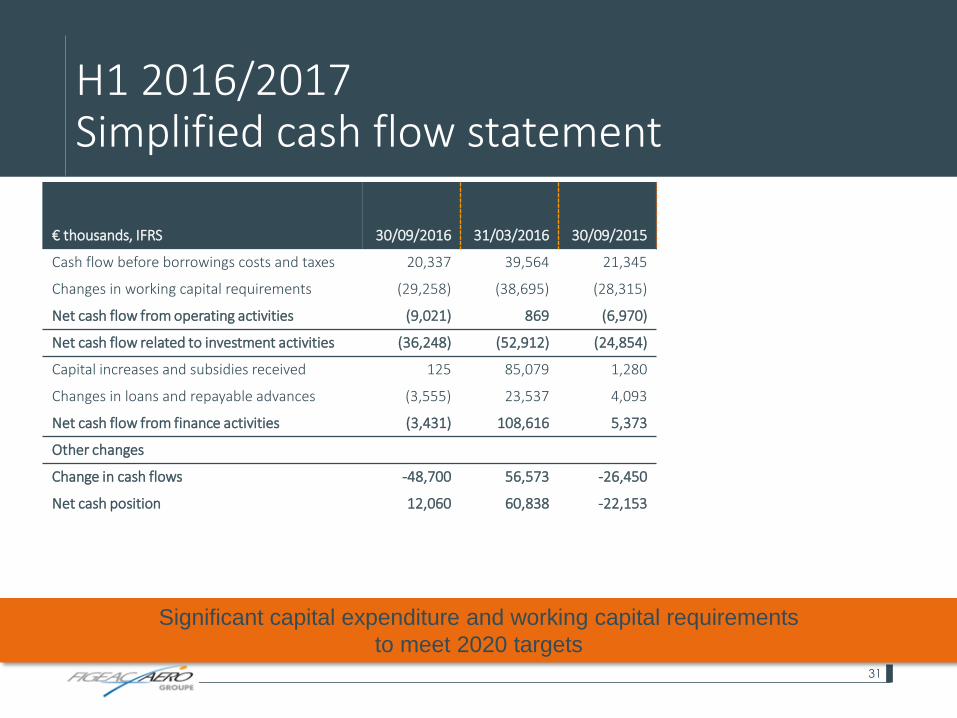
H1 2016/2017Simplified cash flow statement
Significant capital expenditure and working capital requirements
to meet 2020 targets
€ thousands, IFRS 30/09/2016 31/03/2016 30/09/2015
Cash flow before borrowings costs and taxes 20,337 39,564 21,345
Changes in working capital requirements (29,258) (38,695) (28,315)
Net cash flow from operating activities (9,021) 869 (6,970)
Net cash flow related to investment activities (36,248) (52,912) (24,854)
Capital increases and subsidies received 125 85,079 1,280
Changes in loans and repayable advances (3,555) 23,537 4,093
Net cash flow from finance activities (3,431) 108,616 5,373
Other changes
Change in cash flows -48,700 56,573 -26,450
Net cash position 12,060 60,838 -22,153
32
Aiguille industrial park
46100 FIGEAC
FRANCE
Telephone: +33 (0)5 65 34 52 52
Fax: +33 (0)5 65 34 70 26
WWW.FIGEAC-AERO.COM