DISCLAIMER/67531/metadc715324/...Results of the laboratory scale tw:-stage precipitation work show...
27
This document was prepared in conjunction with work accomplished under Contract No. DE-AC09-76SR00001 with the U.S. Department of Energy. DISCLAIMER This report was prepared as an account of work sponsored by an agency of the United States Government. Neither the United States Government nor any agency thereof, nor any of their employees, makes any warranty, express or implied, or assumes any legal liability or responsibility for the accuracy, completeness, or usefulness of any information, apparatus, product or process disclosed, or represents that its use would not infringe privately owned rights. Reference herein to any specific commercial product, process or service by trade name, trademark, manufacturer, or otherwise does not necessarily constitute or imply its endorsement, recommendation, or favoring by the United States Government or any agency thereof. The views and opinions of authors expressed herein do not necessarily state or reflect those of the United States Government or any agency thereof. This report has been reproduced directly from the best available copy. Available for sale to the public, in paper, from: U.S. Department of Commerce, National Technical Information Service, 5285 Port Royal Road, Springfield, VA 22161, phone: (800) 553-6847, fax: (703) 605-6900, email: [email protected] online ordering: http://www.ntis.gov/ordering.htm Available electronically at http://www.doe.gov/bridge Available for a processing fee to U.S. Department of Energy and its contractors, in paper, from: U.S. Department of Energy, Office of Scientific and Technical Information, P.O. Box 62, Oak Ridge, TN 37831-0062, phone: (865 ) 576-8401, fax: (865) 576-5728, email: [email protected]
Transcript of DISCLAIMER/67531/metadc715324/...Results of the laboratory scale tw:-stage precipitation work show...

This document was prepared in conjunction with work accomplished under Contract No.DE-AC09-76SR00001 with the U.S. Department of Energy.
DISCLAIMER
This report was prepared as an account of work sponsored by an agency of the United States Government.Neither the United States Government nor any agency thereof, nor any of their employees, makes anywarranty, express or implied, or assumes any legal liability or responsibility for the accuracy,completeness, or usefulness of any information, apparatus, product or process disclosed, or represents thatits use would not infringe privately owned rights. Reference herein to any specific commercial product,process or service by trade name, trademark, manufacturer, or otherwise does not necessarily constitute orimply its endorsement, recommendation, or favoring by the United States Government or any agencythereof. The views and opinions of authors expressed herein do not necessarily state or reflect those of theUnited States Government or any agency thereof.
This report has been reproduced directly from the best available copy.
Available for sale to the public, in paper, from: U.S. Department of Commerce, National TechnicalInformation Service, 5285 Port Royal Road, Springfield, VA 22161, phone: (800)553-6847, fax: (703) 605-6900, email: [email protected] online ordering:http://www.ntis.gov/ordering.htm
Available electronically at http://www.doe.gov/bridge
Available for a processing fee to U.S. Department of Energy and its contractors, in paper, from: U.S.Department of Energy, Office of Scientific and Technical Information, P.O. Box 62, Oak Ridge, TN37831-0062, phone: (865 ) 576-8401, fax: (865) 576-5728, email: [email protected]

E. I.DU PONT DE NEMOURS & COMPANY!W.eo....o
ATOMIC ENERGY DIvISION
SAVANNAH RIVER LABORATORY
AIKEN, SOUTH CAROLINA 29808
(WX 810.77?.2670.TEk803.725-621? WU:AUGUSTA,GA.]
DPST-82-786
Distribution:.
Aey. xc’. /~y~.
A. A. Kishbaugh, AED-Wilm. M. W. Villemain, 221-1OHA. S. Barab, P.D. II . J. E. Dickenson, 221-HP. E. Dillon, P.D. II S. Mirahak, SRL, 773-AD. L. McIntosh~ 703-A S. D. Harris, 773-AE. O. Kiger, 703-A D. A. Orth, 773-A,J. K. Brnwn, 703-A H. D. Hanuon, 773-AG. L. Albert, 704-H R. M. Mobley, 773-AG. W. Blackburn, 704-H G. A. Burney, “773-AF. E. Lustig, 704-H L. W. Gray, ‘773-AJ. W. McClard, 704-E G. F. Molen, 773-AL. P. Fernandez, 704-F P. G. King, 773-AR. C. Bellamy, 221-1OH “K. A. Haslinger, 773-AD. J. Mahoney, 221-IOH ~*b:C. C. Robbins, 221-1OH
.
September 28, 1982
J. T. GRANAGHAN, ?iANAGERSAVANNAH RIVER PLANT JIS FILE
ATTENTION : L. M. PAPOUCHADO , SUPERINTENDENT RECORD COPYSEPARATIONSTECHNOLOGY DEPAR~NT
FLOWSREET DEVELOPMENT FOR TEE NEWNEPTDNIDM OXALATE PRECIPITATION SYSTSM
INTRODUCTION
The HB-Line facilities now under construction will uae a newtwo-stage seni-continuous precipitation system 1 to provide productversatility and to maintain consistent control over product charac-teristics. A procedure has been demonstrated that produces neptu-niuin (IV) oxalate particles that filter well and readily calcine tothe oxide. The laboratory precipitations were small scale using al/100th scale model of the new HB-Line neptunium (IV) oxalate pre-cipitation system. ,1’nis memorandum smmrizes laboratory develop-ment work and provides flowsheet guidelines for neptunium (IV)
oxalate precipitation in the new HB-Line.
. . ‘..“
DPST-82-786
Results of the laboratory scale tw:-stage precipitation workshow that neptunium (IV) oxalate and ox;.departicle size increasewith higher precipitatic,ntemperatures . For a given volubility,particle size decreased as the absolute concentrations of oxalicand nitric acid increas<?d. Large particles could be produced fromeither cationic or aniot~icprecipitation conditions. Increasing
residence time in the first stage precipitator did not signifi-cantly increase particle size. Based on these small scale testsand present product requirements, the following flowsheet guide-lines are provided to assist in start-up of the new HB-Line.
FLOWSSEET GUIDELINES
The neptunium (~) oxalate precipitations used a two-stageprecipitation system. The precipitation experiments were designedto investigate the powder characteristics of neptunium (IV) oxalateprecipitates over a wide range of process variables.
The flowsheet suggestions outlined in Table 1 are derived fromthe statistical analysis of the results of these precipitationexperiments. Table 1 shows an “optimum” flowsheet and two alternat-ive flowsheets. These are described below.
“Optimum” Flowsheet
The “optimum” flowsheet is a set of precipitation conditionswhich:
● Maximizes neptunium (IV) oxalate particle size for th@ two-stageprecipitation design.
. Minimizes the volume percent of “fines”.
o Minimizes total waste volumes.
. Maintains filtrate losses below 10 mg/1.
0 Meets design batch sizes of 1.0 kg neptunium
. Operates the two-stage precipitation system in a batch mode.
-2-
... , .
,,,
DPST-82-7S6
The advantages of the “optimum” flowsheet are maximum
neptunl~m (IV) oxalate particle size and minimum volume percentof “finzs.” These oxa?ate characteristics contribute to goodfiltration. The “opti;.:um”flowsheet minimizes waste volumes andmaintajns filtrate los:.es below 10 mg/1, thus reducing the amountof rec>cle material.
Ir.the “optimum” flowsheet, filtrate losses are minimized int,~oways. Since the second stage precipitator is maintained athigh temperature during precipitation, the slurry spends a longertime at a higher temperature where the reduction of neptunium (V)
7 ~e Presence of neptunumto neptunium (IV) is rapid and complete.(V) results in higher filtrate losses. Also, in the “optimum”flowsheet, the filtration is performed at ambient temperatureswhere the equilibrium volubility is less than 10 mg/1.
The significantfeature of the “optimum” flowsheet is thatfiltrate losses as low as 10 mg/1 can be achieved by operating thetwo-stage precipitation system in a batch mode.
The “optimum” flowsheet is determined using the statisticallysignificant factor effecis in Tables 6 through 8.
Alternate Flowsheet 1
The “Alternate Flowsheet 1“ in Table 1, is the same as the,,optimum” flowsheet except the filtration is perfomed at 60”cinstead of ambient. Filtration at 60”c will result in neptuniumlosses to the filtrate of approximately 50 to 100 mg/1 (approxi-mately 1 to 2 % losses per run) . ~is flowsheet is a semi-continuous version of the “optimum” flowsheet.
Advantages associated with “Alternate Flowsheet 1“ areincreased throughput from semi-continuous operation and reducedcycle time by elimination of a cooling cycle. me main disadvan–
tage’of this flowsheet, cowared with the “optimm” flowsheet, isthe relatively higher neptunium losses to the filtrate.
Alternate Flowsheet 2
The “Alternate Flowsheet 2“ in Table 1, maintains the secondstage precipi.=:or at ambient temperature with continuous filtrat-ion during tl,e precipitation run. Nitric acid concentrations, inthe neptuni!jm feed, of approximately 4.0 M are required to achievea rapid and cu,.plete7reduction of neptunim (V) to neptunium (IV).This flowsheet takes advantage of the lower volubility of neptunium(IV) oxalate at ambient temperatures.
-3-

—.. —- ~-.. A—— .
DPST-82-786
Potential disadvantages of “Alternate Flowsheet 2“ aredecreated particle sizes of oxalate and oxides of approximately30 to :~0% and 10 to 15% respectively. The decreased particlesizes are due to increased nitric acid concentration in theneptunium feed and lower temperature in the second stage precipi-
tator. rhe decreased particle size is based on the statisticallysignificant factor effects in Tables 6 through 8.
DISCUSSION
EXPE-NTAL METHODS
Volubility I“ests
Pure solutions of neptunium (IV) in dilute nitric acidrequired for volubility and precipitation studies were preparedby dissolving neptunium oxide obtained from H8-Line and purifyingby anion exchange .
The equilibrium volubility of neptunium oxalate in nitric/oxalic a :id solutions was determined at room temperature, 45“C, and60°C. In this procedure, neptunium oxalate was precipitated fromsolutions of various concentrations of oxalic and nitric acids.The nitric/oxalic acid solutions represented a wide range of freeoxalate ion concentrateion. After equilibration, the solutions wereanalyzed to determine the volubility of neptunium oxalate. Neptun-ium analysis were performed by standard alpha counting techniques.
Precipitation Tests
All precipitations were performed using a two stage semi-continuous precipitation systemi (see Figure 1). A series ofprecipitation experiments were used to identify the significant
process variables affecting precipitate characteristics. Responsevariables in these experiments were the neptunium oxalate and oxideparticle size distribut ions, plating in the precipitators, andextent of precipitation in the first stage precipitator. The major
process variables of interest were:
Process Variable Range
e Neptunium feed concentration to 10 - 20 gin/lthe first stage precipitator.
0 Nitric acid concentration 1 - 3.5Min the neptunium feed .
-L-
e
0
e
e
DPST-82-786
Oxalic acid concentration to 0.45 - 0.9Mthe first stage precipitator.
Temperature in the first 2 - 10 minstage precipitator .
Temperature in the second 25 - 60”cstage precipitator.
Oxalic/nitric ratio oxalic - oxalic(i.e. R~value) lean rich
Experimental flow rates for the two stage semi-continuousprecipitation system were determined (see Appendix 1) as functionsof the process variables. A two-level factorial screening design3was used to set up process parameters for the precipitationexperiments.
Neptunium Oxalate Flowsheet Development
General Background
Phase 11 of the New ~-Line Project is the new facility forthe production of neptunium oxide via oxalate precipitation/calcination. Characteristics of the oxide depend on the precursorneptunium oxalate. Primary objectives of the new two-stage semi-continuous precipitation system were to provide product versatilityand to maintain consistent control over process parameters.
Different solution conditions during precipitation influenceparticle size distributions and particle”morphologies. The two-
stage semi-continuous precipitation system (see Figure 1) wasdesigned to operate at essentially constant volubility conditions.Constant volubility maintains consistent control over solutionconditions (i.e. constant concentrateion profiles).
The neptunium (IV) oxalate development work identified process
variables which significantly affect product characteristics usingthe two-stage semi-continuous precipitation system.
Equilibrium Volubility Measurements
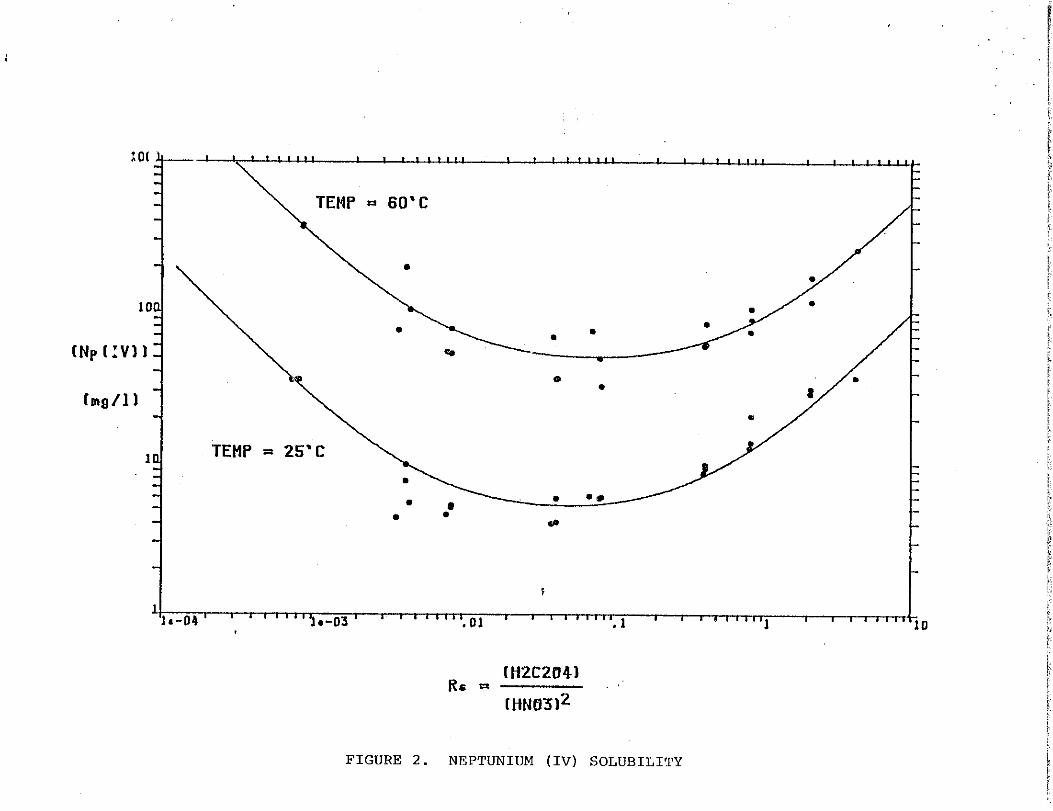
Equilibrium volubility data are shown in Figure 2. Neptunium
(IV) oxalate was precipitated from solutions of various concentra-tions of oxalic and nitric acid. The data show that neptunium (IV)
-5-
DPST-82-786
oxalate volubility is a function of the free oxalate ion concentra-tion. Equilibria between neptunium (IV) oxalate complexes account
‘“r ‘he ‘Y?ing.s:lubi’i’y”Four oxalate complexes have been
reported. ~ Mlnlmum volubility resulted when the formation ofthe highly insoluble di-oxalate complex was favored. Increasedvolubility resulted from the formation of cationic or anioniccomplexes as the free oxalate ion was varied from optimum values.
The follo,~ingcomplex equilibria have been used to develop amathematical model of the equilibrium volubility of neptuniumoxalate as a function of free
Np(c20~)2*6~0 (solid) -
Np(C204)20 + 2H+ -
Np(C204)20 + HzC204 -
oxaiate ion concentration.
NP(C20q)20 (soln) (1)
NP(C20q)+2 + H2C204 (2)
NP(C204)3-2 + 2H+ (3)
The neptunium (IV) oxalate volubility can be expressed (i.e.,mOles/liter) as;
[NP*] total = a. + al/R~ + a2R~ (4)
where R~ is proportional to the free oxalate ion concentration
and ao, al, and a2 are least square coefficients based On thevolubility model . Table 2 suuunarizesthe experimentally determinedcoefficients at 22, 45, and 60”C.
Precipitation Procedures
Neptunium (IV) oxalate was precipitated from neptunium (IV)nitrate solutions containing about IO to 25 grams of neptunium perliter in 1.0 to 3.5 M nitric acid. The neptunium feed solutioncontained 0.05 M hydrazine to stabilize the neptunium (IV) valencestate. Ascorbic acid was added before precipitation to reduce anyneptunium (V) to neptunium (IV). The prescence of neptunium (V)results in higher losses to the filtrate. The neptunium oxalateprecipitations were on a 2.0 to 5.0 gram scale.
Precipitation Screening Designs
The main use of a screening design is to efficiently identifythe few really important variables mong a larger number ofpossible variables with a minfium number of experiments. Adetailed explanation and analysis3>4 of the two-level factorial
-6-
DPST-82-786
experimental designs may be found in Appendix 2. Table 3 shows theexperimental screening design3 used for the neptunium (IV; oxalateprecipitations.
Precipitation Response Variables
The particle size distributions of neptunium oxalate and
neptunium oxide were used to evaluate the quality of precipitatesformed under a given set of conditions. Measures used to evaluatequality were: mode, median, percent of particles less than 5pm,and percent of particles greater than 20um. Particle size distri-butions were determined by Coulter Counter analysis.
The mode of the particle size distribution was used as ameasure of precipitate quality because it is not influenced byextreme observations . The mode is simply the size that occurs mostfrequently. The median is the mid-point of the particle sizedistribution and is somehwat sensitive to extreme values. The meanis very sensitive to extreme values. The percentage of particles
less than 5.O!.Im was used to evaluate the formation of fines. Thismeasure may be.useful regarding filtration characteristics of theoxalate.
The extent of plating in the precipitators was simply noted asnone, light or heavy. This was a qualitative observation.
Vessel Agitation
A series of agitation tests were performed on the l/100thscale model precipitation system. These tests involved observationof NaOH/HN03 neutralization reactions using colored indicators.The rate of color change in the precipitation system is limited bymixing kinetics and not neutralization kinetics . The neutraliza-
tion reactions are very fast. Bulk mixing times of less than5 seconds were typical in the first and second stage precipitationvessels.
Three bladed marine8 “tYPe Impellers were used in both vessels.Tip speeds of the agitators In the first and second stage precipi-tators were the same as tip speeds used in previous neptunium (IV)oxalate work.7 One inch and three inch diameter marine typeimpellers were used in the first and second stage precipitatorsrespectively.
-7-

DPST-82-786
PRECIPITATION SESULTS
Effect of Temperature
Table 4 shows data obtained in the nsptunium (IV) oxalate
precipitation experiments. me particle ;ize is strongly influ-enced by the temperature during precipitation. Larger cxalate
particles were obtained when both precipitators were at the highertemperature. The higher precipitation temperatures provided better
particle Srowth and reduced amount of fines (i.e., the percent ofmaterial less than 5.0~). This effect is shown in Table 7.Particle sizes were routinely between 25w and 401im.
When both precipitators were at room temperature, the oxaiateparticle sizes were typically less than 16~.
When the precipitators were operated at different temperaturesthe results varied. When the first stage precipitator was at 60gCand the second stage at ambient, the oxalate particle sizes variedbetween 15 and 25pm. When the first stage precipitator was atambient and the second stage at 60”C the oxalate particle sizesvaried between 20 and 30um.
The rate of reduction of neptunium (V) to neptunium (IV)increases at higher temperatures .7
Effect of Nitric Acid Concentrateion
Neptunium (IV) oxalate particle size decreases with high
nitric acid concentration in the neptunium (IV) feed stream. Thiseffect is statistically significant as shown in Table 6. Nitricacid concentration ranged from 1.0 to 3.5 M in these tests.
The lower limit of 2.0 M nitric acid in the neptunium feedgiven in the recommended flowsheet is to prevent preciuit ation ofascorbic acid degradation product in the feed during a precipita-tion run. The rate of reduction of n~ptunium (V) increases withincreasing nitric acid concentration.
Effeet of Neptunium Concentrateion
Precipitation of neptunium (IV) oxalate fruz feed solutionscontaining 10 to 25 gfl neptunium produced low filtrate losses andslurries that filtered well. The overall effect of neptuniumconcentration on particle size is not statisti.ctillysignificant.
-8-
Effect of Oxalic
Oxalic acidbetween 0.45 and
DPST-82-786.’:!
Acid Concentrateion
concentration in the fee< streams was varied0.9 M. Elating observed in the first stage pre-
cipitator decreased with tigher concentrai.ions of oxalic acid.This effect was statistically significant as shown in Table 8.
Effect of Oxalic/Nitric Ratio
Large particles can be produced from precipitation conditionson both sides of the solubil”ityminimum (i.e., cationic vs anionic.)However, cationic precipitantion conditions, i?.general, producesignificantly higher throughputs and lower tota”ivolumes for agiven design. Anionic precipitation conditions significantlyreduced the rate of precipitation in the first stage precipitatorby forming strong oxalate complexes with neptunium (see Table 8).
In is expected that the morphology of precipitates producedunder these different conditions will be different but morphologyinformation will not be available for these studies until a con-tained scanning electron microscope (SEM) if available .
Effect of Residence Time
The effect of residence time in the first stage precipitatoron particle size was not statistically significant in thesestudies. The range of first stage residence times was 2.O to 7.O
minutes.
Ascorbic Acid Degradation
Excessive degradation of ascorbic acid was observed during the
neptunium valence adjustment from neptunium (V) to neptunium (IV)at high temperatures. The ascorbic acid degradation product pre-cipitated in the feed tanks. However, the sludge which formed wassoluble in 3.0 to 4.0 M nitric acid.
It is recommended that valence adjustment of neptunium (V)to neptunium (IV) be performed just before precipitantion at roomtemperature with the nitric acid concentration at least 2.0 M.This solution will be stable to precipitation of ascorbic aciddegradation product for at least.4 hours.
-9-
DPST-82-786
CONCLUSIONS
The particle size o the neptunium (IV) oxalate precipitatesare very sensitive to pr:cipitation temperatures and concentrateionsof oxalif and nitric acids during precipitation. In general ,larser PZrt icles were pr~d!lcedwhen precipitantion temperatures inboth ves:els were at 60’c. The nitric acid concentration in theneptuniunf (IV) nitrate feed solution must be at least 2.0 M toprevent precipitation of ascorbic acid degradation product. Theeffect of residence time on particle size was not statisticallysignificant in these studies.
H. D. WONResearch Manager
by:~@D. W. LuerkensActinide Technology Div.
-1o-
DPST-82-786
REFERENCES
1.
2.
3.
4.
5.
6.
7.
8.
H. D Harmon to E. O. Kiger, “Recommended Flowsheet For NewHB-I ine Neptunium Precipitation Facilities,” DPST-80-664.
H. r!.Harmon to G. W. Wilds, “Recommended Change in FlowsheetFor New HB-Line Neptunium Precipitantion Process ,” DPST-81-291.
D. W. Marquardt, B. S. Brown, K. A. Chatto, and R. D. Snee,“Strategy of Experimental ion,” Engineering Department,E. 1. du Pent de Nemours and Co. , Inc., Wilmington, Delaware
(March 1970, Revised 1977).
M. G. Natrella, “Experimental Statistics” , Handbook 91 NationalBureau of Standards, United States Department of Comerce ,Library of Congress Catalog Number 63-60072.
V. A. Mikhailov, “Analytical Chemistry of Neptunium, ” HalstedPress, a division of John Wiley and Sons Inc., New York.
Gel Man and Others, “Complex Compounds of Transuranides, ”Acadern.,of Sciences of the USSR, Israel Program for ScientificTranslation, Jerusalem 1967.
J. A. Porter, “Precipitation of Neptunium Oxalate andCalcination to Neptunium Oxide,” DP-591 , July 1961.
W. A. Wilson to S. D. Harris, “The Design of Agitated ProcessVessels,” DPST-80-470, June 1980.
-11-

d
:0[F’ ‘\’’’’”, L
TEMP = 60’C
I oa
(Np[:V))-
frng/11
Ill TEMP = 25’ C
-1 ● .
1‘1*-04‘ ,
i*-03 “.01r
“.1 , ,“1
1-
[H2C204)R. = .,
[HNU3)2
FIGuRE 2. NEPTUNIUM (IV) VOLUBILITY
D
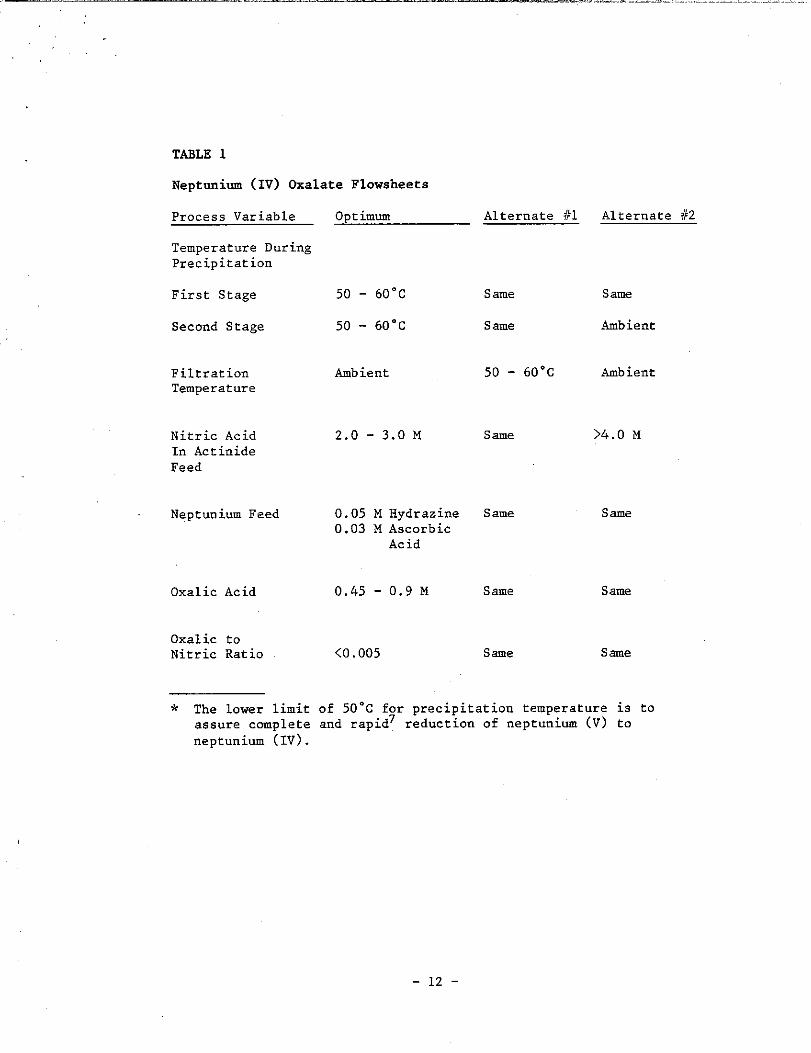
TASLE 1
Neptunium (IV) Oxalate Flowsheets
Process Variable
Temperature DuringPrecipitantion
First Stage
Second Stage
FiltrationTemperature
Nitric AcidIn ActinideFeed
Neptunium Feed
Oxalic Acid
Oxalic to
Nitric Ratio
Optimm Alternate /)1 Alternate //2
50 - 60”c
50 - 60”C
Ambient
2.0 - 3.0 M
0.05 M Hydrazine0.03 M Ascorbic
Acid
0.45 - 0.9 M
<0.005
Same
Same
50 - 60”c
Same
Same
Same
Same
Same
Ambient
Ambient
>4.0 M
Same
Sau
Sme
* The lower limit of 50”C for precipitation temperature isassure complete and rapid7 reduction of neptunium (V) to
to
neptunium ~IV).
-12-
,.
TABLE 2
Least Squares Coefficients for Volubility Data
Temperature (“C)
Coeff. 22 45 60
% 1.6 X 10⁻⁵ 5.6 X 10⁻⁵ 1.7 x 10⁻⁴
al 1.3 x 10⁻⁷ 1.4 x 10⁻⁶ 1.5 x 10⁻⁶
% 3.3 x 10⁻⁵ 2.6 X 10⁻⁴ 2.0 x 10⁻⁴
-13-

TABLE 3
Precipitation Screening Design
Run {/
R-1
R-2
R-3
R-4
R-5
R-6
R-7
R-8
R-9
R-10
R-11
R-12
R-13
R-14
R-15
R-16
Temp P1
(“C)
22
22
60
60
60
22
60
22
60
22
22
22
60
60
22
60
[NP]~~
10
20
20
10
20
10
10
10
20
10
20
20
10
20
20
10
[HN031~(M)
3.5
3.5
3.5
3.5
1.0
1.0
1.0
3.5
1.0
1.0
1.0
1.0
3.5
3.5
3.5
1.0
Res. Time
(Min)
2.0
7.0
2.0
2.0
7.0
2.0
2.0
7.0
2.0
7.0
2.0
7.0
7.0
7.0
2.0
7.0
anion
cation
anion
cation
cation
cation
cation
anion
anion
anion
cation
cation
anion
cation
anion
T?mp P2
(“c).—
fo
:.2
22
22
22
22
60
22
60
60
22
60
60
60
60
22
[H2C20,If(M)
0.9
0.45
0.9
0.45
0.45
0.45
0.9
0.9
0.45
0.45
0.9
0.9
0.45
0.9
0.45
0.9
-14-

TA8LE 4
Median and Mode for Neptunium Oxalates and Oxides
Run {/
R-1
R-2
R-3
R-4
R-5
R-6
R-7
R-8
R-9
R-10
R-11
R-12
R-13
R-14
R-15
R-16
OxalateMode(urn)
16.8
16.0
20.2
16.0
32.0
20.2
40.3
14.9
29.8
32.0
16.0
20.2
25.4
20.2
16.0
12.7
Oxide OxalateMode Median
—~(urn)
7.8 15.1
10.1 14.4
8.7 18.4
8.0 16.3
10.9 29.8
20.2 15.7
10.1 38.6
8.0 15.6
16.0 25.3
8.0 30.1
9.4 15.8
12.7 20.8
12.7 28.1
8.0 20.8
6.3 16.8
6.3 13.7
JxideMedian~
8.5
10.2
9.3
8.6
11.2
13.0
12.7
9.0
13.5
9.2
8.9
11.8
12.7
11.9
7.9
8.1
-15-
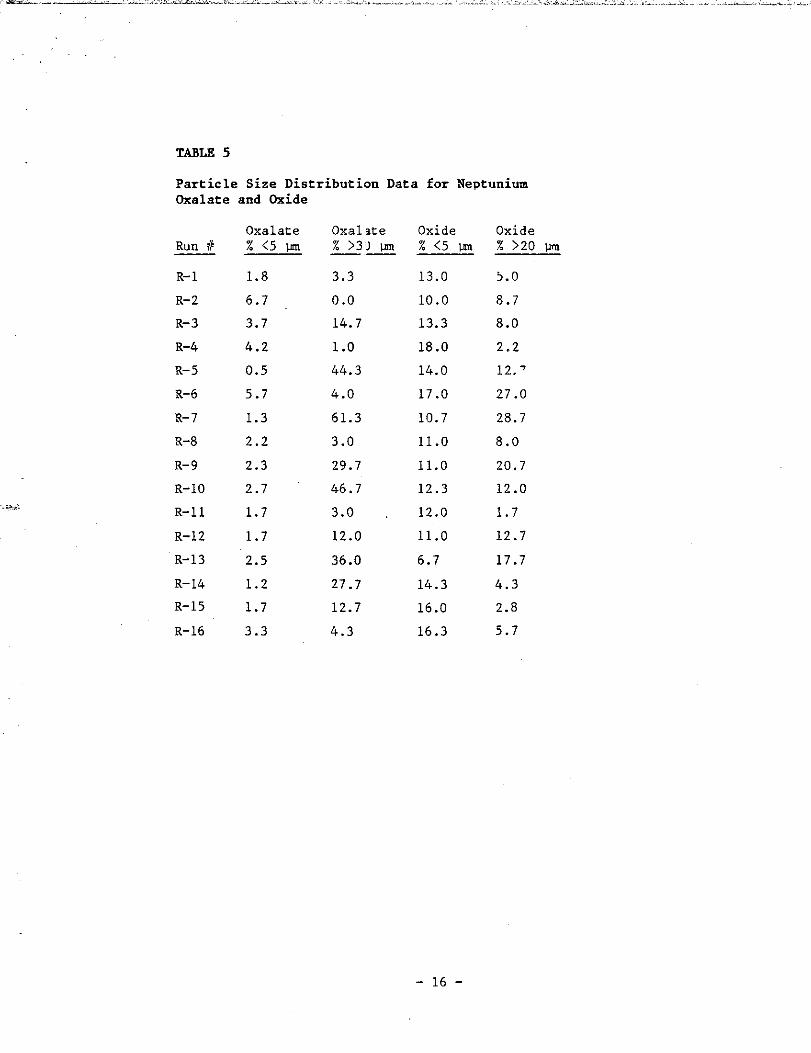
TABLE 5
Particle Size Distribution Data for NeptuniumOxalate and Oxide
R-1
R-2
R-3
R-4
R-5
R-6
R-7
R-8
R-9
R-10
R-n
R-12
R-13
R-14
R-15
R-16
Oxalate%<sm
1.8
6.7
3.7
4.2
0.5
5.7
1.3
2.2
2.3
2.7
1.7
1.7
2.5
1.2
1.7
3.3
Oxal ate% >3’Jm——
3.3
0.0
14.7
1.0
44.3
4.0
61.3
3.0
29.7
46.7
3.0
12.0
36.0
27.7
12.7
4.3
Oxidez<5m
13.0
10.0
13.3
18.0
14.0
17.0
10.7
11.0
11.0
12.3
12.0
11.0
6.7
14.3
16.0
16.3
Oxide% >20 pm
5.0
8.7
8.0
2.2
12.7
27.0
28.7
8.0
20.7
12.0
1.7
12.7
17.7
4.3
2.8
5.7
-16-
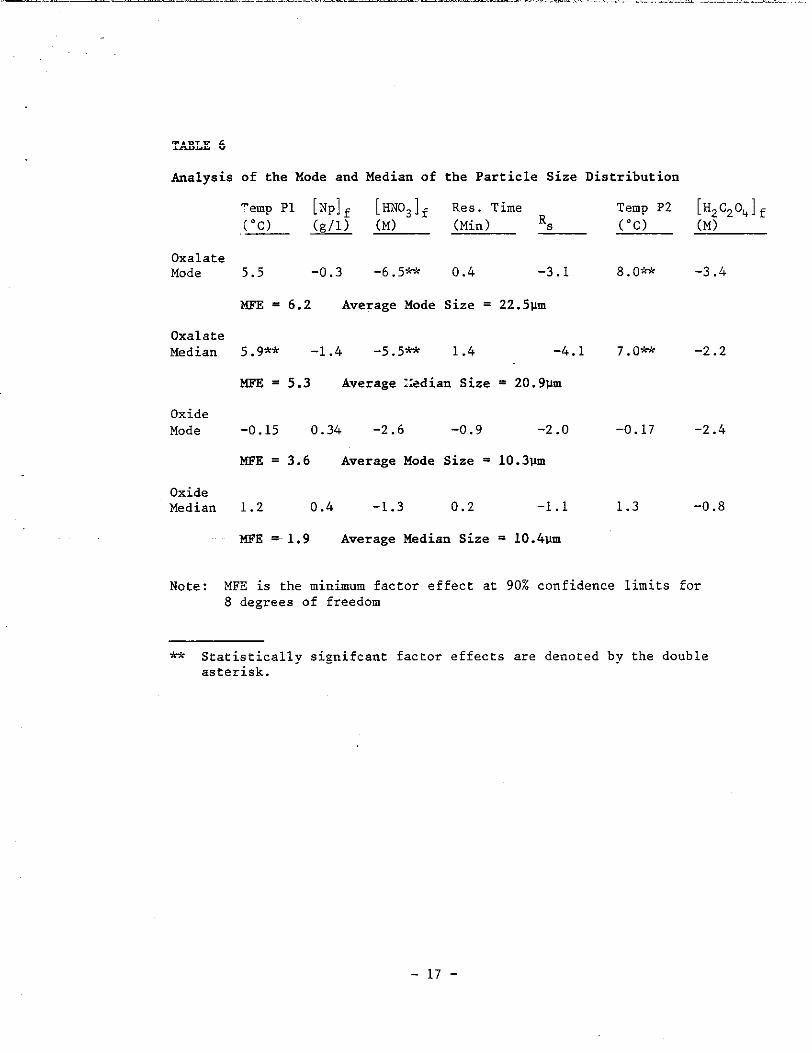
TASLE 6
Analysis
OxalateMode
Oxalate
Median
Oxide
Mode
OxideMedian
of the Mode and Median of
‘“empP1 [Np]f [HN03]f
,—w _[“c) (M)
5.5 -0.3 -6,5w.
MFE = 6.2 Average Mode
5.9** -1.4 .5.5*
the Particle Size
Res. TimeR~(Min) _
o.& -3.1
Size = 22.5vm
1.4 -4.1
MFE = 5.3 Average ::adian Size = 20.9Pm
-0.15 0.34 -2.6 -0.9 -2.0
MFE = 3.6 Average Mode Size = 10.3vm
1.2 0.4 -1.3 0.2 -1.1
MFE =1.9 Average Median Size = 10.4um
1distribution
Temp P2 [H2c20q1~(“C) (M)
7.13* -2.2
-0.17 -2.4
1.3 -0.8
Note: MFE is the minimum factor effect at 90% confidence limits for8 degrees of freedom
* Statistically significantfactor effects are denoted by the doubleasterisk.
-17-
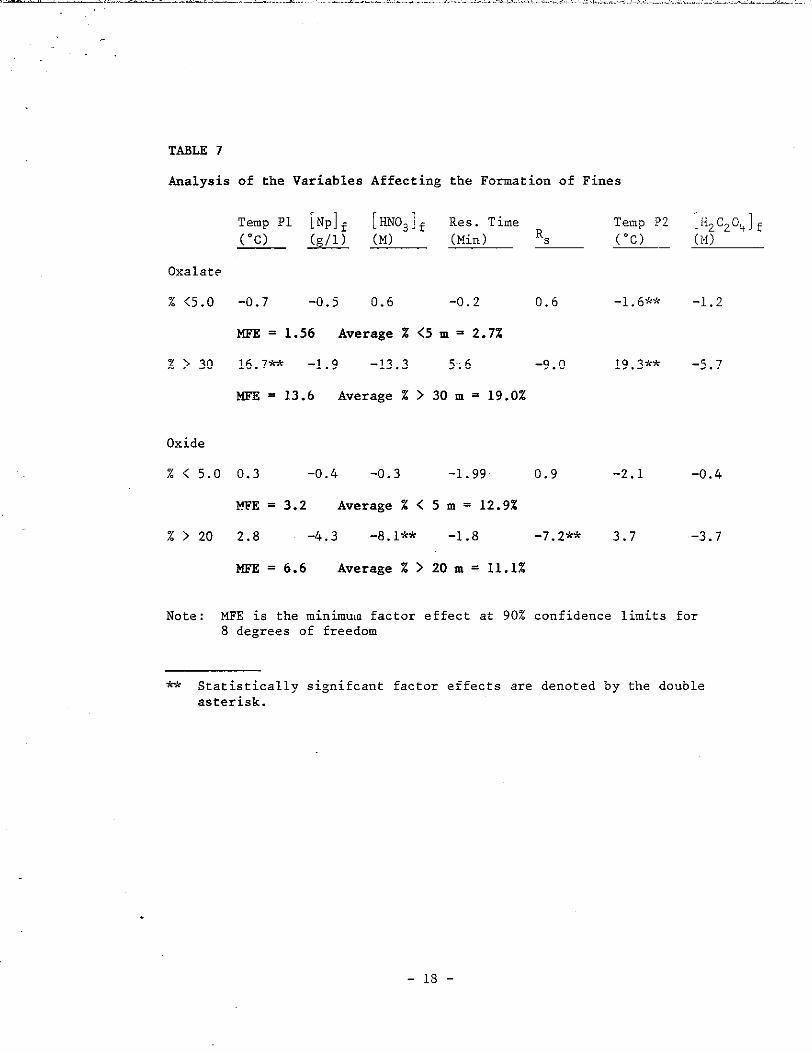
TA8LE 7
Analysis of the Variables Affecting the Formation of Fines
Temp PI [NP]f [HN03]f ~jj;)Time ~
(“C) (g/l) —(M) s
Oxalate
% <5.0 -0.7 -0.5 0.6 -0.2 0.6
m = 1.56 Average Z <5 m = 2.7Z
%>30 16.7% -1.9 -13.3
WE = 1.3.6 Average Z >
Oxide
% < 5.0 0.3 -0.4 -0.3
i.!VE= 3.2 Average Z C
% > 20 2.8 -4.3 -8.1*
m = 6.6 Average % >
5:6 -9.0
30 m = 19.0%
-1.99 0.9
5 m = 12.9%
-1.8 -7-z*
20 m = 11.1%
Temp P2
(“C)——
-1.6**
19.3**
-2.1
3.7
1[~zczoq f(M)
-1.2
-5.7
-0.4
-3.7
Note : MFE is the mini.mu,ofactor effect at 90% confidence limits for8 degrees of freedom
* Statistically significantfactor effects are denoted by the doubleasterisk.
-18-

TARLE 8
Significant Variables Affecting Plating in P1 and Reaction Kinetics
Platingin P1
ReactionKinetics
Temp PI [N,]f ~~,] f ~i;)Time ~ Temp P2
(“c) (g/l) _ —s (“C)
0.0 0.3 0.0 0.0 -0.3 -
MFE = 0.4 Average response = 0.4
.13.7* 1.5% o-8 -1.4 -1.6** 13.1
MFE = 1.48 Average glljmin loss = 1.3 glllmin
[H2C204]f(M)
-0.S**
-0.4
Note: ?.fFEis the minimum factor effect at 90% confidence limits for8 degrees of freedom
* Statistically significantfactor effects are denoted by the doubleasterisk.
-19-
DPST-82-786
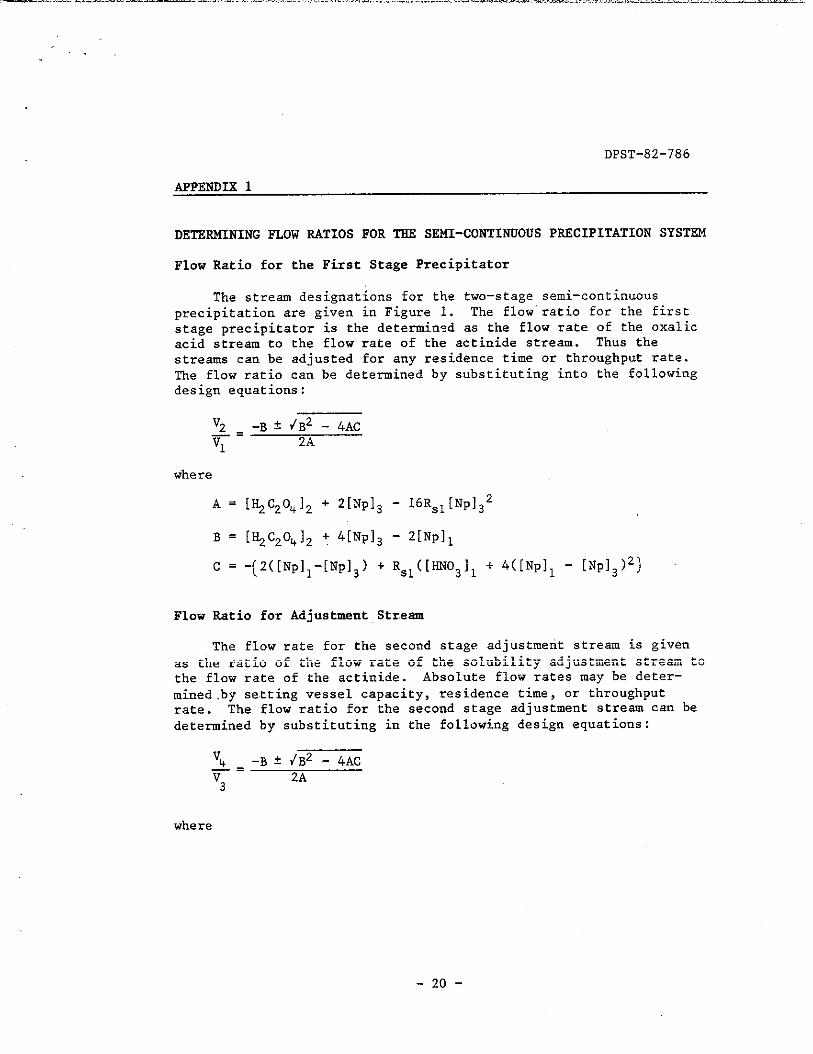
APPEND2X 1
DETERMINING FLOW RATIOS FOR TBE SEMI-CONTINUOUS PRECIPITATION SYSTEN
Flow Ratio for the First Stage Precipitator
The stream designations for the two-stage semi-continuousprecipitation are given in Figure 1. The flow’ratio for the firststage precipitator is the deteminsd as the flow rate of the oxalicacid stream to the flow rate of the actinide stream. Thus thestreams can be adjusted for any residence time or throughput rate.The flow ratio can be determined by substituting into the followingdesign equations :
‘2 . -B * ~B2 - 4AC~ 2A
where
A = [~c20q]2 + 2[NP]3 - 16R~l[NP132
B = [~C204]2 + 4[NP13 - 2[NP11
(C = - 2([NP11-[NP13)+ R~l([m03]l + 4([NP11 - [NP]3)2)
Flow Ratio for Adjustment Stream
The flow rate for the second stage adjustmeritstream is givenas the ratio of the flow rate of the volubility adjustment stream tothe flow rate of the actinide. Absolute flow rates may be deter-
mined .by setting vessel capacity, residence time, or throughputrate. The flow ratio for the second stage adjustment stream can be
determined by substituting in the following design equations :
~=-B*4B2-4ACv 2A3
where
-20-

,..
DPST-82-786
where
A = ([~c20q]4 + 2[NP14) - 16R,2[NP142
B = ([~C20413 - 2[Np]3 + 4[NP]4 + [H2CZ04141
C = ([~C20q]3 - 2[NP13 + ZINP1+)
- R~z ([~o~lj + 4[NP13 - 4[Np1412
and
v=v(l+~)3 1 vi
-21-

DPST-82-786
APPENDIX 1 (cent‘d)
Determining Flow Ratios for The Semi-centintous PrecipitatiJn Systern
List of Variables
[Np], ... Neptunium feed concentration in stream {/1
[Kio3]1 . . . Nitric acid concentration in the neptunium feed
[%%0,12 . . . Oxalic acid feed concentration to the first stageprecipitator
[NP]3 ... Unprecipitated neptunium concentration in theoverflow line
[%%0,1, . . . Oxalic acid concentration in the overflow stream
[HN031~ . . . Nitric acid concentration in the overflow stream
R~ ... Ratio of oxalic acid concentration to theconcentration of nitric acid squared. This is the
free oxalate ion concentration.
[NP]4 . . . Unprecipitated neptunium concentration in the secondstage precipitator. This may be a close to theequilibrium volubility value.
[~+oql, . . . Oxalic acid concentration to the second stageprecipitator. This is the adjustment stream.
-22-

. ..’
DPST-82-786
TWO-LEVEL FACTORIAL DESIGN,)
Experimental Designs
Two-level factorial experimental designsz permit estim2tion ofthe effects of several factors simultaneously. This is accomplished
by making experimental runs at all combinations of “p” factors, with“2” levels per factor. These two-level factorial experiments are
easy to design and analyze, are readily adaptable to both continuousand discrete factors, and provide adequate pre.uiction models forfactor relationships that have no strong curvature (naximum orminimum) in the experimental region. For continuous variables, thehigher value is coded ,,+!!and ehe lower value coded “-” . The codingfor the sixteen run fractional factorial screening design used in
the neptunium (~) oxalate precipitation experiments is given inTable 2.
Use of these designs permits estimation of factor effects moreprecisely than a one-at-a time testing becau.:eof,the hiddenreplication included. Systematic error is kept to a minimum by
replication of design points and randomization of tho trails beforerunning.
If a computed factor effect is larger in absolute value thanthe “minimum significant factor effect,” the experimenter can safelyconclude that the true effect is nonzero.
The computed factor effects represent the difference betweenresponse at the high and low levels of the factor. If the factor isdivided by the difference of the high and low levels of the factors,the result will be the change in the response for a unit change inthe factor.
-23-

.“
DPST-82-786
APPENDIX 2 (cent ‘d)
TWO-LEVEL FACTORIAL DESIG !S
The model underlying the :wo-level factorial is of the form
+ ‘12X1% + a13xlx3 + ‘““ + ap-1 ,PXP-XP
+ higher order interactions
where
y = predicted response fOr: particle size distributions,plating in the precipitators, acd extent of precipitation in thefirst stage precipitator.
xj = (factor level - (Hi + Lo)/2)/(Hi - Lo)/2
aj = (,factor effect for xj)/2
aij = (iriteractioneffect for xi, xj)/2
The fractional factorial screening design used in the neptunium(IV) oxalate precipitation experiments can be viewed as an estimateof the constant and linear terms of this feneral polynomial model ofthe precipitation system. The analysis of this type of screeningdesign is simply mult ivariable linear regression.
Interpretation of the Screening Design Analysis
The cmputed factor effects are the coefficients of a linear
multivariable model. If the sign of the computed factor effect isnegative for a given response variable the response decreases as thevariable increases. In other words the response and the variable
are inversely related. If the cmputed factor effect is positivethe response “and the variable are directly related.
The magnitude of the computed factor effect compared with the“minimum factc- effect” determines the level of significance of thevariable at a cercain level of confidence. Thus the analysisproduces a relative ordering of sign~ficance among the variables.The results fr-- screening designs are often used to design furtherexperiments.
-24-