DISCLAIMER - kering.com · 2 DISCLAIMER This presentation does not constitute an offer of...
51
Transcript of DISCLAIMER - kering.com · 2 DISCLAIMER This presentation does not constitute an offer of...
2
DISCLAIMER
This presentation does not constitute an offer of securities for sale in the United States of America or any other jurisdiction.
Certain information contained in this document may include projections and forecasts. They express objectives based on current assessments
and estimates of the Group’s executive management which are subject to numerous factors, risks and uncertainties. Consequently, reported
figures and assessments may differ significantly from projected figures. The following factors among others set out in the Reference
Document (Document de Référence) filed with the French Financial Markets Authority (Autorité des Marchés Financiers - AMF) on March
30th, 2017 which is available on Kering’s website at www.kering.com may cause actual figures to differ materially from projected figures: any
unfavourable development affecting consumer spending in the activities of the Group in France and abroad, notably for products and services
sold by the Luxury Goods and Sport & Lifestyle brands, the events, crises, fears, and resulting costs of complying with environmental, health
and safety regulations and all other regulations with which Group companies are required to comply; the competitive situation on each of our
markets; exchange rate and other risks related to international activities; risks arising from current or future litigation. Kering gives no
commitment to updating and/or revising and/or commenting any projections and forecasts, or their impact on the results and perspectives of
the Group, which may be contained in this presentation.
The information contained in this document has been selected by the Group’s executive management to present Kering’s Full year 2017
results. This document has not been independently verified. Kering makes no representation or undertaking as to the accuracy or
completeness of such information. None of the Kering or any of its affiliates representatives shall bear any liability (in negligence or
otherwise) for any loss arising from any use of this presentation or its contents or otherwise arising in connection with this presentation.
IN NO WAY DOES KERING ASSUME ANY RESPONSIBILITY FOR ANY INVESTMENT OR OTHER DECISIONS MADE BASED UPON THE
INFORMATION PROVIDED IN THIS PRESENTATION. INFORMATION IN THIS PRESENTATION, INCLUDING FORECAST FINANCIAL
INFORMATION, SHOULD NOT BE CONSIDERED AS ADVICE OR A RECOMMENDATION TO INVESTORS OR POTENTIAL INVESTORS IN
RELATION TO HOLDING, PURCHASING OR SELLING SECURITIES OR OTHER FINANCIAL PRODUCTS OR INSTRUMENTS AND DOES
NOT TAKE INTO ACCOUNT YOUR PARTICULAR INVESTMENT OBJECTIVES, FINANCIAL SITUATION OR NEEDS. BEFORE ACTING ON
ANY INFORMATION YOU SHOULD CONSIDER THE APPROPRIATENESS OF THE INFORMATION HAVING REGARD TO THESE MATTERS,
ANY RELEVANT OFFER DOCUMENT AND IN PARTICULAR, YOU SHOULD SEEK INDEPENDENT FINANCIAL ADVICE. ALL SECURITIES
AND FINANCIAL PRODUCT OR INSTRUMENT TRANSACTIONS INVOLVE RISKS, WHICH INCLUDE (AMONG OTHERS) THE RISK OF
ADVERSE OR UNANTICIPATED MARKET, FINANCIAL OR POLITICAL DEVELOPMENTS AND, IN INTERNATIONAL TRANSACTIONS,
CURRENCY RISK. READERS ARE ADVISED TO REVIEW THE COMPANY'S REFERENCE DOCUMENT AND THE COMPANY'S APPLICABLE
AMF FILINGS BEFORE MAKING ANY INVESTMENT OR OTHER DECISION.
13.02.2018

INTRODUCTION
FRANÇOIS-HENRI PINAULT
CHAIRMAN AND CEO
ANALYSIS OF RESULTS
JEAN-MARC DUPLAIX
GROUP CHIEF FINANCIAL OFFICER
NET DEBTFCF FROM OPERATIONS
4,371
3,049
2016 2017
1,189
2,318
2016 2017
+4.6%
+8.1%
+27.2%
2015 2016 2017
1,6471,886
2,948
2015 2016 2017
In €m In €m
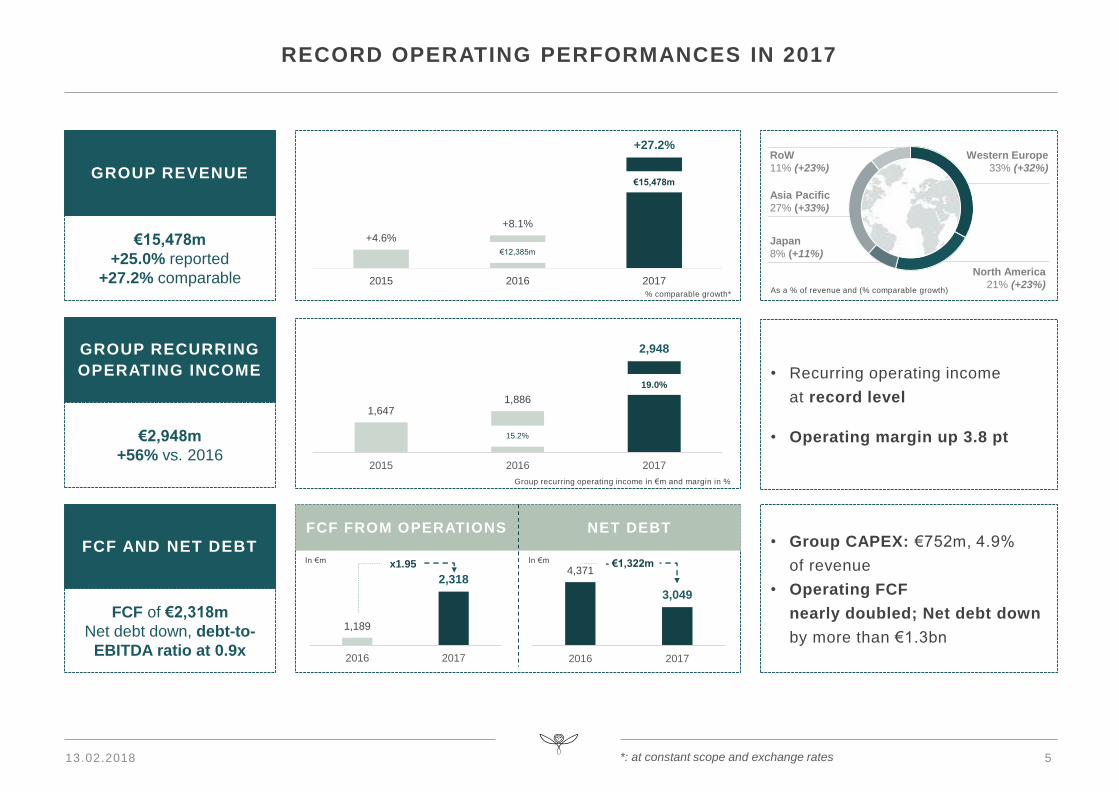
RECORD OPERATING PERFORMANCES IN 2017
% comparable growth*
GROUP RECURRING
OPERATING INCOME
€2,948m
+56% vs. 2016
FCF AND NET DEBT
FCF of €2,318m
Net debt down, debt-to-
EBITDA ratio at 0.9x
• Recurring operating income
at record level
• Operating margin up 3.8 pt
• Group CAPEX: €752m, 4.9%
of revenue
• Operating FCF
nearly doubled; Net debt down
by more than €1.3bn
€15,478m
+25.0% reported
+27.2% comparable
GROUP REVENUE
Western Europe
33% (+32%)
North America
21% (+23%)
Asia Pacific
27% (+33%)
RoW
11% (+23%)
Japan
8% (+11%)
As a % of revenue and (% comparable growth)
15.2%
19.0%
Group recurring operating income in €m and margin in %
€15,478m
€12,385m
x1.95
13.02.2018 5
- €1,322m
*: at constant scope and exchange rates
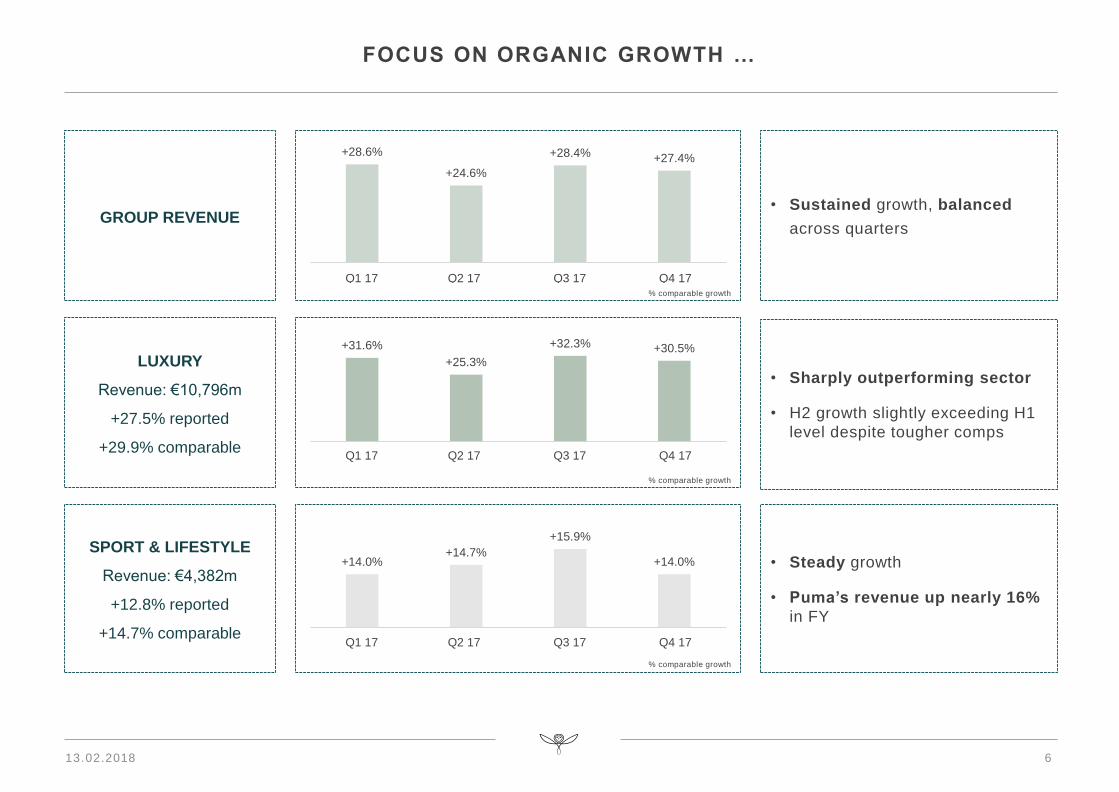
+28.6%
+24.6%
+28.4% +27.4%
T1 17 T2 17 T3 17 T4 17Q1 17 Q2 17 Q3 17 Q4 17
FOCUS ON ORGANIC GROWTH …
% comparable growth
% comparable growth
% comparable growth
LUXURY
Revenue: €10,796m
+27.5% reported
+29.9% comparable
SPORT & LIFESTYLE
Revenue: €4,382m
+12.8% reported
+14.7% comparable
GROUP REVENUE
• Sharply outperforming sector
• H2 growth slightly exceeding H1
level despite tougher comps
• Steady growth
• Puma’s revenue up nearly 16%
in FY
• Sustained growth, balanced
across quarters
+31.6%
+25.3%
+32.3% +30.5%
T1 17 T2 17 T3 17 T4 17Q1 17 Q2 17 Q3 17 Q4 17
+14.0%+14.7%
+15.9%
+14.0%
T1 17 T2 17 T3 17 T4 17Q1 17 Q2 17 Q3 17 Q4 17
13.02.2018 6
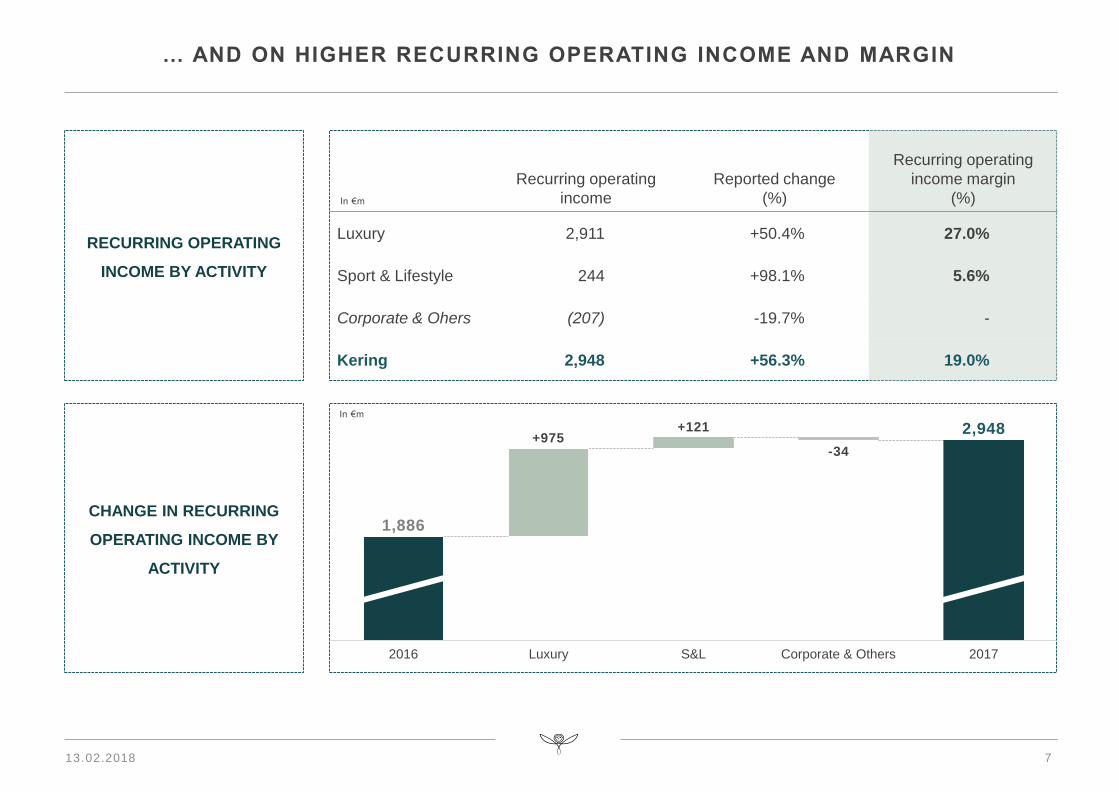
Recurring operating
income
Reported change
(%)
Recurring operating
income margin
(%)
Luxury 2,911 +50.4% 27.0%
Sport & Lifestyle 244 +98.1% 5.6%
Corporate & Ohers (207) -19.7% -
Kering 2,948 +56.3% 19.0%
… AND ON HIGHER RECURRING OPERATING INCOME AND MARGIN
2,948
Luxury2016 Corporate & Others
+975
2017S&L
1,886
-34
+121
RECURRING OPERATING
INCOME BY ACTIVITY
CHANGE IN RECURRING
OPERATING INCOME BY
ACTIVITY
In €m
In €m
13.02.2018 7
Retail
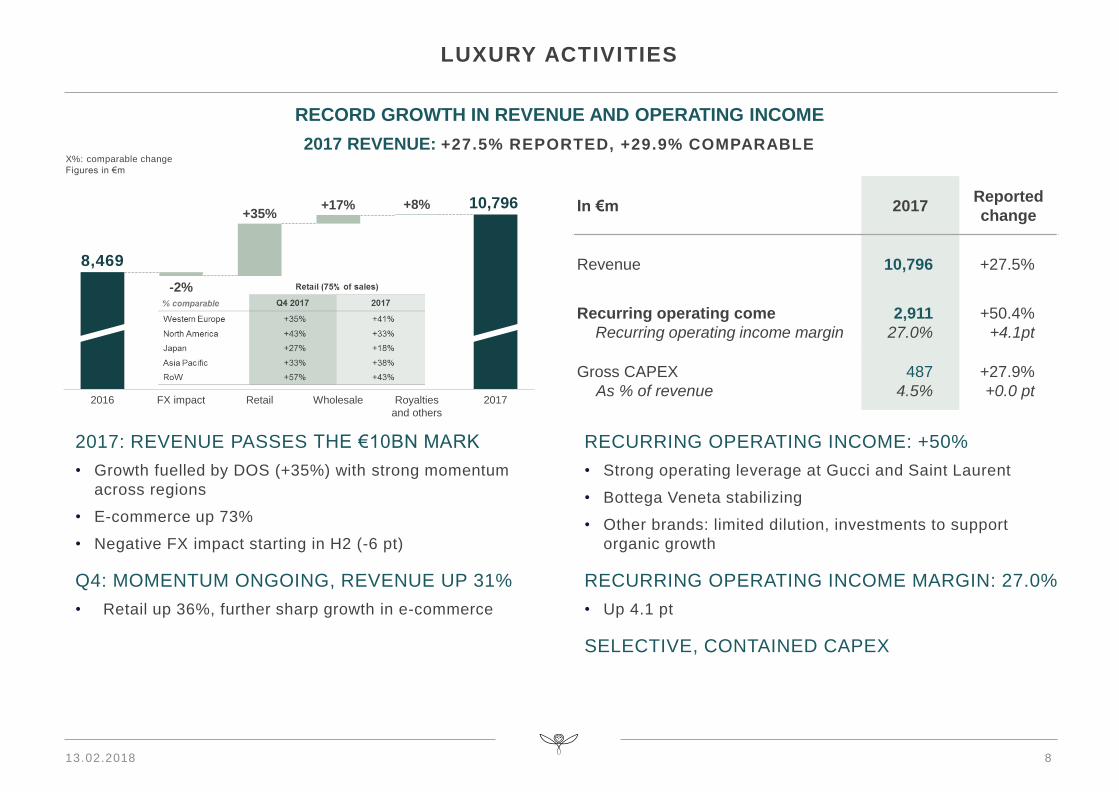
+35%
Wholesale2016 FX impact Royalties
and others
10,796
2017
8,469
-2%
+17% +8%
RECORD GROWTH IN REVENUE AND OPERATING INCOME
8
LUXURY ACTIVITIES
2017: REVENUE PASSES THE €10BN MARK
• Growth fuelled by DOS (+35%) with strong momentum
across regions
• E-commerce up 73%
• Negative FX impact starting in H2 (-6 pt)
Q4: MOMENTUM ONGOING, REVENUE UP 31%
• Retail up 36%, further sharp growth in e-commerce
RECURRING OPERATING INCOME: +50%
• Strong operating leverage at Gucci and Saint Laurent
• Bottega Veneta stabilizing
• Other brands: limited dilution, investments to support
organic growth
RECURRING OPERATING INCOME MARGIN: 27.0%
• Up 4.1 pt
SELECTIVE, CONTAINED CAPEX
2017 REVENUE: +27.5% REPORTED, +29.9% COMPARABLE
In €m 2017Reported
change
Revenue 10,796 +27.5%
Recurring operating come
Recurring operating income margin
2,911
27.0%
+50.4%
+4.1pt
Gross CAPEX
As % of revenue
487
4.5%
+27.9%
+0.0 pt
13.02.2018
X%: comparable change
Figures in €m
9
GUCCI
2016 Western
Europe
+58%4,378
North
America
Retail (85% of sales): +47%
2017
+35%
RoW
+52%
Asia
Pacific
6,211
Royalties
and others
+15%
Wholesale
+21%+48%
Japan
+44%
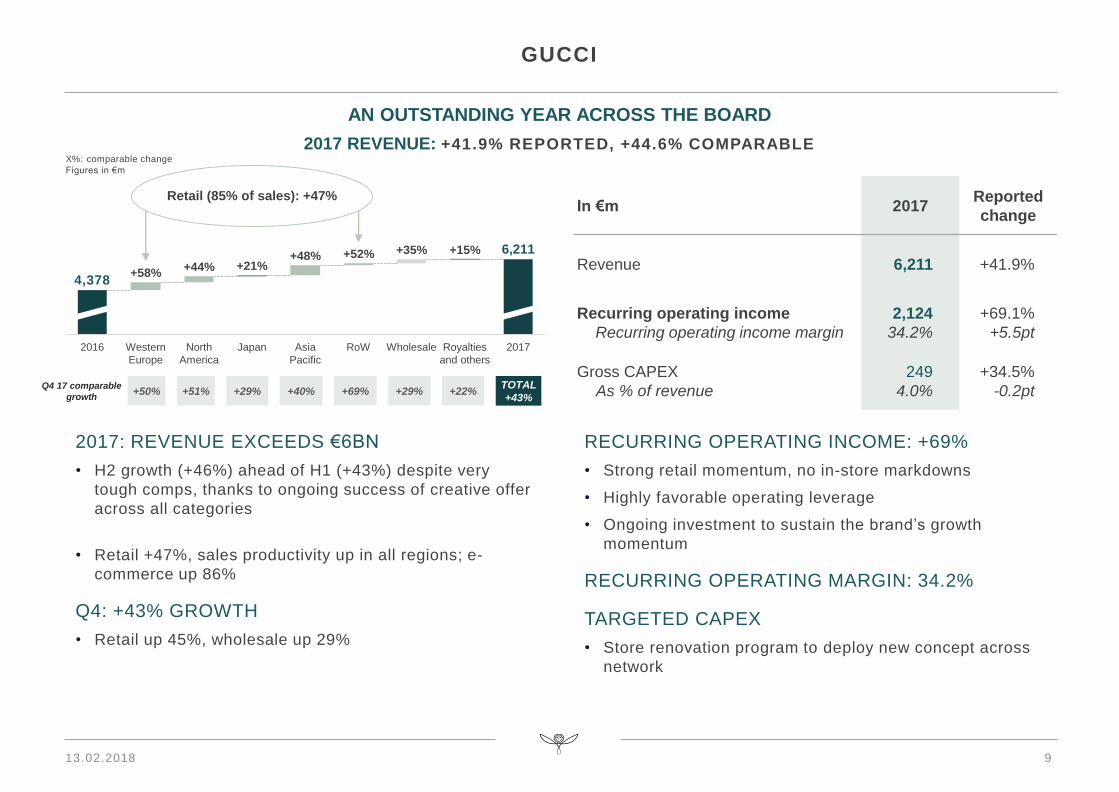
2017: REVENUE EXCEEDS €6BN
• H2 growth (+46%) ahead of H1 (+43%) despite very
tough comps, thanks to ongoing success of creative offer
across all categories
• Retail +47%, sales productivity up in all regions; e-
commerce up 86%
Q4: +43% GROWTH
• Retail up 45%, wholesale up 29%
AN OUTSTANDING YEAR ACROSS THE BOARD
2017 REVENUE: +41.9% REPORTED, +44.6% COMPARABLE
RECURRING OPERATING INCOME: +69%
• Strong retail momentum, no in-store markdowns
• Highly favorable operating leverage
• Ongoing investment to sustain the brand’s growth
momentum
RECURRING OPERATING MARGIN: 34.2%
TARGETED CAPEX
• Store renovation program to deploy new concept across
network
In €m 2017Reported
change
Revenue 6,211 +41.9%
Recurring operating income
Recurring operating income margin
2,124
34.2%
+69.1%
+5.5pt
Gross CAPEX
As % of revenue
249
4.0%
+34.5%
-0.2pt+50%Q4 17 comparable
growth+51% +29% +40% +29%
TOTAL
+43%+69% +22%
13.02.2018
X%: comparable change
Figures in €m
A YEAR OF STABILIZATION
10
BOTTEGA VENETA
Japan
Retail (83% of sales): +4%
North
America
2017
+4%
Wholesale
+19%
Asia
Pacific
Royalties
and others
1,176
-8%
RoW
-4%
+3%1,173
Western
Europe
+7%
2016
-2%
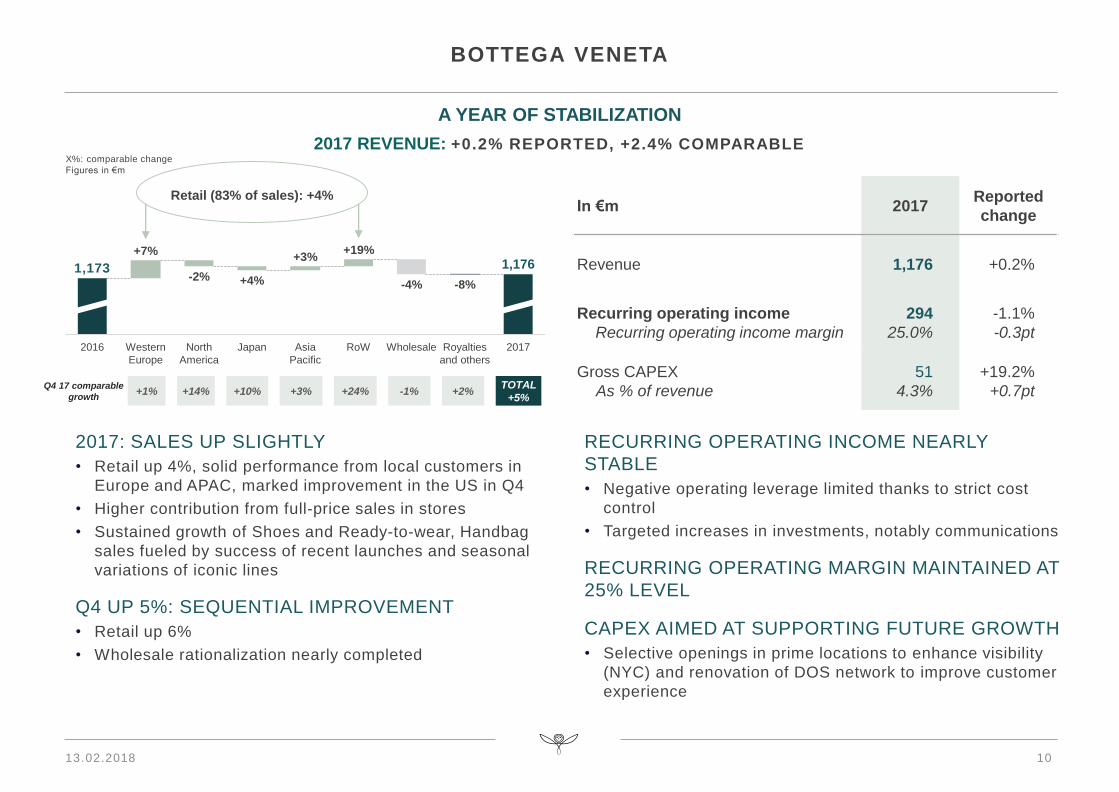
2017 REVENUE: +0.2% REPORTED, +2.4% COMPARABLE
2017: SALES UP SLIGHTLY
• Retail up 4%, solid performance from local customers in
Europe and APAC, marked improvement in the US in Q4
• Higher contribution from full-price sales in stores
• Sustained growth of Shoes and Ready-to-wear, Handbag
sales fueled by success of recent launches and seasonal
variations of iconic lines
Q4 UP 5%: SEQUENTIAL IMPROVEMENT
• Retail up 6%
• Wholesale rationalization nearly completed
RECURRING OPERATING INCOME NEARLY
STABLE
• Negative operating leverage limited thanks to strict cost
control
• Targeted increases in investments, notably communications
RECURRING OPERATING MARGIN MAINTAINED AT
25% LEVEL
CAPEX AIMED AT SUPPORTING FUTURE GROWTH
• Selective openings in prime locations to enhance visibility
(NYC) and renovation of DOS network to improve customer
experience
In €m 2017Reported
change
Revenue 1,176 +0.2%
Recurring operating income
Recurring operating income margin
294
25.0%
-1.1%
-0.3pt
Gross CAPEX
As % of revenue
51
4.3%
+19.2%
+0.7pt
X%: comparable change
Figures in €m
+1%Q4 17 comparable
growth+14% +10% +3% -1%
TOTAL
+5%+24% +2%
13.02.2018
11
SAINT LAURENT
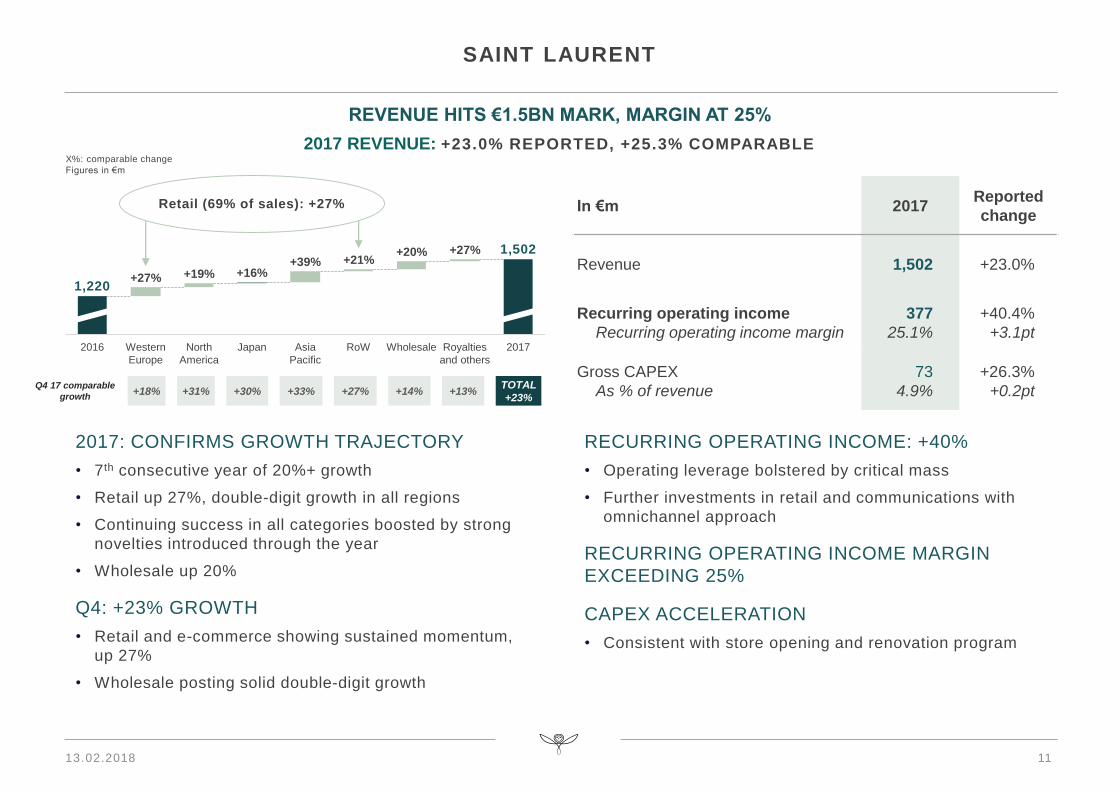
REVENUE HITS €1.5BN MARK, MARGIN AT 25%
2017 REVENUE: +23.0% REPORTED, +25.3% COMPARABLE
2017: CONFIRMS GROWTH TRAJECTORY
• 7th consecutive year of 20%+ growth
• Retail up 27%, double-digit growth in all regions
• Continuing success in all categories boosted by strong
novelties introduced through the year
• Wholesale up 20%
Q4: +23% GROWTH
• Retail and e-commerce showing sustained momentum,
up 27%
• Wholesale posting solid double-digit growth
RECURRING OPERATING INCOME: +40%
• Operating leverage bolstered by critical mass
• Further investments in retail and communications with
omnichannel approach
RECURRING OPERATING INCOME MARGIN
EXCEEDING 25%
CAPEX ACCELERATION
• Consistent with store opening and renovation program
In €m 2017Reported
change
Revenue 1,502 +23.0%
Recurring operating income
Recurring operating income margin
377
25.1%
+40.4%
+3.1pt
Gross CAPEX
As % of revenue
73
4.9%
+26.3%
+0.2pt
Wholesale
+20%
Western
Europe
+27%
2016
1,220
Retail (69% of sales): +27%
2017
1,502
Royalties
and others
+27%
RoW
+16%
Japan Asia
Pacific
+39% +21%+19%
North
America
+18%Q4 17 comparable
growth+31% +30% +33% +14%
TOTAL
+23%+27% +13%
13.02.2018
X%: comparable change
Figures in €m
12
OTHER LUXURY BRANDS
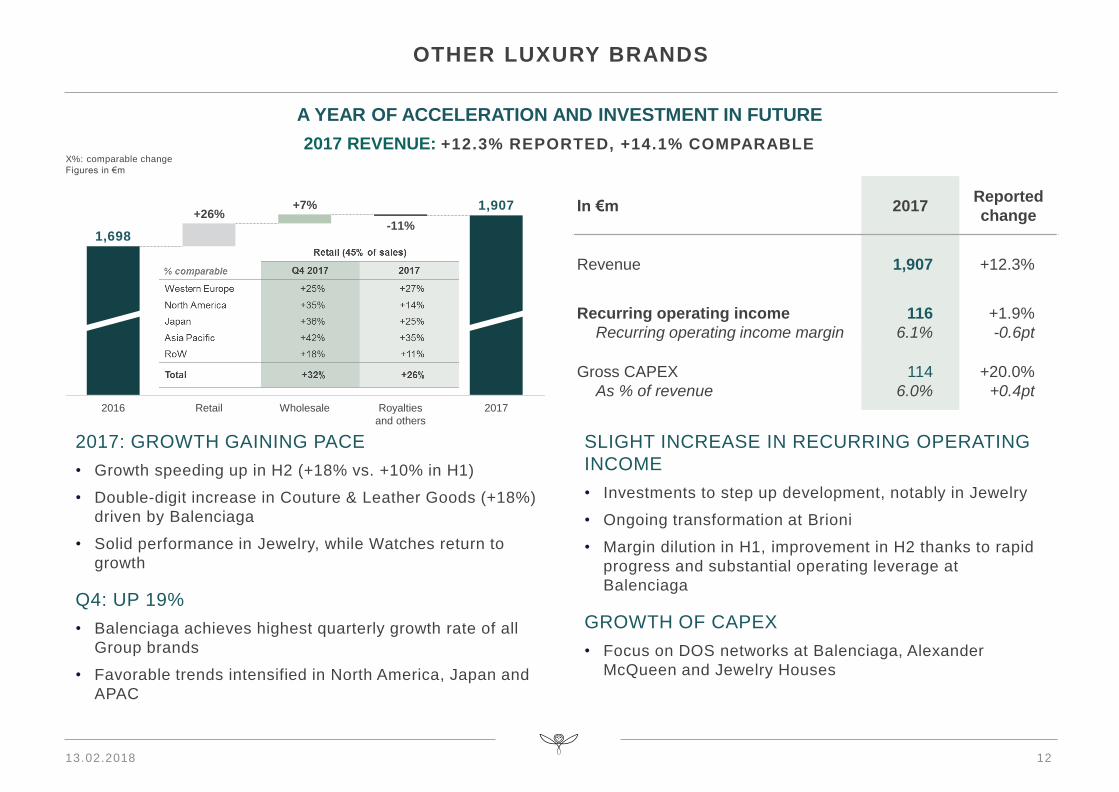
2017: GROWTH GAINING PACE
• Growth speeding up in H2 (+18% vs. +10% in H1)
• Double-digit increase in Couture & Leather Goods (+18%)
driven by Balenciaga
• Solid performance in Jewelry, while Watches return to
growth
Q4: UP 19%
• Balenciaga achieves highest quarterly growth rate of all
Group brands
• Favorable trends intensified in North America, Japan and
APAC
SLIGHT INCREASE IN RECURRING OPERATING
INCOME
• Investments to step up development, notably in Jewelry
• Ongoing transformation at Brioni
• Margin dilution in H1, improvement in H2 thanks to rapid
progress and substantial operating leverage at
Balenciaga
GROWTH OF CAPEX
• Focus on DOS networks at Balenciaga, Alexander
McQueen and Jewelry Houses
A YEAR OF ACCELERATION AND INVESTMENT IN FUTURE
2017 REVENUE: +12.3% REPORTED, +14.1% COMPARABLE
2017
1,907
Royalties
and others
-11%
Wholesale
+7%
Retail
+26%
2016
1,698
In €m 2017Reported
change
Revenue 1,907 +12.3%
Recurring operating income
Recurring operating income margin
116
6.1%
+1.9%
-0.6pt
Gross CAPEX
As % of revenue
114
6.0%
+20.0%
+0.4pt
13.02.2018
X%: comparable change
Figures in €m
13
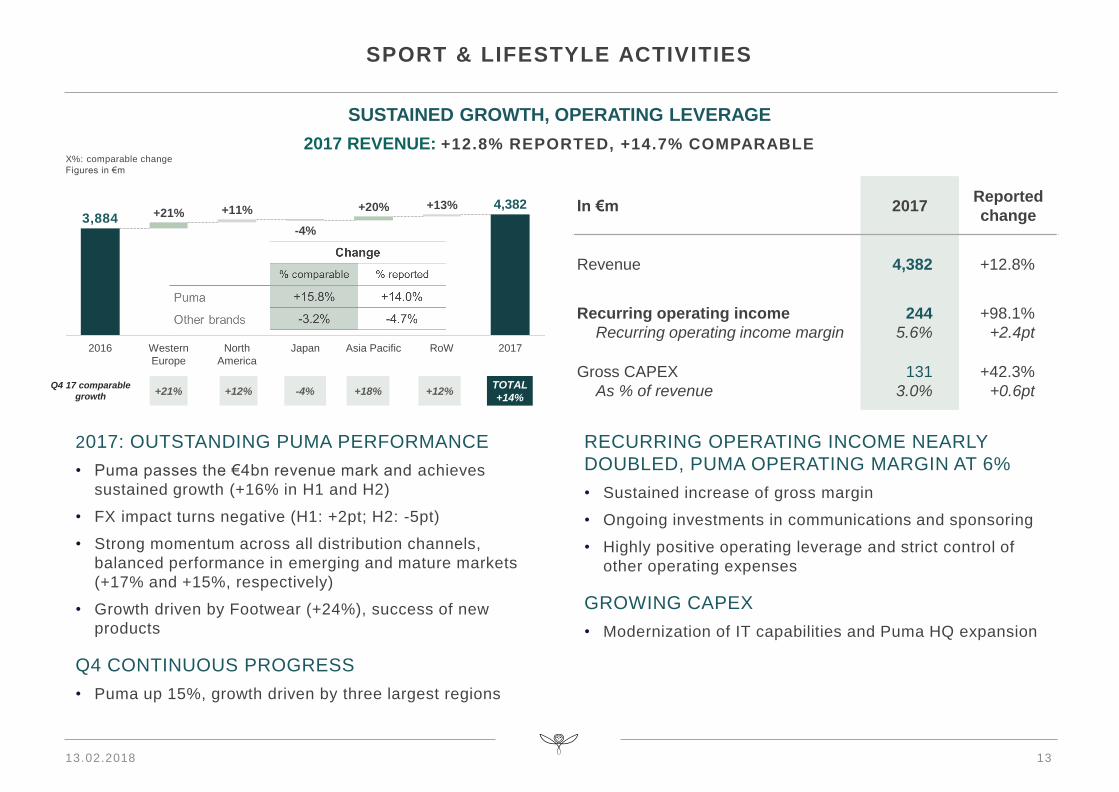
SPORT & LIFESTYLE ACTIVITIES
SUSTAINED GROWTH, OPERATING LEVERAGE
2017 REVENUE: +12.8% REPORTED, +14.7% COMPARABLE
2017: OUTSTANDING PUMA PERFORMANCE
• Puma passes the €4bn revenue mark and achieves
sustained growth (+16% in H1 and H2)
• FX impact turns negative (H1: +2pt; H2: -5pt)
• Strong momentum across all distribution channels,
balanced performance in emerging and mature markets
(+17% and +15%, respectively)
• Growth driven by Footwear (+24%), success of new
products
Q4 CONTINUOUS PROGRESS
• Puma up 15%, growth driven by three largest regions
RECURRING OPERATING INCOME NEARLY
DOUBLED, PUMA OPERATING MARGIN AT 6%
• Sustained increase of gross margin
• Ongoing investments in communications and sponsoring
• Highly positive operating leverage and strict control of
other operating expenses
GROWING CAPEX
• Modernization of IT capabilities and Puma HQ expansion
3,884 +21%
2016
+11%
Western
Europe
North
America
-4%
Japan
+20% +13%
Asia Pacific 2017
4,382
RoW
+21%Q4 17 comparable
growth+12% -4% +18% +12%
TOTAL
+14%
In €m 2017Reported
change
Revenue 4,382 +12.8%
Recurring operating income
Recurring operating income margin
244
5.6%
+98.1%
+2.4pt
Gross CAPEX
As % of revenue
131
3.0%
+42.3%
+0.6pt
13.02.2018
X%: comparable change
Figures in €m
14
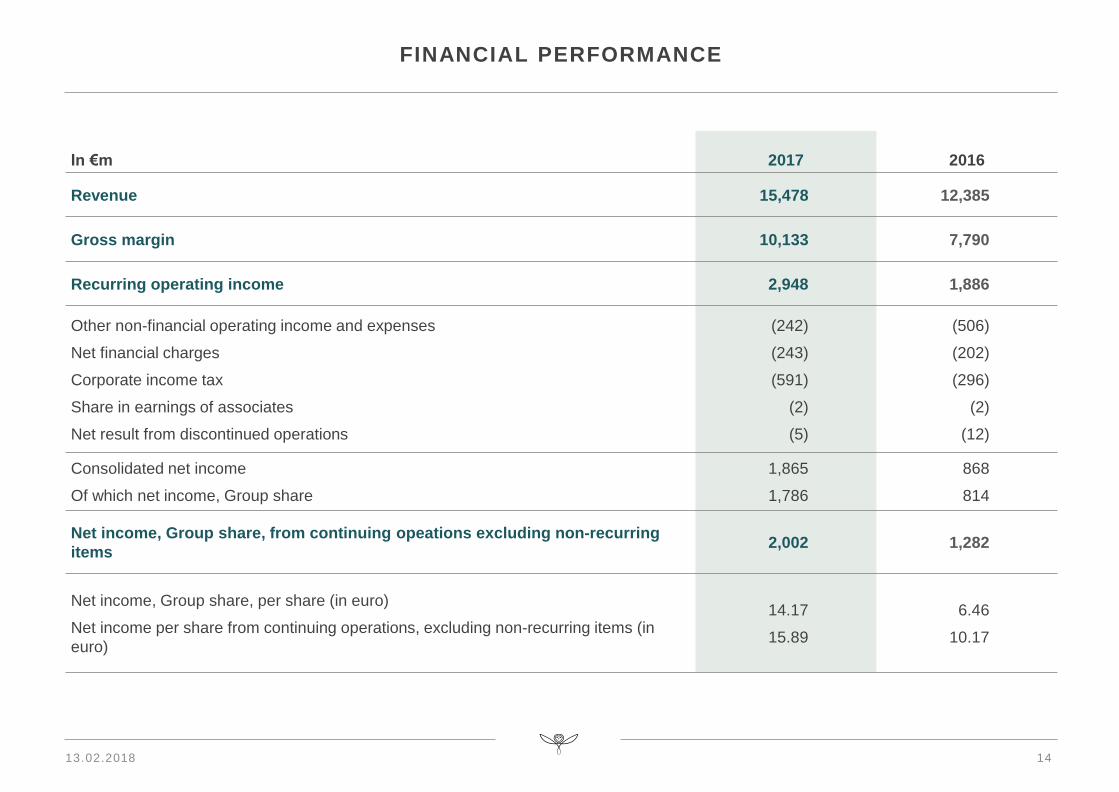
FINANCIAL PERFORMANCE
In €m 2017 2016
Revenue 15,478 12,385
Gross margin 10,133 7,790
Recurring operating income 2,948 1,886
Other non-financial operating income and expenses
Net financial charges
Corporate income tax
Share in earnings of associates
Net result from discontinued operations
(242)
(243)
(591)
(2)
(5)
(506)
(202)
(296)
(2)
(12)
Consolidated net income
Of which net income, Group share
1,865
1,786
868
814
Net income, Group share, from continuing opeations excluding non-recurring
items2,002 1,282
Net income, Group share, per share (in euro)
Net income per share from continuing operations, excluding non-recurring items (in
euro)
14.17
15.89
6.46
10.17
13.02.2018
15
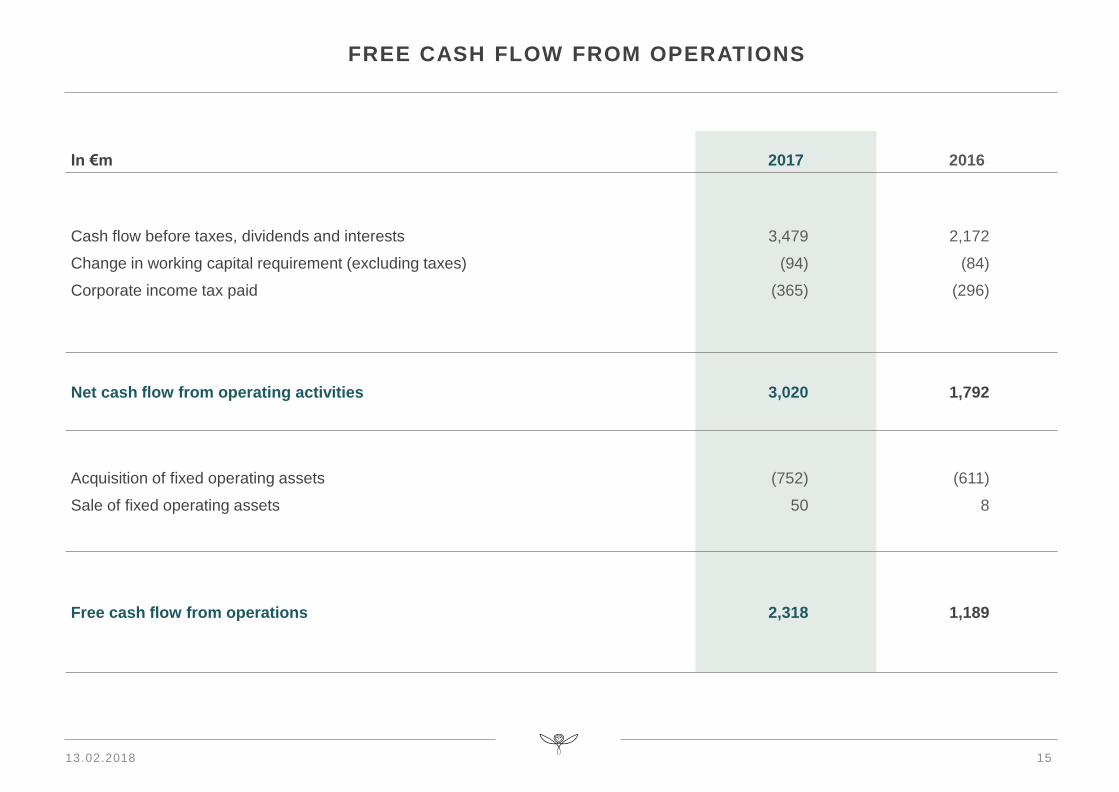
FREE CASH FLOW FROM OPERATIONS
In €m 2017 2016
Cash flow before taxes, dividends and interests
Change in working capital requirement (excluding taxes)
Corporate income tax paid
3,479
(94)
(365)
2,172
(84)
(296)
Net cash flow from operating activities 3,020 1,792
Acquisition of fixed operating assets
Sale of fixed operating assets
(752)
50
(611)
8
Free cash flow from operations 2,318 1,189
13.02.2018
16
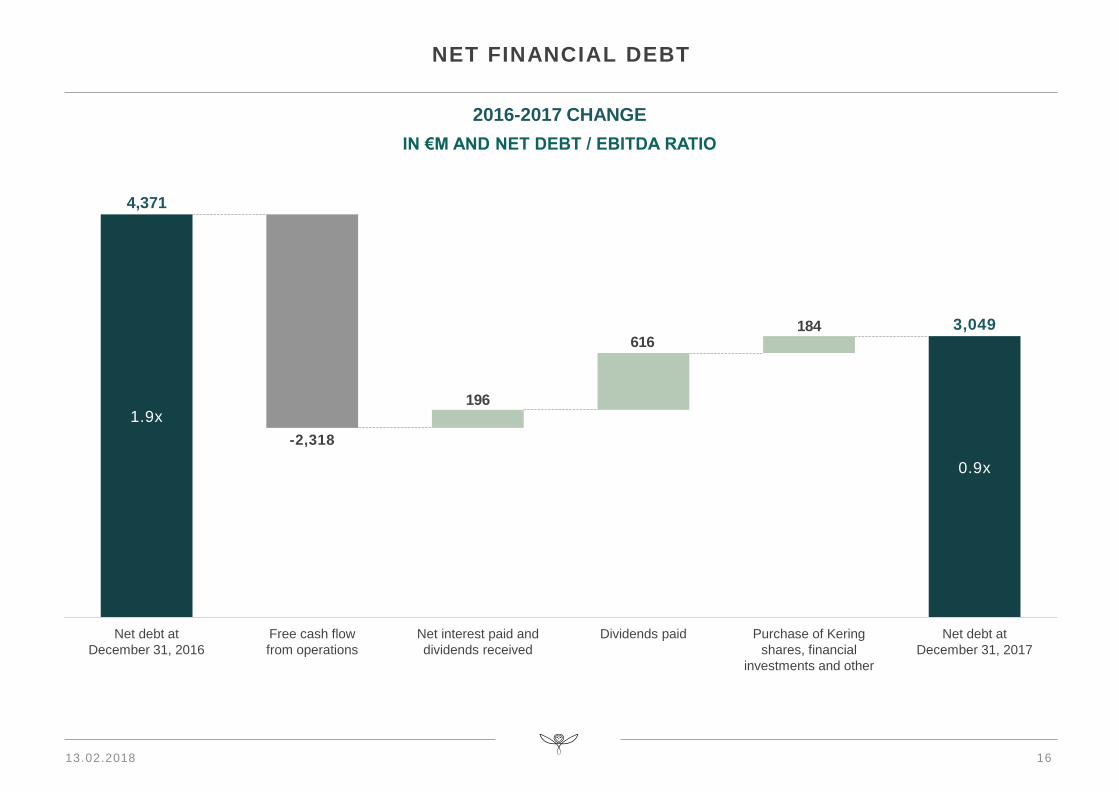
NET FINANCIAL DEBT
184616
196
Purchase of Kering
shares, financial
investments and other
-2,318
3,049
Free cash flow
from operations
0.9x
Net debt at
December 31, 2017
4,371
Net debt at
December 31, 2016
Net interest paid and
dividends received
Dividends paid
1.9x
2016-2017 CHANGE
IN €M AND NET DEBT / EBITDA RATIO
13.02.2018
17
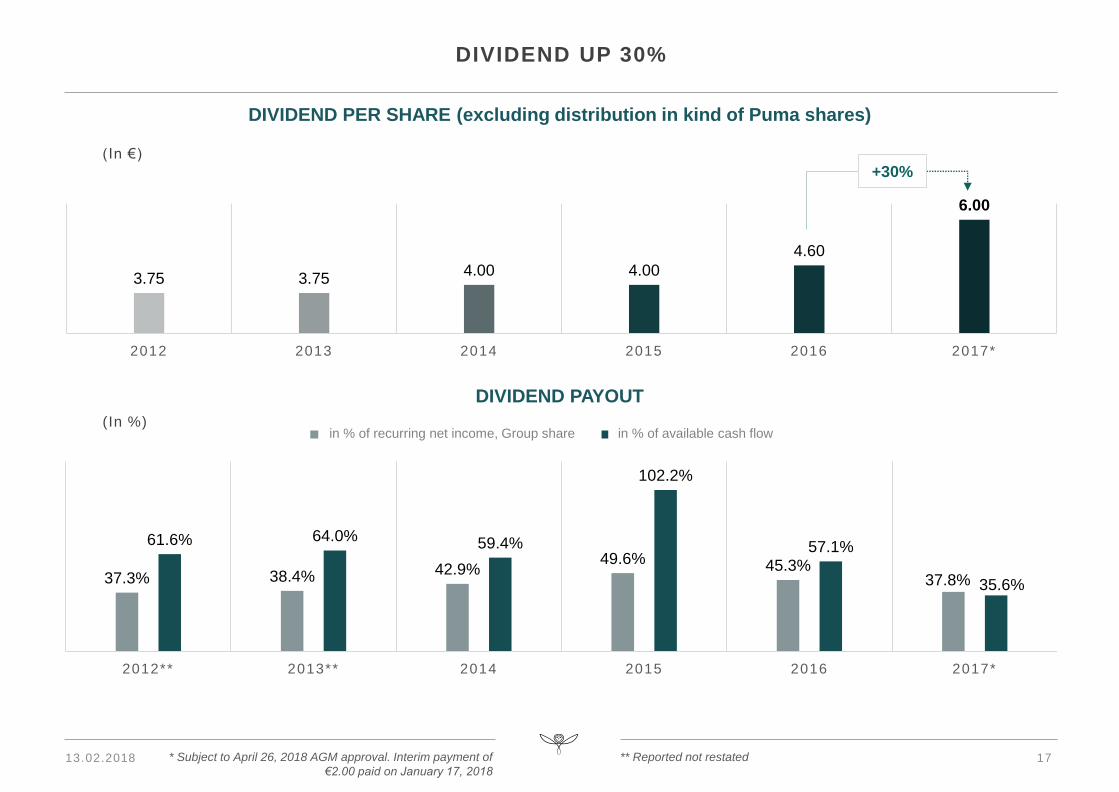
DIVIDEND PER SHARE (excluding distribution in kind of Puma shares)
(In €)
DIVIDEND UP 30%
3.75 3.754.00 4.00
4.60
6.00
2012 2013 2014 2015 2016 2017*
DIVIDEND PAYOUT
(In %)
37.3% 38.4% 42.9%49.6% 45.3%
37.8%
61.6% 64.0% 59.4%
102.2%
57.1%
35.6%
2012** 2013** 2014 2015 2016 2017*
en % du RNPdG poursuivi courant en % du cash flow disponiblein % of available cash flow
+30%
in % of recurring net income, Group share
13.02.2018 ** Reported not restated* Subject to April 26, 2018 AGM approval. Interim payment of
€2.00 paid on January 17, 2018
A LUXURY PURE PLAYER
JEAN-FRANÇOIS PALUS
GROUP MANAGING DIRECTOR
All information in this section is subject to approval of the dividend in kind by Kering shareholders
at the Annual General Meeting of April 26, 2018
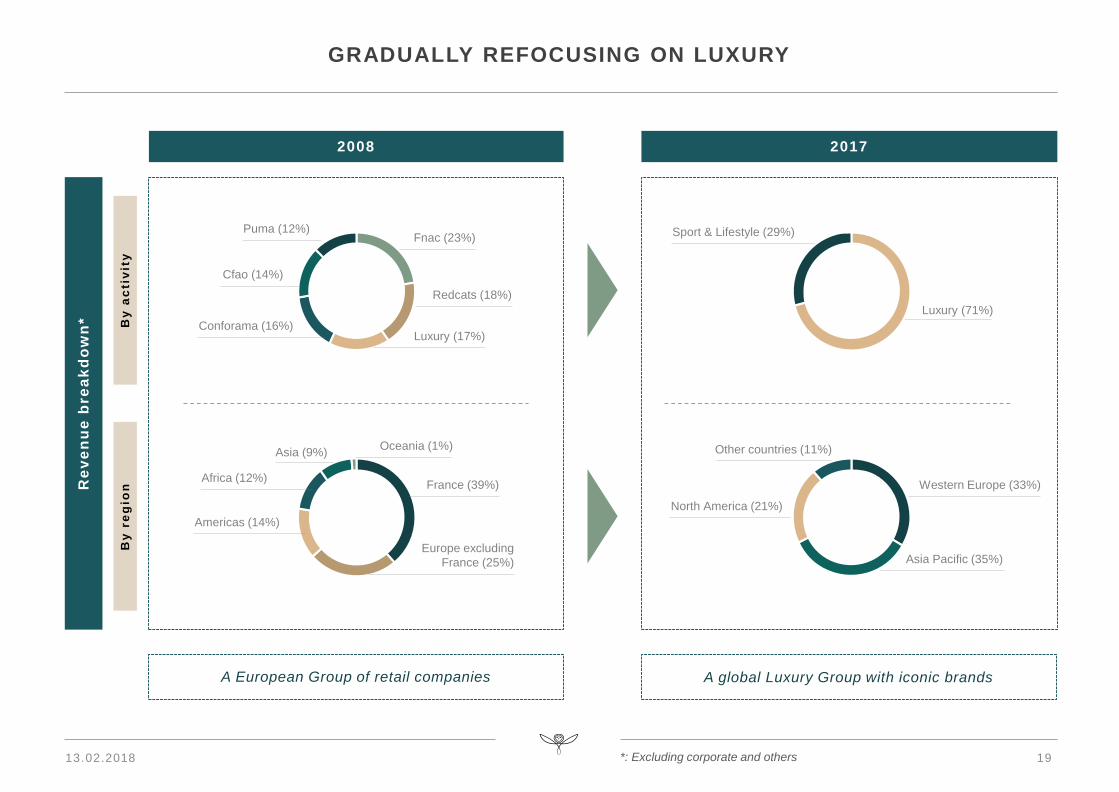
GRADUALLY REFOCUSING ON LUXURY
13.02.2018
2008 2017
A European Group of retail companies A global Luxury Group with iconic brands
Luxury (71%)
By
ac
tiv
ity
By
re
gio
n
Redcats (18%)
Fnac (23%)
Cfao (14%)
Sport & Lifestyle (29%)
Other countries (11%)
Western Europe (33%)
Asia Pacific (35%)
North America (21%)
Re
ve
nu
e b
re
ak
do
wn
*
Conforama (16%)
Puma (12%)
Asia (9%)
Luxury (17%)
19*: Excluding corporate and others
Americas (14%)
France (39%)
Europe excluding
France (25%)
Oceania (1%)
Africa (12%)
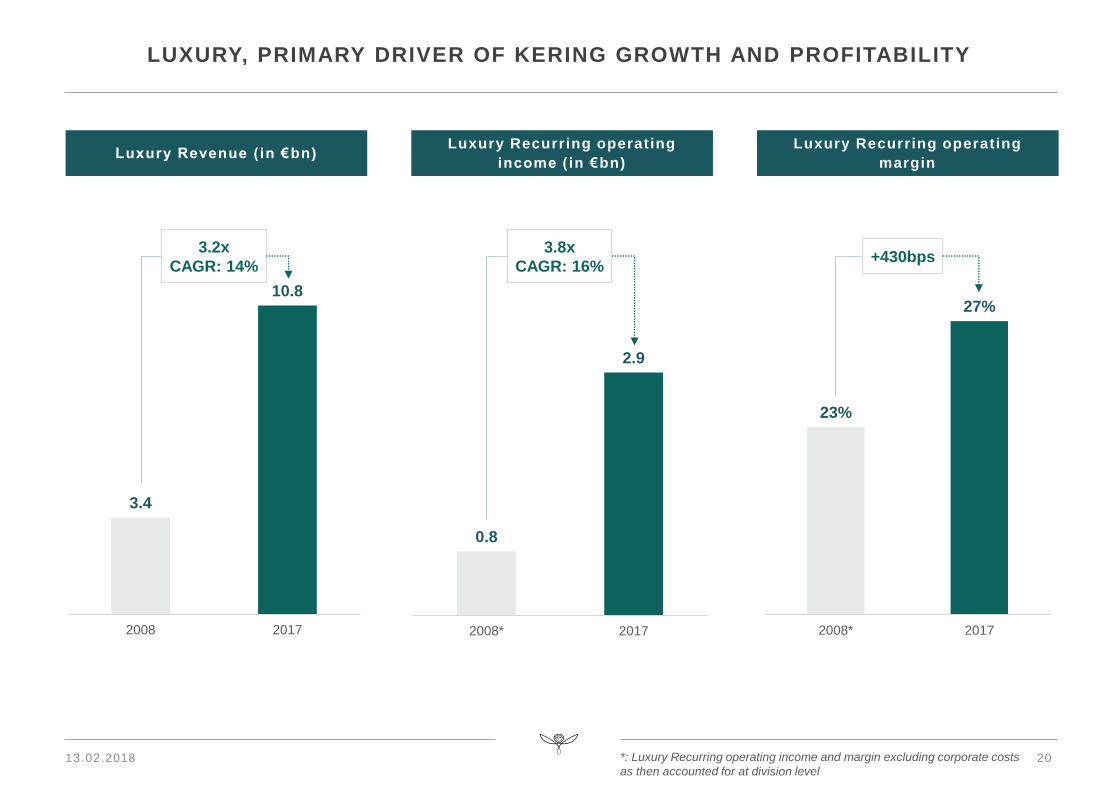
LUXURY, PRIMARY DRIVER OF KERING GROWTH AND PROFITABILITY
13.02.2018
Luxury Revenue ( in €bn)Luxury Recurring operating
income (in €bn)
Luxury Recurring operating
margin
3.4
10.8
2008 2017
0.8
2.9
2008* 2017
23%
27%
2008* 2017
3.2x
CAGR: 14%
3.8x
CAGR: 16%+430bps
20*: Luxury Recurring operating income and margin excluding corporate costs
as then accounted for at division level
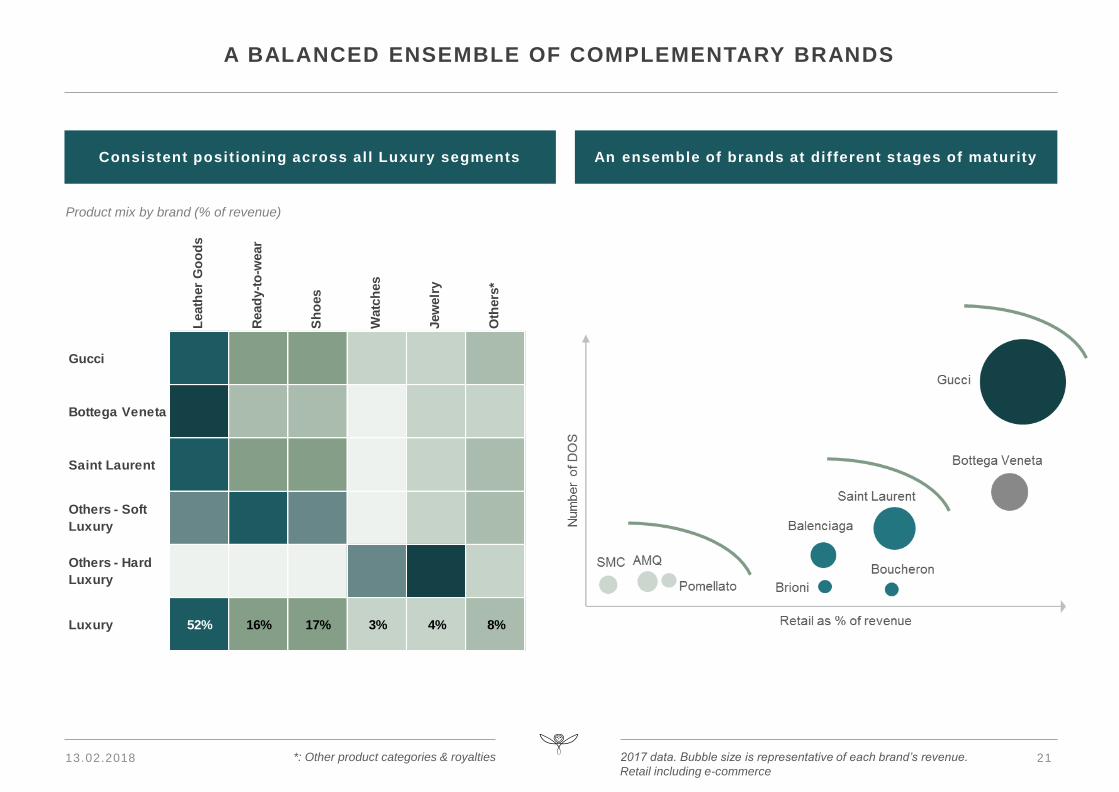
A BALANCED ENSEMBLE OF COMPLEMENTARY BRANDS
Consistent posit ioning across al l Luxury segments An ensemble of brands at different stages of maturity
Product mix by brand (% of revenue)
13.02.2018 212017 data. Bubble size is representative of each brand’s revenue.
Retail including e-commerce
*: Other product categories & royalties
Leath
er
Go
od
s
Read
y-t
o-w
ear
Sh
oes
Watc
hes
Jew
elr
y
Oth
ers
*
Gucci
Bottega Veneta
Saint Laurent
Others - Soft
Luxury
Others - Hard
Luxury
Luxury 52% 16% 17% 3% 4% 8%
13.02.2018
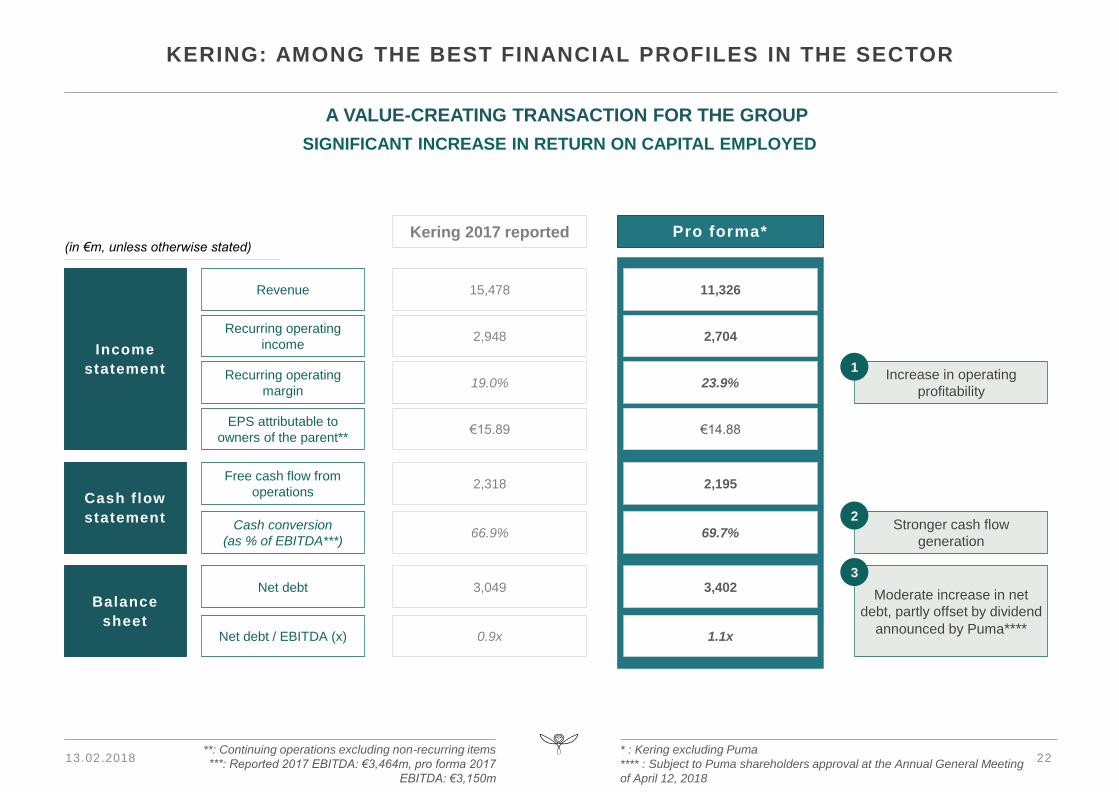
KERING: AMONG THE BEST FINANCIAL PROFILES IN THE SECTOR
Income
statement
Cash f low
statement
Revenue 15,478
Recurring operating
margin19.0%
Cash conversion
(as % of EBITDA***)
(in €m, unless otherwise stated)
66.9%
Balance
sheetNet debt / EBITDA (x) 0.9x
11,326
23.9%
69.7%
1.1x
Kering 2017 reported Pro forma*
Increase in operating
profitability
Stronger cash flow
generation
Recurring operating
income2,948 2,704
Free cash flow from
operations2,318 2,195
EPS attributable to
owners of the parent**€15.89 €14.88
Net debt 3,049 3,402Moderate increase in net
debt, partly offset by dividend
announced by Puma****
A VALUE-CREATING TRANSACTION FOR THE GROUP
1
2
22
3
* : Kering excluding Puma
**** : Subject to Puma shareholders approval at the Annual General Meeting
of April 12, 2018
**: Continuing operations excluding non-recurring items
***: Reported 2017 EBITDA: €3,464m, pro forma 2017
EBITDA: €3,150m
SIGNIFICANT INCREASE IN RETURN ON CAPITAL EMPLOYED
x3.9
63
245
2013 2017
23
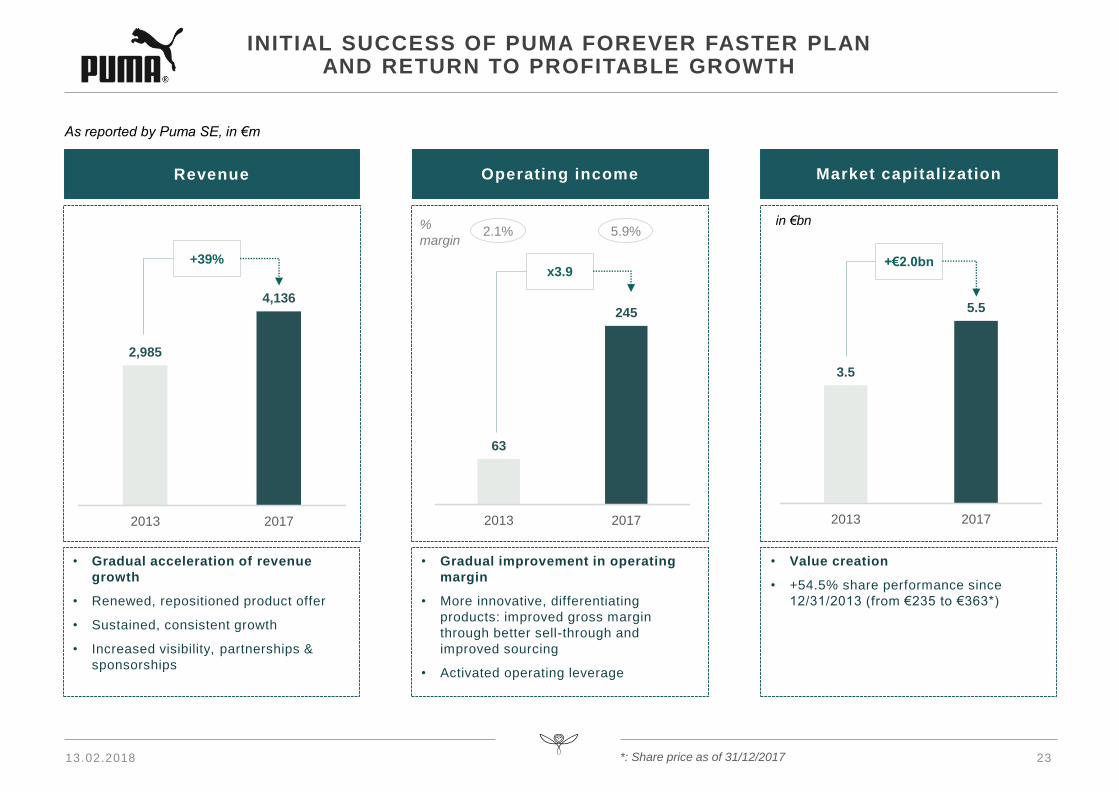
INITIAL SUCCESS OF PUMA FOREVER FASTER PLAN AND RETURN TO PROFITABLE GROWTH
Operating income Market capitalization
• Gradual improvement in operating
margin
• More innovative, differentiating
products: improved gross margin
through better sell-through and
improved sourcing
• Activated operating leverage
13.02.2018
Revenue
• Gradual acceleration of revenue
growth
• Renewed, repositioned product offer
• Sustained, consistent growth
• Increased visibility, partnerships &
sponsorships
• Value creation
• +54.5% share performance since
12/31/2013 (from €235 to €363*)
As reported by Puma SE, in €m
%
margin
+39%
2.1% 5.9%in €bn
3.5
5.5
2013 2017
+€2.0bn
2,985
4,136
2013 2017
*: Share price as of 31/12/2017
24
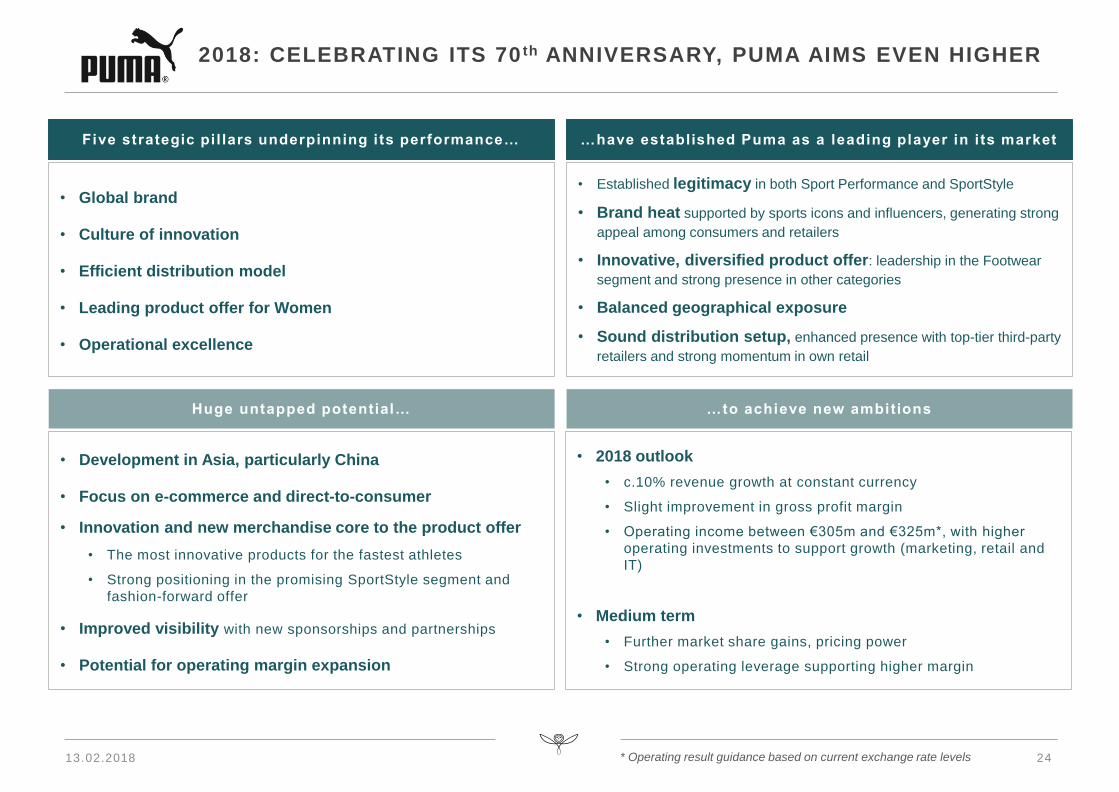
2018: CELEBRATING ITS 70 th ANNIVERSARY, PUMA AIMS EVEN HIGHER
13.02.2018
Five strategic pi l lars underpinning its performance…
• Global brand
• Culture of innovation
• Efficient distribution model
• Leading product offer for Women
• Operational excellence
…have established Puma as a leading player in i ts market
• Established legitimacy in both Sport Performance and SportStyle
• Brand heat supported by sports icons and influencers, generating strong
appeal among consumers and retailers
• Innovative, diversified product offer: leadership in the Footwear
segment and strong presence in other categories
• Balanced geographical exposure
• Sound distribution setup, enhanced presence with top-tier third-party
retailers and strong momentum in own retail
Huge untapped potential…
• Development in Asia, particularly China
• Focus on e-commerce and direct-to-consumer
• Innovation and new merchandise core to the product offer
• The most innovative products for the fastest athletes
• Strong positioning in the promising SportStyle segment and
fashion-forward offer
• Improved visibility with new sponsorships and partnerships
• Potential for operating margin expansion
…to achieve new ambitions
• 2018 outlook
• c.10% revenue growth at constant currency
• Slight improvement in gross profit margin
• Operating income between €305m and €325m*, with higher
operating investments to support growth (marketing, retail and
IT)
• Medium term
• Further market share gains, pricing power
• Strong operating leverage supporting higher margin
* Operating result guidance based on current exchange rate levels
13.02.2018
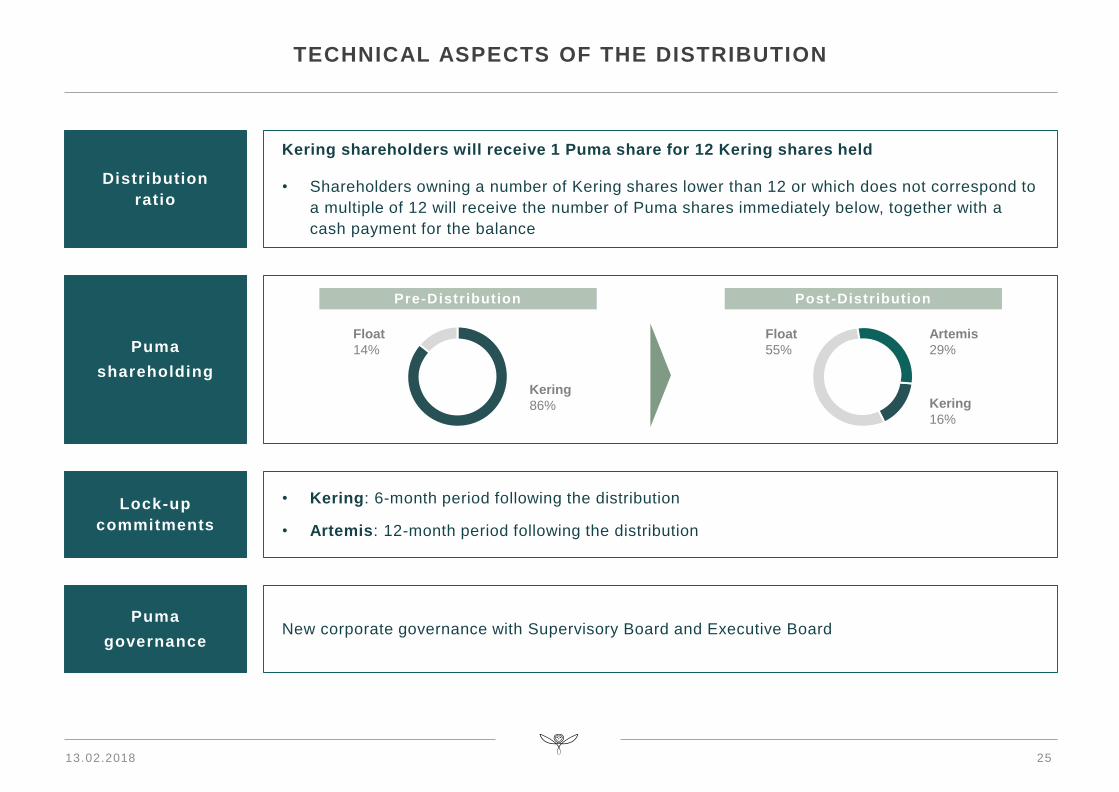
TECHNICAL ASPECTS OF THE DISTRIBUTION
Distribution
ratio
Kering shareholders will receive 1 Puma share for 12 Kering shares held
• Shareholders owning a number of Kering shares lower than 12 or which does not correspond to
a multiple of 12 will receive the number of Puma shares immediately below, together with a
cash payment for the balance
New corporate governance with Supervisory Board and Executive BoardPuma
governance
• Kering: 6-month period following the distribution
• Artemis: 12-month period following the distribution
Lock-up
commitments
Puma
shareholding
Float
14%
Kering
86%
Float
55%
Kering
16%
Artemis
29%
Post-DistributionPre-Distribution
25
13.02.2018
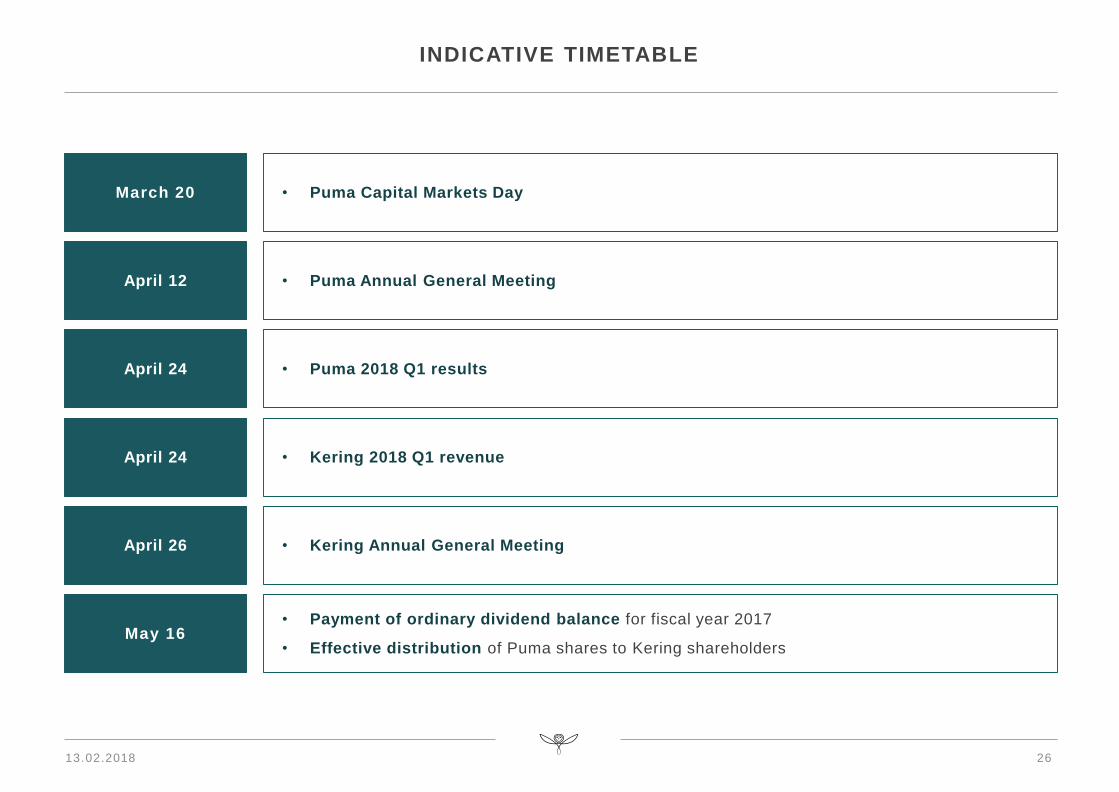
INDICATIVE TIMETABLE
26
May 16• Payment of ordinary dividend balance for fiscal year 2017
• Effective distribution of Puma shares to Kering shareholders
April 24 • Kering 2018 Q1 revenue
April 26 • Kering Annual General Meeting
April 24 • Puma 2018 Q1 results
March 20 • Puma Capital Markets Day
April 12 • Puma Annual General Meeting
13.02.2018
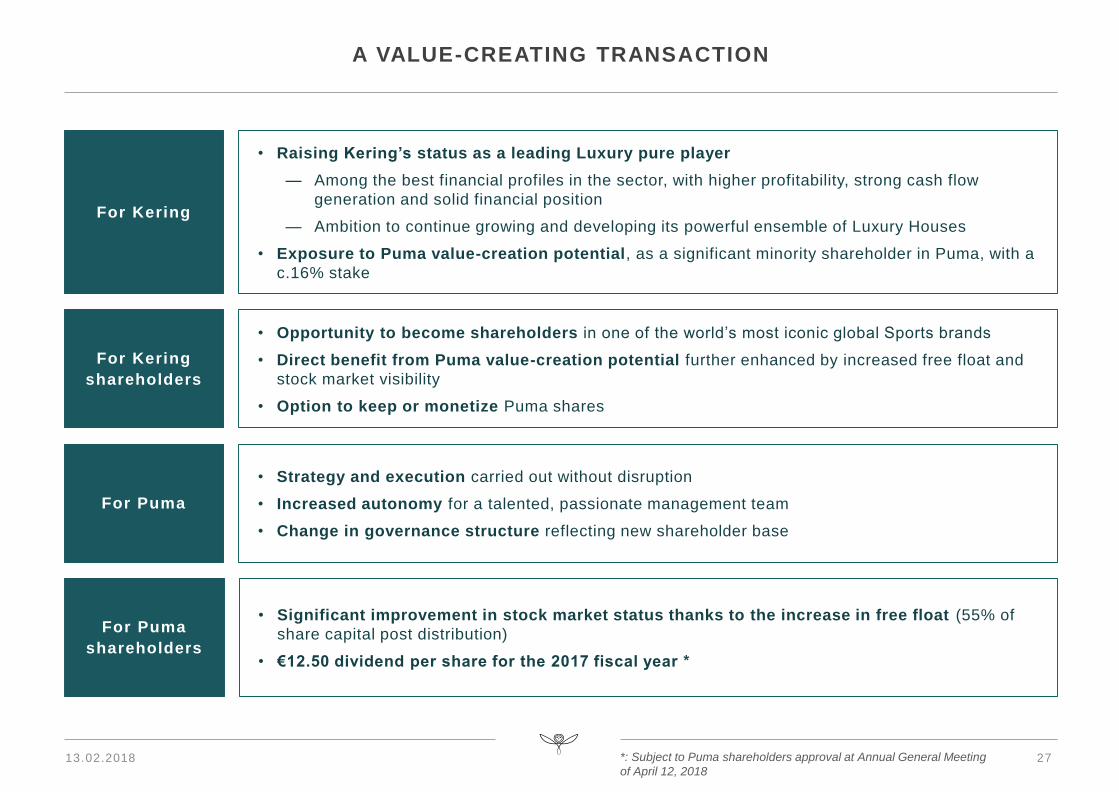
A VALUE-CREATING TRANSACTION
• Raising Kering’s status as a leading Luxury pure player
— Among the best financial profiles in the sector, with higher profitability, strong cash flow
generation and solid financial position
— Ambition to continue growing and developing its powerful ensemble of Luxury Houses
• Exposure to Puma value-creation potential, as a significant minority shareholder in Puma, with a
c.16% stake
• Strategy and execution carried out without disruption
• Increased autonomy for a talented, passionate management team
• Change in governance structure reflecting new shareholder base
• Opportunity to become shareholders in one of the world’s most iconic global Sports brands
• Direct benefit from Puma value-creation potential further enhanced by increased free float and
stock market visibility
• Option to keep or monetize Puma shares
27
For Puma
For Kering
For Kering
shareholders
For Puma
shareholders
• Significant improvement in stock market status thanks to the increase in free float (55% of
share capital post distribution)
• €12.50 dividend per share for the 2017 fiscal year *
*: Subject to Puma shareholders approval at Annual General Meeting
of April 12, 2018
NEW PROFILE: STRATEGY AND AMBITIONS
FRANÇOIS-HENRI PINAULT
CHAIRMAN AND CEO
29
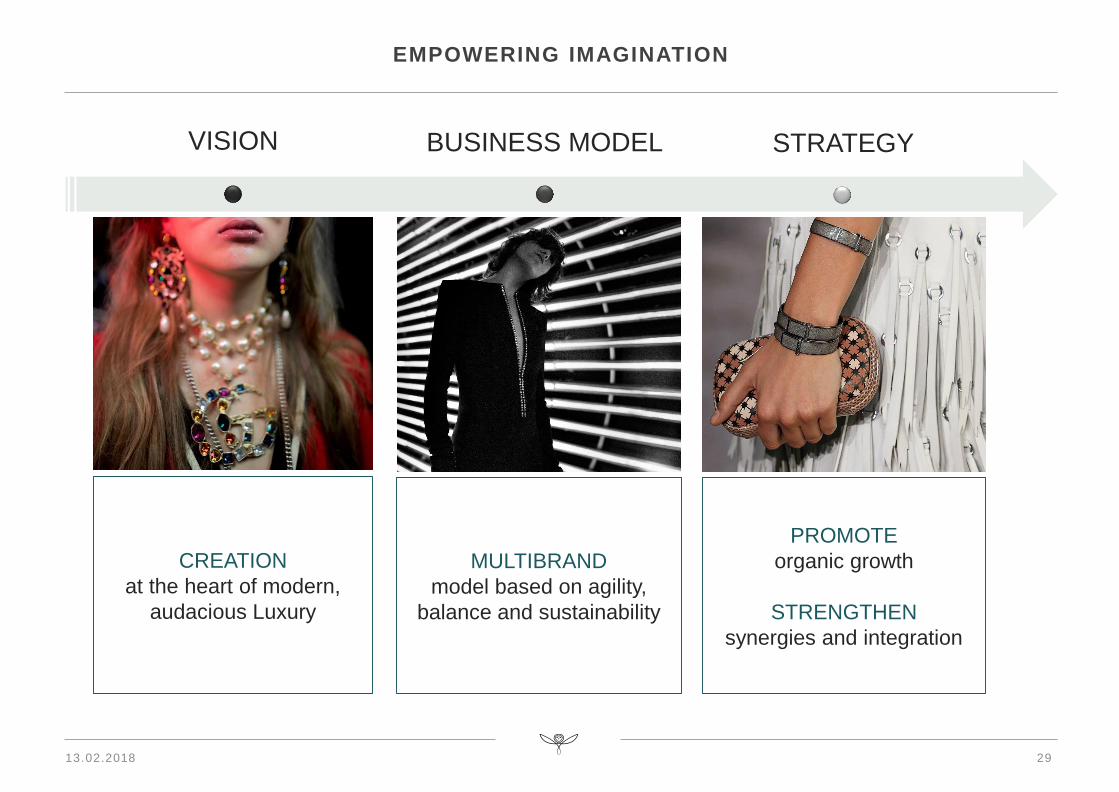
EMPOWERING IMAGINATION
VISION BUSINESS MODEL STRATEGY
CREATION
at the heart of modern,
audacious Luxury
PROMOTE
organic growth
STRENGTHEN
synergies and integration
MULTIBRAND
model based on agility,
balance and sustainability
13.02.2018
CREATIVITY
30
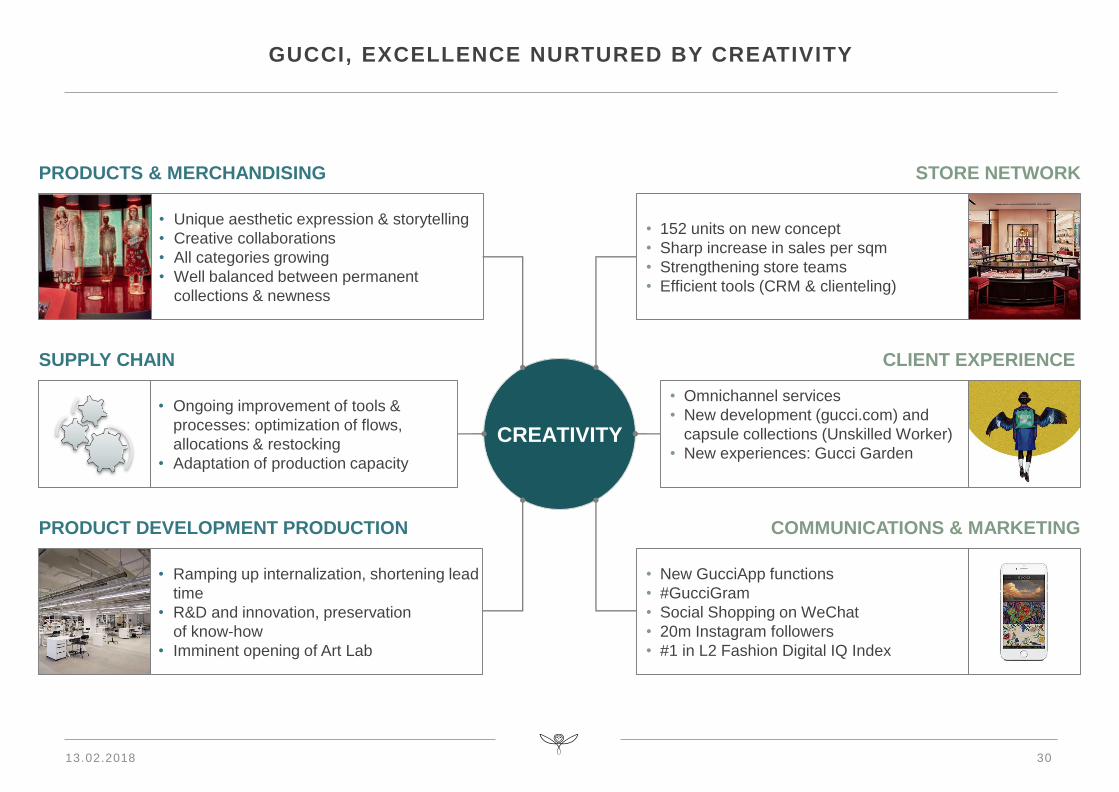
GUCCI, EXCELLENCE NURTURED BY CREATIVITY
STORE NETWORK
CLIENT EXPERIENCE
• 152 units on new concept
• Sharp increase in sales per sqm
• Strengthening store teams
• Efficient tools (CRM & clienteling)
• Omnichannel services
• New development (gucci.com) and
capsule collections (Unskilled Worker)
• New experiences: Gucci Garden
• New GucciApp functions
• #GucciGram
• Social Shopping on WeChat
• 20m Instagram followers
• #1 in L2 Fashion Digital IQ Index
COMMUNICATIONS & MARKETING
PRODUCTS & MERCHANDISING
SUPPLY CHAIN
PRODUCT DEVELOPMENT PRODUCTION
• Ongoing improvement of tools &
processes: optimization of flows,
allocations & restocking
• Adaptation of production capacity
• Ramping up internalization, shortening lead
time
• R&D and innovation, preservation
of know-how
• Imminent opening of Art Lab
• Unique aesthetic expression & storytelling
• Creative collaborations
• All categories growing
• Well balanced between permanent
collections & newness
13.02.2018
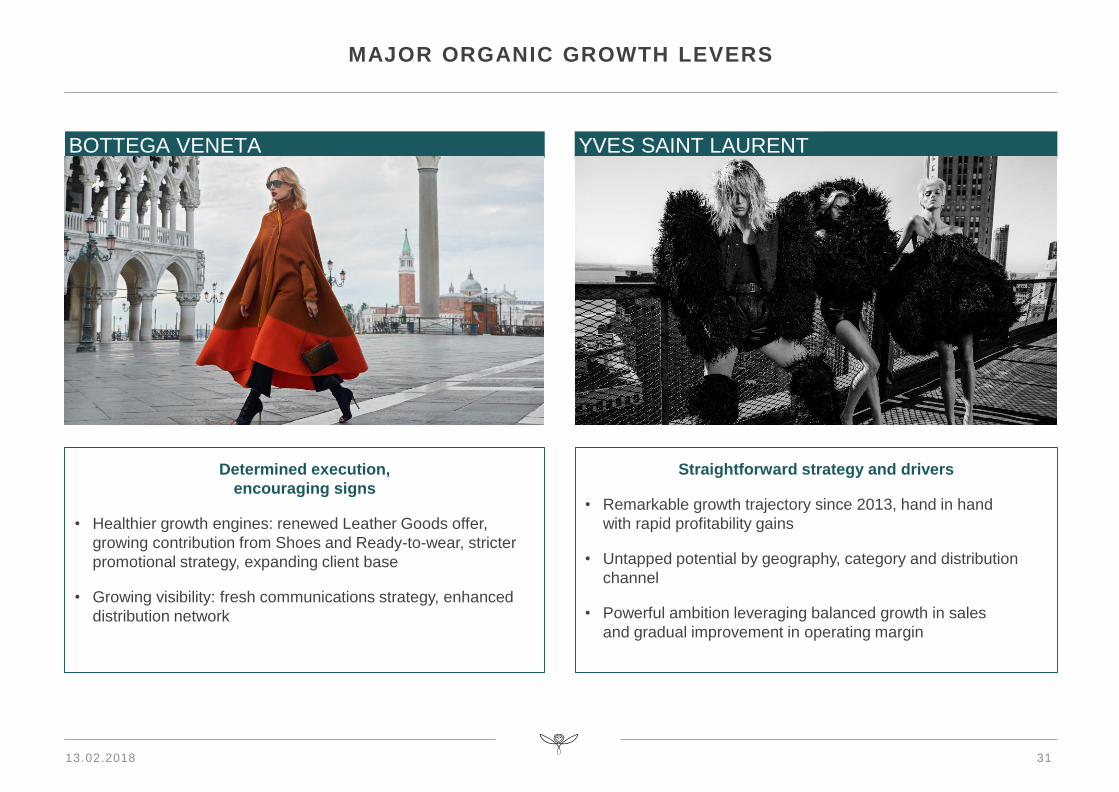
MAJOR ORGANIC GROWTH LEVERS
31
BOTTEGA VENETA YVES SAINT LAURENT
Determined execution,
encouraging signs
• Healthier growth engines: renewed Leather Goods offer,
growing contribution from Shoes and Ready-to-wear, stricter
promotional strategy, expanding client base
• Growing visibility: fresh communications strategy, enhanced
distribution network
Straightforward strategy and drivers
• Remarkable growth trajectory since 2013, hand in hand
with rapid profitability gains
• Untapped potential by geography, category and distribution
channel
• Powerful ambition leveraging balanced growth in sales
and gradual improvement in operating margin
13.02.2018
32
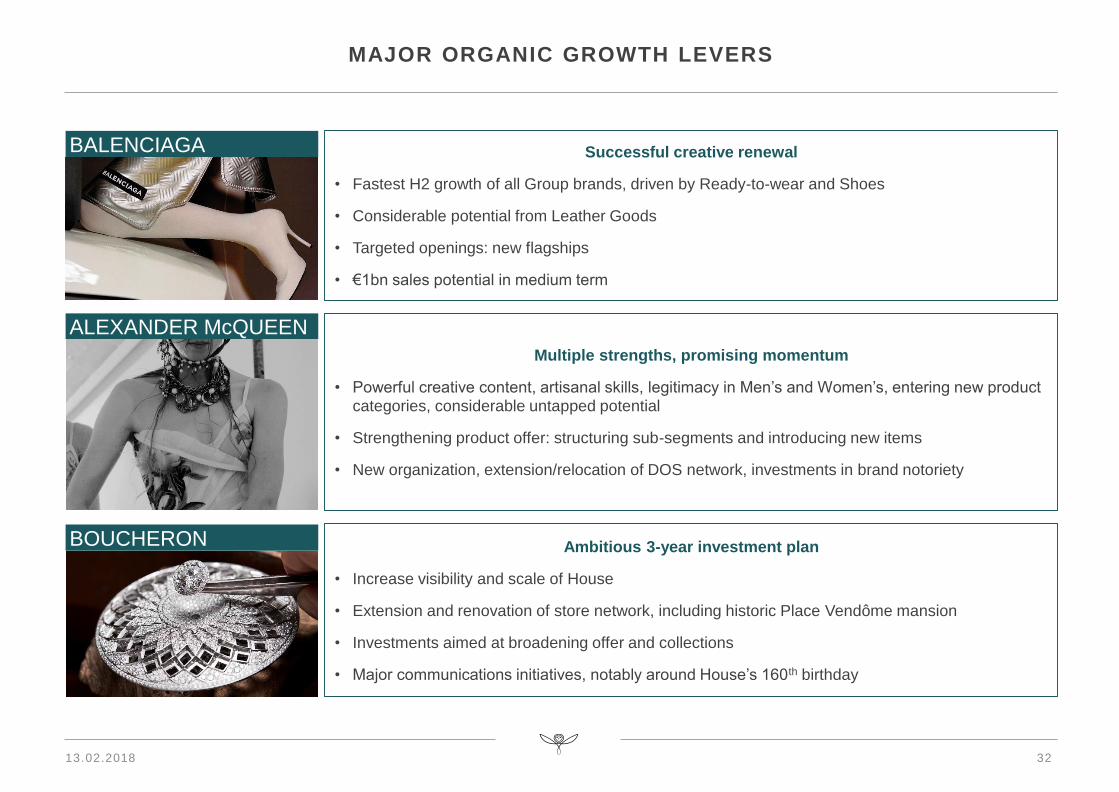
MAJOR ORGANIC GROWTH LEVERS
Successful creative renewal
• Fastest H2 growth of all Group brands, driven by Ready-to-wear and Shoes
• Considerable potential from Leather Goods
• Targeted openings: new flagships
• €1bn sales potential in medium term
Ambitious 3-year investment plan
• Increase visibility and scale of House
• Extension and renovation of store network, including historic Place Vendôme mansion
• Investments aimed at broadening offer and collections
• Major communications initiatives, notably around House’s 160th birthday
Multiple strengths, promising momentum
• Powerful creative content, artisanal skills, legitimacy in Men’s and Women’s, entering new product categories, considerable untapped potential
• Strengthening product offer: structuring sub-segments and introducing new items
• New organization, extension/relocation of DOS network, investments in brand notoriety
BALENCIAGA
ALEXANDER McQUEEN
BOUCHERON
13.02.2018
33
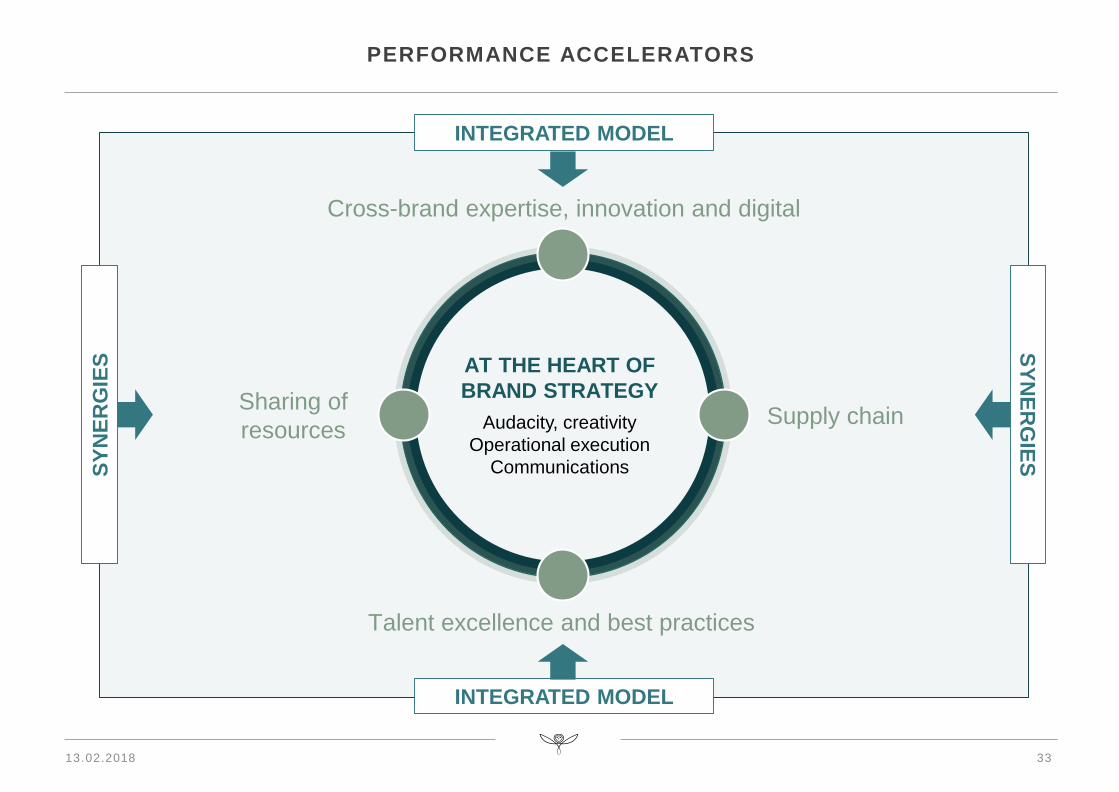
PERFORMANCE ACCELERATORS
AT THE HEART OF
BRAND STRATEGY
Audacity, creativity
Operational execution
Communications
Sharing of
resourcesSupply chain
Cross-brand expertise, innovation and digital
Talent excellence and best practices
INTEGRATED MODEL
SY
NE
RG
IES
SY
NE
RG
IES
INTEGRATED MODEL
13.02.2018
34
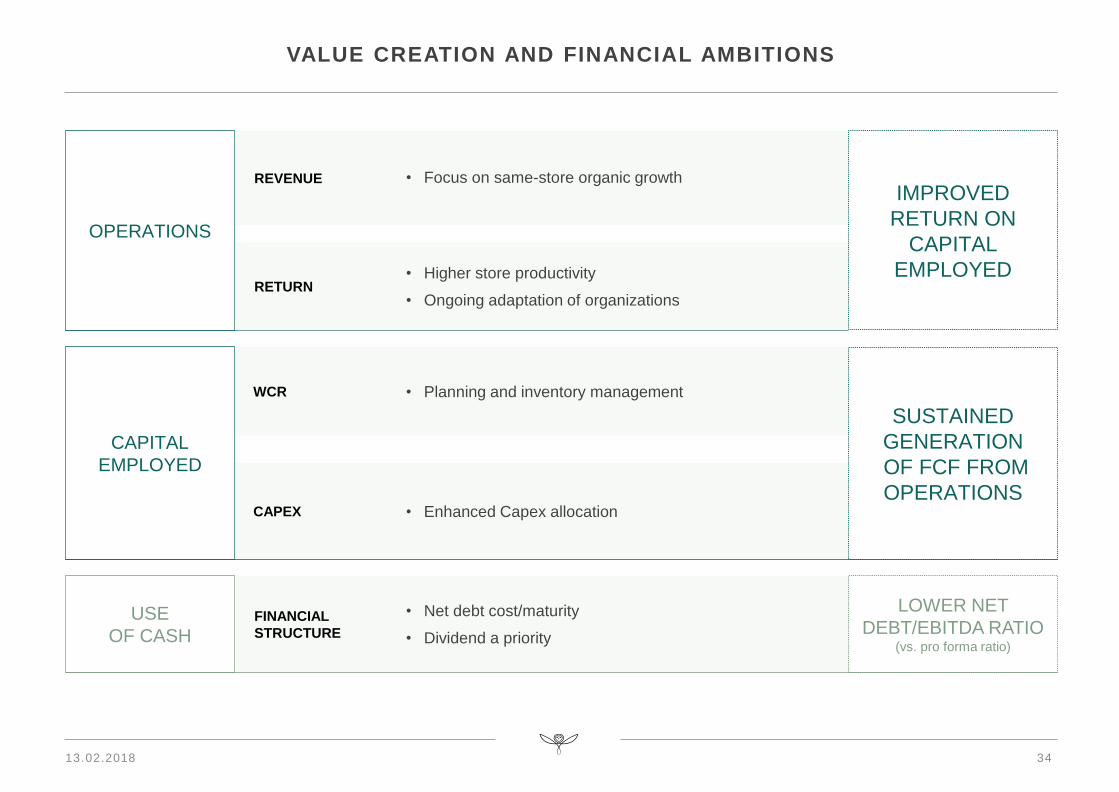
VALUE CREATION AND FINANCIAL AMBITIONS
REVENUE
RETURN
FINANCIAL
STRUCTURE
WCR
CAPEX • Enhanced Capex allocation
OPERATIONS
CAPITAL
EMPLOYED
USE
OF CASH
• Focus on same-store organic growth
LOWER NET
DEBT/EBITDA RATIO (vs. pro forma ratio)
• Higher store productivity
• Ongoing adaptation of organizations
• Net debt cost/maturity
• Dividend a priority
• Planning and inventory management
IMPROVED
RETURN ON
CAPITAL
EMPLOYED
SUSTAINED
GENERATION
OF FCF FROM
OPERATIONS
13.02.2018

Q&A
Appendix
37
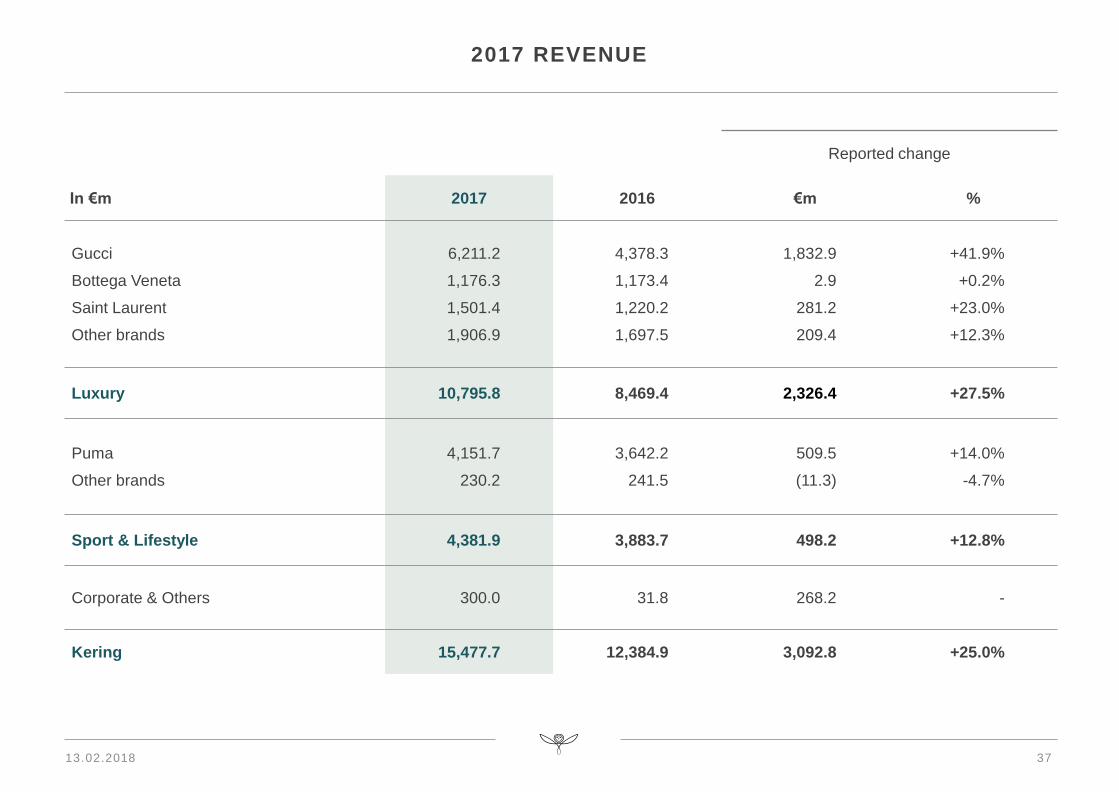
2017 REVENUE
Reported change
In €m 2017 2016 €m %
Gucci
Bottega Veneta
Saint Laurent
Other brands
6,211.2
1,176.3
1,501.4
1,906.9
4,378.3
1,173.4
1,220.2
1,697.5
1,832.9
2.9
281.2
209.4
+41.9%
+0.2%
+23.0%
+12.3%
Luxury 10,795.8 8,469.4 2,326.4 +27.5%
Puma
Other brands
4,151.7
230.2
3,642.2
241.5
509.5
(11.3)
+14.0%
-4.7%
Sport & Lifestyle 4,381.9 3,883.7 498.2 +12.8%
Corporate & Others 300.0 31.8 268.2 -
Kering 15,477.7 12,384.9 3,092.8 +25.0%
13.02.2018
y-o-y change
In €m % comparable % reported
Q1 17
Q2 17
Q3 17
Q4 17
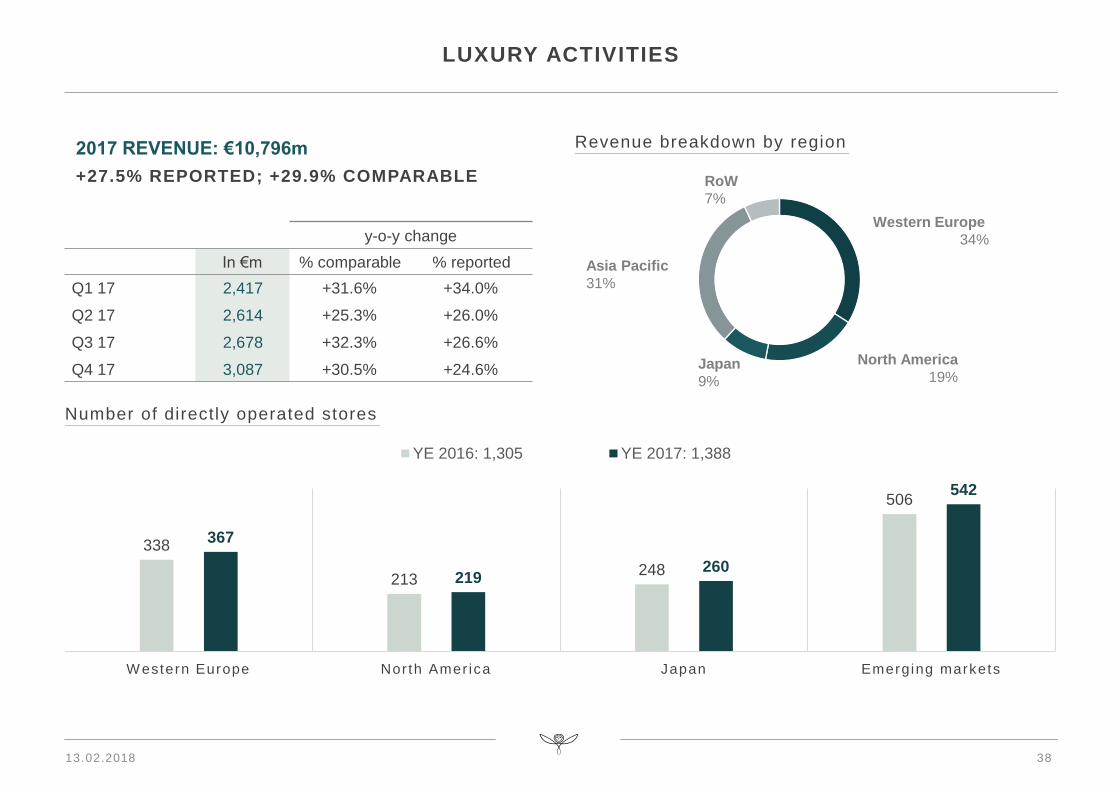
2,417
2,614
2,678
3,087
+31.6%
+25.3%
+32.3%
+30.5%
+34.0%
+26.0%
+26.6%
+24.6%
38
2017 REVENUE: €10,796m
+27.5% REPORTED; +29.9% COMPARABLE
LUXURY ACTIVITIES
Western Europe
34%
North America
19%Japan
9%
Asia Pacific
31%
RoW
7%
Number of directly operated stores
338
213248
506
367
219260
542
W estern Europe Nor th Amer ica Japan Emerging markets
YE 2016: 1,305 YE 2017: 1,388
Revenue breakdown by region
13.02.2018
y-o-y change
In €m % comparable % reported
Q1 17
Q2 17
Q3 17
Q4 17
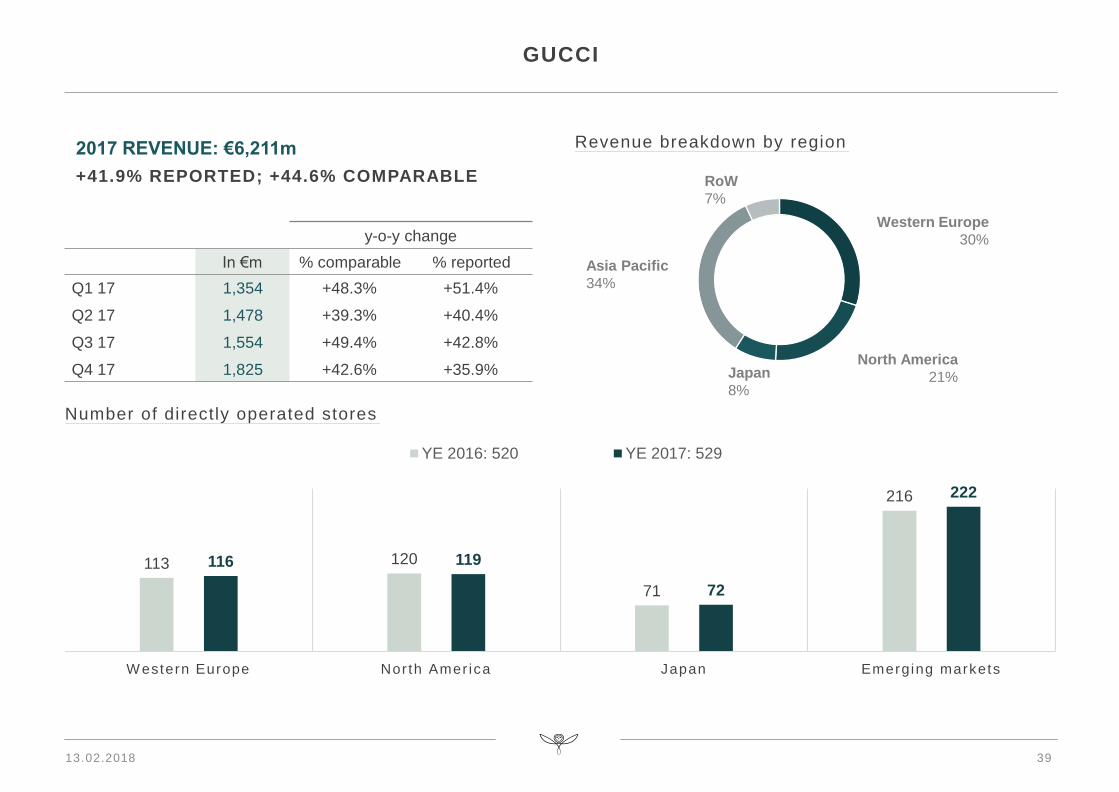
1,354
1,478
1,554
1,825
+48.3%
+39.3%
+49.4%
+42.6%
+51.4%
+40.4%
+42.8%
+35.9%
39
2017 REVENUE: €6,211m
+41.9% REPORTED; +44.6% COMPARABLE
GUCCI
Western Europe
30%
North America
21%Japan
8%
Asia Pacific
34%
RoW
7%
Number of directly operated stores
113 120
71
216
116 119
72
222
W estern Europe Nor th Amer ica Japan Emerging markets
YE 2016: 520 YE 2017: 529
Revenue breakdown by region
13.02.2018
y-o-y change
In €m % comparable % reported
Q1 17
Q2 17
Q3 17
Q4 17
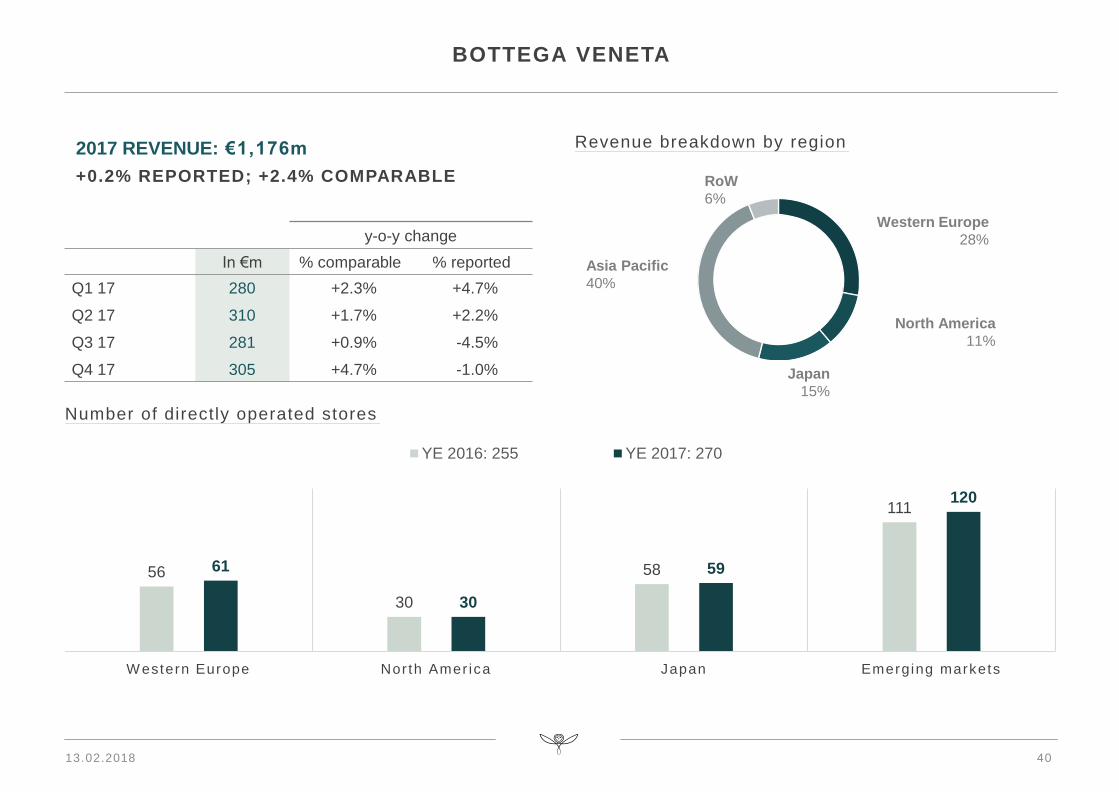
280
310
281
305
+2.3%
+1.7%
+0.9%
+4.7%
+4.7%
+2.2%
-4.5%
-1.0%
40
2017 REVENUE: €1,176m
+0.2% REPORTED; +2.4% COMPARABLE
BOTTEGA VENETA
Western Europe
28%
North America
11%
Japan
15%
Asia Pacific
40%
RoW
6%
Number of directly operated stores
56
30
58
111
61
30
59
120
W estern Europe Nor th Amer ica Japan Emerging markets
YE 2016: 255 YE 2017: 270
Revenue breakdown by region
13.02.2018
y-o-y change
In €m % comparable % reported
Q1 17
Q2 17
Q3 17
Q4 17
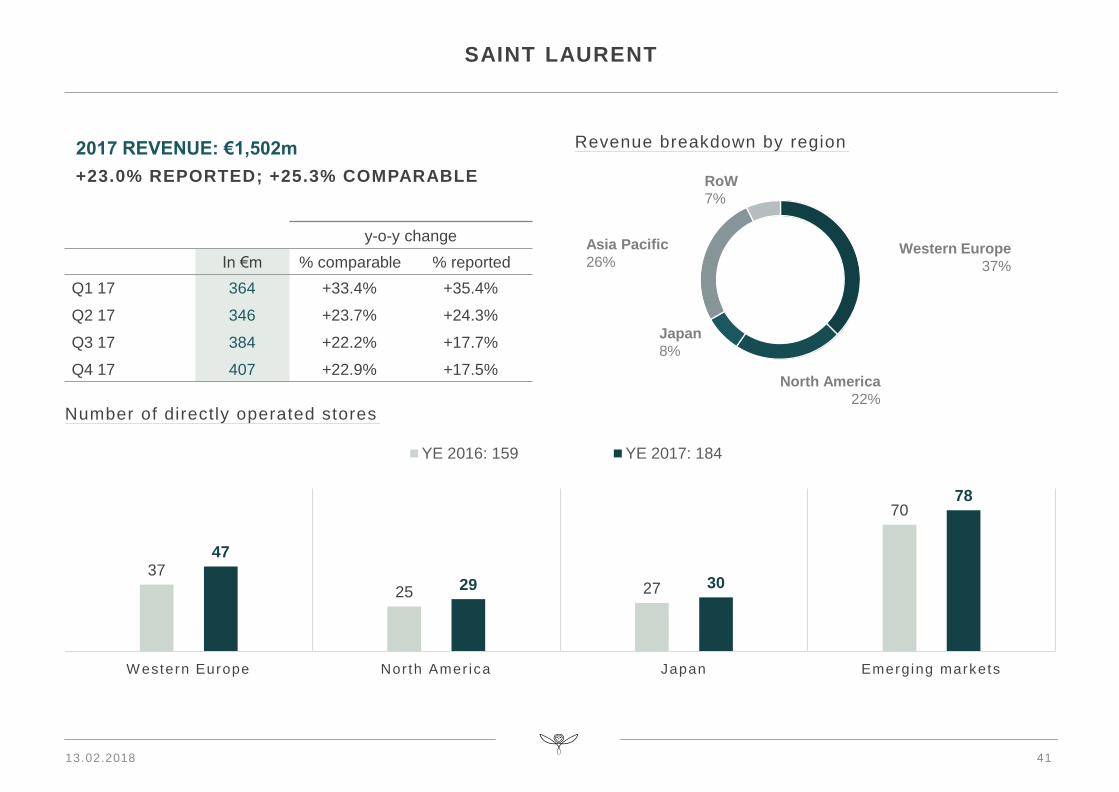
364
346
384
407
+33.4%
+23.7%
+22.2%
+22.9%
+35.4%
+24.3%
+17.7%
+17.5%
41
2017 REVENUE: €1,502m
+23.0% REPORTED; +25.3% COMPARABLE
SAINT LAURENT
Western Europe
37%
North America
22%
Japan
8%
Asia Pacific
26%
RoW
7%
Number of directly operated stores
37
25 27
70
47
29 30
78
W estern Europe Nor th Amer ica Japan Emerging markets
YE 2016: 159 YE 2017: 184
Revenue breakdown by region
13.02.2018
y-o-y change
In €m % comparable % reported
Q1 17
Q2 17
Q3 17
Q4 17
418
479
460
550
+11.1%
+9.1%
+17.0%
+18.8%
+12.3%
+9.2%
+13.0%
+14.7%
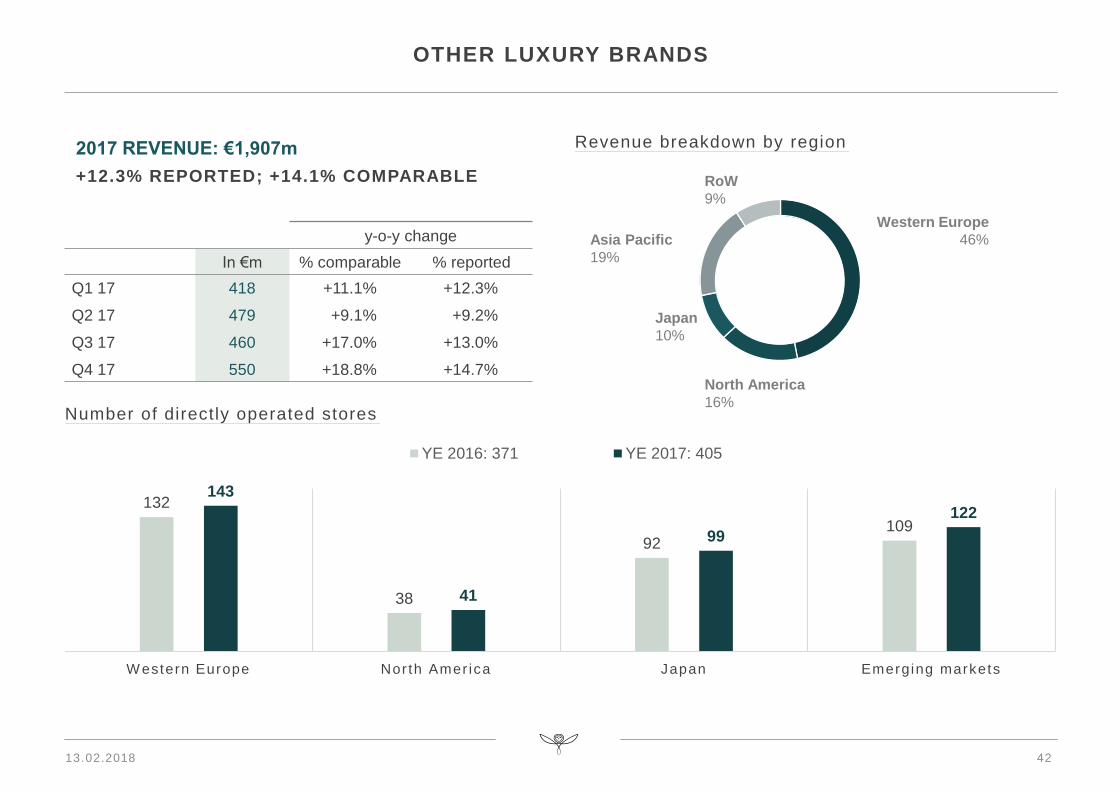
42
2017 REVENUE: €1,907m
+12.3% REPORTED; +14.1% COMPARABLE
OTHER LUXURY BRANDS
Western Europe
46%
North America
16%
Japan
10%
Asia Pacific
19%
RoW
9%
Number of directly operated stores
132
38
92109
143
41
99
122
W estern Europe Nor th Amer ica Japan Emerging markets
YE 2016: 371 YE 2017: 405
Revenue breakdown by region
13.02.2018
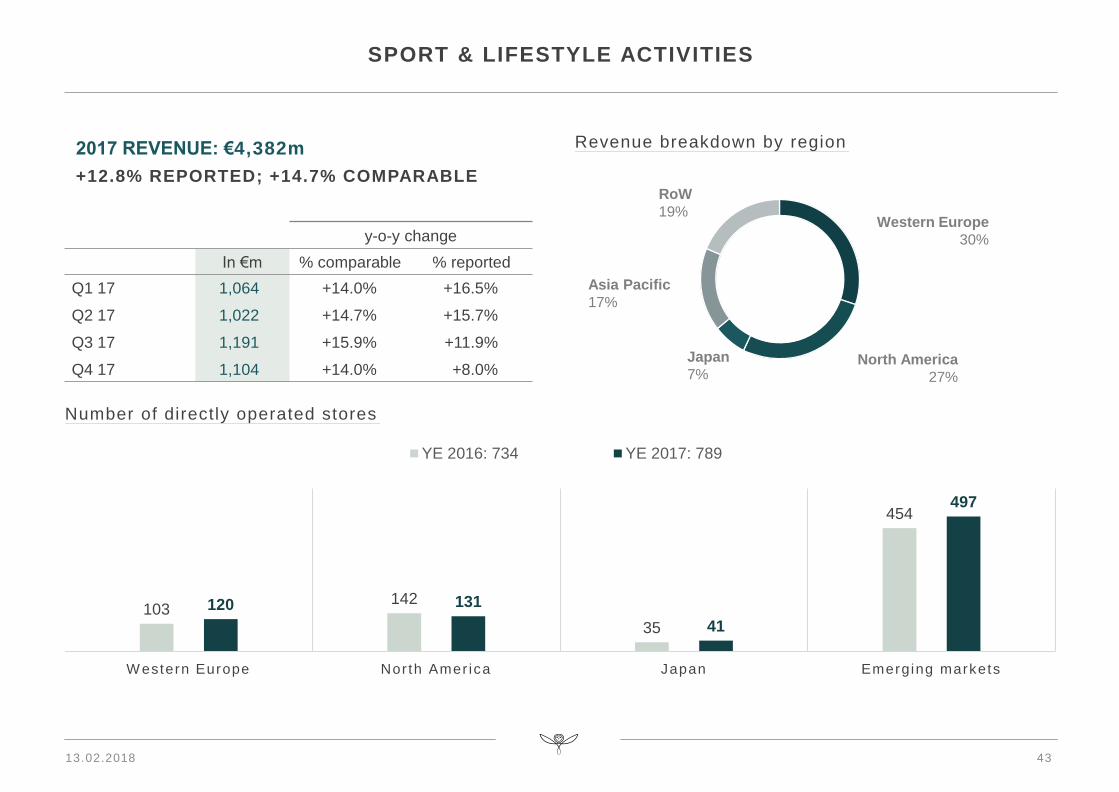
y-o-y change
In €m % comparable % reported
Q1 17
Q2 17
Q3 17
Q4 17
1,064
1,022
1,191
1,104
+14.0%
+14.7%
+15.9%
+14.0%
+16.5%
+15.7%
+11.9%
+8.0%
43
2017 REVENUE: €4,382m
+12.8% REPORTED; +14.7% COMPARABLE
SPORT & LIFESTYLE ACTIVITIES
Western Europe
30%
North America
27%
Japan
7%
Asia Pacific
17%
RoW
19%
Revenue breakdown by region
Number of directly operated stores
103142
35
454
120 131
41
497
W estern Europe Nor th Amer ica Japan Emerging markets
YE 2016: 734 YE 2017: 789
13.02.2018
44
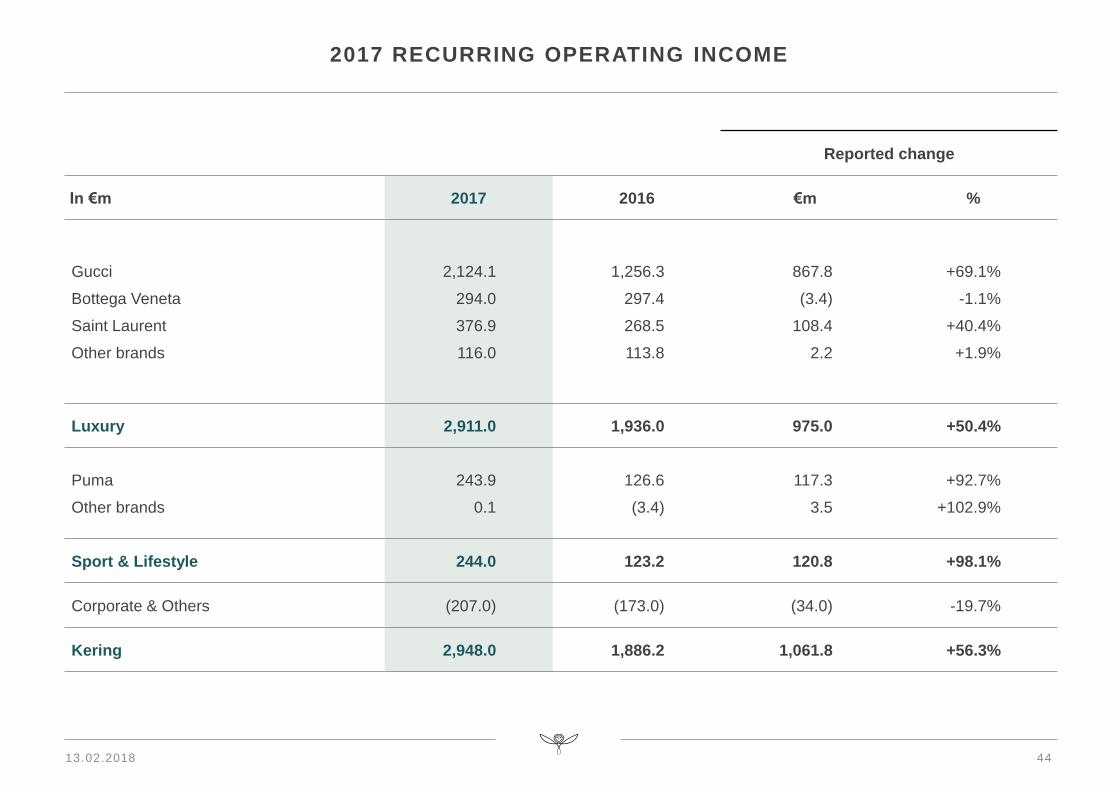
2017 RECURRING OPERATING INCOME
Reported change
In €m 2017 2016 €m %
Gucci
Bottega Veneta
Saint Laurent
Other brands
2,124.1
294.0
376.9
116.0
1,256.3
297.4
268.5
113.8
867.8
(3.4)
108.4
2.2
+69.1%
-1.1%
+40.4%
+1.9%
Luxury 2,911.0 1,936.0 975.0 +50.4%
Puma
Other brands
243.9
0.1
126.6
(3.4)
117.3
3.5
+92.7%
+102.9%
Sport & Lifestyle 244.0 123.2 120.8 +98.1%
Corporate & Others (207.0) (173.0) (34.0) -19.7%
Kering 2,948.0 1,886.2 1,061.8 +56.3%
13.02.2018
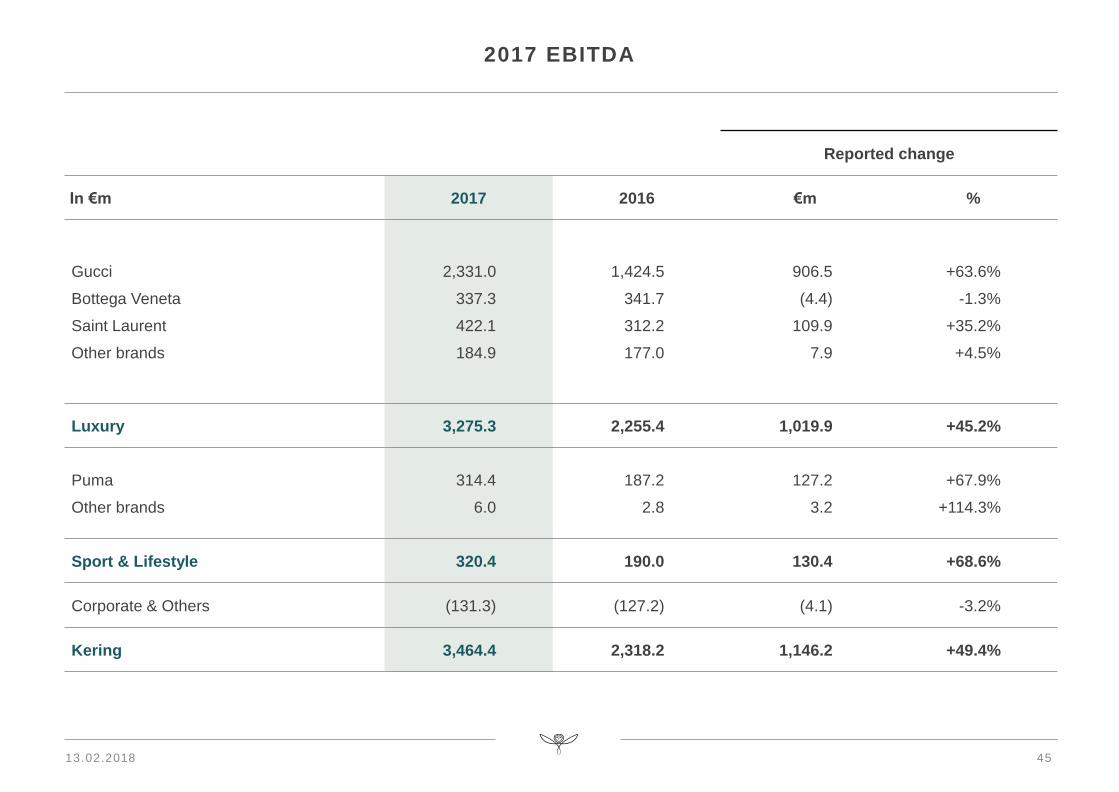
45
2017 EBITDA
Reported change
In €m 2017 2016 €m %
Gucci
Bottega Veneta
Saint Laurent
Other brands
2,331.0
337.3
422.1
184.9
1,424.5
341.7
312.2
177.0
906.5
(4.4)
109.9
7.9
+63.6%
-1.3%
+35.2%
+4.5%
Luxury 3,275.3 2,255.4 1,019.9 +45.2%
Puma
Other brands
314.4
6.0
187.2
2.8
127.2
3.2
+67.9%
+114.3%
Sport & Lifestyle 320.4 190.0 130.4 +68.6%
Corporate & Others (131.3) (127.2) (4.1) -3.2%
Kering 3,464.4 2,318.2 1,146.2 +49.4%
13.02.2018
46
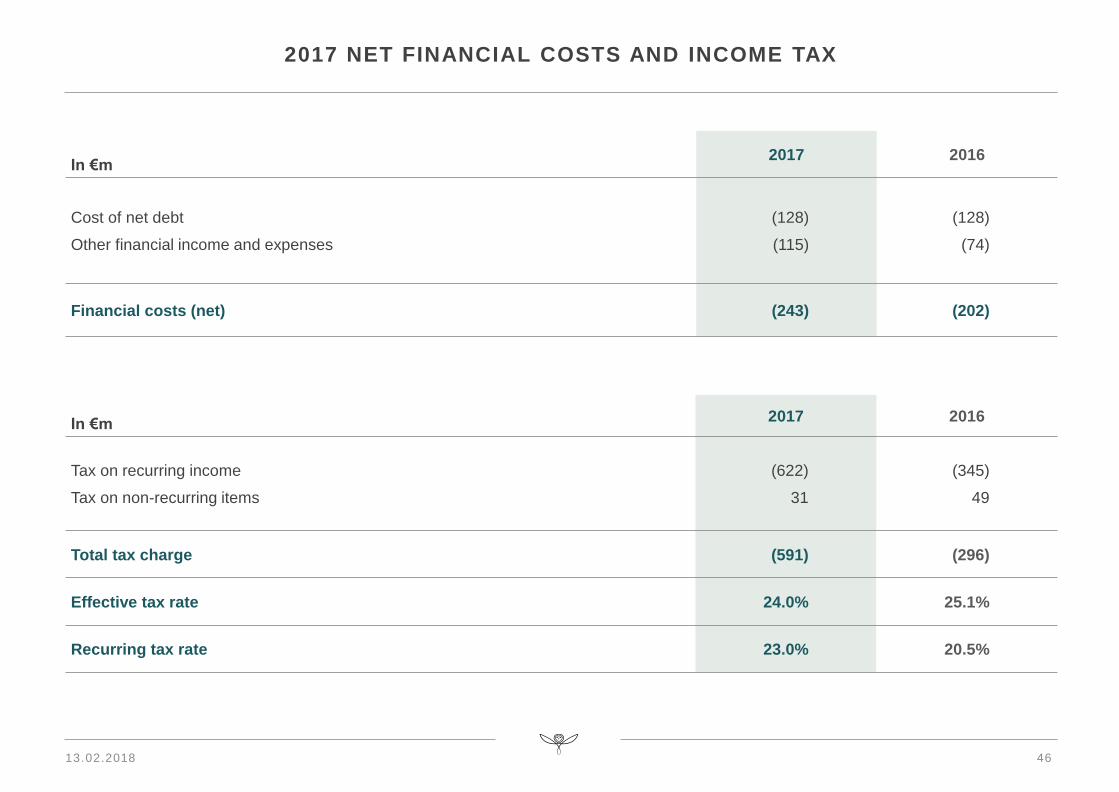
2017 NET FINANCIAL COSTS AND INCOME TAX
In €m2017 2016
Cost of net debt
Other financial income and expenses
(128)
(115)
(128)
(74)
Financial costs (net) (243) (202)
In €m2017 2016
Tax on recurring income
Tax on non-recurring items
(622)
31
(345)
49
Total tax charge (591) (296)
Effective tax rate 24.0% 25.1%
Recurring tax rate 23.0% 20.5%
13.02.2018
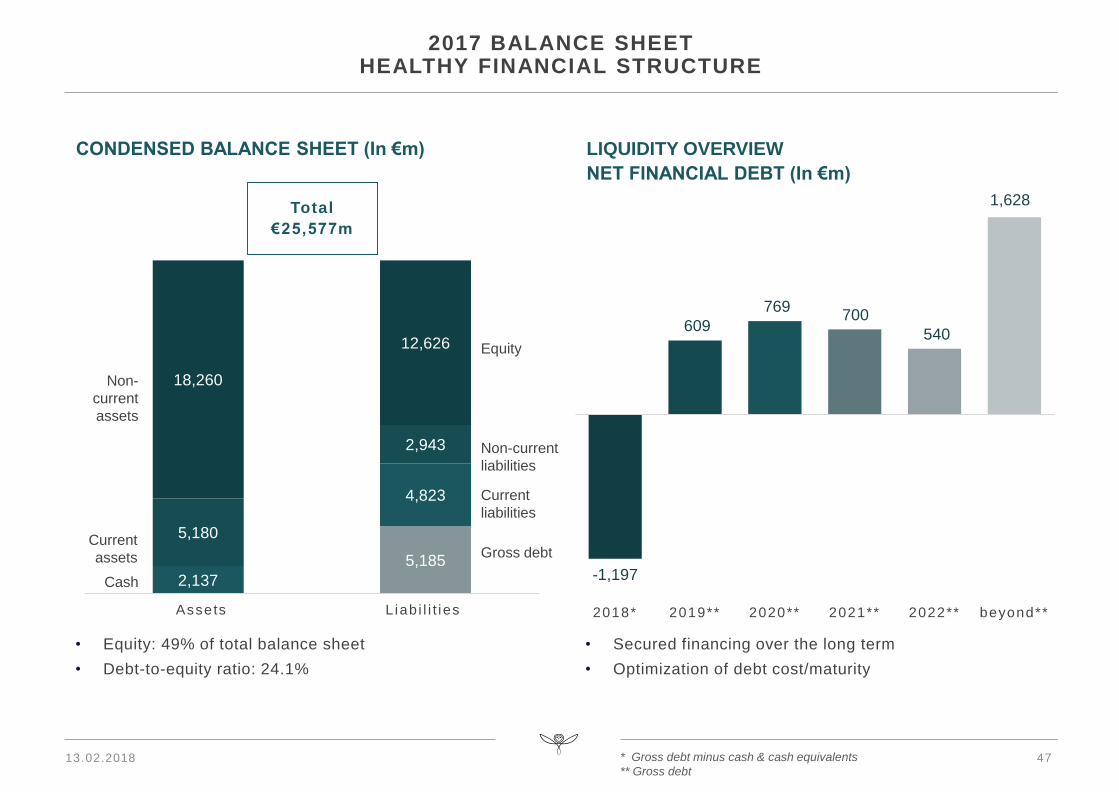
5,185
2,137
4,823
5,180
2,943
18,260
12,626
Actif Passif
2017 BALANCE SHEETHEALTHY FINANCIAL STRUCTURE
-1,197
609
769 700
540
1,628
2018* 2019** 2020** 2021** 2022** beyond**
Total
€25,577m
• Equity: 49% of total balance sheet
• Debt-to-equity ratio: 24.1%
• Secured financing over the long term
• Optimization of debt cost/maturity
Current
assets
Non-
current
assets
Cash
Equity
Gross debt
CONDENSED BALANCE SHEET (In €m) LIQUIDITY OVERVIEW
NET FINANCIAL DEBT (In €m)
Non-current
liabilities
Current
liabilities
Assets L iab i l i t ies
13.02.2018 47* Gross debt minus cash & cash equivalents
** Gross debt
48
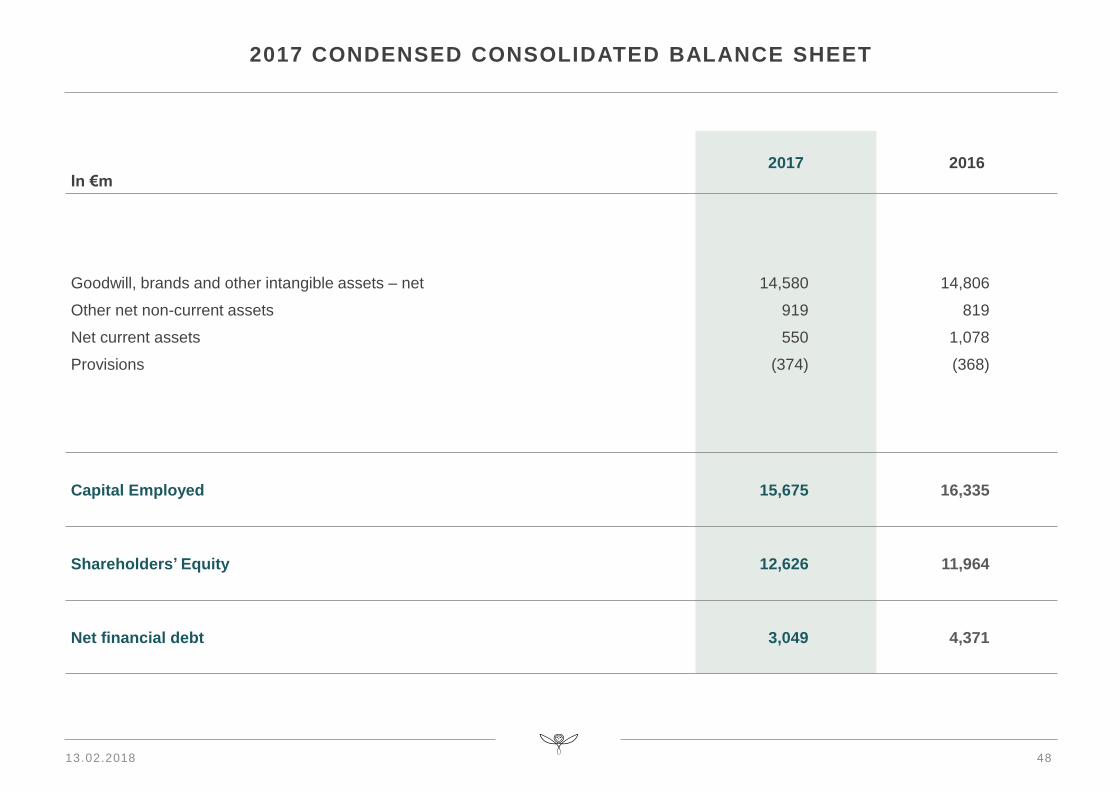
2017 CONDENSED CONSOLIDATED BALANCE SHEET
In €m2017 2016
Goodwill, brands and other intangible assets – net
Other net non-current assets
Net current assets
Provisions
14,580
919
550
(374)
14,806
819
1,078
(368)
Capital Employed 15,675 16,335
Shareholders’ Equity 12,626 11,964
Net financial debt 3,049 4,371
13.02.2018
13.02.2018
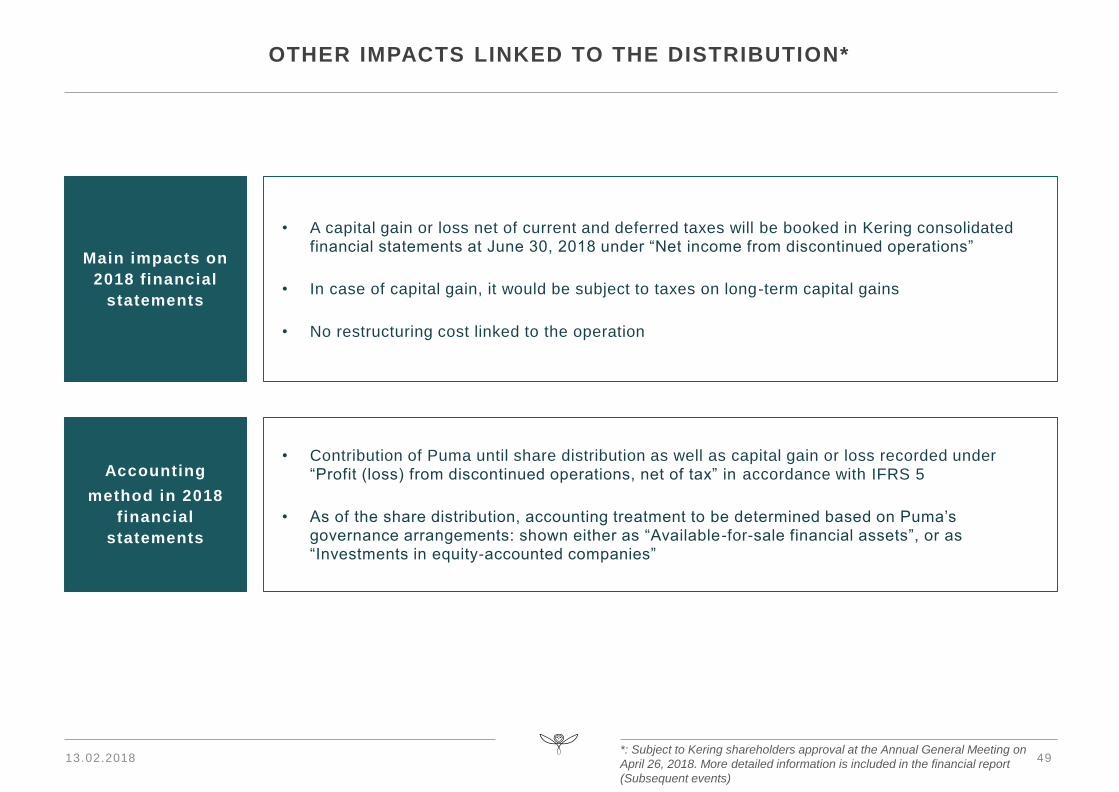
OTHER IMPACTS LINKED TO THE DISTRIBUTION*
Main impacts on
2018 financial
statements
• A capital gain or loss net of current and deferred taxes will be booked in Kering consolidated financial statements at June 30, 2018 under “Net income from discontinued operations”
• In case of capital gain, it would be subject to taxes on long-term capital gains
• No restructuring cost linked to the operation
Accounting
method in 2018
financial
statements
• Contribution of Puma until share distribution as well as capital gain or loss recorded under
“Profit (loss) from discontinued operations, net of tax” in accordance with IFRS 5
• As of the share distribution, accounting treatment to be determined based on Puma’s governance arrangements: shown either as “Available-for-sale financial assets”, or as “Investments in equity-accounted companies”
49*: Subject to Kering shareholders approval at the Annual General Meeting on
April 26, 2018. More detailed information is included in the financial report
(Subsequent events)
Gucci • Bottega Veneta • Saint Laurent • Balenciaga • Alexander McQueen • McQ
Stella McCartney • Brioni • Christopher Kane • Tomas Maier
Boucheron • Pomellato • Dodo • Qeelin • Ulysse Nardin • Girard -Perregaux
Puma • Cobra • Volcom
Kering Eyewear