Discharge Monitoring Reports - files.dep.state.pa.usfiles.dep.state.pa.us/Water/Wastewater...
75
Discharge Monitoring Reports
Transcript of Discharge Monitoring Reports - files.dep.state.pa.usfiles.dep.state.pa.us/Water/Wastewater...

Discharge Monitoring Reports

• As a result of this training, you should be able to understand:
– The general requirements associated with DMR reporting (due dates, types of reports, etc.)
– The general requirements associated with sampling and analysis
– How to calculate statistics properly and complete DMRs properly
Objectives

• This training is organized as follows:
– General DMR Requirements
– Sampling & Analysis Requirements
– Calculations & Completing DMRs
Objectives
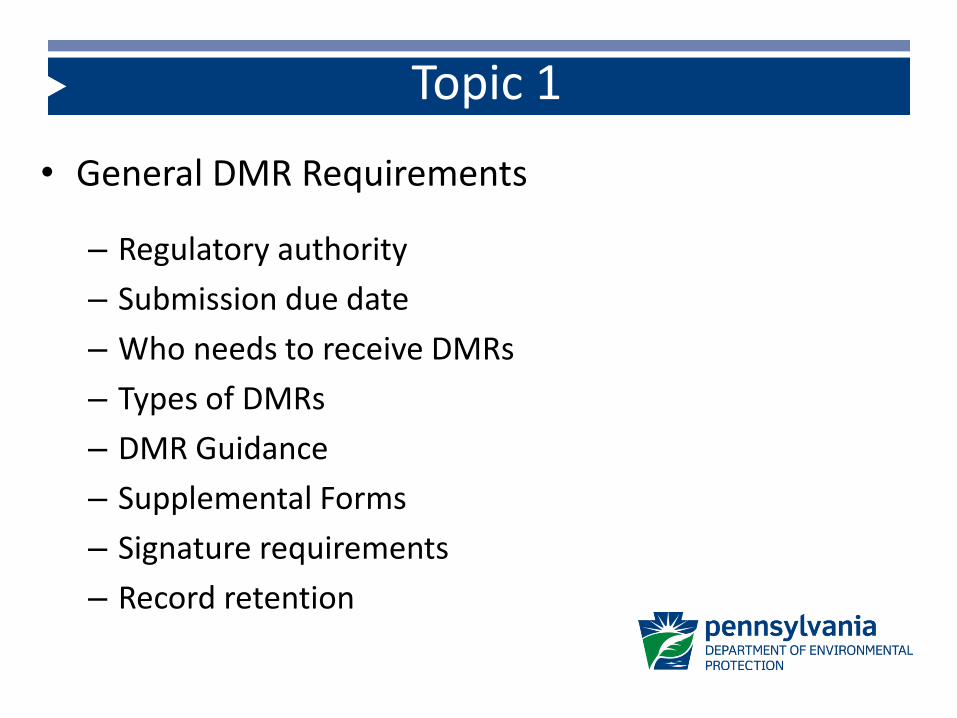
• General DMR Requirements
– Regulatory authority
– Submission due date
– Who needs to receive DMRs
– Types of DMRs
– DMR Guidance
– Supplemental Forms
– Signature requirements
– Record retention
Topic 1

• Discharge Monitoring Reports (DMRs) are reports submitted by NPDES permittees to permitting authorities to document self-monitoring activities that must be conducted to comply with NPDES permits. (DMRs may also be required for WQM permits).
• DMR Supplemental Reports request additional information beyond the DMRs (e.g., biosolids management, process control, hauled-in wastes, etc.).
General DMR Requirements

• The requirement to submit DMRs comes from two regulations:
– Federal regulations – 40 CFR 122.41(l)(4)(i)
– State regulations – 25 Pa. Code § 92a.61(g) (this regulation also gives DEP authority to request additional information, i.e., supplemental forms)
General DMR Requirements
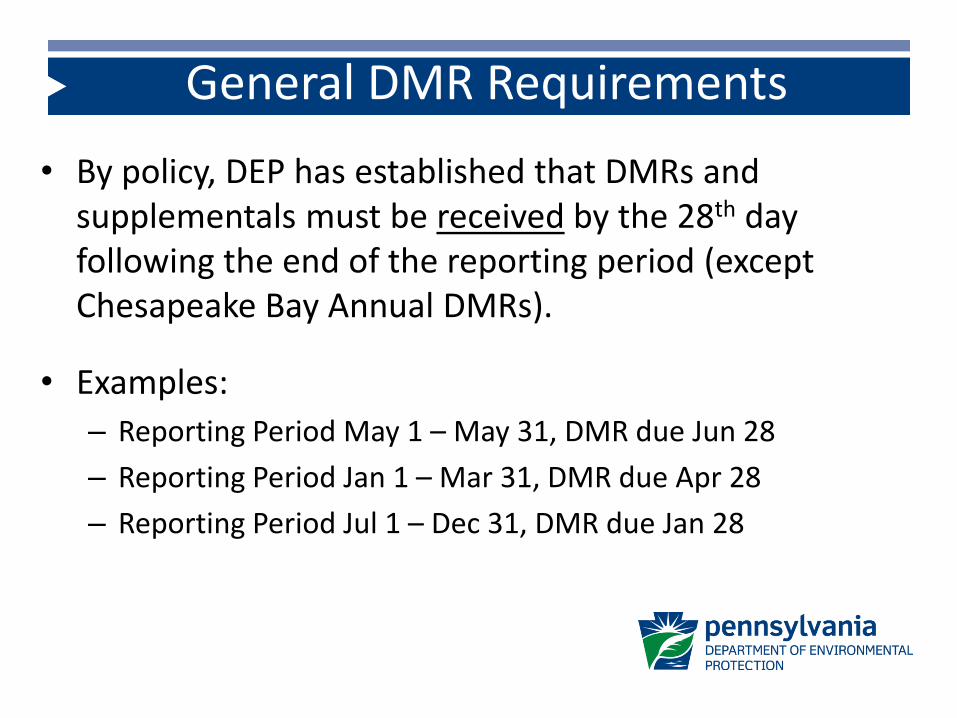
• By policy, DEP has established that DMRs and supplementals must be received by the 28th day following the end of the reporting period (except Chesapeake Bay Annual DMRs).
• Examples:
– Reporting Period May 1 – May 31, DMR due Jun 28
– Reporting Period Jan 1 – Mar 31, DMR due Apr 28
– Reporting Period Jul 1 – Dec 31, DMR due Jan 28
General DMR Requirements

• Submission can be made on paper or electronically (eDMR system).
• Part A pollutant limits table(s) in NPDES permits establish the requirements for DMRs.
• When reviewing paper or electronic DMR templates, always verify accuracy of the template by checking the Part A pollutant limits tables.
General DMR Requirements

• Paper DMR submissions:
– Use DMR template attached to permit
– If a “Major” or “Significant Minor” facility, you will receive “pre-print” DMRs from EPA. When received, begin using these DMRs
– Submit to DEP office that issued the permit (with supplementals) and, if necessary, to EPA (without supplementals) and other agencies (e.g., DRBC)
• Electronic DMR submissions: one submission, attach supplementals
General DMR Requirements

• Types of DMRs:
– Monthly
– Quarterly
– Semiannual
– Annual
• The parameters that appear on DMRs are generally based on required sampling frequency
• Newly issued/reissued permits require calendar-based reporting periods
General DMR Requirements

• Guidance for completing DMRs is contained in the following documents:
– “Discharge Monitoring Reports Overview and Summary” (3800-DEP-BK3047)
– “DMR Instructions” (3800-FM-BPNPSM0463)
– “Management of ‘Non-Detect Results’ for Discharge Monitoring Reports” (3800-FS-DEP4262)
• These documents have changed over time. In general, follow instructions contained in and/or attached to the facility’s permit.
General DMR Requirements

• Supplemental Forms
– DEP maintains an inventory of approved supplemental reports on its website, which can be accessed by visiting www.dep.state.pa.us/edmr and selecting “Supplemental Forms”.
– Both Word and Excel versions of most forms are available. Facilities are strongly encouraged to use the Excel version of the forms, regardless if they participate in eDMR, because they contain all of DEP’s DMR calculation policies.
General DMR Requirements

• Supplemental Forms (continued)
– The Daily Effluent Monitoring Excel-based spreadsheet is the prototype of the future eDMR data entry screen – eventually everyone will be required to use eDMR
– No guarantee that proprietary software systems are designed in accordance with DEP’s DMR policies
– Attach paper or electronic supplemental forms to your paper DMR or eDMR report for submission to DEP
General DMR Requirements

• Signature Requirements
– Paper DMRs must be signed by a Principal Executive Officer or Authorized Agent. Signatures on DMRs submitted to DEP should be in ink.
– Electronic DMRs must be certified by an individual with a Certifier role in the eDMR system for the facility – this is typically a facility owner, authority chairman, borough manager, etc.
– Delegation of authority required in writing.
General DMR Requirements

• Computer-Generated DMRs
– DEP may allow submission of computer-generated DMRs with pre-approval. Send a blank copy of the computer-generated DMR to DEP and, if you receive EPA DMRs, to EPA for approval before any submission.
– Computer-generated supplemental reports may be used if the content and formatting matches that of the paper forms that accompanied the permit. (Note – calculations should conform to DEP’s policies).
General DMR Requirements
• Record Retention
– Federal regulations require that all records used to prepare DMRs must be retained for a minimum of 3 years. (This applies to all other reports and permit applications as well). Exception – sludge records must be retained a minimum of 5 years.
– DEP allows facilities to retain DMR records electronically; however, be sure to back up records and the records should be readily accessible for review by a DEP inspector
General DMR Requirements

• Sampling & Analysis Requirements
– Laboratory requirements
– Analytical methods
– Sampling location
– Representative samples
– Self-monitoring records
Topic 2

• Laboratory Requirements
– Chapter 252 requires that all NPDES sample results be obtained using a laboratory accredited by or registered with DEP
– Accreditation – generally for commercial labs
– Registration – “accreditation-by-rule,” may be used by wastewater laboratories ($50 fee)
• See 25 Pa. Code § 252.6 for requirements to maintain the accreditation-by-rule status
Sampling & Analysis Requirements

• Analytical Methods
– Methods used for reporting must be:
• Identified in 40 CFR Part 136; OR
• Approved by DEP, though not listed in 40 CFR Part 136; OR
• Identified in the NPDES permit.
– Contact DEP if there is any doubt whether a method or procedure for analyzing samples meets one of these criteria
Sampling & Analysis Requirements

• Sampling Location
– Identified in Part A of permit (below limits tables), e.g., “Outfall 001”
– Further clarification on exact sampling location may be obtained from DEP
– For effluent, end of pipe sampling most desirable, but other locations after disinfection are acceptable
– Influent samples should be collected downstream of the introduction point(s) for hauled-in wastes (unless wastes put into digesters)
Sampling & Analysis Requirements
• Representative Samples
– All samples must be representative of the discharge
– Sampling should not be biased:
• DO NOT sample only during ideal conditions
• In general, DO NOT skip a scheduled sampling event due to adverse weather conditions (high flows), poor treatment plant performance, or changes to influent flow characteristics
– Systematic sampling is encourage (though not required), e.g., samples for a pollutant required weekly should be taken on the same day of each week
Sampling & Analysis Requirements

• Representative Samples (continued)
– Effluent samples should be collected where the effluent is well mixed near the center of the discharge conveyance and at the approximate mid-depth point, where the turbulence is at a maximum and the settlement of solids is minimized.
– Not only is representative sampling important for compliance with the permit, but key statewide decisions are made based on the analytical results of sampling efforts (e.g., Chesapeake Bay)
Sampling & Analysis Requirements

• Self-Monitoring Records
– All sampling and measurements taken must record the following information, subject to record retention rules:
• The exact place, date and time of sampling or measurements
• The person(s) who performed the sampling or measurements
• The date(s) the analyses were performed
• The person(s) who performed the analyses
• The analytical techniques or methods used and the associated detection level
• The results of such analyses
Sampling & Analysis Requirements

• Calculations & Completing DMRs
– No Discharge / NODI codes
– Statistical base codes
– Calculating geometric mean, weekly average and mass load statistics
– Chesapeake Bay calculations and reporting
– Non-detect management
– Rounding
– Reporting violations
Topic 3
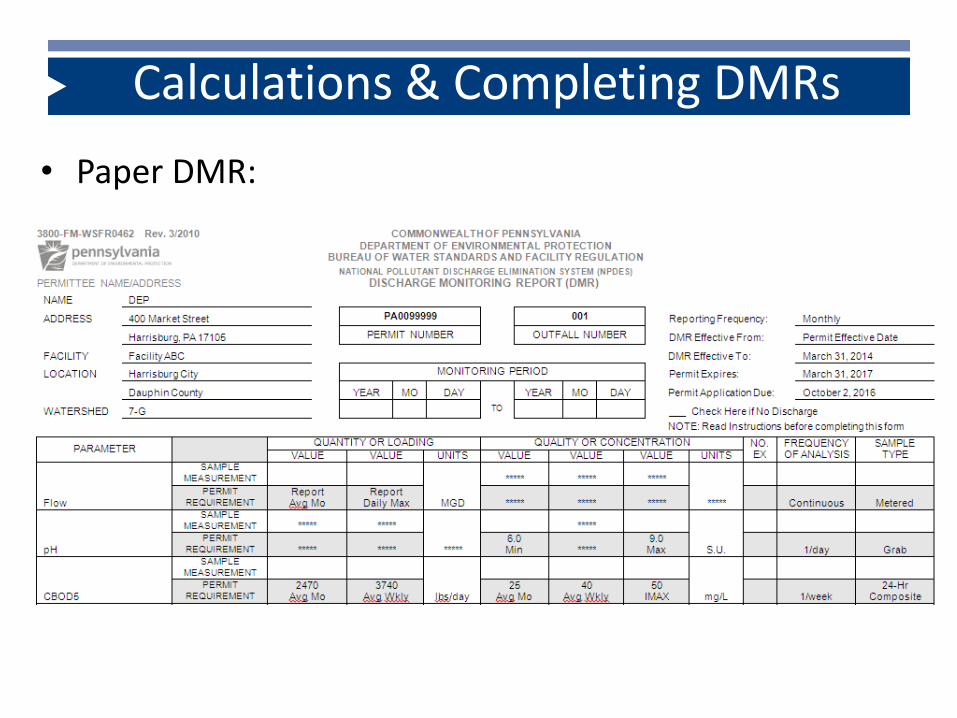
• Paper DMR:
Calculations & Completing DMRs

• eDMR:
Calculations & Completing DMRs

• No Discharge
– Once an NPDES permit is issued that requires submission of DMRs, submissions must be made even if there is no discharge for the entire reporting period.
– Write “No Discharge” or check the “No Discharge” box on paper DMRs and check the “No Discharge” box on eDMR report templates.
Calculations & Completing DMRs

• NODI Codes
– If there is at least one discharge during the reporting period, a permittee cannot check the “No Discharge” box - “NODI” codes may be used in lieu of reporting statistical results
– If there is at least one result for a parameter during the reporting period, NODI codes cannot be used
– There are 4 allowable NODI codes
– If a NODI code is used, provide an explanation in the Comments section of DMR or separate attachment
Calculations & Completing DMRs

• NODI Codes (continued)
– A = General Permit monitoring exemption
– E = No samples collected or analyses conducted for a parameter*
– GG = Conditional monitoring, not required during period
– FF = Other reasons for the absence of data*
* Creates a violation in ICIS (EPA system)
Calculations & Completing DMRs

• Statistical Base Codes - Descriptions
– Monthly Average – For concentration, sum the total of daily concentrations and divide by the number of samples. For loading (lbs/day), sum the total of daily loadings and divide by the number of samples during the month. To calculate the daily loading, multiply the daily concentration (mg/l) by the average flow (MGD) on the date of sampling and a conversion factor of 8.34.
Calculations & Completing DMRs
• Statistical Base Codes - Descriptions
– Weekly Average – For concentration, sum the total of daily concentrations each week (beginning on a Sunday and ending on a Saturday) and divide by the number of samples. For loading (lbs/day), sum the total of average daily loadings during each week of the reporting period and divide by the number of samples during the week. Report the maximum weekly average on the DMR.
Calculations & Completing DMRs

• Statistical Base Codes - Descriptions
– Maximum Daily – The maximum concentration or load measured during a 24-hour period during the reporting period; if multiple measurements are taken daily, include all data in the analysis.
– Instantaneous Maximum (IMAX) – The maximum result obtained by a grab sample for a specific pollutant over the entire reporting period covered by a DMR (where required on DMR).
Calculations & Completing DMRs

• Statistical Base Codes - Descriptions
– Instantaneous Minimum – Report the minimum result obtained by a grab sample for a specific pollutant over the entire reporting period covered by a DMR (e.g., DO)
– Geometric Mean - the average of a set of n sample results given by the nth root of their product (e.g., fecal coliform)
Calculations & Completing DMRs

• Statistical Base Codes - Descriptions
– Total Monthly – Sum of the total of average daily loadings, divided by the number of samples during the month, and multiplied by the number of days in the month.
– Total Annual – Sum of the Total Monthly loads over an annual period
Calculations & Completing DMRs

• Geometric Mean
– The geometric mean formula is:
– Example: 5 results are obtained during a month – 20, 300, 400, 500 and 0. The geometric mean is:
– If any value from the lab is “0”, use 1 for the calculation
– Never report “0” on DMRs for fecal coliform or for any other parameter
Calculations & Completing DMRs

• Geometric Mean (Non-Detect Results)
– If you receive a “non-detect” result for fecal coliform (e.g., < 2), report the non-detect result on supplemental forms. Ignore the “<” symbol for the geo mean calculation but include the “<” symbol with the final result
– For all “non-detect” results for bacteria, indicate in the Comments section of the DMR the maximum volume of sample filtered
Calculations & Completing DMRs

• Geometric Mean (TNTC)
– If you receive a “Too Numerous To Count” result for fecal coliform (TNTC), a numeric value should be reported on supplemental forms (e.g., > 2,000)
– Ignore the “>” symbol for the geo mean calculation, but include the “>” symbol in the final result
– For data sets that include both “<” and “>” results, the final result should be reported with the “>” symbol
Calculations & Completing DMRs
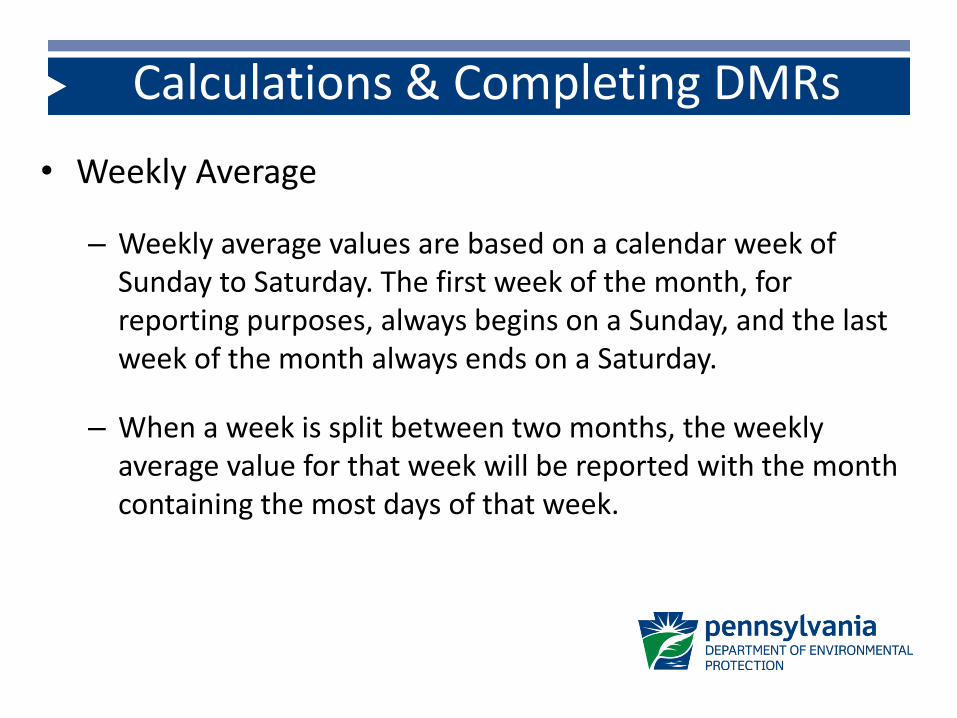
• Weekly Average
– Weekly average values are based on a calendar week of Sunday to Saturday. The first week of the month, for reporting purposes, always begins on a Sunday, and the last week of the month always ends on a Saturday.
– When a week is split between two months, the weekly average value for that week will be reported with the month containing the most days of that week.
Calculations & Completing DMRs
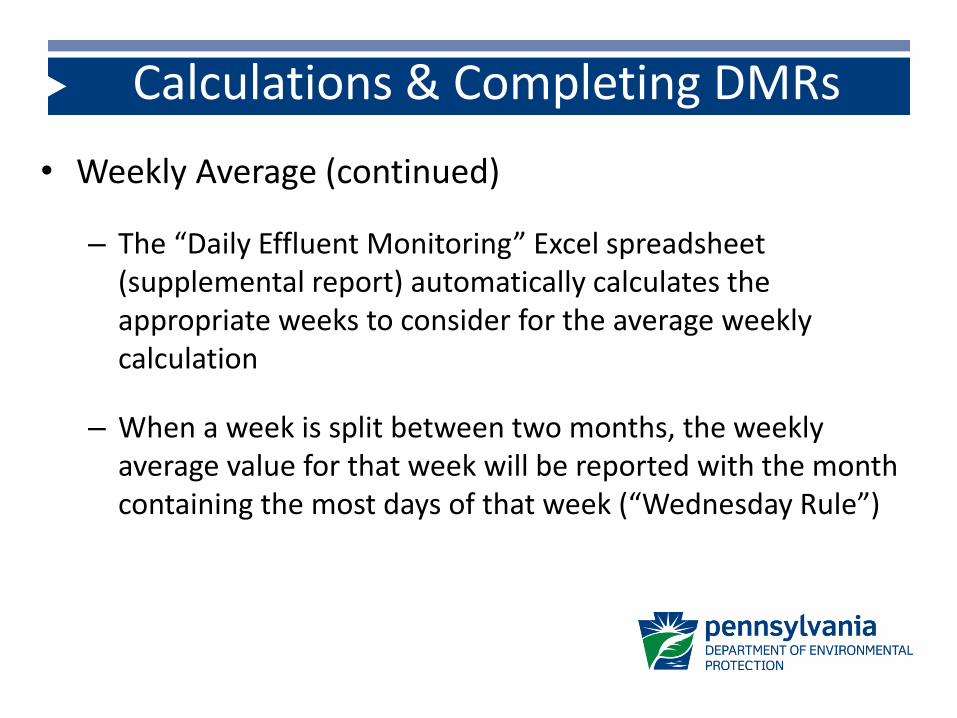
• Weekly Average (continued)
– The “Daily Effluent Monitoring” Excel spreadsheet (supplemental report) automatically calculates the appropriate weeks to consider for the average weekly calculation
– When a week is split between two months, the weekly average value for that week will be reported with the month containing the most days of that week (“Wednesday Rule”)
Calculations & Completing DMRs

• Weekly Average (continued)
– If the 1st day of the month begins on a Monday, Tuesday or Wednesday, the 1st week of the month for reporting purposes is the previous Sunday
– If the 1st day of the month begins on a Thursday, Friday or Saturday, the 1st week of the month for reporting purposes is the following Sunday
Calculations & Completing DMRs
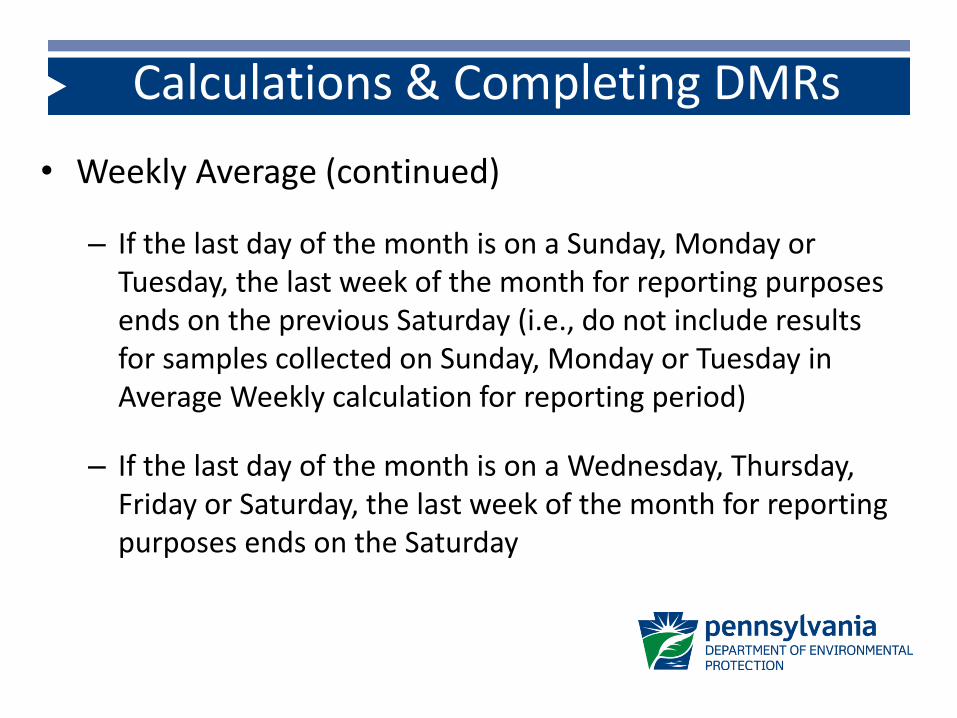
• Weekly Average (continued)
– If the last day of the month is on a Sunday, Monday or Tuesday, the last week of the month for reporting purposes ends on the previous Saturday (i.e., do not include results for samples collected on Sunday, Monday or Tuesday in Average Weekly calculation for reporting period)
– If the last day of the month is on a Wednesday, Thursday, Friday or Saturday, the last week of the month for reporting purposes ends on the Saturday
Calculations & Completing DMRs

• Weekly Average (continued)
– There could be up to 5 weeks to calculate average weekly results, depending on the month
– Only those weeks that are full weeks (7 days) should be used to evaluate the maximum average weekly result for DMR reporting (i.e., if the last day of the month ends on a Sunday, Monday or Tuesday, do not include partial week in calculation of Average Weekly for the reporting period – include in next reporting period)
Calculations & Completing DMRs

• Weekly Average Example 1: October 2012
– October 1, 2012 is a Monday. The first week therefore begins on Sunday, September 30, 2012
– Week 1: Sunday, 9/30– Saturday, 10/6
– Week 2: Sunday, 10/7 – Saturday, 10/13
– Week 3: Sunday, 10/14 – Saturday, 10/20
– Week 4: Sunday, 10/21 – Saturday, 10/27
– Week 5: Sunday, 10/28 – Saturday, 11/3
– Since the end of the month is on a Wednesday (10/31), 11/1, 11/2 and 11/3 are included in Week 5
Calculations & Completing DMRs
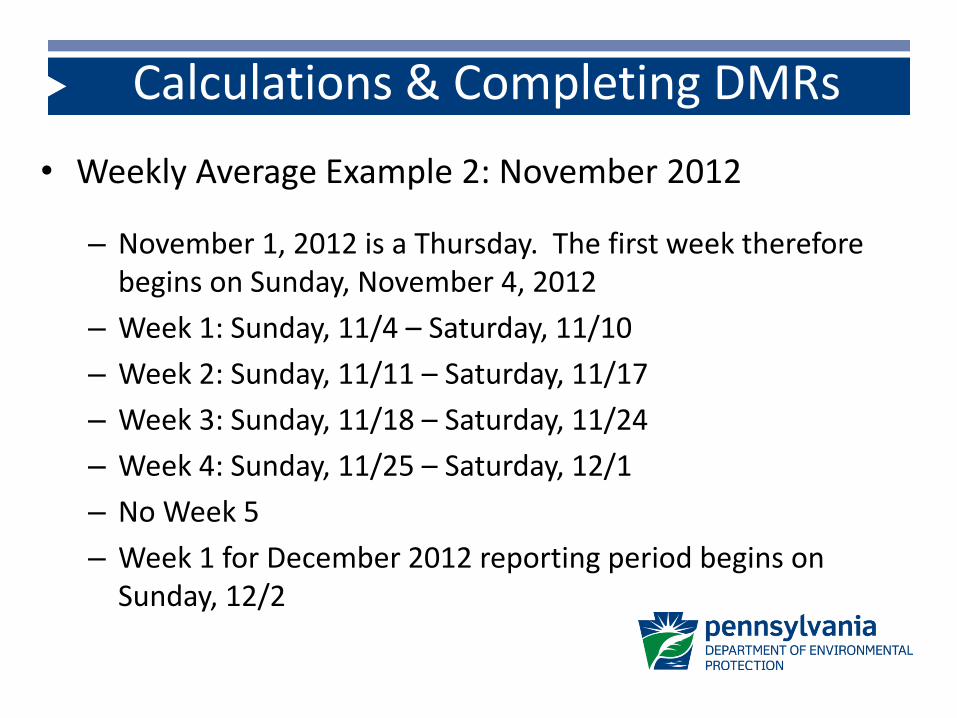
• Weekly Average Example 2: November 2012
– November 1, 2012 is a Thursday. The first week therefore begins on Sunday, November 4, 2012
– Week 1: Sunday, 11/4 – Saturday, 11/10
– Week 2: Sunday, 11/11 – Saturday, 11/17
– Week 3: Sunday, 11/18 – Saturday, 11/24
– Week 4: Sunday, 11/25 – Saturday, 12/1
– No Week 5
– Week 1 for December 2012 reporting period begins on Sunday, 12/2
Calculations & Completing DMRs
• Calculating Mass Loads
– To calculate mass loads, always start with the basic formula: Concentration (mg/L) x Flow (MGD) x 8.34. This results in the daily average load.
– Concentration must be in terms of mg/L and Flow must be in terms of million gallons per day (MGD). Concentration and Flow must be for the day of sample collection.
Calculations & Completing DMRs

• Calculating Mass Loads (continued)
– Why is the conversion factor of 8.34 used?
Calculations & Completing DMRs
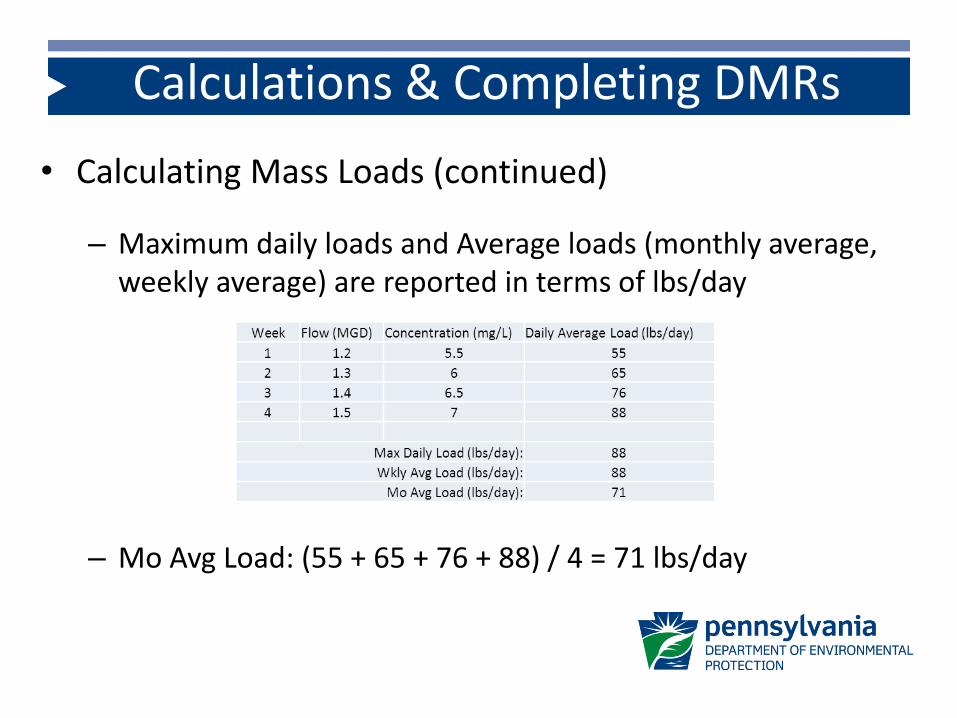
• Calculating Mass Loads (continued)
– Maximum daily loads and Average loads (monthly average, weekly average) are reported in terms of lbs/day
– Mo Avg Load: (55 + 65 + 76 + 88) / 4 = 71 lbs/day
Calculations & Completing DMRs

• Calculating Mass Loads (continued)
– Total loads are reported in terms of lbs
– Mo Avg Load: (55 + 65 + 76 + 88) / 4 = 71 lbs/day
– Total Mo Load: 71 lbs/day x 30 days in month = 2,130 lbs
Calculations & Completing DMRs
• Chesapeake Bay & Nutrient Issues
– “Significant Dischargers” to the Chesapeake Bay watershed for the purpose of implementing EPA’s 2010 Bay TMDL include:
• Sewage facilities with design flows ≥ 0.4 MGD; and
• Industrial waste facilities with discharges ≥ 75 lbs/day Total Nitrogen (TN) or ≥ 25 lbs/day Total Phosphorus (TP)
Calculations & Completing DMRs

• Chesapeake Bay & Nutrient Issues (continued)
– Significant Dischargers and new/expanding discharges to the Bay watershed are typically subject to the following effluent limitations and reporting requirements:
• Annual Net TN and TP mass load limits (“cap loads”) (Annual DMR)
• Annual Total TN and TP mass load reporting (Annual DMR)
• Monthly concentration and mass load (total and net) reporting for Ammonia-N (NH3-N) (may also be reported annually), Total Kjeldahl N (TKN), Nitrate + Nitrite-N (NO2+NO3-N), TN, and TP (Monthly DMR)
Calculations & Completing DMRs

• Chesapeake Bay & Nutrient Issues (continued)
– Annual DMRs are due on November 28th each year
– A 30-day “Truing Period” is provided to allow a facility that is in non-compliance with cap loads to purchase nutrient credits
– Monthly DMRs are due on the 28th day following the end of the reporting period
Calculations & Completing DMRs
• Chesapeake Bay & Nutrient Issues (continued)
– Nitrogen series
• TN = TKN + NO2+NO3-N (samples collected on same day)
• TKN = NH3-N + Organic N
• NH3-N should not be greater than TKN
• Example 1: TKN = 1.0 mg/L, NO2+NO3-N = 2.5 mg/L, TN = 3.5 mg/L
• Example 2: TKN < 1.0 mg/L, NO2+NO3-N = 10 mg/l, TN < 11.0 mg/L
Calculations & Completing DMRs

• Chesapeake Bay & Nutrient Issues (continued)
– Monthly Total Mass Load
• Facilities are encouraged to use the “Nutrient Monitoring” supplemental form in Excel format (the “Daily Effluent Monitoring” Excel file may be used but does not contain nutrient-specific validation)
• Facilities wishing to register credits through DEP must enter all daily sample results in the Nutrient Monitoring Excel file
Calculations & Completing DMRs

• Chesapeake Bay & Nutrient Issues (continued)
– Monthly Net Mass Load
• Identical to Monthly Total Mass Loads unless (1) credits have been purchased and are being applied during the month, (2) credits have been sold during the month, or (3) offsets are applied during the month
• Use Nitrogen and Phosphorus Budget supplemental forms to document the calculation of Monthly Net Mass Loads
Calculations & Completing DMRs

• Chesapeake Bay & Nutrient Issues (continued)
– Annual Total Mass Load
• Sum of Monthly Total Mass Loads for 12 months
• For facilities with cap loads, this value is reported for the “compliance year” starting October 1 and ending September 30
• Facilities that are not Significant Chesapeake Bay dischargers may have Annual Total Mass Load limits for TN, TP or other parameters based on TMDLs. This value may need to be reported for the October 1 – September 30 period or on a calendar year basis, depending on the permit
Calculations & Completing DMRs

• Chesapeake Bay & Nutrient Issues (continued)
– Annual Net Mass Load
• Sum of Monthly Net Mass Loads for 12 months
• Will be identical to Annual Total Mass Load unless a facility reports the purchase or sale of nutrient credits during the compliance year or during the Truing Period
• Report on the Annual Nutrient Summary supplemental form and the Annual Bay DMR
Calculations & Completing DMRs

• Chesapeake Bay & Nutrient Issues (continued)
– If the calculated Annual Net Mass Load exceeds the permitted cap load, the permittee will need to purchase credits to achieve compliance
– To determine the number of credits to purchase for compliance, determine the difference between the Annual Net Mass Load and the cap load and multiply by the delivery ratio for the pollutant as identified in the permit
Calculations & Completing DMRs
• Non-Detect Results
– Results qualified by the less than symbol (<) or present a value accompanied by “ND” or “Non-Detect” mean the laboratory could not quantify the value above a specific threshold known as the “quantitation limit” (QL)
– Non-detect results do not mean that there is zero (0) mass of the substance in the sample, but rather that the mass cannot be quantified with the method and/or equipment used for the analysis
Calculations & Completing DMRs

• Non-Detect Results
– One study by DEP examined samples with non-detect results, then spiked the samples with a known mass, and re-analyzed and found that pollutants were actually present in the sample at ranges of 60-80% of the QL
– It is in the permittee’s best interests to use laboratories and/or methods that can achieve the lowest possible QLs
Calculations & Completing DMRs

• Non-Detect Rules (continued)
1. Report the actual value reported by the laboratory on supplemental reporting forms (i.e., “< 2 mg/L”)
2. Do not report zeroes or “non-detect” for statistical values on the DMR
3. Ignore the less than (<) symbol and calculate statistics based on reported values (except as noted in the next slide); where there is at least one non-detect result in a data set, include the less than (<) symbol with the statistical result.
Calculations & Completing DMRs

• Non-Detect Rules (continued)
4. If your permit contains a water quality based limit that is less than the most sensitive DL, as published in 25 Pa. Code Chapter 16 (Appendix A, Tables 2A and 2B), and you receive a result of non-detect in which the reporting limit is less than or equal to the most sensitive DL, zero may be substituted for the reporting limit when calculating statistics in a mixed data set (i.e., some non-detect and some detected results). (Part C of permit would indicate whether the limit is less than the most stringent DL).
Calculations & Completing DMRs
• Non-Detect Rules (continued)
5. For reporting average values where you have all non-detect (<) results, report the result in this format on the DMR: “< QL” (where QL is the actual value reported by the laboratory). If the QL varies between samples, use the average QL for the period.
6. For reporting maximum daily values on DMRs, report the maximum detected value for the period. If there are no detected values, report the highest QL for the period, in this format: “< QL”.
Calculations & Completing DMRs

• Non-Detect Example 1: Limit >= Most Sensitive DL, Mixed Data Set
Permit Limit for Benzene is 0.0002 mg/L (Avg Mo)
• Most Sensitive DL in Ch. 16: 0.0002 mg/L
• Monthly Results: < 0.0002, 0.0009, 0.003, 0.001 mg/L
• Avg Mo Statistic = < (0.0002 + 0.0009 + 0.003 + 0.001) / 4 = < 0.001 mg/L (violation)
Calculations & Completing DMRs
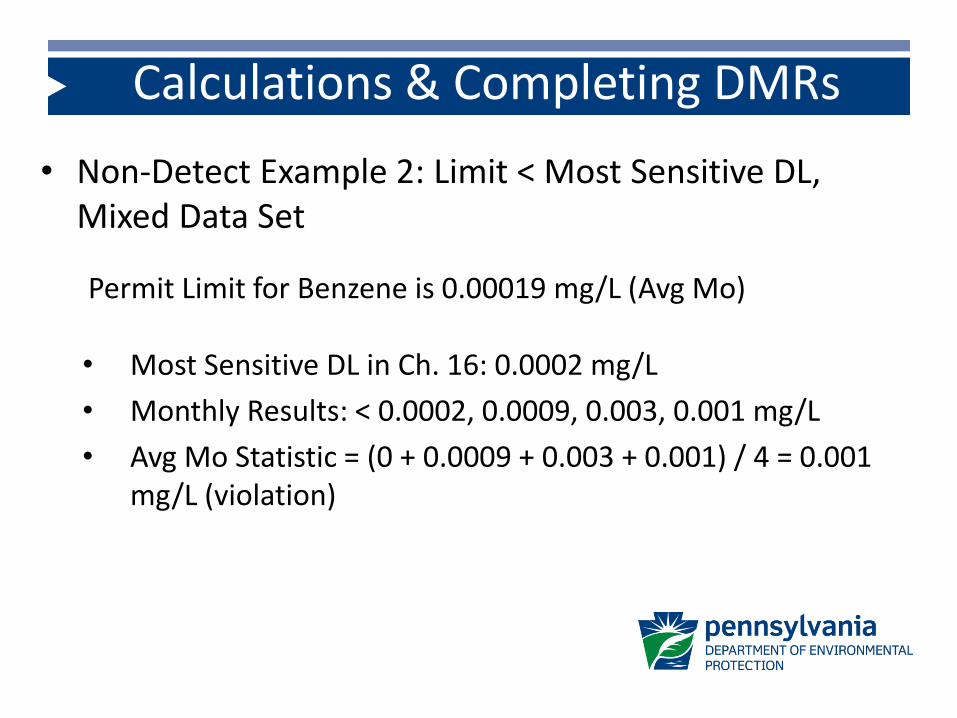
• Non-Detect Example 2: Limit < Most Sensitive DL, Mixed Data Set
Permit Limit for Benzene is 0.00019 mg/L (Avg Mo)
• Most Sensitive DL in Ch. 16: 0.0002 mg/L
• Monthly Results: < 0.0002, 0.0009, 0.003, 0.001 mg/L
• Avg Mo Statistic = (0 + 0.0009 + 0.003 + 0.001) / 4 = 0.001 mg/L (violation)
Calculations & Completing DMRs

• Non-Detect Example 3: Mass Load Calculation
Permit Limit for TSS Avg Mo Load is 23.0 lbs/day
• Monthly TSS Concentration Results: < 2, < 2, < 2, 5 mg/L
• Avg Daily Flow on Day of Sampling: 1.0 MGD (each day)
• Avg Mo Load: < [(((2 mg/L x 1.0 MGD x 8.34) x 3) + 5 mg/L x 1.0 MGD x 8.34) / 4] = < 22.9 lbs/day (compliance)
Calculations & Completing DMRs

• Rounding Rules
1. Values reported on the DMR should be rounded to the same number of decimal places as the limit for the parameter as set forth in the permit
2. If the permit does not contain a limit but requests monitoring only, values for concentration results should be rounded to the maximum number of decimal places in the data set as reported by the laboratory or the instrument used for analysis.
Calculations & Completing DMRs
• Rounding Rules (continued)
3. If mass loads must be reported and there is no limit, round statistical values to the nearest whole number, unless the calculated number is less than one, in which case the value should be rounded to one significant figure (e.g., 0.1, 0.05, etc.)
4. If the number you are rounding is followed by 5, 6, 7, 8, or 9, round the number up, otherwise round down.
Calculations & Completing DMRs

• Rounding Example 1
Permit Limit for TRC is 0.22 mg/L (Avg Mo)
• Equipment manufacturer says results are accurate to 1 ppb
• Monthly Results: 0.197 mg/L, 0.251 mg/L, 0.242 mg/L, 0.178 mg/L
• Avg Mo Statistic = (0.197 + 0.251 + 0.242 + 0.178) / 4 = 0.217 mg/L
• Round to 0.22 mg/L (2 decimal places)
Calculations & Completing DMRs

• Rounding Example 2
Monitoring requirement in permit for Total Copper (no limit)
• Monthly Results: 0.01 mg/L, 0.009 mg/L, 0.01 mg/L, 0.013 mg/L
• Avg Mo Statistic = (0.01 + 0.009 + 0.01 + 0.013) / 4 = 0.0105 mg/L
• Round to 0.011 mg/L (max 3 decimal places in data set)
Calculations & Completing DMRs
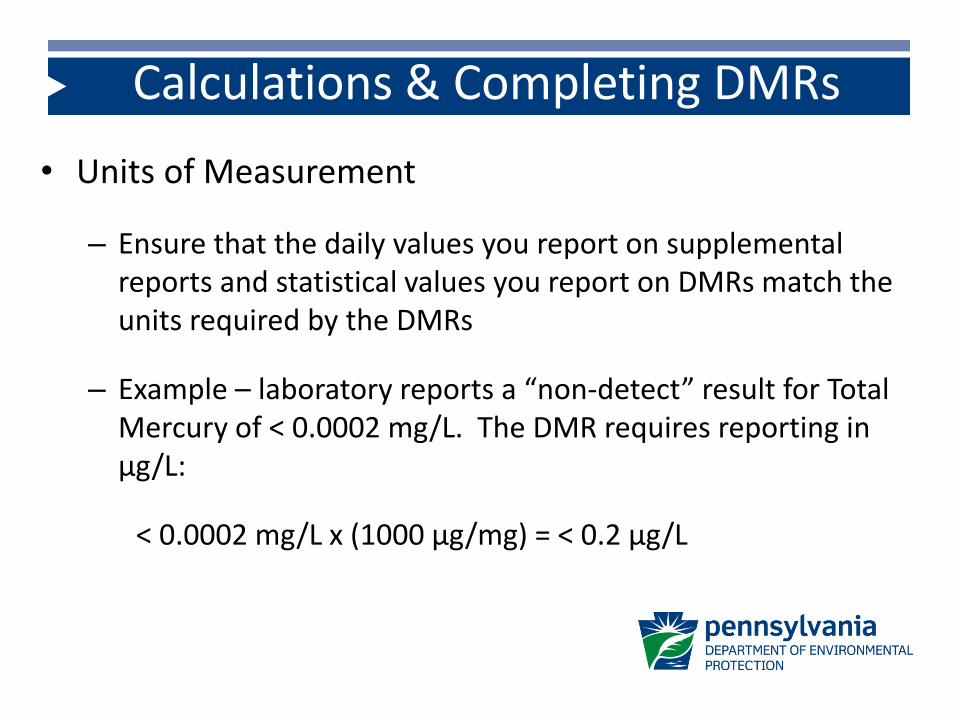
• Units of Measurement
– Ensure that the daily values you report on supplemental reports and statistical values you report on DMRs match the units required by the DMRs
– Example – laboratory reports a “non-detect” result for Total Mercury of < 0.0002 mg/L. The DMR requires reporting in µg/L:
< 0.0002 mg/L x (1000 µg/mg) = < 0.2 µg/L
Calculations & Completing DMRs

• Number of Excursions (“NO EX”)
– Specify the number of excursions in the “NO EX” field (eDMR) or column (paper DMRs)
– To determine the number of excursions per pollutant, sum the number of permit limit violations per pollutant.
Example: pH limits are 6.0 – 9.0 S.U., and the minimum pH is 5.9 and maximum pH is 9.1 during reporting period, the “NO EX” value is 2.
Example 2: The average monthly Lead concentration limit is 0.01 mg/L, the maximum daily limit is 0.02 mg/L, and the IMAX limit is 0.025 mg/L (but not on the DMR). There were two results reported at 0.021 mg/L, but the average monthly concentration was 0.009 mg/L. The “NO EX” value is 1 (one violation of maximum daily limit).
Calculations & Completing DMRs

• Reporting Violations
– Compare the value of the statistical result, after rounding, to the value of the permit limit to evaluate whether there has been an excursion
– Example – If the monthly average value is “< 23 lbs/day” and the limit is 22 lbs/day, this is a violation (23 is greater than 22)
Calculations & Completing DMRs
• Reporting Violations
– Report all effluent violations (and any other permit violations) on the Non-Compliance Reporting Form (3800-FM-BPNPSM0440)
• The Non-Compliance Reporting Form may be used to satisfy the permit requirement to provide a written report within 5 days following incidents of non-compliance that endanger human health or the environment (i.e., the form does not always need to be attached to the DMR)
– A summary of violations may be recorded in the Comments section of DMRs (not required)
Calculations & Completing DMRs

• Revisions
– Both paper and electronic DMRs can be revised if it is discovered, after submission, that mistakes were made
– There is no time limitation on when revisions can be submitted
– Include a detailed explanation of the reason for the revision
Calculations & Completing DMRs
• Central Office Division of Operations, Monitoring and Data Systems, (717) 787-5017 (eDMR & General DMR support)
• SERO Clean Water Program, (484) 250-5970
• NERO Clean Water Program, (570) 826-2553
• SCRO Clean Water Program, (717) 705-4707
• NCRO Clean Water Program, (570) 327-0532
• SWRO Clean Water Program, (412) 442-4060
• NWRO Clean Water Program, (814) 332-6942
Contacts