
Disaster Resilience Chapter 9 Water and Wastewater 50 ...
33
DISASTER RESILIENCE FRAMEWORK 50% Draft for Norman, OK Workshop 20 October 2014 Water and Wastewater Sector, Introduction Chapter 9, Page 1 of 33 9. Water and Wastewater Sector 9.1. Introduction Water and wastewater systems play a critical role in our daily lives. They provide basic services for our homes, places of business, and industry. In the United States, most people take these services for granted because of the high level of service and reliability generally provided by water and wastewater utilities. It is not until a water main break or other disruption in service occurs, that we are reminded of the importance of water and wastewater systems. This chapter addresses disaster resilience of utility-scale water and wastewater systems. While water and wastewater infrastructure that serve only a small number of households, such as groundwater wells and septic systems, are not specifically addressed, the basic resilience concepts are also generally applicable to these individual systems. Utility-scale water and wastewater lifelines are often complex systems consisting of large distributed pipeline networks and localized facilities such as treatment plants and pump stations. The infrastructure for these systems was installed as communities developed and expanded over time. The American Society of Civil Engineers (ASCE) 2013 Report Card for America’s Infrastructure gave the nation’s water and wastewater systems a grade of D. A primary reason for this low grade is much of the water and wastewater infrastructure is reaching the end of its useful life; it is not uncommon for some system components to be over 100 years old. While some utilities are already taking steps to improve the resilience of their system, capital improvement programs of many others often focus on emergency repairs, increasing system capacity to meet population growth, or making system improvements to satisfy public health and environmental regulations. Replacement of buried pipelines is often delayed until water main breaks become frequent or wastewater pipeline groundwater infiltration rates create excessive demand on the treatment system. Communities have a perfect opportunity to couple resilience improvements with retrofit or replacement of aging infrastructure over the coming years to improve the resilience of water and wastewater infrastructure. 9.1.1. Social Needs and Systems Performance Goals The average person uses between 80–100 gallons of water per day. Personal uses include water for drinking and cooking, personal hygiene, flushing toilets, laundry, landscape irrigation, and many others. Many businesses and industries are also dependent on a continual supply of potable water and wastewater collection services. Without functioning water and wastewater systems the operation of restaurants, child care facilities, hotels, medical offices, food processing plants, paper mills, etc. is not possible. Additionally, water systems in urban and suburban areas provide emergency water supply for fire suppression. Chapter 2 discusses this societal dependence on water and wastewater systems and other lifelines in more detail. In the United States, communities are generally willing to accommodate short-term (on the order of a few days) disruptions in water and wastewater services resulting from man-made or natural disasters. However, longer-term disruptions are less tolerable. The Oregon Resilience Plan (OSSPAC, 2013) indicated if business cannot reoccupy facilities (including functioning water and wastewater systems) within one month they will be forced to move or dissolve. This timeline likely varies depending on the needs of individual communities and the severity of the disaster. As detailed in Section 9.3, water and wastewater utility providers need to work with customers and regulatory agencies to establish realistic performance goals for post-disaster level of service, evaluate their systems’ current status in relation to those goals, and then develop strategies to close the identified resilience gaps. 9.1.2. Interdependencies As described in Chapter 4, the operation and repair of water and wastewater systems is highly dependent
Transcript of Disaster Resilience Chapter 9 Water and Wastewater 50 ...

DISASTER RESILIENCE FRAMEWORK 50% Draft for Norman, OK Workshop
20 October 2014 Water and Wastewater Sector, Introduction
Chapter 9, Page 1 of 33
9. Water and Wastewater Sector
9.1. Introduction
Water and wastewater systems play a critical role in our daily lives. They provide basic services for our homes, places of business, and industry. In the United States, most people take these services for granted because of the high level of service and reliability generally provided by water and wastewater utilities. It is not until a water main break or other disruption in service occurs, that we are reminded of the importance of water and wastewater systems.
This chapter addresses disaster resilience of utility-scale water and wastewater systems. While water and wastewater infrastructure that serve only a small number of households, such as groundwater wells and septic systems, are not specifically addressed, the basic resilience concepts are also generally applicable to these individual systems.
Utility-scale water and wastewater lifelines are often complex systems consisting of large distributed pipeline networks and localized facilities such as treatment plants and pump stations. The infrastructure for these systems was installed as communities developed and expanded over time. The American Society of Civil Engineers (ASCE) 2013 Report Card for America’s Infrastructure gave the nation’s water and wastewater systems a grade of D. A primary reason for this low grade is much of the water and wastewater infrastructure is reaching the end of its useful life; it is not uncommon for some system components to be over 100 years old.
While some utilities are already taking steps to improve the resilience of their system, capital improvement programs of many others often focus on emergency repairs, increasing system capacity to meet population growth, or making system improvements to satisfy public health and environmental regulations. Replacement of buried pipelines is often delayed until water main breaks become frequent or wastewater pipeline groundwater infiltration rates create excessive demand on the treatment system. Communities have a perfect opportunity to couple resilience improvements with retrofit or replacement of aging infrastructure over the coming years to improve the resilience of water and wastewater infrastructure.
9.1.1. Social Needs and Systems Performance Goals
The average person uses between 80–100 gallons of water per day. Personal uses include water for drinking and cooking, personal hygiene, flushing toilets, laundry, landscape irrigation, and many others. Many businesses and industries are also dependent on a continual supply of potable water and wastewater collection services. Without functioning water and wastewater systems the operation of restaurants, child care facilities, hotels, medical offices, food processing plants, paper mills, etc. is not possible. Additionally, water systems in urban and suburban areas provide emergency water supply for fire suppression. Chapter 2 discusses this societal dependence on water and wastewater systems and other lifelines in more detail.
In the United States, communities are generally willing to accommodate short-term (on the order of a few days) disruptions in water and wastewater services resulting from man-made or natural disasters. However, longer-term disruptions are less tolerable. The Oregon Resilience Plan (OSSPAC, 2013) indicated if business cannot reoccupy facilities (including functioning water and wastewater systems) within one month they will be forced to move or dissolve. This timeline likely varies depending on the needs of individual communities and the severity of the disaster. As detailed in Section 9.3, water and wastewater utility providers need to work with customers and regulatory agencies to establish realistic performance goals for post-disaster level of service, evaluate their systems’ current status in relation to those goals, and then develop strategies to close the identified resilience gaps.
9.1.2. Interdependencies
As described in Chapter 4, the operation and repair of water and wastewater systems is highly dependent

DISASTER RESILIENCE FRAMEWORK 50% Draft for Norman, OK Workshop
20 October 2014 Water and Wastewater Sector, Introduction
Chapter 9, Page 2 of 33
on other lifeline sectors. Other sectors are dependent on water and wastewater systems.
Water and Wastewater Systems depend on:
Transportation – Water and wastewater utilities are dependent on roadway and bridge transportation systems for staff to access facilities for operation and repairs. Disaster damage to transportation infrastructure has the potential to complicate and lengthen repair times, or even prevent repairs in certain areas until roadways and bridges are accessible.
Transportation – Water and wastewater buried pipelines are often co-located near other buried lifelines under or adjacent to roadways. Failure of pipelines may result in damage to the roadway (e.g., sinkhole from water main break or collapsed sewer pipeline) and impact to traffic when repairs are being made. Sometimes water and wastewater pipelines are co-located on bridges at river or other crossings. If not properly designed, relative movement between the bridge and surrounding soil could result in damage to the supported pipelines. Pipeline damage could result in damage to the bridge. For instance, if a supported water pipeline breaks due to relative movement between the bridge and surrounding soil, water flow from the broken pipe could cause scour of the soil supporting the bridge abutment and result in potential bridge collapse.
Transportation – Water and wastewater utilities generally keep on hand a limited stock of pipe, fittings, and other repair materials. Depending on the size of the disaster, this stock may be quickly depleted. Utilities will rely on transportation networks to obtain additional repair materials from suppliers and other utilities. Also, utilities rely on a semi-regular delivery of water and wastewater treatment process chemicals. Supply chain disruption could lead to difficulty in meeting water quality and wastewater treatment regulations.
Energy – Water and wastewater utilities rely on commercial electricity to run pumps, various components of processes equipment, and lab and office operations. Some of these functions have emergency backup generators, but overall power demands make it impractical to run a water or wastewater system entirely on backup generators.
Energy – Water and wastewater utilities rely on a continual supply of fuel for trucks, equipment, and emergency generators. Disruption in fuel production, storage, or delivery could severely impact a utility’s ability to continue limited operation on emergency generator power and perform repairs.
Communications and Information – Water and wastewater utilities often rely on cellular networks for communication amongst operations staff and contractors. If the cellular network is down for an extended period of time, complications and delay in repairs can occur. This was observed in the 2010 Maule earthquake in Chile (Eidinger, 2012).
Customers – Water and wastewater utilities rely on customers to pay bills as a continued source of operating capital. Utilities will potentially experience significant capital expenditures in the aftermath of a disaster and customers may not have the ability to pay bills, placing a large financial burden on the utilities.
Water and Wastewater Systems are required by:
Wastewater – Wastewater collection systems are dependent on adequate water flow rates to keep sewage flowing. If the water system is down, sewer pipelines may quickly become plugged.
Communications and Information – Air conditioning system cooling towers require water to keep sensitive electronic equipment in central offices at safe operating temperatures.
Hospitals – Hospitals generally have a limited emergency water supply and ability to hold wastewater, but need water and wastewater services restored quickly to remain operational.
Fire Departments – Fire Departments require a water supply with adequate fire flow and pressure for fire suppression.
Commercial Buildings – Commercial buildings require a water supply with adequate fire flow and pressure for sprinkler systems; otherwise a fire watch may be necessary. Fire watch programs are expensive to maintain and may be cost prohibitive for any extended duration.
DISASTER RESILIENCE FRAMEWORK 50% Draft for Norman, OK Workshop
20 October 2014 Water and Wastewater Sector, Water Infrastructure
Chapter 9, Page 3 of 33
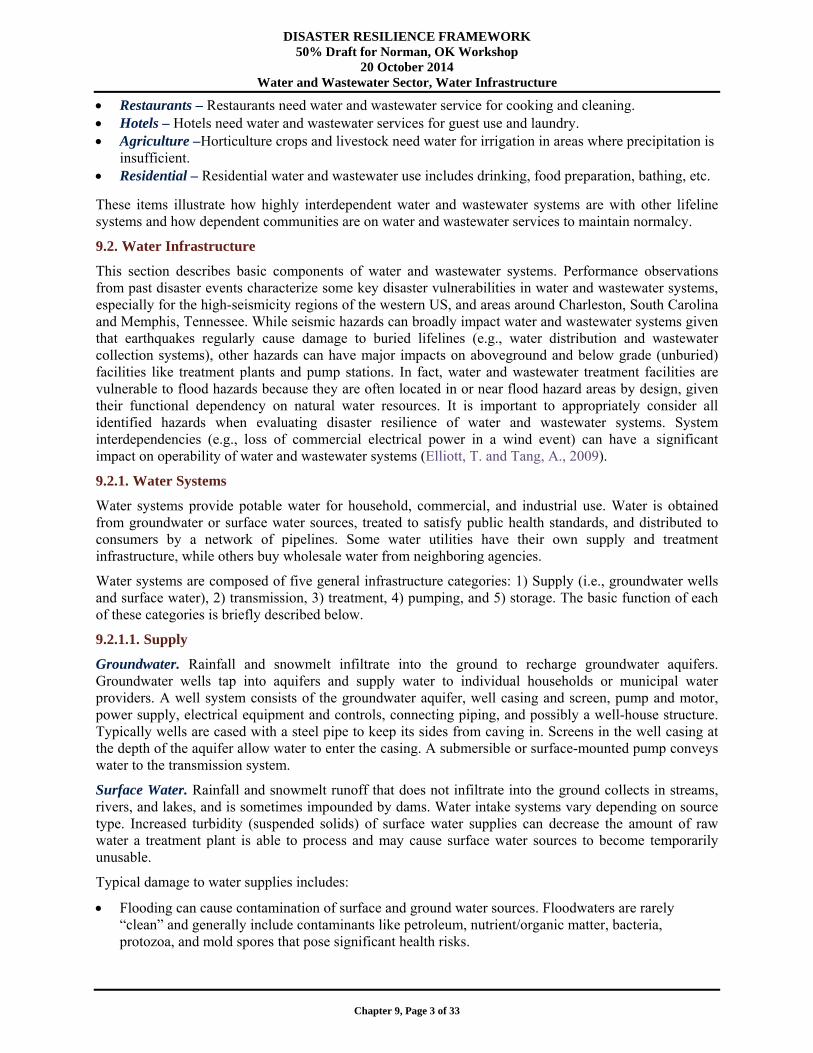
Restaurants – Restaurants need water and wastewater service for cooking and cleaning. Hotels – Hotels need water and wastewater services for guest use and laundry. Agriculture –Horticulture crops and livestock need water for irrigation in areas where precipitation is
insufficient. Residential – Residential water and wastewater use includes drinking, food preparation, bathing, etc.
These items illustrate how highly interdependent water and wastewater systems are with other lifeline systems and how dependent communities are on water and wastewater services to maintain normalcy.
9.2. Water Infrastructure
This section describes basic components of water and wastewater systems. Performance observations from past disaster events characterize some key disaster vulnerabilities in water and wastewater systems, especially for the high-seismicity regions of the western US, and areas around Charleston, South Carolina and Memphis, Tennessee. While seismic hazards can broadly impact water and wastewater systems given that earthquakes regularly cause damage to buried lifelines (e.g., water distribution and wastewater collection systems), other hazards can have major impacts on aboveground and below grade (unburied) facilities like treatment plants and pump stations. In fact, water and wastewater treatment facilities are vulnerable to flood hazards because they are often located in or near flood hazard areas by design, given their functional dependency on natural water resources. It is important to appropriately consider all identified hazards when evaluating disaster resilience of water and wastewater systems. System interdependencies (e.g., loss of commercial electrical power in a wind event) can have a significant impact on operability of water and wastewater systems (Elliott, T. and Tang, A., 2009).
9.2.1. Water Systems
Water systems provide potable water for household, commercial, and industrial use. Water is obtained from groundwater or surface water sources, treated to satisfy public health standards, and distributed to consumers by a network of pipelines. Some water utilities have their own supply and treatment infrastructure, while others buy wholesale water from neighboring agencies.
Water systems are composed of five general infrastructure categories: 1) Supply (i.e., groundwater wells and surface water), 2) transmission, 3) treatment, 4) pumping, and 5) storage. The basic function of each of these categories is briefly described below.
9.2.1.1. Supply
Groundwater. Rainfall and snowmelt infiltrate into the ground to recharge groundwater aquifers. Groundwater wells tap into aquifers and supply water to individual households or municipal water providers. A well system consists of the groundwater aquifer, well casing and screen, pump and motor, power supply, electrical equipment and controls, connecting piping, and possibly a well-house structure. Typically wells are cased with a steel pipe to keep its sides from caving in. Screens in the well casing at the depth of the aquifer allow water to enter the casing. A submersible or surface-mounted pump conveys water to the transmission system.
Surface Water. Rainfall and snowmelt runoff that does not infiltrate into the ground collects in streams, rivers, and lakes, and is sometimes impounded by dams. Water intake systems vary depending on source type. Increased turbidity (suspended solids) of surface water supplies can decrease the amount of raw water a treatment plant is able to process and may cause surface water sources to become temporarily unusable.
Typical damage to water supplies includes:
Flooding can cause contamination of surface and ground water sources. Floodwaters are rarely “clean” and generally include contaminants like petroleum, nutrient/organic matter, bacteria, protozoa, and mold spores that pose significant health risks.

DISASTER RESILIENCE FRAMEWORK 50% Draft for Norman, OK Workshop
20 October 2014 Water and Wastewater Sector, Water Infrastructure
Chapter 9, Page 4 of 33
Earthquake-induced permanent ground displacement can cause well casing and well discharge piping damage. The force of moving ground can bend well casings and brake well discharge piping.
Increased turbidity of surface waters as a result of flooding can overwhelm water treatment systems. Water treatment processes include removal of particulates; however, their processes are based on a limited measure of turbidity existing prior to treatment. Floodwaters can have significantly increased turbidity that tax water systems and lead to treatment delays. Similarly, seismic events can trigger landslides which also impact turbidity. In the 2008 Wenchuan China earthquake, many landslides occurred in the mountainous region and led to increased turbidity in local waterways.
In the 2011 Tohoku Japan earthquake, a tsunami inundated several freshwater intake facilities with seawater. These water intakes were unusable for a long period of time due to the high concentration of salts in the water (Miyajima, 2012). This type of salt water infiltration of water treatment systems is often experienced after storm surge events and as a result of coastal flooding in general.
Reservoirs behind dams often serve as water supply features, but dam failure can present a secondary hazard in the wake of events including earthquakes, heavy rainfall, and flooding events. Concentrated rainfall or precipitation and flooding can result in the most common means of dam
failure: overtopping. While dams can control floods, many are specifically designed for other uses (e.g., water supply facilities), and therefore may not be equipped to contain large volumes of quickly accumulating surface water runoff. Additionally, older and poorly maintained dams are more vulnerable to overtopping or failure as the result of heavy precipitation and flooding.
In the 1971 San Fernando earthquake in Southern California, the Lower San Fernando Dam experienced a landslide and near failure. The event lowered the dam’s crest about 30 ft and put 80,000 people at significant risk while the impounded water level was being lowered. These types of dam failures are rare, but present a significant life-safety risk to anyone downstream of a dam. Dams are critical infrastructure components that need to be designed to withstand extreme events.
9.2.1.2. Transmission
Water system transmission and distribution pipelines are a significant asset class for water utilities. Large water utilities may have a network consisting of thousands of miles of pipelines. Typically these pipelines operate under pressure and are buried 2.5–6 feet or deeper underground, making them difficult to inspect and expensive and disruptive to repair. Pipeline material and joint type significantly influence the performance of a pipeline when it is located in an area subjected to permanent ground deformation occurring in an earthquake or landslide. Table 9-1 summarizes commonly in-place and currently used pipeline materials and joint types, along with their applicable American Water Works Association (AWWA) standard. Materials and joint types with no designated standard are no longer manufactured, but represent a significant portion of the installed pipelines in the US.

DISASTER RESILIENCE FRAMEWORK 50% Draft for Norman, OK Workshop
20 October 2014 Water and Wastewater Sector, Water Infrastructure
Chapter 9, Page 5 of 33
Table 9-1: Commonly Used Water Pipeline Materials, Standards, and Vulnerability To Ground Deformation (AWWA, 1994)
Material Type and Diameter AWWA Standard Joint Type
Low Vulnerability
Ductile Iron C100 series Bell-and-spigot, rubber gasket, restrained
Polyethylene C906 Fused
Steel C200 series Arc welded
Steel No designation Riveted
Steel C200 series Bell-and-spigot, rubber gasket, restrained
Low to Moderate Vulnerability
Concrete cylinder C300, C303 Bell-and-spigot, restrained
Ductile iron C100 series Bell-and-spigot, rubber gasket, unrestrained
Polyvinyl chloride C900, C905 Bell-and-spigot, restrained
Moderate Vulnerability
Asbestos cement (> 8-in. diameter) C400 series Coupled
Cast iron (> 8-in. diameter) No designation Bell-and-spigot, rubber gasket
Polyvinyl chloride C900, C905 Bell-and-spigot, unrestrained
Steel C200 series Bell-and-spigot, rubber gasket, unrestrained
Moderate to High Vulnerability
Asbestos cement (≤ 8-in. diameter) C400 series Coupled
Cast iron (≤ 8-in. diameter) No designation Bell-and-spigot, rubber gasket
Concrete cylinder C300, C303 Bell-and-spigot, unrestrained
Steel No designation Gas welded
High Vulnerability
Cast iron No designation Bell-and-spigot, leaded or mortared
Transmission Pipelines. Large diameter (> 12 in) transmission pipelines carry raw water from a source to the treatment plant, and treated water to storage facilities and community sectors before branching out into smaller diameter distribution pipelines. Transmission pipelines can be thought of as the backbone of the pipeline system.
Distribution Pipelines. Smaller diameter (≤ 12 in) distribution pipelines carry treated water from transmission pipelines to neighborhoods and industrial areas. For some smaller utilities, major transmission lines may also fall in this diameter range. Service connections branch off distribution pipelines to supply individual customers. The portion of the service connection before the water meter is typically maintained by the water utility and the portion after the water meter is the responsibility of the individual customer.
Buried pipelines are less vulnerable to some types of hazards (e.g., wind), but seismic events often result in widespread damage of buried infrastructure. Flood forces can also impact buried systems. Typical damage to water pipelines includes:
Buried water pipelines can become exposed as a result of landslides (particularly in steeper terrain) or erosion associated with flood hazards. In these instances, pipe leaks, breaks and uncoupling of pipes are common. Breaks and leaks in buried water pipelines are one of the largest earthquake damage mechanisms in water systems. “Leak” commonly refers to relatively minor damage to a pipe barrel or joint that results in minor
to moderate water loss, but does not significantly impair the distribution system’s function. “Break” commonly refers to major damage to a pipe barrel or joint that results in major water loss
that may cause loss of pressure in a zone or nearby tanks to completely drain.

Pipeligeyseit caupermabetwepotenPipeliexpec
Pipelicommsubjecresultwhere9-3). P
Figure 9Earthqu
(
FigureFailure,
Pipelireactirestrabecom
Majorin thetwice
ine leaks and er from a watesed to the roaanent ground een areas that ntial damage fines failed in cted fault movine failures ge
monly initiatescted to axial sting in damage the walls of Pipes may als
9-1: Water Pipuake, Christc(Source: Eidi
e 9-3: Welded San Fernan1971 (Sourc
ine damage ison blocks, anin movement
me too high thr earthquakes
e City of Sendthe failure ra
DIS50
Water an
breaks can caer pipeline breadway. A majdisplacementdid and did n
from permanepast earthqua
vement. enerally fall ins at locations strains, pipe se to the pipe.
f the pipe locaso fail in the m
ipeline Breakchurch, New Zinger & Tang
d Steel Pipe Cdo Earthqua
ce: OSSPAC,
s often concennd service cont of the pipe ahe pipe or joins continue to rdai in the 201ate of steel or
SASTER RESI0% Draft for
20 Ond Wastewate
Chapt
ause collateraeak in the 201or cause of pt. Large strainnot experiencent ground disakes at fault c
nto one of sevof existing co
sections may pWelded steel
ally wrinkle tomiddle of the
k, ChristchurcZealand, 201
g, 2014)
Compression ake, Californi
2013)
ntrated at discnnections. Disand causes locnt fails in a mreveal new in1 Tohoku earductile iron p
ILIENCE FRANorman, OK
October 2014er Sector, Wat
ter 9, Page 6 of 33
al damage to a11 Christchuripeline breakns develop in e permanent gsplacement isrossings that
veral commonorrosion dampull apart (seel pipe may exo accommoda pipe barrel, a
ch 11
FigureNanbu
ia, Figurearth
continuities suscontinuity crcally high stre
manner similarformation abo
rthquake in Japipe (Miyajim
RAMEWORKWorkshop
ter Infrastruc
3
adjacent infrarch New Zeal
ks and leaks ispipelines at t
ground displas where pipeliwere not exp
n types. Earthmage. For bell-
e Figure 9-2)xperience a simate shorteningaway from th
e 9-2: Pipelinu Earthquake
OS
re 9-4: Waterhquake, Chris
(Source: Ei
uch as pipe elreates a semi-esses in pipesr to one of theout pipe mate
apan, polyvinyma, 2012). Pip
cture
astructure. Figland earthquas liquefactionthe movemenacement. Anoines cross actiplicitly design
hquake failure-and-spigot ty) or push togemilar axial co
g of the pipe she joints (see F
ne Separated, e, Kobe, JapaSSPAC, 2013
r pipeline breastchurch, Newidinger & Ta
lbows, tees, in-support points and joints. Ife mechanismserial performayl chloride (Ppeline perform
gure 9-1 showake and the da-induced
nt boundaries other locationive faults.
ned for the
e of pipe ype joint pipeether (“telescoompression fasection (see FFigure 9-4).
Great Hyogoan, 1995 (Sou3)
ak, Christchuw Zealand, 2
ang, 2014)
n-line valves,t that attemptf these stresses described abance. For instPVC) pipe hadmance lessons
ws the amage
n of
e ope”) ailure
Figure
oken-urce:
urch
2011
, ts to es bove. tance, d s

from presistajointsgood earthqdecaddemoand T
Due tcustomFigurearthqwheresystemwater
In theresultuncovdiameEdwadamaginund
Waterexperand/oforcesvelociand at
Soil slevelsburied
9.2.1.3. T
Water trehealth waraw waterWater trechemical and contro
Typical d
Water(i.e., lleadin
Hydrooften sloshi(Balla
past earthquaant ductile-iro that accommperformance
quakes. High-des and is seeinstrated good
Tang, 2014) eao extensive dmers, a systeme 9-5 shows aquakes. Also, e the system tms typically rr distribution ae Tohoku Japated in erosion vered, undermeter (36 in andards, 2014). Itge to pipeline
dation zone arr pipelines corience damager flood-bornes associated wity flows are ttached pipeli
saturation coms can result ind pipelines an
Treatment
eatment plantater quality str source, to
eatment plantstorage and fol equipment
amage to wat
r treatment pllakes, rivers).ng to loss of fodynamic forcause damag
ing damage toantyne and Cr
DIS50
Water an
akes have led on pipe produ
modate axial ain the 1995 K
-Density Polying increased d performancearthquakes.
damage to watm of emergenan example oftemporary sm
treatment planrely on mutuaand treatmentan earthquakeand several f
mined, and brod greater) pipt is expected tes will be revere rebuilt. o-located on be as a result oe debris impacwith coastal flmore likely toines than inun
mbined with rn uplift or buond transmissio
s process rawtandards and remove paths typically co
feed equipmen.
ter treatment p
lants are vuln Electrical co
functionality aces generatede to process to process tankrouse, 1997; N
SASTER RESI0% Draft for
20 Ond Wastewate
Chapt
to improvemucts have beenand bending dKobe (NIST, yethylene (HD
use by watere in the 2010
ter distributioncy water distf a water distrmall-scale want was not opal aid and govt equipment the, tsunami inufeet of scour toke several la
pelines (Tang that more tsunealed as areas
bridges often of flood inundct. Hydrodynalooding or higo damage strundation aloneising groundw
oyancy forces on structures
w water fromoften to impr
hogens, organonsist of a nnt, lab and of
plants include
erable to flooontrol systemsand service oud from liquid tank covers, bk componentsNIST, 1996; S
ILIENCE FRANorman, OK
October 2014er Sector, Wat
ter 9, Page 7 of 33
ents in pipe mn developed i
deformation in1996) and 20
DPE) pipe hasr and wastewaChile (Eiding
on networks retribution statioribution statioater treatment erational or o
vernment resohat an individ
undation that arge &
nami s in the
dation amic gh uctures . water on leading to bre
m groundwaterove taste. Va
nic or inorgannumber of proffice building
es:
oding becauses are often dautages. movement w
baffles, clarifis has been obSchiff, 1997)
RAMEWORKWorkshop
ter Infrastruc
3
materials and in Japan. Thisn the joints. T
011 Tohoku (Ts been used bater utilities. Hger, 2012) an
esulting in loons are often on employed t plants were uoperating at veources to augmdual utility m
eaks within th
er or surface arious procesnic contaminocess tanks,
g space, and a
e they are ofteamaged as the
within a procesiers, and otherserved in all r.
Figure 9-5:Haiti Earth
(Source:
cture
technology. Es pipe uses spThis type of piTang & Edwa
by the natural HDPE water d 2011 Christ
ss of service tnecessary aftafter the 2010used after maery limited cament the limit
may have avail
he system.
water supplisses are used,nants, chemicyard and pla
associated me
en located neae result of floo
ss tank duringr submerged recent major
: Water Distrhquake, Port : Photo by Do
Earthquake pecial restrainipe demonstraards, 2014) gas industry pipelines tchurch (Eidn
to individual fter an earthqu0 Haiti
ajor earthquakapacity. Wateted trucked-inlable.
ies to meet p, depending ocals, and turbant piping, puchanical, elec
ar flooding sood inundation
g an earthquakequipment. Tearthquakes
ribution LocaAu Prince, 2
on Ballantyne
ned ated
for
nger
uake.
kes er n
public on the bidity. umps, ctrical
ources n,
ke This
ation, 2010 e)

Liquejointssettlem
Seismoriginand o
Buildyear. requirloads wall c
Tempearthqcapaclimite
Figure 9-Settleme
Buildi(
9.2.1.4. P
Pumping pump statpipes, valstandby einterrupte
Typical d
Loss othere
Flood Flood
partiaMisso
Seismconstrcrackiin New
efaction-induc, damage to pment between
mic performannal constructiolder tilt-up co
ding performaBuilding codrements, but o(gravity, upli
coverings are porary, small-quakes in areacity. Water syed temporary
-6: Pipeline Dent Between Ging, Tohoku E(Source: Tang
Pumping
stations incretion typicallylves, and assemergency g
ed.
amage to wat
of commerciais no backup
dwater inundadwater inundaally below graouri River dam
mic performanruction and aning of the unrw Zealand.
DIS50
Water an
ced permanenpipelines, pipen the ground ance of buildinon and any seoncrete buildince as a resules continue toolder buildingift and lateralbetter protectscale water tras where the sstems typicaltreatment equ
Damage Due Ground and PEarthquake, g & Edwards
ease hydrauliy consists of sociated mechgenerators to
ter pump stati
al electrical ppower supply
ation of pumpation of electrade and/or in maged by floonce of pump sny seismic retreinforced ma
SASTER RESI0% Draft for
20 Ond Wastewate
Chapt
nt ground dispe racks, etc. Fand an adjace
ngs at water treismic retrofitings are particlt of wind eveo incorporate g stock is at a), protection fted against threatment plansystem treatmlly rely on muuipment that a
To DifferentPile SupporteJapan, 2011
s, 2014)
ic head (i.e., a simple buihanical, elect
o enable con
ions includes:
ower due to ay.
ps can disable rical equipmenflood-prone aod inundationstation buildintrofits that maasonry wall at
ILIENCE FRANorman, OK
October 2014er Sector, Wat
ter 9, Page 8 of 33
placement cauFigure 9-6 shoent pile suppoeatment plantts that may hacularly vulnerents is also destrengthened higher risk. Bfor openings
he wind hazarnts (see Figurement plant is nutual aid and gan individual
tial ed
FigurHaiti P
raise water frlding that hotrical and conntinued opera
:
any type of ha
and damage nt and controareas. Figure 9n. ngs is dependay have been t a pump stati
RAMEWORKWorkshop
ter Infrastruc
3
uses separatioows pipeline dorted buildingts is dependenave been comrable to damaependent on bd wind-resistaBuildings wit(windows, do
rd. e 9-7) are somnot operationagovernment rutility may h
re 9-7: TempoPort Au Prin
Photo b
from one elevouses pumps, ntrol equipmation when
azard event pr
pumps and thols at pump sta9-8 shows a p
dent upon the completed. F
ion after the 2
cture
on of process damage due t
g. nt upon the ty
mpleted. Unreiage in earthqubuilding constant design andth continuousoors), and ade
metimes used al or operatinresources to ahave available
orary Water ce Earthquak
by Don Ballan
vation to a himotors that
ment. Pump scommercial
revents opera
heir motors. ations locatedpump station
type and yearFigure 9-9 sho2011 Christch
tank constructo differential
ype and year oinforced maso
uakes. truction type d constructions load paths foequate roof an
after major ng at very limiaugment the e.
Treatment Plke, 2010 (Sountyne)
igher elevatiopower the pu
stations oftenpower supp
ation of pump
d wholly or adjacent to th
r of original ows significanhurch earthqu
ction l
of onry
and n or all nd
ited
lant, urce:
on). A umps,
n have ply is
ps if
he
nt uake

FigurDamaged
M
Buildand thcontin
9.2.1.5. S
Water utilStored poTypically from fire head, as re
Modern tanks aconstructeTypical ctheir assoare indicPotable reservoirslined eartconcerns be covere
Typical d
Elevagradeconten
At gralocatehydrothe tan
Inlet avarietmecha
1 AWWA is
re 9-8: Bismad By Flood In
Missouri River
ding performahe overall abinuous load pa
torage
lities use storotable water i
one to three suppression oequired by th
utility-scaleand reserved of steel oconstruction ociated desigcated in T
water s are often then structurerequire the red, typically w
amage to wat
ated storage ta and can be dnts. High winade or partialled in or near fodynamic forcnks. Buoyancand outlet pipty of hazards, anical piping
s American Wate
DIS50
Water an
rck, ND Pumnundation Frr (Source: FE
nce as a resullity of the bui
ath.
rage tanks anis drawn dowdays of aver
or other emerhe characterist
e storage voirs are r concrete. types and
gn standard Table 9-2.
in-ground concrete-
es. Security eservoirs to with a concret
ter storage tan
anks are moredamaged to thnds present a hly undergrounflood-prone aces imposed bcy forces can ping connectio
particularly wjoints adjace
er Works Associ
SASTER RESI0% Draft for
20 Ond Wastewate
Chapt
mp Station rom AdjacentEMA)
lt of wind eveilding envelop
d reservoirs twn during timrage daily wargency needs.tics of the dis
te, metal, or w
nks and reserv
e susceptible the point of struhigher hazardnd storage tan
areas. Hydrostby higher velocause uplift oons on water when the stornt to a steel ta
iation. ACI is Am
Table
Tank/Reser
Ground-supp
Steel standpi
Elevated stee
Reinforced c
Wire- and st
Tendon-pres
ILIENCE FRANorman, OK
October 2014er Sector, Wat
ter 9, Page 9 of 33
t Figu
DifferentEarthqua
ents is dependpe to stay inta
to balance wames of peak uater demand i Elevated stotribution syst
wood roof sup
voirs includes
to hazards frouctural failured in coastal arnks are more tatic forces frocity flows orof subgrade tastorage tanks
rage tank itselank that were
merican Concret
e 9-2: Tank/R
rvoir Type
ported steel rese
ipe
el tank
concrete tank
trand- wound, cir
stressed concrete
RAMEWORKWorkshop
ter Infrastruc
3
ure 9-9: Pumptial Settlemenake, 2011 (So
dent on buildiact during hig
ater demand wusage and recis stored to saorage tanks catem.
pported by int
s:
om high winde resulting in reas. susceptible to
rom standing r wave actionanks if the sois and reservoilf is damagede separated du
te Institute.
Reservoir Typ
ervoir
rcular, prestress
e tank
cture
p Station Damnt, Christchuource: Eiding
ing constructigh winds as w
with water prcharged durinatisfy increasan be used to
termediate co
ds than structusudden relea
o flood damagor slow movi
n can damage il becomes sairs are prone td or fails. Figuuring the 1994
pes And Desig
ed concrete tank
mage Due Tourch New Zeager & Tang, 2
ion type and ywell as having
roduction capng off-peak hsed usage demincrease hyd
lumns.
ures located aase of their
ge, particularling water or or cause failu
aturated. to damage froure 9-10 show4 Northridge
gn Standard
Design Standard1
AWWA D
AWWA D
AWWA D
ACI 350
k AWWA D
AWWA D
o aland 2014)
year g a
pacity. hours. mands draulic
at
ly if
ure of
om a ws
100
100
100
110
115
earthqto the
Earthqresistewall mbecau
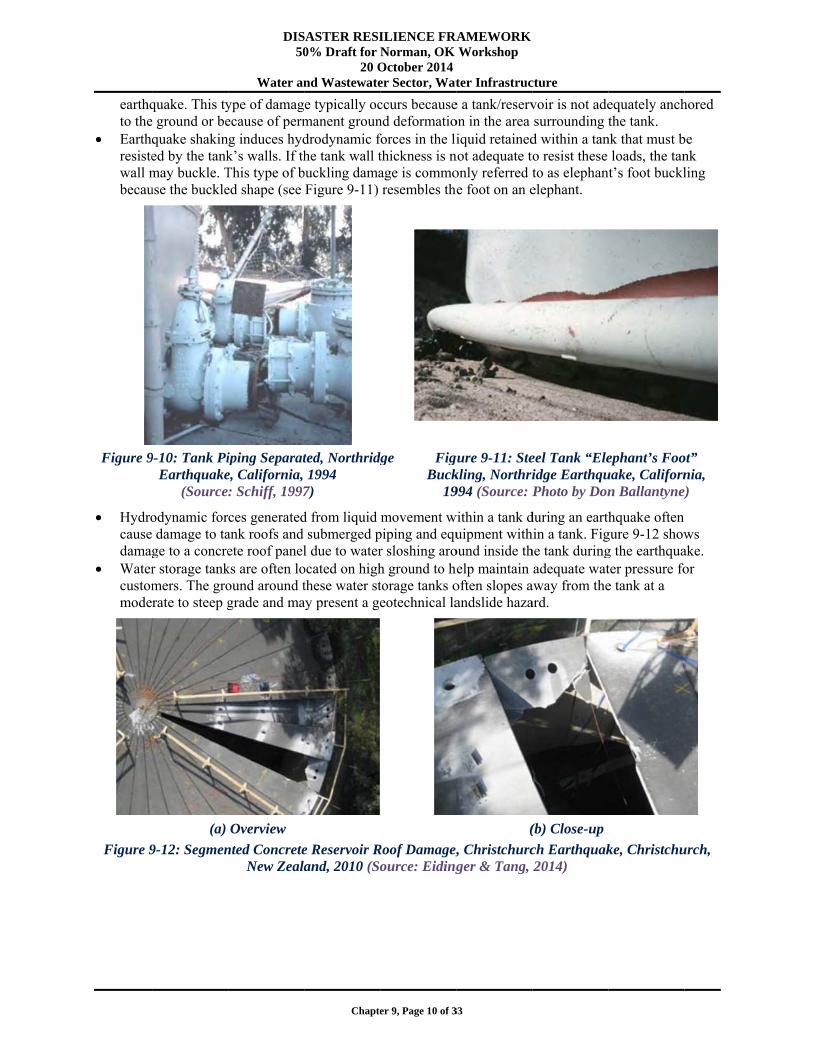
Figure 9
Hydrocausedamag
Watercustommode
Figure 9
quake. This tye ground or bequake shakined by the tankmay buckle. Tuse the buckle
9-10: Tank PipEarthquake
(Source
odynamic for damage to tage to a concrer storage tankmers. The grorate to steep g
(a)
9-12: Segmen
DIS50
Water an
ype of damagecause of permg induces hydk’s walls. If thThis type of bed shape (see
iping Separate, California, : Schiff, 1997
ces generatedank roofs and ete roof panel
ks are often loound around tgrade and ma
Overview
nted ConcreteNew Zeala
SASTER RESI0% Draft for
20 Ond Wastewate
Chapte
e typically ocmanent groundrodynamic fhe tank wall t
buckling damaFigure 9-11)
ted, Northridg1994
7)
d from liquid submerged p
l due to waterocated on highthese water stay present a ge
e Reservoir Rand, 2010 (So
ILIENCE FRANorman, OK
October 2014er Sector, Wat
er 9, Page 10 of 3
ccurs becausend deformatioforces in the lithickness is nage is commoresembles the
dge FigBuck
19
movement wpiping and equr sloshing aroh ground to htorage tanks oeotechnical la
Roof Damage,ource: Eiding
RAMEWORKWorkshop
ter Infrastruc
33
e a tank/reservon in the area iquid retained
not adequate toonly referred te foot on an e
gure 9-11: Stekling, Northri994 (Source: P
within a tank duipment with
ound inside thelp maintain
often slopes aandslide haza
(
, Christchurcger & Tang,
cture
voir is not adesurrounding t
d within a tano resist these to as elephanelephant.
eel Tank “Eleidge EarthquPhoto by Don
during an earthhin a tank. Fighe tank duringadequate wat
away from theard.
(b) Close-up
ch Earthquak2014)
equately anchthe tank.
nk that must bloads, the tan
nt’s foot buckl
ephant’s Foouake, Californn Ballantyne)
hquake often gure 9-12 showg the earthquater pressure foe tank at a
ke, Christchu
hored
be nk ling
ot” nia,
e)
ws ake. or
urch,

Wateremptymay bwave largerwas dan exatanks topplethe 20tank igroun
9.2.2. Wa
Wastewatindustrial them to aAfter sepdisinfectiofor irrigatwater. Othwater in th
Wastewattreatment,
9.2.2.1. C
The collefor wastewto that foinstead oindividualwastewateconveys products Also, aspipelines pressure, grade of tInfiltratiocan signifpumps coare comm
Buried piresult in Typical d
Similaa resu
2 ASTM is A
r storage tanky tanks) in a tbe subjected timpact force
r than the seisdesigned to reample of this in the foregro
ed by tsunami011 Tohoku Jin the backgrond and does no
astewater Sys
ter systems liquid wast
a treatment plparation of on, treated wation or other pher utilities hhe same pipel
ter systems , and 3) pump
Collection
ection pipelinwater systemr water syste
of deliveringl customer collectioliquid and oaway from
s opposed that opera
sewer lines athe pipelines in and inflowficantly increaonvey wastew
monly used for
ipelines are lewidespread amage to was
ar to water diult of landslid
American Societ
DIS50
Water an
ks (especially tsunami inundto buoyancy (s that may be
smic anchoragsist. Figure 9behavior: tw
ound were floi wave inunda
Japan earthquound was on hot appear to b
stems
collect dote products lant in a sewe
solids, procastewater is dpurposes. Somhave collectiolines.
are composeping. The bas
ne network s is similar
ems, except g water to ers the n system
other waste customers. to water
ate under are generally in the system
w of groundwaase the volum
water through r constructing
ess vulnerabldamage of bstewater colle
istribution syses or erosion.
ty for Testing an
SASTER RESI0% Draft for
20 Ond Wastewate
Chapte
partially dation zone (uplift) and e much ge the tank -13 shows o liquid fuel
oated and ation after ake. The higher be damaged.
omestic and and convey
er (pipeline). cessing and discharged as me utilities haon systems th
ed of three ic function of
gravity feedneed to be ca
ater into the me of wastew
pressurized g new collecti
le to some tyburied infrastection pipeline
stems, wastew. This can lea
nd Materials. AW
Table 9-3:
Wastewater
Clay pipe
Prestressed c
Polyvinyl Ch
Polyvinyl Ch
Ductile iron
High-density
ILIENCE FRANorman, OK
October 2014er Sector, Wat
er 9, Page 11 of 3
effluent intoave separate chat are combi
general catef each of thes
d systems thatarefully contrcollection sy
water that arrivforce mains. ion pipelines
ypes of hazartructure. Flooes includes:
water collectioad to damage o
WWA is America
FiguTsunami
20
Wastewater C
r Collection Pip
concrete cylinde
hloride (PVC) p
hloride (PVC) p
pipe
y polyethylene (H
RAMEWORKWorkshop
ter Infrastruc
33
a receiving bcollection sysined and coll
egories of ine categories i
at are not undrolled to mainystem throughves at the treaA variety ofand repair of
rds, includingod forces can
on pipelines cor breaks wit
an Water Works
re 9-13: Steei Inundation,
011 (Source: T
Collection Pip
pe Type
er pipe
ipe, gravity
ipe, force main
HDPE) pipe
cture
body of waterstems for waslect both was
nfrastructure: is briefly desc
der pressure. ntain gravity fh cracks and atment plant.f pipe materiaf existing pipe
g wind, but sn also impac
can be exposethin the pipeli
s Association.
el Tanks Disp, Tohoku EarTang & Edw
ipe Types and
Design Stan
ASTM C700
AWWA C30
ASTM D303
AWWA C90
ASTM A746
ASTM F714
r or may be rstewater and stewater and
1) collectiocribed below.
The elevatioflow in the sybreaks in the In some instals (see Tablees.
seismic eventct buried sys
ed and damagines.
placed Due Torthquake, Japards, 2014)
d Design Stan
ndard2
0
01
34
00
6 and AWWA C
4
reused storm storm
on, 2) .
n and ystem. e pipe tances e 9-3)
ts can stems.
ged as
o pan,
ndard
C150

LiqueObser10 bre
Liquein pip
CrackFigurwaste
Figure 9-Christ
Zealand
Somebridgedesignand susuppopipelidamagadjaceraw w
Wasteon briinundHydrofloodidamaginund
Soil slevelsleadin
9.2.2.2. T
Wastewateffluent dand clariffrom primplants typ
efaction-inducrvations fromeaks and leakefaction often peline and struked and brokee 9-15). Incre
ewater treatme
-14: Manholetchurch Earthd, 2011 (Sour
etimes wastewes at river or ned, relative murrounding soorted pipelineine attached toged by differeent bridge sup
wastewater direwater collectidges experien
dation and flooodynamic foring or high vege structures
dation alone. saturation coms can result inng to ruptures
Treatment
ter treatment discharge meefiers remove omary sedimenpically consist
DIS50
Water an
ced permanenm past earthquaks in water pip
induces floatucture invert een sections of eased flow ratent plants afte
e Floated duehquake, Chrirce: Eidinger
water pipelineother crossingmovement beoil could resus. Figure 9-16o a bridge. Thential settlempports, resultirectly to the rtion pipelinesnce damage aod-borne debces associatedelocity flows and attached
mbined with rn uplift or buos and breaks w
plants procesets public heorganic and inntation tanks t of a number
SASTER RESI0% Draft for
20 Ond Wastewate
Chapte
nt ground dispakes indicate pelines (OSSPting of manhoelevations canf pipe lead to te creates excer earthquake
e to Liquefacistchurch, Ner & Tang, 201
es are co-locatgs. If not propetween the brilt in damage t6 shows a sewhe pipeline w
ment between ing in discharriver. s that are co-las a result of fris impact. d with coastaare more likepipelines tha
ising groundwoyancy forces within the sys
ss raw sewagealth standardnorganic comis typically
r of process ta
ILIENCE FRANorman, OK
October 2014er Sector, Wat
er 9, Page 12 of 3
placement cauapproximate
PAC, 2013).oles and sewen cause disrupsignificant iness demand o
es.
ction, ew 14)
ChrZeala
ted on perly idge to the
wer as
rge of
ocated flood
l ely to an
water on buried piptem.
ge from houseds. Various scmponents of th
processed inanks, yard an
F
E
RAMEWORKWorkshop
ter Infrastruc
33
uses breaks anly one sewer
er pipelines (sption to the c
ncreases in infon the already
Figure 9-15ristchurch Eaand, 2011 (So
pelines and co
ehold and indcreens, sedimhe raw wastew
n anaerobic dnd plant pipin
Figure 9-16: Bridge SuppEarthquake,
2011 (Sour
cture
nd collapses opipe collapse
see Figure 9-1ollection systfiltration and y reduced cap
5: Sewer Pipearthquake, Chource: Eiding
ollection syst
dustrial sourcmentation tanwater influen
digesters. Wang, pumps, ch
Sewer Pipelinport Settlemen
Christchurchrce: Eidinger
of sewer pipee occurs for ev
14). These chtem gravity flinflow rates (
pacity of
eline Break, hristchurch, Nger & Tang, 2
tem structures
ces so the resnks, aeration tnt. Sludge remastewater treaemical storag
ine Break Dunt, Christchuh, New Zeala& Tang, 201
elines. very
hanges low. (see
New 2014)
s
ulting tanks,
moved atment ge and
ue To urch and, 14)

feed equiequipmen
Typical d
WastevolumTheredamagThe Nall 14
Figure Flood
Durinseawasewer
The HWWTincludBay PYonk A
baovSWN
Einfa9-fasi
Fotsywin
ipment, lab nt.
amage to was
ewater treatmmes of treatedefore, they canges to buildin
New York Cit of the WWT
9-17: Wastewd-Prone Areas
ng Sandy overater was relear system, flooHurricane SanTPs in the Newding the PassaPark Sewage Tkers, NY (FEMA clarifying ta
asin with a hevertopped at tewerage Com
Wastewater TrNewark, NJ. Electronic connundated and acilities, as sh-18, which deacilities’ recovignificantly. loodwater inuther mechanicystems and co
wastewater trencluding settli
DIS50
Water an
and office b
stewater treatm
ment plants ared water to natun be vulnerabngs, equipmenty Departmen
TPs it owns an
water Treatms. Hunts Poin
r 560 million ased into wateod inundation ndy Mitigationw Jersey and aic Valley SewTreatment PlaMA, 2013). Soank located ineight of 13 feethe Passaic V
mmission reatment Plan
ntrols were damaged in m
hown in Figurelayed the very times
undation damcal and electromponents ofatment proceing tanks and
SASTER RESI0% Draft for
20 Ond Wastewate
Chapte
building spa
ment plants in
e often locateurally occurrible to flood innt, and electri
nt of Environmnd operates ar
ment Plants Arnt WWTP Alo
(Source:
gallons of unerways. This oof plant faciln AssessmentNew York mwerage Commant East Rockome damage
n a et was
Valley
nt in
many re
maged rical f the ss
d biological tre
F
ILIENCE FRANorman, OK
October 2014er Sector, Wat
er 9, Page 13 of 3
ace, and asso
ncludes:
d in or near flng bodies of
nundation fromical and mechmental Protectre at risk of fl
re Often Locong the East NYC DEP, 2
ntreated and doccurred as a lities, and powt Team (MAT
metropolitan amission Wastkaway, NY anthey experien
eatment syste
Figure 9-18:Floodwater at
Was
RAMEWORKWorkshop
ter Infrastruc
33
ociated mech
flood-prone arwater via gram riverine or hanical systemtion (NYC Dlood damage
cated AdjacenRiver In New
2013)
diluted sewageresult of infil
wer outages (NT) Report invarea as a resultewater Treatmnd the Yonkernced included
ems.
: Subgrade Ethe Passaic V
stewater Faci
cture
hanical, elect
reas because tavity (see Figucoastal sourc
ms and loss ofDEP) noted in
(NYCDEP, 2
nt To Or Alonw York City I
e mixed withltration of floNYC DEP, 2estigated damlt of storm surment Plant inrs Wastewate
d:
Electric SystemValley Sewerility (FEMA,
trical and co
they return laure 9-17). ces resulting if functionalitya recent study
2013).
ng WaterwaysIs Shown Her
h stormwater aoodwaters into013).
mages at threerge inundation
n Newark, NJ,er Treatment P
m Damaged Brage Commiss 2013)
ontrol
arge
n y. y that
s In re.
and o the
e n , the Plant
By sion

Manyinundvia thutilitisome otherwFigurpump
Wastegravittreatmelevatlow pgreateearthqjoint s
The hcausemissinthe easloshi
Damaearthqhydro
Plant suppoprocesuppowhereelectr
Figure 9Perm
Earthqu
y WWTPs aredation, floodwhese pathwayses located witfacilities and
wise be protee 9-19 shows
ped out of lowewater collectty feed, mean
ment plant is ation of the sys
points often coer liquefactionquakes. Liqueseparation (se
hydrodynamic damage to prng process tanarthquake. Figing liquid witage to chain-dquakes. Damaodynamic forccomponents
ort electrical css tanks mov
orted utilities.e one bridge erical conduit a
9-20: Processmanent Grounake, Chile, 2
DIS50
Water an
e interconnectwaters can ents causing damthin them and
d buildings thacted from flo floodwaters
wer levels of Wtion systems a
ning that the wat a low pointstem. Unfortuoincide with an potential duefaction inducee Figure 9-20
c forces generrocess tank conk roof panelgure 9-23 shothin the tank. driven solids cage consists oces from liquiare often connconduit and ping in differen Similarly, hiexperienced aand exposed w
s Tank Joint nd Deformat010 (Source:
Yu)
SASTER RESI0% Draft for
20 Ond Wastewate
Chapte
ted below graer and travel
mage to d reaching at might odwaters. being
WWTP. are generally
wastewater t in the unately these areas of uring ced permanen0 and Figure
rated from liqovers, bafflesls due to damaows damage to
collection sysof dislodged cid movement nected by catrocess pipingnt directions igh wind evena permanent owires during t
Offset Due T
tion, Maule Photo by Ke
ILIENCE FRANorman, OK
October 2014er Sector, Wat
er 9, Page 14 of 3
ade via tunnel
nt ground disp9-21), damag
quid movemens, and other suage from liquo clarifier equ
stems (scraperchains or sprowithin the tan
twalks or otheg. Differentialfrom seismic
nts can damagoffset of aboutthe 2010 Mau
FigurLower Le
Severe
To
ent
FigS
Defo
RAMEWORKWorkshop
ter Infrastruc
33
ls and utility c
placement hasge to pipelines
nt within a tanubmerged equuid sloshing aruipment due t
rs, etc.) has bockets and bronk (see Figurer small accesl movement b shaking) cange these typest 12 inches an
ule earthquake
re 9-19: Floodevels of a WW
e Storms Resu
gure 9-21: ChSeparation Duormation, Ma
(Source:
cture
conduits. Dur
s often causeds, pipe racks,
nk during an uipment. Figuaround inside to hydrodynam
been observedoken scraper bre 9-24). ss bridges. Thbetween compn damage thess of features. nd caused sepe in Chile.
dwaters Are PWTP In the Aulted In Sign
hlorine Contaue To Permanaule Earthqua: Photo by Ke
ring flood
d process tanketc.
earthquake oure 9-22 showthe tank durinmic forces of
d in many pasblades caused
hese bridges mponents (i.e., tse catwalks anFigure 9-25 s
paration of
Pumped Out Atlanta Area Aificant Dama
act Tank Joinnent Groundake, Chile, 20ent Yu)
k
ften ws ng f
st d by
may two nd shows
of After
age
nt
d 010

Figure 9-Slosh
Figure 9Tohok
Seismof oribuildiduringWWT
Nonstoperasprinkability
Tsunaother damagmajorof Sentsunamcosts
-22: Process hing, Maule E
(Source: P
9-24: Damageku Earthquak
Matsuhas
mic performanginal construings are particg high wind eTPs in coastaltructural dam
ation of the fackler lines or lay of staff to pami inundatioequipment. Hge to pipe racr seismic strucndai. The 201mi completelywere estimate
DIS50
Water an
Tank Roof DEarthquake,
Photo by Kent
e To Chain-Dke, Japan, 20shi, et al., 201
nce of buildinction and anycularly vulnerevents is depel areas are gen
mage to lab andcility (especiaab equipmenterform their j
on may flood High velocity ck foundationctural upgrad11 Tohoku eary inundated thed to be $1 bi
SASTER RESI0% Draft for
20 Ond Wastewate
Chapte
Damage Due Chile, 2010 t Yu)
Driven Scrape011 (Source: 12)
ngs at wasteway seismic retrorable to damaendent on the nerally more vd office spaceally the lab). It topples ontojobs after an eabovegroundwater flows a
ns, buried tankde was performrthquake’s shhe plant causillion US doll
ILIENCE FRANorman, OK
October 2014er Sector, Wat
er 9, Page 15 of 3
To Figur
To S
er, Figure
To Bri
ater treatmentofits. Unreinfage in earthquage and type vulnerable toes at wastewaIf paper draw
o the floor becearthquake w
d infrastructuraround wastewks, pipelines, med at the mahaking causeding significanlars (Tang &
RAMEWORKWorkshop
ter Infrastruc
33
re 9-23: ClarifSloshing, Mau
(Source:
e 9-25: Damaidge Moveme
2010 (Sour
t plants is depforced masonruakes. Similar of original co
o high winds tater treatment
wing files are wcause it is not
will be hamperre causing damwater treatmeetc. (see Figu
ain wastewated no damage tnt damage andEdwards, 201
cture
ifier Equipmeule Earthqua: Photo by Ke
age To Electrent, Maule Earce: Photo by
pendent uponry and older trly, building ponstruction anthan those inlt plants may iwater damaget adequately ared. mage to pumpent plants mayure 9-26 and Fer treatment pto the plant. Hd a complete 14).
ent Damage Dake, Chile, 20ent Yu)
rical Conduitarthquake, C
y Kent Yu)
n the type andtilt-up concreperformance nd any retrofiand. mpact contined by broken anchored, the
ps, motors, any cause scourFigure 9-27). plant for the CHowever, the shutdown. Re
Due
010
t Due
Chile,
d year te
fits.
nued
nd r A
City
epair
Figure 9-due to Ts
20
9.2.2.3. P
Pump or lelevation.may remapump statpipes, andemergenc
Pump statgrade sewearthquak
Typical d
Floodsubmeduring
Flood Lique
float apossib
Loss o Tsuna
other collec
Tsunawave damagabove
-26: Collapsesunami Scou011 (Source:
Pumping
lift stations m The pump m
ain a pressurition typicallyd associated y generators
tions are oftewage collectikes.
amage to was
dwater inundaersible type pg flood inund
dwater inundaefaction durinand tilt (see Fbly render theof commerciaami inundatioequipment. H
ction wells anami inundatioforces and dege to pump ste-grade struct
DIS50
Water an
e of Pipe Rackr, Tohoku EaTang & Edw
may be requiremay dischargeized force m
y consists of mechanical, to enable con
en located in ion pipelines
stewater pump
ation of pumppumps. This wdation from Saation of electrng seismic eveFigure 9-28). Te pump stational electrical pon may flood High velocity nd pipelines. on can cause sebris impact ftations from tures.
SASTER RESI0% Draft for
20 Ond Wastewate
Chapte
k next to Digarthquake, Ja
wards, 2014)
ed in a predome at the higheain and discha simple buielectrical an
ntinued operat
low-lying are. This makes
p stations inc
ps can disable was a commonandy (NYCDrical equipmenents can causeThis movemen inoperable.ower preventabovegroundwater flows a
significant damforces. Figuretsunami force
ILIENCE FRANorman, OK
October 2014er Sector, Wat
er 9, Page 16 of 3
gesters apan,
Figudu
Jap
minately graver elevation toharge at a dilding that ho
nd control eqtion when the
eas or below s them vulne
cludes:
and damage n cause of puEP, 2013). nt and controe buried pumpent is also like
ts operation od infrastructuraround pump
mage to above 9-29 and Figes. Similar tsu
RAMEWORKWorkshop
ter Infrastruc
33
ure 9-27: Eroue to Tsunamipan, 2011 (So
vity feed systeo another secstant location
ouses pumps, quipment. Pume commercial
ground sinceerable to flo
the pumps anump station fa
ols. p station wastely to damage
f pumps if there causing dam
stations may
ve-grade strucgure 9-30 illuunami damage
cture
oded Pipe Supi Scour, Toho
ource: Tang &
em to lift wasction of gravin, such as a
motors that mp stations mpower supply
e they move wooding and li
nd their motorailure within N
tewater collece connecting p
ere is no backmage to pumpy cause scour
ctures due to hustrate typicale can be expe
upport Foundoku Earthqu& Edwards, 2
stewater to a hity feed pipeltreatment plapower the pumay have stay is interrupte
water along biquefaction d
rs if they are New York Cit
ctions wells tpiping and
kup power supps, motors, andamage to bu
hydrodynamil significant ected for other
dation ake,
2014)
higher ine or ant. A umps, andby ed.
below during
not ty
to
upply. nd uried
ic
r

FigureTilted
Earthqu(
Figure 9-
9.2.3. Com
A combinwastewateof the wawater. Coindustrial significancombinati
Expancomb
Sewercollec
CSO scombis then
Screehypocscreenefflue
e 9-28: Pumpd Due To Liquake, Christc(Source: Eidi
-30: Structura
mbined Stor
ned sewer syer in the samstewater treat
ombined sewewaste, toxic
nt investmentsions of approa
nded treatmeined sewer flr separation –ction systemsstorage – Adined sewer fln pumped to t
ening and disichlorite for dins. Solids are ent is directed
DIS50
Water an
Station Wellquefaction, Chchurch, New Zinger & Tang
al Damage F20
m and Sewer
ystem is desige pipe. Whentment plant, uer overflow (C
materials, ans to minimizeaches have m
ent capacity –ow associated– Adding a se. ding storage cow associatedthe wastewateinfection – Fisinfection andirected to th
d to the receiv
SASTER RESI0% Draft for
20 Ond Wastewate
Chapte
l Floated andhristchurch Zealand, 201
g, 2014)
From Tsunam011 (Source: T
r Lines
gned to collen heavy rainfauntreated sewCSO) may cond debris. Ove CSOs and m
mitigated CSO
– Adding treatd with large second separat
capacity (typid with large ser treatment pacilities are a
nd solids greathe wastewater
ving body of w
ILIENCE FRANorman, OK
October 2014er Sector, Wat
er 9, Page 17 of 3
d
11
FigureWaveJapa
mi Wave and DTang & Edwa
ect storm watfalls produce wer contents montain not onlver the last 25meet requirem
Os, including:
tment capacitstorm events.te piping syste
ically one or storm events. plant for procadded to enablter than aboutr treatment plwater.
RAMEWORKWorkshop
ter Infrastruc
33
e 9-29: Struce and Debris Ian, 2011 (Sou
Debris Impacards, 2014)
ter runoff, doa volume of may flow direly storm wate5 plus years, ments of the 1
ty to the wast
em to decoup
more tunnelsAfter the stor
cessing as caple the flows tt 0.25 in. are rlant for proce
cture
ctural DamagImpact, Toho
urce: Tang &
ct, Tohoku E
omestic sewawater that exectly into theer but also unwastewater u
1972 Clean W
tewater system
ple the sanitar
s) to collect anrm event the s
pacity is availto be treated wremoved with
essing and the
ge From Tsunoku EarthquaEdwards, 20
Earthquake, J
age, and induxceeds the cape receiving bontreated humautilities have Water Act. Va
m to handle th
ry and storm w
nd store the stored wastewable.
with sodium h a series of e treated wate
nami ake,
014)
Japan,
ustrial pacity ody of an and
made arious
he
water
water
er

DISASTER RESILIENCE FRAMEWORK 50% Draft for Norman, OK Workshop
20 October 2014 Water and Wastewater Sector, Performance Goals
Chapter 9, Page 18 of 33
9.3. Performance Goals
The large and distributed nature of water and wastewater systems, combined with their interdependence on other lifelines, limits the practicality of maintaining 100 percent operational capacity in the aftermath of a major natural disaster. This section identifies a recommended level of service performance goals for water and wastewater systems.
We provide a recommended level of service performance goals as a starting point; they need to be discussed with individual utilities and communities before they are adopted. It is important to consider the uniqueness of the infrastructure of individual utilities and the specific needs of their customers when adopting system performance goals for a specific community. It is critical that all water and wastewater stakeholders be engaged in establishing community-specific level of service performance goals for each of the three different hazard levels (routine, expected, and extreme) discussed in Section 2.1.2. This group of stakeholders should include representation from:
Residential customers Business customers Industrial customers (if applicable) Water wholesale customers (if applicable) Hospital customers (if applicable) Firefighters Local government officials Local emergency management officials Drinking water regulators (Health Authority, etc.) Wastewater regulators (Dept. of Environmental Quality, Environmental Protection Agency, etc.) Water and wastewater utility operators and engineers Consulting engineers Interdependent lifelines (power, liquid fuel, transportation, etc.)
The process of establishing performance goals involves a discussion amongst the stakeholders about their expectations for the availability of water and wastewater systems during post-disaster response and recover phases for different hazard levels (e.g., routine, expected, and extreme). The assumed expectation of the general public is that for routine disasters there would be little, if any, interruption of service for water and wastewater lifelines. A dialogue is required between utilities and customers to determine the appropriate level of service performance goals for expected and extreme events.
There may be elements in a system that are so critical to public safety that they need to be designed to remain operational after an extreme event. For example, failure of a water supply impoundment dam would present a significant life-safety hazard to downstream residents, and should be designed for an extreme event.
Interdependencies of water and wastewater systems with other lifelines also need to be considered when developing performance goals. For instance, availability of a reliable supply of liquid fuel impacts how long systems can run on backup emergency generators and impacts the vehicles and equipment needed by repair crews. Delivery of liquid fuels is in turn dependent on the status of the highway and bridge transportation network.
Table 9-4 and Table 9-5 provide recommended water and wastewater system performance goals for post-disaster response and recovery for an expected wind or seismic event. Performance goals are broken down into functional categories (i.e., water for fire suppression at key supply points, treatment plants operating to meet regulatory requirements, etc.) and further broken down into target timelines to restore the functional categories to 30 percent, 60 percent, and 90 percent operational status.

DISASTER RESILIENCE FRAMEWORK 50% Draft for Norman, OK Workshop
20 October 2014 Water and Wastewater Sector, Performance Goals
Chapter 9, Page 19 of 33
Table 9-4: Detailed Infrastructure System Resilience Matrix – Water
Disturbance Restoration times (1) Hazard Any (2) 30% Restored
Hazard Level Expected 60% RestoredAffected Area Community 90% RestoredDisruption Level Moderate (3) X Current
Functional Category: Cluster
(4) Support Needed
(5) Target Goal
Overall Recovery Time for Hazard and Level Listed Phase 1 -- Response
Phase 2 -- Workforce
Phase 3 -- Community
Days 0
Days1
Days1-3
Wks1-4
Wks 4-8
Wks 8-12
Mos 4
Mos4-36
Mos36+
Source 1 Potable water at supply (WTP, wells, impoundment) 30% 60% 90% X Water for fire suppression at key supply points 90% X Transmission (inculding Substations) 1 Backbone transmission facilities (pipelines, pump stations, and reservoirs)
90% X
Distribution Critical Facilities 1 Hospitals, EOC, Police Station, Fire Stations 60% 90% X Emergency Housing 1 Emergency Shelters 60% 90% X Housing/Neighborhoods 2 Drink water available at community distribution centers 60% 90% Water for fire suppression at fire hydrants 90% X Community Recovery Infrastructure 3 All other clusters 30% 90% X
Footnotes: 1 Specify hazard being considered
Specify level -- Routine, Expected, Extreme Specify the size of the area affected - localized, community, regional Specify severity of disruption - minor, moderate, severe
2 30% 60% 90% Restoration times relate to number of elements of each cluster 3 X Estimated restoration time for current conditions based on design standards and current inventory
Relates to each cluster or category and represents the level of restoration of service to that cluster or category Listing for each category should represent the full range for the related clusters Category recovery times will be shown on the Summary Matrix "X" represents the recovery time anticipated to achieve a 90% recovery level for the current conditions
4 Indicate levels of support anticipated by plan R Regional S State MS Multi-state C Civil Corporate Citizenship
5 Indicate minimum performance category for all new construction. See Section 3.2.6

DISASTER RESILIENCE FRAMEWORK 50% Draft for Norman, OK Workshop
20 October 2014 Water and Wastewater Sector, Regulatory Environment
Chapter 9, Page 20 of 33
Table 9-5: Detailed Infrastructure System Resilience Matrix – Wastewater
Disturbance Restoration times (1) Hazard Any (2) 30% Restored
Hazard Level Expected 60% RestoredAffected Area Community 90% RestoredDisruption Level Moderate (3) X Current
Functional Category: Cluster
(4) Support Needed
(5) Target Goal
Overall Recovery Time for Hazard and Level Listed Phase 1 -- Response
Phase 2 -- Workforce
Phase 3 -- Community
Days 0
Days1
Days1-3
Wks1-4
Wks 4-8
Wks 8-12
Mos 4
Mos4-36
Mos36+
Treatment Plants Treatment plants operating with primary treatment and disinfection
60% 90%
Treatment plants operating to meet regulatory requirements 30% 60% 90% X Trunk Lines Backbone collection facilities (major trunklines and pump stations)
30% 60% 90% X
Collection Lines Critical Facilities Hospitals, EOC, Police Station, Fire Stations 30% 90% X Emergency Housing Emergency Shelters 30% 90% X Housing/Neighborhoods Threats to public health and safety controlled by containing & routing raw sewage away from public
30% 60% 90% X
Community Recovery Infrastructure All other clusters 30% 60% 90% X
Footnotes: 1 Specify hazard being considered
Specify level -- Routine, Expected, Extreme Specify the size of the area affected - localized, community, regional Specify severity of disruption - minor, moderate, severe
2 30% 60% 90% Restoration times relate to number of elements of each cluster 3 X Estimated restoration time for current conditions based on design standards and current inventory
Relates to each cluster or category and represents the level of restoration of service to that cluster or category Listing for each category should represent the full range for the related clusters Category recovery times will be shown on the Summary Matrix "X" represents the recovery time anticipated to achieve a 90% recovery level for the current conditions
4 Indicate levels of support anticipated by plan R Regional S State MS Multi-state C Civil Corporate Citizenship
5 Indicate minimum performance category for all new construction. See Section 3.2.6
It is assumed that the financial burden associated with upgrading all components of an entire system to be more disaster resilient would overwhelm the short-term capital improvement budgets of most utilities. Therefore, performance goals have been established around the concept of a hardened backbone system. This backbone network should be capable of supplying key health and safety related community needs shortly after a disaster, while more extensive repairs are being completed on the remainder of the system. Performance goals are based on a balance of societal needs and realistic expectations of system performance.
9.4. Regulatory Environment
Water and wastewater utilities are subject to rules and regulations that are generally intended to protect public health and safety and the environment. These regulatory requirements are administered by Federal, State, and Local governmental agencies.

DISASTER RESILIENCE FRAMEWORK 50% Draft for Norman, OK Workshop
20 October 2014 Water and Wastewater Sector, Standards and Codes
Chapter 9, Page 21 of 33
9.4.1. Federal
United States Environmental Protection Agency (EPA)
Safe Drinking Water Act Contaminant Level Limits – EPA sets limits on levels of certain chemical and microbial
contaminants in drinking water. Underground Injection Control (UIC) – EPA regulates construction, operation, permitting, and
closure of injection wells that place fluids underground for storage or disposal. Clean Water Act Analytical Methods – EPA publishes laboratory test procedures for use by industry and
municipalities to analyze the chemical, physical, and biological components of wastewater. Effluent Limitations Guidelines – EPA establishes regulations for industrial wastewater
discharges to surface waters and publicly owned treatment works. National Pollutant Discharge Elimination System (NPDES) – EPA controls water pollution by
regulating point sources of pollutant discharge through the NPDES permit system.
9.4.2. State
State Drinking Water Programs (e.g., Oregon Health Authority, Drinking Water Services). States ensure water systems meet Safe Drinking Water Act standards. They ensure water systems test for contaminants, review plans for water system improvements, conduct on-site inspections and sanitary surveys, provide training and technical assistance, and take action against water systems not meeting standards.
State Water Quality Programs (e.g., Oregon Department of Environmental Quality, Water Quality Division). States ensure water systems meet water quality standards. They develop and implement water quality standards, regulate sewage treatment systems and industrial dischargers, collect and evaluate water quality data, provide training and technical assistance, and take action against wastewater systems not meeting standards.
9.4.3. Local
Individual municipalities or utility districts may elect to impose regulatory standards in excess of Federal and State standards. In practice this is seldom done due to the increased cost to customers associated with meeting higher than minimum regulatory standards.
9.5. Standards and Codes
The industry uses codes, standards, and guidelines to establish minimum acceptable criteria for design, assessment, and construction. Table 9-6 summarizes available codes, standards, and guidelines for design, assessment, and retrofit of water systems components. Table 9-7 provides a similar summary for wastewater systems.
DISASTER RESILIENCE FRAMEWORK 50% Draft for Norman, OK Workshop
20 October 2014 Water and Wastewater Sector, Standards and Codes
Chapter 9, Page 22 of 33
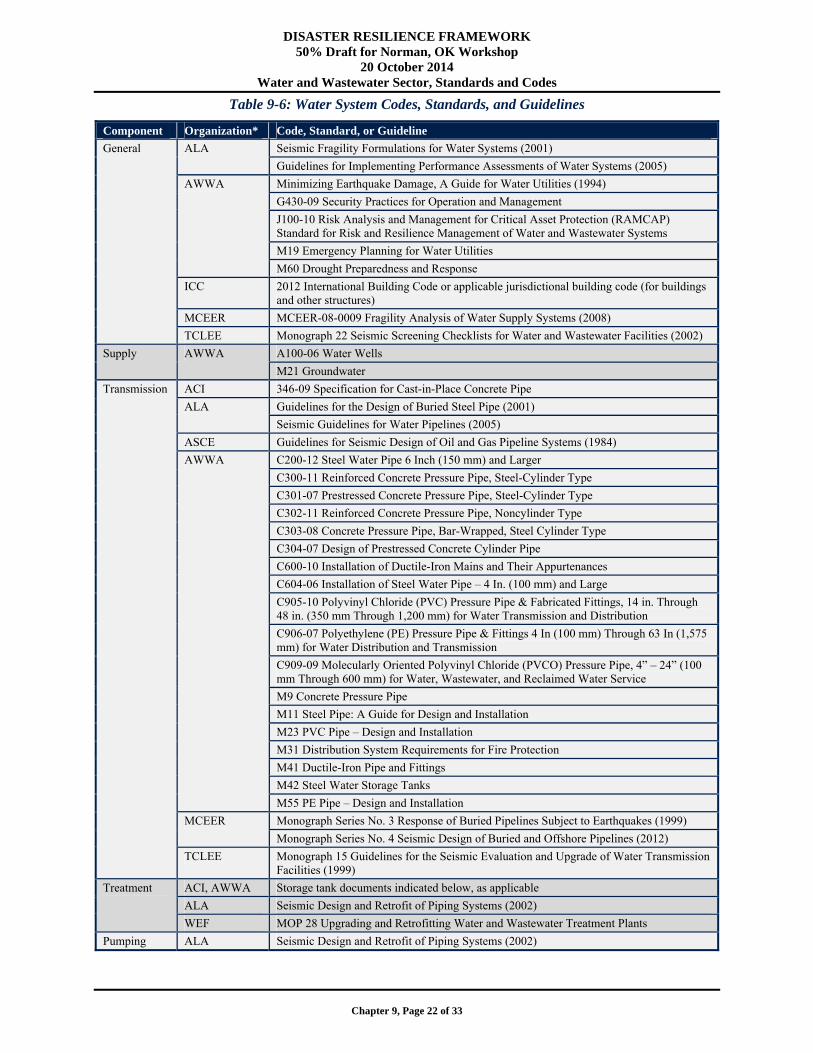
Table 9-6: Water System Codes, Standards, and Guidelines
Component Organization* Code, Standard, or Guideline
General ALA Seismic Fragility Formulations for Water Systems (2001)
Guidelines for Implementing Performance Assessments of Water Systems (2005)
AWWA Minimizing Earthquake Damage, A Guide for Water Utilities (1994)
G430-09 Security Practices for Operation and Management
J100-10 Risk Analysis and Management for Critical Asset Protection (RAMCAP) Standard for Risk and Resilience Management of Water and Wastewater Systems
M19 Emergency Planning for Water Utilities
M60 Drought Preparedness and Response
ICC 2012 International Building Code or applicable jurisdictional building code (for buildings and other structures)
MCEER MCEER-08-0009 Fragility Analysis of Water Supply Systems (2008)
TCLEE Monograph 22 Seismic Screening Checklists for Water and Wastewater Facilities (2002)
Supply AWWA A100-06 Water Wells
M21 Groundwater
Transmission ACI 346-09 Specification for Cast-in-Place Concrete Pipe
ALA Guidelines for the Design of Buried Steel Pipe (2001)
Seismic Guidelines for Water Pipelines (2005)
ASCE Guidelines for Seismic Design of Oil and Gas Pipeline Systems (1984)
AWWA C200-12 Steel Water Pipe 6 Inch (150 mm) and Larger
C300-11 Reinforced Concrete Pressure Pipe, Steel-Cylinder Type
C301-07 Prestressed Concrete Pressure Pipe, Steel-Cylinder Type
C302-11 Reinforced Concrete Pressure Pipe, Noncylinder Type
C303-08 Concrete Pressure Pipe, Bar-Wrapped, Steel Cylinder Type
C304-07 Design of Prestressed Concrete Cylinder Pipe
C600-10 Installation of Ductile-Iron Mains and Their Appurtenances
C604-06 Installation of Steel Water Pipe – 4 In. (100 mm) and Large
C905-10 Polyvinyl Chloride (PVC) Pressure Pipe & Fabricated Fittings, 14 in. Through 48 in. (350 mm Through 1,200 mm) for Water Transmission and Distribution
C906-07 Polyethylene (PE) Pressure Pipe & Fittings 4 In (100 mm) Through 63 In (1,575 mm) for Water Distribution and Transmission
C909-09 Molecularly Oriented Polyvinyl Chloride (PVCO) Pressure Pipe, 4” – 24” (100 mm Through 600 mm) for Water, Wastewater, and Reclaimed Water Service
M9 Concrete Pressure Pipe
M11 Steel Pipe: A Guide for Design and Installation
M23 PVC Pipe – Design and Installation
M31 Distribution System Requirements for Fire Protection
M41 Ductile-Iron Pipe and Fittings
M42 Steel Water Storage Tanks
M55 PE Pipe – Design and Installation
MCEER Monograph Series No. 3 Response of Buried Pipelines Subject to Earthquakes (1999)
Monograph Series No. 4 Seismic Design of Buried and Offshore Pipelines (2012)
TCLEE Monograph 15 Guidelines for the Seismic Evaluation and Upgrade of Water Transmission Facilities (1999)
Treatment ACI, AWWA Storage tank documents indicated below, as applicable
ALA Seismic Design and Retrofit of Piping Systems (2002)
WEF MOP 28 Upgrading and Retrofitting Water and Wastewater Treatment Plants
Pumping ALA Seismic Design and Retrofit of Piping Systems (2002)

DISASTER RESILIENCE FRAMEWORK 50% Draft for Norman, OK Workshop
20 October 2014 Water and Wastewater Sector, Standards and Codes
Chapter 9, Page 23 of 33
Component Organization* Code, Standard, or Guideline
Storage WEF MOP 28 Upgrading and Retrofitting Water and Wastewater Treatment Plants
ACI 350.3-06 Seismic Design of Liquid-Containing Concrete Structures and Commentary
350.4R-04 Design Considerations for Environmental Engineering Concrete Structures
371R-08 Guide for the Analysis, Design, and Construction of Elevated Concrete and Composite Steel-Concrete Water Storage Tanks
372R-03 Design and Construction of Circular Wire- and Strand-Wrapped Prestressed Concrete Structures
AWWA D100-11 Welded Carbon Steel Tanks for Water Storage
D110-13 Wire- and Strand-Wound, Circular, Prestressed Concrete Tanks
D115-06 Tendon-Prestressed Concrete Water Tanks
Table 9-7: Wastewater System Codes, Standards, and Guidelines
Component Organization3 Code, Standard, or Guideline
General ALA Wastewater System Performance Assessment Guideline (2004)
AWWA J100-10 Risk Analysis and Management for Critical Asset Protection (RAMCAP) Standard for Risk and Resilience Management of Water and Wastewater Systems
WEF Emergency Planning, Response, and Recovery
Guide for Municipal Wet Weather Strategies
MOP FD-17 Prevention and Control of Sewer System Overflows
ICC 2012 International Building Code or applicable jurisdictional building code (for buildings and other structures)
TCLEE Monograph 22 Seismic Screening Checklists for Water and Wastewater Facilities (2002)
Collection ACI 346-09 Specification for Cast-in-Place Concrete Pipe
ALA Guidelines for the Design of Buried Steel Pipe (2001)
ASCE Guidelines for Seismic Design of Oil and Gas Pipeline Systems (1984)
MCEER Monograph Series No. 3 Response of Buried Pipelines Subject to Earthquakes (1999)
Monograph Series No. 4 Seismic Design of Buried and Offshore Pipelines (2012)
WEF MOP FD-5 Gravity Sanitary Sewer Design and Construction
MOP FD-6 Existing Sewer Evaluation and Rehabilitation
Treatment ACI 350-06 Code Requirements for Environmental Engineering Concrete Structures and Commentary
350.3-06 Seismic Design of Liquid-Containing Concrete Structures and Commentary
350.4R-04 Design Considerations for Environmental Engineering Concrete Structures
372R-03 Design and Construction of Circular Wire- and Strand-Wrapped Prestressed Concrete Structures
ALA Seismic Design and Retrofit of Piping Systems (2002)
WEF MOP 8 Design of Municipal Wastewater Treatment Plants
MOP 28 Upgrading and Retrofitting Water and Wastewater Treatment Plants
Pumping ALA Seismic Design and Retrofit of Piping Systems (2002)
One shortcoming is that codes and standards do not take into account differences in expected lifespan of infrastructure when defining the design hazard level. Pipelines and other components of water and wastewater systems often have a service lifespan of 100 years, compared with the typical service lifespan of 50 years for buildings. Therefore, the implied level of reliability of a pipeline designed for a particular hazard level (i.e., 500-year return period earthquake) is less than that of a building designed for the same
3 ACI is American Concrete Institute. ASCE is American Society of Civil Engineers. AWWA is American Water Works Association. ICC is International Code Council. MCEER is Multidisciplinary Center for Earthquake Engineering Research. TCLEE is Technical Council on Lifeline Earthquake Engineering. WEF is Water Environment Federation.

DISASTER RESILIENCE FRAMEWORK 50% Draft for Norman, OK Workshop
20 October 2014 Water and Wastewater Sector, Standards and Codes
Chapter 9, Page 24 of 33
hazard level due to longer expected service life of the pipeline (i.e., a pipeline in the ground for 100 years is more likely to experience the design earthquake than one in the ground for 50 years).
9.5.1. New Construction
9.5.1.1. Implied or Stated Performance Levels for Expected Hazard Levels
Design of new aboveground structures (i.e., treatment plant office and lab buildings, pump stations, process tanks, water storage tanks and reservoirs, etc.) is typically governed by local building codes, or design standards that prescribe a similar wind and seismic hazard as the local building code. Design loads are prescribed by a consensus-based standard, Minimum Design Loads for Buildings and Other Structures (ASCE, 2010). This standard uses the concept of Risk Category to increase the design force level for important structures. Typical buildings are assigned to Risk Category II. Water and wastewater treatment facilities are assigned to Risk Category III, because failure of these facilities can cause disruption to civilian life and potentially cause public health risks. Water storage facilities and pump stations required to maintain water pressure for fire suppression are assigned to the highest category, Risk Category IV.
The building code intends that structures designed as Risk Category III or IV should remain operational or require only minor repairs to be put back into operation following a design level (expected) wind or seismic event. By designing for this performance target for the expected level event it is assumed that water and wastewater systems would remain operational under a routine level event and may experience moderate to major damage during an extreme level event.
For the design of new underground pipelines there is a lack of a standard unifying code for water and wastewater systems. This is especially true for seismic design of buried water and wastewater pipelines or buried pipelines that may be impacted by landslides induced by flooding. Often the Chief Engineer of a particular utility is responsible for establishing design practices for their agency. While these agency-specific design practices are generally based on industry recommendations, variability in standards used by utilities results in variability between utilities in the intended system reliability for natural and man-made hazards.
Some utilities develop their own standards to specifically address significant local hazards. For example, the San Francisco Public Utilities Commission (SFPUC) developed its own internal standard that outlines level of service performance goals following a major Bay Area earthquake and specific requirements for design and retrofit of aboveground and underground infrastructure. The SFPUC Engineering Standard General Seismic Requirements for Design of New Facilities and Upgrade of Existing Facilities (SFPUC, 2006) establishes design criteria that in many cases are more stringent than building codes and/ or industry standards, but are intended to ensure the SFPUC is able to achieve its basic level of service performance goal of delivering winter day demand to their wholesale customers within 24 hours after a major earthquake.
9.5.1.2. Recovery Levels
The performance level implied by codes and standards for new construction provides an indication of the recovery level (timeframe) expected for individual system components. The timeframe required for a water or wastewater system to return to normal operating status following a major disaster is highly dependent on the recovery time for individual system components and the system’s specific characteristics (e.g., type and number of components, age of construction, system redundancy, etc.). For instance, if a pump is damaged by an earthquake and will take six months to repair, but a redundant pump is undamaged, the system recovery time is not impacted by the six month repair time. Estimating system recovery times for a specific hazard requires in-depth engineering and operational knowledge of the system.
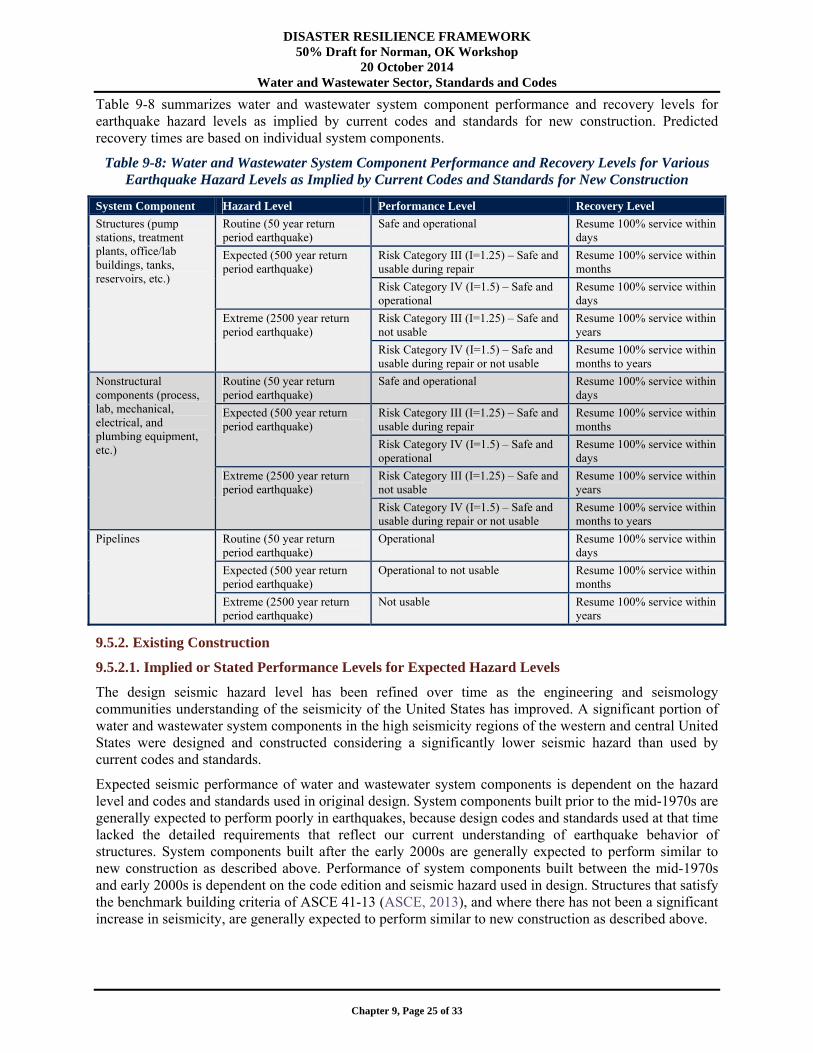
DISASTER RESILIENCE FRAMEWORK 50% Draft for Norman, OK Workshop
20 October 2014 Water and Wastewater Sector, Standards and Codes
Chapter 9, Page 25 of 33
Table 9-8 summarizes water and wastewater system component performance and recovery levels for earthquake hazard levels as implied by current codes and standards for new construction. Predicted recovery times are based on individual system components.
Table 9-8: Water and Wastewater System Component Performance and Recovery Levels for Various Earthquake Hazard Levels as Implied by Current Codes and Standards for New Construction
System Component Hazard Level Performance Level Recovery Level
Structures (pump stations, treatment plants, office/lab buildings, tanks, reservoirs, etc.)
Routine (50 year return period earthquake)
Safe and operational Resume 100% service within days
Expected (500 year return period earthquake)
Risk Category III (I=1.25) – Safe and usable during repair
Resume 100% service within months
Risk Category IV (I=1.5) – Safe and operational
Resume 100% service within days
Extreme (2500 year return period earthquake)
Risk Category III (I=1.25) – Safe and not usable
Resume 100% service within years
Risk Category IV (I=1.5) – Safe and usable during repair or not usable
Resume 100% service within months to years
Nonstructural components (process, lab, mechanical, electrical, and plumbing equipment, etc.)
Routine (50 year return period earthquake)
Safe and operational Resume 100% service within days
Expected (500 year return period earthquake)
Risk Category III (I=1.25) – Safe and usable during repair
Resume 100% service within months
Risk Category IV (I=1.5) – Safe and operational
Resume 100% service within days
Extreme (2500 year return period earthquake)
Risk Category III (I=1.25) – Safe and not usable
Resume 100% service within years
Risk Category IV (I=1.5) – Safe and usable during repair or not usable
Resume 100% service within months to years
Pipelines Routine (50 year return period earthquake)
Operational Resume 100% service within days
Expected (500 year return period earthquake)
Operational to not usable Resume 100% service within months
Extreme (2500 year return period earthquake)
Not usable Resume 100% service within years
9.5.2. Existing Construction
9.5.2.1. Implied or Stated Performance Levels for Expected Hazard Levels
The design seismic hazard level has been refined over time as the engineering and seismology communities understanding of the seismicity of the United States has improved. A significant portion of water and wastewater system components in the high seismicity regions of the western and central United States were designed and constructed considering a significantly lower seismic hazard than used by current codes and standards.
Expected seismic performance of water and wastewater system components is dependent on the hazard level and codes and standards used in original design. System components built prior to the mid-1970s are generally expected to perform poorly in earthquakes, because design codes and standards used at that time lacked the detailed requirements that reflect our current understanding of earthquake behavior of structures. System components built after the early 2000s are generally expected to perform similar to new construction as described above. Performance of system components built between the mid-1970s and early 2000s is dependent on the code edition and seismic hazard used in design. Structures that satisfy the benchmark building criteria of ASCE 41-13 (ASCE, 2013), and where there has not been a significant increase in seismicity, are generally expected to perform similar to new construction as described above.

DISASTER RESILIENCE FRAMEWORK 50% Draft for Norman, OK Workshop
20 October 2014 Water and Wastewater Sector, Resilience Assessment Methodology
Chapter 9, Page 26 of 33
Expected performance of nonstructural components should be evaluated on a case-by-case basis, as engineers have only recently started to pay close attention to seismic design and construction of nonstructural components. Expected performance of pipelines should be evaluated on a system-by-system basis because performance of pipelines is dependent on pipe type, joint type, and earthquake ground movement parameters.
9.5.2.2. Recovery Levels
In general, the recovery timeframe for system components will decrease for newer construction or retrofit. The Oregon Resilience Plan (OSSPAC, 2013) estimated the restoration time for pre-1975 structures to be 18 months to three years, 1975–1993 structures to be three to six months, and 1994 to present structures to be one to three months.
9.6. Resilience Assessment Methodology
9.6.1. Assessment Methodology
Section 9.2 describes the basic components of water and wastewater systems and observations of where these systems failed in past disasters. System performance is also highly dependent on the current condition of the system and standards used in its design. This information about past disaster performance of similar systems, combined with knowledge of current condition and original design standards of the system, helps a utility estimate the expected level of service they would be able to provide after a major disaster. There is likely to be a gap in the level of service a system would provide if a major disaster occurred today versus community-established performance goals. It is likely the capital expenditure required to close this performance gap far exceeds the short-term capital improvement project budgets of the utility. However, the resilience of any system can be improved incrementally over time by appropriately considering design criteria to reduce the impact of natural and man-made hazards in design of new and upgrade of existing infrastructure.
To estimate the level of service a water or wastewater system would provide after a given scenario disaster, an assessment of expected damage to the system and restoration times is required. For instance, the Oregon Resilience Plan indicates the current estimated time to restore water and wastewater services after an expected level earthquake in the Willamette Valley (including Portland, Salem, and Eugene) is from one month to one year, and along the Oregon Coast the estimated time is from one to three years. Comparing these restoration estimates with a community’s post-disaster level of service goals provides an indication of the resilience gap (OSSPAC, 2013).
The level of detail of this assessment can take one of three basic forms:
Tier 1 – A high level assessment of performance by persons knowledgeable about the system and anticipated hazard (chief engineer, operations manager, etc.)
Tier 2 – A more refined assessment based on typical system inventory (i.e., pipe type, length and soil type) using generalized component fragilities
Tier 3 – A detailed assessment of all components in a system, specific component fragilities, and the intra-dependencies of system components.
To appropriately characterize the current disaster resilience of water and wastewater systems, each service provider should undergo a Tier 1 assessment. If potential resilience vulnerabilities are identified they should undergo a more refined Tier 2 or 3 assessment. Several methodologies and tools are available to conduct these resilience assessments, a few of which are described below.
HAZUS-MH is a multi-hazard (flood, earthquake, and hurricane) loss estimation tool developed by the Federal Emergency Management Agency (FEMA) for use in pre-disaster mitigation, emergency preparedness, and response and recovery planning (FEMA, 2012). Communities can use this tool to characterize their hazard exposure, estimate losses to the water and wastewater systems, and estimate repair costs and duration.

DISASTER RESILIENCE FRAMEWORK 50% Draft for Norman, OK Workshop
20 October 2014 Water and Wastewater Sector, Resilience Assessment Methodology
Chapter 9, Page 27 of 33
AWWA J100-10 Risk Analysis and Management for Critical Asset Protection (RAMCAP) Standard for Risk and Resilience Management of Water and Wastewater Systems (AWWA, 2010) provides another methodology for conducting multi-hazard system resilience assessments. The RAMCAP Plus process was originally developed by the American Society of Mechanical Engineers – Innovative Technologies Institute (ASME-ITI) and is intended to be a consistent and comparable methodology for evaluating risk/resilience across various critical infrastructure sectors. It consists of a seven-step process for analyzing and managing risks associated with malevolent attacks and naturally occurring hazards (earthquake, hurricane, tornado, and flood).
1. Asset Characterization 2. Threat Characterization 3. Consequence Analysis 4. Vulnerability Analysis 5. Threat Analysis 6. Risk/Resilience Analysis 7. Risk/Resilience Management
AWWA J100-10 includes an optional Utility Resilience Index (URI). The URI includes two indices:
An operational resilience index is based on a series of indicators that reflect a utility’s organizational preparedness and capabilities to respond and restore critical functions/services following an incident.
A financial resilience index is based on a series of indicators that reflect a utility’s financial preparedness and capabilities to respond and restore critical functions/services following an incident.
URI can be used as a benchmark to evaluate potential resilience improvement projects and as a measure to track a utility’s progress over time towards achieving resilience performance goals.
The EPA developed the Water Health and Economic Analysis Tool (WHEAT) to assist water and wastewater utilities in quantifying an adverse event’s: 1) public health consequences, 2) utility-level financial consequences, and 3) direct and indirect regional economic consequences (EPA, 2014). This tool was developed to assist utilities in performing step 3 (consequence analysis) of the RAMCAP Plus process. WHEAT version 3.0 supports consequence analyses for three scenarios: 1) loss of one or more assets, 2) release of a stored hazardous gas, and 3) intentional contamination of a drinking water distribution system.
The EPA also developed the Vulnerability Self-Assessment Tool (VSAT) to assist water and wastewater utilities perform security threat and natural hazard risk assessments (EPA, 2010). The tool was developed to assist utilities in updating their Emergency Response Plans (ERPs). VSAT software uses an eight-step process to guide users through a risk assessment consistent with the 2007 RAMCAP framework.
1. Analysis setup and utility information 2. Asset identification 3. Countermeasure evaluation 4. Threat identification 5. Baseline assessment 6. Improvement assessment (propose new countermeasures) 7. Cost/Risk evaluations 8. Summaries and reports
An example Tier 1 plus (more detailed than Tier 1 but not as detailed as Tier 2) resilience assessment procedure for water systems, used in developing the Oregon Resilience Plan, is outlined below.
9.6.1.1. Tier 1 Plus Resilience Assessment:
1. Identify the appropriate earthquake hazard level

DISASTER RESILIENCE FRAMEWORK 50% Draft for Norman, OK Workshop
20 October 2014 Water and Wastewater Sector, Resilience Assessment Methodology
Chapter 9, Page 28 of 33
For buried pipelines:
2. Compile an inventory of system pipelines including pipe material, joint type, and length. 3. Superimpose the pipeline distribution system onto maps of the scenario hazard (peak ground
acceleration, liquefaction potential, and landslide potential). 4. Use empirical relationships developed by the American Lifelines Alliance (ALA) to predict the
number of breaks and leaks in the distribution system. 5. Estimate the time required to repair the predicted number of breaks and leaks based on historical crew
productivity data. Modify this repair time, as appropriate, based on discussions of the expected damage states of interdependent lifelines (transportation, liquid fuel, etc.).
For aboveground infrastructure:
6. Compile an inventory of system components (tanks, pump stations, treatment plants, etc.) including type of construction, date of original construction and any subsequent retrofits.
7. Estimate the level of damage predicted for the aboveground water system components based on observations from past earthquakes, the seismic hazard prescribed by the building code at the time of original construction or retrofit, and the professional judgment of engineers knowledgeable in the seismic performance of water systems.
8. Estimate the time required to repair the predicted damage to aboveground infrastructure. Modify this repair time, as appropriate, based on discussions of the expected damage states of interdependent lifelines (transportation, liquid fuel, etc.)
For the system:
9. Determine the expected repair time for the system based on the repair times for buried pipelines and aboveground infrastructure estimated in steps 5 and 8.
10. Compare this estimate of repair time for the system to the performance goals established by the community to determine the resilience gap.
These different resilience assessment approaches should be evaluated and refined into one consistent methodology prior to implementation of nationwide water and wastewater system resilience assessments.
Note that recovery time for utilities that purchase water from wholesale suppliers is highly dependent on the recovery time of the supplying utility. Wholesale water suppliers should work with their customers to assess the expected damage and restorations times from the source to the final individual customers. In this case, water and wastewater system resilience assessments may require a regional approach to appropriately characterize the expected performance of the system of systems in a major disaster.
9.6.2. Strategies for New Construction
Water and wastewater providers should consider resilience performance goals in all new construction projects. Projects should be designed to satisfy current code requirements or exceed code requirements where code minimum standards are not anticipated to provide a final product that would be expected to meet the utility’s resilience performance goals. The incremental cost of designing and constructing for improved disaster resilience is generally a relatively small percentage of total project costs.
9.6.3. Strategies for Existing Construction
Water and wastewater providers should consider resilience improvements to existing infrastructure as part of the capital improvement planning process. The process of conducting system resilience assessments will likely identify key pipelines and facilities that significantly impact the overall resilience of a system. These components should be evaluated in greater detail. Providers should evaluate a number of potential strategies, including retrofit or replacement of existing components, or building redundant components, in anticipation of failure of existing components. Retrofit of existing infrastructure or new redundant components should be designed such that the final product would be expected to meet the utility’s resilience performance goals.

DISASTER RESILIENCE FRAMEWORK 50% Draft for Norman, OK Workshop
20 October 2014 Water and Wastewater Sector, Tools Needed for Resilience
Chapter 9, Page 29 of 33
9.6.4. Addressing Resilience Performance Gaps
Once water and wastewater providers have worked with the community to establish resilience performance goals and completed baseline resilience assessments, there may be a number of goals not currently met due to the expected performance of system components, financial resources of the utility, interdependencies with other lifelines, etc. These performance gaps are likely to be addressed by a phased program (perhaps over as long as a 50-year time horizon) of new construction, retrofit of existing system components to better withstand disasters, modifications to emergency response plans, coordination with interdependent lifeline providers, and other strategies. It is expected that these resilience enhancements will be coupled with other system improvements to maximize the benefit of limited financial resources.
For instance, it can be difficult to justify replacing hundreds of miles of water pipelines based on earthquake resilience considerations alone, but coupled with replacement of aging and failing pipelines, the incremental cost of using more earthquake resistant pipe materials and joints is relatively minor. For major resilience improvements to take place on a shorter timeline a more extensive campaign of public outreach and education would be required.
9.7. Tools Needed for Resilience
9.7.1. Standards and Codes
Good design references are available for seismic design of water pipelines. However, there is no nationally adopted design standard that requires utilities to consider seismic design for their pipeline installations. The US water and wastewater industries need to develop and adopt design standards for new pipelines and retrofit standards for existing pipelines.
9.7.2. Practice and Research Needs
9.7.2.1. Current Research
The Los Angeles Department of Water and Power (LADWP) and the Portland Water Bureau (PWB) are conducting demonstration projects with Kubota earthquake-resistant ductile iron pipe (ERDIP). This type of pipe has been used successfully in Japan for 40 years and recent earthquakes have demonstrated its superb performance with no documented breaks or leaks. LADWP and PWB have installed this pipe in two locations to become familiar with design and installation of ERDIP, evaluate field installation procedures, and enable a first-hand evaluation on the use of ERDIP to improve the resilience of the LADWP and PWB water distribution systems.
Researchers are conducting large-scale experiments to fill gaps in the knowledge database on seismic performance of newer pipeline materials like restrained joint polyvinyl chloride.
Academic researchers (O’Rourke, 2014) are beginning to investigate the next generation of disaster resilient pipelines. Hybrid pipelines like FlexSteel®, a steel reinforced and polyethylene lined pipe, are being evaluated for resistance to earthquakes and other disasters.
9.7.2.2. Future Development Needs
Benefit cost analysis is a useful method to provide economic justification for resilience improvement projects. However, most current tools do not adequately consider indirect economic losses. It is recommended that a tool be developed that explicitly considers indirect economic losses. This will allow communities to make informed decisions regarding the economic benefit of various resilience improvement project options and provide utilities with another means to justify the benefits of capital improvement expenditures.
Seismic design of buried infrastructure is highly dependent on geotechnical engineering predictions of peak ground displacement. Refinements to these peak ground displacement prediction models based on data gathered in recent earthquakes would be helpful in prioritizing areas for retrofit of existing pipelines or installation of new pipelines that are more tolerant of ground movement.
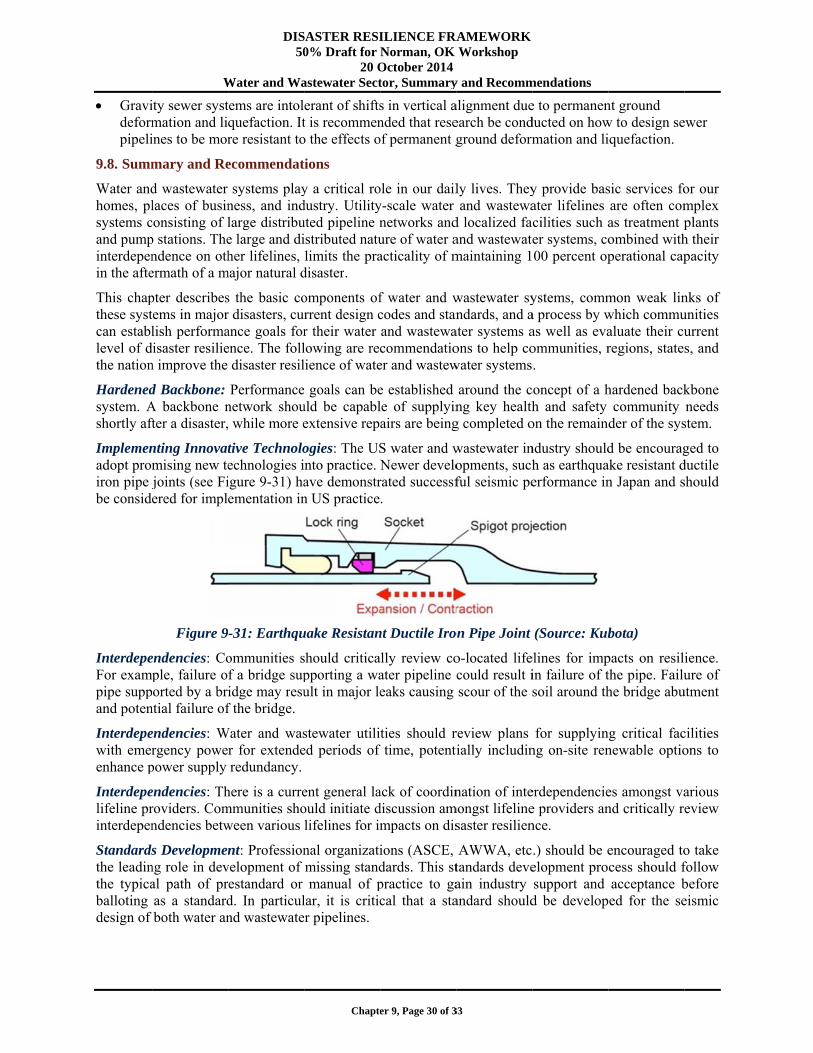
Gravideformpipeli
9.8. Summ
Water andhomes, plsystems cand pumpinterdepenin the afte
This chapthese systcan establlevel of dthe nation
Hardenedsystem. Ashortly aft
Implemenadopt promiron pipe jbe consid
InterdepeFor exampipe suppand poten
Interdepewith emerenhance p
Interdepelifeline printerdepen
Standardsthe leadinthe typicaballoting design of
W
ity sewer systmation and liines to be mor
mary and Re
d wastewater laces of busin
consisting of lp stations. Thendence on othermath of a m
pter describestems in majorlish performa
disaster resilien improve the
d Backbone: A backbone nfter a disaster,
nting Innovatmising new tejoints (see Fiered for impl
Figure 9
endencies: Comple, failure o
orted by a brintial failure of
endencies: Wrgency powe
power supply
endencies: Throviders. Comndencies betw
s Developmenng role in deval path of pras a standardboth water an
DIS50
Water and Wa
tems are intolquefaction. Itre resistant to
ecommendat
systems playness, and indlarge distribue large and diher lifelines,
major natural d
s the basic cor disasters, curance goals forence. The foll
disaster resil
Performancenetwork shou while more e
tive Technoloechnologies iigure 9-31) haementation in
-31: Earthqu
ommunities sf a bridge supidge may resuf the bridge.
Water and wasr for extenderedundancy.
here is a curremmunities shoween various
nt: Professionvelopment of estandard or d. In particulnd wastewate
SASTER RESI0% Draft for
20 Oastewater Sect
Chapte
erant of shiftst is recommeno the effects o
tions
y a critical rodustry. Utilityuted pipeline nistributed natulimits the pra
disaster.
omponents ofrrent design cr their water lowing are reclience of wate
goals can beuld be capablextensive rep
ogies: The USnto practice. Nave demonstrn US practice
uake Resistan
should criticapporting a wault in major le
stewater utilied periods of
ent general laould initiate dlifelines for im
nal organizatimissing standmanual of p
lar, it is criticr pipelines.
ILIENCE FRANorman, OK
October 2014tor, Summary
er 9, Page 30 of 3
s in vertical anded that reseof permanent g
ole in our daily-scale water networks andure of water aacticality of m
f water and wcodes and stanand wastewacommendatioer and wastew
e established le of supplyinairs are being
S water and wNewer develorated successf.
nt Ductile Iro
ally review coater pipeline ceaks causing
ties should rf time, potenti
ack of coordindiscussion ammpacts on dis
ions (ASCE, dards. This stpractice to gacal that a sta
RAMEWORKWorkshop
y and Recomm
33
alignment dueearch be condground deform
ly lives. Theyand wastewa
d localized faand wastewatemaintaining 1
wastewater syndards, and a
ater systems aons to help cowater systems
around the cng key healthg completed o
wastewater inopments, suchful seismic pe
on Pipe Joint
o-located lifecould result iscour of the s
review plans ially includin
nation of intemongst lifeline
saster resilien
AWWA, etctandards deveain industry andard should
mendations
e to permanenducted on howmation and li
y provide basater lifelines cilities such aer systems, co00 percent op
ystems, comma process by was well as evaommunities, r.
concept of a hh and safety
on the remain
ndustry shouldh as earthquaerformance in
(Source: Kub
elines for impin failure of tsoil around th
for supplyinng on-site ren
erdependenciee providers annce.
.) should be eelopment prosupport and d be develop
nt ground w to design seiquefaction.
sic services foare often comas treatment pombined withperational cap
mon weak linwhich commualuate their curegions, state
hardened backcommunity
der of the sys
d be encouragake resistant dn Japan and s
bota)
pacts on resilthe pipe. Failuhe bridge abu
ng critical facnewable optio
es amongst vand critically re
encouraged tocess should facceptance bed for the se
ewer
or our mplex plants h their pacity
nks of unities urrent s, and
kbone needs
stem.
ged to ductile should
ience. ure of
utment
cilities ons to
arious eview
o take follow before eismic

DISASTER RESILIENCE FRAMEWORK 50% Draft for Norman, OK Workshop
20 October 2014 Water and Wastewater Sector, Summary and Recommendations
Chapter 9, Page 31 of 33
Water Quality Impacts: Communities should consider potential adverse water source quality impacts of a disaster. Runoff following wildfire has the potential to increase surface water source turbidity and render the water source unusable for drinking water. Man-made hazards, flooding, and earthquake events have potential to generate fuel spills from storage tanks, releases of untreated wastewater, and other adverse impacts for source water quality.
Resiliency Assessment: Utilities should be required to complete a resiliency assessment as part of periodic master planning updates and develop plans to mitigate identified resiliency deficiencies. It is recommended that current resilience assessment methods be evaluated and refined into one consistent methodology prior to implementation of nationwide resilience assessments. A strategy must also be developed to minimize potential liability concerns a utility may have if a disaster was to strike after a potential deficiency had been identified but before a utility had adequate time to address the deficiency.
Capital Improvement Planning and Asset Management: Utilities should be encouraged to consider disaster resilience in establishing priorities for capital improvement projects and asset management. It may not be economical to complete a project from a disaster resilience perspective alone, but the incremental cost of considering disaster resilience in planned retrofit and replacement projects is minor compared to the added resilience benefit. Using this phased approach to resilience improvement projects will greatly improve the resilience of a community’s water and wastewater infrastructure over a period of years, while minimizing the financial burden of these improvements.
Facility Site Planning: Utilities should be encouraged to consider disaster resilience in site planning for new facilities and prior to significant capital improvement projects at existing facilities. New facilities should not be located in disaster prone locations, such as floodplain or tsunami inundation zones. Additionally, it may not be a wise economic investment to complete multi-hazard resilience upgrades to facilities in these disaster prone locations unless the locational hazard is also addressed.
Redundancy: The City of Sendai, Japan installed 21 buried water tanks after the 1995 Kobe earthquake. To prevent the tank from draining due to damage elsewhere in the system, these tanks include earthquake shutoff valves that close automatically when strong ground shaking is detected. The water saved in these tanks is then used as a source of potable water immediately after the earthquake. The majority of these tanks and earthquake valves performed well in the 2011 Tohoku earthquake and were able to serve as a water source for the local community after the earthquake. However, two tanks were in the tsunami inundation zone and therefore, not usable as a potable source after the earthquake and tsunami (Tang & Edwards, 2014). US utilities should consider various options, such as these added storage tanks, to improve system redundancy.
Redundancy: Redundant systems are inherently more resilient. In Japan, many water utilities are implementing loop transmission main systems to increase system redundancy. Water and wastewater utilities should evaluate this loop system approach, addition of isolation valves, and other methods to improve system redundancy. This is especially important for backbone system pipelines that serve critical locations (hospitals, large industrial customers, etc.) and need to be robust and redundant.
Consequence-based planning: When conducting precovery planning (pre-disaster and recovery) it is recommended that a consequence-based approach be adopted. By thoroughly considering the downstream physical, societal, and economic impacts of a given action from a disaster resilience perspective the optimum decision can be reached.
Scenario Development: When developing design and assessment standards for disaster resilience it is important to consider the appropriate hazard level. A system could be designed to remain operational after an extremely rare event, but the economic cost of system upgrades and required new infrastructure would be prohibitively costly. However, the system should be designed to have enough resilience to remain operational after a minor, semi-frequently occurring disaster (i.e., 50 year return period earthquake). Scenario development and consequence-based planning should be closely linked. The components of a

DISASTER RESILIENCE FRAMEWORK 50% Draft for Norman, OK Workshop
20 October 2014 Water and Wastewater Sector, References
Chapter 9, Page 32 of 33
system where the consequence of failure is much higher should be designed for a less frequently occurring (more extreme) disaster. It is recommended that water and wastewater backbone components be designed or retrofit to be operational after an extreme level event.
Rating System: The water and wastewater industry should be encouraged to develop a disaster resiliency rating system to track how utilities are performing with respect to improvements in system resilience.
Disaster Response Plan: Utilities should be encouraged to create or update their disaster response plans based on community-established response and recovery goals. Community-wide training events should be conducted to exercise these plans and work out issues prior to implementing them in an actual disaster.
The Water and Wastewater Agency Response Network (WARN) is an established intrastate contractual relationship for sharing resources necessary to respond to a disaster. The WARN system is currently limited to intrastate mutual aid. However, disasters such as a potential Cascadia Subduction Zone earthquake in the Pacific Northwest have potential to significantly impact multistate regions and overwhelm local resources. It is recommended that the WARN system be expanded to facilitate easier sharing of resources across state lines.
Regulatory Compliance: Communities should work with regulatory agencies before a disaster to establish acceptable practices and operational standards for use during the disaster response phase. Planning should address questions like, “Will it be acceptable to discharge raw sewage to receiving bodies of water?”
Temporary Sanitary Services: Communities should work with utilities and public health agencies to identify, before the event, who will be responsible for temporary sanitation services (e.g., portable toilets).
Temporary Water Supply: Communities should work with utilities to plan for water supply at key distribution points for firefighting and distribution of emergency drinking water. This may require installation of valves and hydrants prior to the event to improve access after the event.
Public and Business Community Education: The general public and business community need to be educated about the potential risks and expected downtime for water and wastewater systems resulting from a disaster. Utility customers need to understand the potential economic consequences of inaction before they will be willing to support potential rate increases to pay for resilience improvements to water and wastewater systems.
Emergency Kit: It should be recommended that community members and employers maintain emergency kits with water and personal sanitation supplies adequate for the expected duration of service interruption.
Business Continuity Plan: Utilities should develop business continuity plans that include on-call contracts or agreements with contractors, consultants, and essential suppliers (fuel, equipment, repair materials, process chemicals, etc.). Utilities should evaluate if current emergency response contingency funds are adequate for the level of damage predicted by an analysis of the system for the disaster scenarios adopted by the community and modify funding levels as appropriate.
9.9. References
ASCE (2013). Seismic Evaluation and Rehabilitation of Existing Buildings. Reston, VA: American Society of Civil Engineers.
AWWA (1994). Minimizing Earthquake Damage, A Guide for Water Utilities. Denver, CO: American Water Works Association.
AWWA (2013). J100-10 (R13) Risk and Resilience Management of Water and Wastewater Systems (RAMCAP)Earthquake Damage, A Guide for Water Utilities. Denver, CO: American Water Works Association.

DISASTER RESILIENCE FRAMEWORK 50% Draft for Norman, OK Workshop
20 October 2014 Water and Wastewater Sector, References
Chapter 9, Page 33 of 33
Ballantyne, D., & Crouse, C. (1997). Reliability and Restoration of Water Supply Systems for Fire Suppression and Drinking Following Earthquakes. Gaithersburg, MD: National Institute of Standards and Technology.
Eidinger, J. (2012). Performance of Water Systems during the Maule Mw 8.8 Earthquake 27 February 2010. Earthquake Spectra, Vol. 28, No. S1, S605-S620.
Eidinger, J., & Tang, A. (2014). Christchurch, New Zealand Earthqake Sequence of Mw 7.1 September 04, 2010 Mw 6.3 February 22, 2011 Mw 6.0 June 13, 2011: Lifeline Performance. Reston, VA: American Society of Civil Engineers.
Elliott, T., & Tang, A. (2009). Pacific Northwest Storms of December 1-4, 2007 Lifeline Performance. Reston, VA: American Society of Civil Engineers.
EPA (2010). VSAT – Risk Assessment Tool for Water Sector Utilities. Washington, D.C.: Environmental Protection Agency.
EPA (2014). Water Health and Economic Analysis Tool Version 3.0, Consequence Analysis Tool for Water Utilities. Washington, D.C.: Environmental Protection Agency.
FEMA (2012). Hazus-MH 2.1 User Manual. Washington, D.C.: Federal Emergency Management Agency.
FEMA (2013). Mitigation Assessment Team Report Hurricane Sandy in New Jersey and New York Building Performance Observations, Recommendations, and Technical Guidance . Washington, D.C.: Federal Emergency Management Agency.
Matsuhashi, M., Fukatani, W., Yokota, T., Ozaki, M., & Horie, N. (2012). The Damage of Sewage Treatment Systems Caused by the Great East Japan Earthquake. International Symposium on Engineering Lessons Learned from the 2011 Great East Japan Earthquake, Tokyo, Japan.
Miyajima, M. (2012). Damage to Water Supply System Induced by the 2011 Great East Japan Earthquake. International Symposium on Engineering Lessons Learned from the 2011 Great East Japan Earthquake, Tokyo, Japan.
NYCDEP (2013). New York City Wastewater Resiliency Plan: Climate Risk Assessment and Adaptation Study. October 2013. New York City Department of Environmental Protection.
NIST (1996). The January 17, 1995 Hyogoken-Nanbu (Kobe) Earthquake: Performance of Structures, Lifelines, and Fire Protection Systems. Gaithersburg, MD: National Institute of Standards and Technology.
O’Rourke, T. (2014). Resilient Lifeline Systems, ASCE TCLEE LeVal Lund Lecture, April 2, 2014, California Institute of Technology, Pasadena, CA.
OSSPAC (2013). The Oregon Resilience Plan, Reducing Risk and Improving Recovery for the Next Cascadia Earthquake and Tsunami. Salem, OR: Oregon Seismic Safety Policy Advisory Commission.
SFPUC (2006). General Seismic Requirements for Design of New Facilities and Upgrade of Existing Facilities. San Francisco, CA: San Francisco Public Utilities Commission.
Schiff, A. (1997). Northridge Earthquake: Lifeline Performance and Post-Earthquake Response. Gaithersburg, MD: National Institute of Standards and Technology.
Tang, A., & Edwards, C. (2014). Tohoku, Japan, Earthquake and Tsunami of March 11, 2011 Lifeline Performance. Reston, VA: American Society of Civil Engineers.