Disability Monograph - RODRA
86
The United Republic of Tanzania Disability Monograph and January, 2016 Office of Chief Government Statistician Ministry of State, President Office, State House and Good Governance National Bureau of Statistics Ministry of Finance Dar es Salaam
Transcript of Disability Monograph - RODRA
The United Republic of Tanzania
Disability Monograph
and
January, 2016
Office of Chief Government Statistician
Ministry of State, President Office, State
House and Good Governance
National Bureau of Statistics
Ministry of Finance
Dar es Salaam

i
UNITED REPUBLIC OF TANZANIA, ADMINISTRATIVE BOUNDARIES

ii
Foreword
The 2012 Population and Housing Census (PHC) for the United Republic of Tanzania was
carried out on the 26th August, 2012. This was the fifth Census after the Union of Tanganyika
and Zanzibar in 1964. Other Censuses were carried out in 1967, 1978, 1988 and 2002. The
2012 PHC, like previous others, will contribute to the improvement of quality of life of
Tanzanians through the provision of current and reliable data for policy formulation,
development planning and services delivery as well as for monitoring and evaluating national
and international development frameworks.
The 2012 PHC was unique as the collected information will be used in monitoring and
evaluating the Development Vision 2025 for Tanzania Mainland and Zanzibar Development
Vision 2020, Five Year Development Plan 2011/12–2015/16, National Strategy for Growth
and Reduction of Poverty (NSGRP) commonly known as MKUKUTA and Zanzibar Strategy
for Growth and Reduction of Poverty (ZSGRP) commonly known as MKUZA. The census
will also provide information for the evaluation of the Millennium Development Goals
(MDGs) in 2015. The Poverty Monitoring Master Plan, which is the monitoring tool for
NSGRP and ZSGRP, mapped out core indicators for poverty monitoring against the sequence
of surveys, with the 2012 PHC being one of them. Several of these core indicators for poverty
monitoring are measured directly from the 2012 PHC. The census provides a denominator for
the determination of other indicators such as childhood mortality, rates of maternal mortality
and others.
The success of the census depended upon the cooperation and contributions from the
government, development partners, various institutions and the public at large. A special
word of thanks should go to the government leaders at all levels, particularly the Minister for
Finance; Minister of State, President’s Office, Finance, Economy and Development Planning,
Zanzibar; Members of Parliament; Members of House of Representatives; Councillors;
Regional and District Census Committees chaired by Regional and District Commissioners;
Field Assistants; Enumerators; Supervisors; local leaders and heads of households.
Our special gratitude should go to the following; DfID, Government of Japan, JICA, UNDP,
UNFPA, UNICEF, USAID, World Bank and other development partners for providing
assistance in terms of equipment, long and short term consultancies, training and funding. We
would like to thank religious and political party leaders, as well as Non-Governmental
iii
Organisations (NGOs), mass media and the general public for their contribution towards
successful implementation of the census.
Last but not least, we would wish to acknowledge the vital contributions to the project by
Hajjat Amina Mrisho Said, the 2012 Commissioner for Population and Housing Census and
Mr. Mwalim Haji Ameir, the Census Commissar for Zanzibar. Special thanks should also go
to the Management and staff of the National Bureau of Statistics and Office of Chief
Government Statistician, Zanzibar. Their commitment and dedication made significant
contributions to the overall efficiency of the census operations. We would also like to convey
our appreciation to all other Government Officials who worked tirelessly to ensure successful
implementation of the 2012 Population and Housing Census.
Hon. Mizengo Peter Pinda (MP),
Prime Minister, United Republic of Tanzania
Hon. Ambassador Seif Ali Iddi (MP and MHR),
Second Vice President, Zanzibar

iv
Executive Summary
This Disability Monograph provides in-depth analysis of the level, trend and pattern of
disability in Tanzania. Specifically, it analyses and provides information on albinism and
difficulties in the domains of seeing, hearing, walking, remembering, self-care and other
difficulties using indicators based on data from the 2012 Population and Housing Census
(PHC). Where data allows, comparisons are made with estimates from previous censuses,
other sources as well as with other countries. The information is presented at national level
then disaggregated by the area of Tanzania Mainland and Tanzania Zanzibar, rural and urban.
It is also disaggregated by the 30 administrative regions in the country (25 in Tanzania
Mainland and 5 in Tanzania Zanzibar). Important findings from the report are summarized
below:
Chapter one describes the background, overview of census questions and changes since 2002,
concepts and definitions and the quality of data.
Chapter two gives information on prevalence of persons with disability and marital status in
Tanzania. At the national level 9.3 percent of the population aged 7 years and above had
some form of activity limitation. Prevalence was higher on the Tanzania Mainland (9.3
percent) compared to Tanzania Zanzibar (7.3 percent) and was also higher in rural areas 9.9
percent than in urban areas 7.8 percent. It also appeared that the Prevalence across regions
ranged from 4.3 percent in Manyara to 15 percent in Mara region.Also presents that more
than fifty percent (56.3 percent) of persons with disability in Tanzania were married or living
together, 29.1 percent had never been married and 10.3 percent were widowed. Majority
(44.1 percent) of the older persons with disability (65 years or above) were married. This was
followed by those widowed (39.1 percent) and the never married (6.9 percent).
Chapter three gives information on the education of person with disability. Out of 3,450,986
persons with disability aged 5 years and above, 2,228,280 (64.6 percent) were literate. The
literacy rate of persons with disability in urban areas (81.3 percent) was higher compared
with that of rural areas (58.7 percent). The literacy level among females without disability in
Tanzania was higher (72.5 percent) compared with that of females with disability (60.9
percent). On the other hand literacy rate for males without disability was higher (83.2
percent) than that of males with disability (76.4 percent). There was a slight difference in
literacy rate between Tanzania and Tanzania Mainland.

v
Results show that it was 51.5 percent of children with disability who were attending school
compared with 52.7 percent of children without disability. Furthermore results indicate that
children with disability who were attending school in Tanzania Mainland were 51.3 percent
compared with 52.4 percent of children without disability. In Tanzania Zanzibar 60.0 percent
of children with disability were attending school compared to 62.7 of children without
disability.
Chapter four indicates that 70.2 percent of persons with disability in Tanzania were currently
employed. The proportion of employed females (35.7 percent) was almost equal to that of
males (34.5 percent). The situation was different in Tanzania Zanzibar where by only 49.9
percent of persons with disability were currently employed with 28.7 percent of males and
21.3 percent of females.
Results show that 67.1 percent of persons with disability in Tanzania were employed in the
Agriculture, Commercial and Food Crops activities. Females (70.3 percent) were more
involved in the above mentioned economic activity than males (63.8 percent).
Chapter five indicates that proportion of households headed by males with disability was 68.3
percent of all household headed by persons with disability. Females with disability headed
the remaining 31.7 percent of the households. Also the proportion of household using
electricity (Tanesco/Zeco) is lower among households headed by persons with disabilities
than those headed by persons without disability (14.7 percent 20.1presents respectively).

vi
Summary of Key Indicators
Indicator
Number Percentage
Prevalence Rate for Persons of Age 7 Years or Above Tanzania
Both Sexes 3,157,516 9.3 Male 1,487,595 9.1 Female 1,669,921 9.4
Tanzania Mainland Both Sexes 3,084,091 9.3 Male 1,453,367 9.1 Female 1,630,724 9.5
Tanzania Zanzibar Both Sexes 73,425 7.3 Male 34,228 7.1 Female 39,197 7.4
Disability by Severity
Some Difficulty 1,663,024
74.1
A lot of Difficulty 408,963
18.2
Unable 172,616
7.7
Marital Status ( Person with Disability)
Married 1,205,906
50.3 Never Married 697,102
29.1
Living Together 143,877
6.0 Separated 27,375
1.1
Divorced 75,294
3.1 Widowed 247,360
10.3
Current Economic Activity (Person with Disability)
Employed 1,621,206
66.8
Unemployed 83,939
3.5
Inactive 720,048
29.7
Household Amenities(Main Source of Energy for Lighting)
Kerosene 632,864
63.3
Electricity 163,478
16.4
Torch/Rechargeable Lamp 135,363 13.5
Others 67,340
6.7
Membership to Social Security Schemes (Person with Disability)
National Health Insurance or Community Health (NHIF or CHF)
1,188,258
5.6
Public Service Pension Fund (PSPF) 360,403
1.6
Zanzibar Social Security Fund (ZSSF) 86,643
0.3
Parastatal Pensions Fund ( PPF) 145,474
0.7
National Social Security Fund (NSSF) 398,181
1.8
Local Authorities Pension Fund (LAPF) 81,256
0.4

vii
Contents
Page
Foreword .......................................................................................................................................... ii
Executive Summary ......................................................................................................................... iv
Contents ........................................................................................................................................ vii
List of Tables ................................................................................................................................... ix
List of Figures .................................................................................................................................. xi
List of Maps ..................................................................................................................................... xi
List of Abbreviations ...................................................................................................................... xii
Chapter One .................................................................................................................................... 1
Introduction ..................................................................................................................................... 1
1.1 Overview .......................................................................................................................... 1
1.2 Census Background .......................................................................................................... 1
1.3 Disability Questions for 2002 and 2012 Censuses ........................................................... 2
1.4 Concepts and Definitions ................................................................................................. 3
1.4.1 Concepts ........................................................................................................................... 3
1.4.2 Definitions ........................................................................................................................ 4
1.5 Data Quality ..................................................................................................................... 4
1.6 Organization of the Monograph ....................................................................................... 5
1.7 Conclusion ........................................................................................................................ 6
Chapter Two .................................................................................................................................... 7
Prevalence and Distribution of Persons with Disability .............................................................. 7
2.1 Overview .......................................................................................................................... 7
2.2 Prevalence of Disability ................................................................................................... 7
2.3 Distribution of Persons with Disability by Geographical Area ........................................ 8
2.4 Prevalence Rate of Persons with Disability by Age and Sex ......................................... 10
2.5 Types of Disability ......................................................................................................... 12
2.6 Severity of Disability ...................................................................................................... 13
2.7 Marital Status of Persons with Disability in Tanzania ................................................... 15
2.8 Comparison of Marital Status between Persons with and without Disability ................ 15

viii
Chapter Three ............................................................................................................................... 17
Literacy and Education ............................................................................................................... 17
3.1 Overview ........................................................................................................................ 17
3.2 Literacy Status of Persons with Disability in Tanzania ................................................. 17
3.4 Education of Persons with Disability ............................................................................. 20
3.5 School Attendance for Persons with Disability .............................................................. 21
3.6 Education Attainment ..................................................................................................... 24
Chapter Four ................................................................................................................................. 26
Economic Activities ....................................................................................................................... 26
4.1 Overview ........................................................................................................................ 26
4.2 Economic Activity Status of Persons with Disability ................................................... 26
4.3 Employed Persons with Disability – Main Economic Activity ..................................... 29
4.4 Main Occupation in Employment for Persons with Disability. ..................................... 32
Chapter Five .................................................................................................................................. 33
Housing and Household Characteristics ..................................................................................... 33
5.1 Overview ........................................................................................................................ 33
5.2 Household Headship ....................................................................................................... 33
5.3 Housing Conditions ........................................................................................................ 34
5.3.1 Sources of Energy for Lighting ...................................................................................... 34
5.3.2 Toilet Facilities ............................................................................................................... 36
5.3.3 Distribution of Households by Tenure and Disability status ......................................... 39
5.4 Social Security Scheme Membership ............................................................................. 41
Chapter Six .................................................................................................................................... 43
Summary, Recommendations And Conclusion .......................................................................... 43
6. 1 Summary ........................................................................................................................ 43
6.2 Recommendations .......................................................................................................... 43
6.3 Conclusion: ..................................................................................................................... 45
References ....................................................................................................................................... 46
Appendix 1:Different Table Generated from the Report ................................................................ 47
Appendix 2:Census Questionnaires ................................................................................................ 56
ix
List of Tables
Table 2. 1: Prevalence Rates (%) of Disability for Selected Countries ................................. 7
Table 2. 2: Prevalence Rate (%) of Persons of Age 7 Years or Above with
Disability by Age and Sex; Tanzania; 2012 Census .......................................... 10
Table 2. 3: Prevalence Rate (%) of Persons of Age 7 Years or Above with
Disability by Age and Sex; Tanzania Mainland 2012Census. ........................... 11
Table 2. 4: Prevalence Rate (%) of Persons of Age 7 Years or Above with
Disability by Age and Sex; Tanzania Zanzibar, 2012 Census ........................... 11
Table 2. 5: Percentage of Persons with Disability by Region and Type of
Disability; Tanzania; 2012 Census .................................................................... 12
Table 2. 6: Number and Disabilities for Persons of Age 7 Years or Above by Type,
Severity and Area; Tanzania, 2012 Census. ...................................................... 14
Table 2. 7: Percentage Distribution of Persons with Disability of Age 15 Years or
Above by Age Group and Marital Status; Tanzania, 2012 Census ....................15
Table 3. 1: Number of All and Literate Persons of Age Five Years or Above with
Disability and Their Literacy Rate by Five year Age Groups and Sex;
Tanzania, 2012 Census ...................................................................................... 18
Table 3. 2: Number of All and Literate Persons of Age Five Years or Above with
Disability and Their Literacy Rate by Five year Age Groups and Sex;
Tanzania Rural, 2012 Census ............................................................................ 18
Table 3. 3: Number of All and Literate Persons of Age Five Years or Above with
Disability and Their Literacy Rate by Five year Age Groups and Sex;
Tanzania Urban, 2012 Census ........................................................................... 19
Table 3. 4: Comparison of Literacy Rates Between Persons with and without
Disability of Age 5 Years or Above and Different Sexes in Rural and
Urban Areas by Type of Literacy; Tanzania, 2012 Census ............................... 20
Table 3. 5: Percentage Distribution of Persons with and without Disability of Aged
5 – 24 Years by Area, School Attendance Status, Rural/Urban and Sex;
Tanzania, 2012 Census ...................................................................................... 22
Table 3. 6: Percentage Distribution of Persons with Disability of Aged 5 Years or
Above by Education Attainment, Area and Sex; Tanzania, 2012
Census. ............................................................................................................... 25
Table 4. 1: Number and Percentage of Persons with Disability of Age 15 Years or
Above by Current Activity Status; Tanzania, 2012 Census ............................. 27
Table 4. 2: Number and Percentage of Persons with Disability of Age 15 Years or
Above in Rural and Urban areas by Current Activity Status; Tanzania,
2012 Census. ...................................................................................................... 27
x
Table 4. 3: Percentage Distribution of Employed Persons with Disability of Age
15 Years or Above, Males and Females by Industry ; Tanzania, 2012
Census ................................................................................................................ 30
Table 4. 4: Percentage Distribution of Employed Persons with Disability in Each
Industry by Ten Years Age Group ;Tanzania, 2012, Census ............................ 31
Table 4. 5: Percentage Distribution of Employed Persons with Disability by
Occupation, Sex and Age Group; Tanzania, 2012 Census ................................ 32
Table 5. 1: Percentage Distribution of Households Headed by Persons with
Disability by Type of Toilet Facility and Area; Tanzania, 2012 Census ........... 37
Table 5. 2: Percentage Distribution of Households Headed by Persons without
Disability by Type of Toilet Facility and Area; Tanzania, 2012 Census ........... 38
Table 5. 3: Percentage Distribution of Households by Area, Tenure and Disability
Status; Tanzania, 2012 Census .......................................................................... 39
Table 5. 4: Percentage Distribution of Households by Area, Tenure and Disability
Status; Tanzania, 2012 Census .......................................................................... 40
Table 5. 5: Percentage Distribution of Household Headed by Persons with
Disability by Social Security Scheme Membership........................................... 42
xi
List of Figures
Figure 1. 1: Interactions between the Parts of Components of ICF. ....................................... 3
Figure 2. 1: Disability Prevalence Rate for Persons of Age 7 Years or Above by
Residence, Rural and Urban Areas and Sex; Tanzania, 2012 Census ................. 8
Figure 3. 1: Primary School Net Enrolment Rates of Persons with and without
Disability by Sex; Tanzania, 2012 Census ....................................................... 23
Figure 3. 2: Primary Schools Gross Enrolment Rates of Persons with and without Disability
and Sex; Tanzania, 2012 Census ....................................................................... 24
Figure 4. 1: Proportion of Employed Persons of Age 15 Years or Above with
Disability by Sex; Tanzania, Tanzania Mainland and Tanzania
Zanzibar by Sex; Tanzania 2012 Census. .......................................................... 28
Figure 5. 1: Percentage Distribution of Household Headed by Persons with
Disability by Area and Sex of Head; Tanzania, 2012 Census .......................... 34
Figure 5. 2: Main Sources of Energy for Lighting by Disability Status of Head; Tanzania,
2012 Census ....................................................................................................... 35
List of Maps
Map 2. 1: Disability Prevalence Rate (%) for Persons of Age 7 Years or Above with
Disability by Region; Tanzania, 2012 Census ..................................................... 9

xii
List of Abbreviations
AU - African Union
DfID - Department for International Development
DRC - Democratic Republic of Congo
DTU - Demographic Training Unit
EAC - East African Community
ESCAP - Economic and Social Council Commision for Asia and Pasific
FYDP - Five Year Development Plan
GDP - Gross Domestic Product
IRR - Index of Relative Representative
JICA - Japanese International Co-operation Agency
LTPP - Long Term Perspective Plan
MDGs - Millennium Development Goals
MKUKUTA - Mkakati wa Kukuza Uchumi na Kupunguza Umasikini
NBS - National Bureau of Statistics
NSGRP - National Strategy for Growth and Reduction of Poverty
OCGS - Office of Chief Government Statistician
OECD - Organization for Economic Development
PHC - Population and Housing Census
PWDS - People with Disabilities
SADC - Southern Africa Development Community
TDV - Tanzania Development Vision
TDS - Tanzania Disability Survey
UN - United Nations
UNDP - United Nations Development Programme
UNICEF - United Nations Children’s Fund
UNFPA - United Nations Population Fund
URT - United Republic of Tanzania
US - United States
USA - United States of America
USAID - United States Agency for International Development
WHO - World Health Organization
ZSRGRP - Zanzibar Strategy for Growth and Reduction of Poverty

1
Chapter One
Introduction
1.1 Overview
This chapter describes the census background, disability questions used for 2002 and 2012
censuses, definitions of concepts, data quality and organization of monograph itself.
1.2 Census Background
Since early 1990 disability has been a subject in the international forums. In 1993 the United
Nations (UN) adopted the Standard Rules on the Equalization of Opportunities for Persons
with Disability and in 2006 UN adopted the Convention on the Rights of Persons with
Disability.
The need for disability statistics is not a new phenomenon. Studies have been conducted
worldwide and recommendations made for governments to design policies that address the
needs of persons with disability.
The UN “Global Context of Disability by March 11, 2010’’(UN, 2011) showed that, there
were at least 650 million people with disability in the world of whom 400 million live in
developing countries. The report further states that if all these people lived together they
would make up the third largest country in the world, a country about equal in size of
European Union. This country would be characterized by extreme poverty, illiteracy and
unemployment to name but a few.
This observation is also echoed by the World Report on Disability (WHO, 2011) which
reveals that more than 650 million people in the world in 2011 experienced disability. The
report further proposed practical solutions to overcome barriers to health care, rehabilitation,
education, employment and support services and create an enabling environment for persons
with disabilities to prosper. This global perspective paints a general picture of the status of
persons with disability and calls for national governments to respond to the needs and
challenges faced by persons with disability. Tanzania has ratified the Standard Rules on the
Equalization of Opportunities and the Convention on the Rights of Persons with Disabilities
and its Optional Protocol and proceeded to put in place the National Disability Policy (2004)
and the Persons with Disabilities Act (2010). Key recommendations of the policy include:
Strengthen the existing basic health services,
2
Develop a mechanism to ensure early intervention,
Provide a conducive environment for the practice of inclusive education,
Improve skills training and facilities for persons with disability,
Provide work tools and seed money to enable persons with disability establish income
generating projects,
Take measures to ensure that public buildings and facilities are accessible,
Provide institutional care to eligible persons with disability and create awareness for
families to care for relatives with disability.
The 2012 Census is the second in the history of Tanzania to include questions on disability,
the first was that of 2002.
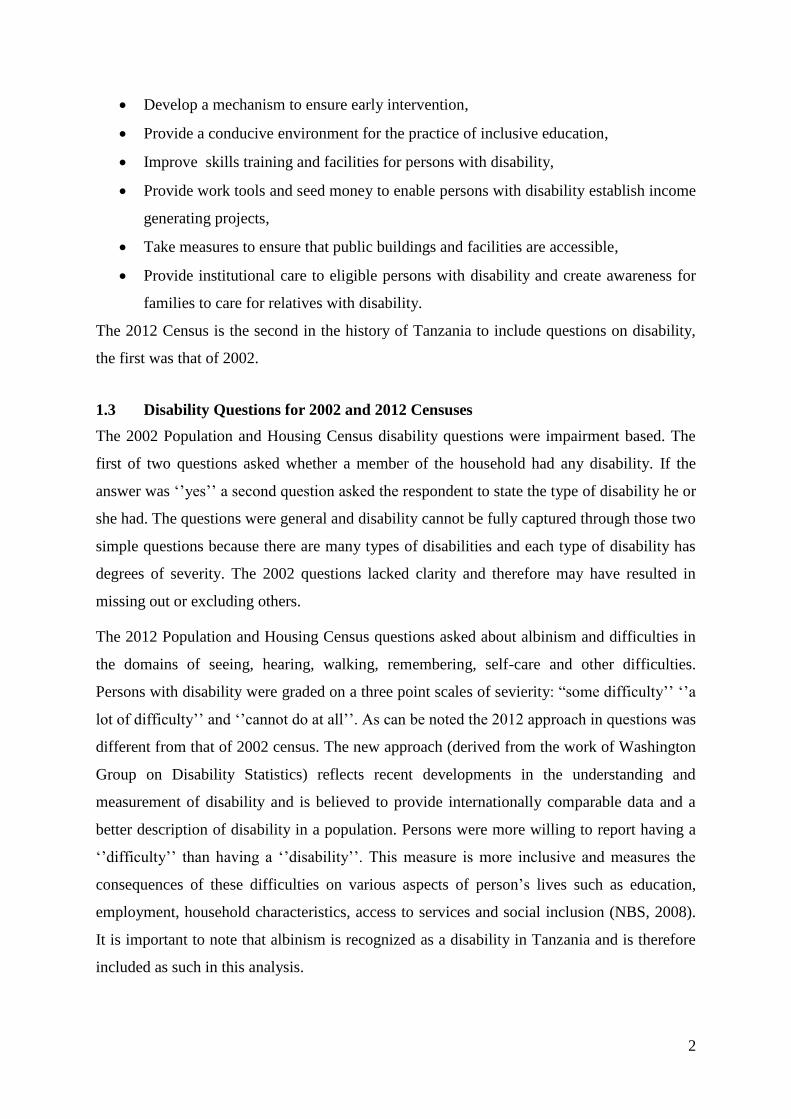
1.3 Disability Questions for 2002 and 2012 Censuses
The 2002 Population and Housing Census disability questions were impairment based. The
first of two questions asked whether a member of the household had any disability. If the
answer was ‘’yes’’ a second question asked the respondent to state the type of disability he or
she had. The questions were general and disability cannot be fully captured through those two
simple questions because there are many types of disabilities and each type of disability has
degrees of severity. The 2002 questions lacked clarity and therefore may have resulted in
missing out or excluding others.
The 2012 Population and Housing Census questions asked about albinism and difficulties in
the domains of seeing, hearing, walking, remembering, self-care and other difficulties.
Persons with disability were graded on a three point scales of sevierity: “some difficulty’’ ‘’a
lot of difficulty’’ and ‘’cannot do at all’’. As can be noted the 2012 approach in questions was
different from that of 2002 census. The new approach (derived from the work of Washington
Group on Disability Statistics) reflects recent developments in the understanding and
measurement of disability and is believed to provide internationally comparable data and a
better description of disability in a population. Persons were more willing to report having a
‘’difficulty’’ than having a ‘’disability’’. This measure is more inclusive and measures the
consequences of these difficulties on various aspects of person’s lives such as education,
employment, household characteristics, access to services and social inclusion (NBS, 2008).
It is important to note that albinism is recognized as a disability in Tanzania and is therefore
included as such in this analysis.
3
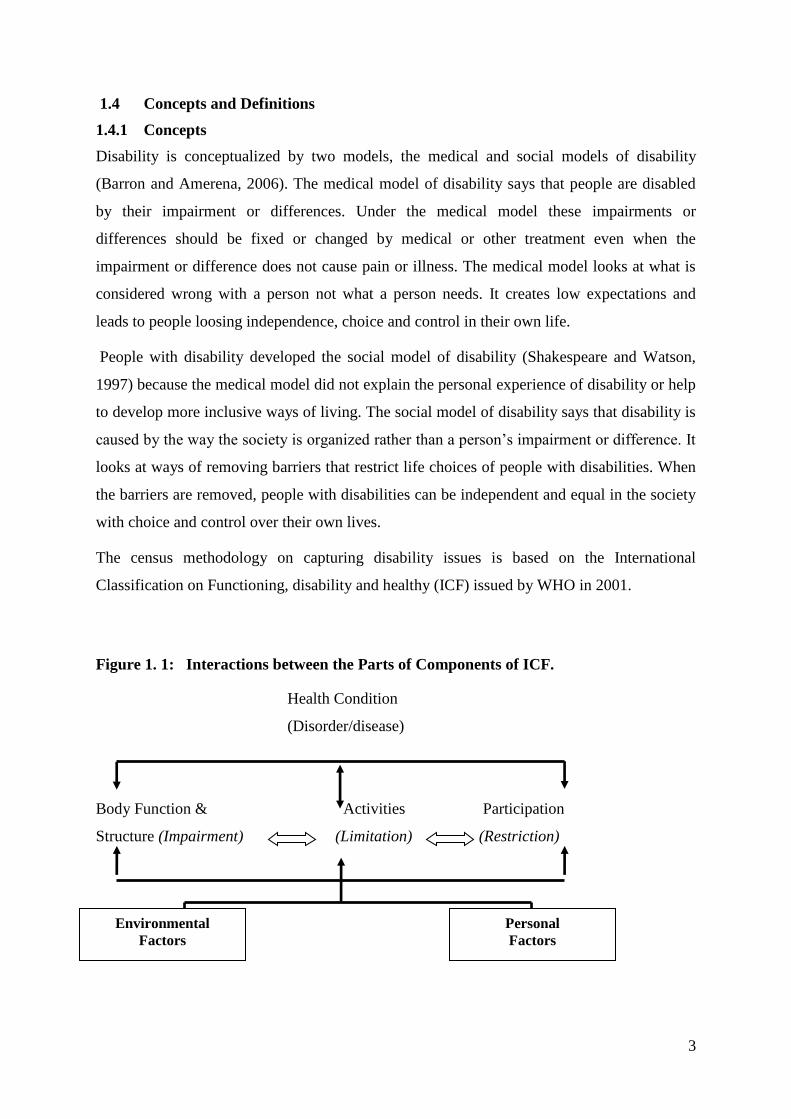
1.4 Concepts and Definitions
1.4.1 Concepts
Disability is conceptualized by two models, the medical and social models of disability
(Barron and Amerena, 2006). The medical model of disability says that people are disabled
by their impairment or differences. Under the medical model these impairments or
differences should be fixed or changed by medical or other treatment even when the
impairment or difference does not cause pain or illness. The medical model looks at what is
considered wrong with a person not what a person needs. It creates low expectations and
leads to people loosing independence, choice and control in their own life.
People with disability developed the social model of disability (Shakespeare and Watson,
1997) because the medical model did not explain the personal experience of disability or help
to develop more inclusive ways of living. The social model of disability says that disability is
caused by the way the society is organized rather than a person’s impairment or difference. It
looks at ways of removing barriers that restrict life choices of people with disabilities. When
the barriers are removed, people with disabilities can be independent and equal in the society
with choice and control over their own lives.
The census methodology on capturing disability issues is based on the International
Classification on Functioning, disability and healthy (ICF) issued by WHO in 2001.
Figure 1. 1: Interactions between the Parts of Components of ICF.
Health Condition
(Disorder/disease)
Body Function & Activities Participation
Structure (Impairment) (Limitation) (Restriction)
Environmental
Factors
Personal
Factors

4
1.4.2 Definitions
According to ICF persons with disability are defined as those persons who are at a greater
risk than the general population of experiencing limitations in performing specific tasks or
participation in activities. Such persons may not experience limitations in specifically
measured tasks, such as bathing or dressing or participation activities, such as working
because the necessary adaptations have been made at the person or environmental levels. Yet
these persons would still be considered to be at a greater risk of limitations in activities and or
participation than the general population because of the presence of limitations in basic
activity functioning.
The WHO (PAHO and WHO, 2006), defines disability as a generic term that includes
impairments in body functions and structures, activity limitations and participation
restrictions. It includes the negative aspects of the inter-action between an individual (with a
health condition) and his context (environmental and personal factors).
According to the UN Convention on the Rights of Persons with Disabilities (2006) persons
with disabilities include those who have long term physical, mental, intellectual or sensory
impairments which in interaction with various barriers may hinder their full and effective
participation in society on an equal basis with others.
The National Policy on Disability (2004) defines a person with disability as an individual
whose prospects of obtaining and retaining employment are greatly reduced due to known
physical, mental or social factors. This analytical report adopts all the definitions.
1.5 Data Quality
According to the 2012 PHC Tanzania had 34,075,839 people of age 7 years and above in
private household of whom, 3,157,516 were persons with disability (pwd) (9.3 percent). This
prevalence is higher than that of 2008 disability survey which recorded a prevalence of 7.8
percent and yet higher than that of 2002 Census which was 2.0 percent. The significant
changes in disability levels from 2002, 2008 and 2012 are likely not to have been caused by
changes in the society but due to limitations which affect the quality of data collected. These
limitations include differences in the definition of disability, different methods of data
collection, poor infrastructure and attitudes of respondents and knowledge of enumerators.
The 2002 PHC questions for example were impairment based while those of 2012 followed
activity limitations and functioning approach. Due to differences in the understanding of

5
disability and attitudes of respondents some impairments and activity limitations may or may
not constitute a problem worth recording. Poor infrastructure is yet another area that may
affect data quality as some remote areas could not be reached. Training of enumerators is
important to enable them perform their work effectively. However a few days training may
not be enough for enumerators without previous experience in disability issues to acquire the
required competence. It is important to note here that census questions did not ask about the
causes of disability. Equally data for children with disabilities aged 0-7 years is not available
because according to Washington Group on Disability Statistics of this age group cannot
fully explain the difficulties in the substantive domains.
The UN Economic and Social Council Commission for Asia and Pacific (ESCAP, 2009)
indicated that in many countries, disability data collection is at an early stage of development
and that available data revealed that wide disparities exist in the region. In Africa South of
Sahara, the prevalence of disability in selected countries shows the same disparity as
indicated in chapter two.
The UN believes that the variance is due to differences in definitions of disability, methods of
data collection as well as capacity of data collectors. There is no doubt that lack of reliable
information impacts negatively on the planning for the provision of services to people with
disabilities in the country as well as the creation of an enabling environment for the
equalization of opportunities.
Despite the limitations mentioned above, the findings generally underscore the disadvantaged
position persons with disabilities experience as far as access to basic services is concerned. It
is important that planning at all levels should address the needs and challenges faced by
people with disabilities.
1.6 Organization of the Monograph
This monograph consists of six chapters. Chapter one describes the background, overview of
census questions and changes since 2002, concepts and definitions and data quality. Chapter
two looks at disability prevalence by geography, types and severity. Chapter three examines
the demographic characteristics of persons with disability in literacy and education. Chapter
four describes the economic characteristics of persons with disability namely: usual economic
activities, factors limiting the participation of persons with disability in economic activities,
employment status, main economic activities and main occupation. Household

6
characteristics, household size, tenure, headship, assets and amenities are dealt with in
chapter five while chapter six deals with summary, conclusion and recommendations.
1.7 Conclusion
The need for disability statistics cannot be overemphasized. The inclusion of pwds in all
spheres of development requires the availability of correct information necessary for
planning. For this reason the 2012 PHC disability questions were based on the work of the
Washington Group on Disability Statistics which looks at difficulties (rather than
impairments) people experienced in the domains of seeing, hearing, walking, remembering,
self-care and other difficulties.
Both the medical and social model of disability have been examined. This monograph
however adopts the ICF concept and definition of disability as encompassing impairments in
body function and structures, activity limitation and participation restrictions and the negative
aspects of the inter-action between an individual and his/her social environment. The 2012
PHC revealed that Tanzania has a population of 34,075,839 people aged 7 years and above of
whom 3,157,516 were persons with disability representing 9.3 percent of the population aged
7 years or above. This prevalence is higher than that of 2008 TDHS which was 7.8 percent
and yet higher than 2 percent of 2002 PHC. The changes in disability levels are attributable to
limitations which affect data quality. These limitations include differences in the definition of
disability, different methods of data collection, poor infrastructure and knowledge of
enumerators.

7
Chapter Two
Prevalence and Distribution of Persons with Disability
2.1 Overview
This chapter provides a picture of prevalence of persons with disability in Tanzania, Tanzania
Mainland, and Tanzania Zanzibar by rural and urban areas and sex. The chapter also presents
distribution of persons with disability, marital status, estimates of disability by type and its
severity.
2.2 Prevalence of Disability
Prevalence of disability is the number of persons born with disability or become disabled per
1,000 of the population in the country until a date of census or survey.
According to the 2012 Census 3,157,516 persons (9.3 percent) of the total population in
private household in Tanzania aged 7 years or above had different types of disability. In other
words, for every 1,000 persons in Tanzania in the year 2012, 93 persons had disability. The
prevalence estimate of 9.3 percent was slightly lower than the global prevalence of 10.0
percent estimated by the United Nations. Table 2.1 indicates prevalence rates of disability for
selected developed and developing countries.
Table 2. 1: Prevalence Rates (%) of Disability for Selected Countries
Country Year Rates from Census Data Country Year Rates from Surveys Data
Tanzania 2002 2.0 Tanzania 2008 7.8
Kenya 2007 4.6 Zambia 2006 13.1
Sudan 2008 4.8 Australia 2000 20.0
Ghana 2010 3.0 Ecuador 2005 12.1
Botswana 1991 2.2 Nicaragua 2003 10.3
USA 2000 19.4 New Zealand 1996 20.0
Canada 2001 18.5 Spain 1986 15.0
Brazil 2000 14.5 China 1987 5.0
Uganda 2001 3.5 Netherlands 1986 11.6
Mexico 2000 2.5 Egypt 1996 4.4
India 2001 2.1 Germany 1992 8.4

8
Sources: United Nations Statistics Divisions, IBGB (Brazil), INEC (Nicaragua), INEC (Ecuador),INEGI
(Mexico), Statistics New Zealand, INE (Spain),Census of India 2001, SINTEF Health Research (Zambia) 2006
Generally developing countries tend to report lower percentages of persons with disability
compared with developed countries. Some common factors leading to higher percentages of
persons with disability in developed countries include a relatively high percentage of elderly
people and survival rates compared to developing countries.
2.3 Distribution of Persons with Disability by Geographical Area
Figure 2.1 presents prevalence rates of disability for Tanzania, Tanzania Mainland and
Tanzania Zanzibar by sex. At the national level 9.3 percent of the population aged 7 years
and above from private household had some form of activity limitation. The prevalence was
higher in Tanzania Mainland (9.3 percent) compared to Tanzania Zanzibar (7.3 percent), and
it was also higher in rural areas (9.9 percent) than in urban areas (7.8 percent). Results further
show that the proportion of persons with disability was relatively higher among females (9.4
percent) compared with males (9.1 percent).
Figure 2. 1: Disability Prevalence Rate for Persons of Age 7 Years or Above by
Residence, Rural and Urban Areas and Sex; Tanzania, 2012 Census
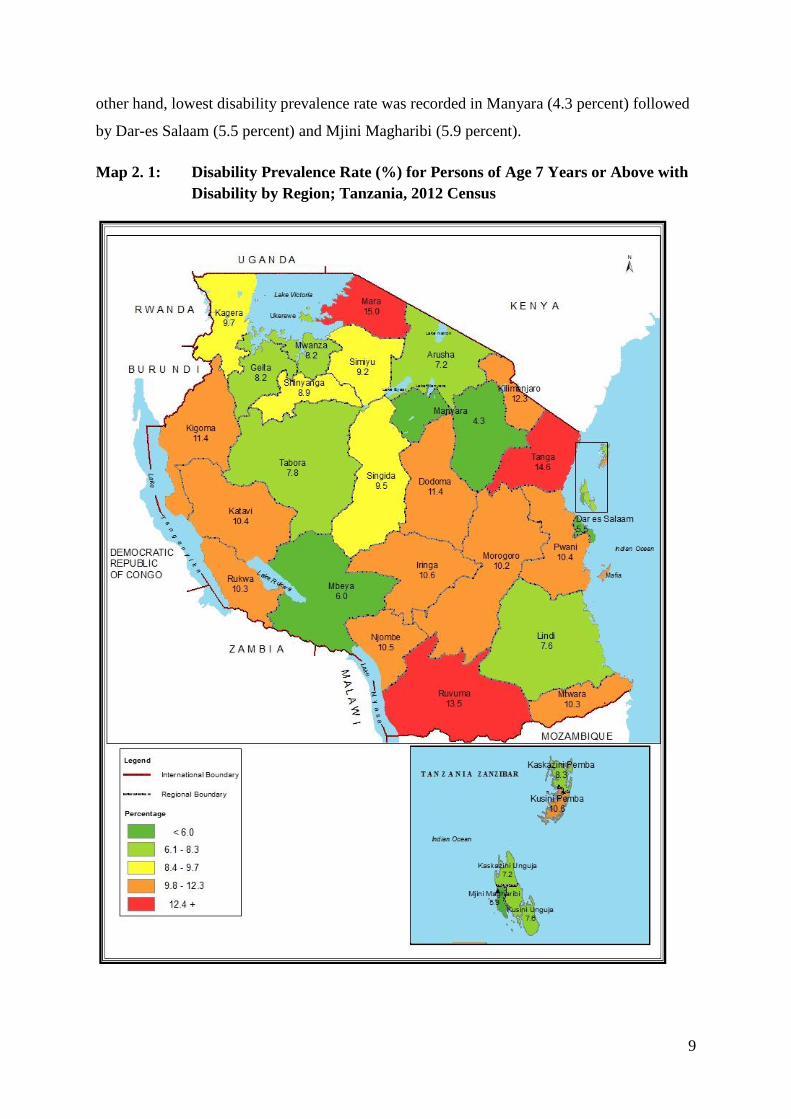
Prevalence of disability varies by regions. The highest disability prevalence rate was recorded
in Mara (15.0 percent) followed by Tanga (14.6 percent) and Ruvuma (13.5 percent). On the
9
other hand, lowest disability prevalence rate was recorded in Manyara (4.3 percent) followed
by Dar-es Salaam (5.5 percent) and Mjini Magharibi (5.9 percent).
Map 2. 1: Disability Prevalence Rate (%) for Persons of Age 7 Years or Above with
Disability by Region; Tanzania, 2012 Census

10
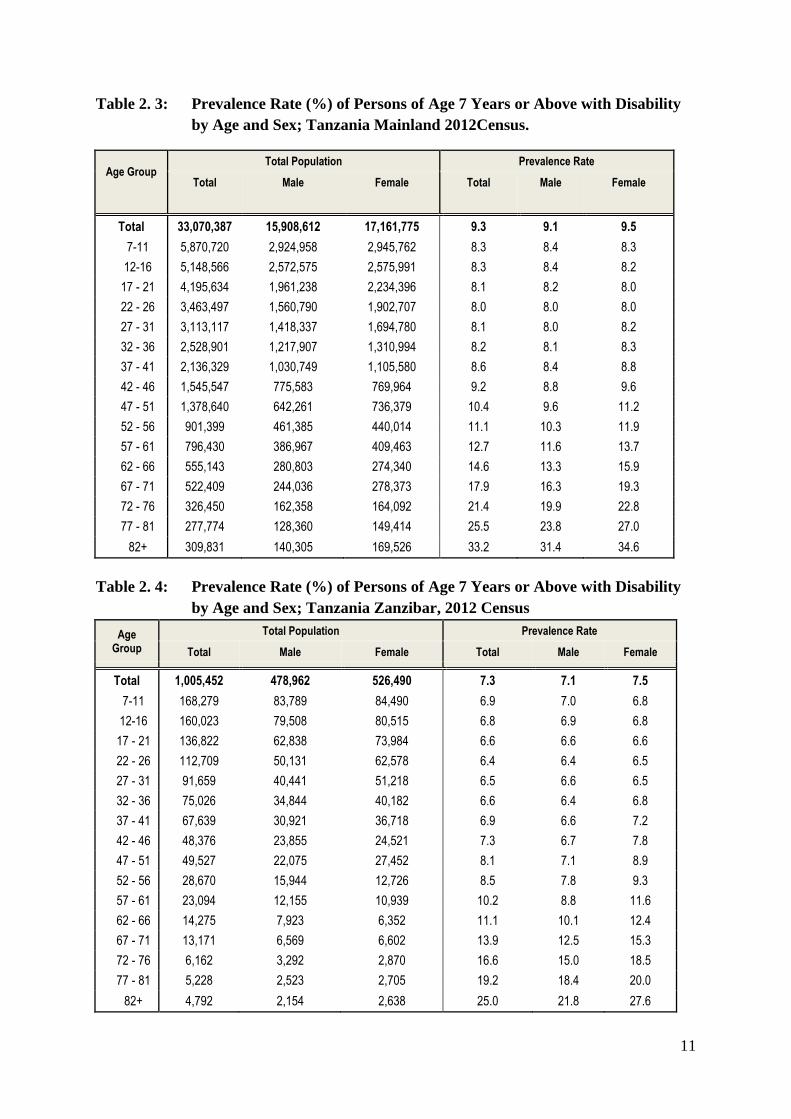
2.4 Prevalence Rate of Persons with Disability by Age and Sex
Tables 2.2 to 2.4 present the prevalence rate of persons with disability by age groups and
sex in Tanzania, Tanzania Mainland and Tanzania Zanzibar for the population aged 7 years
and above. Table 2.2 indicates that, in general, disability prevalence rate was higher among
older people as compared to young one, varying from 33 percent for persons aged 80 years
and above to only 8.3 percent for those aged 7 to 11 years.
Table 2. 2: Prevalence Rate (%) of Persons of Age 7 Years or Above with Disability
by Age and Sex; Tanzania; 2012 Census
Age Group Total Population Prevalence Rate
Total Male Female Total Male Female
Total 34,075,839 16,387,574 17,688,265 9.3 9.1 9.4
7-11 6,038,999 3,008,747 3,030,252 8.3 8.4 8.3
12-16 5,308,589 2,652,083 2,656,506 8.3 8.4 8.2
17 - 21 4,332,456 2,024,076 2,308,380 8.1 8.1 8.0
22 - 26 3,576,206 1,610,921 1,965,285 7.9 7.9 7.9
27 - 31 3,204,776 1,458,778 1,745,998 8.0 8.0 8.1
32 - 36 2,603,927 1,252,751 1,351,176 8.2 8.1 8.3
37 - 41 2,203,968 1,061,670 1,142,298 8.6 8.4 8.8
42 - 46 1,593,923 799,438 794,485 9.1 8.8 9.5
47 - 51 1,428,167 664,336 763,831 10.3 9.5 11.1
52 - 56 930,069 477,329 452,740 11.0 10.2 11.8
57 - 61 819,524 399,122 420,402 12.6 11.5 13.6
62 - 66 569,418 288,726 280,692 14.5 13.2 15.9
67 - 71 535,580 250,605 284,975 17.8 16.2 19.3
72 - 76 332,612 165,650 166,962 21.3 19.8 22.7
77 - 81 283,002 130,883 152,119 25.4 23.7 26.9
82+ 314,623 142,459 172,164 33.0 31.3 34.5
11
Table 2. 3: Prevalence Rate (%) of Persons of Age 7 Years or Above with Disability
by Age and Sex; Tanzania Mainland 2012Census.
Age Group Total Population Prevalence Rate
Total Male Female Total Male Female
Total 33,070,387 15,908,612 17,161,775 9.3 9.1 9.5
7-11 5,870,720 2,924,958 2,945,762 8.3 8.4 8.3
12-16 5,148,566 2,572,575 2,575,991 8.3 8.4 8.2
17 - 21 4,195,634 1,961,238 2,234,396 8.1 8.2 8.0
22 - 26 3,463,497 1,560,790 1,902,707 8.0 8.0 8.0
27 - 31 3,113,117 1,418,337 1,694,780 8.1 8.0 8.2
32 - 36 2,528,901 1,217,907 1,310,994 8.2 8.1 8.3
37 - 41 2,136,329 1,030,749 1,105,580 8.6 8.4 8.8
42 - 46 1,545,547 775,583 769,964 9.2 8.8 9.6
47 - 51 1,378,640 642,261 736,379 10.4 9.6 11.2
52 - 56 901,399 461,385 440,014 11.1 10.3 11.9
57 - 61 796,430 386,967 409,463 12.7 11.6 13.7
62 - 66 555,143 280,803 274,340 14.6 13.3 15.9
67 - 71 522,409 244,036 278,373 17.9 16.3 19.3
72 - 76 326,450 162,358 164,092 21.4 19.9 22.8
77 - 81 277,774 128,360 149,414 25.5 23.8 27.0
82+ 309,831 140,305 169,526 33.2 31.4 34.6
Table 2. 4: Prevalence Rate (%) of Persons of Age 7 Years or Above with Disability
by Age and Sex; Tanzania Zanzibar, 2012 Census
Age Group
Total Population Prevalence Rate
Total Male Female Total Male Female
Total 1,005,452 478,962 526,490 7.3 7.1 7.5
7-11 168,279 83,789 84,490 6.9 7.0 6.8
12-16 160,023 79,508 80,515 6.8 6.9 6.8
17 - 21 136,822 62,838 73,984 6.6 6.6 6.6
22 - 26 112,709 50,131 62,578 6.4 6.4 6.5
27 - 31 91,659 40,441 51,218 6.5 6.6 6.5
32 - 36 75,026 34,844 40,182 6.6 6.4 6.8
37 - 41 67,639 30,921 36,718 6.9 6.6 7.2
42 - 46 48,376 23,855 24,521 7.3 6.7 7.8
47 - 51 49,527 22,075 27,452 8.1 7.1 8.9
52 - 56 28,670 15,944 12,726 8.5 7.8 9.3
57 - 61 23,094 12,155 10,939 10.2 8.8 11.6
62 - 66 14,275 7,923 6,352 11.1 10.1 12.4
67 - 71 13,171 6,569 6,602 13.9 12.5 15.3
72 - 76 6,162 3,292 2,870 16.6 15.0 18.5
77 - 81 5,228 2,523 2,705 19.2 18.4 20.0
82+ 4,792 2,154 2,638 25.0 21.8 27.6
12
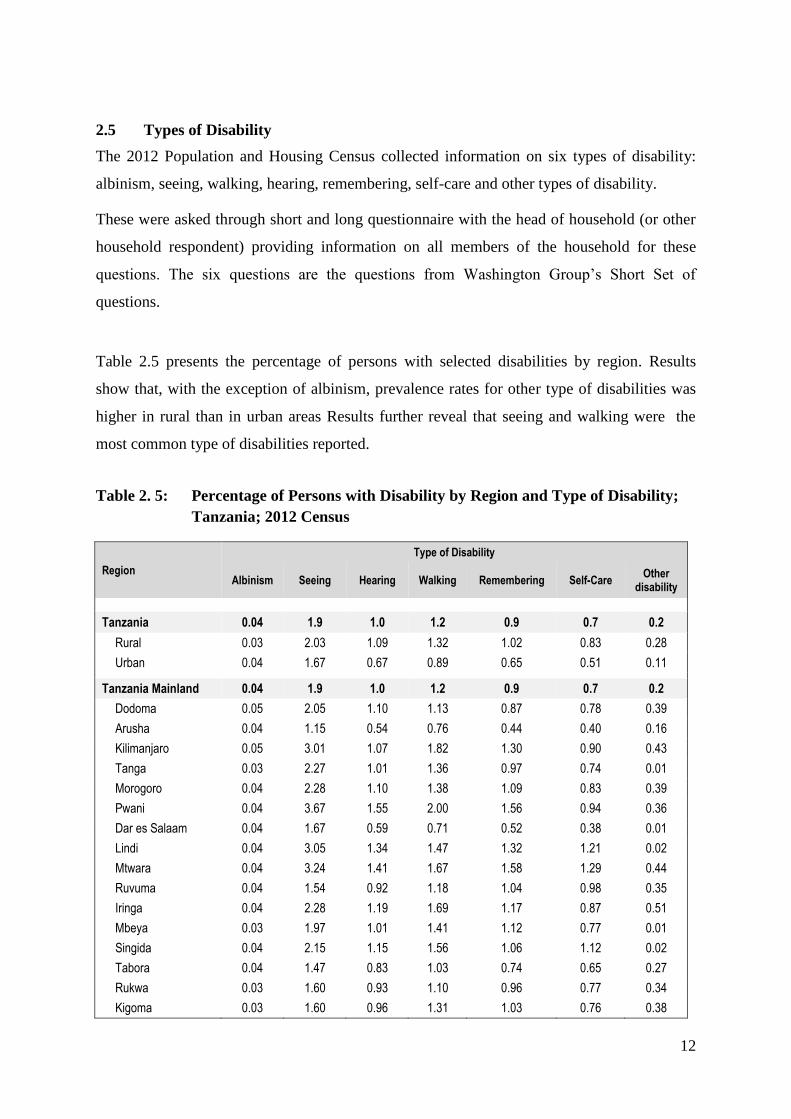
2.5 Types of Disability
The 2012 Population and Housing Census collected information on six types of disability:
albinism, seeing, walking, hearing, remembering, self-care and other types of disability.
These were asked through short and long questionnaire with the head of household (or other
household respondent) providing information on all members of the household for these
questions. The six questions are the questions from Washington Group’s Short Set of
questions.
Table 2.5 presents the percentage of persons with selected disabilities by region. Results
show that, with the exception of albinism, prevalence rates for other type of disabilities was
higher in rural than in urban areas Results further reveal that seeing and walking were the
most common type of disabilities reported.
Table 2. 5: Percentage of Persons with Disability by Region and Type of Disability;
Tanzania; 2012 Census
Region
Type of Disability
Albinism Seeing Hearing Walking Remembering Self-Care Other
disability
Tanzania 0.04 1.9 1.0 1.2 0.9 0.7 0.2
Rural 0.03 2.03 1.09 1.32 1.02 0.83 0.28
Urban 0.04 1.67 0.67 0.89 0.65 0.51 0.11
Tanzania Mainland 0.04 1.9 1.0 1.2 0.9 0.7 0.2
Dodoma 0.05 2.05 1.10 1.13 0.87 0.78 0.39
Arusha 0.04 1.15 0.54 0.76 0.44 0.40 0.16
Kilimanjaro 0.05 3.01 1.07 1.82 1.30 0.90 0.43
Tanga 0.03 2.27 1.01 1.36 0.97 0.74 0.01
Morogoro 0.04 2.28 1.10 1.38 1.09 0.83 0.39
Pwani 0.04 3.67 1.55 2.00 1.56 0.94 0.36
Dar es Salaam 0.04 1.67 0.59 0.71 0.52 0.38 0.01
Lindi 0.04 3.05 1.34 1.47 1.32 1.21 0.02
Mtwara 0.04 3.24 1.41 1.67 1.58 1.29 0.44
Ruvuma 0.04 1.54 0.92 1.18 1.04 0.98 0.35
Iringa 0.04 2.28 1.19 1.69 1.17 0.87 0.51
Mbeya 0.03 1.97 1.01 1.41 1.12 0.77 0.01
Singida 0.04 2.15 1.15 1.56 1.06 1.12 0.02
Tabora 0.04 1.47 0.83 1.03 0.74 0.65 0.27
Rukwa 0.03 1.60 0.93 1.10 0.96 0.77 0.34
Kigoma 0.03 1.60 0.96 1.31 1.03 0.76 0.38
13
Shinyanga 0.04 1.07 0.63 0.73 0.44 0.42 0.19
Kagera 0.02 2.48 1.48 1.36 1.30 0.88 0.52
Mwanza 0.04 1.36 0.74 0.86 0.59 0.52 0.01
Mara 0.04 2.00 0.97 1.42 1.09 1.05 0.33
Manyara 0.03 1.62 0.87 1.11 0.73 0.71 0.27
Njombe 0.04 1.90 1.10 1.62 1.14 0.76 0.51
Katavi 0.04 1.71 1.05 1.21 0.93 0.86 0.33
Simiyu 0.04 1.22 0.78 0.96 0.61 0.61 0.24
Geita 0.04 1.36 0.82 0.91 0.65 0.61 0.01
Tanzania Zanzibar 0.03 2.1 1.2 0.9 0.8 0.6 0.2
Kaskazini Unguja 0.02 2.03 1.12 0.83 0.73 0.57 0.01
Kusini Unguja 0.03 2.88 1.79 1.18 1.05 0.60 0.80
Mjini Magharibi 0.03 1.86 0.83 0.75 0.64 0.50 0.01
Kaskazini Pemba 0.02 1.76 1.27 0.91 0.91 0.69 0.02
Kusini Pemba 0.03 2.97 1.84 1.19 1.28 0.71 0.66
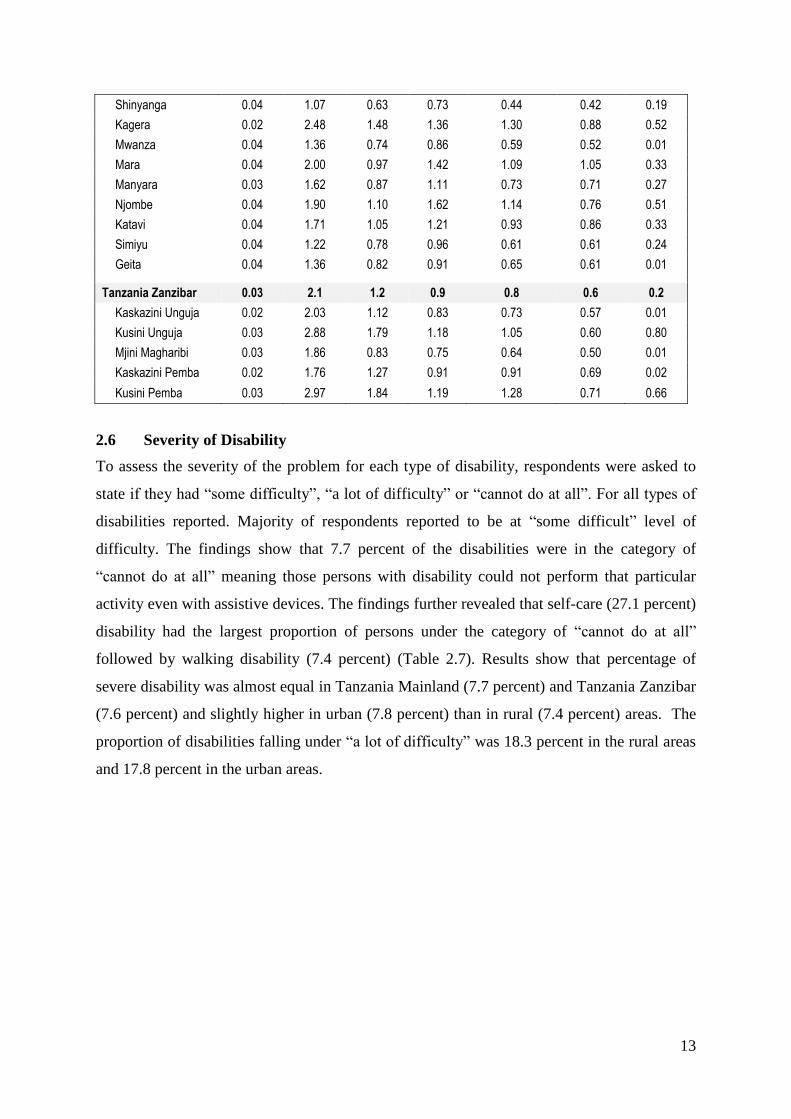
2.6 Severity of Disability
To assess the severity of the problem for each type of disability, respondents were asked to
state if they had “some difficulty”, “a lot of difficulty” or “cannot do at all”. For all types of
disabilities reported. Majority of respondents reported to be at “some difficult” level of
difficulty. The findings show that 7.7 percent of the disabilities were in the category of
“cannot do at all” meaning those persons with disability could not perform that particular
activity even with assistive devices. The findings further revealed that self-care (27.1 percent)
disability had the largest proportion of persons under the category of “cannot do at all”
followed by walking disability (7.4 percent) (Table 2.7). Results show that percentage of
severe disability was almost equal in Tanzania Mainland (7.7 percent) and Tanzania Zanzibar
(7.6 percent) and slightly higher in urban (7.8 percent) than in rural (7.4 percent) areas. The
proportion of disabilities falling under “a lot of difficulty” was 18.3 percent in the rural areas
and 17.8 percent in the urban areas.

14
Table 2. 6: Number and Disabilities for Persons of Age 7 Years or Above by Type,
Severity and Area; Tanzania, 2012 Census.
Areas
Level of Severity
Type of Disability
Some Difficulty A lot of Difficulty Unable
Total Number % Number % Number %
Tanzania
2,244,603 1,663,024 74.1 408,963 18.2 172,616 7.7
Seeing 819,197 670,345 81.8 117,671 14.4 31,181 3.8
Hearing 393,799 299,245 76.0 66,195 16.8 28,359 7.2
Walking 480,954 335,556 69.8 109,786 22.8 35,612 7.4
Remembering 351,453 256,545 73.0 71,448 20.3 23,460 6.7
Self-care 199,200 101,333 50.9 43,863 22.0 54,004 27.1
Rural
1,727,785 1,276,309 73.9 316,934 18.3 134,542 7.8
Seeing 609,462 494,704 81.2 89,735 14.7 25,023 4.1
Hearing 311,843 236,762 75.9 52,603 16.9 22,478 7.2
Walking 374,456 263,415 70.3 84,484 22.6 26,557 7.1
Remembering 275,262 200,806 73.0 55,744 20.3 18,712 6.8
Self-care 156,762 80,622 51.4 34,368 21.9 41,772 26.6
Urban
516,818 386,715 74.8 92,029 17.8 38,074 7.4
Seeing 209,735 175,641 83.7 27,936 13.3 6,158 2.9
Hearing 81,956 62,483 76.2 13,592 16.6 5,881 7.2
Walking 106,498 72,141 67.7 25,302 23.8 9,055 8.5
Remembering 76,191 55,739 73.2 15,704 20.6 4,748 6.2
Self-care 42,438 20,711 48.8 9,495 22.4 12,232 28.8
Tanzania Mainland
2,179,939 1,611,958 73.9 400,302 18.4 167,679 7.7
Seeing 792,707 646,795 81.6 115,343 14.6 30,569 3.9
Hearing 379,888 287,887 75.8 64,438 17.0 27,563 7.3
Walking 470,689 328,513 69.8 107,843 22.9 34,333 7.3
Remembering 342,085 249,492 72.9 69,827 20.4 22,766 6.7
Self-care 194,570 99,271 51.0 42,851 22.0 52,448 27.0
Tanzania Zanzibar
64,664 51,066 79.0 8,661 13.4 4,937 7.6
Seeing 26,490 23,550 88.9 2,328 8.8 612 2.3
Hearing 13,911 11,358 81.6 1,757 12.6 796 5.7
Walking 10,265 7,043 68.6 1,943 18.9 1,279 12.5
Remembering 9,368 7,053 75.3 1,621 17.3 694 7.4
Self-care 4,630 2,062 44.5 1,012 21.9 1,556 33.6
15
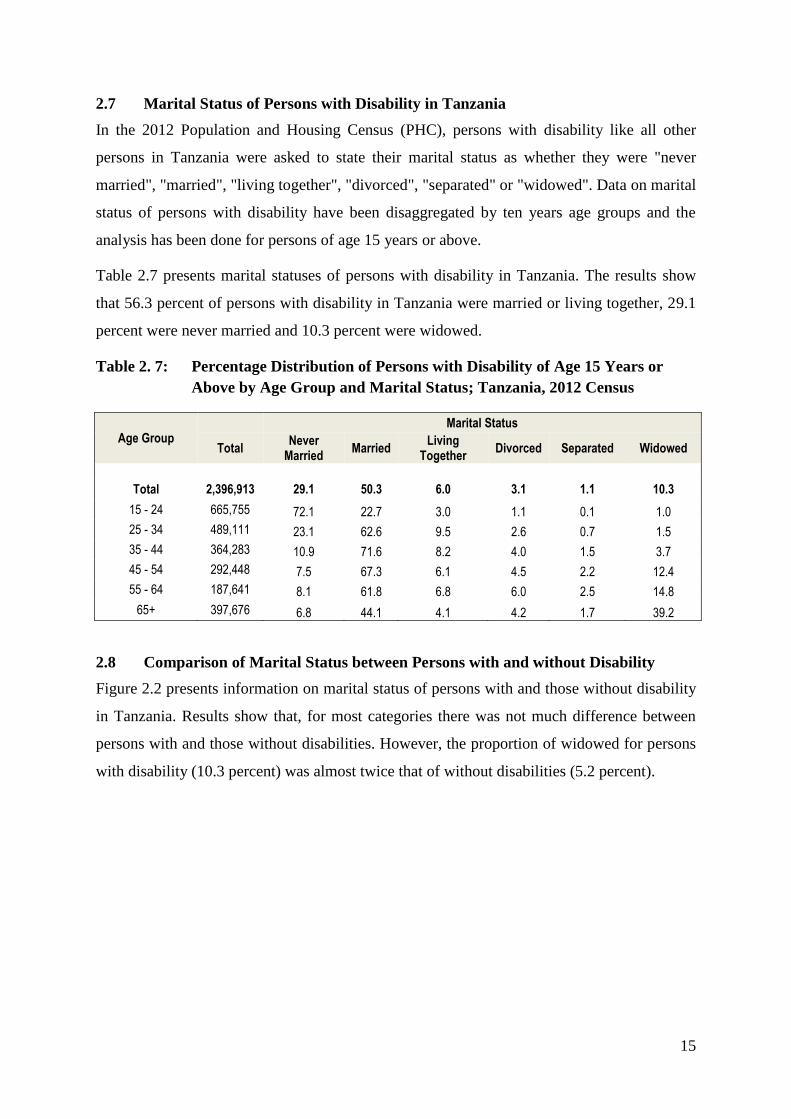
2.7 Marital Status of Persons with Disability in Tanzania
In the 2012 Population and Housing Census (PHC), persons with disability like all other
persons in Tanzania were asked to state their marital status as whether they were "never
married", "married", "living together", "divorced", "separated" or "widowed". Data on marital
status of persons with disability have been disaggregated by ten years age groups and the
analysis has been done for persons of age 15 years or above.
Table 2.7 presents marital statuses of persons with disability in Tanzania. The results show
that 56.3 percent of persons with disability in Tanzania were married or living together, 29.1
percent were never married and 10.3 percent were widowed.
Table 2. 7: Percentage Distribution of Persons with Disability of Age 15 Years or
Above by Age Group and Marital Status; Tanzania, 2012 Census
Age Group
Marital Status
Total Never
Married Married
Living Together
Divorced Separated Widowed
Total 2,396,913 29.1 50.3 6.0 3.1 1.1 10.3
15 - 24 665,755 72.1 22.7 3.0 1.1 0.1 1.0
25 - 34 489,111 23.1 62.6 9.5 2.6 0.7 1.5
35 - 44 364,283 10.9 71.6 8.2 4.0 1.5 3.7
45 - 54 292,448 7.5 67.3 6.1 4.5 2.2 12.4
55 - 64 187,641 8.1 61.8 6.8 6.0 2.5 14.8
65+ 397,676 6.8 44.1 4.1 4.2 1.7 39.2
2.8 Comparison of Marital Status between Persons with and without Disability
Figure 2.2 presents information on marital status of persons with and those without disability
in Tanzania. Results show that, for most categories there was not much difference between
persons with and those without disabilities. However, the proportion of widowed for persons
with disability (10.3 percent) was almost twice that of without disabilities (5.2 percent).

16
Figure 2.2: Percentage Distribution of Persons with Disability and Persons without
Disability of Age 15 Years or Above by Marital Status; Tanzania, 2012
Census
17
Chapter Three
Literacy and Education
3.1 Overview
This chapter describes literacy and education status among persons with disability. The
chapter also compares persons with and without disability in some key literacy and education
indicators.
In the 2012 Population and Housing Census, persons aged four years or above were asked if
they could read and write in: Kiswahili only, English only, Both Kiswahili and English or
Any Other Language (s). For the purpose of this chapter the analysis includes all person of
age five years or above.
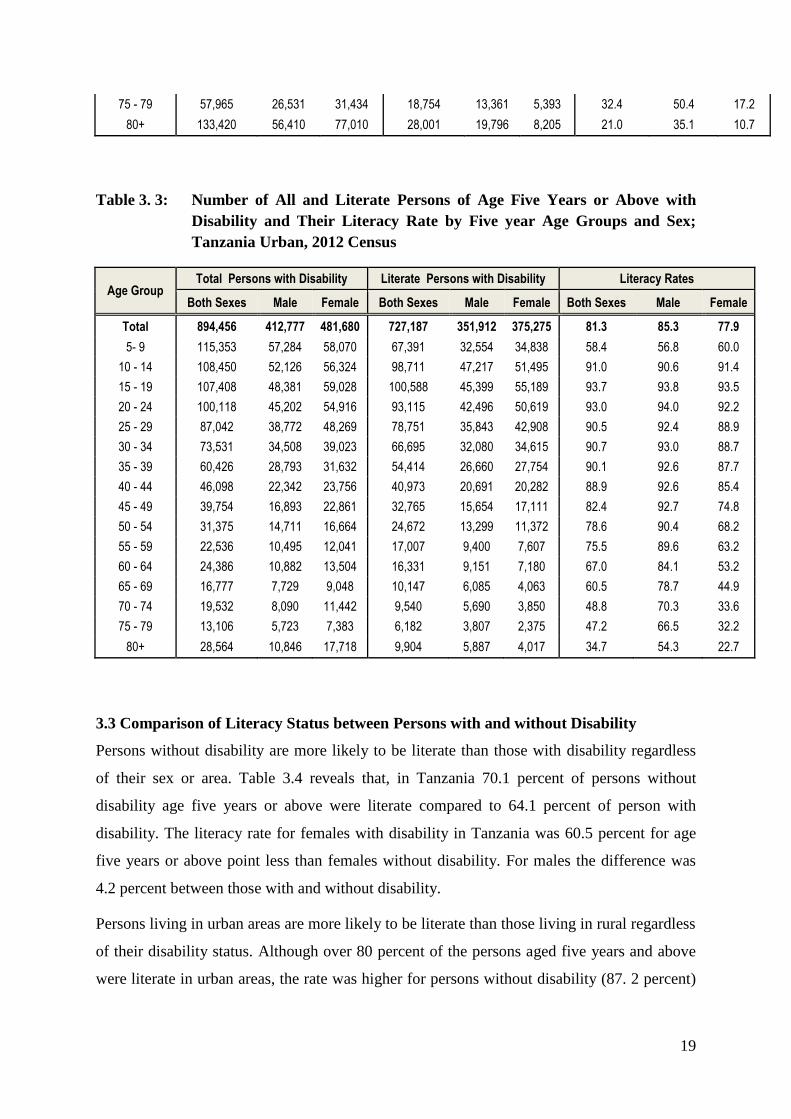
3.2 Literacy Status of Persons with Disability in Tanzania
Table 3.1 presents population distribution of persons with disability aged five years and
above by five-year age groups, literacy and sex. Out of 3,450,986 persons with disabilities
aged 5 years and above, 2,228,280 (64.6 percent) were literate. Males with disability were
more literate than females with disability. Results show that literacy rate among males with
disability was 69.6 percent compared with 60.1 percent of females. However, at age group 10
– 14, the literacy rate of females with disability (80.3 percent) was higher than that of males
with disability (77.3 percent).
Literacy rate of persons with disability was significantly higher in urban (81.3 percent) than
in rural areas (58.7 percent) (Tables 3.2 and 3.3). This could be attributed to the fact that
males have comparative advantage over females and that parents tend to send to school male
children with disabilities than females. In recognition of this cultural anomaly the National
Policy on Disability (2004) proposes priority attention for women with disability in the
delivery of services.
The results also reveal that, at age 20 and above, literacy rate for males is relatively higher
that of females, when compared to younger ages. This can be explained by "advantage" male
children had in the past when compared to girls. However, below 20 years there is no marked
difference between boys and girls signifying equity in provision of education in recent years.

18
Table 3. 1: Number of All and Literate Persons of Age Five Years or Above with
Disability and Their Literacy Rate by Five year Age Groups and Sex;
Tanzania, 2012 Census
Age Group Total Persons with Disability Literate Persons with Disability Literacy Rates
Both Sexes Male Female Both Sexes Male Female Both Sexes Male Female
Total 3,450,986 1,626,533 1,824,454 2,228,280 1,131,460 1,096,820 64.6 69.6 60.1
5 - 9 551,349 277,130 274,219 206,145 98,827 107,318 37.4 35.7 39.1
10 - 14 474,448 237,701 236,746 373,855 183,742 190,113 78.8 77.3 80.3
15 - 19 368,478 181,619 186,860 309,682 152,821 156,861 84.0 84.1 83.9
20 - 24 305,283 138,538 166,745 247,744 116,415 131,329 81.2 84.0 78.8
25 - 29 263,940 118,941 144,999 203,098 95,910 107,188 76.9 80.6 73.9
30 - 34 232,192 108,645 123,546 179,624 88,235 91,389 77.4 81.2 74.0
35 - 39 201,613 95,025 106,588 154,767 77,149 77,617 76.8 81.2 72.8
40 - 44 166,762 79,253 87,509 125,918 64,800 61,118 75.5 81.8 69.8
45 - 49 147,546 63,668 83,878 104,398 52,920 51,478 70.8 83.1 61.4
50 - 54 127,782 58,858 68,924 79,943 46,068 33,875 62.6 78.3 49.1
55 - 59 90,640 42,106 48,534 54,003 31,766 22,238 59.6 75.4 45.8
60 - 64 106,784 47,100 59,684 53,656 32,631 21,025 50.2 69.3 35.2
65 - 69 81,346 35,887 45,460 36,900 23,621 13,279 45.4 65.8 29.2
70 - 74 99,768 42,552 57,216 35,706 23,704 12,002 35.8 55.7 21.0
75 - 79 71,072 32,254 38,818 24,936 17,167 7,768 35.1 53.2 20.0
80+ 161,984 67,256 94,729 37,905 25,683 12,222 23.4 38.2 12.9
Table 3. 2: Number of All and Literate Persons of Age Five Years or Above with
Disability and Their Literacy Rate by Five year Age Groups and Sex;
Tanzania Rural, 2012 Census
Age Group Total Persons with Disability Literate Persons with Disability Literacy Rates
Both Sexes Male Female Both Sexes Male Female Both Sexes Male Female
Total 2,556,530 1,213,756 1,342,774 1,501,093 779,548 721,545 58.7 64.2 53.7
5 - 9 435,996 219,847 216,149 138,754 66,273 72,481 31.8 30.1 33.5
10 - 14 365,998 185,576 180,422 275,143 136,525 138,618 75.2 73.6 76.8
15 - 19 261,070 133,238 127,832 209,094 107,422 101,672 80.1 80.6 79.5
20 - 24 205,165 93,336 111,829 154,630 73,920 80,710 75.4 79.2 72.2
25 - 29 176,898 80,169 96,729 124,346 60,067 64,280 70.3 74.9 66.5
30 - 34 158,660 74,137 84,523 112,929 56,155 56,774 71.2 75.7 67.2
35 - 39 141,187 66,232 74,956 100,352 50,489 49,863 71.1 76.2 66.5
40 - 44 120,664 56,910 63,754 84,944 44,108 40,836 70.4 77.5 64.1
45 - 49 107,792 46,775 61,017 71,633 37,267 34,366 66.5 79.7 56.3
50 - 54 96,407 44,147 52,260 55,272 32,769 22,503 57.3 74.2 43.1
55 - 59 68,104 31,611 36,493 36,996 22,366 14,630 54.3 70.8 40.1
60 - 64 82,398 36,218 46,180 37,325 23,480 13,845 45.3 64.8 30.0
65 - 69 64,569 28,157 36,412 26,753 17,536 9,217 41.4 62.3 25.3
70 - 74 80,236 34,462 45,774 26,166 18,014 8,152 32.6 52.3 17.8
19
75 - 79 57,965 26,531 31,434 18,754 13,361 5,393 32.4 50.4 17.2
80+ 133,420 56,410 77,010 28,001 19,796 8,205 21.0 35.1 10.7
Table 3. 3: Number of All and Literate Persons of Age Five Years or Above with
Disability and Their Literacy Rate by Five year Age Groups and Sex;
Tanzania Urban, 2012 Census
Age Group Total Persons with Disability Literate Persons with Disability Literacy Rates
Both Sexes Male Female Both Sexes Male Female Both Sexes Male Female
Total 894,456 412,777 481,680 727,187 351,912 375,275 81.3 85.3 77.9
5- 9 115,353 57,284 58,070 67,391 32,554 34,838 58.4 56.8 60.0
10 - 14 108,450 52,126 56,324 98,711 47,217 51,495 91.0 90.6 91.4
15 - 19 107,408 48,381 59,028 100,588 45,399 55,189 93.7 93.8 93.5
20 - 24 100,118 45,202 54,916 93,115 42,496 50,619 93.0 94.0 92.2
25 - 29 87,042 38,772 48,269 78,751 35,843 42,908 90.5 92.4 88.9
30 - 34 73,531 34,508 39,023 66,695 32,080 34,615 90.7 93.0 88.7
35 - 39 60,426 28,793 31,632 54,414 26,660 27,754 90.1 92.6 87.7
40 - 44 46,098 22,342 23,756 40,973 20,691 20,282 88.9 92.6 85.4
45 - 49 39,754 16,893 22,861 32,765 15,654 17,111 82.4 92.7 74.8
50 - 54 31,375 14,711 16,664 24,672 13,299 11,372 78.6 90.4 68.2
55 - 59 22,536 10,495 12,041 17,007 9,400 7,607 75.5 89.6 63.2
60 - 64 24,386 10,882 13,504 16,331 9,151 7,180 67.0 84.1 53.2
65 - 69 16,777 7,729 9,048 10,147 6,085 4,063 60.5 78.7 44.9
70 - 74 19,532 8,090 11,442 9,540 5,690 3,850 48.8 70.3 33.6
75 - 79 13,106 5,723 7,383 6,182 3,807 2,375 47.2 66.5 32.2
80+ 28,564 10,846 17,718 9,904 5,887 4,017 34.7 54.3 22.7
3.3 Comparison of Literacy Status between Persons with and without Disability
Persons without disability are more likely to be literate than those with disability regardless
of their sex or area. Table 3.4 reveals that, in Tanzania 70.1 percent of persons without
disability age five years or above were literate compared to 64.1 percent of person with
disability. The literacy rate for females with disability in Tanzania was 60.5 percent for age
five years or above point less than females without disability. For males the difference was
4.2 percent between those with and without disability.
Persons living in urban areas are more likely to be literate than those living in rural regardless
of their disability status. Although over 80 percent of the persons aged five years and above
were literate in urban areas, the rate was higher for persons without disability (87. 2 percent)
20
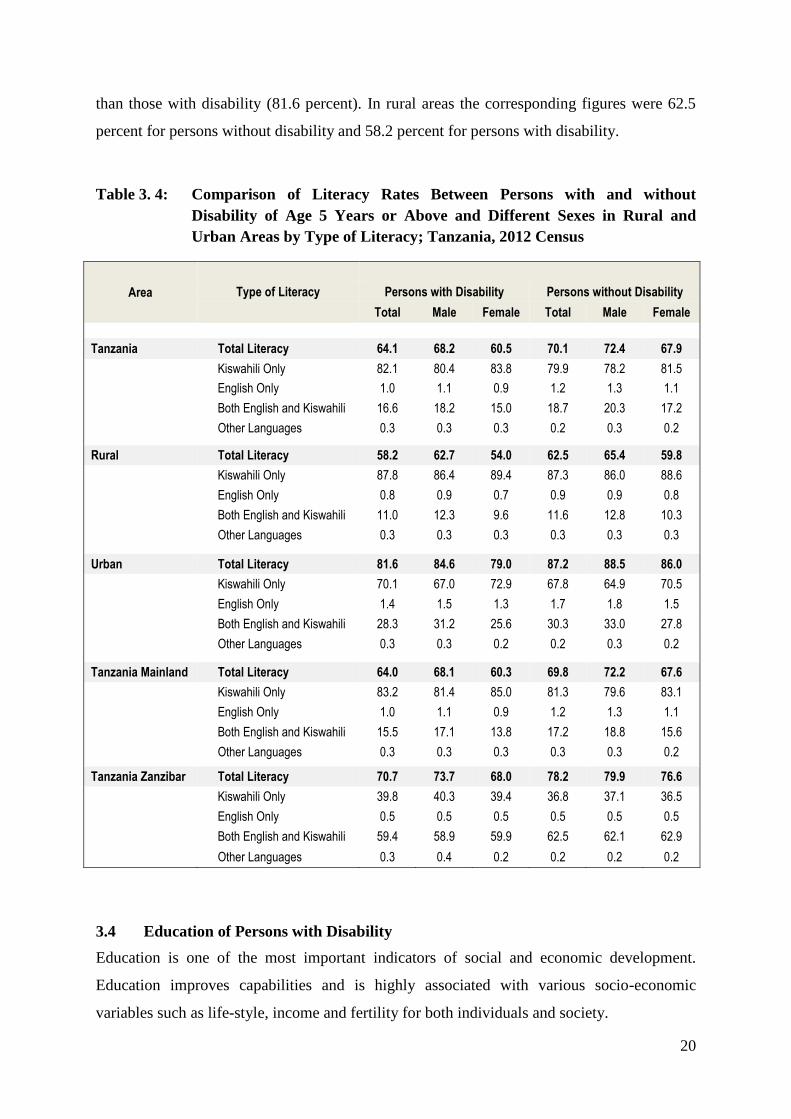
than those with disability (81.6 percent). In rural areas the corresponding figures were 62.5
percent for persons without disability and 58.2 percent for persons with disability.
Table 3. 4: Comparison of Literacy Rates Between Persons with and without
Disability of Age 5 Years or Above and Different Sexes in Rural and
Urban Areas by Type of Literacy; Tanzania, 2012 Census
Area
Type of Literacy Persons with Disability Persons without Disability
Total Male Female Total Male Female
Tanzania Total Literacy 64.1 68.2 60.5 70.1 72.4 67.9
Kiswahili Only 82.1 80.4 83.8 79.9 78.2 81.5
English Only 1.0 1.1 0.9 1.2 1.3 1.1
Both English and Kiswahili 16.6 18.2 15.0 18.7 20.3 17.2
Other Languages 0.3 0.3 0.3 0.2 0.3 0.2
Rural Total Literacy 58.2 62.7 54.0 62.5 65.4 59.8
Kiswahili Only 87.8 86.4 89.4 87.3 86.0 88.6
English Only 0.8 0.9 0.7 0.9 0.9 0.8
Both English and Kiswahili 11.0 12.3 9.6 11.6 12.8 10.3
Other Languages 0.3 0.3 0.3 0.3 0.3 0.3
Urban Total Literacy 81.6 84.6 79.0 87.2 88.5 86.0
Kiswahili Only 70.1 67.0 72.9 67.8 64.9 70.5
English Only 1.4 1.5 1.3 1.7 1.8 1.5
Both English and Kiswahili 28.3 31.2 25.6 30.3 33.0 27.8
Other Languages 0.3 0.3 0.2 0.2 0.3 0.2
Tanzania Mainland Total Literacy 64.0 68.1 60.3 69.8 72.2 67.6
Kiswahili Only 83.2 81.4 85.0 81.3 79.6 83.1
English Only 1.0 1.1 0.9 1.2 1.3 1.1
Both English and Kiswahili 15.5 17.1 13.8 17.2 18.8 15.6
Other Languages 0.3 0.3 0.3 0.3 0.3 0.2
Tanzania Zanzibar Total Literacy 70.7 73.7 68.0 78.2 79.9 76.6
Kiswahili Only 39.8 40.3 39.4 36.8 37.1 36.5
English Only 0.5 0.5 0.5 0.5 0.5 0.5
Both English and Kiswahili 59.4 58.9 59.9 62.5 62.1 62.9
Other Languages 0.3 0.4 0.2 0.2 0.2 0.2
3.4 Education of Persons with Disability
Education is one of the most important indicators of social and economic development.
Education improves capabilities and is highly associated with various socio-economic
variables such as life-style, income and fertility for both individuals and society.
21
Tanzania has ratified and signed various international conventions and agreements that
recognize the need of educational policies and practices that accommodate all learners. These
include: The UN Convention on the Rights of the Child (1989), the Dakar World Education
Conference (2000), the Salamanca Statement and Framework for Action (1994) and the UN
Convention on the Rights of Persons with Disabilities. Despite incorporating these
conventions and agreements into policies (the National Policy on Disability 2004 and the
National Strategy on Inclusive Education 2013) the education system in the country is still
facing challenges in achieving equal access to education for children with disability.
3.5 School Attendance for Persons with Disability
All persons of age five (5) years or above who were in the country during the census night
were asked to state if they were "attending", "dropped out", "completed", or "had never been
to school". For those who had dropped out or completed school a follow up question on the
highest level attained was asked. (Note: the analysis on school attendance focuses on persons
of age 5 to 24 years only)
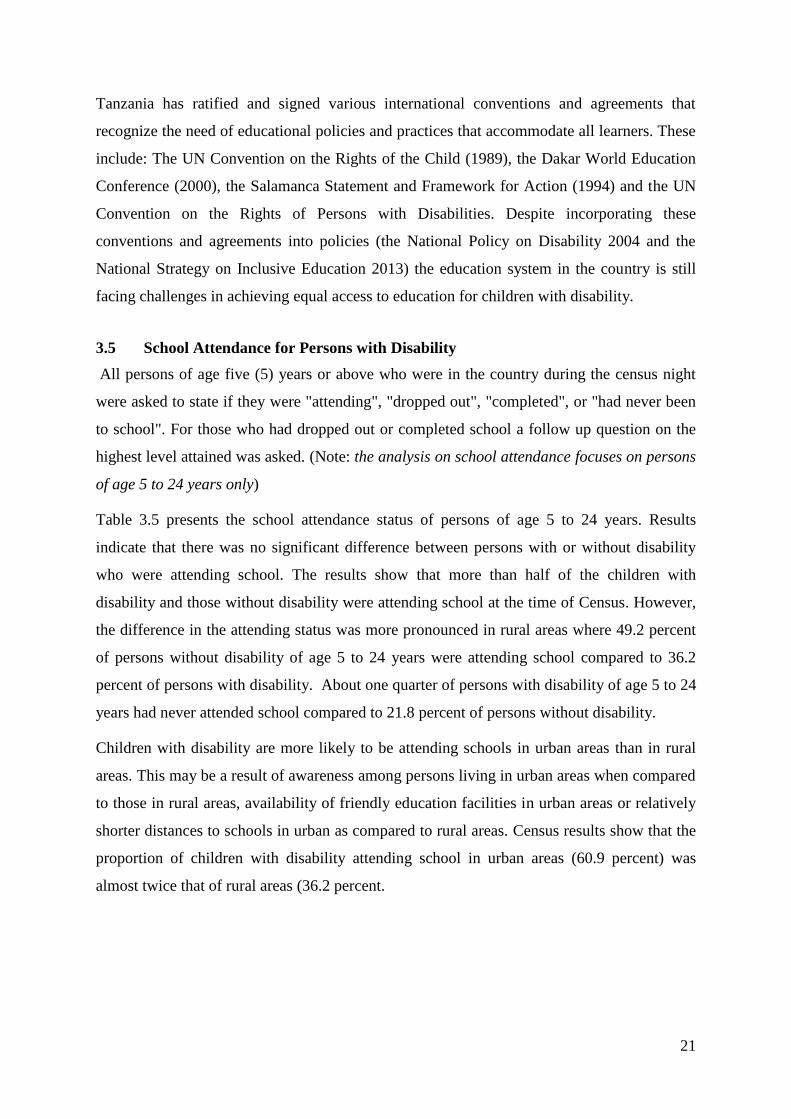
Table 3.5 presents the school attendance status of persons of age 5 to 24 years. Results
indicate that there was no significant difference between persons with or without disability
who were attending school. The results show that more than half of the children with
disability and those without disability were attending school at the time of Census. However,
the difference in the attending status was more pronounced in rural areas where 49.2 percent
of persons without disability of age 5 to 24 years were attending school compared to 36.2
percent of persons with disability. About one quarter of persons with disability of age 5 to 24
years had never attended school compared to 21.8 percent of persons without disability.
Children with disability are more likely to be attending schools in urban areas than in rural
areas. This may be a result of awareness among persons living in urban areas when compared
to those in rural areas, availability of friendly education facilities in urban areas or relatively
shorter distances to schools in urban as compared to rural areas. Census results show that the
proportion of children with disability attending school in urban areas (60.9 percent) was
almost twice that of rural areas (36.2 percent.
22
Table 3. 5: Percentage Distribution of Persons with and without Disability of Aged 5
– 24 Years by Area, School Attendance Status, Rural/Urban and Sex;
Tanzania, 2012 Census
Area School
Attendance Status Persons with Disability Persons without Disability
Total Male Female Total Male Female
Tanzania
100.0 49.2 50.8 100.0 48.7 51.3
Attending 51.5 26.0 25.5 52.7 26.4 26.4
Drop Out 5.2 2.7 2.4 5.0 2.7 2.4
Completed 19.1 8.3 10.8 20.4 8.8 11.6
Never Attended 24.2 12.2 12.0 21.8 10.9 10.9
Rural
100.0 49.9 50.1 100.0 49.6 50.4
Attending 36.2 18.3 17.8 49.2 24.8 24.4
Drop Out 4.1 2.3 1.8 5.4 3.0 2.4
Completed 12.8 5.8 7.0 17.7 8.1 9.7
Never Attended 21.7 10.9 10.8 27.6 13.8 13.8
Urban
100.0 47.0 53.0 100.0 46.5 53.5
Attending 60.9 30.3 30.6 61.3 30.3 31.0
Drop Out 4.2 1.9 2.4 4.0 1.8 2.2
Completed 25.0 10.0 15.0 27.0 10.7 16.3
Never Attended 9.9 4.9 5.0 7.6 3.7 4.0
Tanzania Mainland
100.0 49.2 50.8 100.0 48.7 51.3
Attending 51.3 25.9 25.4 52.4 26.3 26.2
Drop Out 5.0 2.7 2.4 4.9 2.6 2.3
Completed 19.3 8.4 10.8 20.6 8.9 11.7
Never Attended 24.4 12.2 12.1 22.0 11.0 11.1
Tanzania Zanzibar
100.0 48.9 51.1 100.0 48.3 51.7
Attending 60.0 29.8 30.2 62.7 30.7 32.0
Drop Out 9.4 5.0 4.3 8.8 4.8 4.1
Completed 13.0 5.1 7.9 14.6 5.8 8.8
Never Attended 17.6 9.0 8.6 13.8 7.0 6.8
3.5.1 Net and Gross School Enrolment Rates
In primary education, Net Enrolment Rate (NER) is defined as the number of children aged
7-13 years who are attending school divided by the total number of children in that age
group. The 7-13 year age group is the official primary school age in Tanzania. On the other
hand, Gross Enrolment Rate (GER) is defined as the number of children attending primary
school regardless of age divided by the total number of children of age 7-13 years.

23
Results from the Census shows that NER and GER for persons with and without disability
was almost equal indicating a positive progress in achieving equal education for all (Figure
3.1 and 3.2).
Figure 3. 1: Primary School Net Enrolment Rates of Persons with and without
Disability by Sex; Tanzania, 2012 Census

24
Figure 3. 2: Primary Schools Gross Enrolment Rates of Persons with and without
Disability and Sex; Tanzania, 2012 Census
3.6 Education Attainment
The 2012 PHC collected information on the level of education attainment for all persons of
age five years or above.
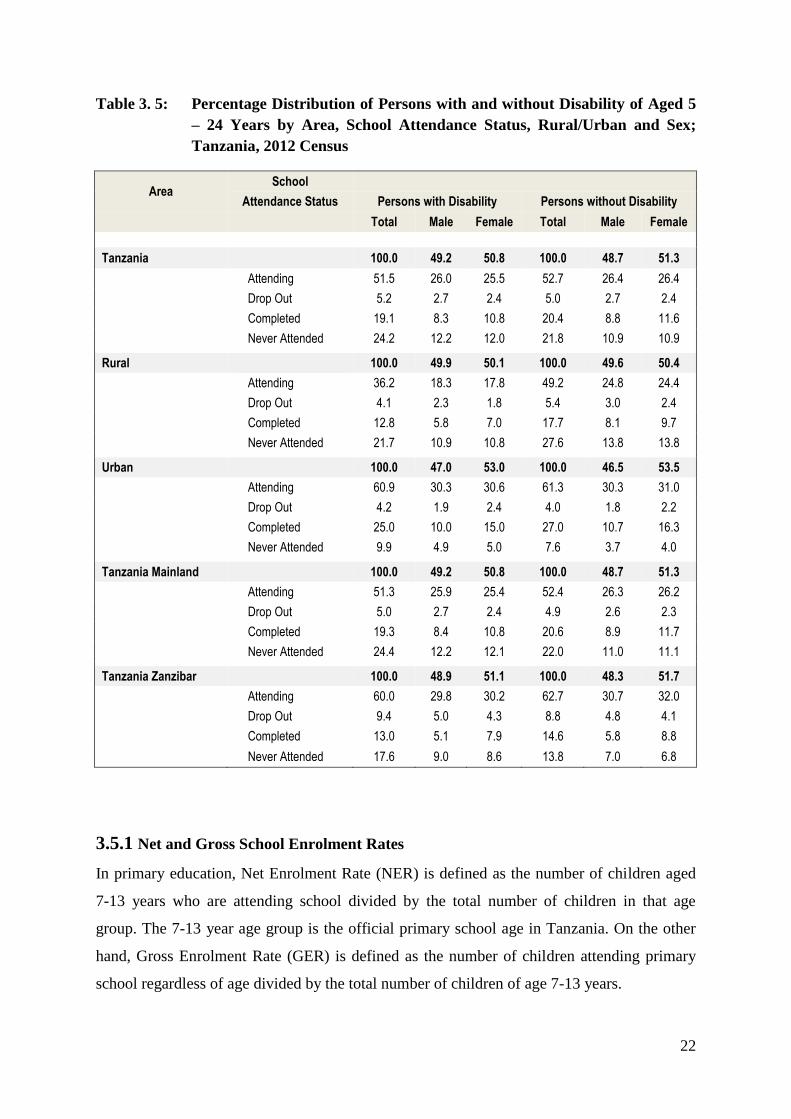
Table 3.6 presents results on education attained by persons with disability of age 5 years or
above by sex in Tanzania, Tanzania Mainland and Tanzania Zanzibar. Results show that
majority of persons with disabilities in Tanzania (84.2 percent) had attained primary
education. The situation in Tanzania Mainland was similar to that of Tanzania. However,
Tanzania Zanzibar had a larger proportion of persons with disability who had attained
secondary education (78.0 percent) than Tanzania Mainland (11.3 percent). The findings also
revealed that, the proportion of persons with disability who attained university and other
related was larger in Tanzania Zanzibar (4.0 percent) than in Tanzania Mainland (1.8
percent). The difference between Tanzania Mainland and Tanzania Zanzibar can be attributed
to different educations systems existing between the two parts of the Union Government.
25
Table 3. 6: Percentage Distribution of Persons with Disability of Aged 5 Years or
Above by Education Attainment, Area and Sex; Tanzania, 2012 Census.
Education Attainment
Area
Tanzania Tanzania Mainland Tanzania Zanzibar
Total Male Female Total Male Female Total Male Female
Total 100.0 50.0 50.0 100.0 50.0 50.0 100.0 48.6 51.4
Pre Primary 0.1 0.0 0.0 0.1 0.0 0.0 0.0 0.0 0.0
Primary 84.2 41.2 43.0 85.3 41.7 43.6 16.2 8.4 7.8
Training after Primary 0.8 0.4 0.4 0.8 0.4 0.4 0.5 0.2 0.2
Secondary School 12.4 6.8 5.6 11.3 6.3 5.0 78.0 36.6 41.4
Training after Secondary 0.7 0.4 0.3 0.7 0.4 0.3 1.3 0.7 0.6
University and Other Related 1.8 1.2 0.7 1.8 1.1 0.6 4.0 2.6 1.4
26
Chapter Four
Economic Activities
4.1 Overview
The importance of statistical data on economic activities of a nation becomes clear when
addressing among other things the labour market in the country. The 2012 PHC, collected
information on both usual and current economic activities for all persons of age 5 years or
above. However, the analysis of this chapter focuses on the current economic activities, main
occupation, industry and employment status for persons of age 15 years or above.
4.2 Economic Activity Status of Persons with Disability
Table 4.1 and 4.2 give information on the activity status of persons with disability of age 15
years or above in Tanzania, Tanzania Mainland and Tanzania Zanzibar. Results indicate that
in Tanzania, two-third (70.2 percent) of persons with disability were employed, about one-
third (27.1 percent) were distribution inactive and just 2.7 percent were unemployed. The
same distribution was observed in Tanzania Mainland.
The proportion of persons with disability who were employed was larger in Tanzania
Mainland (70.7 percent) than Tanzania Zanzibar (49.9 percent). Tanzania Zanzibar had the
largest proportion of inactive persons (44.1 percent) than Tanzania (27.1 percent) and
Tanzania Mainland (26.7 percent). Results also show that the proportion of the economically
inactive was larger for females than males in all areas. Findings from Table 4.2 reveal that the
proportion employed for persons with disability was larger in rural ( 74.8 percent) than in
urban areas (58.2 percent).The proportion that was inactive for persons with disability was
larger in urban areas than in rural areas and in both areas. Results also show that females with
disability were more likely to be inactive when compared males with disability.

27
Table 4. 1: Number and Percentage of Persons with Disability of Age 15 Years or
Above by Current Activity Status; Tanzania, 2012 Census
Number Percentage
Total Male Female Total Male Female
Tanzania 2,425,190 1,111,701 1,313,489 100.0 45.8 54.2
Employed 1,703,362 836,824 866,538 70.2 34.5 35.7
Unemployed 64,763 35,807 28,956 2.7 1.5 1.2
Inactive 657,064 239,069 417,995 27.1 9.9 17.2
Tanzania Mainland 2,368,034 1,085,818 1,282,216 100.0 45.9 54.1
Employed 1,674,815 820,430 854,385 70.7 34.6 36.1
Unemployed 61,375 33,651 27,724 2.6 1.4 1.2
Inactive 631,844 231,736 400,107 26.7 9.8 16.9
Tanzania Zanzibar 57,156 25,883 31,273 100.0 45.3 54.7
Employed 28,547 16,394 12,153 49.9 28.7 21.3
Unemployed 3,388 2,156 1,232 5.9 3.8 2.2
Inactive 25,221 7,333 17,888 44.1 12.8 31.3
Table 4. 2: Number and Percentage of Persons with Disability of Age 15 Years or
Above in Rural and Urban areas by Current Activity Status; Tanzania,
2012 Census.
Number Percentage
Total Male Female Total Male Female
Tanzania 2,425,190 1,111,701 1,313,489 100.0 45.8 54.2
Employed 1,703,362 836,824 866,538 70.2 34.5 35.7
Unemployed 64,763 35,807 28,956 2.7 1.5 1.2
Inactive 657,064 239,069 417,995 27.1 9.9 17.2
Rural 1,754,537 808,334 946,203 100.0 46.1 53.9
Employed 1,312,785 631,745 681,040 74.8 36.0 38.8
Unemployed 31,029 17,373 13,656 1.8 1.0 0.8
Inactive 410,723 159,216 251,507 23.4 9.1 14.3
Urban 670,653 303,367 367,286 100.0 45.2 54.8
Employed 390,577 205,080 185,498 58.2 30.6 27.7
Unemployed 33,734 18,435 15,299 5.0 2.7 2.3
Inactive 246,341 79,853 166,488 36.7 11.9 24.8
Figure 4.1 shows the proportion of employed persons of age 15 years or above with
disability. Results shows that, about one out of ten employed persons (9.4 percent) had some

28
type of disability in Tanzania. The proportion was slightly larger for females (9.7 percent)
than males (9.1 percent). It was the same in Tanzania Mainland.
Results further show that 7.4 percent of working persons in Tanzania Zanzibar had some type
of disability and the proportion was larger for females (8.0 percent) than males (7.0 percent).
Figure 4. 1: Proportion of Employed Persons of Age 15 Years or Above with
Disability by Sex; Tanzania, Tanzania Mainland and Tanzania Zanzibar
by Sex; Tanzania 2012 Census.

29
4.3 Employed Persons with Disability – Main Economic Activity
This section discusses the distribution of persons with disability of age 15 years or above by industry and age group, in Tanzania, Tanzania
Mainland and Tanzania Zanzibar.
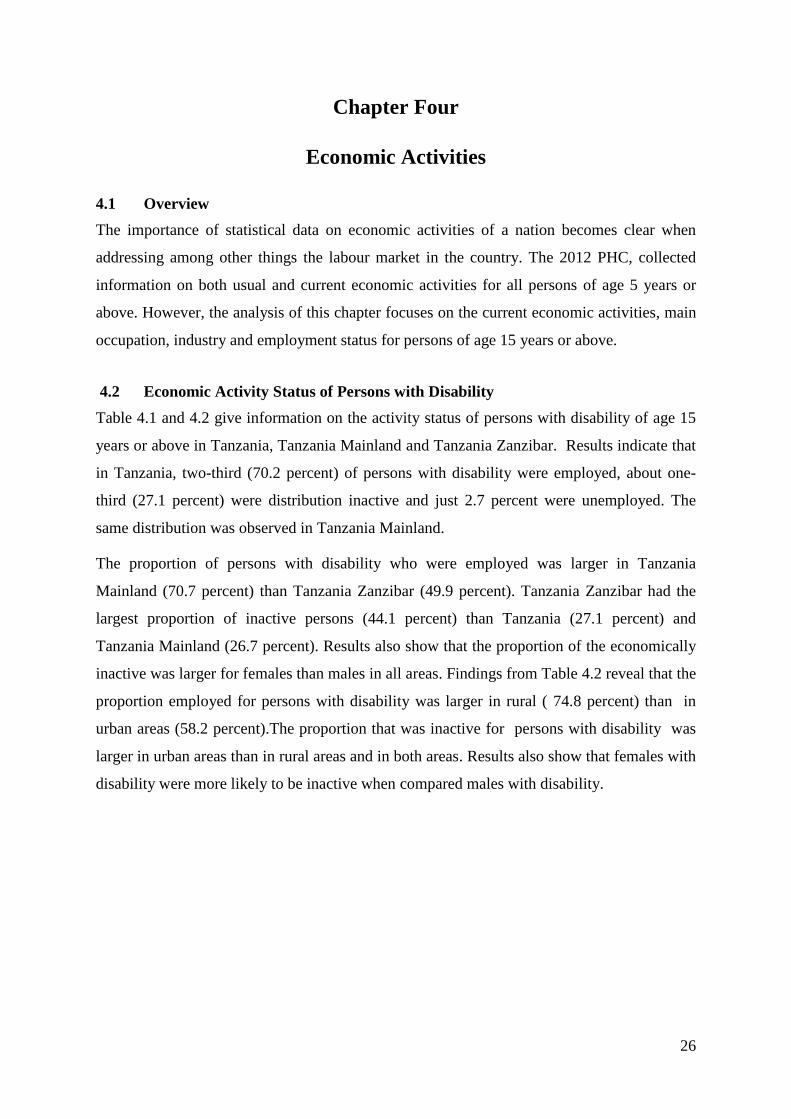
Table 4.3 reveals that nearly two thirds (67.1 percent) of persons with disability were engaged in commercial agriculture, food crops and forestry
activities. Trade and commerce with 5.9 percent was the second important industry for persons with disability .In Tanzania, commercial
agriculture, food crops and forestry activities employed a larger percentage of females (70.3 percent) than males (63.8 percent). It was the same
thing in Tanzania Mainland.
Commercial agriculture, food crops and forestry had most of the employed persons with disability in Tanzania Zanzibar (44.2 percent), followed
by fishing, hunting, livestock and other related activities (8.4 percent) and raw food sales (6.5 percent). In Tanzania Zanzibar, the percentage
employed in commercial agriculture, food crops and forestry was larger for female than males. However, in fishing, hunting, livestock and other
related activities the percentage was higher for males than females.

30
Table 4. 3: Percentage Distribution of Employed Persons with Disability of Age 15 Years or Above, Males and Females by Industry;
Tanzania, 2012 Census
Industry
Tanzania Tanzania Mainland Tanzania Zanzibar
Both Sexes Male Female Both Sexes Male Female Both Sexes Male Female
Total 100.0 100.0 100.0 100.0 100.0 100.0 100.0 100.0 100.0
Commercial Agriculture, Food Crops and Forestry 67.1 63.8 70.3 67.5 64.3 70.6 44.2 37.1 54.1
Fishing Hunting Livestock and Other Related 3.1 4.1 2.0 3.0 3.9 2.0 8.4 13.0 2.1
Mining and Quarrying 2.5 2.7 2.2 2.5 2.7 2.2 1.3 1.4 1.1
Manufacturing 2.7 3.3 2.2 2.6 3.2 2.1 6.4 6.2 6.8
Electricity Gas and Steam 0.3 0.4 0.2 0.3 0.4 0.2 0.6 0.7 0.4
Services for Clean Water Sewage and Environment 0.7 0.7 0.8 0.7 0.7 0.7 1.2 1.2 1.1
Construction 2.0 3.1 0.9 1.9 3.0 0.9 3.4 5.4 0.7
Raw Food Sales (Uncooked Food) 2.8 2.8 2.9 2.8 2.7 2.8 6.5 7.5 5.2
Trade and Commerce 5.9 6.2 5.5 5.9 6.3 5.5 4.3 4.7 3.6
Haulage and Storage 1.0 1.8 0.3 1.0 1.7 0.3 2.4 3.8 0.5
Services for food Hotels and Lodges 1.5 1.0 2.1 1.5 0.9 2.1 4.7 3.8 6.0
Information and Communication 0.3 0.4 0.2 0.3 0.4 0.2 0.8 0.8 0.8
Financial Institution and Insurance 0.6 0.7 0.6 0.6 0.7 0.6 1.1 1.1 1.1
Public Administration and Security Services 1.0 1.5 0.5 0.9 1.4 0.5 3.9 5.5 1.6
Education Services 1.4 1.5 1.3 1.3 1.4 1.2 3.9 2.8 5.6
Health and Social Welfare Services 0.5 0.4 0.6 0.5 0.4 0.6 1.1 1.0 1.2
Domestic Services 4.9 3.7 6.0 4.9 3.8 6.0 2.8 0.8 5.5
Other Activities not listed 1.8 2.2 1.5 1.8 2.1 1.5 3.0 3.2 2.6
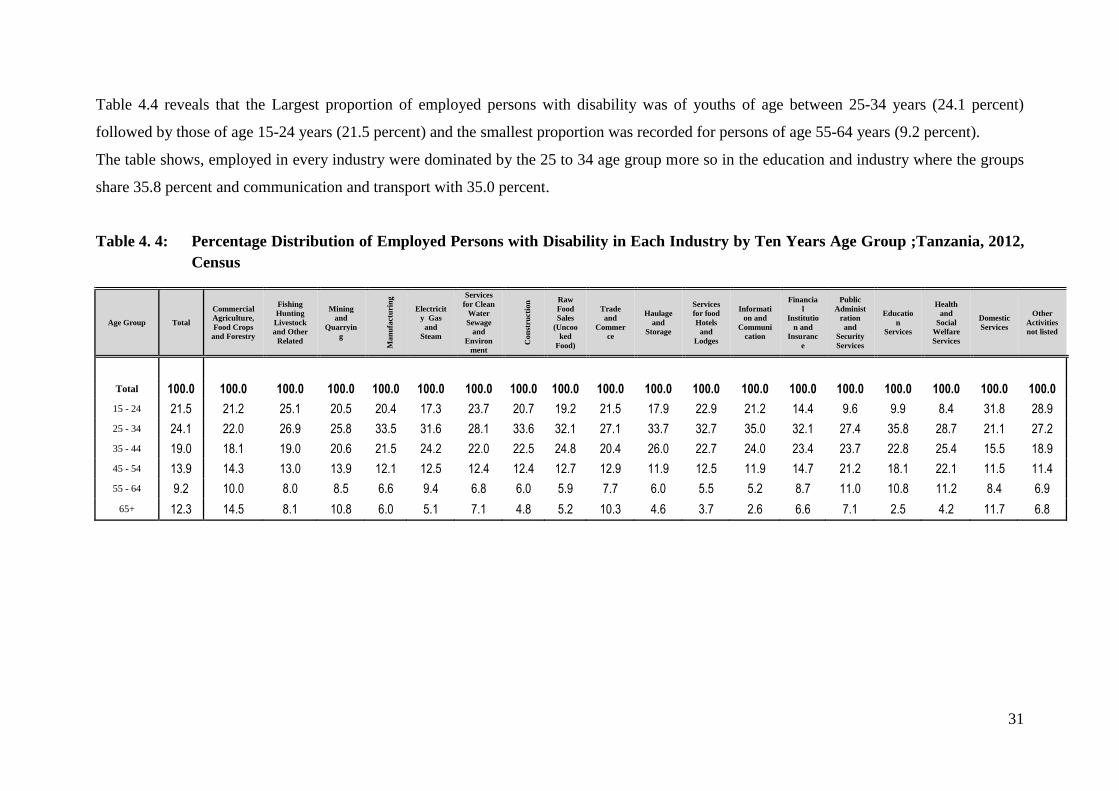
31
Table 4.4 reveals that the Largest proportion of employed persons with disability was of youths of age between 25-34 years (24.1 percent)
followed by those of age 15-24 years (21.5 percent) and the smallest proportion was recorded for persons of age 55-64 years (9.2 percent).
The table shows, employed in every industry were dominated by the 25 to 34 age group more so in the education and industry where the groups
share 35.8 percent and communication and transport with 35.0 percent.
Table 4. 4: Percentage Distribution of Employed Persons with Disability in Each Industry by Ten Years Age Group ;Tanzania, 2012,
Census
Age Group Total
Commercial
Agriculture,
Food Crops
and Forestry
Fishing
Hunting
Livestock
and Other
Related
Mining
and
Quarryin
g
Man
ufa
ctu
rin
g
Electricit
y Gas
and
Steam
Services
for Clean
Water
Sewage
and
Environ
ment
Con
stru
ctio
n Raw
Food
Sales
(Uncoo
ked
Food)
Trade
and
Commer
ce
Haulage
and
Storage
Services
for food
Hotels
and
Lodges
Informati
on and
Communi
cation
Financia
l
Institutio
n and
Insuranc
e
Public
Administ
ration
and
Security
Services
Educatio
n
Services
Health
and
Social
Welfare
Services
Domestic
Services
Other
Activities
not listed
Total 100.0 100.0 100.0 100.0 100.0 100.0 100.0 100.0 100.0 100.0 100.0 100.0 100.0 100.0 100.0 100.0 100.0 100.0 100.0
15 - 24 21.5 21.2 25.1 20.5 20.4 17.3 23.7 20.7 19.2 21.5 17.9 22.9 21.2 14.4 9.6 9.9 8.4 31.8 28.9
25 - 34 24.1 22.0 26.9 25.8 33.5 31.6 28.1 33.6 32.1 27.1 33.7 32.7 35.0 32.1 27.4 35.8 28.7 21.1 27.2
35 - 44 19.0 18.1 19.0 20.6 21.5 24.2 22.0 22.5 24.8 20.4 26.0 22.7 24.0 23.4 23.7 22.8 25.4 15.5 18.9
45 - 54 13.9 14.3 13.0 13.9 12.1 12.5 12.4 12.4 12.7 12.9 11.9 12.5 11.9 14.7 21.2 18.1 22.1 11.5 11.4
55 - 64 9.2 10.0 8.0 8.5 6.6 9.4 6.8 6.0 5.9 7.7 6.0 5.5 5.2 8.7 11.0 10.8 11.2 8.4 6.9
65+ 12.3 14.5 8.1 10.8 6.0 5.1 7.1 4.8 5.2 10.3 4.6 3.7 2.6 6.6 7.1 2.5 4.2 11.7 6.8

32
4.4 Main Occupation in Employment for Persons with Disability.
This section gives information on the main occupation in employment for person with
disability.
As pointed earlier the majority of persons with disability were engaged in agriculture,
commercial and food crops industries, results shows that largest proportion were dealing with
farming and livestock keeping as well as fishing (Table 4.5). As might be expected females
were engaged in farming activities more than males. Agriculture and fishing was the
occupation of more than 70 percent of persons with disability and most of these were in 35 to
64 years age group. The information for Tanzania Mainland, Tanzania Zanzibar and by rural
and urban areas are presented in Appendix 1 Tables 1.6 to 1.9
Table 4. 5: Percentage Distribution of Employed Persons with Disability by
Occupation, Sex and Age Group; Tanzania, 2012 Census
Age Group Total Administrators
and Professionals
Technicians Clerks Small
Business
Service Workers
Shop and Stall Sales
Workers
Street Vendors
and Related Workers
Crafts and
Related Workers
Farmers Livestock Fishers
Others
Total 100.0 2.7 5.7 4.7 2.5 4.1 70.3 10.0
15–24 21.5 0.3 0.8 1.1 0.5 0.8 15.1 2.9
25–34 24.1 0.8 1.7 1.5 0.8 1.4 15.5 2.4
35–64 42.0 1.4 2.8 1.9 1.1 1.6 29.6 3.7
65+ 12.3 0.2 0.5 0.2 0.1 0.3 10.1 0.9
Male 49.8 1.6 3.0 2.2 1.2 3.0 33.6 5.2
15–24 10.5 0.1 0.4 0.5 0.2 0.5 7.2 1.5
25–34 12.0 0.4 0.9 0.7 0.4 1.0 7.3 1.3
35–64 20.9 0.9 1.5 0.9 0.5 1.3 13.9 1.9
65+ 6.4 0.1 0.3 0.1 0.1 0.2 5.2 0.5
Female 50.2 1.1 2.7 2.6 1.3 1.1 36.7 4.8
15–24 11.1 0.1 0.4 0.7 0.2 0.3 7.9 1.4
25–34 12.1 0.4 0.8 0.8 0.4 0.4 8.2 1.1
35–64 21.2 0.5 1.3 1.0 0.5 0.4 15.7 1.8
65+ 5.9 0.1 0.2 0.1 0.0 0.1 4.9 0.5

33
Chapter Five
Housing and Household Characteristics
5.1 Overview
This chapter presents information on household headed by persons with disability in relation
to the housing conditions, household size and ownership of assets. Household tenure and
Social Security Fund Membership are also explained in this chapter.
5.2 Household Headship
Figure 5:1 indicates the distribution of households headed by persons with disability by area
and sex of household head. Results show that the household headship for persons with
disability differs significantly between males and females. The proportion of households
headed by males with disability was 68.3 percent of all household headed by persons with
disability. Females with disability headed the remaining 31.7 percent of the households. The
same results were observed for general household headship 33.4 percent headed by female.

34
Figure 5. 1: Percentage Distribution of Household Headed by Persons with Disability
by Area and Sex of Head; Tanzania, 2012 Census
5.3 Housing Conditions
This part describes the source of energy used for lighting, toilets facility and tenure of the
households headed by persons with disability.
5.3.1 Sources of Energy for Lighting
The main sources of energy for lighting in Tanzania are kerosene, firewood, electricity, solar
energy and candles. Figure 5.2 shows that the proportion of household using electricity
(Tanesco/Zeco) is lower among households headed by persons with disabilities than those
headed by persons without disability (14.7 percent 20.1presents respectively). There is no
remarkable difference regarding the uses of kerosene (lantern/Chimney) (16.6 percent for
HoH with disability and 17.6 percent of HoH without disability and Torch/Rechargeable
Lamp (13.5 percent for HoH with disability and 14.7 percent of HoH without disability).
However , the proportion of those using kerosene (Wick Lamps) is higher among household

35
headed by persons with disability 46.7 percent compared to those household headed by
persons without disability 39.9 percent.
Figure 5. 2: Main Sources of Energy for Lighting by Disability Status of Head;
Tanzania, 2012 Census

36
5.3.2 Toilet Facilities
Table 5.1 and 5.2 describes the types of toilet facilities used by households headed by persons with disablility and without disablility by area. Overall the
pit latrine without washable/soil slabs was the most common type of toilet facility used by households whether headed by Persons with or without. The
proportion of households that used this type of toilet was significantly higher (32.9 persons) for households headed by persons with disability than
households headed by persons without disability (29.8 percent).
The second most common toilet facility was pit latrine without slab/ open pit. Results indicate that 29.6 percent of households headed by person with
disablility were recorded to be using pit latrine without slab/ open pit compared to 26.5 percent of households headed by persons without disability. Pit
latrine with washable slab without lid was used by 9.4 percent and 11.0 percent of households headed by persons with and without disability respectively.
Results further indicate that 11.0 percent of households headed by persons with disability were using flush toilets against 14.5 percent of household’s
headed by persons without disability. However, the use of ventilated improved pit (VIP) latrine was higher for households headed by person without
disability (1.5 percent) than for households headed by person with disability (1.2).

37
Table 5. 1: Percentage Distribution of Households Headed by Persons with Disability by Type of Toilet Facility and Area; Tanzania, 2012
Census
Area
Total Type of Toilet Facility (Households Headed by Persons with Disability)
Flush/Pour to Piped Sewer System
Flush/ Pour to Septic Tank
Flush/ Pour to Covered Pit
Flush/Pour to Somewhere Else
Ventilated Improved Pit Latrine
Pit Latrine with Washable Slab with Lid
Pit Latrine with Washable Slab without Lid
Pit Latrine without Washable/ Soil Slab
Pit Latrine without Slab/Open Pit
Composting/Ecoson Latrine
Bucket No Facility/bush/ field/ beach
Tanzania 999,045 1.3 2.9 5.8 1.0 1.2 7.5 9.4 32.9 29.6 0.2 0.0 8.2
Rural 730,647 0.2 0.5 2.0 0.4 0.7 4.5 6.4 38.4 35.8 0.2 0.0 10.7
Urban 268,398 4.2 9.4 16.1 2.5 2.6 15.4 17.7 17.7 12.8 0.1 0.0 1.3
Tanzania Mainland 977,414 1.2 2.8 5.6 1.0 1.2 6.9 9.5 33.5 30.3 0.2 0.0 7.8
Rural 717,238 0.2 0.5 1.9 0.4 0.7 4.1 6.3 39.1 36.4 0.2 0.0 10.2
Urban 260,176 4.1 9.3 15.7 2.5 2.6 14.8 18.1 18.2 13.2 0.1 0.0 1.3
Tanzania Zanzibar 21,631 3.7 6.1 18.0 1.8 2.8 31.6 7.1 3.4 2.0 0.1 - 23.4
Rural 13,409 1.4 2.8 11.7 1.3 2.3 28.1 8.4 4.7 2.9 0.1 - 36.3
Urban 8,222 7.6 11.4 28.2 2.7 3.7 37.3 5.0 1.2 0.6 0.0 - 2.3

38
Table 5. 2: Percentage Distribution of Households Headed by Persons without Disability by Type of Toilet Facility and Area; Tanzania, 2012
Census
Area
Total Type of Toilet Facility (Households Headed by Persons Without Disablility)
Flush/Pour to Piped Sewer System
Flush/ Pour to Septic Tank
Flush/ Pour to Covered Pit
Flush/Pour to Somewhere Else
Ventilated Improved Pit Latrine
Pit Latrine with Washable Slab with Lid
Pit Latrine with Washable Slab without Lid
Pit Latrine without Washable/ Soil Slab
Pit Latrine without Slab/Open Pit
Composting/Ecoson Latrine
Bucket No Facility/bush/ field/ beach
Tanzania 8,277,952 1.7 4.1 7.3 1.3 1.5 8.7 11.0 29.8 26.5 0.2 0.0 7.8
Rural 5,461,656 0.3 0.6 2.2 0.5 0.8 4.5 6.4 38.1 35.0 0.2 0.0 11.4
Urban 2,816,296 4.6 11.0 17.1 2.9 3.0 16.9 20.0 13.7 9.9 0.1 0.0 0.8
Tanzania Mainland 8,049,371 1.6 4.1 6.9 1.3 1.5 8.0 11.2 30.5 27.2 0.2 0.0 7.5
Rural 5,337,403 0.2 0.5 2.0 0.4 0.7 3.9 6.4 38.9 35.8 0.2 0.0 10.8
Urban 2,711,968 4.4 11.0 16.7 2.9 2.9 16.1 20.6 14.2 10.3 0.1 0.0 0.8
Tanzania Zanzibar 228,581 4.9 7.4 20.5 2.4 3.0 31.7 6.9 2.7 1.6 0.1 0.0 18.8
Rural 124,253 2.2 3.8 13.3 1.6 2.3 27.9 8.8 4.2 2.5 0.1 0.0 33.4
Urban 104,328 8.2 11.7 29.1 3.4 3.9 36.3 4.6 0.9 0.4 0.0 0.0 1.5

39
5.3.3 Distribution of Households by Tenure and Disability status
The ownership of dwelling is a good indicator of households’ socioeconomic status. Table 5.3 and
5.4 shows the distribution of household by tenure and disability status of the households headed by
persons with and without disability by residence. The table indicates that there was a big difference
in the ownership of dwellings between households headed by persons with and without disability
with 80.4 and 73.7 percent respectively.
Table 5. 3: Percentage Distribution of Households Headed by Persons with Disability by
Area, Tenure and Disability Status; Tanzania, 2012 Census
Area Total
Households Headed by Persons with Disability
Owned by Household
Living without Paying
any Rent
Rented Privately
Rented by
Employer
Rented by Government
at Subsidized
Rent
Owned by Employer
(Free)
Owned by Employer
(Rent)
Tanzania 999,045 80.4 4.3 13.0 0.6 0.6 0.9 0.2
Rural 730,647 89.5 4.1 4.8 0.3 0.3 0.8 0.1
Urban 268,398 55.6 5.0 35.1 1.2 1.5 1.1 0.4
Tanzania Mainland 977,414 80.4 4.2 13.1 0.6 0.6 0.9 0.2
Rural 717,238 89.5 4.0 4.9 0.4 0.3 0.8 0.1
Urban 260,176 55.1 4.8 35.8 1.2 1.5 1.1 0.4
Tanzania Zanzibar 21,631 81.7 10.0 6.1 0.5 0.9 0.7 0.1
Rural 13,409 88.3 9.1 1.4 0.2 0.2 0.7 0.1
Urban 8,222 70.9 11.5 13.7 0.9 2.1 0.6 0.2

40
Table 5. 4: Percentage Distribution of Households Headed by Persons without Disability
by Area, Tenure and Disability Status; Tanzania, 2012 Census
Area Total
Households Headed by Persons without Disability
Owned by Household
Living without Paying
any Rent
Rented Privately
Rented by
Employer
Rented by Government
at Subsidized
Rent
Owned by Employer
(Free)
Owned by Employer
(Rent)
Tanzania 8,277,952 73.7 4.4 19.0 0.8 0.9 1.0 0.3
Rural 5,461,656 87.6 4.1 6.4 0.5 0.4 0.9 0.2
Urban 2,816,296 46.8 5.0 43.3 1.5 1.8 1.1 0.4
Tanzania Mainland 8,049,371 73.6 4.2 19.3 0.8 0.9 1.0 0.3
Rural 5,337,403 87.5 4.0 6.5 0.5 0.4 0.9 0.2
Urban 2,711,968 46.1 4.7 44.3 1.5 1.8 1.1 0.4
Tanzania Zanzibar 228,581 77.9 10.2 8.9 0.7 1.2 0.8 0.3
Rural 124,253 88.5 8.3 1.7 0.3 0.3 0.8 0.1
Urban 104,328 65.2 12.6 17.5 1.2 2.2 0.8 0.4
In both Tanzania Mainland and Tanzania Zanzibar, the proportion of households owning dwelling
was much higher for households headed by persons with disability than for households headed by
person without disability. In Tanzania Zanzibar the proportion of households owning dwelling was
81.7 percent for households headed by person with disability and 77.9 percent for household
headed by person without disability. In Tanzania Mainland the proportion of ownership of
dwellings was much higher for household headed by persons with disability (80.4 percent) than for
household headed by persons without disability (73.6 percent). Moreover results show that in
Tanzania rural more household headed by persons with disability were recorded to have owned
their dwellings (89.5 persons) compared to those in urban areas (55.6 percent).

41
5.4 Social Security Scheme Membership
Social security scheme is the government program aimed at providing basic needs to citizens in
times of trouble including retirement, unemployment, and disability. Social Security Scheme
includes both Social Security Fund and Medical Security Fund.
Table 5.4 shows percentage distribution of households headed by persons with disability by social
security scheme membership. Results show that 10 percent of all household headed by person with
disability were members in one of the social security scheme. The Scheme which were recorded to
have more members than other Schemes were the National Health Insurance Fund (NHIF) and
Community Health Fund (CHF) (5.6 percent). Urban areas had a higher number of households
headed by persons with disability who had a membership in at least one of the Social Security
Schemes (14.9 percent) than in rural areas (7.6 percent). Tanzania Zanzibar had a higher proportion
of households headed by persons with disability who were Members in one of the Social Security
Schemes (15.5 percent) compared with the proportion of the same type of households in Tanzania
Mainland (9.4 percent).
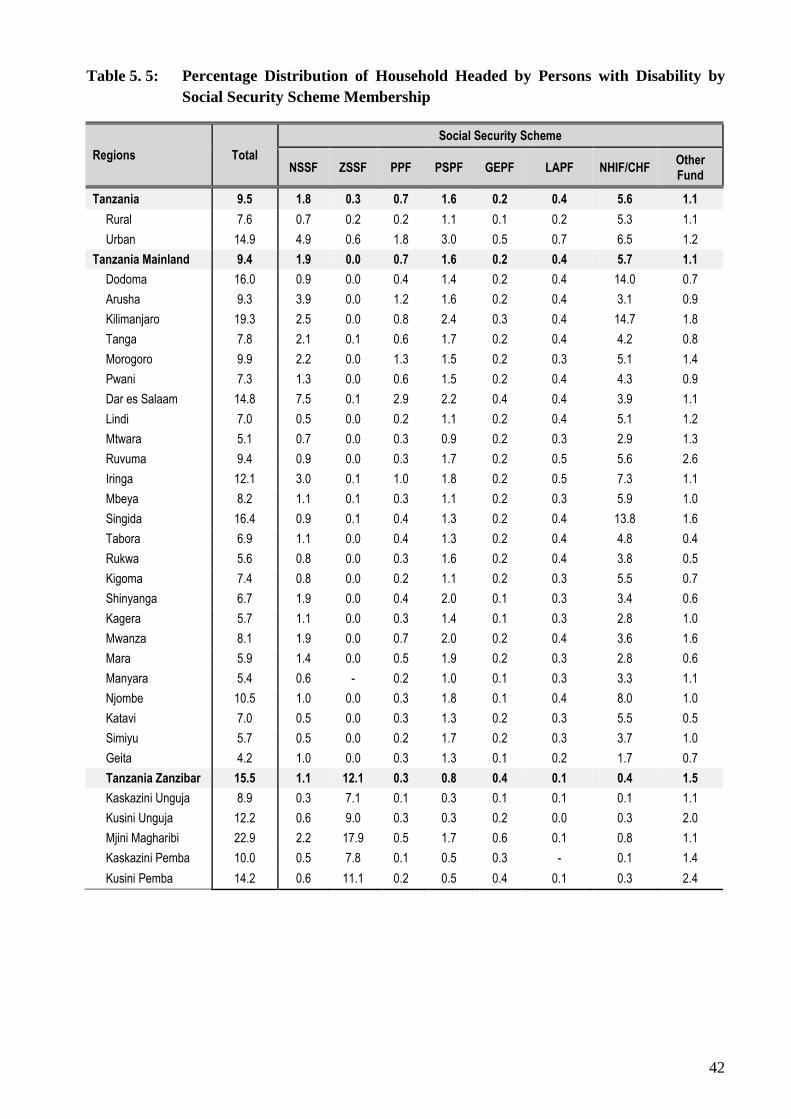
42
Table 5. 5: Percentage Distribution of Household Headed by Persons with Disability by
Social Security Scheme Membership
Regions Total
Social Security Scheme
NSSF ZSSF PPF PSPF GEPF LAPF NHIF/CHF Other Fund
Tanzania 9.5 1.8 0.3 0.7 1.6 0.2 0.4 5.6 1.1
Rural 7.6 0.7 0.2 0.2 1.1 0.1 0.2 5.3 1.1
Urban 14.9 4.9 0.6 1.8 3.0 0.5 0.7 6.5 1.2
Tanzania Mainland 9.4 1.9 0.0 0.7 1.6 0.2 0.4 5.7 1.1
Dodoma 16.0 0.9 0.0 0.4 1.4 0.2 0.4 14.0 0.7
Arusha 9.3 3.9 0.0 1.2 1.6 0.2 0.4 3.1 0.9
Kilimanjaro 19.3 2.5 0.0 0.8 2.4 0.3 0.4 14.7 1.8
Tanga 7.8 2.1 0.1 0.6 1.7 0.2 0.4 4.2 0.8
Morogoro 9.9 2.2 0.0 1.3 1.5 0.2 0.3 5.1 1.4
Pwani 7.3 1.3 0.0 0.6 1.5 0.2 0.4 4.3 0.9
Dar es Salaam 14.8 7.5 0.1 2.9 2.2 0.4 0.4 3.9 1.1
Lindi 7.0 0.5 0.0 0.2 1.1 0.2 0.4 5.1 1.2
Mtwara 5.1 0.7 0.0 0.3 0.9 0.2 0.3 2.9 1.3
Ruvuma 9.4 0.9 0.0 0.3 1.7 0.2 0.5 5.6 2.6
Iringa 12.1 3.0 0.1 1.0 1.8 0.2 0.5 7.3 1.1
Mbeya 8.2 1.1 0.1 0.3 1.1 0.2 0.3 5.9 1.0
Singida 16.4 0.9 0.1 0.4 1.3 0.2 0.4 13.8 1.6
Tabora 6.9 1.1 0.0 0.4 1.3 0.2 0.4 4.8 0.4
Rukwa 5.6 0.8 0.0 0.3 1.6 0.2 0.4 3.8 0.5
Kigoma 7.4 0.8 0.0 0.2 1.1 0.2 0.3 5.5 0.7
Shinyanga 6.7 1.9 0.0 0.4 2.0 0.1 0.3 3.4 0.6
Kagera 5.7 1.1 0.0 0.3 1.4 0.1 0.3 2.8 1.0
Mwanza 8.1 1.9 0.0 0.7 2.0 0.2 0.4 3.6 1.6
Mara 5.9 1.4 0.0 0.5 1.9 0.2 0.3 2.8 0.6
Manyara 5.4 0.6 - 0.2 1.0 0.1 0.3 3.3 1.1
Njombe 10.5 1.0 0.0 0.3 1.8 0.1 0.4 8.0 1.0
Katavi 7.0 0.5 0.0 0.3 1.3 0.2 0.3 5.5 0.5
Simiyu 5.7 0.5 0.0 0.2 1.7 0.2 0.3 3.7 1.0
Geita 4.2 1.0 0.0 0.3 1.3 0.1 0.2 1.7 0.7
Tanzania Zanzibar 15.5 1.1 12.1 0.3 0.8 0.4 0.1 0.4 1.5
Kaskazini Unguja 8.9 0.3 7.1 0.1 0.3 0.1 0.1 0.1 1.1
Kusini Unguja 12.2 0.6 9.0 0.3 0.3 0.2 0.0 0.3 2.0
Mjini Magharibi 22.9 2.2 17.9 0.5 1.7 0.6 0.1 0.8 1.1
Kaskazini Pemba 10.0 0.5 7.8 0.1 0.5 0.3 - 0.1 1.4
Kusini Pemba 14.2 0.6 11.1 0.2 0.5 0.4 0.1 0.3 2.4

43
Chapter Six
Summary, Recommendations And Conclusion
6. 1 Summary
The 2012 Population and Housing Census like its predecessor of 2002 included questions on
disability status. Unlike the 2002 Census impairment based questions, those of 2012 Census based
questions examined activity limitations and their impact to the lives of persons with disability. The
2012 PHC results allow not only an evaluation of the magnitude and prevalence of disability levels
in the country but also facilitate a critical examination of the opportunities offered to persons with
disability and their involvement and participation in different activities.
The general picture generated by the results of 2012 PHC indicates that, persons with disability
were disadvantaged across indicators: education, employment, health care and rehabilitation
services and provisions. The need for reliable data on disability cannot be overstated. There is no
doubt that lack of reliable information has negative impact on the planning for the provision of
services to persons with disability in the country as well as the creation of an enabling environment
for the equalization of opportunities. However, PHC is not the best mechanism for collecting
information on disability. Disability is a complex subject and due to its national scale, PHC can
only include a few questions. A dedicated disability survey is a vital source of information.
6.2 Recommendations
Disability is a new dimension in the history of census in Tanzania. Structure of
questions and knowledge of disability issues, among other concerns affect data
adequacy, quality and reliability. The National Bureau of Statistics is encouraged to
involve disability experts, service providers and persons with disability themselves in
the planning and implementation of data collection activity.
Given the complexity of census exercise and its national scale, only a few variables
on disability can be accommodated. The Ministry responsible for disability and the
National Bureau of Statistics in collaboration with development partners should carry
an inter census dedicated disability survey that would capture more variables and
thus generate more information.
Majority of persons with disability live in rural areas while most services are
concentrated in urban locations. This is an anomaly which infringes the right of
persons with disability living in rural areas to receive the services they deserve.
Ministries responsible for disability and local government should as a matter of

44
urgency take measures to reverse this trend. Deliberate efforts should be made by the
government and non-governmental organizations to provide comprehensive
community based services to persons with disability
The problem of disability in the country could be effectively mitigated overtime
through the introduction of early intervention services. Lack of early intervention
services exacerbates the problem of disability. There is a need for the government to
take concerted efforts to make early intervention a permanent agenda in health-
education-social welfare services planning and implementation. Disabled Persons
Organizations (DPOs) and Pro Disability Organizations (PDOs) should ensure that
the government honours its obligation.
“Nothing for us without us” is not just a slogan. It is a serious call and a reminder to
stakeholders and in particular the government to make equalization and quality of life
a meaningful reality in the lives of persons with disability. The government needs to
take measures to ensure that persons with disability through their organizations are
fully involved, represented and participate in the planning and implementation of
policies and programmes and in particular those that affect them.

45
6.3 Conclusion:
The findings of 2012 PHC reveal that Tanzania has 34,075,839 people aged 7 years or above of
whom 3,157,516 are persons with disability representing 9.3 percent of the population aged 7 years
or above. The analysis of the census data excludes children with disabilities aged 0-7 years since,
according to the Washington Group on Disability Statistics, this age group cannot fully explain the
difficulties they experience. PHC is, admittedly, a powerful tool for gathering data and information
required for among other things, development planning and services provision. Due to its national
scale, a census can only accommodate a few variables on disability. The findings however
underscore the disadvantaged position people with disability experience as far as participation and
access to basic services is concerned. The findings show, inter alia, that the majority of persons
with disability (0-14 years and 65 years or above) cannot fend for themselves and most of them live
in rural areas with little or no access to services and support. A larger proportion of them are
women (44.1 percent of 65 years or above are married). This was followed by those who were
widowed accounting for 39.2 percent and the never married 6.9 percent.
Generally the proportion of children with disabilities attending school is low. With respect to
housing characteristics and utilities the results show that persons with disability lagged far behind
in the ownership of houses and use of utilities.
These findings constitute a final work-up call for the government and stakeholders to implement
the existing policies which call for equalization of opportunities for persons with disabilities in all
spheres of life.

46
References
National Bureau of Statistics (NBS), 2003.The 2002 Population and Housing Census, General
Report, Dar es Salaam, Tanzania
National Bureau of Statistics (NBS), 2003.The 2002 Population and Housing Census, Age and Sex
Distribution Report, Dar es Salaam, Tanzania
National Bureau of Statistics (NBS), 2004.The 2002 Population and Housing Census, National
Basic Demographic and Socio-Economic Profile, Dar es Salaam, Tanzania
National Bureau of Statistics (NBS), 2006.The 2002 Population and Housing Census, Analytical
Report, Dar es Salaam, Tanzania
National Bureau of Statistics (NBS), 2008.The 2012 Population and Housing Census Management
and Implementation Strategy, Dar es Salaam, Tanzania
National Bureau of Statistics (NBS), 2013.The 2012 Population and Housing Census, Population
Distribution by Administrative Areas (Volume I), Dar es Salaam, Tanzania
National Bureau of Statistics (NBS), 2013.The 2012 Population and Housing Census, Population
Distribution by Age and Sex (Volume II), Dar es Salaam, Tanzania
National Bureau of Statistics (NBS), 2014.The 2012 Population and Housing Census, Basic
Demographic and Socio -Economic Profile, Dar es Salaam, Tanzania
National Bureau of Statistics (NBS), 2011, Tanzania Demographic and Health Survey 2010, Dar es
Salaam, Tanzania
UN (2008): Millennium Development Goals indicators: the official UN site for MDGs indicators
United Nations, 2008.Principles and Recommendations for Population and Housing Censuses,
New York, USA

47
Appendix 1: Different Table Generated from the Report
Table 1.1: Prevalence and Spatial Distribution of Persons with Disability of Age 7 Years
or Above by Regions and Rural/Urban Locations and Sex ; Tanzania, 2012
Census
Region Total Population Persons with disability
Total Male Female Total Male Female
Number % Number % Number %
Tanzania 34,075,839 16,387,574 17,688,265 3,157,516 9.3 1,487,595 9.1 1,669,921 9.4
Rural 23,523,202 11,385,252 12,137,950 2,334,761 9.9 1,107,438 9.7 1,227,323 10.1
Urban 10,552,637 5,002,322 5,550,315 822,755 7.8 380,157 7.6 442,598 8.0
Tanzania Mainland 33,070,387 15,908,612 17,161,775 3,084,091 9.3 1,453,367 9.1 1,630,724 9.5
Dodoma 1,579,387 759,783 819,604 179,892 11.4 84,717 11.2 95,175 11.6
Arusha 1,315,489 627,702 687,787 94,096 7.2 44,821 7.1 49,275 7.2
Kilimanjaro 1,331,763 638,475 693,288 163,391 12.3 76,248 11.9 87,143 12.6
Tanga 1,589,872 761,222 828,650 231,473 14.6 109,205 14.3 122,268 14.8
Morogoro 1,721,411 840,841 880,570 175,364 10.2 83,672 10.0 91,692 10.4
Pwani 857,524 414,574 442,950 89,386 10.4 41,402 10.0 47,984 10.8
Dar es Salaam 3,568,507 1,721,104 1,847,403 195,442 5.5 91,680 5.3 103,762 5.6
Lindi 692,537 327,416 365,121 52,447 7.6 24,121 7.4 28,326 7.8
Mtwara 1,016,815 472,111 544,704 105,000 10.3 47,562 10.1 57,438 10.5
Ruvuma 1,060,514 510,963 549,551 143,512 13.5 68,910 13.5 74,602 13.6
Iringa 738,127 349,849 388,278 78,379 10.6 36,143 10.3 42,236 10.9
Mbeya 2,089,738 987,858 1,101,880 124,988 6.0 55,925 5.7 69,063 6.3
Singida 1,014,792 497,682 517,110 96,585 9.5 45,848 9.2 50,737 9.8
Tabora 1,667,696 813,690 854,006 129,406 7.8 61,900 7.6 67,506 7.9
Rukwa 720,659 346,059 374,600 73,882 10.3 35,319 10.2 38,563 10.3
Kigoma 1,464,161 695,898 768,263 166,626 11.4 78,277 11.2 88,349 11.5
Shinyanga 1,125,848 544,274 581,574 99,732 8.9 47,757 8.8 51,975 8.9
Kagera 1,817,040 884,072 932,968 175,706 9.7 83,779 9.5 91,927 9.9
Mwanza 2,039,306 987,497 1,051,809 166,747 8.2 79,665 8.1 87,082 8.3
Mara 1,253,848 592,771 661,077 188,323 15.0 87,839 14.8 100,484 15.2
Manyara 1,059,185 530,779 528,406 46,046 4.3 22,512 4.2 23,534 4.5
Njombe 555,980 256,630 299,350 58,378 10.5 26,406 10.3 31,972 10.7
Katavi 404,797 199,285 205,512 42,095 10.4 20,521 10.3 21,574 10.5
Simiyu 1,135,392 533,614 601,778 104,492 9.2 48,964 9.2 55,528 9.2
Geita 1,249,999 614,463 635,536 102,703 8.2 50,174 8.2 52,529 8.3
Tanzania Zanzibar 1,005,452 478,962 526,490 73,425 7.3 34,228 7.1 39,197 7.4
Kaskazini Unguja 142,373 69,184 73,189 10,239 7.2 4,827 7.0 5,412 7.4
Kusini Unguja 89,985 44,283 45,702 6,860 7.6 3,266 7.4 3,594 7.9
Mjini Magharibi 467,812 219,992 247,820 27,658 5.9 12,561 5.7 15,097 6.1
Kaskazini Pemba 158,443 76,113 82,330 13,154 8.3 6,193 8.1 6,961 8.5
Kusini Pemba 146,839 69,390 77,449 15,514 10.6 7,381 10.6 8,133 10.5

48
Table 1.2: Percentage Distribution of Employed Persons with Disability by Industry, Sex and Age Group; Tanzania Mainland, 2012 Census
Age Group
Total
Commercial Agriculture, Food Crops and Forestry
Fishing Hunting Livestock and Other Related
Mining and Quarrying
Man
ufa
ctu
rin
g
Electricity Gas and Steam
Services for Clean Water Sewage and Environment
Co
nst
ruct
ion
Raw Food Sales (Uncooked Food)
Trade and Commerce
Haulage and Storage
Services for food Hotels and Lodges
Information and Communication
Financial Institution and Insurance
Public Administration and Security Services
Education Services
Health and Social Welfare Services
Domestic Services
Other Activities not listed
Total 100.0 67.5 3.0 2.5 2.6 0.3 0.7 1.9 2.8 5.9 1.0 1.5 0.3 0.6 0.9 1.3 0.5 4.9 1.8
15–24 21.6 14.4 0.7 0.5 0.5 0.1 0.2 0.4 0.5 1.3 0.2 0.3 0.1 0.1 0.1 0.1 0.0 1.6 0.5
25–34 24.1 14.8 0.8 0.6 0.9 0.1 0.2 0.7 0.9 1.6 0.3 0.5 0.1 0.2 0.3 0.5 0.1 1.0 0.5
35–64 41.9 28.5 1.2 1.1 1.1 0.1 0.3 0.8 1.2 2.4 0.4 0.6 0.1 0.3 0.5 0.7 0.3 1.7 0.7
65+ 12.4 9.8 0.2 0.3 0.2 0.0 0.1 0.1 0.1 0.6 0.0 0.1 0.0 0.0 0.1 0.0 0.0 0.6 0.1
Male 49.6 31.9 1.9 1.4 1.6 0.2 0.3 1.5 1.3 3.1 0.9 0.4 0.2 0.3 0.7 0.7 0.2 1.9 1.1
15–24 10.3 6.8 0.5 0.3 0.3 0.0 0.1 0.3 0.3 0.7 0.1 0.1 0.0 0.0 0.1 0.1 0.0 0.6 0.3
25–34 11.8 6.9 0.5 0.4 0.5 0.1 0.1 0.5 0.4 0.8 0.3 0.1 0.1 0.1 0.2 0.3 0.0 0.4 0.3
35–64 20.5 13.3 0.8 0.6 0.7 0.1 0.1 0.6 0.6 1.3 0.4 0.2 0.1 0.2 0.4 0.4 0.1 0.7 0.4
65+ 6.4 5.0 0.2 0.2 0.1 0.0 0.0 0.1 0.1 0.3 0.0 0.0 0.0 0.0 0.1 0.0 0.0 0.2 0.1
Female 50.4 35.5 1.0 1.1 1.1 0.1 0.4 0.4 1.4 2.8 0.2 1.0 0.1 0.3 0.2 0.6 0.3 3.0 0.7
15–24 11.2 7.6 0.3 0.2 0.3 0.0 0.1 0.1 0.3 0.6 0.0 0.2 0.0 0.1 0.0 0.1 0.0 1.0 0.2
25–34 12.2 8.0 0.3 0.3 0.4 0.0 0.1 0.1 0.5 0.8 0.1 0.3 0.0 0.1 0.1 0.2 0.1 0.7 0.2
35–64 21.1 15.2 0.4 0.5 0.4 0.0 0.2 0.2 0.6 1.1 0.1 0.4 0.0 0.1 0.1 0.3 0.2 1.1 0.3
65+ 5.9 4.8 0.1 0.1 0.1 0.0 0.0 0.0 0.1 0.3 0.0 0.0 0.0 0.0 0.0 0.0 0.0 0.3 0.0

49
Table 1.3: Percentage Distribution of Employed Persons with Disability by Industry, Sex and Age Group; Tanzania Zanzibar, 2012 Census.
Age Group
Total
Commercial Agriculture, Food Crops and Forestry
Fishing Hunting Livestoc
k and Other
Related
Mining and
Quarrying
Man
ufa
ctu
rin
g
Electricity Gas and
Steam
Services for
Clean Water
Sewage and
Environment
Co
nst
ruct
ion
Raw Food Sales
(Uncooked
Food)
Trade and
Commerce
Haulage
and Stora
ge
Services for food
Hotels and
Lodges
Information and Communication
Financial
Institution and
Insurance
Public Administration
and Securit
y Service
s
Education Services
Health
and Soci
al Welfare
Services
Domestic Services
Other Activities not listed
Total 100.0 39.8 8.3 1.5 6.6 0.6 1.2 3.9 7.3 4.7 2.6 5.5 0.9 1.2 4.4 4.0 1.0 3.1 3.4
15–24 14.3 5.0 1.8 0.3 1.1 0.0 0.3 0.9 1.0 0.7 0.3 0.8 0.1 0.1 0.3 0.2 - 0.9 0.6
25–34 24.3 6.8 2.2 0.3 1.9 0.2 0.4 1.3 1.8 1.3 1.0 1.8 0.2 0.3 1.4 1.5 0.2 0.7 1.0
35–64 52.6 22.2 3.6 0.9 3.2 0.4 0.6 1.7 4.1 2.4 1.2 2.7 0.6 0.7 2.7 2.3 0.7 1.2 1.5
65+ 8.8 5.8 0.6 0.0 0.4 0.0 0.0 0.1 0.5 0.2 0.1 0.2 0.1 0.0 0.1 0.1 0.1 0.2 0.2
Male 58.5 19.5 7.3 0.9 3.6 0.4 0.7 3.6 4.8 3.0 2.3 2.6 0.6 0.7 3.6 1.6 0.5 0.5 2.2
15–24 8.9 2.9 1.7 0.2 0.5 0.0 0.2 0.8 0.7 0.5 0.3 0.3 0.1 0.0 0.2 0.0 - 0.1 0.4
25–34 15.2 3.8 2.0 0.3 1.0 0.1 0.2 1.2 1.2 0.8 0.9 1.0 0.1 0.2 1.1 0.5 0.0 0.1 0.7
35–64 29.1 9.6 3.1 0.5 1.9 0.3 0.3 1.5 2.6 1.6 1.1 1.1 0.3 0.4 2.2 1.0 0.4 0.2 1.0
65+ 5.3 3.3 0.6 - 0.2 0.0 0.0 0.1 0.3 0.1 0.1 0.1 0.1 - 0.1 0.1 0.1 0.1 0.2
Female 41.5 20.3 0.9 0.5 3.1 0.2 0.5 0.3 2.5 1.7 0.2 3.0 0.4 0.5 0.8 2.4 0.5 2.5 1.2
15–24 5.4 2.2 0.1 0.1 0.6 - 0.1 0.1 0.3 0.2 0.0 0.5 0.1 0.1 0.0 0.2 - 0.8 0.2
25–34 9.1 3.0 0.3 0.1 0.9 0.1 0.1 0.1 0.6 0.5 0.1 0.8 0.0 0.1 0.3 0.9 0.2 0.6 0.4
35–64 23.5 12.6 0.5 0.4 1.3 0.2 0.2 0.1 1.5 0.8 0.1 1.6 0.3 0.3 0.4 1.3 0.3 1.0 0.6
65+ 3.5 2.5 0.0 0.0 0.3 - - 0.1 0.1 0.1 - 0.1 - 0.0 0.0 - 0.0 0.1 0.1

50
Table 1.4: Percentage Distribution of Employed Persons with Disability by Industry, Sex and Age Group; Tanzania Rural, 2012 Census
Age Group
Total
Commercial
Agriculture,
Food Crops and
Forestry
Fishing
Hunting
Livestock and
Other Relat
ed
Mining and
Quarrying
Man
ufa
ctu
rin
g
Electricity Gas and
Steam
Services for Clean Water
Sewage and
Environment
Co
nst
ruct
ion
Raw Food Sales
(Uncooked
Food)
Trade and Com
merce
Haulage and
Storage
Services for food
Hotels and
Lodges
Information and
Communication
Financial
Institution and
Insurance
Public Administration
and Security Services
Education
Services
Health and
Social Welfar
e Servic
es
Domestic
Services
Other Activitie
s not listed
Total 100.0 77.6 3.2 2.2 1.2 0.1 0.3 1.0 1.1 4.8 0.4 0.7 0.1 0.3 0.4 0.9 0.2 4.5 0.9
15–24 22.3 16.9 0.9 0.5 0.3 0.0 0.1 0.2 0.2 1.1 0.1 0.2 0.0 0.1 0.0 0.1 0.0 1.3 0.3
25–34 22.4 16.9 0.9 0.5 0.3 0.0 0.1 0.3 0.3 1.1 0.1 0.2 0.0 0.1 0.1 0.3 0.1 0.9 0.2
35–64 41.5 32.5 1.2 0.9 0.5 0.1 0.1 0.4 0.5 1.9 0.2 0.3 0.0 0.1 0.2 0.4 0.1 1.7 0.3
65+ 13.8 11.4 0.3 0.3 0.1 0.0 0.0 0.1 0.1 0.6 0.0 0.0 0.0 0.0 0.0 0.0 0.0 0.6 0.1
Male 48.8 36.8 2.1 1.2 0.7 0.1 0.1 0.8 0.5 2.4 0.3 0.3 0.1 0.2 0.3 0.5 0.1 1.9 0.5
15–24 10.8 8.0 0.6 0.2 0.1 0.0 0.0 0.2 0.1 0.5 0.1 0.1 0.0 0.0 0.0 0.0 0.0 0.6 0.2
25–34 10.8 7.8 0.6 0.3 0.2 0.0 0.0 0.2 0.2 0.6 0.1 0.1 0.0 0.0 0.1 0.2 0.0 0.4 0.1
35–64 20.0 15.1 0.8 0.5 0.3 0.0 0.1 0.3 0.2 1.0 0.1 0.1 0.0 0.1 0.2 0.3 0.1 0.7 0.2
65+ 7.1 5.8 0.2 0.2 0.1 0.0 0.0 0.0 0.0 0.3 0.0 0.0 0.0 0.0 0.0 0.0 0.0 0.3 0.1
Female 51.2 40.9 1.1 1.0 0.5 0.0 0.2 0.2 0.6 2.4 0.1 0.4 0.0 0.2 0.1 0.3 0.1 2.6 0.4
15–24 11.5 8.9 0.3 0.2 0.1 0.0 0.1 0.1 0.1 0.6 0.0 0.1 0.0 0.0 0.0 0.0 0.0 0.7 0.1
25–34 11.6 9.1 0.3 0.2 0.1 0.0 0.0 0.1 0.2 0.6 0.0 0.1 0.0 0.0 0.0 0.1 0.0 0.5 0.1
35–64 21.4 17.3 0.4 0.4 0.2 0.0 0.1 0.1 0.2 1.0 0.0 0.2 0.0 0.1 0.0 0.2 0.1 1.0 0.1
65+ 6.7 5.6 0.1 0.1 0.0 0.0 0.0 0.0 0.0 0.3 0.0 0.0 0.0 0.0 0.0 0.0 0.0 0.3 0.0
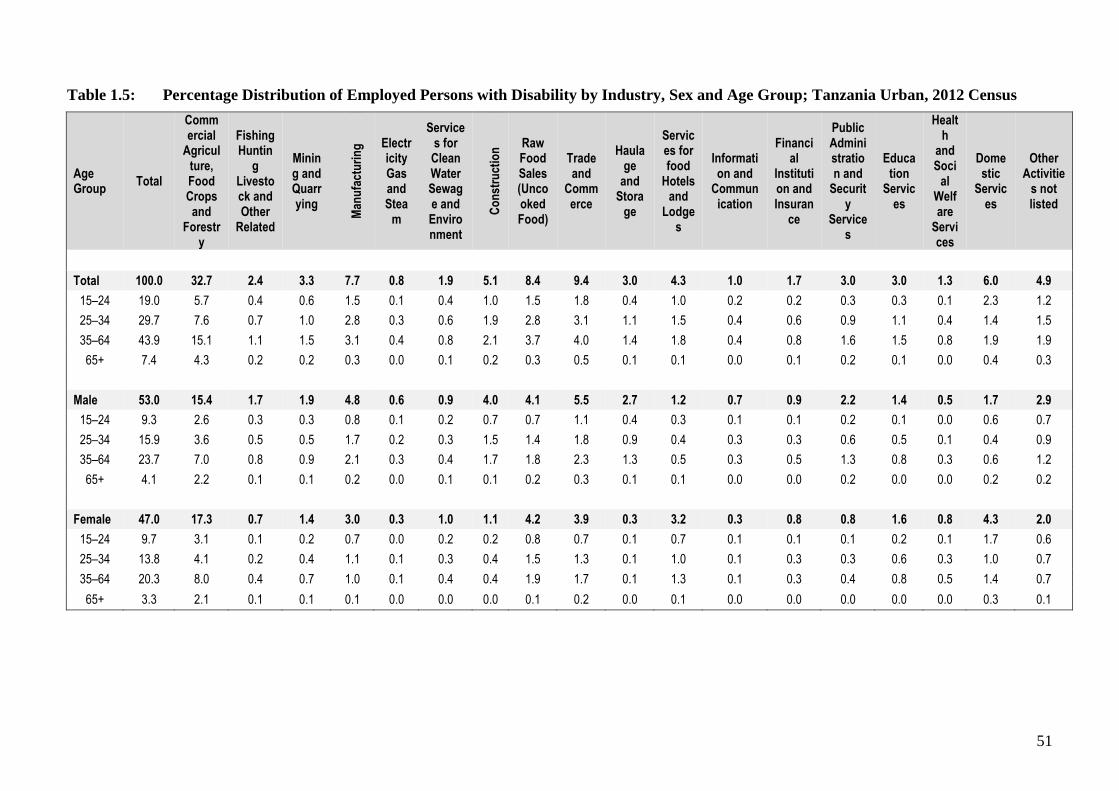
51
Table 1.5: Percentage Distribution of Employed Persons with Disability by Industry, Sex and Age Group; Tanzania Urban, 2012 Census
Age Group
Total
Commercial
Agriculture, Food Crops and
Forestry
Fishing Huntin
g Livestock and Other
Related
Mining and Quarrying
Man
ufa
ctu
rin
g Electr
icity Gas and Stea
m
Services for
Clean Water Sewage and Environment
Co
nst
ruct
ion
Raw Food Sales (Uncooked Food)
Trade and
Commerce
Haulage
and Stora
ge
Services for food
Hotels and
Lodges
Information and
Communication
Financial
Institution and Insuran
ce
Public Administration and
Security
Services
Education
Services
Health
and Soci
al Welfare
Services
Domestic
Services
Other Activitie
s not listed
Total 100.0 32.7 2.4 3.3 7.7 0.8 1.9 5.1 8.4 9.4 3.0 4.3 1.0 1.7 3.0 3.0 1.3 6.0 4.9
15–24 19.0 5.7 0.4 0.6 1.5 0.1 0.4 1.0 1.5 1.8 0.4 1.0 0.2 0.2 0.3 0.3 0.1 2.3 1.2
25–34 29.7 7.6 0.7 1.0 2.8 0.3 0.6 1.9 2.8 3.1 1.1 1.5 0.4 0.6 0.9 1.1 0.4 1.4 1.5
35–64 43.9 15.1 1.1 1.5 3.1 0.4 0.8 2.1 3.7 4.0 1.4 1.8 0.4 0.8 1.6 1.5 0.8 1.9 1.9
65+ 7.4 4.3 0.2 0.2 0.3 0.0 0.1 0.2 0.3 0.5 0.1 0.1 0.0 0.1 0.2 0.1 0.0 0.4 0.3
Male 53.0 15.4 1.7 1.9 4.8 0.6 0.9 4.0 4.1 5.5 2.7 1.2 0.7 0.9 2.2 1.4 0.5 1.7 2.9
15–24 9.3 2.6 0.3 0.3 0.8 0.1 0.2 0.7 0.7 1.1 0.4 0.3 0.1 0.1 0.2 0.1 0.0 0.6 0.7
25–34 15.9 3.6 0.5 0.5 1.7 0.2 0.3 1.5 1.4 1.8 0.9 0.4 0.3 0.3 0.6 0.5 0.1 0.4 0.9
35–64 23.7 7.0 0.8 0.9 2.1 0.3 0.4 1.7 1.8 2.3 1.3 0.5 0.3 0.5 1.3 0.8 0.3 0.6 1.2
65+ 4.1 2.2 0.1 0.1 0.2 0.0 0.1 0.1 0.2 0.3 0.1 0.1 0.0 0.0 0.2 0.0 0.0 0.2 0.2
Female 47.0 17.3 0.7 1.4 3.0 0.3 1.0 1.1 4.2 3.9 0.3 3.2 0.3 0.8 0.8 1.6 0.8 4.3 2.0
15–24 9.7 3.1 0.1 0.2 0.7 0.0 0.2 0.2 0.8 0.7 0.1 0.7 0.1 0.1 0.1 0.2 0.1 1.7 0.6
25–34 13.8 4.1 0.2 0.4 1.1 0.1 0.3 0.4 1.5 1.3 0.1 1.0 0.1 0.3 0.3 0.6 0.3 1.0 0.7
35–64 20.3 8.0 0.4 0.7 1.0 0.1 0.4 0.4 1.9 1.7 0.1 1.3 0.1 0.3 0.4 0.8 0.5 1.4 0.7
65+ 3.3 2.1 0.1 0.1 0.1 0.0 0.0 0.0 0.1 0.2 0.0 0.1 0.0 0.0 0.0 0.0 0.0 0.3 0.1
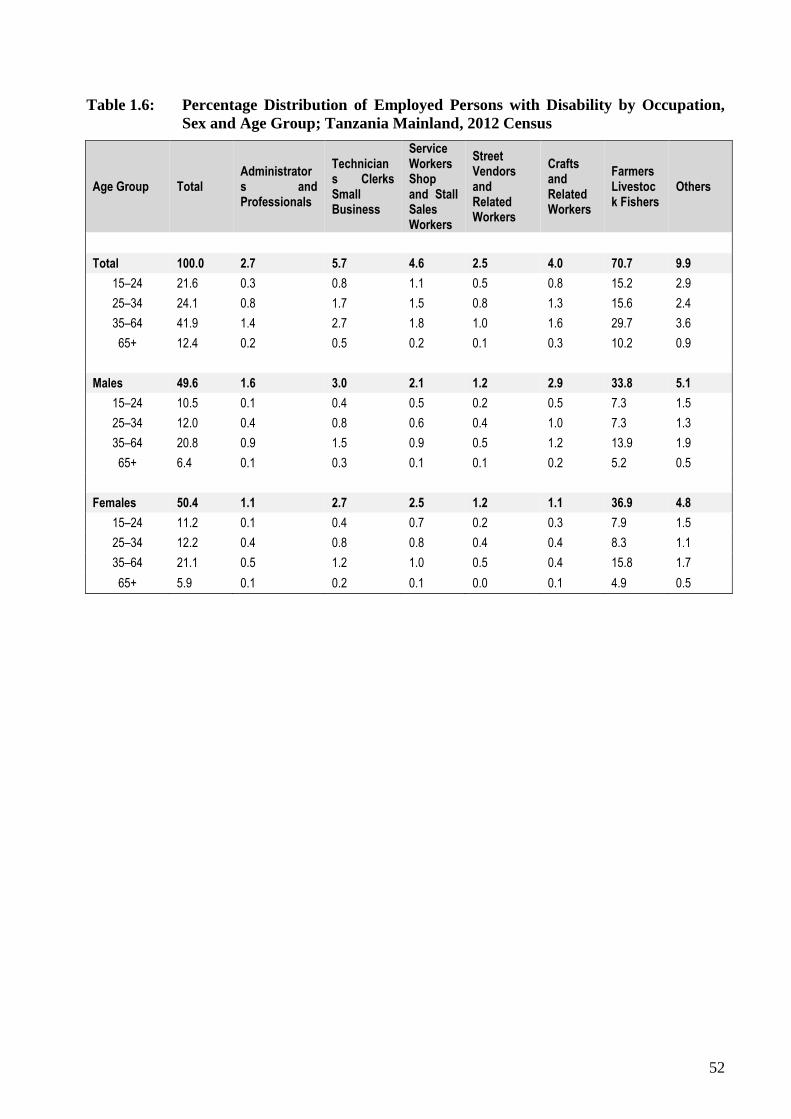
52
Table 1.6: Percentage Distribution of Employed Persons with Disability by Occupation,
Sex and Age Group; Tanzania Mainland, 2012 Census
Age Group Total Administrators and Professionals
Technicians Clerks Small Business
Service Workers Shop and Stall Sales Workers
Street Vendors and Related Workers
Crafts and Related Workers
Farmers Livestock Fishers
Others
Total 100.0 2.7 5.7 4.6 2.5 4.0 70.7 9.9
15–24 21.6 0.3 0.8 1.1 0.5 0.8 15.2 2.9
25–34 24.1 0.8 1.7 1.5 0.8 1.3 15.6 2.4
35–64 41.9 1.4 2.7 1.8 1.0 1.6 29.7 3.6
65+ 12.4 0.2 0.5 0.2 0.1 0.3 10.2 0.9
Males 49.6 1.6 3.0 2.1 1.2 2.9 33.8 5.1
15–24 10.5 0.1 0.4 0.5 0.2 0.5 7.3 1.5
25–34 12.0 0.4 0.8 0.6 0.4 1.0 7.3 1.3
35–64 20.8 0.9 1.5 0.9 0.5 1.2 13.9 1.9
65+ 6.4 0.1 0.3 0.1 0.1 0.2 5.2 0.5
Females 50.4 1.1 2.7 2.5 1.2 1.1 36.9 4.8
15–24 11.2 0.1 0.4 0.7 0.2 0.3 7.9 1.5
25–34 12.2 0.4 0.8 0.8 0.4 0.4 8.3 1.1
35–64 21.1 0.5 1.2 1.0 0.5 0.4 15.8 1.7
65+ 5.9 0.1 0.2 0.1 0.0 0.1 4.9 0.5

53
Table 1.7: Percentage Distribution of Employed Persons with Disability by Occupation,
Sex and Age Group; Tanzania Zanzibar, 2012 Census
Age Group Total
Administrators and
Professionals
Technicians
Clerks Small
Business
Service Workers
Shop and Stall
Sales Workers
Street Vendors
and Related Workers
Crafts and
Related Workers
Farmers Livestock Fishers
Others
Total 100.0 4.6 9.5 16.6 4.2 8.9 43.0 13.2
15–24 14.3 0.2 0.7 2.2 0.6 1.8 6.3 2.5
25–34 24.3 1.3 2.8 5.0 1.1 2.7 8.2 3.2
35–64 52.6 2.9 5.7 8.6 2.3 4.1 22.7 6.4
65+ 8.8 0.2 0.4 0.7 0.2 0.4 5.7 1.2
Male 58.5 2.7 5.3 10.2 2.4 6.0 24.1 7.8
15–24 8.9 0.1 0.3 1.1 0.5 1.0 4.4 1.5
25–34 15.2 0.7 1.5 3.1 0.6 1.9 5.2 2.1
35–64 29.1 1.8 3.2 5.5 1.2 2.9 11.0 3.5
65+ 5.3 0.2 0.3 0.4 0.1 0.1 3.5 0.7
Female 41.5 1.8 4.2 6.4 1.8 2.9 18.9 5.4
15–24 5.4 0.1 0.3 1.1 0.2 0.7 1.9 1.0
25–34 9.1 0.5 1.3 1.9 0.5 0.8 3.0 1.1
35–64 23.5 1.1 2.5 3.1 1.0 1.2 11.7 2.8
65+ 3.5 0.1 0.1 0.3 0.1 0.3 2.2 0.5

54
Table 1.8: Percentage Distribution of Employed Persons with Disability by Occupation,
Sex and Age Group; Tanzania Rural, 2012 Census
Age Group Total Administrators
and Professionals
Technicians Clerks Small
Business
Service Workers
Shop and Stall Sales
Workers
Street Vendors
and Related Workers
Crafts and
Related Workers
Farmers Livestock Fishers
Others
Total 100.0 1.8 4.0 1.9 0.9 2.1 81.4 7.9
15–24 22.3 0.2 0.6 0.5 0.2 0.5 17.9 2.5
25–34 22.4 0.5 1.0 0.5 0.3 0.6 17.8 1.7
35–64 41.5 0.9 1.9 0.7 0.4 0.9 33.9 2.8
65+ 13.8 0.2 0.5 0.1 0.1 0.2 11.8 0.9
Male 48.8 1.0 2.1 0.8 0.4 1.5 39.0 4.0
15–24 10.8 0.1 0.3 0.2 0.1 0.3 8.6 1.3
25–34 10.8 0.3 0.5 0.2 0.1 0.4 8.4 0.9
35–64 20.0 0.6 1.0 0.3 0.2 0.7 15.9 1.4
65+ 7.1 0.1 0.3 0.1 0.0 0.1 6.1 0.5
Female 51.2 0.8 1.9 1.1 0.4 0.7 42.5 4.0
15–24 11.5 0.1 0.3 0.3 0.1 0.2 9.3 1.2
25–34 11.6 0.2 0.5 0.3 0.1 0.2 9.4 0.8
35–64 21.4 0.3 0.9 0.4 0.2 0.2 18.0 1.4
65+ 6.7 0.1 0.2 0.1 0.0 0.1 5.8 0.5

55
Table 1.9: Percentage Distribution of Employed Persons with Disability by Occupation,
Sex and Age Group; Tanzania Urban, 2012 Census
Age Group Total Administrators
and Professionals
Technicians Clerks Small
Business
Service Workers
Shop and Stall
Sales Workers
Street Vendors
and Related Workers
Crafts and
Related Workers
Farmers Livestock Fishers
Others
Total 100.0 5.7 11.4 14.2 7.8 10.5 33.9 16.5
15–24 19.0 0.4 1.5 3.3 1.4 2.1 6.0 4.3
25–34 29.7 1.9 3.8 4.7 2.7 3.9 7.9 4.8
35–64 43.9 3.1 5.7 5.7 3.3 4.1 15.6 6.4
65+ 7.4 0.2 0.5 0.5 0.3 0.4 4.5 1.0
Male 53.0 3.3 6.1 6.7 3.8 7.7 16.3 9.0
15–24 9.3 0.2 0.7 1.4 0.7 1.4 2.8 2.1
25–34 15.9 1.0 1.9 2.1 1.4 2.9 3.8 2.8
35–64 23.7 1.9 3.1 2.9 1.6 3.2 7.3 3.6
65+ 4.1 0.2 0.4 0.3 0.1 0.3 2.3 0.5
Female 47.0 2.3 5.3 7.5 3.9 2.8 17.7 7.5
15–24 9.7 0.3 0.7 1.9 0.7 0.8 3.2 2.2
25–34 13.8 0.9 1.8 2.5 1.4 1.0 4.1 2.0
35–64 20.3 1.2 2.6 2.9 1.7 0.9 8.2 2.8
65+ 3.3 0.1 0.2 0.2 0.1 0.1 2.2 0.4

56
Appendix 2: Census Questionnaires
Short Questionnaire
PHCF 2
FORM NO. OF
Region ……………… District……………….. Ward/Shehia………........... Village/Street …….................. EA
Please state the names of
all persons who spent the
census night, that is Sunday
26th August, 2012 in your
household, starting with the
name of the head of
household
(01) (02) 06 (09) (10) (11)
1
2
If an extra Questionnaire has been used put an "X" in the box
(08)
Does (NAME) have difficulty
remembering or concentrating?
No Difficulty = 1
Some Difficulty = 2
A lot of Difficulty = 3
Unable to Remember = 4
Not Applicable = 5
(07)
REMEMBERING
(03) (04) (05)
Does [NAME] have
difficulty walking or
climbing steps?
No Difficulty = 1
Some Difficulty = 2
A lot of Difficulty = 3
Unable to Walk = 4
Not Applicable = 5
WALKINGHEARINGALBINISMAGE
Does (NAME) have
difficulty hearing, even if
using a hearing aid?
No Difficulty = 1
Some Difficulty = 2
A lot of Difficulty = 3
Unable to Hear = 4
Not Applicable = 5
Does (NAME) have
difficulty seeing, even if
wearing glasses?
No Difficulty = 1
Some Difficulty = 2
A lot of Difficulty = 3
Unable to See = 4
Not Applicable = 5
STRICTLY CONFIDENTIAL
B: ALL PERSONS
No. HOUSEHOLD
MEMBERS
RELATIONSHIP TO
THE HEAD OF
HOUSEHOLD
SEX
Is [NAME] an
albino?
Yes = 1
No = 2
What is the relationship of
[NAME] to the head of
the household?
Head = 1
Spouse = 2
Son/Daughter = 3
Parent = 4
Grand Child = 5
Other Relative = 6
Not Related = 7
SEEING
Is [NAME] a
male or a
female?
MALE = 1
FEMALE = 2
HOUSEHOLD NO.
A: IDENTIFICATION
How old is [NAME]?
WRITE AND
SHADE AGE IN
COMPLETE
YEARS.
IF UNDER ONE
YEAR WRITE "00"
FOR 97 YEARS
AND ABOVE
WRITE '97'
THE UNITED REPUBLIC OF TANZANIA
2012 POPULATION AND HOUSING CENSUS
SHORT QUESTIONNAIRE
DISABILITY
Does (NAME) have difficulty
with self-care, such as washing
all over or dressing?
No Difficulty = 1
Some Difficulty = 2
A lot of Difficulty = 3
Unable to Care = 4
Not Applicable = 5
SELF-CARE
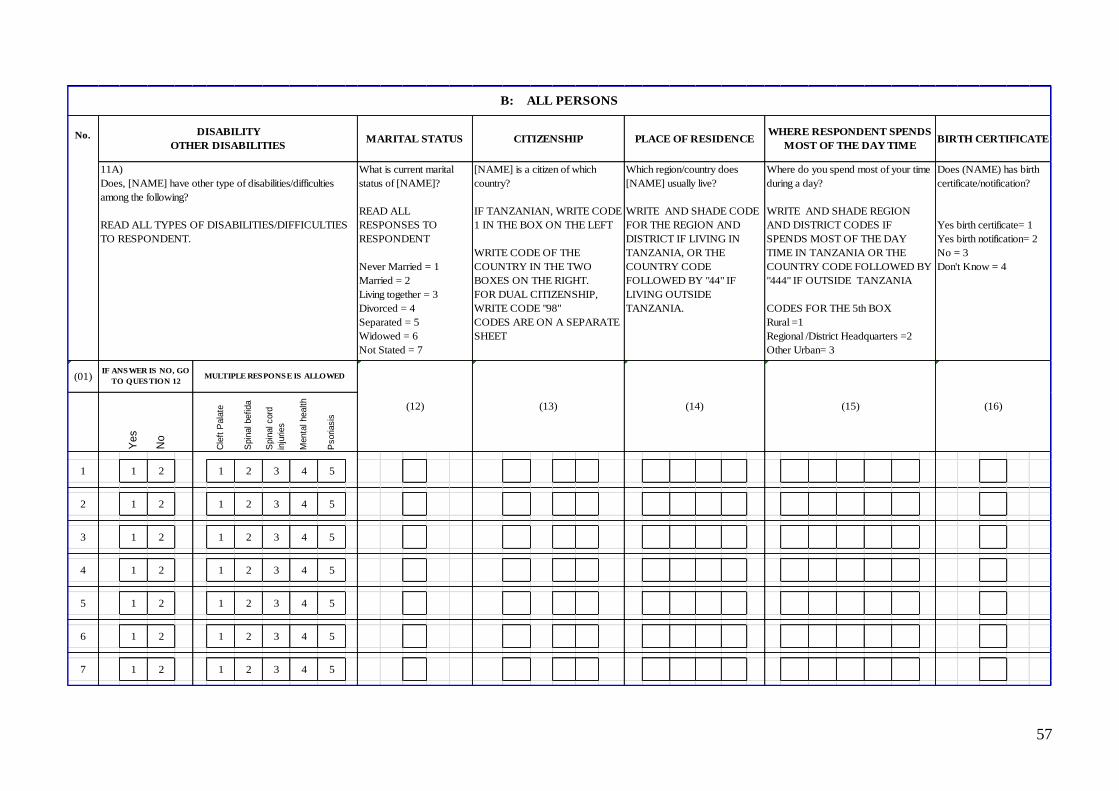
57
(01)
Ye
s
No
Cle
ft P
ala
te
Spin
al befida
Spin
al cord
inju
ries
Menta
l health
Psoriasis
1 1 2 1 2 3 4 5
2 1 2 1 2 3 4 5
3 1 2 1 2 3 4 5
4 1 2 1 2 3 4 5
5 1 2 1 2 3 4 5
6 1 2 1 2 3 4 5
7 1 2 1 2 3 4 5
B: ALL PERSONS
What is current marital
status of [NAME]?
READ ALL
RESPONSES TO
RESPONDENT
Never Married = 1
Married = 2
Living together = 3
Divorced = 4
Separated = 5
Widowed = 6
Not Stated = 7
[NAME] is a citizen of which
country?
IF TANZANIAN, WRITE CODE
1 IN THE BOX ON THE LEFT
WRITE CODE OF THE
COUNTRY IN THE TWO
BOXES ON THE RIGHT.
FOR DUAL CITIZENSHIP,
WRITE CODE "98"
CODES ARE ON A SEPARATE
SHEET
Which region/country does
[NAME] usually live?
WRITE AND SHADE CODE
FOR THE REGION AND
DISTRICT IF LIVING IN
TANZANIA, OR THE
COUNTRY CODE
FOLLOWED BY "44" IF
LIVING OUTSIDE
TANZANIA.
Where do you spend most of your time
during a day?
WRITE AND SHADE REGION
AND DISTRICT CODES IF
SPENDS MOST OF THE DAY
TIME IN TANZANIA OR THE
COUNTRY CODE FOLLOWED BY
"444" IF OUTSIDE TANZANIA
CODES FOR THE 5th BOX
Rural =1
Regional /District Headquarters =2
Other Urban= 3
PLACE OF RESIDENCE BIRTH CERTIFICATENo. WHERE RESPONDENT SPENDS
MOST OF THE DAY TIME
Does (NAME) has birth
certificate/notification?
Yes birth certificate= 1
Yes birth notification= 2
No = 3
Don't Know = 4
DISABILITY
OTHER DISABILITIES
11A)
Does, [NAME] have other type of disabilities/difficulties
among the following?
READ ALL TYPES OF DISABILITIES/DIFFICULTIES
TO RESPONDENT.
(12) (13) (14) (15)
MARITAL STATUS CITIZENSHIP
(16)
IF ANSWER IS NO, GO
TO QUESTION 12MULTIPLE RESPONSE IS ALLOWED

58
No.
(01) (17) (18)
1
2
3
4
5
6
7
8
C: EDUCATION: ALL PERSONS AGED 4 YEARS AND ABOVE
(19)
LITERACY EDUCATION ATTAINMENT LEVEL OF EDUCATION
Can [NAME] read and write
a short sentence in Kiswahili,
English, Kiswahili and English
or any other language?
Kiswahili = 1
English = 2
Kiswahili and English = 3
Other Languages = 4
Illiterate = 5
Are you/Is [NAME] currently attending, partially
attended, completed or never attended school?
Now attending =1
Partially attended =2
Completed =3
Never attended =4
IF THE ANSWER IS 'NEVER ATTENDED' SKIP TO
SECTION D
What level of education has [NAME]
completed or is currently attending?
WRITE AND SHADE THE
APPROPRIATE CODE.
CODES ARE IN SEPARATE
HANDBOOK

59
Yes = 1
No = 2
IF THE ANSWER IS YES, RECORD THE NUMBER OF DEATHS
(21) (22) (24) (25) (26) (27)
1
2
3
4
5
6
If number of death is more than 8, use an extra questionnaire
What was the cause
of death?
Road Accident = 1
Other Injuries = 2
Suicide = 3
Violence = 4
Sickness/Disease = 5
Martenal Death = 6
Other = 7
How old was the deceased at the
time of death?
WRITE AGE IN COMPLETED
YEARS. IF UNDER ONE YEAR
WRITE "00" IF IS 97 YEARS
OR ABOVE WRITE '97'
D: GENERAL AND MATERNAL DEATHS
IF THE ANSWER IS NO, SKIP TO SECTION E
(23)
PLEASE RECORD INFORMATION ON DEATHS THAT OCCURRED IN THE HOUSEHOLD DURING THE LAST 12 MONTHS.
DO NOT FORGET CHILDHOOD MORTALITY
Did the death occur during
pregnancy?
Yes = 1
No = 2
IF THE ANSWER IS YES,
SKIP TO SECTION E
Did the death occur during
childbirth
Yes = 1
No = 2
IF THE ANSWER IS YES
SKIP TO SECTION E
Did the death occur during
the 6 weeks period following
the end of pregnancy,
irrespective of the way the
pregnancy ended?
Yes = 1
No = 2
IF DEATH IS OF WOMAN AGED BETWEEN 12 AND 49 YEARS
(20) Was there any death which occurred in this household during the last 12 months?
Dea
th S
eria
l N
um
ber
Was the
deceased a male
or a female?
Male =1
Female =2

60
Yes No
Maize 1 2 Cattle
Paddy 1 2 Goats
Cassava 1 2 Sheeps
Banana 1 2 Poultry
Other Crops 1 2
Has/is any member of this
household operated/operating
any land for agricultural
purposes during 2011/12
agricultural year?
Yes = 1
No = 2
IF THE ANSWER IS NO,
SKIP TO QUESTION 30
Which of the following crops did the
household grow?
Was any member of this
household engaged in raising
cattle, goats, sheep or poultry
up to the census night?
Yes = 1
No = 2
IF THE ANSWER IS NO,
SKIP TO QUESTION 32
How many cattle, goats or sheep were
available during the Census night?
IF NO, WRITE AND SHADE CODE
"00000"
E: AGRICULTURE AND LIVESTOCK
Is there any member of this
household who is currently
engaged in fish farming?
Yes = 1
No = 2
AGRICULTURE LIVESTOCK FISH FARMING
(28) (29) (30) (31) (32)

61
33) Is there any person who was a member of this household currently living outside Tanzania?
Yes = 1
No = 2
34) Write the number of males and females living outside Tanzania?
CODES ARE IN SEPARATE HANDBOOK
1st
HH Member 6th
HH Member
2nd
HH Member 7th
HH Member
3rd
HH Member 8th
HH Member
4th
HH Member 9th
HH Member
5th
HH Member 10th
HH Member
IF THE NUMBER OF DIASPORA IS MORE THAN 10, USE EXTRA QUESTIONNAIRE
1st
HH Member 6th
HH Member
2nd
HH Member 7th
HH Member
3rd
HH Member 8th
HH Member
4th
HH Member 9th
HH Member
5th
HH Member 10th
HH Member
36) Have you or anyone in this household received remitance in the form of cash or in kind from them
during the last 12 months? Yes =1, No =2
F
IF THE ANSWER IS NO, SKIP TO SECTION G
F: CITIZENS IN DIASPORA
M
35) In which country are they living?

62
37) Is there a person in this household who is a member of the following social security funds?
Yes = 1
No = 2
Fund
National Social Security Fund (NSSF) =1
Zanzibar Social Security Fund (ZSSF) =2
Parastatal Pension Fund (PPF) =3
Public Service Pension Fund (PSPF) =4
Government Employee Provident Fund (GEPF) =5
Local Authority Pension Fund (LAPF) =6
National Health Insurance Fund/Community Health Fund (NHIF/CHF) =7
Other Funds =8
H: TOTAL NUMBER OF PERSONS IN THE HOUSEHOLD
Males
Females
Total
DATE HOUSEHOLD ENUMERATED
NAME OF SUPERVISOR
DATE OF EDITING QUESTIONNAIRE
IF THE ANSWER IS NO, GO TO SECTION H, MULTIPLE RESPONSE IS ALLOWED
Day Month
G: SOCIAL SECURITY FUNDS
Day Month

63
Long Questionnaire
FO RM NO . O F
A: IDENTIFICATION
Region ……………………… District………………..… Ward/Shehia……………..………… Village/Street ………………. EA .............................. HOUSEHOLD NO.
Please state the
names of all
persons who spent
the census night,
that is Sunday 26th
August, 2012 in
your household,
starting with the
name of the head
of household
(01) (02) '(06) (09) (10)
1
2
If an extra Questionnaire has been used put an "X" in the box
Does (NAME) have difficulty
remembering or
concentrating?
No Difficulty = 1
Some Difficulty = 2
A lot of Difficulty = 3
Unable to Remember = 4
Not Applicable = 5
Does (NAME) have
difficulty with self-care,
such as washing all over
or dressing?
No Difficulty = 1
Some Difficulty = 2
A lot of Difficulty = 3
Unable to Care = 4
Not Applicable = 5
(03) (04) (05) (07) (08) (11)
WALKING REMEMBERING SELFCARE
What is the
relationship of
[NAME] to the head
of the household?
Head = 1
Spouse = 2
Son/Daughter = 3
Parent = 4
Grand Child = 5
Other Relative = 6
Not Related = 7
Is [NAME]
a male or a
female?
Male = 1
Female = 2
How old is [NAME]?
WRITE AND
SHADE AGE IN
COMPLETE
YEARS.
IF UNDER ONE
YEAR WRITE "00"
FOR 97 YEARS
AND ABOVE
WRITE '97'
Is [NAME] an
albino?
Yes = 1
No = 2
Does (NAME) have
difficulty seeing,
even if wearing
glasses?
No Difficulty = 1
Some Difficulty = 2
A lot of Difficulty =
3
Unable to See = 4
Not Applicable = 5
Does (NAME) have
difficulty hearing,
even if using a
hearing aid?
No Difficulty = 1
Some Difficulty = 2
A lot of Difficulty =
3
Unable to Hear = 4
Not Applicable = 5
Does [NAME]
have difficulty
walking or climbing
steps?
No Difficulty = 1
Some Difficulty = 2
A lot of Difficulty =
3
Unable to Walk = 4
Not Applicable = 5
B: ALL PERSONS
No .
HOUSEHOLD
MEMBERS
RELATIONSHIP
TO THE HEAD
OF HOUSEHOLD
SEX AGE
DISABILITY
ALBINISM SEEING HEARING
PHCF 3
THE UNITED REPUBLIC OF TANZANIA
2012 POPULATION AND HOUSING CENSUS STRICTLY CONFIDENTIAL
LONG QUESTIONNAIRE

64
B: ALL PERSONS
(01)
Ye
s
No
Cle
ft P
ala
te
Spin
al befida
Spin
al cord
inju
ries
Menta
l health
Psoriasis
1 1 2 1 2 3 4 5
2 1 2 1 2 3 4 5
3 1 2 1 2 3 4 5
4 1 2 1 2 3 4 5
5 1 2 1 2 3 4 5
6 1 2 1 2 3 4 5
7 1 2 1 2 3 4 5
8 1 2 1 2 3 4 5
No.DISABILITY
OTHER DISABILITIES
11A)
Does, [NAME] have other type of disabilities/difficulties
among the following?
READ ALL TYPES OF DISABILITIES/DIFFICULTIES
TO RESPONDENT.
IF ANSWER IS NO, GO
TO QUESTION 12MULTIPLE RESPONSE IS ALLOWED
What is current marital
status of [NAME]?
READ ALL
RESPONSES TO
RESPONDENT
Never Married = 1
Married = 2
Living together = 3
Divorced = 4
Separated = 5
Widowed = 6
Not Stated = 7
[NAME] is a citizen of which
country?
IF TANZANIAN, WRITE
CODE 1 IN THE BOX ON
THE LEFT
WRITE CODE OF THE
COUNTRY IN THE TWO
BOXES ON THE RIGHT.
FOR DUAL CITIZENSHIP,
WRITE CODE "98"
CODES ARE ON A
SEPARATE SHEET
MARITAL STATUS CITIZENSHIP
(12) (13)
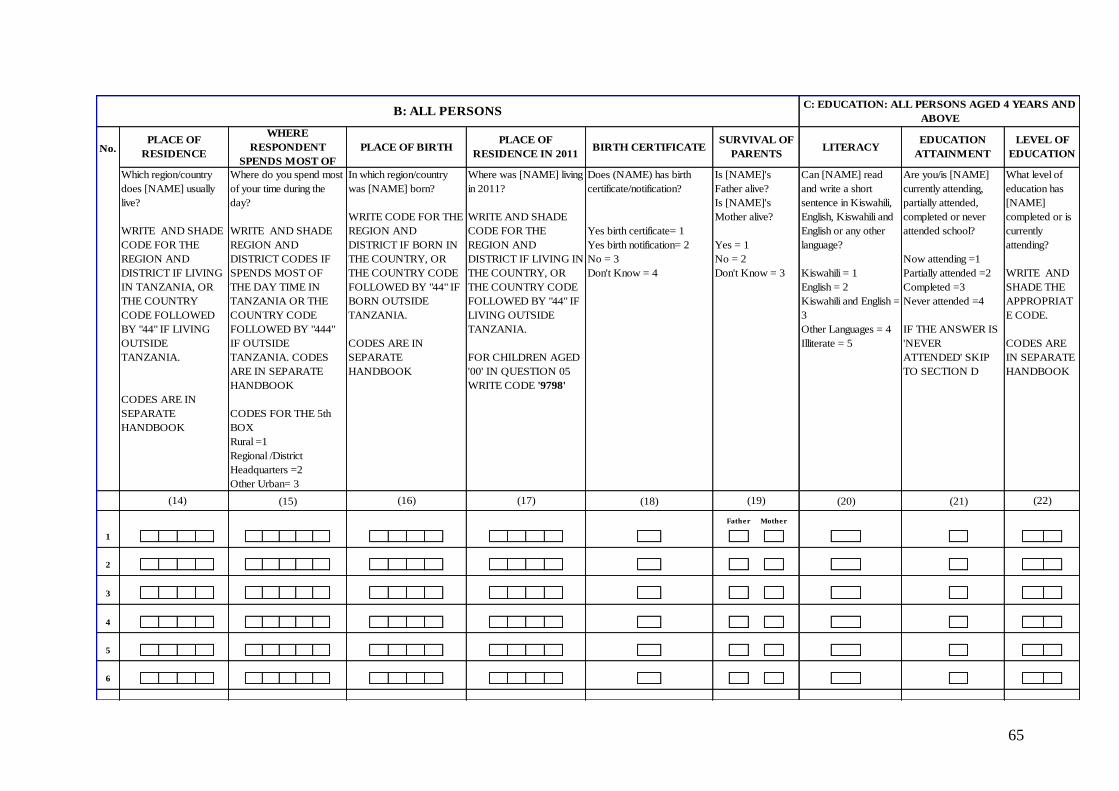
65
(15) (18) (20) (21)
Father Mother
1
2
3
4
5
6
C: EDUCATION: ALL PERSONS AGED 4 YEARS AND
ABOVE
LITERACYEDUCATION
ATTAINMENT
LEVEL OF
EDUCATION
Which region/country
does [NAME] usually
live?
WRITE AND SHADE
CODE FOR THE
REGION AND
DISTRICT IF LIVING
IN TANZANIA, OR
THE COUNTRY
CODE FOLLOWED
BY "44" IF LIVING
OUTSIDE
TANZANIA.
CODES ARE IN
SEPARATE
HANDBOOK
B: ALL PERSONS
PLACE OF
RESIDENCENo.
(22)(16)
PLACE OF
RESIDENCE IN 2011
Where was [NAME] living
in 2011?
WRITE AND SHADE
CODE FOR THE
REGION AND
DISTRICT IF LIVING IN
THE COUNTRY, OR
THE COUNTRY CODE
FOLLOWED BY "44" IF
LIVING OUTSIDE
TANZANIA.
FOR CHILDREN AGED
'00' IN QUESTION 05
WRITE CODE '9798'
PLACE OF BIRTH
In which region/country
was [NAME] born?
WRITE CODE FOR THE
REGION AND
DISTRICT IF BORN IN
THE COUNTRY, OR
THE COUNTRY CODE
FOLLOWED BY "44" IF
BORN OUTSIDE
TANZANIA.
CODES ARE IN
SEPARATE
HANDBOOK
Is [NAME]'s
Father alive?
Is [NAME]'s
Mother alive?
Yes = 1
No = 2
Don't Know = 3
What level of
education has
[NAME]
completed or is
currently
attending?
WRITE AND
SHADE THE
APPROPRIAT
E CODE.
CODES ARE
IN SEPARATE
HANDBOOK
(14) (19)(17)
Are you/is [NAME]
currently attending,
partially attended,
completed or never
attended school?
Now attending =1
Partially attended =2
Completed =3
Never attended =4
IF THE ANSWER IS
'NEVER
ATTENDED' SKIP
TO SECTION D
BIRTH CERTIFICATE
Does (NAME) has birth
certificate/notification?
Yes birth certificate= 1
Yes birth notification= 2
No = 3
Don't Know = 4
Can [NAME] read
and write a short
sentence in Kiswahili,
English, Kiswahili and
English or any other
language?
Kiswahili = 1
English = 2
Kiswahili and English =
3
Other Languages = 4
Illiterate = 5
WHERE
RESPONDENT
SPENDS MOST OF
Where do you spend most
of your time during the
day?
WRITE AND SHADE
REGION AND
DISTRICT CODES IF
SPENDS MOST OF
THE DAY TIME IN
TANZANIA OR THE
COUNTRY CODE
FOLLOWED BY "444"
IF OUTSIDE
TANZANIA. CODES
ARE IN SEPARATE
HANDBOOK
CODES FOR THE 5th
BOX
Rural =1
Regional /District
Headquarters =2
Other Urban= 3
SURVIVAL OF
PARENTS
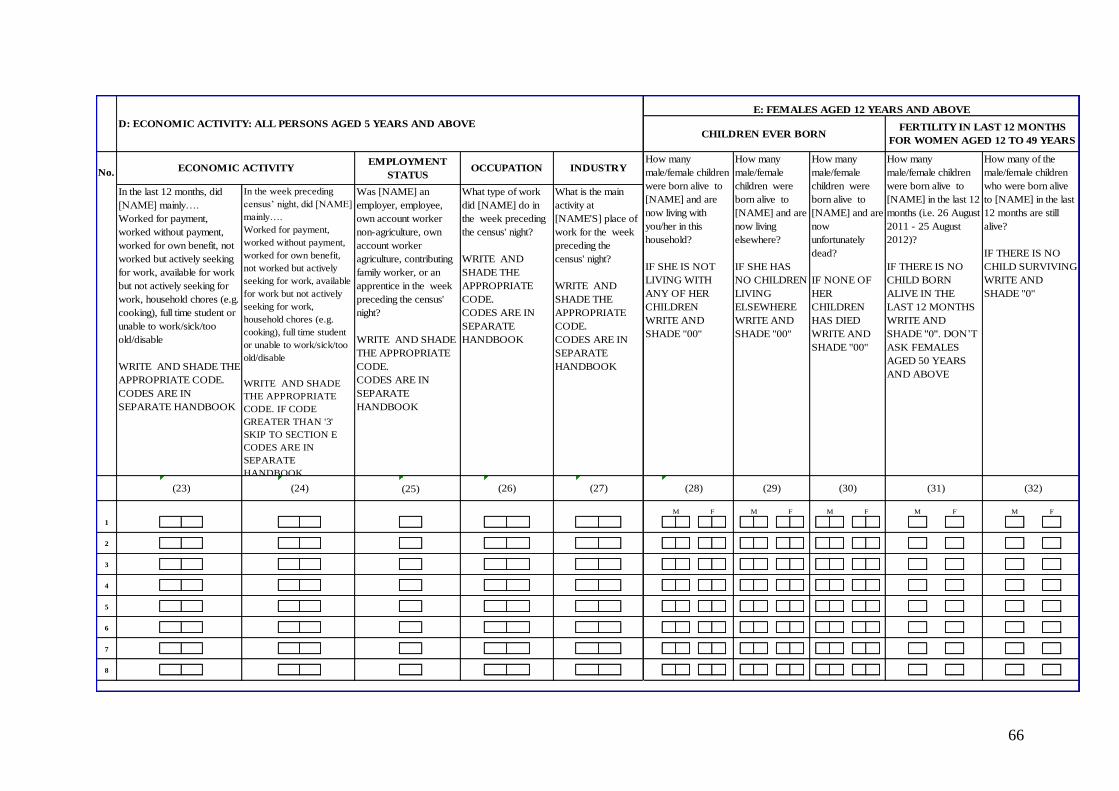
66
(25)
M F M F
1
2
3
4
5
6
7
8
(27)(23) (24)
No.
In the last 12 months, did
[NAME] mainly….
Worked for payment,
worked without payment,
worked for own benefit, not
worked but actively seeking
for work, available for work
but not actively seeking for
work, household chores (e.g.
cooking), full time student or
unable to work/sick/too
old/disable
WRITE AND SHADE THE
APPROPRIATE CODE.
CODES ARE IN
SEPARATE HANDBOOK
In the week preceding
census’ night, did [NAME]
mainly….
Worked for payment,
worked without payment,
worked for own benefit,
not worked but actively
seeking for work, available
for work but not actively
seeking for work,
household chores (e.g.
cooking), full time student
or unable to work/sick/too
old/disable
WRITE AND SHADE
THE APPROPRIATE
CODE. IF CODE
GREATER THAN '3'
SKIP TO SECTION E
CODES ARE IN
SEPARATE
HANDBOOK
Was [NAME] an
employer, employee,
own account worker
non-agriculture, own
account worker
agriculture, contributing
family worker, or an
apprentice in the week
preceding the census'
night?
WRITE AND SHADE
THE APPROPRIATE
CODE.
CODES ARE IN
SEPARATE
HANDBOOK
How many
male/female
children were
born alive to
[NAME] and are
now living
elsewhere?
IF SHE HAS
NO CHILDREN
LIVING
ELSEWHERE
WRITE AND
SHADE ''00''
How many
male/female
children were
born alive to
[NAME] and are
now
unfortunately
dead?
IF NONE OF
HER
CHILDREN
HAS DIED
WRITE AND
SHADE ''00''
How many of the
male/female children
who were born alive
to [NAME] in the last
12 months are still
alive?
IF THERE IS NO
CHILD SURVIVING
WRITE AND
SHADE ''0''
CHILDREN EVER BORN
INDUSTRY
What is the main
activity at
[NAME'S] place of
work for the week
preceding the
census' night?
WRITE AND
SHADE THE
APPROPRIATE
CODE.
CODES ARE IN
SEPARATE
HANDBOOK
How many
male/female children
were born alive to
[NAME] in the last 12
months (i.e. 26 August
2011 - 25 August
2012)?
IF THERE IS NO
CHILD BORN
ALIVE IN THE
LAST 12 MONTHS
WRITE AND
SHADE ''0''. DON’T
ASK FEMALES
AGED 50 YEARS
AND ABOVE
(32)(28)
D: ECONOMIC ACTIVITY: ALL PERSONS AGED 5 YEARS AND ABOVE
(26)
What type of work
did [NAME] do in
the week preceding
the census' night?
WRITE AND
SHADE THE
APPROPRIATE
CODE.
CODES ARE IN
SEPARATE
HANDBOOK
ECONOMIC ACTIVITY OCCUPATION EMPLOYMENT
STATUS
E: FEMALES AGED 12 YEARS AND ABOVE
How many
male/female children
were born alive to
[NAME] and are
now living with
you/her in this
household?
IF SHE IS NOT
LIVING WITH
ANY OF HER
CHILDREN
WRITE AND
SHADE ''00''
(31)
FERTILITY IN LAST 12 MONTHS
FOR WOMEN AGED 12 TO 49 YEARS
M F
(29) (30)
M F M F

67
F: GENERAL AND MATERNAL DEATHS IN THE HOUSEHOLD
IF THE ANSWER IS NO, SKIP TO SECTION G
RECORD THE NUMBER OF DEATHS
(34) (37)
1
2
3
4
5
6
7
8
If number of death is more than 8, use an extra questionnaire
PLEASE RECORD INFORMATION ON DEATHS THAT OCCURRED IN THE HOUSEHOLD DURING THE LAST 12 MONTHS. DO NOT FORGET CHILDHOOD
MORTALITY
Did the death occur during pregnancy?
Yes = 1
No = 2
IF THE ANSWER IS YES SKIP TO
SECTION G
Did the death occur during
childbirth?
Yes = 1
No = 2
IF THE ANSWER IS YES
SKIP TO SECTION G
Did the death occur during
the 6 weeks period following
the end of pregnancy,
irrespective of the way the
pregnancy ended?
Yes = 1
No = 2
IF DEATH IS OF A WOMAN AGED 12 TO 49 YEARS
Dea
th S
eria
l Num
ber
Was the deceased a
male or a female?
Male =1
Female =2
(40)(35)
What was the cause of
death?
Road Accident = 1
Other Injuries = 2
Suicide = 3
Domestic Violence = 4
Sickness/Disease = 5
Martenal Death = 6
Other = 7
(33) Was there any death which occurred in this household during the last 12 months? YES=1 NO=2
(38) (39)
How old was the deceased at the
time of death?
WRITE AGE IN COMPLETED
YEARS. IF UNDER ONE YEAR
WRITE "00" IF 97 YEARS OR
ABOVE WRITE '97'
(36)

68
Owned by household=1
Title deed= 1
Iron sheets =1
Cement =1
Stones =1
Lived in without paying any rent=2
Residential Licence= 2
Tiles =2
Ceramic tiles =2
Cement bricks =2
Rented privately =3 Offer = 3 Concrete =3 Parquet or Polished wood =3 Sundried bricks =3
Rented by employer =4 Customary ownership = 4 Asbestos =4 Terazzo =4 Baked bricks =4
Rented by government at a subsidized rent =5 Contract = 5 Grass/Leaves =5 Vinyl or Asphalt strips =5 Timber =5
Owned by Employer - Free of charge =6 Registration (Zanzibar) = 6 Mud and Leaves =6 Wood Planks =6 Timber ana Sheets =6
Owned by Employer - With rent =7 No legal right = 7 Plastics/Box =7 Palm/Bamboo =7 Poles and Mud =7
Tent =8 Earth/Sand =8 Grass =8
Dung =9 Tent =9
1-Modern floor
0-Non modern floor
(43)
What is the ownership status of the main dwelling used
by the household?
IF THE ANSWER IS CODE 2 OR ABOVE, SKIP
TO QUESTION 43
(42)
What legal right do you have
over the ownership of this land
where your house is built?
(45)
What are the main roofing
materials used for the
main building of this
household?
(44)
G: HOUSING CONDITIONS AND OWNERSHIP OF ASSETS
What are the main wall
materials used for the main
building of this household?
What are the main flooring materials
used for the main building of this
household?
(41)
69
(47)
Piped water into dwelling =01
Electricity (TANESCO/ZECO) =01
Electricity (TANESCO/ZECO) =01
Piped water in the yard/plot =02
Solar =02
Solar =02
Public tap/standpipe =03 Generator/private sources =03 Generator (private source) =03
Tubewell/borehole =04 Cooking Gas =04 Gas (Industrial) =04
Protected dug well =05 Gas (Biogas) =05 Gas (Biogas) =05
Unprotected dug well =06 Electricity (Wind) =06 Electricity (Wind) =06
Protected spring =07 Paraffin =07 Acetylene lamp =07
Unprotected spring =08 Coal =08 Kerosene (lantern/chimney) =08
Rainwater collection =09 Charcoal =09 Kerosene (Wick lamps) =09
Bottled water =10 Firewood =10 Candles =10
Cart with small tank/drum =11 Wood/ residuals =11 Firewood =11
Tanker truck =12 Animal residuals =12 Torch/Rechargeable lamps =12
Surface water (river, dam, lake, pond,
stream,charco, canal, irrigation channels)
=13 Not Applicable =13
Improved cooking fuel Have electricityNon improved cooking fuel Have no electricity
Improved source
Non improved source
What is the main source of drinking water for
this household?
(49)(48)
What is the main source of energy used by
this household for cooking?
What is the main source of energy used by
this household for lighting?
How many rooms are available
for sleeping in this household?
G: HOUSING CONDITIONS AND OWNERSHIP OF ASSETS
RECORD NUMBER OF
ROOMS FOR
SLEEPING
(46)

70
YES NO
Flush/pour flush to piped sewer system =01 Regularly collected =1 Radio 1 2
Flush/pour flush to septic tank =02 Irregularly collected =2 Telephone (Land Line) 1 2
Flush/pour flush to covered pit =03 Burnt =3 Mobile Phone 1 2
Flush/pour flush to somewhere else =04 Roadside dumping =4 Bicycle 1 2
Ventilated improved pit (VIP) latrine =05 Burying/pit =5 Motor vehicle 1 2
Pit latrine with washable slab and with lid =06 Other dumping =6 Motorcycle/Vespa 1 2
Pit latrine with washable slab without lid =07 Tricycle (Guta) 1 2
Pit latrine with not-washable/ soil slab =08 Tri motorcycle (Bajaj) 1 2
Pit latrine without slab/ open pit =09 Television 1 2
Composting/ ecosan latrine =10 Electric Iron 1 2
Bucket =11 Charcoal Iron 1 2
No facility/bush/field/ beach =12 Cooker (Electric or Gas) 1 2
Refrigerator/Freezer 1 2
Improved 1 Computer /Laptop 1 2
Non improved 0 Internet Facility 1 2
Plough 1 2
Regarded as sanitation Power tiller 1 2
Hand hoe 1 2
Wheelbarrow 1 2
Oxen 1 2
Donkey/Camel 1 2
House 1 2
Land/Farm 1 21 At least two items out of the listed assets
0 Less than two items from the listed assets
G: HOUSING CONDITIONS
Does your household have/own the following assets?
FOR "YES" ANSWER, THESE ASSETS SHOULD
BE IN WORKING CONDITION. SHADE THE
APPROPRIATE ANSWER FOR EACH ITEM
(52)(51)(50)
What is the main type of toilet facility used by this
household?
How is the household refuse
disposed of?
71
Yes No
Maize 1 2
Paddy 1 2
Cassava 1 2
Banana 1 2
Other Crops 1 2
Cattle
GoatsSheepPoultry
LIVESTOCKAGRICULTURE
(54) (55) (56)
How many cattle, goats or sheep
were available during the Census
night?
IF NO, WRITE AND SHADE
CODE "00000"
Is there any member of
this household who is
currently engaged in fish
farming?
Yes = 1
No = 2
(57)(53)
H: AGRICULTURE AND LIVESTOCK
FISH FARMING
Has/is any member of this
household
operated/operating any land
for agricultural purposes
during 2011/12 agricultural
year?
Yes = 1
No = 2
IF THE ANSWER IS NO,
SKIP TO QUESTION 55
Which of the following crops did the household
grow?
Was any member of this
household engaged in
raising cattle, goats, sheep
or poultry up to the census
night?
Yes = 1
No = 2
IF THE ANSWER IS
NO, SKIP TO
QUESTION 57
72
59) Write the number of males and females living outside Tanzania? Males
Females
CODES ARE IN SEPARATE HANDBOOK
Total
1st
HH Member 6th
HH Member
2nd
HH Member 7th
HH Member
3rd
HH Member 8th
HH Member
4th
HH Member 9th
HH Member
5th
HH Member 10th
HH Member
IF THE NUMBER OF DIASPORA IS MORE THAN 10, USE EXTRA QUESTIONNAIRE
1st
HH Member 6th
HH Member
2nd
HH Member 7th
HH Member
3rd
HH Member 8th
HH Member
4th
HH Member 9th
HH Member
5th
HH Member 10th
HH Member
62) Is there a person in this household who is a member of the following social security funds?
National Social Security Fund (NSSF) =1
Zanzibar Social Security Fund (ZSSF) =2
Parastatal Pension Fund (PPF) =3
Public Service Pension Fund (PSPF) =4
Government Employee Provident Fund (GEPF) =5
Local Authority Pension Fund (LAPF) =6
National Health Insurance Fund/Community Health Fund (NHIF/CHF) =7
Other Fund =8
J: SOCIAL SECURITY FUNDS
60) In which country are they living?
Month
61) Have you or anyone in this household received remitance in the form of cash or in kind from them during the last 12 months?
Yes =1, No =2
DATE OF EDITING QUESTIONNAIREDay Month
Fund
NAME OF SUPERVISOR
Yes = 1 No = 2 IF THE ANSWER IS NO, GO TO SECTION H. MULTIPLE RESPONSE IS
ALLOWED
DATE HOUSEHOLD ENUMERATED
Day
I: CITIZENS IN DIASPORA K: TOTAL NUMBER OF PERSONS IN THE HOUSEHOLD
58) Is there any person who was a member of this household currently living outside Tanzania? Yes = 1 No = 2
IF THE ANSWER IS NO, SKIP TO SECTION J
M F

73