Director’s Statement and Foreword€¦ · · 2018-01-26Welcome to the Monthly presentation...
37
Transcript of Director’s Statement and Foreword€¦ · · 2018-01-26Welcome to the Monthly presentation...


Foreword
Welcome to the Monthly presentation
organised by the Dissemination Branch of
the Central Statistical Office (CSO). The
CSO embarks on vigorous information
delivery strategy to major stakeholders and
the media institutions in order to increase
utilisation of statistical products and
services. The office produces a number of
statistical products in the Economic, Social,
Agricultural and Environmental areas. The information collected in
these areas may be used for various purposes including policy
formulation, planning, implementation, monitoring and evaluation of
programmes and projects.
This Monthly publication is an attempt to provide highlights of CSO’s
work and how it can help media institutions and the general public to
make use of data and information for sustainable national
development and decision-making.
I would like to urge our readers and users of statistical information to
send to us any comments that may enhance statistical production
and contribute to the improvement of this bulletin.
John Kalumbi DIRECTOR OF CENSUS AND STATISTICS
25th January, 2018
3 | P a g e
INFLATION
CONSUMER PRICE INDEX
YEAR ON YEAR INFLATION RATE FOR JANUARY 2018 INCREASES TO 6.2 PERCENT
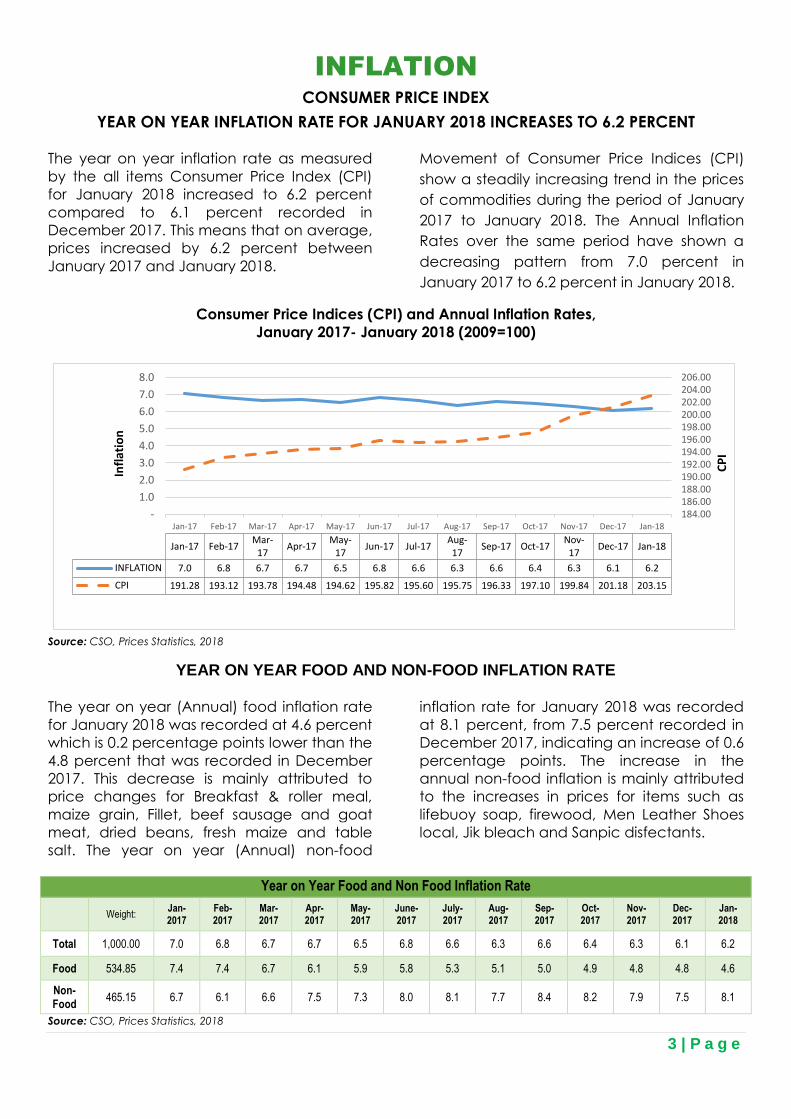
The year on year inflation rate as measured
by the all items Consumer Price Index (CPI)
for January 2018 increased to 6.2 percent
compared to 6.1 percent recorded in
December 2017. This means that on average,
prices increased by 6.2 percent between
January 2017 and January 2018.
Movement of Consumer Price Indices (CPI)
show a steadily increasing trend in the prices
of commodities during the period of January
2017 to January 2018. The Annual Inflation
Rates over the same period have shown a
decreasing pattern from 7.0 percent in
January 2017 to 6.2 percent in January 2018.
Consumer Price Indices (CPI) and Annual Inflation Rates,
January 2017- January 2018 (2009=100)
184.00186.00188.00190.00192.00194.00196.00198.00200.00202.00204.00206.00
-
1.0
2.0
3.0
4.0
5.0
6.0
7.0
8.0
Jan-17 Feb-17 Mar-17 Apr-17 May-17 Jun-17 Jul-17 Aug-17 Sep-17 Oct-17 Nov-17 Dec-17 Jan-18
CP
I
Infl
atio
n
Jan-17 Feb-17Mar-
17Apr-17
May-17
Jun-17 Jul-17Aug-17
Sep-17 Oct-17Nov-
17Dec-17 Jan-18
INFLATION 7.0 6.8 6.7 6.7 6.5 6.8 6.6 6.3 6.6 6.4 6.3 6.1 6.2
CPI 191.28 193.12 193.78 194.48 194.62 195.82 195.60 195.75 196.33 197.10 199.84 201.18 203.15
Source: CSO, Prices Statistics, 2018
YEAR ON YEAR FOOD AND NON-FOOD INFLATION RATE
The year on year (Annual) food inflation rate
for January 2018 was recorded at 4.6 percent
which is 0.2 percentage points lower than the
4.8 percent that was recorded in December
2017. This decrease is mainly attributed to
price changes for Breakfast & roller meal,
maize grain, Fillet, beef sausage and goat
meat, dried beans, fresh maize and table
salt. The year on year (Annual) non-food
inflation rate for January 2018 was recorded
at 8.1 percent, from 7.5 percent recorded in
December 2017, indicating an increase of 0.6
percentage points. The increase in the
annual non-food inflation is mainly attributed
to the increases in prices for items such as
lifebuoy soap, firewood, Men Leather Shoes
local, Jik bleach and Sanpic disfectants.
Year on Year Food and Non Food Inflation Rate
Weight:
Jan-2017
Feb-2017
Mar-2017
Apr-2017
May-2017
June-2017
July-2017
Aug-2017
Sep-2017
Oct-2017
Nov-2017
Dec-2017
Jan-2018
Total 1,000.00 7.0 6.8 6.7 6.7 6.5 6.8 6.6 6.3 6.6 6.4 6.3 6.1 6.2
Food 534.85 7.4 7.4 6.7 6.1 5.9 5.8 5.3 5.1 5.0 4.9 4.8 4.8 4.6
Non-Food
465.15 6.7 6.1 6.6 7.5 7.3 8.0 8.1 7.7 8.4 8.2 7.9 7.5 8.1
Source: CSO, Prices Statistics, 2018
4 | P a g e
ANNUAL INFLATION RATE MOVEMENT BY CPI MAIN GROUP
CPI MAIN GROUPS THAT DECREASED
The annual inflation rate for January 2018
reduced for;
1. FOOD AND NON-ALCOHOLIC BEVERAGES
The annual inflation rate for the food and
non-alcoholic beverages CPI main group
reduced from 4.8 percent in December 2017
to 4.6 percent in January 2018. This decrease
is mainly attributed to the price changes for
Breakfast mealie meal, roller mealie meal
and maize grain.
2. COMMUNICATION
The Communication CPI main group
recorded a reduction in the annual inflation
rate from 1.8 percent to 0.8 percent. This
reduction was influenced by the price
changes of the land phone set.
3. EDUCATION
The Education CPI main group recorded a
reduction in the annual inflation rate from 5.4
percent in December 2017 to 3.8 percent in
January 2018. This decrease is as a result of
changes in Primary School fees for private
schools.
CPI MAIN GROUPS THAT INCREASED
1. Alcoholic Beverages and Tobacco
The annual inflation rate for this CPI main
group increased from 3.7 percent in
December, 2017 to 3.9 percent in January,
2018. This increase is as a result of price
changes of items in the beer subgroup of this
division. The major items that influenced this
change are Mosi and Castle lagers.
2. Clothing and Footwear
The annual inflation rate for the Clothing and
footwear subgroup recorded an increase of
0.1 Percentage points from 7.2 percent
recorded in December 2017 to 7.3 percent
recorded in January, 2018. This increase is
mainly as a result of the price changes of
men’s leather shoes.
3. Housing, Water, Electricity, Gas & Other
Fuels
The annual inflation rate for this CPI main
group increased from 15.9 percent in
December 2017 to 17.1 percent in January
2018. This increase is mainly attributed to
price changes for items such as firewood and
charcoal.
4. Furnishing, Household Equipment, Routine
Housing Maintenance
The annual inflation rate for the Furnishing,
Household Equipment, and Routine Housing
Maintenance CPI main group was recorded
at 4.9 percent in January 2018 compared to
the 4.4 percent in December 2017. This 0.5
percentage points increase is as a result of
price changes for items such as lounge suite,
disinfectants and Jik bleach.
5. Health
The annual inflation rate for the Health CPI
main group was recorded at 5.5 percent in
January 2018 compared to the 4.2 percent
recorded in December 2017. This increase of
1.3 percentage points is attributed to the
price changes of male condoms and
medical scheme fees.
6. Transport
The Transport CPI main group recorded an
increase in the annual inflation rate of 0.8
percentage points from 1.0 percent in
December 2017 to 1.8 percent in January
2018. This increase is mainly attributed to the
price changes of engine oil, bicycle tyres and
general motor vehicle service.
7. Recreation and Culture
The annual inflation rate for the Recreation
and culture CPI main group increased from
5.6 percent recorded in December 2017 to
6.5 percent recorded in January 2018. This
increase is attributed to price changes for
economics textbooks, video rental, school
exercise books and colour television sets.
8. Restaurant and Hotel
The annual inflation rate for the Restaurant
and hotel CPI main group increased from 3.3
percent recorded in December 2017 to 3.6
5 | P a g e
percent recorded in January 2018. This
increase of 0.3 percentage points is as a
result of price movements for items such as
Nshima with beef hotel meals and castle
lager.
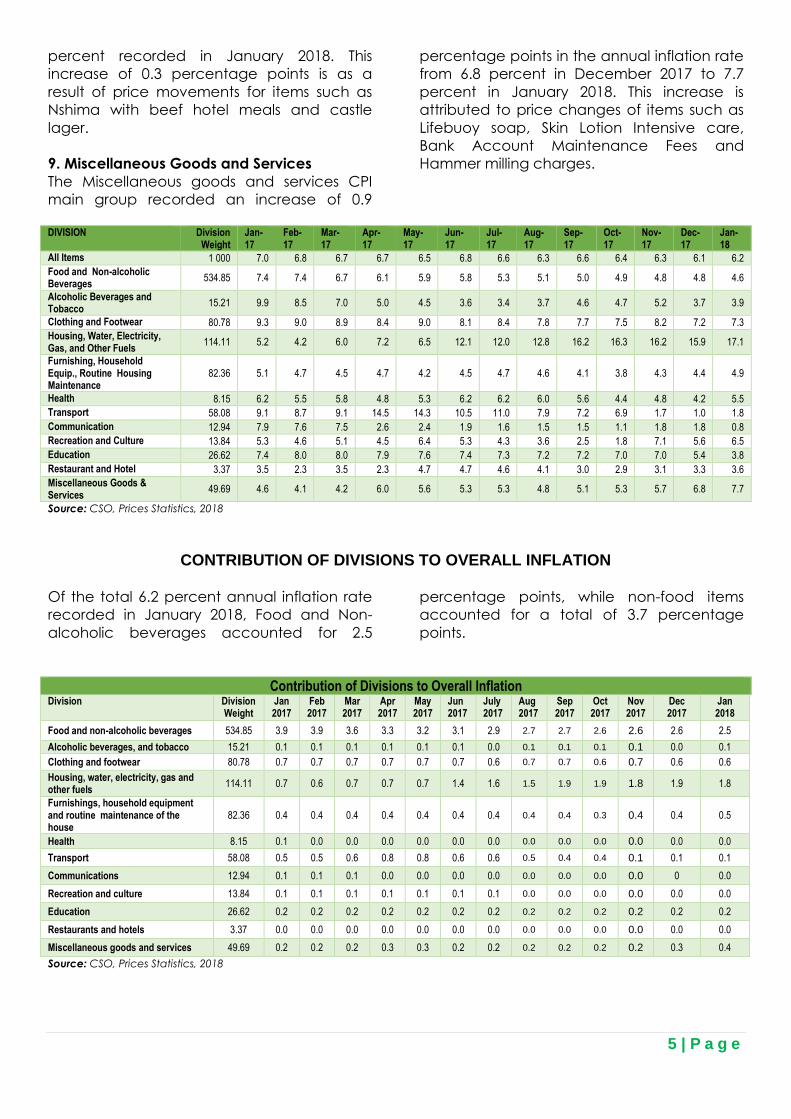
9. Miscellaneous Goods and Services
The Miscellaneous goods and services CPI
main group recorded an increase of 0.9
percentage points in the annual inflation rate
from 6.8 percent in December 2017 to 7.7
percent in January 2018. This increase is
attributed to price changes of items such as
Lifebuoy soap, Skin Lotion Intensive care,
Bank Account Maintenance Fees and
Hammer milling charges.
DIVISION Division
Weight Jan-17
Feb-17
Mar-17
Apr-17
May-17
Jun-17
Jul-17
Aug-17
Sep-17
Oct-17
Nov-17
Dec-17
Jan-18
All Items 1 000 7.0 6.8 6.7 6.7 6.5 6.8 6.6 6.3 6.6 6.4 6.3 6.1 6.2
Food and Non-alcoholic Beverages
534.85 7.4 7.4 6.7 6.1 5.9 5.8 5.3 5.1 5.0 4.9 4.8 4.8 4.6
Alcoholic Beverages and Tobacco
15.21 9.9 8.5 7.0 5.0 4.5 3.6 3.4 3.7 4.6 4.7 5.2 3.7 3.9
Clothing and Footwear 80.78 9.3 9.0 8.9 8.4 9.0 8.1 8.4 7.8 7.7 7.5 8.2 7.2 7.3
Housing, Water, Electricity, Gas, and Other Fuels
114.11 5.2 4.2 6.0 7.2 6.5 12.1 12.0 12.8 16.2 16.3 16.2 15.9 17.1
Furnishing, Household Equip., Routine Housing Maintenance
82.36 5.1 4.7 4.5 4.7 4.2 4.5 4.7 4.6 4.1 3.8 4.3 4.4 4.9
Health 8.15 6.2 5.5 5.8 4.8 5.3 6.2 6.2 6.0 5.6 4.4 4.8 4.2 5.5
Transport 58.08 9.1 8.7 9.1 14.5 14.3 10.5 11.0 7.9 7.2 6.9 1.7 1.0 1.8
Communication 12.94 7.9 7.6 7.5 2.6 2.4 1.9 1.6 1.5 1.5 1.1 1.8 1.8 0.8
Recreation and Culture 13.84 5.3 4.6 5.1 4.5 6.4 5.3 4.3 3.6 2.5 1.8 7.1 5.6 6.5
Education 26.62 7.4 8.0 8.0 7.9 7.6 7.4 7.3 7.2 7.2 7.0 7.0 5.4 3.8
Restaurant and Hotel 3.37 3.5 2.3 3.5 2.3 4.7 4.7 4.6 4.1 3.0 2.9 3.1 3.3 3.6
Miscellaneous Goods & Services
49.69 4.6 4.1 4.2 6.0 5.6 5.3 5.3 4.8 5.1 5.3 5.7 6.8 7.7
Source: CSO, Prices Statistics, 2018
CONTRIBUTION OF DIVISIONS TO OVERALL INFLATION
Of the total 6.2 percent annual inflation rate
recorded in January 2018, Food and Non-
alcoholic beverages accounted for 2.5
percentage points, while non-food items
accounted for a total of 3.7 percentage
points.
Contribution of Divisions to Overall Inflation Division Division
Weight Jan 2017
Feb 2017
Mar 2017
Apr 2017
May 2017
Jun 2017
July 2017
Aug 2017
Sep 2017
Oct 2017
Nov 2017
Dec 2017
Jan 2018
Food and non-alcoholic beverages 534.85 3.9 3.9 3.6 3.3 3.2 3.1 2.9 2.7 2.7 2.6 2.6 2.6 2.5
Alcoholic beverages, and tobacco 15.21 0.1 0.1 0.1 0.1 0.1 0.1 0.0 0.1 0.1 0.1 0.1 0.0 0.1
Clothing and footwear 80.78 0.7 0.7 0.7 0.7 0.7 0.7 0.6 0.7 0.7 0.6 0.7 0.6 0.6
Housing, water, electricity, gas and other fuels
114.11 0.7 0.6 0.7 0.7 0.7 1.4 1.6 1.5 1.9 1.9 1.8 1.9 1.8
Furnishings, household equipment and routine maintenance of the house
82.36 0.4 0.4 0.4 0.4 0.4 0.4 0.4 0.4 0.4 0.3 0.4 0.4 0.5
Health 8.15 0.1 0.0 0.0 0.0 0.0 0.0 0.0 0.0 0.0 0.0 0.0 0.0 0.0
Transport 58.08 0.5 0.5 0.6 0.8 0.8 0.6 0.6 0.5 0.4 0.4 0.1 0.1 0.1
Communications 12.94 0.1 0.1 0.1 0.0 0.0 0.0 0.0 0.0 0.0 0.0 0.0 0 0.0
Recreation and culture 13.84 0.1 0.1 0.1 0.1 0.1 0.1 0.1 0.0 0.0 0.0 0.0 0.0 0.0
Education 26.62 0.2 0.2 0.2 0.2 0.2 0.2 0.2 0.2 0.2 0.2 0.2 0.2 0.2
Restaurants and hotels 3.37 0.0 0.0 0.0 0.0 0.0 0.0 0.0 0.0 0.0 0.0 0.0 0.0 0.0
Miscellaneous goods and services 49.69 0.2 0.2 0.2 0.3 0.3 0.2 0.2 0.2 0.2 0.2 0.2 0.3 0.4
Source: CSO, Prices Statistics, 2018
6 | P a g e
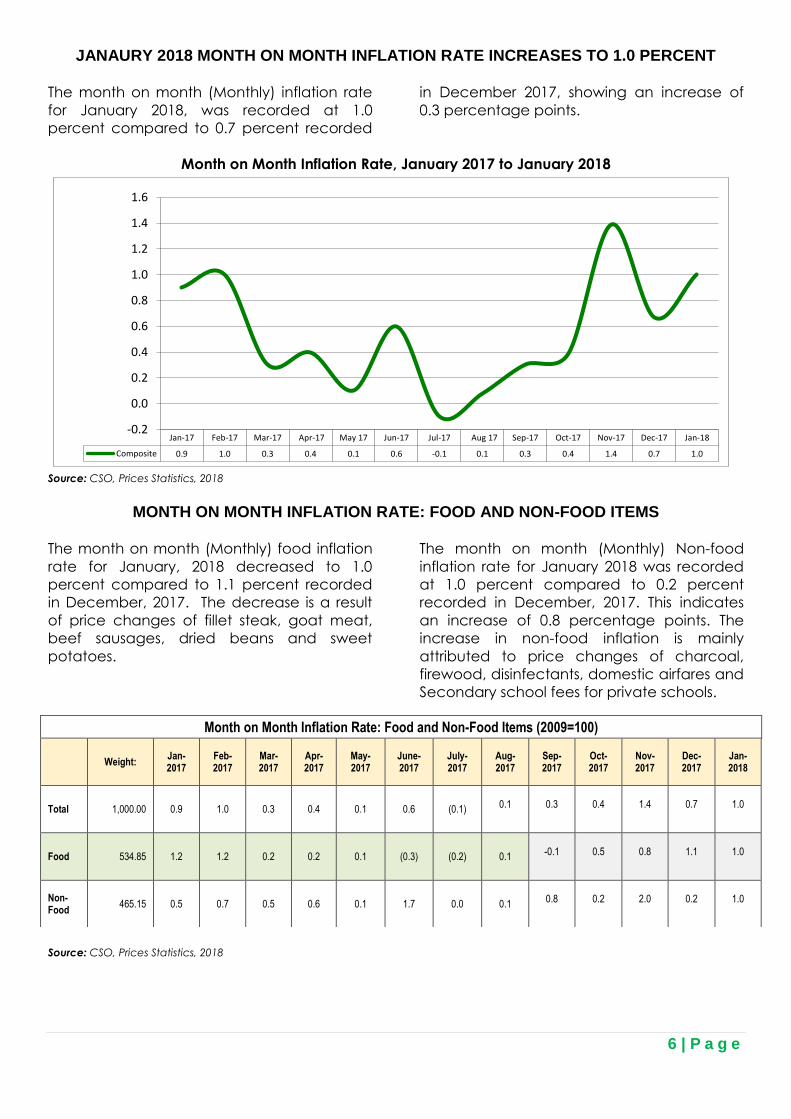
JANAURY 2018 MONTH ON MONTH INFLATION RATE INCREASES TO 1.0 PERCENT
The month on month (Monthly) inflation rate
for January 2018, was recorded at 1.0
percent compared to 0.7 percent recorded
in December 2017, showing an increase of
0.3 percentage points.
Month on Month Inflation Rate, January 2017 to January 2018
Jan-17 Feb-17 Mar-17 Apr-17 May 17 Jun-17 Jul-17 Aug 17 Sep-17 Oct-17 Nov-17 Dec-17 Jan-18
Composite 0.9 1.0 0.3 0.4 0.1 0.6 -0.1 0.1 0.3 0.4 1.4 0.7 1.0
-0.2
0.0
0.2
0.4
0.6
0.8
1.0
1.2
1.4
1.6
Source: CSO, Prices Statistics, 2018
MONTH ON MONTH INFLATION RATE: FOOD AND NON-FOOD ITEMS
The month on month (Monthly) food inflation
rate for January, 2018 decreased to 1.0
percent compared to 1.1 percent recorded
in December, 2017. The decrease is a result
of price changes of fillet steak, goat meat,
beef sausages, dried beans and sweet
potatoes.
The month on month (Monthly) Non-food
inflation rate for January 2018 was recorded
at 1.0 percent compared to 0.2 percent
recorded in December, 2017. This indicates
an increase of 0.8 percentage points. The
increase in non-food inflation is mainly
attributed to price changes of charcoal,
firewood, disinfectants, domestic airfares and
Secondary school fees for private schools.
Source: CSO, Prices Statistics, 2018
Month on Month Inflation Rate: Food and Non-Food Items (2009=100)
Weight:
Jan-2017
Feb-2017
Mar-2017
Apr-2017
May-2017
June-2017
July-2017
Aug-2017
Sep-2017
Oct-2017
Nov-2017
Dec-2017
Jan-2018
Total 1,000.00 0.9 1.0 0.3 0.4 0.1 0.6 (0.1)
0.1
0.3
0.4
1.4
0.7
1.0
Food 534.85 1.2 1.2 0.2 0.2 0.1 (0.3) (0.2) 0.1
-0.1
0.5
0.8
1.1
1.0
Non-Food
465.15 0.5 0.7 0.5 0.6 0.1 1.7 0.0 0.1
0.8
0.2
2.0
0.2
1.0
7 | P a g e
MONTH ON MONTH CONTRIBUTIONS: FOOD AND NON-FOOD
Of the total 1.0 percent month on month
(Monthly) inflation rate recorded in January
2018, Food and Non-alcoholic beverages
accounted for 0.4 percentage points, while
non-food items accounted for a total of 0.6
percentage points.
Month on Month Contribution: Food and Non Food
Division Weight Jan 2017
Feb 2017
Mar 2017
Apr 2017
May 2017
June 2017
July 2017
Aug 2017
Sep 2017
Oct 2017
Nov 2017
Dec 2017
Jan 2018
Food 534.85 0.6 0.7 0.1 0.1 0.0 (0.2) (0.1) 0.1 (0.1) 0.3 0.4 0.5 0.4
Non-Food 465.15 0.4 0.3 0.2 0.2 0.1 0.8 0.0 0.0 0.4 0.1
0.9 0.2 0.6
All Items 1,000.00 1.0 0.9 0.4 0.3 0.1 0.6 (0.1) 0.1 0.3 1.0 1.4 0.7 1.0
Source: CSO, Prices Statistics, 2018
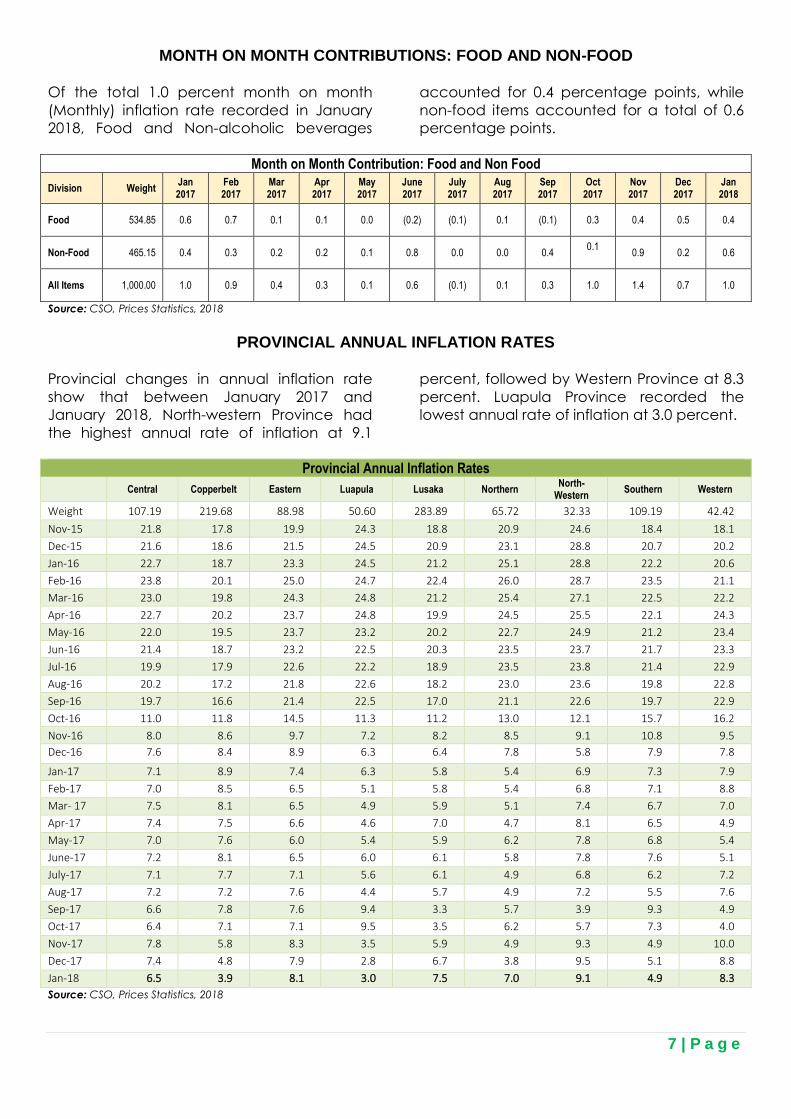
PROVINCIAL ANNUAL INFLATION RATES
Provincial changes in annual inflation rate
show that between January 2017 and
January 2018, North-western Province had
the highest annual rate of inflation at 9.1
percent, followed by Western Province at 8.3
percent. Luapula Province recorded the
lowest annual rate of inflation at 3.0 percent.
Provincial Annual Inflation Rates
Central Copperbelt Eastern Luapula Lusaka Northern
North- Western
Southern Western
Weight 107.19 219.68 88.98 50.60 283.89 65.72 32.33 109.19 42.42
Nov-15 21.8 17.8 19.9 24.3 18.8 20.9 24.6 18.4 18.1
Dec-15 21.6 18.6 21.5 24.5 20.9 23.1 28.8 20.7 20.2
Jan-16 22.7 18.7 23.3 24.5 21.2 25.1 28.8 22.2 20.6
Feb-16 23.8 20.1 25.0 24.7 22.4 26.0 28.7 23.5 21.1
Mar-16 23.0 19.8 24.3 24.8 21.2 25.4 27.1 22.5 22.2
Apr-16 22.7 20.2 23.7 24.8 19.9 24.5 25.5 22.1 24.3
May-16 22.0 19.5 23.7 23.2 20.2 22.7 24.9 21.2 23.4
Jun-16 21.4 18.7 23.2 22.5 20.3 23.5 23.7 21.7 23.3
Jul-16 19.9 17.9 22.6 22.2 18.9 23.5 23.8 21.4 22.9
Aug-16 20.2 17.2 21.8 22.6 18.2 23.0 23.6 19.8 22.8
Sep-16 19.7 16.6 21.4 22.5 17.0 21.1 22.6 19.7 22.9
Oct-16 11.0 11.8 14.5 11.3 11.2 13.0 12.1 15.7 16.2
Nov-16 8.0 8.6 9.7 7.2 8.2 8.5 9.1 10.8 9.5
Dec-16 7.6 8.4 8.9 6.3 6.4 7.8 5.8 7.9 7.8
Jan-17 7.1 8.9 7.4 6.3 5.8 5.4 6.9 7.3 7.9
Feb-17 7.0 8.5 6.5 5.1 5.8 5.4 6.8 7.1 8.8
Mar- 17 7.5 8.1 6.5 4.9 5.9 5.1 7.4 6.7 7.0
Apr-17 7.4 7.5 6.6 4.6 7.0 4.7 8.1 6.5 4.9
May-17 7.0 7.6 6.0 5.4 5.9 6.2 7.8 6.8 5.4
June-17 7.2 8.1 6.5 6.0 6.1 5.8 7.8 7.6 5.1
July-17 7.1 7.7 7.1 5.6 6.1 4.9 6.8 6.2 7.2
Aug-17 7.2 7.2 7.6 4.4 5.7 4.9 7.2 5.5 7.6
Sep-17 6.6 7.8 7.6 9.4 3.3 5.7 3.9 9.3 4.9
Oct-17 6.4 7.1 7.1 9.5 3.5 6.2 5.7 7.3 4.0
Nov-17 7.8 5.8 8.3 3.5 5.9 4.9 9.3 4.9 10.0
Dec-17 7.4 4.8 7.9 2.8 6.7 3.8 9.5 5.1 8.8
Jan-18 6.5 3.9 8.1 3.0 7.5 7.0 9.1 4.9 8.3
Source: CSO, Prices Statistics, 2018

8 | P a g e
PROVINCIAL CONTRIBUTION TO OVERALL INFLATION
Lusaka Province had the highest provincial
contribution of 2.1 percentage points to the
overall annual inflation rate of 6.2 percent
recorded in January 2018. This implies that the
price movements in Lusaka Province had the
greatest influence on the overall annual rate
of inflation. Copperbelt and Eastern
provinces had the second highest provincial
contribution of 0.8 percentage points each.
Luapula Province had the lowest contribution
of 0.2 percentage points.
Source: CSO, Prices Statistics,2018
NATIONAL AVERAGE PRICES FOR SELECTED PRODUCTS
The Consumer Price Basket consists of 440
items and over 23,000 price quotations are
collected from selected outlets in all the
districts in Zambia from 1st to 10th of every
month. The table below shows the maximum
and minimum prices for selected items and
the location in January, 2018.
Product Description Unit of Measure
Minimum Maximum
Price (K) Location Price (K) Location
Breakfast Mealie Meal 25 kg 53.00 Livingstone 100.00 Chipata, Mbala, Chilubi
Roller mealie meal 25 kg 31.50 Livingstone 80.00 Chienge
Maize Grain 20 litre tin 20.00 Serenje 48.00 Solwezi
Dried Kapenta (Mpulungu) 1 kg 60.34 Petauke 265.96 Lusaka
Charcoal 50 kg bag 20.00 Mungwi 80.00 Kitwe
Cement 50 kg 50.00 Isoka 100.00 Chama
Source: CSO, Prices Statistics, 2018
On a monthly basis, a comparison of retail
prices between January 2018 and December
2017 shows that the national average price
of a 25 kg bag of Breakfast Mealie meal
increased by 1.4 percent from K66.23 to
K67.17 while the national average price of a
25 kg bag of Roller Mealie meal increased by
2.4 percent from K49.76 to K50.95. The
national average price of a 20 litre tin of
Maize grain increased by 4.0 percent from
K28.18 to K29.31.
On an annual basis, a comparison of retail
prices between January 2017 and January
2018 shows that the national average price
of a 25kg bag of Breakfast Mealie meal
decreased by 33.6 percent from K101.10 to
K67.17. The national average price of a 20
litre tin of Maize grain decreased by 36.9
percent from K46.46 to K29.31.
Provincial Contribution to Overall Inflation Province Weight Jan
2017 Feb 2017
Mar 2017
Apr 2017
May 2017
June 2017
July 2017
Aug 2017
Sep 2017
Oct 2017
Nov 2017
Dec 2017
Jan 2018
Central 107.19 0.7 0.7 0.8 0.8 0.7 0.8 0.7 0.8 0.5 0.7 0.8 0.8 0.7
Copperbelt 219.68 1.9 1.8 1.7 1.6 1.6 1.7 1.6 1.5 0.9 1.5 1.2 1.0 0.8
Eastern 88.98 0.7 0.6 0.6 0.6 0.6 0.6 0.7 0.7 1.3 0.9 0.8 0.7 0.8
Luapula 50.60 0.3 0.3 0.3 0.2 0.3 0.3 0.3 0.2 0.2 0.2 0.2 0.1 0.2
Lusaka 283.89 1.7 1.7 1.7 2.0 1.7 1.7 1.7 1.6 1.7 1.8 1.7 1.9 2.1
Northern 65.72 0.4 0.4 0.3 0.3 0.4 0.4 0.3 0.3 0.3 0.4 0.3 0.3 0.5
North Western 32.33 0.2 0.2 0.3 0.3 0.3 0.3 0.2 0.2 0.5 0.3 0.3 0.3 0.3
Southern 109.19 0.8 0.8 0.8 0.7 0.8 0.8 0.7 0.6 1.0 0.5 0.6 0.6 0.6
Western 42.42 0.3 0.4 0.3 0.2 0.2 0.2 0.3 0.3 0.3 0.3 0.4 0.4 0.3
National 1,000.00 7.0 6.8 6.7 6.7 6.5 6.8 6.6 6.3 6.6 6.4 6.3 6.1 6.2

9| P a g e
NATIONAL AVERAGE PRICES FOR SELECTED PRODUCTS
Description Unit of Measure Jan 17 Feb 17 Mar 17 Apr 17 May 17 Jun 17 Jul 17 Aug 17 Sep 17 Oct 17 Nov 17 Dec 17 Dec 17 Jan 18
%Change Jan
2018/Dec 2017
%Change Jan
2018/Jan 2017
Breakfast Mealie Meal 25.0 Kilogram 101.10 102.73 103.46 100.73 98.76 96.37 88.58 77.27 72.00 69.36 67.39 66.23 66.23 67.17 1.4 -33.6
Roller Mealie Meal 25.0 Kilogram 83.66 85.11 85.67 83.32 80.56 74.73 65.84 57.73 54.21 52.57 51.24 49.76 49.76 50.95 2.4 -39.1
Maize grain 20.0 Litre 46.46 49.76 53.03 51.12 42.82 36.41 33.97 31.07 29.10 28.31 29.00 28.18 28.18 29.31 4.0 -36.9
Bread 1.0 Each 7.85 7.73 7.78 7.75 7.65 7.66 7.71 7.63 7.63 7.61 7.57 7.55 7.55 7.57 0.3 -3.6
Fillet Steak 1.0 Kilogram 46.72 46.00 48.40 46.55 47.51 47.31 46.19 47.07 46.94 47.13 48.60 47.38 47.38 46.06 -2.8 -1.4
Sausages 1.0 Kilogram 43.62 42.48 41.95 42.19 42.55 42.45 44.02 42.44 41.91 42.09 41.87 43.23 43.23 41.67 -3.6 -4.5
Goat Meat 1.0 Kilogram 33.53 31.80 31.32 31.37 30.30 24.36 30.70 29.29 31.59 31.78 32.94 31.26 31.26 31.56 1.0 -5.9
Buka Buka 1.0 Kilogram 41.80 40.68 40.68 40.14 37.08 37.97 36.77 38.22 37.94 37.38 37.61 38.16 38.16 37.83 -0.9 -9.5
Fresh Kapenta 400.0 Gram 14.44 14.17 15.66 15.55 15.17 15.79 15.60 14.54 14.40 14.56 15.62 15.49 15.49 15.80 2.0 9.4
Dried Bream 1.0 Kilogram 87.30 89.71 90.27 81.36 81.08 77.32 86.82 77.83 82.05 76.29 82.51 83.66 83.66 96.38 15.2 10.4
Dried Kapenta Mpulungu 1.0 Kilogram 114.25 114.32 119.40 123.82 113.35 114.98 108.52 109.99 112.45 111.39 119.67 109.19 109.19 118.48 8.5 3.7
Cooking oil Imported 750.0 Millilitre 15.91 15.75 15.76 15.81 15.63 15.60 15.62 15.51 15.61 15.35 15.39 15.90 15.90 15.38 -3.3 -3.3
Cooking oil Local 2.5 Litre 51.45 51.10 50.52 50.54 49.86 49.70 49.98 49.16 49.03 49.23 48.95 48.91 48.91 48.73 -0.4 -5.3
Rape 1.0 Kilogram 5.30 5.41 5.32 5.24 4.99 4.57 4.45 4.52 4.37 4.42 4.62 5.02 5.02 5.31 5.8 0.2
Cabbage 1.0 Kilogram 3.44 3.60 3.72 3.43 3.28 3.09 2.74 2.48 2.68 2.71 2.85 2.85 2.85 3.04 6.7 -11.6
Tomatoes 1.0 Kilogram 9.32 8.25 7.36 6.17 6.40 6.78 7.27 7.02 7.03 6.94 6.93 6.53 6.53 6.54 0.2 -29.8
Onion 1.0 Kilogram 9.99 10.64 10.43 10.28 11.67 11.38 11.46 10.44 9.76 8.84 8.78 8.83 8.83 9.45 7.0 -5.4
Dried beans 1.0 Kilogram 18.77 19.13 18.75 17.81 17.55 17.19 17.21 15.93 15.72 15.90 16.58 16.73 16.73 16.04 -4.1 -14.5
Mosi 375.0 Millilitre 8.35 8.34 8.22 8.08 8.05 8.03 7.95 7.96 7.96 7.93 7.94 7.93 7.93 7.88 -0.6 -5.6
Castle Lager 375.0 Millilitre 8.24 8.23 8.09 8.00 7.92 7.87 7.87 7.86 7.88 7.81 7.85 7.82 7.82 7.81 -0.1 -5.2
Men Leather Shoes local 1.0 Pair 329.08 327.59 325.28 330.53 331.67 313.51 330.97 317.84 310.40 345.78 333.30 344.65 344.65 331.77 -3.7 0.8
Men Shoes imported 1.0 Pair 207.23 195.47 211.18 205.50 198.82 207.24 213.22 212.10 215.03 210.50 198.71 190.97 190.97 196.01 2.6 -5.4
Cement 50.0 Kilogram 67.38 66.49 66.70 66.60 67.33 68.75 68.93 68.46 67.80 68.18 70.95 72.38 72.38 74.19 2.5 10.1
Charcoal 50.0 Kilogram 40.38 40.30 40.93 39.94 39.33 39.28 40.01 40.28 42.05 40.12 42.13 41.95 41.95 41.65 -0.7 3.1
Firewood 1.0 Kilogram 13.89 15.60 14.30 16.03 12.89 13.41 11.67 12.51 13.65 12.77 10.88 14.35 14.35 8.30 -42.2 -40.2
Bar soap (Chik) 500.0 Gram 10.77 10.71 10.10 10.43 10.75 10.32 10.57 10.44 10.15 10.21 10.30 10.35 10.35 10.55 1.9 -2.0
Boom 400.0 Gram 9.87 9.94 9.88 9.86 9.86 9.84 9.74 9.80 9.81 9.77 9.81 9.83 9.83 9.88 0.5 0.1
Omo Wasing Powder 500.0 Gram 17.83 18.50 18.14 18.11 17.83 18.41 17.65 18.13 18.23 19.65 18.68 18.32 18.32 18.28 -0.2 2.5
Ajax(Scouring powder) 500.0 Gram 11.52 11.63 12.05 12.13 12.19 12.04 12.65 12.33 12.06 12.58 12.94 12.40 12.40 12.69 2.3 10.2
Jik ordinary (Bleach) 500.0 Millilitre 12.16 12.44 12.64 12.75 12.94 13.02 13.32 12.97 13.11 13.34 13.48 13.02 13.02 13.11 0.7 7.8
Disifectants Sanpic 500.0 Millilitre 15.81 13.79 13.25 13.55 15.15 13.85 13.49 15.40 15.95 15.16 14.79 15.52 15.52 16.19 4.3 2.4
Bicycle Tyre 1.0 Each 47.75 48.05 47.73 46.69 47.94 52.38 47.50 45.77 47.76 45.42 47.04 49.87 49.87 45.23 -9.3 -5.3
Bicycle Tube 1.0 Each 20.52 21.21 21.68 20.97 20.93 21.02 20.58 20.65 20.66 20.70 21.33 21.26 21.26 21.06 -0.9 2.6
Engine oil 0.5 Litre 26.53 26.23 26.79 26.44 26.91 26.85 26.41 26.91 27.37 27.41 29.06 28.04 28.04 28.54 1.8 7.6
Air Fare Domestic 1.0 Each 1 125.00 1 175.00 1 375.00 1 375.00 1 292.00 1 256.00 1 256.00 1 242.00 1 076.00 1 086.00 1 256.00 1 191.00 1 191.00 1 138.00 -4.5 1.2
Geisha 250.0 Gram 9.68 9.78 9.86 9.61 9.53 9.63 9.58 9.72 9.67 9.58 9.82 9.82 9.82 9.71 -1.1 0.3
Lifebouy 150.0 Gram 5.88 5.74 6.15 5.96 5.92 5.74 5.82 5.77 5.82 5.95 5.82 5.94 5.94 6.32 6.4 7.5
Hammer milling charge 1.0 Each 6.32 6.32 6.50 6.48 6.37 6.56 6.37 6.25 6.63 6.62 6.73 6.80 6.80 6.90 1.5 9.2
10| P a g e
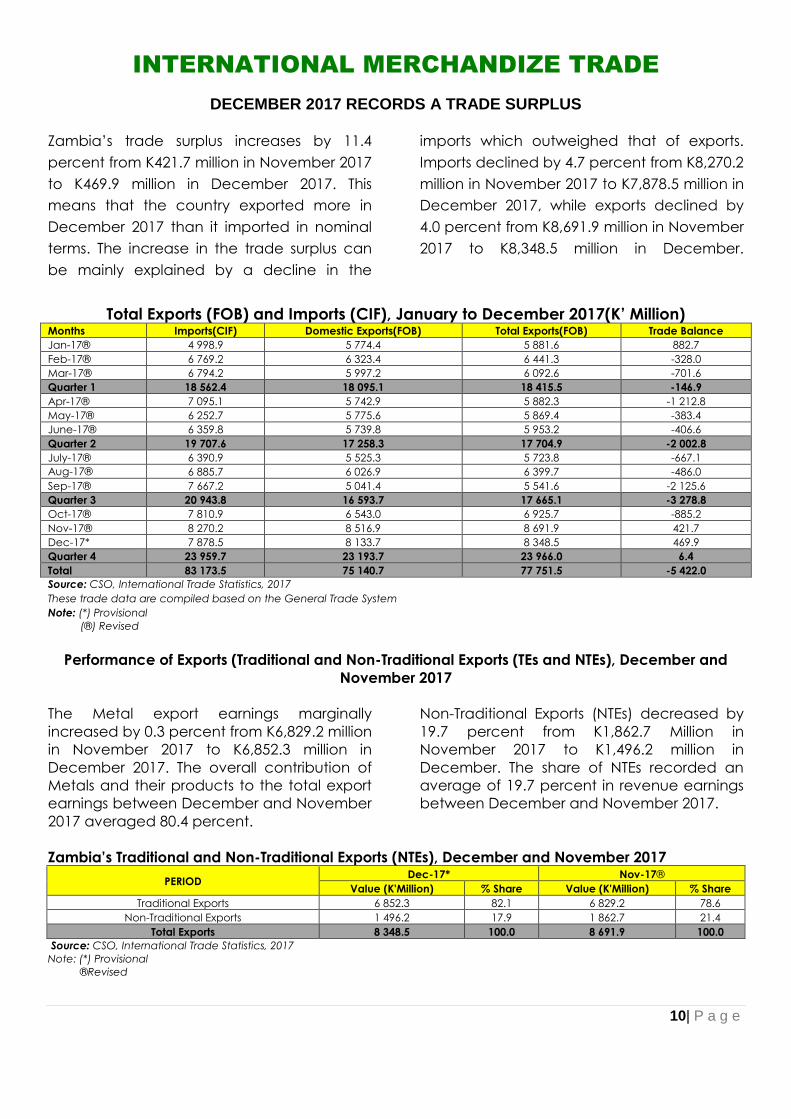
INTERNATIONAL MERCHANDIZE TRADE
DECEMBER 2017 RECORDS A TRADE SURPLUS
Zambia’s trade surplus increases by 11.4
percent from K421.7 million in November 2017
to K469.9 million in December 2017. This
means that the country exported more in
December 2017 than it imported in nominal
terms. The increase in the trade surplus can
be mainly explained by a decline in the
imports which outweighed that of exports.
Imports declined by 4.7 percent from K8,270.2
million in November 2017 to K7,878.5 million in
December 2017, while exports declined by
4.0 percent from K8,691.9 million in November
2017 to K8,348.5 million in December.
Total Exports (FOB) and Imports (CIF), January to December 2017(K’ Million) Months Imports(CIF) Domestic Exports(FOB) Total Exports(FOB) Trade Balance
Jan-17® 4 998.9 5 774.4 5 881.6 882.7
Feb-17® 6 769.2 6 323.4 6 441.3 -328.0
Mar-17® 6 794.2 5 997.2 6 092.6 -701.6
Quarter 1 18 562.4 18 095.1 18 415.5 -146.9
Apr-17® 7 095.1 5 742.9 5 882.3 -1 212.8
May-17® 6 252.7 5 775.6 5 869.4 -383.4
June-17® 6 359.8 5 739.8 5 953.2 -406.6
Quarter 2 19 707.6 17 258.3 17 704.9 -2 002.8
July-17® 6 390.9 5 525.3 5 723.8 -667.1
Aug-17® 6 885.7 6 026.9 6 399.7 -486.0
Sep-17® 7 667.2 5 041.4 5 541.6 -2 125.6
Quarter 3 20 943.8 16 593.7 17 665.1 -3 278.8
Oct-17® 7 810.9 6 543.0 6 925.7 -885.2
Nov-17® 8 270.2 8 516.9 8 691.9 421.7
Dec-17* 7 878.5 8 133.7 8 348.5 469.9
Quarter 4 23 959.7 23 193.7 23 966.0 6.4
Total 83 173.5 75 140.7 77 751.5 -5 422.0
Source: CSO, International Trade Statistics, 2017
These trade data are compiled based on the General Trade System
Note: (*) Provisional
(®) Revised
Performance of Exports (Traditional and Non-Traditional Exports (TEs and NTEs), December and
November 2017
The Metal export earnings marginally
increased by 0.3 percent from K6,829.2 million
in November 2017 to K6,852.3 million in
December 2017. The overall contribution of
Metals and their products to the total export
earnings between December and November
2017 averaged 80.4 percent.
Non-Traditional Exports (NTEs) decreased by
19.7 percent from K1,862.7 Million in
November 2017 to K1,496.2 million in
December. The share of NTEs recorded an
average of 19.7 percent in revenue earnings
between December and November 2017.
Zambia’s Traditional and Non-Traditional Exports (NTEs), December and November 2017
PERIOD Dec-17* Nov-17®
Value (K'Million) % Share Value (K'Million) % Share
Traditional Exports 6 852.3 82.1 6 829.2 78.6
Non-Traditional Exports 1 496.2 17.9 1 862.7 21.4
Total Exports 8 348.5 100.0 8 691.9 100.0
Source: CSO, International Trade Statistics, 2017
Note: (*) Provisional
®Revised
11| P a g e
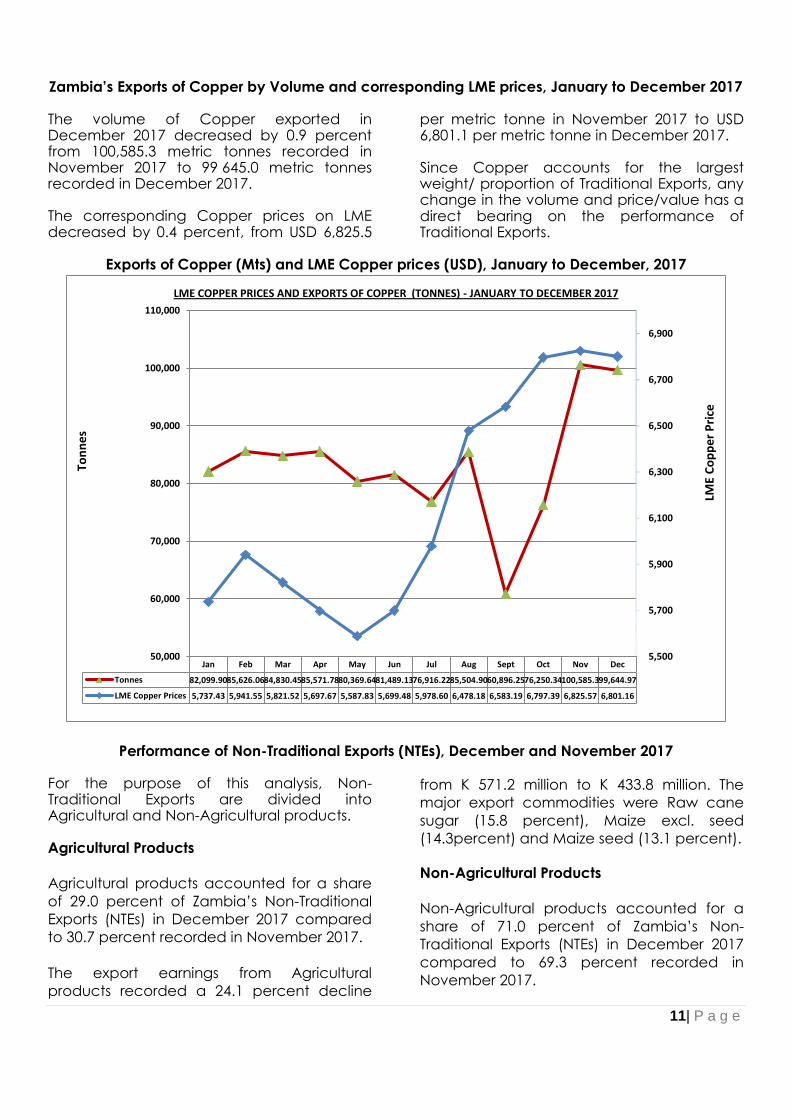
Zambia’s Exports of Copper by Volume and corresponding LME prices, January to December 2017 The volume of Copper exported in December 2017 decreased by 0.9 percent from 100,585.3 metric tonnes recorded in November 2017 to 99 645.0 metric tonnes recorded in December 2017.
The corresponding Copper prices on LME decreased by 0.4 percent, from USD 6,825.5
per metric tonne in November 2017 to USD 6,801.1 per metric tonne in December 2017. Since Copper accounts for the largest weight/ proportion of Traditional Exports, any change in the volume and price/value has a direct bearing on the performance of Traditional Exports.
Exports of Copper (Mts) and LME Copper prices (USD), January to December, 2017
Jan Feb Mar Apr May Jun Jul Aug Sept Oct Nov Dec
Tonnes 82,099.9085,626.0684,830.4585,571.7880,369.6481,489.1376,916.2285,504.9060,896.2576,250.34100,585.399,644.97
LME Copper Prices 5,737.43 5,941.55 5,821.52 5,697.67 5,587.83 5,699.48 5,978.60 6,478.18 6,583.19 6,797.39 6,825.57 6,801.16
5,500
5,700
5,900
6,100
6,300
6,500
6,700
6,900
50,000
60,000
70,000
80,000
90,000
100,000
110,000
LME
Co
pp
er
Pri
ce
Ton
ne
s
LME COPPER PRICES AND EXPORTS OF COPPER (TONNES) - JANUARY TO DECEMBER 2017
Performance of Non-Traditional Exports (NTEs), December and November 2017
For the purpose of this analysis, Non-Traditional Exports are divided into Agricultural and Non-Agricultural products. Agricultural Products
Agricultural products accounted for a share
of 29.0 percent of Zambia’s Non-Traditional
Exports (NTEs) in December 2017 compared
to 30.7 percent recorded in November 2017.
The export earnings from Agricultural
products recorded a 24.1 percent decline
from K 571.2 million to K 433.8 million. The
major export commodities were Raw cane
sugar (15.8 percent), Maize excl. seed
(14.3percent) and Maize seed (13.1 percent).
Non-Agricultural Products
Non-Agricultural products accounted for a
share of 71.0 percent of Zambia’s Non-
Traditional Exports (NTEs) in December 2017
compared to 69.3 percent recorded in
November 2017.

12| P a g e
The export earnings from Non-Agricultural
products recorded a decrease of 17.7
percent from K1,291.4 million to K1,062.4
Million. The major export commodities were
Sulphuric Acid (11.4 percent), cobalt oxides
and hydroxides (11.4) and Bullion semi-
manufactured forms (mainly Gold) (8.4
percent).
Zambia’s Major Non-Traditional Exports (NTEs), December and November 2017 Period Dec-17* Period Nov-17®
Hs-Code Description
Value
(K'Millio
n)
Share
(%) Hs-Code Description
Value
(K'Millio
n)
Sha
re
(%)
AGRIC PRODUCTS 433.8 100.0 AGRIC PRODUCTS 571.2
100
.0
17011300
Raw cane sugar specified in
Subheading Note 2 to this
Chapter 68.5 15.8 10059000 Maize (excl. seed) 120.1
21.
0
10059000 Maize (excl. seed) 62.0 14.3 12019000
Soya beans, whether or not broken, excl.
seed 104.1
18.
2
10051000 Maize seed 56.7 13.1 10051000 Maize seed 54.8 9.6
23040000
Oil-cake and other solid
residues, of soya-bean 47.7 11.0 23040000
Oil-cake and other solid residues, of soya-
bean 51.4 9.0
17019900
Cane or beet sugar, in solid
form, nes 25.7 5.9 17011300
Raw cane sugar specified in Subheading
Note 2 to this Chapter 37.7 6.6
19041000
Prepared foods obtained by
the swelling or roasting of
cereals 18.2 4.2 24012000
Tobacco, partly or wholly
stemmed/stripped 24.7 4.3
12019000
Soya beans, whether or not
broken, excl. seed 16.3 3.8 17019900 Cane or beet sugar, in solid form, nes 18.9 3.3
24012000
Tobacco, partly or wholly
stemmed/stripped 15.0 3.5 06031100 Fresh cut Roses and buds 15.6 2.7
Other - NTEs Agric Product 123.8 28.5 Other - NTEs Agric Product 143.9
25.
2
% Share of December Agric Products NTEs 29.0 % Share of November Agric Products NTEs 30.7
NON-AGRIC PRODUCTS 1 062.4 100.0 NON-AGRIC PRODUCTS 1 291.4
100
.0
28070010 Sulphuric acid; oleum in bulk 121.5 11.4 71081310
Bullion semi-manufactured forms (mainly
Gold) 154.9
12.
0
28220010
Cobalt oxides and hydroxides;
commercial cobalt oxides in
bulk 121.4 11.4 28070010 Sulphuric acid; oleum in bulk 121.1 9.4
71081310
Bullion semi-manufactured
forms (mainly Gold) 89.7 8.4 74081100
Wire of refined copper, maximum cross-
sectional dimension >6mm 106.5 8.2
22029900
Other non-alcoholic
beverages, nes 42.9 4.0 49070010
New stamps; stamp-impressed paper;
cheque forms; banknotes, etc -
postage,revenue stamp 91.5 7.1
74081100
Wire of refined copper,
maximum cross-sectional
dimension >6mm 37.0 3.5 84339000 Parts of harvesting... machinery 68.1 5.3
25030000
Sulphur of all kinds (excl.
sublimed, precipitated and
colloidal sulphur) 30.4 2.9 28220010
Cobalt oxides and hydroxides; commercial
cobalt oxides in bulk 46.5 3.6
25232900 Portland cement (excl. white) 28.6 2.7 22029900 Other non-alcoholic beverages, nes 35.1 2.7
36020090
Other prepared explosives,
(excl. propellent powders) 21.9 2.1 34022000
Washing and cleaning preparations, put
up for retail sale 34.7 2.7
72023000 Ferro-silico-manganese 20.8 2.0 25232900 Portland cement (excl. white) 30.4 2.4
34022000
Washing and cleaning
preparations, put up for retail
sale 20.0 1.9 38249900 Other nes 27.7 2.1
29309010
Other organo-
sulphurcompounds, nes - in
bulk 17.8 1.7 36020090
Other prepared explosives, (excl.
propellent powders) 23.7 1.8
41032000
Hides and skins of reptiles, fresh
or preserved, not tanned 16.9 1.6 72023000 Ferro-silico-manganese 22.6 1.8
85444900
Electric conductors, nes, for a
voltage <=80 V, not fitted with
connectors 14.5 1.4 15162000
Vegetable fats and oils and their fractions,
hydrogenated, etc 20.8 1.6
25222000 Slaked lime 14.4 1.4 68159900
Articles of stone or other mineral
substances, nes 19.6 1.5
26020000
Manganese
ores/concentrates(inc.ferrugino 13.3 1.3 25030000
Sulphur of all kinds (excl. sublimed,
precipitated and colloidal sulphur) 18.7 1.5
13| P a g e
Period Dec-17* Period Nov-17®
Hs-Code Description
Value
(K'Millio
n)
Share
(%) Hs-Code Description
Value
(K'Millio
n)
Sha
re
(%)
us), with manganese
cont.of=>20%
Other - NTEs Non Agric Product 451.2 42.5 Other - NTEs Non Agric Product 469.4
36.
3
% Share of December Non-Agric Products
NTEs 71.0 % Share of November Non-Agric Products NTEs 69.3
NTE''s 1 496.2 100.0 NTE''s 1 862.7
100
.0
Source: CSO, International Trade Statistics, 2017
Note: (*) Provisional
® Revised figures
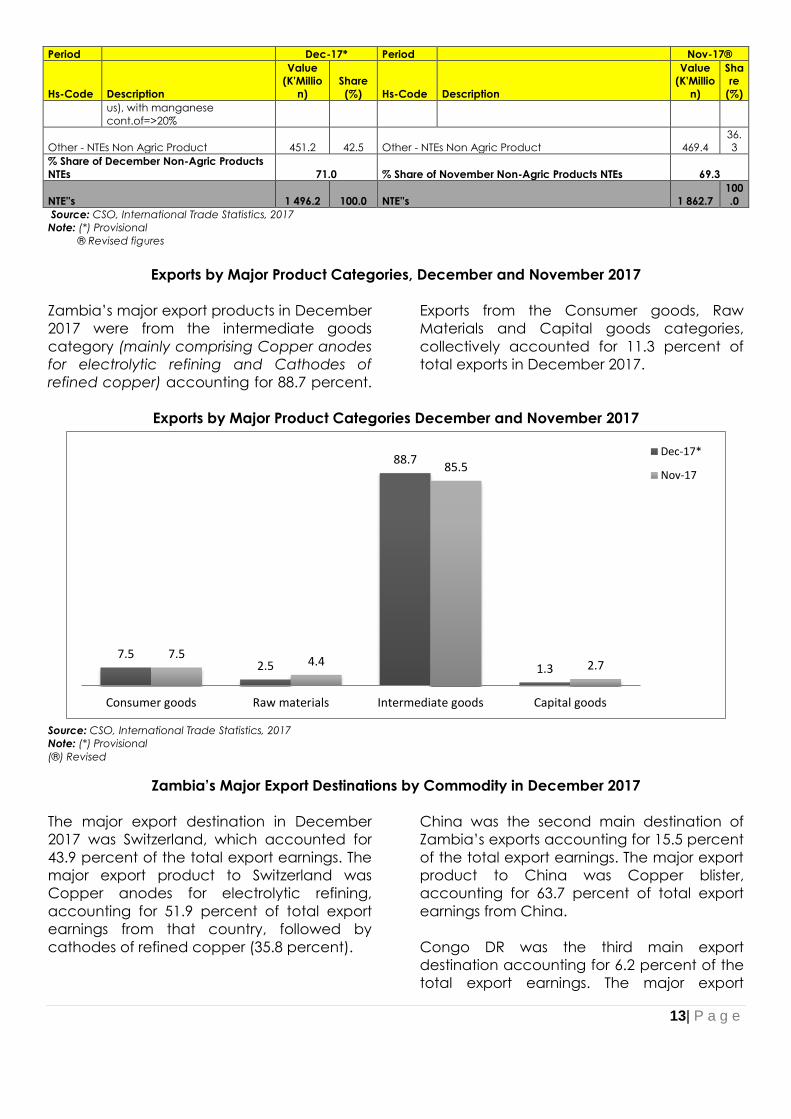
Exports by Major Product Categories, December and November 2017
Zambia’s major export products in December
2017 were from the intermediate goods
category (mainly comprising Copper anodes
for electrolytic refining and Cathodes of
refined copper) accounting for 88.7 percent.
Exports from the Consumer goods, Raw
Materials and Capital goods categories,
collectively accounted for 11.3 percent of
total exports in December 2017.
Exports by Major Product Categories December and November 2017
7.52.5
88.7
1.37.5
4.4
85.5
2.7
Consumer goods Raw materials Intermediate goods Capital goods
Dec-17*
Nov-17
Source: CSO, International Trade Statistics, 2017
Note: (*) Provisional
(®) Revised
Zambia’s Major Export Destinations by Commodity in December 2017
The major export destination in December
2017 was Switzerland, which accounted for
43.9 percent of the total export earnings. The
major export product to Switzerland was
Copper anodes for electrolytic refining,
accounting for 51.9 percent of total export
earnings from that country, followed by
cathodes of refined copper (35.8 percent).
China was the second main destination of
Zambia’s exports accounting for 15.5 percent
of the total export earnings. The major export
product to China was Copper blister,
accounting for 63.7 percent of total export
earnings from China.
Congo DR was the third main export
destination accounting for 6.2 percent of the
total export earnings. The major export

14| P a g e
product was Sulphuric acid; oleum in bulk
accounting for 23.3 percent of total export
earnings from that country.
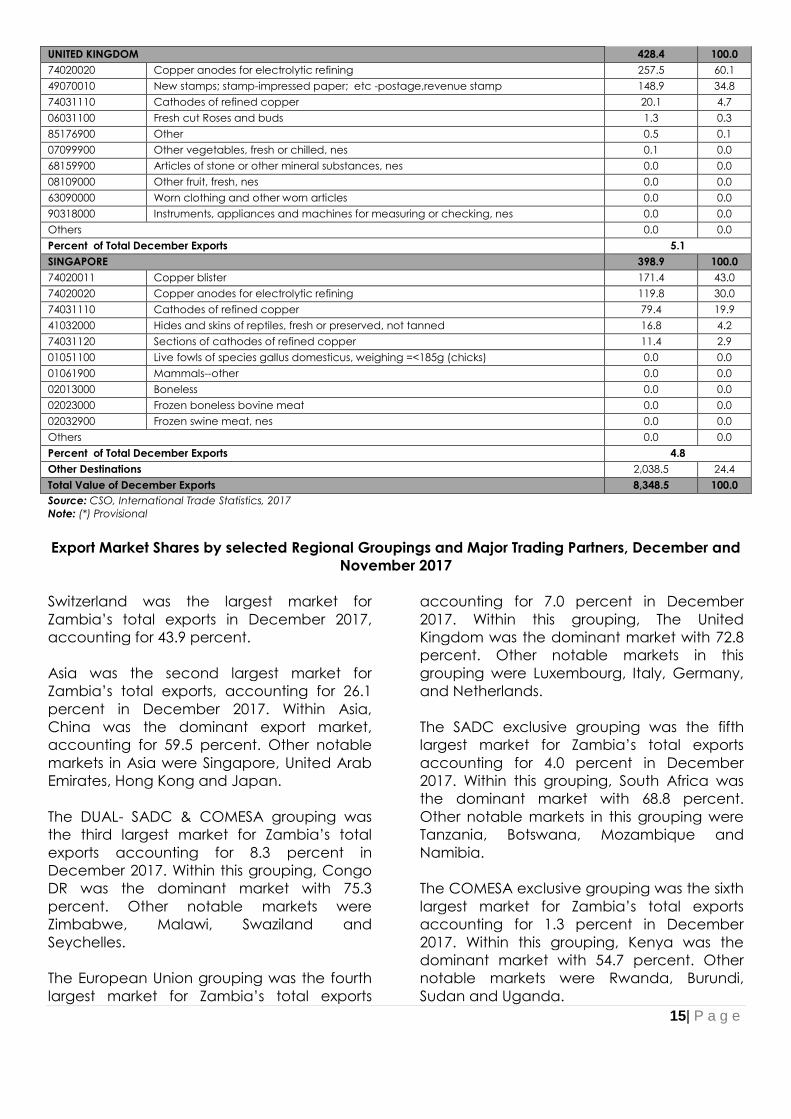
The United Kingdom was the fourth main
export destination accounting for 5.1 percent
of the total export earnings. The major export
products were Copper anodes for
electrolytic refining accounting for 60.1
percent of total export earnings from that
country.
The fifth main export destination was
Singapore, which accounted for 4.8 percent
of the total export earnings. The major export
product was Copper blister, accounting for
43.0 percent of total export earnings from
that country.
These five countries collectively accounted
for 75.6 percent of Zambia’s total export
earnings in December 2017.
Zambia's Five Major Export Destinations by Product for December 2017
Country / Hs-
Code Description
Dec-2017*
Value
(K'Million)
%
Share
SWITZERLAND 3,664.3 100.0
74020020 Copper anodes for electrolytic refining 1,900.8 51.9
74031110 Cathodes of refined copper 1,311.9 35.8
74031120 Sections of cathodes of refined copper 189.4 5.2
74020011 Copper blister 158.9 4.3
28220010 Cobalt oxides and hydroxides; commercial cobalt oxides in bulk 89.4 2.4
49070010 New stamps; stamp-impressed paper; etc -postage,revenue stamp 8.1 0.2
74031900 Other refined Copper 4.1 0.1
68159900 Articles of stone or other mineral substances, nes 0.9 0.0
74032990 Copper-cobalt alloy 0.7 0.0
26050020 Cobalt concentrate 0.1 0.0
Others 0.0 0.0
Percent of Total December Exports 43.9
CHINA 1,297.4 100.0
74020011 Copper blister 826.2 63.7
74031110 Cathodes of refined copper 230.1 17.7
74031120 Sections of cathodes of refined copper 121.0 9.3
74031900 Other refined Copper 98.6 7.6
26020000
MANGANESE ORES/CONCENTRATES(INC.FERRUGINOUS), WITH MANGANESE
CONT.OF=>20% 7.0 0.5
44032000 Untreated coniferous wood in the rough... 2.2 0.2
25223000 Hydraulic lime 2.1 0.2
44039900 Wood, nes in the rough..., (excl. treated) 1.8 0.1
44092900
Non-coniferous wood continuously shaped along any of its edges,ends of faces...,
other 1.4 0.1
24012000 Tobacco, partly or wholly stemmed/stripped 1.4 0.1
Others 5.5 0.4
Percent of Total December Exports 15.5
CONGO DR 520.9 100.0
28070010 Sulphuric acid; oleum in bulk 121.5 23.3
17011300 Raw cane sugar specified in Subheading Note 2 to this Chapter 49.9 9.6
25030000 Sulphur of all kinds (excl. sublimed, precipitated and colloidal sulphur) 30.4 5.8
17019900 Cane or beet sugar, in solid form, nes 25.4 4.9
34022000 Washing and cleaning preparations, put up for retail sale 19.0 3.7
29309010 Other organo-sulphurcompounds, nes - in bulk 17.8 3.4
19041000 Prepared foods obtained by the swelling or roasting of cereals 17.7 3.4
22029900 Other non-alcoholic beverages, nes 16.8 3.2
25222000 Slaked lime 14.3 2.8
36020090 Other prepared explosives, (excl. propellent powders) 13.0 2.5
Others 195.0 37.4
Percent of Total December Exports 6.2
15| P a g e
UNITED KINGDOM 428.4 100.0
74020020 Copper anodes for electrolytic refining 257.5 60.1
49070010 New stamps; stamp-impressed paper; etc -postage,revenue stamp 148.9 34.8
74031110 Cathodes of refined copper 20.1 4.7
06031100 Fresh cut Roses and buds 1.3 0.3
85176900 Other 0.5 0.1
07099900 Other vegetables, fresh or chilled, nes 0.1 0.0
68159900 Articles of stone or other mineral substances, nes 0.0 0.0
08109000 Other fruit, fresh, nes 0.0 0.0
63090000 Worn clothing and other worn articles 0.0 0.0
90318000 Instruments, appliances and machines for measuring or checking, nes 0.0 0.0
Others 0.0 0.0
Percent of Total December Exports 5.1
SINGAPORE 398.9 100.0
74020011 Copper blister 171.4 43.0
74020020 Copper anodes for electrolytic refining 119.8 30.0
74031110 Cathodes of refined copper 79.4 19.9
41032000 Hides and skins of reptiles, fresh or preserved, not tanned 16.8 4.2
74031120 Sections of cathodes of refined copper 11.4 2.9
01051100 Live fowls of species gallus domesticus, weighing =<185g (chicks) 0.0 0.0
01061900 Mammals--other 0.0 0.0
02013000 Boneless 0.0 0.0
02023000 Frozen boneless bovine meat 0.0 0.0
02032900 Frozen swine meat, nes 0.0 0.0
Others 0.0 0.0
Percent of Total December Exports 4.8
Other Destinations 2,038.5 24.4
Total Value of December Exports 8,348.5 100.0
Source: CSO, International Trade Statistics, 2017
Note: (*) Provisional
Export Market Shares by selected Regional Groupings and Major Trading Partners, December and
November 2017
Switzerland was the largest market for
Zambia’s total exports in December 2017,
accounting for 43.9 percent.
Asia was the second largest market for
Zambia’s total exports, accounting for 26.1
percent in December 2017. Within Asia,
China was the dominant export market,
accounting for 59.5 percent. Other notable
markets in Asia were Singapore, United Arab
Emirates, Hong Kong and Japan.
The DUAL- SADC & COMESA grouping was
the third largest market for Zambia’s total
exports accounting for 8.3 percent in
December 2017. Within this grouping, Congo
DR was the dominant market with 75.3
percent. Other notable markets were
Zimbabwe, Malawi, Swaziland and
Seychelles.
The European Union grouping was the fourth
largest market for Zambia’s total exports
accounting for 7.0 percent in December
2017. Within this grouping, The United
Kingdom was the dominant market with 72.8
percent. Other notable markets in this
grouping were Luxembourg, Italy, Germany,
and Netherlands.
The SADC exclusive grouping was the fifth
largest market for Zambia’s total exports
accounting for 4.0 percent in December
2017. Within this grouping, South Africa was
the dominant market with 68.8 percent.
Other notable markets in this grouping were
Tanzania, Botswana, Mozambique and
Namibia.
The COMESA exclusive grouping was the sixth
largest market for Zambia’s total exports
accounting for 1.3 percent in December
2017. Within this grouping, Kenya was the
dominant market with 54.7 percent. Other
notable markets were Rwanda, Burundi,
Sudan and Uganda.

16| P a g e
Export Market Shares by Selected Regional Groupings, December and November 2017
GROUPING Dec-17*
GROUPING Nov-17®
Value (K'Million) % Share Value (K'Million) % Share
ASIA 2,180.5 100.0 ASIA 2,256.7 100.0
CHINA 1,297.4 59.5 CHINA 1,231.3 54.6
SINGAPORE 398.9 18.3 UNITED ARAB EMIRATES 356.0 15.8
UNITED ARAB EMIRATES 336.8 15.4 SINGAPORE 283.9 12.6
HONG KONG 89.0 4.1 INDIA 200.6 8.9
JAPAN 27.9 1.3 HONG KONG 165.7 7.3
Other ASIA 30.5 1.4 Other ASIA 19.3 0.9
% of Total December Exports 26.1 % of Total November Exports 26.0
DUAL-SADC & COMESA 692.1 100.0 DUAL-SADC & COMESA 698.7 100.0
CONGO DR 520.9 75.3 CONGO DR 513.3 73.5
ZIMBABWE 121.7 17.6 ZIMBABWE 123.4 17.7
MALAWI 44.8 6.5 MALAWI 60.4 8.6
SWAZILAND 4.5 0.7 SWAZILAND 1.7 0.2
SEYCHELLES 0.1 0.0 MADAGASCAR 0.0 0.0
Other DUAL-SADC & COMESA 0.0 0.0 Other DUAL-SADC & COMESA 0.0 0.0
% of Total December Exports 8.3 % of Total November Exports 8.0
EUROPEAN UNION 588.2 100.0 EUROPEAN UNION 255.6 100.0
UNITED KINGDOM 428.4 72.8 UNITED KINGDOM 198.3 77.6
LUXEMBOURG 142.5 24.2 GERMANY 29.8 11.7
ITALY 5.7 1.0 NETHERLANDS 7.1 2.8
GERMANY 5.4 0.9 DENMARK 5.8 2.3
NETHERLANDS 3.8 0.6 ITALY 4.0 1.6
Other EU 2.5 0.4 Other EU 10.6 4.1
% of Total December Exports 7.0 % of Total November Exports 2.9
SADC EXCLUSIVE 333.8 100.0 SADC EXCLUSIVE 704.5 100.0
SOUTH AFRICA 229.5 68.8 SOUTH AFRICA 515.0 73.1
TANZANIA 61.5 18.4 BOTSWANA 84.9 12.0
BOTSWANA 16.8 5.0 TANZANIA 73.9 10.5
MOZAMBIQUE 15.1 4.5 MOZAMBIQUE 19.2 2.7
NAMIBIA 7.6 2.3 NAMIBIA 8.8 1.2
Other SADC EXCLUSIVE 3.3 1.0 Other SADC EXCLUSIVE 2.8 0.4
% of Total December Exports 4.0 % of Total November Exports 8.1
COMESA EXCLUSIVE 111.1 100.0 COMESA EXCLUSIVE 152.9 100.0
KENYA 60.7 54.7 KENYA 78.9 51.6
RWANDA 20.7 18.6 RWANDA 34.4 22.5
BURUNDI 19.0 17.1 BURUNDI 24.2 15.8
SUDAN 6.2 5.6 ETHIOPIA 11.4 7.4
UGANDA 4.5 4.1 UGANDA 4.1 2.7
Other COMESA EXCLUSIVE 0.0 0.0 Other COMESA EXCLUSIVE 0.0 0.0
% of Total December Exports 1.3 % of Total November Exports 1.8
SWITZERLAND 3,664.3 43.9 SWITZERLAND 3,991.0 45.9
Rest of the World 778.4 9.3 Rest of the World 632.5 7.3
World 8,348.5 100.0 World 8,691.9 100.0
Source: CSO, International Trade Statistics, 2017
Note: (*) Provisional
® Revised Note: 1. SADC = (SADC EXCLUSIVE + Dual SADC & COMESA)
2. COMESA = (COMESA Exclusive + Dual SADC & COMESA)
Switzerland Does not belong to any Regional grouping but is our Major Export Destination
Imports by Major Product Categories, December and November 2017
The major import products by category in
December 2017 were Capital goods
category, accounting for 30.5 percent.
The Consumer goods category was
second with 27.6 percent, followed by
the intermediate goods and Raw
materials Categories, accounting for 26.6
percent and 15.3 percent, respectively.

17| P a g e
Imports (cif) by Major Product Categories, December and November 2017
27.6
15.3
26.6
30.5
24.4
17.4
28.429.8
Consumer goods Raw materials Intermediate goods Capital goods
Dec-17*
Nov-17
Source: CSO, International Trade Statistics, 2017
Note: (*) Provisional
Zambia’s Major Import Sources by Product in December 2017
The major source of imports in December
2017 was South Africa, accounting for
26.2 percent. The major import product
was gas oils, accounting for 3.1 percent
of imports from that country.
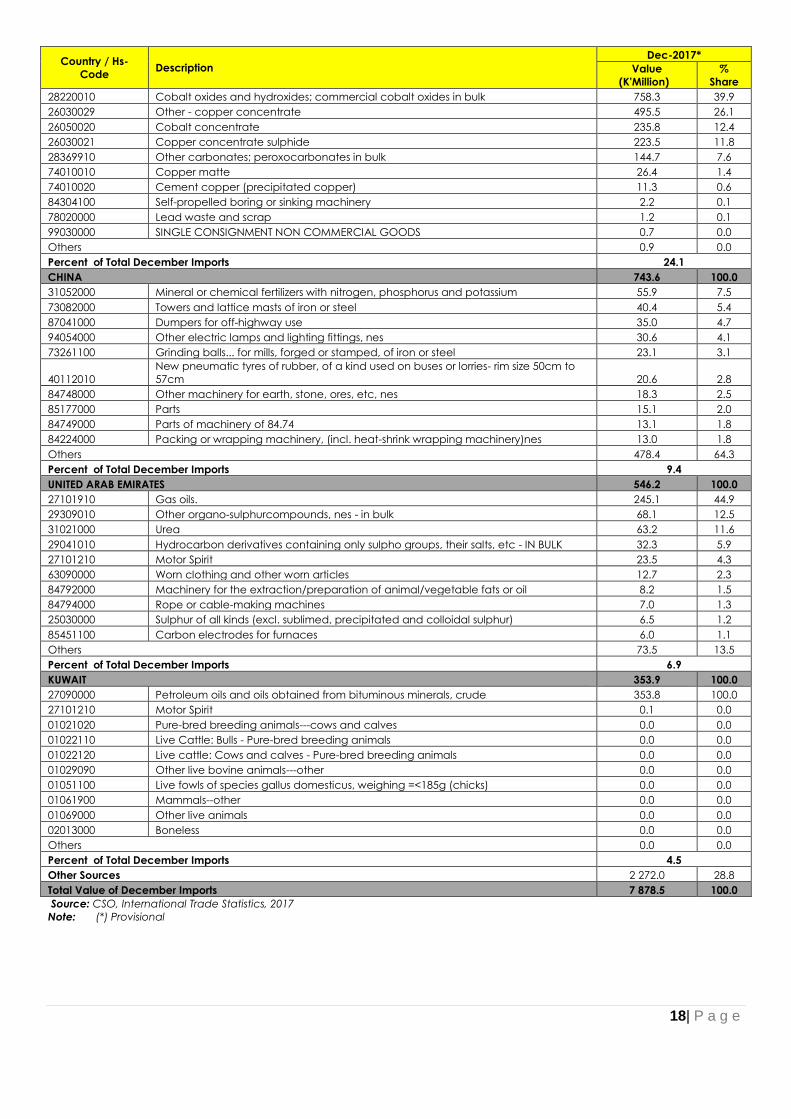
The second major source was Congo DR,
accounting for 24.1 percent. The major
import products were Cobalt oxides and
hydroxides; commercial cobalt oxides in
bulk which accounted for 39.9 percent of
imports from Congo DR.
China was the third main source of
Zambia’s imports, accounting for 9.4
percent. The major import products were
Mineral or chemical fertilizers with
nitrogen, phosphorous and potassium
accounting for 7.5 percent of imports
from China.
Other major sources of Zambia’s imports
were United Arab Emirates and Kuwait,
which collectively accounted for 11.4
percent of Zambia’s imports.
Zambia’s Five Major Import Sources by Product for December, 2017
Country / Hs-
Code Description
Dec-2017*
Value
(K'Million)
%
Share
SOUTH AFRICA 2 062.2 100.0
27101910 Gas oils. 63.7 3.1
25030000 Sulphur of all kinds (excl. sublimed, precipitated and colloidal sulphur) 60.8 2.9
84314900 Parts of machinery of 84.26, 84.29 and 84.30, nes 47.1 2.3
87042100 vehicles (diesel engine) for the transport of goods GVW upto 5 tonnes 43.8 2.1
87012000 Road tractors for semi-trailers 41.5 2.0
31021000 Urea 40.7 2.0
84139100 Parts of pumps for liquids 34.3 1.7
31023000 Ammonium nitrate 31.0 1.5
84749000 Parts of machinery of 84.74 28.8 1.4
39021090 Other Polypropylene, in primary forms, Pigmented 25.0 1.2
Others 1 645.5 79.8
Percent of Total December Imports 26.2
CONGO DR 1 900.5 100.0
18| P a g e
Country / Hs-
Code Description
Dec-2017*
Value
(K'Million)
%
Share
28220010 Cobalt oxides and hydroxides; commercial cobalt oxides in bulk 758.3 39.9
26030029 Other - copper concentrate 495.5 26.1
26050020 Cobalt concentrate 235.8 12.4
26030021 Copper concentrate sulphide 223.5 11.8
28369910 Other carbonates; peroxocarbonates in bulk 144.7 7.6
74010010 Copper matte 26.4 1.4
74010020 Cement copper (precipitated copper) 11.3 0.6
84304100 Self-propelled boring or sinking machinery 2.2 0.1
78020000 Lead waste and scrap 1.2 0.1
99030000 SINGLE CONSIGNMENT NON COMMERCIAL GOODS 0.7 0.0
Others 0.9 0.0
Percent of Total December Imports 24.1
CHINA 743.6 100.0
31052000 Mineral or chemical fertilizers with nitrogen, phosphorus and potassium 55.9 7.5
73082000 Towers and lattice masts of iron or steel 40.4 5.4
87041000 Dumpers for off-highway use 35.0 4.7
94054000 Other electric lamps and lighting fittings, nes 30.6 4.1
73261100 Grinding balls... for mills, forged or stamped, of iron or steel 23.1 3.1
40112010
New pneumatic tyres of rubber, of a kind used on buses or lorries- rim size 50cm to
57cm 20.6 2.8
84748000 Other machinery for earth, stone, ores, etc, nes 18.3 2.5
85177000 Parts 15.1 2.0
84749000 Parts of machinery of 84.74 13.1 1.8
84224000 Packing or wrapping machinery, (incl. heat-shrink wrapping machinery)nes 13.0 1.8
Others 478.4 64.3
Percent of Total December Imports 9.4
UNITED ARAB EMIRATES 546.2 100.0
27101910 Gas oils. 245.1 44.9
29309010 Other organo-sulphurcompounds, nes - in bulk 68.1 12.5
31021000 Urea 63.2 11.6
29041010 Hydrocarbon derivatives containing only sulpho groups, their salts, etc - IN BULK 32.3 5.9
27101210 Motor Spirit 23.5 4.3
63090000 Worn clothing and other worn articles 12.7 2.3
84792000 Machinery for the extraction/preparation of animal/vegetable fats or oil 8.2 1.5
84794000 Rope or cable-making machines 7.0 1.3
25030000 Sulphur of all kinds (excl. sublimed, precipitated and colloidal sulphur) 6.5 1.2
85451100 Carbon electrodes for furnaces 6.0 1.1
Others 73.5 13.5
Percent of Total December Imports 6.9
KUWAIT 353.9 100.0
27090000 Petroleum oils and oils obtained from bituminous minerals, crude 353.8 100.0
27101210 Motor Spirit 0.1 0.0
01021020 Pure-bred breeding animals---cows and calves 0.0 0.0
01022110 Live Cattle: Bulls - Pure-bred breeding animals 0.0 0.0
01022120 Live cattle: Cows and calves - Pure-bred breeding animals 0.0 0.0
01029090 Other live bovine animals---other 0.0 0.0
01051100 Live fowls of species gallus domesticus, weighing =<185g (chicks) 0.0 0.0
01061900 Mammals--other 0.0 0.0
01069000 Other live animals 0.0 0.0
02013000 Boneless 0.0 0.0
Others 0.0 0.0
Percent of Total December Imports 4.5
Other Sources 2 272.0 28.8
Total Value of December Imports 7 878.5 100.0
Source: CSO, International Trade Statistics, 2017
Note: (*) Provisional
19| P a g e
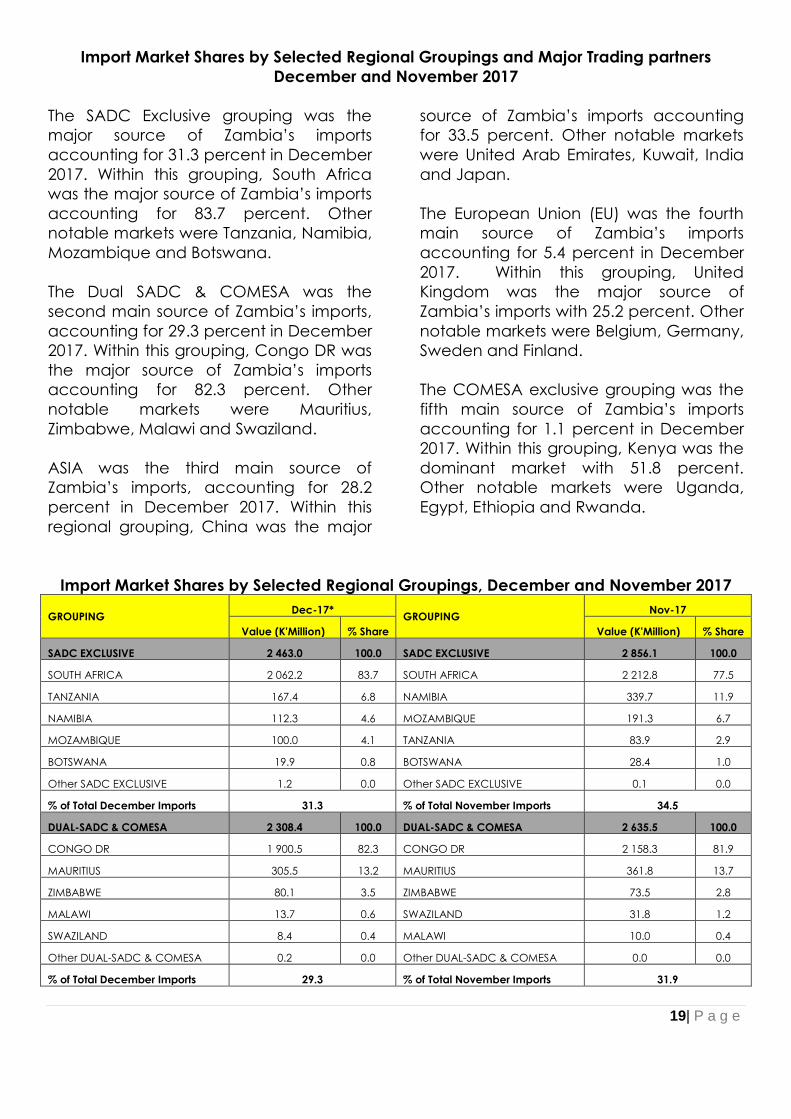
Import Market Shares by Selected Regional Groupings and Major Trading partners
December and November 2017
The SADC Exclusive grouping was the
major source of Zambia’s imports
accounting for 31.3 percent in December
2017. Within this grouping, South Africa
was the major source of Zambia’s imports
accounting for 83.7 percent. Other
notable markets were Tanzania, Namibia,
Mozambique and Botswana.
The Dual SADC & COMESA was the
second main source of Zambia’s imports,
accounting for 29.3 percent in December
2017. Within this grouping, Congo DR was
the major source of Zambia’s imports
accounting for 82.3 percent. Other
notable markets were Mauritius,
Zimbabwe, Malawi and Swaziland.
ASIA was the third main source of
Zambia’s imports, accounting for 28.2
percent in December 2017. Within this
regional grouping, China was the major
source of Zambia’s imports accounting
for 33.5 percent. Other notable markets
were United Arab Emirates, Kuwait, India
and Japan.
The European Union (EU) was the fourth
main source of Zambia’s imports
accounting for 5.4 percent in December
2017. Within this grouping, United
Kingdom was the major source of
Zambia’s imports with 25.2 percent. Other
notable markets were Belgium, Germany,
Sweden and Finland.
The COMESA exclusive grouping was the
fifth main source of Zambia’s imports
accounting for 1.1 percent in December
2017. Within this grouping, Kenya was the
dominant market with 51.8 percent.
Other notable markets were Uganda,
Egypt, Ethiopia and Rwanda.
Import Market Shares by Selected Regional Groupings, December and November 2017
GROUPING Dec-17*
GROUPING Nov-17
Value (K'Million) % Share Value (K'Million) % Share
SADC EXCLUSIVE 2 463.0 100.0 SADC EXCLUSIVE 2 856.1 100.0
SOUTH AFRICA 2 062.2 83.7 SOUTH AFRICA 2 212.8 77.5
TANZANIA 167.4 6.8 NAMIBIA 339.7 11.9
NAMIBIA 112.3 4.6 MOZAMBIQUE 191.3 6.7
MOZAMBIQUE 100.0 4.1 TANZANIA 83.9 2.9
BOTSWANA 19.9 0.8 BOTSWANA 28.4 1.0
Other SADC EXCLUSIVE 1.2 0.0 Other SADC EXCLUSIVE 0.1 0.0
% of Total December Imports 31.3 % of Total November Imports 34.5
DUAL-SADC & COMESA 2 308.4 100.0 DUAL-SADC & COMESA 2 635.5 100.0
CONGO DR 1 900.5 82.3 CONGO DR 2 158.3 81.9
MAURITIUS 305.5 13.2 MAURITIUS 361.8 13.7
ZIMBABWE 80.1 3.5 ZIMBABWE 73.5 2.8
MALAWI 13.7 0.6 SWAZILAND 31.8 1.2
SWAZILAND 8.4 0.4 MALAWI 10.0 0.4
Other DUAL-SADC & COMESA 0.2 0.0 Other DUAL-SADC & COMESA 0.0 0.0
% of Total December Imports 29.3 % of Total November Imports 31.9

2 0 | P a g e
GROUPING Dec-17*
GROUPING Nov-17
Value (K'Million) % Share Value (K'Million) % Share
ASIA 2 219.0 100.0 ASIA 1 895.9 100.0
CHINA 743.6 33.5 CHINA 780.7 41.2
UNITED ARAB EMIRATES 546.2 24.6 UNITED ARAB EMIRATES 361.6 19.1
KUWAIT 353.9 16.0 INDIA 271.3 14.3
INDIA 217.6 9.8 JAPAN 126.3 6.7
JAPAN 102.5 4.6 HONG KONG 87.0 4.6
Other ASIA 255.2 11.5 Other ASIA 269.1 14.2
% of Total December Imports 28.2 % of Total November Imports 22.9
EUROPEAN UNION 426.3 100.0 EUROPEAN UNION 497.9 100.0
UNITED KINGDOM 107.2 25.2 UNITED KINGDOM 125.4 25.2
BELGIUM 53.7 12.6 GERMANY 55.2 11.1
GERMANY 49.8 11.7 IRELAND 52.3 10.5
SWEDEN 46.0 10.8 NETHERLANDS 48.2 9.7
FINLAND 42.0 9.8 BELGIUM 46.0 9.2
Other EU 127.4 29.9 Other EU 171.0 34.3
% of Total December Imports 5.4 % of Total November Imports 6.0
COMESA EXCLUSIVE 83.0 100.0 COMESA EXCLUSIVE 51.4 100.0
KENYA 43.0 51.8 KENYA 32.6 63.4
UGANDA 25.1 30.2 EGYPT 18.3 35.6
EGYPT 15.0 18.0 UGANDA 0.5 1.0
ETHIOPIA 0.0 0.0 RWANDA 0.0 0.0
RWANDA 0.0 0.0 BURUNDI 0.0 0.0
Other COMESA EXCLUSIVE 0.0 0.0 Other COMESA EXCLUSIVE 0.0 0.0
% of Total December Imports 1.1 % of Total November Imports 0.6
Rest of the World 378.8 4.8 Rest of the World 333.4 4.0
World 7 878.5 100.0 World 8 270.2 100.0
Source: CSO, International Trade Statistics, 2017
Note: (*) Provisional
(R) Revised figures
2 1 | P a g e
CURRENT LABOUR MARKET STATISTICS
The 2017 Quarterly Labour Force Survey
(QLFS) was based on the resolutions of
the 19th International Conference of
Labour Statisticians (19th ICLS) of 2013.
The key revisions contained in the
resolution mainly relate to the definition of
work, employment, unemployment, as
well as the introduction and elaboration
of measures of labour underutilization
(underemployment) and potential labour
force. The resolution also emphasizes on
the exclusion from employment of
activities such as collection of firewood,
fetching water, production of goods and
services for own use.
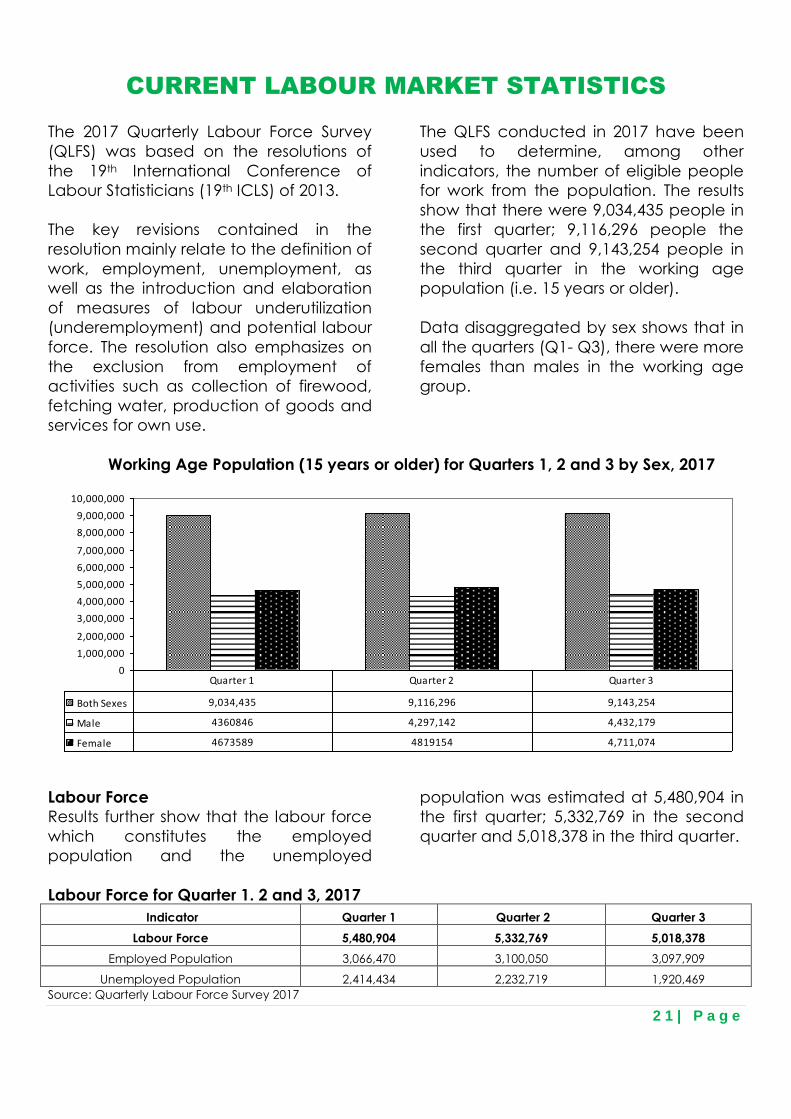
The QLFS conducted in 2017 have been
used to determine, among other
indicators, the number of eligible people
for work from the population. The results
show that there were 9,034,435 people in
the first quarter; 9,116,296 people the
second quarter and 9,143,254 people in
the third quarter in the working age
population (i.e. 15 years or older).
Data disaggregated by sex shows that in
all the quarters (Q1- Q3), there were more
females than males in the working age
group.
Working Age Population (15 years or older) for Quarters 1, 2 and 3 by Sex, 2017
0
1,000,000
2,000,000
3,000,000
4,000,000
5,000,000
6,000,000
7,000,000
8,000,000
9,000,000
10,000,000
Both Sexes 9,034,435 9,116,296 9,143,254
Male 4360846 4,297,142 4,432,179
Female 4673589 4819154 4,711,074
Quarter 1 Quarter 2 Quarter 3
Labour Force
Results further show that the labour force
which constitutes the employed
population and the unemployed
population was estimated at 5,480,904 in
the first quarter; 5,332,769 in the second
quarter and 5,018,378 in the third quarter.
Labour Force for Quarter 1. 2 and 3, 2017
Indicator Quarter 1 Quarter 2 Quarter 3
Labour Force 5,480,904 5,332,769 5,018,378
Employed Population 3,066,470 3,100,050 3,097,909
Unemployed Population 2,414,434 2,232,719 1,920,469
Source: Quarterly Labour Force Survey 2017
2 2 | P a g e
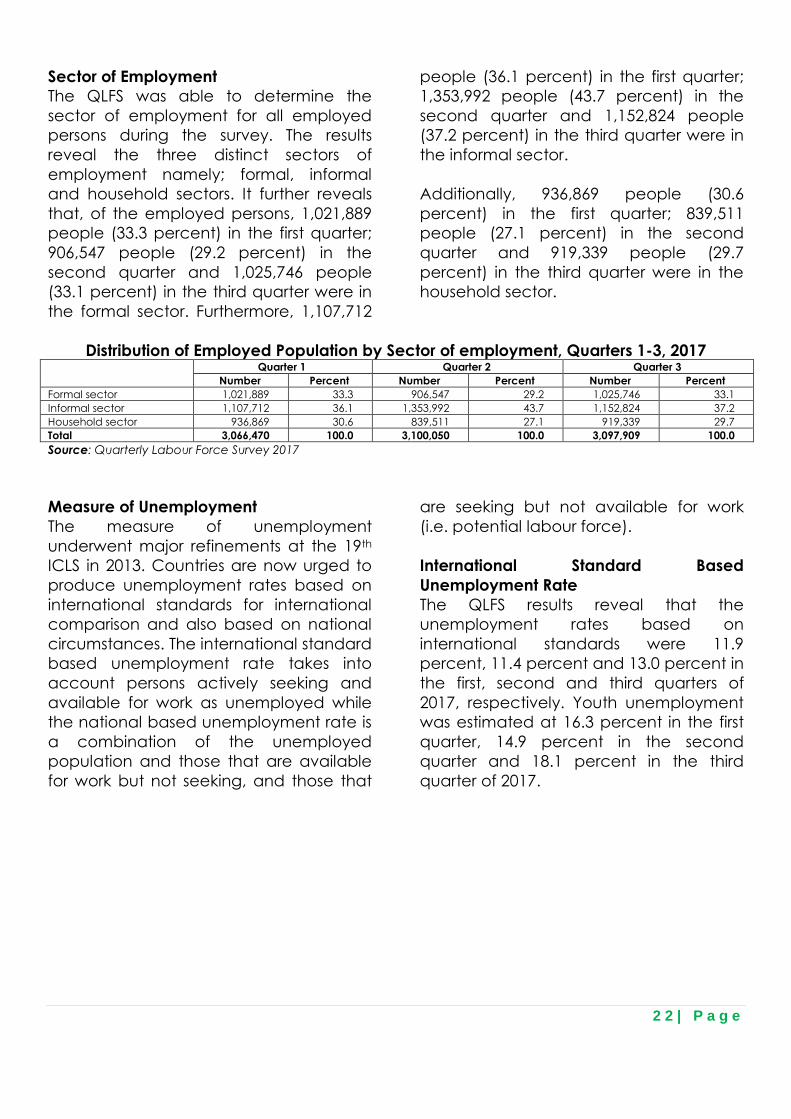
Sector of Employment
The QLFS was able to determine the
sector of employment for all employed
persons during the survey. The results
reveal the three distinct sectors of
employment namely; formal, informal
and household sectors. It further reveals
that, of the employed persons, 1,021,889
people (33.3 percent) in the first quarter;
906,547 people (29.2 percent) in the
second quarter and 1,025,746 people
(33.1 percent) in the third quarter were in
the formal sector. Furthermore, 1,107,712
people (36.1 percent) in the first quarter;
1,353,992 people (43.7 percent) in the
second quarter and 1,152,824 people
(37.2 percent) in the third quarter were in
the informal sector.
Additionally, 936,869 people (30.6
percent) in the first quarter; 839,511
people (27.1 percent) in the second
quarter and 919,339 people (29.7
percent) in the third quarter were in the
household sector.
Distribution of Employed Population by Sector of employment, Quarters 1-3, 2017 Quarter 1 Quarter 2 Quarter 3
Number Percent Number Percent Number Percent
Formal sector 1,021,889 33.3 906,547 29.2 1,025,746 33.1
Informal sector 1,107,712 36.1 1,353,992 43.7 1,152,824 37.2
Household sector 936,869 30.6 839,511 27.1 919,339 29.7
Total 3,066,470 100.0 3,100,050 100.0 3,097,909 100.0
Source: Quarterly Labour Force Survey 2017
Measure of Unemployment
The measure of unemployment
underwent major refinements at the 19th
ICLS in 2013. Countries are now urged to
produce unemployment rates based on
international standards for international
comparison and also based on national
circumstances. The international standard
based unemployment rate takes into
account persons actively seeking and
available for work as unemployed while
the national based unemployment rate is
a combination of the unemployed
population and those that are available
for work but not seeking, and those that
are seeking but not available for work
(i.e. potential labour force).
International Standard Based
Unemployment Rate
The QLFS results reveal that the
unemployment rates based on
international standards were 11.9
percent, 11.4 percent and 13.0 percent in
the first, second and third quarters of
2017, respectively. Youth unemployment
was estimated at 16.3 percent in the first
quarter, 14.9 percent in the second
quarter and 18.1 percent in the third
quarter of 2017.

2 3 | P a g e
Unemployment rate (Overall and Youth) based on international standards, Quarter 1,
Quarter 2 and Quarter 3, 2017
11.9 11.4
13.0
16.314.9
18.1
0
2
4
6
8
10
12
14
16
18
20
Quarter 1 Quarter 2 Quarter 3
Per
cen
tage
Overall unemployment rate Youth unemployment rate
Source: Quarterly Labour Force Survey 2017
National Standard Based Unemployment
Rate
The QLFS results also reveal that the
National unemployment rate were 44.1
percent, 41.9 percent and 38.3 percent in
the first, second and third quarters of
2017, respectively. Youth unemployment
rate was estimated at 51.1 percent in the
first quarter, 48.0 percent in the second
quarter and 45.5 percent in the third
quarter of 2017.
National unemployment rate (Overall and Youth), Quarter 1, Quarter 2 and Quarter 3,
2017
44.141.9
38.3
51.148.0
45.5
0
10
20
30
40
50
60
Quarter 1 Quarter 2 Quarter 3
Per
cen
tage
Overall unemployment Rate Youth unemployment rate
Source: Quarterly Labour Force Survey 2017
2 4 | P a g e
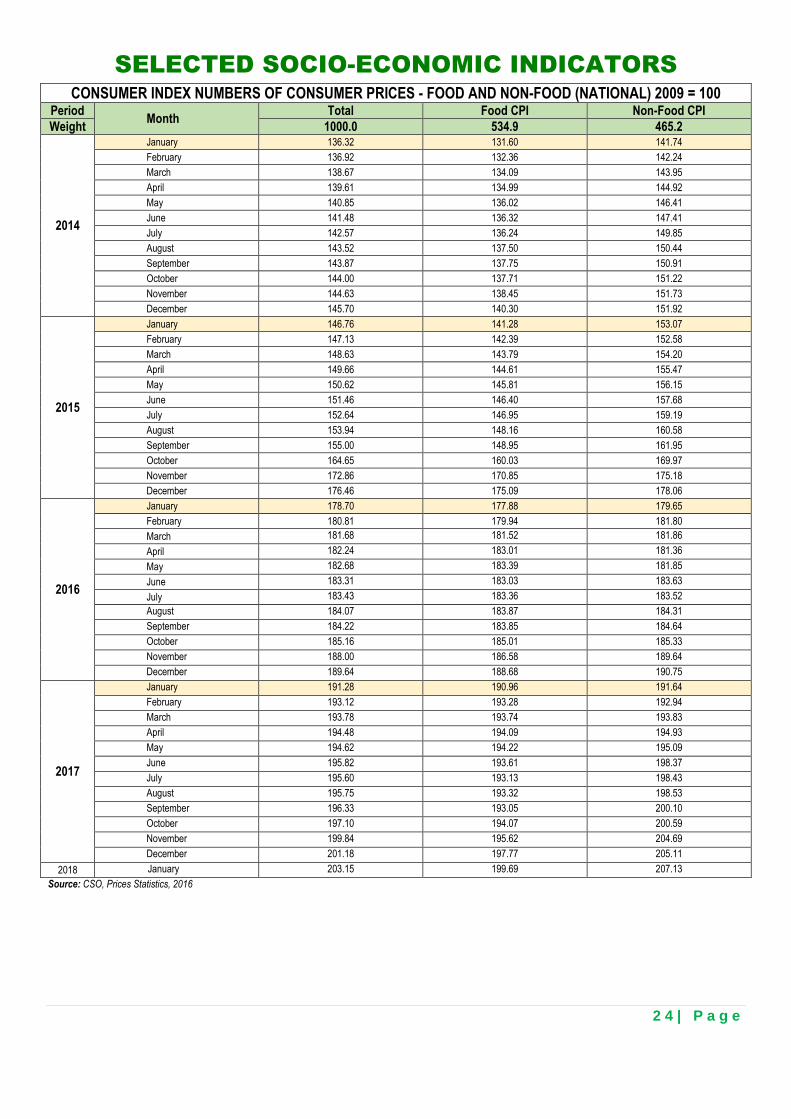
SELECTED SOCIO-ECONOMIC INDICATORS
Source: CSO, Prices Statistics, 2016
CONSUMER INDEX NUMBERS OF CONSUMER PRICES - FOOD AND NON-FOOD (NATIONAL) 2009 = 100
Period Month
Total Food CPI Non-Food CPI
Weight 1000.0 534.9 465.2
2014
January 136.32 131.60 141.74
February 136.92 132.36 142.24
March 138.67 134.09 143.95
April 139.61 134.99 144.92
May 140.85 136.02 146.41
June 141.48 136.32 147.41
July 142.57 136.24 149.85
August 143.52 137.50 150.44
September 143.87 137.75 150.91
October 144.00 137.71 151.22
November 144.63 138.45 151.73
December 145.70 140.30 151.92
2015
January 146.76 141.28 153.07
February 147.13 142.39 152.58
March 148.63 143.79 154.20
April 149.66 144.61 155.47
May 150.62 145.81 156.15
June 151.46 146.40 157.68
July 152.64 146.95 159.19
August 153.94 148.16 160.58
September 155.00 148.95 161.95
October 164.65 160.03 169.97
November 172.86 170.85 175.18
December 176.46 175.09 178.06
2016
January 178.70 177.88 179.65
February 180.81 179.94 181.80
March 181.68 181.52 181.86
April 182.24 183.01 181.36
May 182.68 183.39 181.85
June 183.31 183.03 183.63
July 183.43 183.36 183.52
August 184.07 183.87 184.31
September 184.22 183.85 184.64
October 185.16 185.01 185.33
November 188.00 186.58 189.64
December 189.64 188.68 190.75
2017
January 191.28 190.96 191.64
February 193.12 193.28 192.94
March 193.78 193.74 193.83
April 194.48 194.09 194.93
May 194.62 194.22 195.09
June 195.82 193.61 198.37
July 195.60 193.13 198.43
August 195.75 193.32 198.53
September 196.33 193.05 200.10
October 197.10 194.07 200.59
November 199.84 195.62 204.69
December 201.18 197.77 205.11
2018 January 203.15 199.69 207.13
2 5 | P a g e
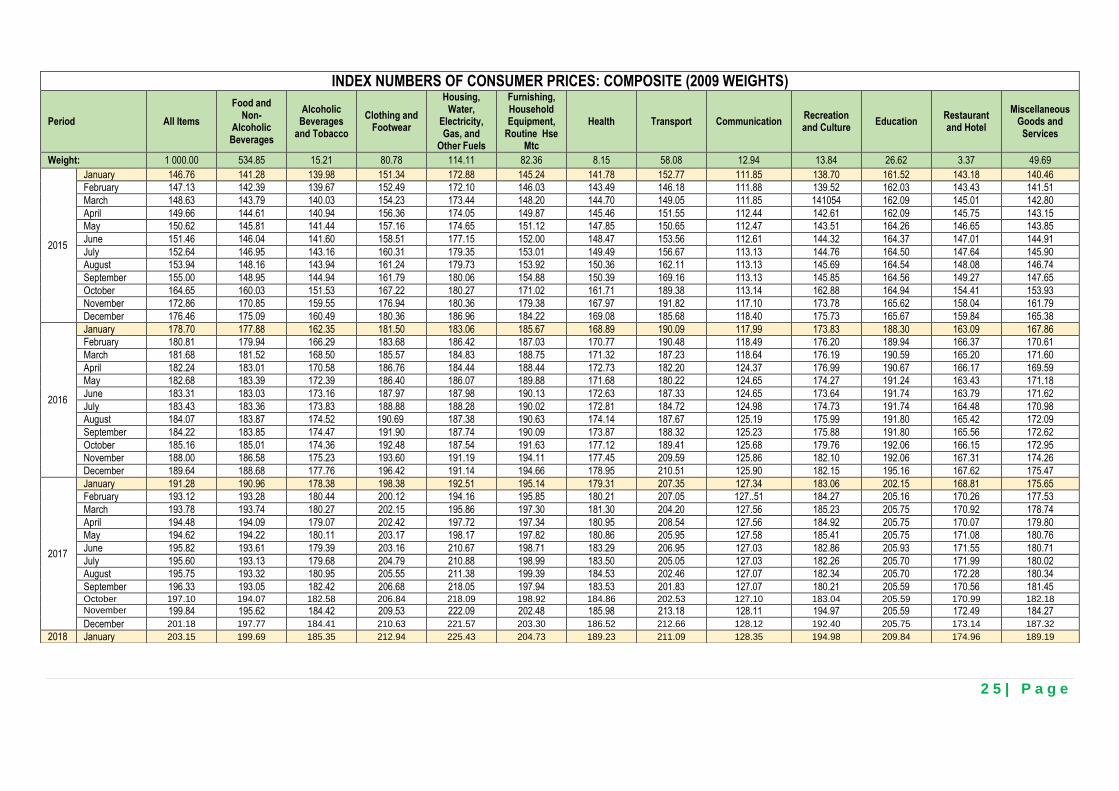
INDEX NUMBERS OF CONSUMER PRICES: COMPOSITE (2009 WEIGHTS)
Period All Items
Food and Non-
Alcoholic Beverages
Alcoholic Beverages
and Tobacco
Clothing and Footwear
Housing, Water,
Electricity, Gas, and
Other Fuels
Furnishing, Household Equipment,
Routine Hse Mtc
Health Transport Communication Recreation and Culture
Education Restaurant and Hotel
Miscellaneous Goods and
Services
Weight: 1 000.00 534.85 15.21 80.78 114.11 82.36 8.15 58.08 12.94 13.84 26.62 3.37 49.69
2015
January 146.76 141.28 139.98 151.34 172.88 145.24 141.78 152.77 111.85 138.70 161.52 143.18 140.46
February 147.13 142.39 139.67 152.49 172.10 146.03 143.49 146.18 111.88 139.52 162.03 143.43 141.51
March 148.63 143.79 140.03 154.23 173.44 148.20 144.70 149.05 111.85 141054 162.09 145.01 142.80
April 149.66 144.61 140.94 156.36 174.05 149.87 145.46 151.55 112.44 142.61 162.09 145.75 143.15
May 150.62 145.81 141.44 157.16 174.65 151.12 147.85 150.65 112.47 143.51 164.26 146.65 143.85
June 151.46 146.04 141.60 158.51 177.15 152.00 148.47 153.56 112.61 144.32 164.37 147.01 144.91
July 152.64 146.95 143.16 160.31 179.35 153.01 149.49 156.67 113.13 144.76 164.50 147.64 145.90
August 153.94 148.16 143.94 161.24 179.73 153.92 150.36 162.11 113.13 145.69 164.54 148.08 146.74
September 155.00 148.95 144.94 161.79 180.06 154.88 150.39 169.16 113.13 145.85 164.56 149.27 147.65
October 164.65 160.03 151.53 167.22 180.27 171.02 161.71 189.38 113.14 162.88 164.94 154.41 153.93
November 172.86 170.85 159.55 176.94 180.36 179.38 167.97 191.82 117.10 173.78 165.62 158.04 161.79
December 176.46 175.09 160.49 180.36 186.96 184.22 169.08 185.68 118.40 175.73 165.67 159.84 165.38
2016
January 178.70 177.88 162.35 181.50 183.06 185.67 168.89 190.09 117.99 173.83 188.30 163.09 167.86
February 180.81 179.94 166.29 183.68 186.42 187.03 170.77 190.48 118.49 176.20 189.94 166.37 170.61
March 181.68 181.52 168.50 185.57 184.83 188.75 171.32 187.23 118.64 176.19 190.59 165.20 171.60
April 182.24 183.01 170.58 186.76 184.44 188.44 172.73 182.20 124.37 176.99 190.67 166.17 169.59
May 182.68 183.39 172.39 186.40 186.07 189.88 171.68 180.22 124.65 174.27 191.24 163.43 171.18
June 183.31 183.03 173.16 187.97 187.98 190.13 172.63 187.33 124.65 173.64 191.74 163.79 171.62
July 183.43 183.36 173.83 188.88 188.28 190.02 172.81 184.72 124.98 174.73 191.74 164.48 170.98
August 184.07 183.87 174.52 190.69 187.38 190.63 174.14 187.67 125.19 175.99 191.80 165.42 172.09
September 184.22 183.85 174.47 191.90 187.74 190.09 173.87 188.32 125.23 175.88 191.80 165.56 172.62
October 185.16 185.01 174.36 192.48 187.54 191.63 177.12 189.41 125.68 179.76 192.06 166.15 172.95
November 188.00 186.58 175.23 193.60 191.19 194.11 177.45 209.59 125.86 182.10 192.06 167.31 174.26
December 189.64 188.68 177.76 196.42 191.14 194.66 178.95 210.51 125.90 182.15 195.16 167.62 175.47
2017
January 191.28 190.96 178.38 198.38 192.51 195.14 179.31 207.35 127.34 183.06 202.15 168.81 175.65
February 193.12 193.28 180.44 200.12 194.16 195.85 180.21 207.05 127..51 184.27 205.16 170.26 177.53
March 193.78 193.74 180.27 202.15 195.86 197.30 181.30 204.20 127.56 185.23 205.75 170.92 178.74
April 194.48 194.09 179.07 202.42 197.72 197.34 180.95 208.54 127.56 184.92 205.75 170.07 179.80
May 194.62 194.22 180.11 203.17 198.17 197.82 180.86 205.95 127.58 185.41 205.75 171.08 180.76
June 195.82 193.61 179.39 203.16 210.67 198.71 183.29 206.95 127.03 182.86 205.93 171.55 180.71
July 195.60 193.13 179.68 204.79 210.88 198.99 183.50 205.05 127.03 182.26 205.70 171.99 180.02
August 195.75 193.32 180.95 205.55 211.38 199.39 184.53 202.46 127.07 182.34 205.70 172.28 180.34
September 196.33 193.05 182.42 206.68 218.05 197.94 183.53 201.83 127.07 180.21 205.59 170.56 181.45 October 197.10 194.07 182.58 206.84 218.09 198.92 184.86 202.53 127.10 183.04 205.59 170.99 182.18
November 199.84 195.62 184.42 209.53 222.09 202.48 185.98 213.18 128.11 194.97 205.59 172.49 184.27
December 201.18 197.77 184.41 210.63 221.57 203.30 186.52 212.66 128.12 192.40 205.75 173.14 187.32
2018 January 203.15 199.69 185.35 212.94 225.43 204.73 189.23 211.09 128.35 194.98 209.84 174.96 189.19

26 | P a g e
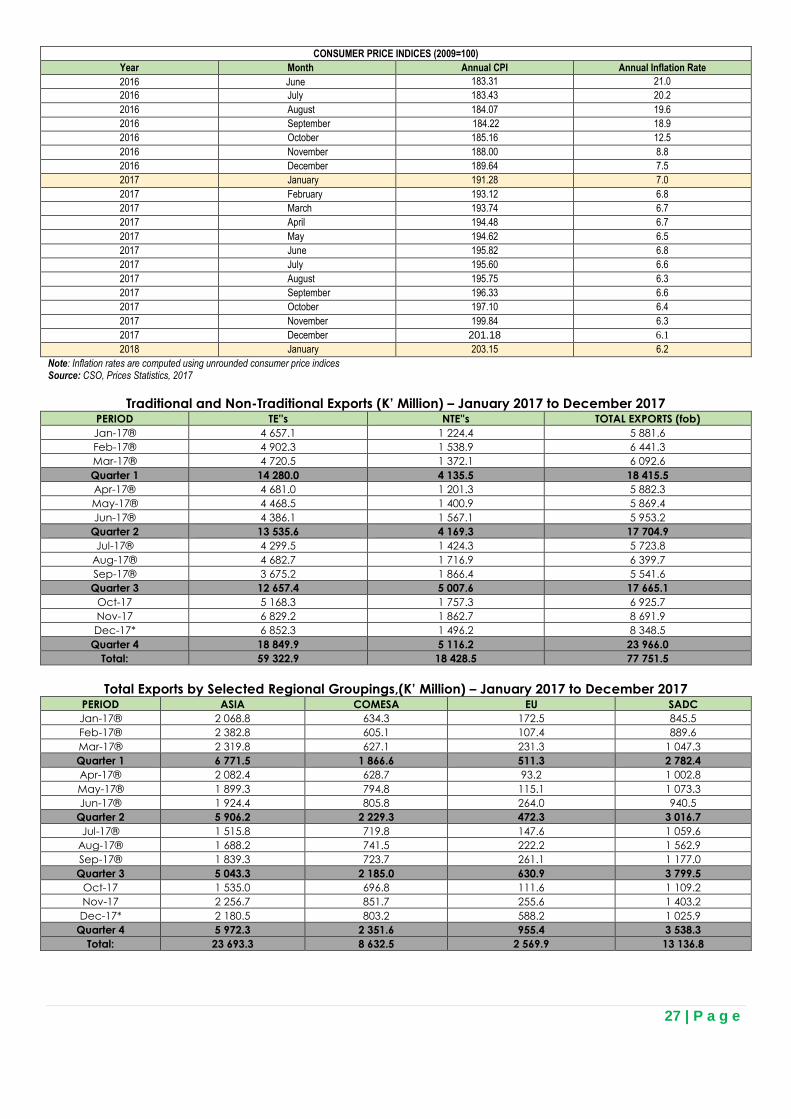
CONSUMER PRICE INDICES (2009=100)
Year Month Annual CPI Annual Inflation Rate
2011 January 111.61 6.3
2011 February 112.36 6.5
2011 March 113.56 6.6
2011 April 114.24 6.3
2011 May 114.56 6.3
2011 June 114.52 6.1
2011 July 115.89 6.9
2011 August 116.60 6.5
2011 September 117.01 6.6
2011 October 116.80 6.7
2011 November 116.94 6.4
2011 December 117.47 6.0
2012 January 118.77 6.4
2012 February 119.09 6.0
2012 March 120.84 6.4
2012 April 121.63 6.5
2012 May 122.11 6.6
2012 June 122.16 6.7
2012 July 123.06 6.2
2012 August 124.11 6.4
2012 September 124.72 6.6
2012 October 124.80 6.8
2012 November 125.04 6.9
2012 December 126.08 7.3
2013 January 127.08 7.0
2013 February 127.30 6.9
2013 March 128.81 6.6
2013 April 129.57 6.5
2013 May 130.67 7.0
2013 June 131.13 7.3
2013 July 131.99 7.3
2013 August 132.87 7.1
2013 September 133.41 7.0
2013 October 133.40 6.9
2013 November 133.82 7.0
2013 December 135.08 7.1
2014 January 136.32 7.3
2014 February 136.96 7.6
2014 March 138.67 7.7
2014 April 139.61 7.8
2014 May 140.85 7.8
2014 June 141.48 7.9
2014 July 142.57 8.0
2014 August 143.46 8.0
2014 September 143.87 7.8
2014 October 144.00 7.9
2014 November 144.63 8.1
2014 December 145.70 7.9
2015 January 146.76 7.7
2015 February 147.13 7.4
2015 March 148.63 7.2
2015 April 149.66 7.2
2015 May 150.62 6.9
2015 June 151.46 7.1
2015 July 152.64 7.1
2015 August 153.94 7.3
2015 September 155.00 7.7
2015 October 164.65 14.3
2015 November 172.86 19.5
2015 December 176.46 21.1
2016 January 178.70 21.8
2016 February 180.81 22.9
2016 March 181.68 22.2
2016 April 182.24 21.8
2016 May 182.68 21.3
27 | P a g e
CONSUMER PRICE INDICES (2009=100)
Year Month Annual CPI Annual Inflation Rate
2016 June 183.31 21.0
2016 July 183.43 20.2
2016 August 184.07 19.6
2016 September 184.22 18.9
2016 October 185.16 12.5
2016 November 188.00 8.8
2016 December 189.64 7.5
2017 January 191.28 7.0
2017 February 193.12 6.8
2017 March 193.74 6.7
2017 April 194.48 6.7
2017 May 194.62 6.5
2017 June 195.82 6.8
2017 July 195.60 6.6
2017 August 195.75 6.3
2017 September 196.33 6.6
2017 October 197.10 6.4
2017 November 199.84 6.3
2017 December 201.18 6.1
2018 January 203.15 6.2
Note: Inflation rates are computed using unrounded consumer price indices Source: CSO, Prices Statistics, 2017
Traditional and Non-Traditional Exports (K’ Million) – January 2017 to December 2017 PERIOD TE''s NTE''s TOTAL EXPORTS (fob)
Jan-17® 4 657.1 1 224.4 5 881.6
Feb-17® 4 902.3 1 538.9 6 441.3
Mar-17® 4 720.5 1 372.1 6 092.6
Quarter 1 14 280.0 4 135.5 18 415.5
Apr-17® 4 681.0 1 201.3 5 882.3
May-17® 4 468.5 1 400.9 5 869.4
Jun-17® 4 386.1 1 567.1 5 953.2
Quarter 2 13 535.6 4 169.3 17 704.9
Jul-17® 4 299.5 1 424.3 5 723.8
Aug-17® 4 682.7 1 716.9 6 399.7
Sep-17® 3 675.2 1 866.4 5 541.6
Quarter 3 12 657.4 5 007.6 17 665.1
Oct-17 5 168.3 1 757.3 6 925.7
Nov-17 6 829.2 1 862.7 8 691.9
Dec-17* 6 852.3 1 496.2 8 348.5
Quarter 4 18 849.9 5 116.2 23 966.0
Total: 59 322.9 18 428.5 77 751.5
Total Exports by Selected Regional Groupings,(K’ Million) – January 2017 to December 2017 PERIOD ASIA COMESA EU SADC
Jan-17® 2 068.8 634.3 172.5 845.5
Feb-17® 2 382.8 605.1 107.4 889.6
Mar-17® 2 319.8 627.1 231.3 1 047.3
Quarter 1 6 771.5 1 866.6 511.3 2 782.4
Apr-17® 2 082.4 628.7 93.2 1 002.8
May-17® 1 899.3 794.8 115.1 1 073.3
Jun-17® 1 924.4 805.8 264.0 940.5
Quarter 2 5 906.2 2 229.3 472.3 3 016.7
Jul-17® 1 515.8 719.8 147.6 1 059.6
Aug-17® 1 688.2 741.5 222.2 1 562.9
Sep-17® 1 839.3 723.7 261.1 1 177.0
Quarter 3 5 043.3 2 185.0 630.9 3 799.5
Oct-17 1 535.0 696.8 111.6 1 109.2
Nov-17 2 256.7 851.7 255.6 1 403.2
Dec-17* 2 180.5 803.2 588.2 1 025.9
Quarter 4 5 972.3 2 351.6 955.4 3 538.3
Total: 23 693.3 8 632.5 2 569.9 13 136.8

28 | P a g e
Total Exports Trade by Product Category, (Million) –January 2017 to December 2017
PERIOD CONSUMER GOODS RAW MATERIALS INTERMEDIATE GOODS CAPITAL GOODS TOTAL EXPORTS (fob)
Jan-17® 439.7 357.6 4 980.1 104.1 5 881.6
Feb-17® 565.2 459.8 5 262.5 153.8 6 441.3
Mar-17® 502.5 239.6 5 182.9 167.7 6 092.6
Quarter 1 1 507.4 1 057.0 15 425.5 425.6 18 415.5
Apr-17® 384.8 251.5 5 116.6 129.4 5 882.3
May-17® 563.3 320.6 4 867.1 118.4 5 869.4
Jun-17® 624.3 339.6 4 861.9 127.4 5 953.2
Quarter 2 1 572.5 911.7 14 845.6 375.2 17 704.9
Jul-17® 509.6 296.6 4 785.4 132.2 5 723.8
Aug-17® 601.4 246.7 5 392.6 159.0 6 399.7
Sep-17® 595.7 217.7 4 591.2 137.1 5 541.6
Quarter 3 1 706.8 760.9 14 769.1 428.3 17 665.1
Oct-17 607.2 119.8 6 096.6 102.0 6 925.7
Nov-17 648.0 381.3 7 429.3 233.2 8 691.9
Dec-17* 628.9 209.6 7 402.5 107.4 8 348.5
Quarter 4 1 884.2 710.7 20 928.5 442.6 23 966.0
Total: 6 670.8 3 440.3 65 968.6 1 671.7 77 751.5
Total Exports by Mode of Transport, K' Million and Tonnes– January 2017 to December 2017
PERIOD
ROAD TRANSPORT RAIL TRANSPORT AIR TRANSPORT OTHER TOTAL EXPORTS (fob)
ZMK TONNES ZMK TONNES ZMK TONNES ZMK TONNES ZMK TONNES
Jan-17® 4 407.6 261 702.6 10.4 2 496.3 276.3 457.2 1 187.2 103 245.3 5 881.6 367 901.4
Feb-17® 4 520.2 238 344.0 133.4 3 173.1 462.0 436.9 1 325.7 103 019.2 6 441.3 344 973.2
Mar-17® 4 008.9 275 481.2 78.4 1 544.0 240.3 381.3 1 765.1 122 698.2 6 092.6 400 104.7
Quarter 1 12 936.6 775 527.8 222.2 7 213.4 978.6 1 275.5 4 278.1 328 962.7 18 415.5 1 112 979.4
Apr-17® 4 090.5 238 543.0 37.2 774.1 194.8 325.3 1 559.8 127 129.4 5 882.3 366 771.8
May-17® 4 309.9 260 793.1 46.2 1 099.4 281.0 409.6 1 232.3 131 618.2 5 869.4 393 920.2
Jun-17® 4 546.3 301 735.2 53.8 3 006.3 250.2 391.0 1 102.9 108 581.0 5 953.2 413 713.5
Quarter 2 12 946.7 801 071.4 137.2 4 879.7 726.0 1 125.9 3 895.1 367 328.6 17 704.9 1 174 405.6
Jul-17® 4 389.4 297 620.6 96.2 2 000.1 220.4 392.8 1 017.7 112 411.7 5 723.8 412 425.3
Aug-17® 4 944.3 347 215.8 0.0 1.1 258.2 308.4 1 197.2 114 526.9 6 399.7 462 052.2
Sep-17® 3 872.9 304 164.1 126.7 5 846.9 281.4 306.9 1 260.7 117 238.5 5 541.6 427 556.5
Quarter 3 13 206.6 949 000.5 222.9 7 848.1 760.0 1 008.2 3 475.6 344 177.2 17 665.1 1 302 034.0
Oct-17 5 137.3 326 203.6 7.2 688.0 360.8 371.6 1 420.3 49 543.0 6 925.7 376 806.2
Nov-17 6 938.2 391 254.3 109.9 2 689.5 335.2 890.9 1 308.7 46 981.2 8 691.9 441 815.9
Dec-17* 6 260.6 330 347.4 8.1 4 468.7 281.8 332.2 1 798.0 49 014.1 8 348.5 384 162.4
Quarter 4 18 336.1 1 047 805.3 125.2 7 846.1 977.8 1 594.7 4 527.0 145 538.4 23 966.0 1 202 784.6
Total: 57 426.0 3 573 405.0 707.5 27 787.3 3 442.3 5 004.3 16 175.7 1 186 006.9 77 751.5 4 792 203.5
Imports by Regional Groupings, (K’ Million) – January 2017 to December 2017
PERIOD ASIA COMESA EU SADC
Jan-17® 1 733.8 906.3 304.1 2 709.9
Feb-17® 2 621.5 1 003.1 388.4 3 492.5
Mar-17® 2 565.4 1 392.1 474.6 3 390.1
Quarter 1 6 920.7 3 301.5 1 167.1 9 592.5
Apr-17® 2 756.8 1 382.9 440.2 3 670.0
May-17® 2 092.1 1 021.6 598.0 3 347.4
Jun-17® 1 689.5 1 490.8 497.1 3 903.4
Quarter 2 6 538.4 3 895.3 1 535.4 10 920.8
Jul-17® 1 786.3 1 698.9 460.3 3 805.2
Aug-17® 1 909.8 1 989.8 546.3 4 140.3
Sep-17® 2 023.4 2 545.7 488.2 4 814.5
Quarter 3 5 719.6 6 234.4 1 494.7 12 759.9
Oct-17 2 046.2 2 285.5 513.6 4 807.3
Nov-17 1 895.9 2 686.9 497.9 5 491.6
Dec-17* 2 219.0 2 391.4 426.3 4 771.3
Quarter 4 6 161.0 7 363.8 1 437.9 15 070.2
Total: 25 339.7 20 795.1 5 635.0 48 343.4
29 | P a g e
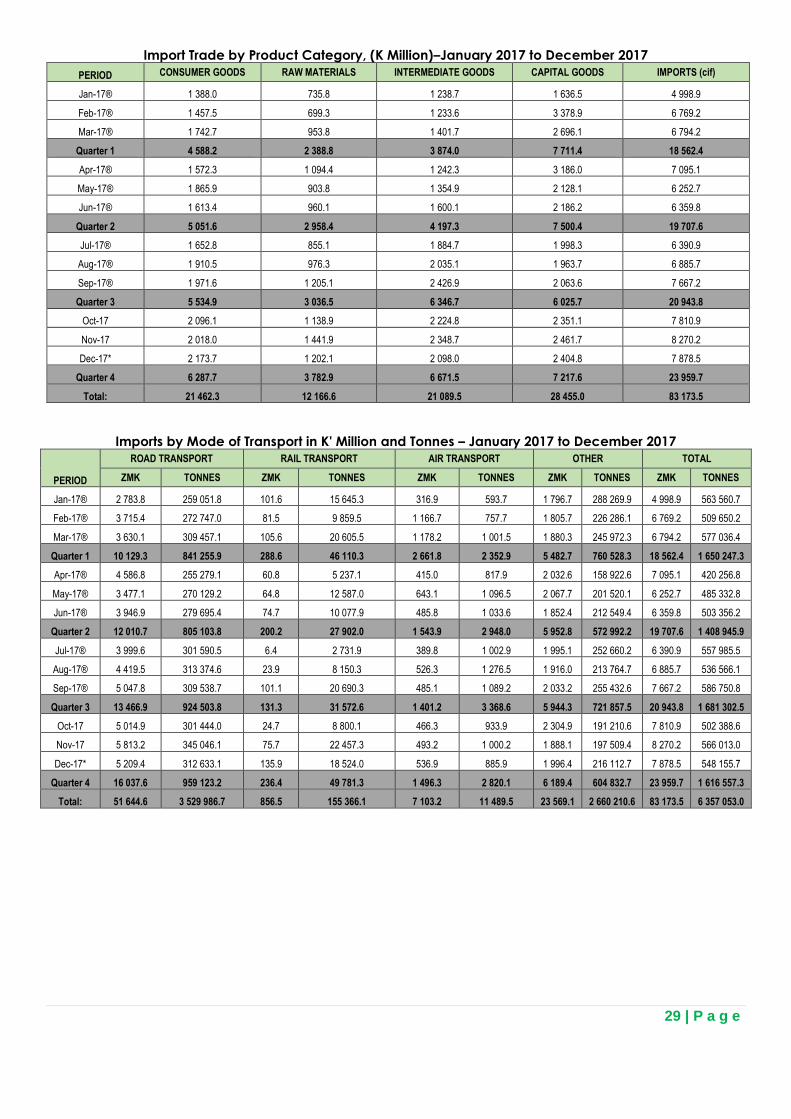
Import Trade by Product Category, (K Million)–January 2017 to December 2017
PERIOD CONSUMER GOODS RAW MATERIALS INTERMEDIATE GOODS CAPITAL GOODS IMPORTS (cif)
Jan-17® 1 388.0 735.8 1 238.7 1 636.5 4 998.9
Feb-17® 1 457.5 699.3 1 233.6 3 378.9 6 769.2
Mar-17® 1 742.7 953.8 1 401.7 2 696.1 6 794.2
Quarter 1 4 588.2 2 388.8 3 874.0 7 711.4 18 562.4
Apr-17® 1 572.3 1 094.4 1 242.3 3 186.0 7 095.1
May-17® 1 865.9 903.8 1 354.9 2 128.1 6 252.7
Jun-17® 1 613.4 960.1 1 600.1 2 186.2 6 359.8
Quarter 2 5 051.6 2 958.4 4 197.3 7 500.4 19 707.6
Jul-17® 1 652.8 855.1 1 884.7 1 998.3 6 390.9
Aug-17® 1 910.5 976.3 2 035.1 1 963.7 6 885.7
Sep-17® 1 971.6 1 205.1 2 426.9 2 063.6 7 667.2
Quarter 3 5 534.9 3 036.5 6 346.7 6 025.7 20 943.8
Oct-17 2 096.1 1 138.9 2 224.8 2 351.1 7 810.9
Nov-17 2 018.0 1 441.9 2 348.7 2 461.7 8 270.2
Dec-17* 2 173.7 1 202.1 2 098.0 2 404.8 7 878.5
Quarter 4 6 287.7 3 782.9 6 671.5 7 217.6 23 959.7
Total: 21 462.3 12 166.6 21 089.5 28 455.0 83 173.5
Imports by Mode of Transport in K' Million and Tonnes – January 2017 to December 2017
PERIOD
ROAD TRANSPORT RAIL TRANSPORT AIR TRANSPORT OTHER TOTAL
ZMK TONNES ZMK TONNES ZMK TONNES ZMK TONNES ZMK TONNES
Jan-17® 2 783.8 259 051.8 101.6 15 645.3 316.9 593.7 1 796.7 288 269.9 4 998.9 563 560.7
Feb-17® 3 715.4 272 747.0 81.5 9 859.5 1 166.7 757.7 1 805.7 226 286.1 6 769.2 509 650.2
Mar-17® 3 630.1 309 457.1 105.6 20 605.5 1 178.2 1 001.5 1 880.3 245 972.3 6 794.2 577 036.4
Quarter 1 10 129.3 841 255.9 288.6 46 110.3 2 661.8 2 352.9 5 482.7 760 528.3 18 562.4 1 650 247.3
Apr-17® 4 586.8 255 279.1 60.8 5 237.1 415.0 817.9 2 032.6 158 922.6 7 095.1 420 256.8
May-17® 3 477.1 270 129.2 64.8 12 587.0 643.1 1 096.5 2 067.7 201 520.1 6 252.7 485 332.8
Jun-17® 3 946.9 279 695.4 74.7 10 077.9 485.8 1 033.6 1 852.4 212 549.4 6 359.8 503 356.2
Quarter 2 12 010.7 805 103.8 200.2 27 902.0 1 543.9 2 948.0 5 952.8 572 992.2 19 707.6 1 408 945.9
Jul-17® 3 999.6 301 590.5 6.4 2 731.9 389.8 1 002.9 1 995.1 252 660.2 6 390.9 557 985.5
Aug-17® 4 419.5 313 374.6 23.9 8 150.3 526.3 1 276.5 1 916.0 213 764.7 6 885.7 536 566.1
Sep-17® 5 047.8 309 538.7 101.1 20 690.3 485.1 1 089.2 2 033.2 255 432.6 7 667.2 586 750.8
Quarter 3 13 466.9 924 503.8 131.3 31 572.6 1 401.2 3 368.6 5 944.3 721 857.5 20 943.8 1 681 302.5
Oct-17 5 014.9 301 444.0 24.7 8 800.1 466.3 933.9 2 304.9 191 210.6 7 810.9 502 388.6
Nov-17 5 813.2 345 046.1 75.7 22 457.3 493.2 1 000.2 1 888.1 197 509.4 8 270.2 566 013.0
Dec-17* 5 209.4 312 633.1 135.9 18 524.0 536.9 885.9 1 996.4 216 112.7 7 878.5 548 155.7
Quarter 4 16 037.6 959 123.2 236.4 49 781.3 1 496.3 2 820.1 6 189.4 604 832.7 23 959.7 1 616 557.3
Total: 51 644.6 3 529 986.7 856.5 155 366.1 7 103.2 11 489.5 23 569.1 2 660 210.6 83 173.5 6 357 053.0

30 | P a g e
Zambia's Trade Flows In Absolute US $ and Zambia Kwacha (ZMW) - 2000 to 2017(January-December)
Flow Year Currency Total Exports Domestic Exports Re-Exports Imports
Trade Balance (fob) (fob) (fob) (cif)
2000 ZMW 2 716 557 648 2 680 166 733 36 390 915 2 751 563 200 (35 005 551.5)
US $ 869 485 416 857 837 819 11 647 597 871 386 492 (1 901 076.0)
2001 ZMW 3 537 206 913 3 523 388 831 13 818 083 3 900 496 869 (363 289 956.1)
US $ 978 788 277 974 964 645 3 823 632 1 079 955 769 (101 167 492.0)
2002 ZMW 4 069 916 925 4 045 881 105 24 035 820 4 732 881 915 (662 964 990.3)
US $ 944 356 533 938 779 421 5 577 112 1 103 070 912 (158 714 379.0)
2003 ZMW 4 642 039 643 4 614 120 921 27 918 722 7 439 867 257 (2 797 827 613.4)
US $ 979 298 782 973 408 964 5 889 818 1 573 309 968 (594 011 186.0)
2004 ZMW 7 526 280 116 7 460 407 702 65 872 413 10 279 302 826 (2 753 022 710.8)
US $ 1 577 240 766 1 563 436 250 13 804 516 2 150 649 040 (573 408 274.0)
2005 ZMW 9 612 909 461 9 564 984 513 47 924 948 11 466 668 653 (1 853 759 192.0)
US $ 2 176 641 598 2 165 790 000 10 851 599 2 579 688 391 (403 046 793.0)
2006 ZMW 13 410 945 234 13 388 136 276 22 808 958 11 049 770 813 2 361 174 421.1
US $ 3 681 524 702 3 675 263 268 6 261 434 3 023 996 472 657 528 230.0
2007 ZMW 18 399 133 746 18 301 278 319 97 855 427 15 945 289 848 2 453 843 898.3
US $ 4 617 454 325 4 592 896 486 24 557 839 4 006 980 387 610 473 937.0
2008 ZMW 18 653 009 287 17 951 197 614 701 811 673 18 476 489 240 176 520 047.0
US $ 5 098 688 004 4 906 852 001 191 836 004 5 060 482 666 38 205 339.0
2009 ZMW 21 364 760 204 20 312 466 565 1 052 293 640 18 941 137 479 2 423 622 725.8
US $ 4 312 054 540 4 099 669 869 212 384 671 3 792 642 675 519 411 865.0
2010 ZMW 34 500 051 458 32 876 095 550 1 623 955 908 25 507 487 313 8 992 564 145.1
US $ 7 200 951 149 6 861 994 346 338 956 803 5 321 002 628 1 879 948 521.0
2011 ZMW 42 915 038 551 37 914 339 432 5 000 699 119 35 440 939 196 7 474 099 355.9
US $ 8 829 248 544 7 800 415 368 1 028 833 176 7 279 139 877 1 550 108 667.0
2012 ZMW 48 206 165 818 44 580 859 222 3 625 306 596 45 275 938 876 2 930 226 942.1
US $ 9 639 652 576 8 914 485 088 725 167 489 8 806 150 488 833 502 088.0
2013 ZMW 57 175 978 267 50 496 013 922 6 679 964 345 56 958 704 567 217 273 700
US $ 10 606 851 708 9 365 214 841 1 241 636 867 10 586 326 204 20 525 504
2014 ZMW 59 613 355 510 49 682 504 458 9 930 851 052 61 086 433 941 -1 473 078 430
US $ 9 686 603 579 8 076 838 096 1 609 765 483 9 793 839 667 -107 236 088
2015 ZMW 60 782 547 898 55 415 303 935 5 367 243 963 73 317 943 293 -12 535 395 395
US $ 7 045 654 292 6 463 141 829 582 512 464 8 472 661 775 -1 427 007 483
2016 ZMW 67 223 106 880 64 083 731 911 3 139 374 969 77 681 278 619 -10 458 171 739
US $ 6 512 804 843 6 211 599 310 301 205 532 7 537 345 482 -1 024 540 639
2017(JAN-DEC) ZMW 77 751 460 327 75 140 730 610 2 610 729 717 83 173 484 250 -5 422 023 923
US $ 8 139 452 683 7 863 687 391 275 765 292 8 723 572 116 -584 119 433
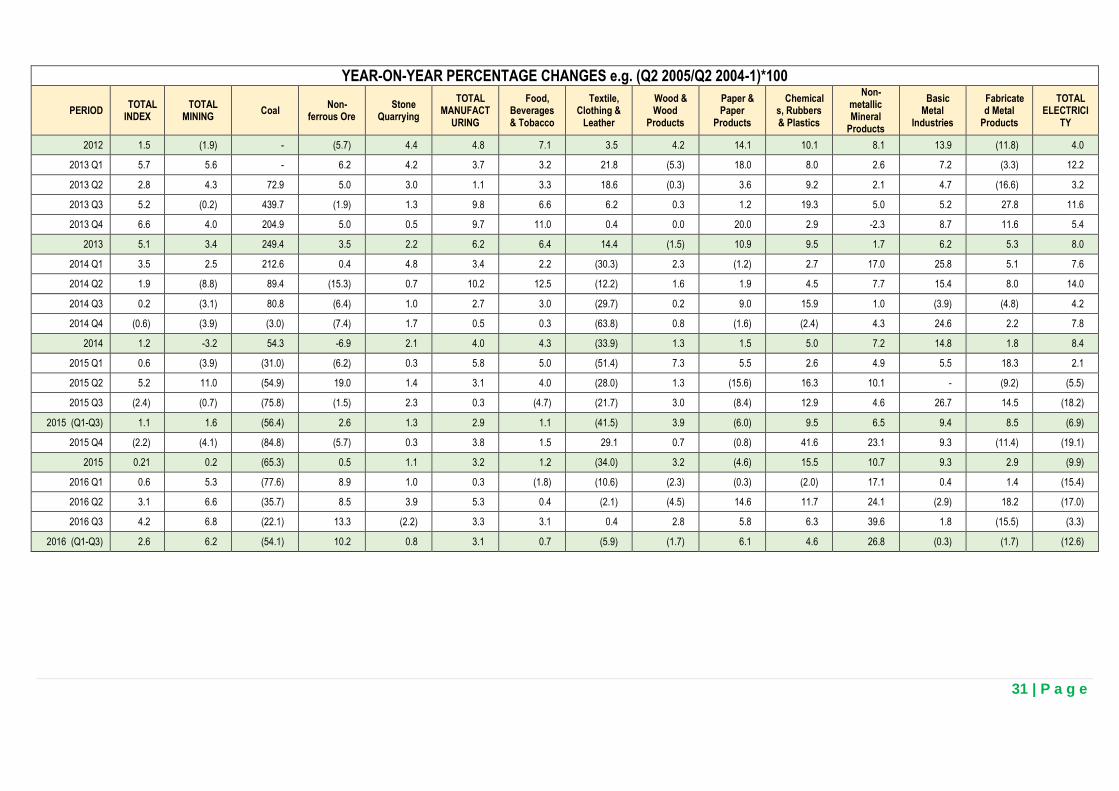
31 | P a g e
YEAR-ON-YEAR PERCENTAGE CHANGES e.g. (Q2 2005/Q2 2004-1)*100
PERIOD TOTAL
INDEX TOTAL
MINING Coal
Non-ferrous Ore
Stone Quarrying
TOTAL MANUFACT
URING
Food, Beverages & Tobacco
Textile, Clothing &
Leather
Wood & Wood
Products
Paper & Paper
Products
Chemicals, Rubbers & Plastics
Non-metallic Mineral
Products
Basic Metal
Industries
Fabricated Metal
Products
TOTAL ELECTRICI
TY
2012 1.5 (1.9) - (5.7) 4.4 4.8 7.1 3.5 4.2 14.1 10.1 8.1 13.9 (11.8) 4.0
2013 Q1 5.7 5.6 - 6.2 4.2 3.7 3.2 21.8 (5.3) 18.0 8.0 2.6 7.2 (3.3) 12.2
2013 Q2 2.8 4.3 72.9 5.0 3.0 1.1 3.3 18.6 (0.3) 3.6 9.2 2.1 4.7 (16.6) 3.2
2013 Q3 5.2 (0.2) 439.7 (1.9) 1.3 9.8 6.6 6.2 0.3 1.2 19.3 5.0 5.2 27.8 11.6
2013 Q4 6.6 4.0 204.9 5.0 0.5 9.7 11.0 0.4 0.0 20.0 2.9 -2.3 8.7 11.6 5.4
2013 5.1 3.4 249.4 3.5 2.2 6.2 6.4 14.4 (1.5) 10.9 9.5 1.7 6.2 5.3 8.0
2014 Q1 3.5 2.5 212.6 0.4 4.8 3.4 2.2 (30.3) 2.3 (1.2) 2.7 17.0 25.8 5.1 7.6
2014 Q2 1.9 (8.8) 89.4 (15.3) 0.7 10.2 12.5 (12.2) 1.6 1.9 4.5 7.7 15.4 8.0 14.0
2014 Q3 0.2 (3.1) 80.8 (6.4) 1.0 2.7 3.0 (29.7) 0.2 9.0 15.9 1.0 (3.9) (4.8) 4.2
2014 Q4 (0.6) (3.9) (3.0) (7.4) 1.7 0.5 0.3 (63.8) 0.8 (1.6) (2.4) 4.3 24.6 2.2 7.8
2014 1.2 -3.2 54.3 -6.9 2.1 4.0 4.3 (33.9) 1.3 1.5 5.0 7.2 14.8 1.8 8.4
2015 Q1 0.6 (3.9) (31.0) (6.2) 0.3 5.8 5.0 (51.4) 7.3 5.5 2.6 4.9 5.5 18.3 2.1
2015 Q2 5.2 11.0 (54.9) 19.0 1.4 3.1 4.0 (28.0) 1.3 (15.6) 16.3 10.1 - (9.2) (5.5)
2015 Q3 (2.4) (0.7) (75.8) (1.5) 2.3 0.3 (4.7) (21.7) 3.0 (8.4) 12.9 4.6 26.7 14.5 (18.2)
2015 (Q1-Q3) 1.1 1.6 (56.4) 2.6 1.3 2.9 1.1 (41.5) 3.9 (6.0) 9.5 6.5 9.4 8.5 (6.9)
2015 Q4 (2.2) (4.1) (84.8) (5.7) 0.3 3.8 1.5 29.1 0.7 (0.8) 41.6 23.1 9.3 (11.4) (19.1)
2015 0.21 0.2 (65.3) 0.5 1.1 3.2 1.2 (34.0) 3.2 (4.6) 15.5 10.7 9.3 2.9 (9.9)
2016 Q1 0.6 5.3 (77.6) 8.9 1.0 0.3 (1.8) (10.6) (2.3) (0.3) (2.0) 17.1 0.4 1.4 (15.4)
2016 Q2 3.1 6.6 (35.7) 8.5 3.9 5.3 0.4 (2.1) (4.5) 14.6 11.7 24.1 (2.9) 18.2 (17.0)
2016 Q3 4.2 6.8 (22.1) 13.3 (2.2) 3.3 3.1 0.4 2.8 5.8 6.3 39.6 1.8 (15.5) (3.3)
2016 (Q1-Q3) 2.6 6.2 (54.1) 10.2 0.8 3.1 0.7 (5.9) (1.7) 6.1 4.6 26.8 (0.3) (1.7) (12.6)
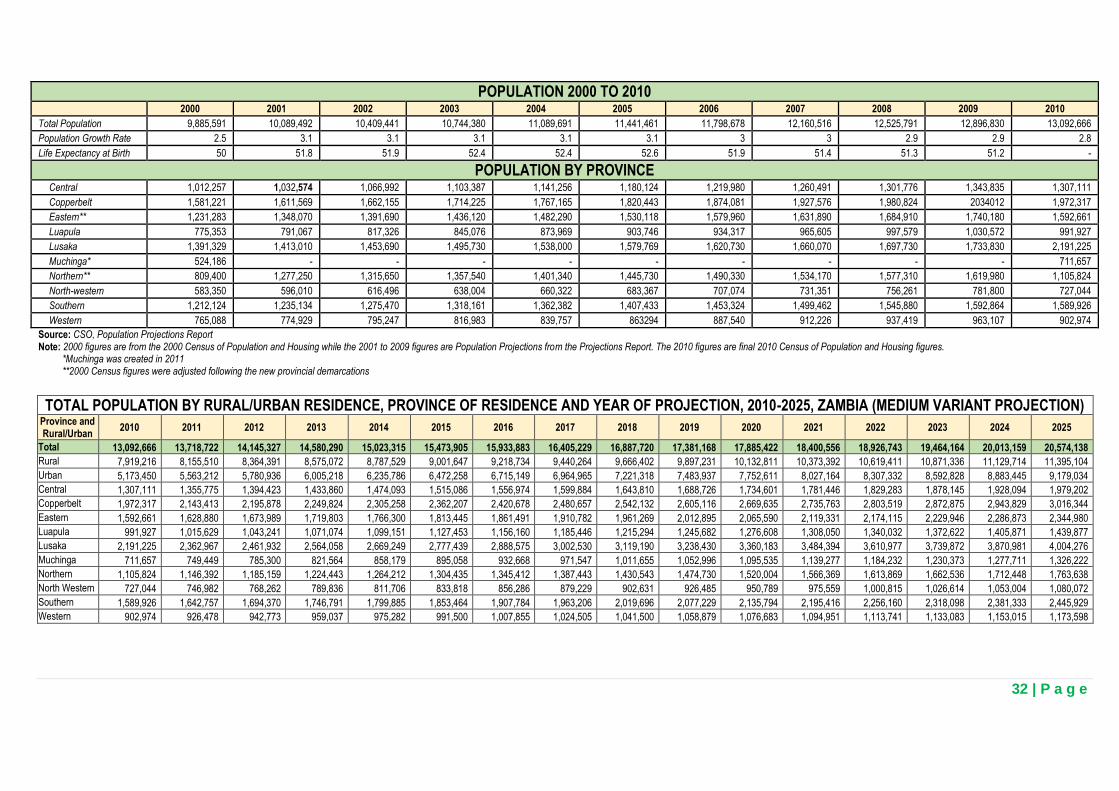
32 | P a g e
POPULATION 2000 TO 2010
2000 2001 2002 2003 2004 2005 2006 2007 2008 2009 2010
Total Population 9,885,591 10,089,492 10,409,441 10,744,380 11,089,691 11,441,461 11,798,678 12,160,516 12,525,791 12,896,830 13,092,666
Population Growth Rate 2.5 3.1 3.1 3.1 3.1 3.1 3 3 2.9 2.9 2.8
Life Expectancy at Birth 50 51.8 51.9 52.4 52.4 52.6 51.9 51.4 51.3 51.2 -
POPULATION BY PROVINCE Central 1,012,257 1,032,574 1,066,992 1,103,387 1,141,256 1,180,124 1,219,980 1,260,491 1,301,776 1,343,835 1,307,111
Copperbelt 1,581,221 1,611,569 1,662,155 1,714,225 1,767,165 1,820,443 1,874,081 1,927,576 1,980,824 2034012 1,972,317
Eastern** 1,231,283 1,348,070 1,391,690 1,436,120 1,482,290 1,530,118 1,579,960 1,631,890 1,684,910 1,740,180 1,592,661
Luapula 775,353 791,067 817,326 845,076 873,969 903,746 934,317 965,605 997,579 1,030,572 991,927
Lusaka 1,391,329 1,413,010 1,453,690 1,495,730 1,538,000 1,579,769 1,620,730 1,660,070 1,697,730 1,733,830 2,191,225
Muchinga* 524,186 - - - - - - - - - 711,657
Northern** 809,400 1,277,250 1,315,650 1,357,540 1,401,340 1,445,730 1,490,330 1,534,170 1,577,310 1,619,980 1,105,824
North-western 583,350 596,010 616,496 638,004 660,322 683,367 707,074 731,351 756,261 781,800 727,044
Southern 1,212,124 1,235,134 1,275,470 1,318,161 1,362,382 1,407,433 1,453,324 1,499,462 1,545,880 1,592,864 1,589,926
Western 765,088 774,929 795,247 816,983 839,757 863294 887,540 912,226 937,419 963,107 902,974
Source: CSO, Population Projections Report Note: 2000 figures are from the 2000 Census of Population and Housing while the 2001 to 2009 figures are Population Projections from the Projections Report. The 2010 figures are final 2010 Census of Population and Housing figures.
*Muchinga was created in 2011 **2000 Census figures were adjusted following the new provincial demarcations
TOTAL POPULATION BY RURAL/URBAN RESIDENCE, PROVINCE OF RESIDENCE AND YEAR OF PROJECTION, 2010-2025, ZAMBIA (MEDIUM VARIANT PROJECTION)
Province and Rural/Urban
2010 2011 2012 2013 2014 2015 2016 2017 2018 2019 2020 2021 2022 2023 2024 2025
Total 13,092,666 13,718,722 14,145,327 14,580,290 15,023,315 15,473,905 15,933,883 16,405,229 16,887,720 17,381,168 17,885,422 18,400,556 18,926,743 19,464,164 20,013,159 20,574,138
Rural 7,919,216 8,155,510 8,364,391 8,575,072 8,787,529 9,001,647 9,218,734 9,440,264 9,666,402 9,897,231 10,132,811 10,373,392 10,619,411 10,871,336 11,129,714 11,395,104
Urban 5,173,450 5,563,212 5,780,936 6,005,218 6,235,786 6,472,258 6,715,149 6,964,965 7,221,318 7,483,937 7,752,611 8,027,164 8,307,332 8,592,828 8,883,445 9,179,034
Central 1,307,111 1,355,775 1,394,423 1,433,860 1,474,093 1,515,086 1,556,974 1,599,884 1,643,810 1,688,726 1,734,601 1,781,446 1,829,283 1,878,145 1,928,094 1,979,202
Copperbelt 1,972,317 2,143,413 2,195,878 2,249,824 2,305,258 2,362,207 2,420,678 2,480,657 2,542,132 2,605,116 2,669,635 2,735,763 2,803,519 2,872,875 2,943,829 3,016,344
Eastern 1,592,661 1,628,880 1,673,989 1,719,803 1,766,300 1,813,445 1,861,491 1,910,782 1,961,269 2,012,895 2,065,590 2,119,331 2,174,115 2,229,946 2,286,873 2,344,980
Luapula 991,927 1,015,629 1,043,241 1,071,074 1,099,151 1,127,453 1,156,160 1,185,446 1,215,294 1,245,682 1,276,608 1,308,050 1,340,032 1,372,622 1,405,871 1,439,877
Lusaka 2,191,225 2,362,967 2,461,932 2,564,058 2,669,249 2,777,439 2,888,575 3,002,530 3,119,190 3,238,430 3,360,183 3,484,394 3,610,977 3,739,872 3,870,981 4,004,276
Muchinga 711,657 749,449 785,300 821,564 858,179 895,058 932,668 971,547 1,011,655 1,052,996 1,095,535 1,139,277 1,184,232 1,230,373 1,277,711 1,326,222
Northern 1,105,824 1,146,392 1,185,159 1,224,443 1,264,212 1,304,435 1,345,412 1,387,443 1,430,543 1,474,730 1,520,004 1,566,369 1,613,869 1,662,536 1,712,448 1,763,638
North Western 727,044 746,982 768,262 789,836 811,706 833,818 856,286 879,229 902,631 926,485 950,789 975,559 1,000,815 1,026,614 1,053,004 1,080,072
Southern 1,589,926 1,642,757 1,694,370 1,746,791 1,799,885 1,853,464 1,907,784 1,963,206 2,019,696 2,077,229 2,135,794 2,195,416 2,256,160 2,318,098 2,381,333 2,445,929
Western 902,974 926,478 942,773 959,037 975,282 991,500 1,007,855 1,024,505 1,041,500 1,058,879 1,076,683 1,094,951 1,113,741 1,133,083 1,153,015 1,173,598
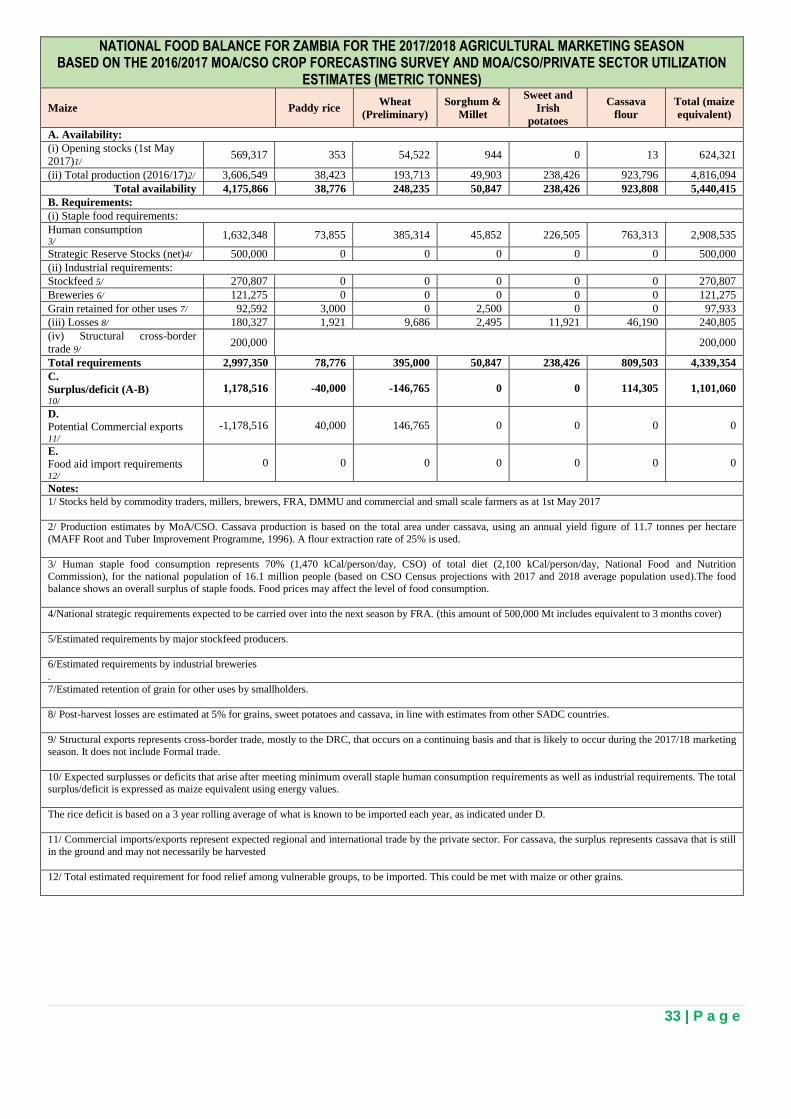
33 | P a g e
NATIONAL FOOD BALANCE FOR ZAMBIA FOR THE 2017/2018 AGRICULTURAL MARKETING SEASON BASED ON THE 2016/2017 MOA/CSO CROP FORECASTING SURVEY AND MOA/CSO/PRIVATE SECTOR UTILIZATION
ESTIMATES (METRIC TONNES)
Maize Paddy rice Wheat
(Preliminary)
Sorghum &
Millet
Sweet and
Irish
potatoes
Cassava
flour
Total (maize
equivalent)
A. Availability:
(i) Opening stocks (1st May
2017)1/ 569,317 353 54,522 944 0 13 624,321
(ii) Total production (2016/17)2/ 3,606,549 38,423 193,713 49,903 238,426 923,796 4,816,094
Total availability 4,175,866 38,776 248,235 50,847 238,426 923,808 5,440,415
B. Requirements:
(i) Staple food requirements:
Human consumption 3/
1,632,348 73,855 385,314 45,852 226,505 763,313 2,908,535
Strategic Reserve Stocks (net)4/ 500,000 0 0 0 0 0 500,000
(ii) Industrial requirements:
Stockfeed 5/ 270,807 0 0 0 0 0 270,807
Breweries 6/ 121,275 0 0 0 0 0 121,275
Grain retained for other uses 7/ 92,592 3,000 0 2,500 0 0 97,933
(iii) Losses 8/ 180,327 1,921 9,686 2,495 11,921 46,190 240,805
(iv) Structural cross-border
trade 9/ 200,000 200,000
Total requirements 2,997,350 78,776 395,000 50,847 238,426 809,503 4,339,354
C.
Surplus/deficit (A-B) 10/
1,178,516 -40,000 -146,765 0 0 114,305 1,101,060
D. Potential Commercial exports 11/
-1,178,516 40,000 146,765 0 0 0 0
E. Food aid import requirements 12/
0 0 0 0 0 0 0
Notes:
1/ Stocks held by commodity traders, millers, brewers, FRA, DMMU and commercial and small scale farmers as at 1st May 2017
2/ Production estimates by MoA/CSO. Cassava production is based on the total area under cassava, using an annual yield figure of 11.7 tonnes per hectare
(MAFF Root and Tuber Improvement Programme, 1996). A flour extraction rate of 25% is used.
3/ Human staple food consumption represents 70% (1,470 kCal/person/day, CSO) of total diet (2,100 kCal/person/day, National Food and Nutrition
Commission), for the national population of 16.1 million people (based on CSO Census projections with 2017 and 2018 average population used).The food
balance shows an overall surplus of staple foods. Food prices may affect the level of food consumption.
4/National strategic requirements expected to be carried over into the next season by FRA. (this amount of 500,000 Mt includes equivalent to 3 months cover)
5/Estimated requirements by major stockfeed producers.
6/Estimated requirements by industrial breweries
.
7/Estimated retention of grain for other uses by smallholders.
8/ Post-harvest losses are estimated at 5% for grains, sweet potatoes and cassava, in line with estimates from other SADC countries.
9/ Structural exports represents cross-border trade, mostly to the DRC, that occurs on a continuing basis and that is likely to occur during the 2017/18 marketing season. It does not include Formal trade.
10/ Expected surplusses or deficits that arise after meeting minimum overall staple human consumption requirements as well as industrial requirements. The total surplus/deficit is expressed as maize equivalent using energy values.
The rice deficit is based on a 3 year rolling average of what is known to be imported each year, as indicated under D.
11/ Commercial imports/exports represent expected regional and international trade by the private sector. For cassava, the surplus represents cassava that is still
in the ground and may not necessarily be harvested
12/ Total estimated requirement for food relief among vulnerable groups, to be imported. This could be met with maize or other grains.
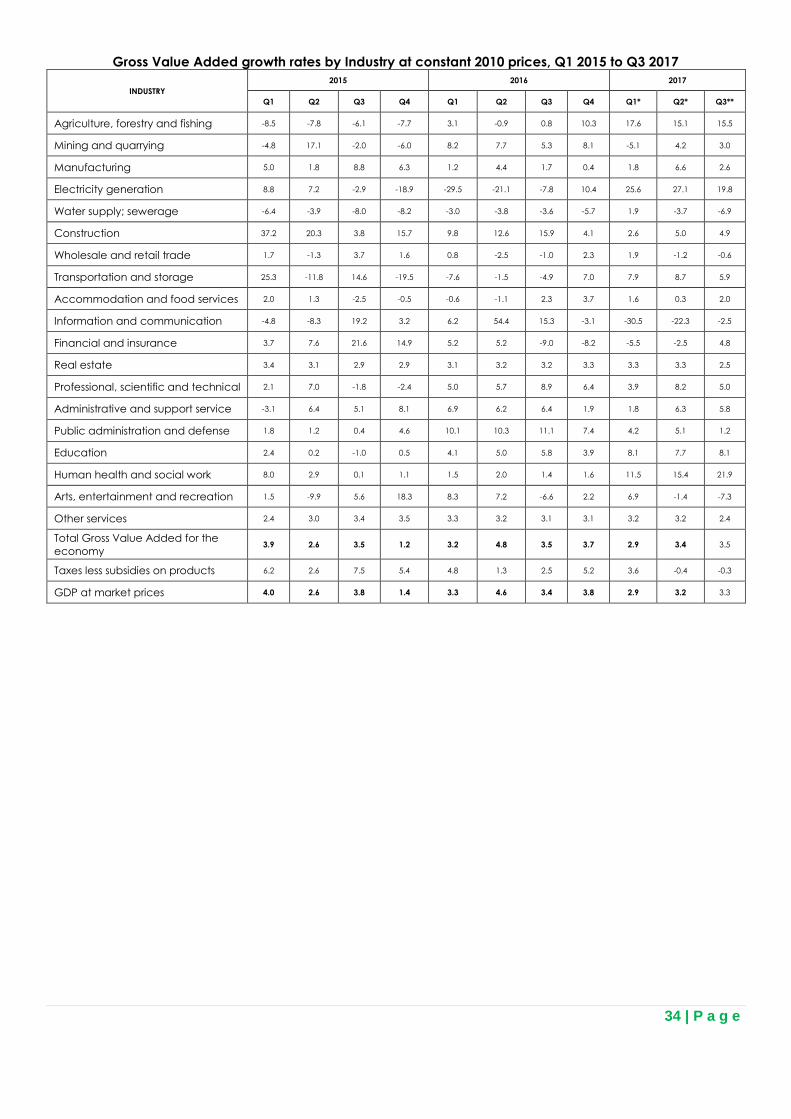
34 | P a g e
Gross Value Added growth rates by Industry at constant 2010 prices, Q1 2015 to Q3 2017
INDUSTRY
2015 2016 2017
Q1 Q2 Q3 Q4 Q1 Q2 Q3 Q4 Q1* Q2* Q3**
Agriculture, forestry and fishing -8.5 -7.8 -6.1 -7.7 3.1 -0.9 0.8 10.3 17.6 15.1 15.5
Mining and quarrying -4.8 17.1 -2.0 -6.0 8.2 7.7 5.3 8.1 -5.1 4.2 3.0
Manufacturing 5.0 1.8 8.8 6.3 1.2 4.4 1.7 0.4 1.8 6.6 2.6
Electricity generation 8.8 7.2 -2.9 -18.9 -29.5 -21.1 -7.8 10.4 25.6 27.1 19.8
Water supply; sewerage -6.4 -3.9 -8.0 -8.2 -3.0 -3.8 -3.6 -5.7 1.9 -3.7 -6.9
Construction 37.2 20.3 3.8 15.7 9.8 12.6 15.9 4.1 2.6 5.0 4.9
Wholesale and retail trade 1.7 -1.3 3.7 1.6 0.8 -2.5 -1.0 2.3 1.9 -1.2 -0.6
Transportation and storage 25.3 -11.8 14.6 -19.5 -7.6 -1.5 -4.9 7.0 7.9 8.7 5.9
Accommodation and food services 2.0 1.3 -2.5 -0.5 -0.6 -1.1 2.3 3.7 1.6 0.3 2.0
Information and communication -4.8 -8.3 19.2 3.2 6.2 54.4 15.3 -3.1 -30.5 -22.3 -2.5
Financial and insurance 3.7 7.6 21.6 14.9 5.2 5.2 -9.0 -8.2 -5.5 -2.5 4.8
Real estate 3.4 3.1 2.9 2.9 3.1 3.2 3.2 3.3 3.3 3.3 2.5
Professional, scientific and technical 2.1 7.0 -1.8 -2.4 5.0 5.7 8.9 6.4 3.9 8.2 5.0
Administrative and support service -3.1 6.4 5.1 8.1 6.9 6.2 6.4 1.9 1.8 6.3 5.8
Public administration and defense 1.8 1.2 0.4 4.6 10.1 10.3 11.1 7.4 4.2 5.1 1.2
Education 2.4 0.2 -1.0 0.5 4.1 5.0 5.8 3.9 8.1 7.7 8.1
Human health and social work 8.0 2.9 0.1 1.1 1.5 2.0 1.4 1.6 11.5 15.4 21.9
Arts, entertainment and recreation 1.5 -9.9 5.6 18.3 8.3 7.2 -6.6 2.2 6.9 -1.4 -7.3
Other services 2.4 3.0 3.4 3.5 3.3 3.2 3.1 3.1 3.2 3.2 2.4
Total Gross Value Added for the
economy 3.9 2.6 3.5 1.2 3.2 4.8 3.5 3.7 2.9 3.4 3.5
Taxes less subsidies on products 6.2 2.6 7.5 5.4 4.8 1.3 2.5 5.2 3.6 -0.4 -0.3
GDP at market prices 4.0 2.6 3.8 1.4 3.3 4.6 3.4 3.8 2.9 3.2 3.3

35 | P a g e
Gross Value Added percentage contribution to the growth by Industry at constant 2010 prices, Q1 2016 to Q3 2017
INDUSTRY 2016 2017
Q1 Q2 Q3 Q4 Q1* Q2* Q3**
Agriculture, forestry and fishing 0.3 -0.1 0.0 0.8 1.7 1.1 0.7
Mining and quarrying 0.8 0.8 0.6 0.8 -0.5 0.4 0.3
Manufacturing 0.1 0.4 0.1 0.0 0.1 0.6 0.2
Electricity generation -0.5 -0.4 -0.1 0.1 0.3 0.4 0.3
Water supply; sewerage 0.0 0.0 0.0 0.0 0.0 0.0 0.0
Construction 1.0 1.2 1.5 0.5 0.3 0.5 0.5
Wholesale and retail trade 0.2 -0.6 -0.2 0.5 0.4 -0.3 -0.1
Transportation and storage -0.3 0.0 -0.2 0.2 0.3 0.3 0.2
Accommodation and food services 0.0 0.0 0.0 0.1 0.0 0.0 0.0
Information and communication 0.2 1.8 0.6 -0.1 -0.9 -1.1 -0.1
Financial and insurance 0.2 0.2 -0.4 -0.3 -0.2 -0.1 0.2
Real estate 0.1 0.1 0.1 0.1 0.1 0.1 0.1
Professional, scientific and technical 0.1 0.1 0.1 0.1 0.1 0.1 0.1
Administrative and support service 0.1 0.1 0.1 0.0 0.0 0.1 0.1
Public administration and defence 0.5 0.5 0.5 0.4 0.2 0.3 0.1
Education 0.3 0.4 0.4 0.3 0.6 0.6 0.6
Human health and social work 0.0 0.0 0.0 0.0 0.2 0.2 0.3
Arts, entertainment and recreation 0.0 0.0 0.0 0.0 0.0 0.0 0.0
Other services 0.0 0.0 0.0 0.0 0.0 0.0 0.0
Total Gross Value Added for the economy 3.0 4.5 3.2 3.5 2.7 3.2 3.3
Taxes less subsidies on products 0.2 0.1 0.2 0.3 0.2 0.0 0.0
GDP at market prices 3.3 4.6 3.4 3.8 2.9 3.2 3.3
*Revised
**First release
Source: CSO, National Accounts
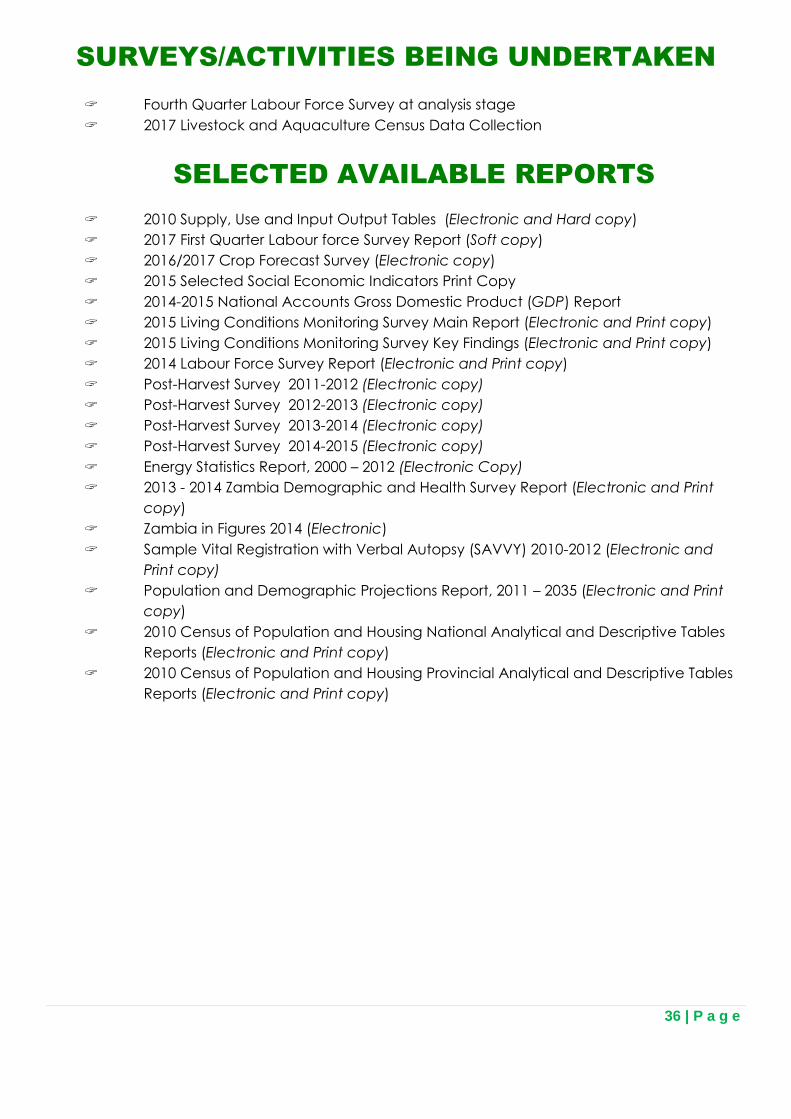
36 | P a g e
SURVEYS/ACTIVITIES BEING UNDERTAKEN
Fourth Quarter Labour Force Survey at analysis stage
2017 Livestock and Aquaculture Census Data Collection
SELECTED AVAILABLE REPORTS
2010 Supply, Use and Input Output Tables (Electronic and Hard copy)
2017 First Quarter Labour force Survey Report (Soft copy)
2016/2017 Crop Forecast Survey (Electronic copy)
2015 Selected Social Economic Indicators Print Copy
2014-2015 National Accounts Gross Domestic Product (GDP) Report
2015 Living Conditions Monitoring Survey Main Report (Electronic and Print copy)
2015 Living Conditions Monitoring Survey Key Findings (Electronic and Print copy)
2014 Labour Force Survey Report (Electronic and Print copy)
Post-Harvest Survey 2011-2012 (Electronic copy)
Post-Harvest Survey 2012-2013 (Electronic copy)
Post-Harvest Survey 2013-2014 (Electronic copy)
Post-Harvest Survey 2014-2015 (Electronic copy)
Energy Statistics Report, 2000 – 2012 (Electronic Copy)
2013 - 2014 Zambia Demographic and Health Survey Report (Electronic and Print
copy)
Zambia in Figures 2014 (Electronic)
Sample Vital Registration with Verbal Autopsy (SAVVY) 2010-2012 (Electronic and
Print copy)
Population and Demographic Projections Report, 2011 – 2035 (Electronic and Print
copy)
2010 Census of Population and Housing National Analytical and Descriptive Tables
Reports (Electronic and Print copy)
2010 Census of Population and Housing Provincial Analytical and Descriptive Tables
Reports (Electronic and Print copy)
37 | P a g e
Subscribe for your free electronic copy of “The Monthly” online at www.zamstats.gov.zm
For more data at your fingertips visit our data portal at: http://zambia.opendataforafrica.org
The Editorial Team would like to thank all Media Institutions and Users of…..
“The Monthly Bulletin”
Thank you for supporting us
Secretariat
John Kalumbi - Director
Sheila S. Mudenda - Assistant Director (IRD)
Etambuyu Lukonga - Senior Research Officer
Bubala Moonga - Statistician
Alphonse Chilufya - Statistician
Wiza Ng’ambi - Statistician
Anthony Nkole - Desktop Publishing Officer
George Mhango - Senior Statistical Officer
Emmanuel Mulambia - Senior Statistical Officer
Churchil Mutale - Intern
John Zulu - Intern
Editorial Team
John Kalumbi - Director
Sheila S. Mudenda - Assistant Director (IRD)
Goodson Sinyenga - Assistant Director (Economic Statistics)