Director’s Report & Audited Financial Statements
68
Director’s Report & Audited Financial Statements CSE Global Ltd and Subsidiary Companies • 31 December 2009
Transcript of Director’s Report & Audited Financial Statements

Director’s Report & Audited Financial Statements
CSE Global Ltd and Subsidiary Companies • 31 December 2009

Corporate Information
BOARD OF DIRECTORSExecutiveTan Mok Koon (Managing Director)
Non-ExecutiveLim Ming Seong (Chairman)Goh Boon Seong (Independent)Phillip Lee Soo Hoon (Independent)Dr. Lim Boh Soon (Independent)Sin Boon Ann (Independent)
AUDIT COMMITTEEPhillip Lee Soo Hoon (Chairman)Dr. Lim Boh SoonSin Boon Ann
NOMINATING COMMITTEELim Ming Seong (Chairman)Goh Boon SeongPhillip Lee Soo Hoon
COMPENSATION COMMITTEELim Ming Seong (Chairman)Goh Boon SeongTan Mok Koon
SECRETARIESTan Cher LiangTan San-Ju
REGISTERED OFFICE50 Raffles Pace#32-01Singapore Land TowerSingapore 048623Tel: 65-6536 5355Fax: 65-6536 1360
BUSINESS OFFICENo. 2, Ubi ViewSingapore 408556Tel: 65-6512 0333Fax: 65-6742 9179
SHARE REGISTRARBoardroom Corporate & Advisory Services Pte Ltd50 Raffles Pace#32-01Singapore Land TowerSingapore 048623Tel: 65-6536 5355Fax: 65-6536 1360
AUDITORSErnst & Young LLPOne Raffles QuayNorth Tower, Level 18Singapore 048583
Audit Partner-in-charge:Tan Chian Khong(Appointment since 2006)
BANKERSArab Bank plcBank of China LtdDBS Bank LtdDeutsche BankMalayan Banking BerhadOversea-Chinese Banking Corporation LtdRHB Bank BerhadStandard Chartered BankThe Bank of East Asia, LtdThe Hong Kong and Shanghai Banking Corporation LtdUnited Overseas Bank Ltd

Directors’ Report 1
Statement by Directors 3
Independent Auditors’ Report 4
Balance Sheets 5
Consolidated Profit and Loss Account 6
Consolidated Statement of Comprehensive Income 7
Statements of Changes in Equity 8
Consolidated Statement of Cash Flows 10
Notes to the Financial Statements 11
Contents
1 CSE Global Ltd Annual Report 2009
for the year ended 31 December 2009
Directors’ Report
The Directors are pleased to present their report to the members together with the audited consolidated financial statements of CSE Global Limited (the “Company”) and its subsidiaries (collectively, the “Group”) and the balance sheet and statement of changes in equity of the Company for the financial year ended 31 December 2009.
Directors
The Directors of the Company in office at the date of this report are :
Lim Ming SeongTan Mok KoonGoh Boon SeongPhillip Lee Soo HoonLim Boh SoonSin Boon Ann
Arrangements to enable Directors to acquire shares and debentures
Except as described in the subsequent paragraphs, neither at the end of nor at any time during the financial year was the Company a party to any arrangement whose objects are, or one of whose objects is, to enable the Directors of the Company to acquire benefits by means of the acquisition of shares in or debentures of the Company or any other body corporate.
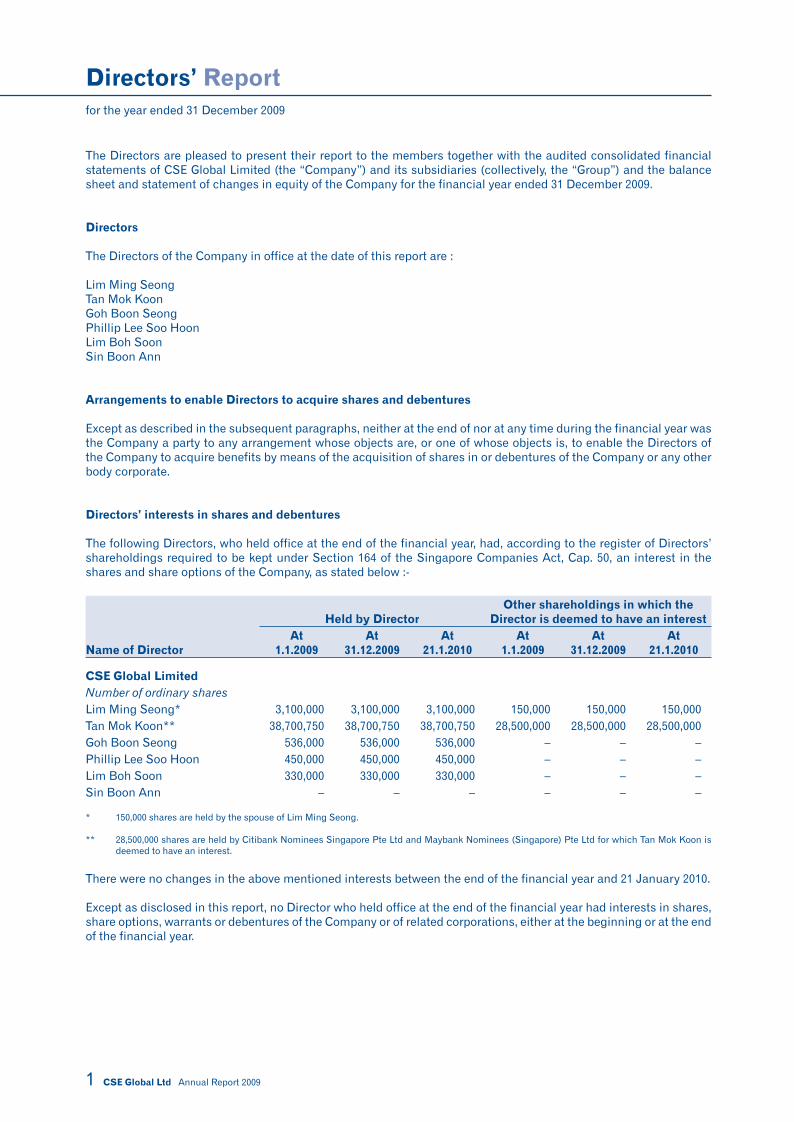
Directors’ interests in shares and debentures
The following Directors, who held office at the end of the financial year, had, according to the register of Directors’ shareholdings required to be kept under Section 164 of the Singapore Companies Act, Cap. 50, an interest in the shares and share options of the Company, as stated below :-
Name of Director
Held by DirectorOther shareholdings in which the
Director is deemed to have an interestAt
1.1.2009At
31.12.2009At
21.1.2010At
1.1.2009At
31.12.2009At
21.1.2010
CSE Global LimitedNumber of ordinary sharesLim Ming Seong* 3,100,000 3,100,000 3,100,000 150,000 150,000 150,000Tan Mok Koon** 38,700,750 38,700,750 38,700,750 28,500,000 28,500,000 28,500,000Goh Boon Seong 536,000 536,000 536,000 – – – Phillip Lee Soo Hoon 450,000 450,000 450,000 – – – Lim Boh Soon 330,000 330,000 330,000 – – – Sin Boon Ann – – – – – –
* 150,000 shares are held by the spouse of Lim Ming Seong.
** 28,500,000 shares are held by Citibank Nominees Singapore Pte Ltd and Maybank Nominees (Singapore) Pte Ltd for which Tan Mok Koon is deemed to have an interest.
There were no changes in the above mentioned interests between the end of the financial year and 21 January 2010.
Except as disclosed in this report, no Director who held office at the end of the financial year had interests in shares, share options, warrants or debentures of the Company or of related corporations, either at the beginning or at the end of the financial year.

Annual Report 2009 CSE Global Ltd 2
for the year ended 31 December 2009
Directors’ Report
Directors’ contractual benefits
Except as disclosed in the financial statements, since the end of the previous financial year, no Director of the Company has received or become entitled to receive a benefit by reason of a contract made by the Company or a related corporation with the Director, or with a firm of which the Director is a member, or with a company in which the Director has a substantial financial interest.
Share options
There is currently no share option scheme on unissued shares of the Company.
Audit Committee
The Audit Committee was established on 22 January 1999.
The Audit Committee comprises three members, all of whom are non-executive Directors and are independent of the management of the Company.
The members of the Audit Committee at the date of this report comprise the following Directors :-
Non-executive/Independent Directors :
Phillip Lee Soo Hoon (Chairman)Lim Boh SoonSin Boon Ann
The Audit Committee performed the functions specified in the Singapore Companies Act, Cap. 50. The functions performed are detailed in the Report on Corporate Governance. The Audit Committee, having reviewed all non-audit services provided by the external auditors to the Group, is satisfied that the nature and extent of such services would not affect the independence of the external auditors.
Auditors
Ernst & Young LLP have expressed their willingness to accept reappointment as auditors.
On behalf of the Board of Directors,
Lim Ming SeongDirector
Tan Mok KoonDirector
Singapore16 March 2010

for the year ended 31 December 2009
Statement by Directors
3 CSE Global Ltd Annual Report 2009
We, Lim Ming Seong and Tan Mok Koon, being two of the Directors of CSE Global Limited, do hereby state that, in the opinion of the Directors :-
(i) the accompanying balance sheets, consolidated profit and loss account, consolidated statement of comprehensive income, statements of changes in equity and consolidated statement of cash flows together with the notes thereto are drawn up so as to give a true and fair view of the state of affairs of the Group and of the Company as at 31 December 2009 and the results, changes in equity and cash flows of the Group and the changes in equity of the Company for the financial year then ended, and
(ii) at the date of this statement, there are reasonable grounds to believe that the Company will be able to pay its debts as and when they fall due.
On behalf of the Board of Directors,
Lim Ming SeongDirector
Tan Mok KoonDirector
Singapore16 March 2010

To the members of CSE Global Limited
Independent Auditors’ Report
Annual Report 2009 CSE Global Ltd 4
We have audited the accompanying financial statements of CSE Global Limited (the “Company”) and its subsidiaries (the “Group”), which comprise the balance sheets of the Group and the Company as at 31 December 2009, the statements of changes in equity of the Group and the Company, and the consolidated profit and loss account, consolidated statement of comprehensive income and consolidated statement of cash flows of the Group for the year then ended, and a summary of significant accounting policies and other explanatory notes.
Management’s responsibility for the financial statements
Management is responsible for the preparation and fair presentation of these financial statements in accordance with the provisions of the Singapore Companies Act, Cap. 50 (the “Act”) and Singapore Financial Reporting Standards. This responsibility includes devising and maintaining a system of internal accounting controls sufficient to provide a reasonable assurance that assets are safeguarded against loss from unauthorised use or disposition; and transactions are properly authorised and that they are recorded as necessary to permit the preparation of true and fair profit and loss account and balance sheet and to maintain accountability of assets; selecting and applying appropriate accounting policies; and making accounting estimates that are reasonable in the circumstances.
Auditors’ responsibility
Our responsibility is to express an opinion on these financial statements based on our audit. We conducted our audit in accordance with Singapore Standards on Auditing. Those standards require that we comply with ethical requirements and plan and perform the audit to obtain reasonable assurance whether the financial statements are free from material misstatement.
An audit involves performing procedures to obtain audit evidence about the amounts and disclosures in the financial statements. The procedures selected depend on the auditor’s judgement, including the assessment of the risks of material misstatement of the financial statements, whether due to fraud or error. In making those risk assessments, the auditor considers internal control relevant to the entity’s preparation and fair presentation of the financial statements in order to design audit procedures that are appropriate in the circumstances, but not for the purpose of expressing an opinion on the effectiveness of the entity’s internal control. An audit also includes evaluating the appropriateness of accounting policies used and the reasonableness of accounting estimates made by management, as well as evaluating the overall presentation of the financial statements.
We believe that the audit evidence we have obtained is sufficient and appropriate to provide a basis for our audit opinion.
Opinion
In our opinion,
(i) the consolidated financial statements of the Group, and the balance sheet and statement of changes in equity of the Company are properly drawn up in accordance with the provisions of the Act and Singapore Financial Reporting Standards so as to give a true and fair view of the state of affairs of the Group and of the Company as at 31 December 2009 and the results, changes in equity and cash flows of the Group and the changes in equity of the Company for the year ended on that date; and
(ii) the accounting and other records required by the Act to be kept by the Company and by those subsidiaries incorporated in Singapore of which we are the auditors have been properly kept in accordance with the provisions of the Act.
Ernst & Young LLPPublic Accountants and Certified Public AccountantsSingapore16 March 2010

as at 31 December 2009
Balance Sheets
5 CSE Global Ltd Annual Report 2009
Group CompanyNote 2009 2008 2009 2008
$’000 $’000 $’000 $’000
Fixed assets 4 12,986 12,669 73 136
Subsidiary companies 5 – – 166,431 192,702
Associated companies 6 7,171 7,283 – –
Other investment 7 190 190 190 190
Intangible assets 8 65,146 67,775 44 73
Deferred tax assets 9 6,645 4,225 181 26
Current assets
Projects-in-progress 10 89,250 88,720 – –
Stocks 11 14,230 11,922 – –
Trade and other debtors 12 79,613 96,857 3,432 6,612
Prepayments 2,133 3,927 10 7
Amounts due from subsidiary companies 5 – – 34,822 45,482
Amounts due from associated companies 6 145 717 – –
Short-term deposits 27 3,155 3,696 – –
Cash and bank balances 27 52,898 38,943 3,891 999
241,424 244,782 42,155 53,100
Current liabilities
Projects-in-progress 10 17,285 18,956 – –
Derivative financial instruments 13 – 5,164 – 5,164
Trade creditors and accruals 14 61,081 61,603 5,703 5,518
Finance leases 29 218 177 – –
Amounts due to bankers 15 47,855 117,431 47,855 102,965
Amounts due to subsidiary companies 5 – – 19,626 53,946
Amounts due to associated companies 6 – 77 – –
Provision for warranties 16 1,402 1,582 – –
Provision for taxation 4,100 8,825 356 301
131,941 213,815 73,540 167,894
Net current assets/(liabilities) 109,483 30,967 (31,385) (114,794)
Non-current liabilities
Deferred tax liabilities 9 (3,915) (3,672) – –
Finance leases 29 (314) (398) – –
Amounts due to bankers 15 (60,669) (10,777) (60,669) (10,777)
136,723 108,262 74,865 67,556
Equity attributable to equity holders of the Company
Share capital 17 92,498 92,498 92,498 92,498
Treasury shares 17 (28,043) (28,043) (28,043) (28,043)
Revenue reserves 109,363 79,985 10,410 3,093
Share-based payment reserve 18 – – – –
Foreign currency translation reserve 19 (37,203) (36,192) – 8
136,615 108,248 74,865 67,556
Minority interests 108 14 – –
136,723 108,262 74,865 67,556
The accompanying accounting policies and explanatory notes form an integral part of the financial statements.

for the financial year ended 31 December 2009
Consolidated Profit and Loss Account
Annual Report 2009 CSE Global Ltd 6
GroupNote 2009 2008
$’000 $’000
Revenues 20 405,060 441,518
Cost of sales (247,435) (276,473)
Gross profit 157,625 165,045
Other operating income
Miscellaneous income 21 1,235 766
Finance income 22 360 991
Operating expenses
Administrative costs (83,212) (81,579)
Selling and distribution costs (5,311) (6,753)
Other operating costs (5,369) (7,550)
Finance costs 23 (6,361) (5,668)
Share of results of associated companies, net of tax 55 274
Profit before taxation 24 59,022 65,526
Taxation 25 (15,347) (17,273)
Profit for the financial year 43,675 48,253
Attributable to :-
Equity holders of the Company 43,659 48,253
Minority interests 16 –
43,675 48,253
Earnings per share (in cents)
Basic EPS 26 9.17 9.65
Diluted EPS 26 9.17 9.63
The accompanying accounting policies and explanatory notes form an integral part of the financial statements.

for the financial year ended 31 December 2009
Consolidated Statement of Comprehensive Income
7 CSE Global Ltd Annual Report 2009
GroupNote 2009 2008
$’000 $’000
Profit for the financial year 43,675 48,253
Other comprehensive income:
- Translation of financial statements of foreign operations 1,611 (16,799)
- Hedging of net investments (2,622) (10,217)
Other comprehensive income for the year, net of tax (1,011) (27,016)
Total comprehensive income for the year 42,664 21,237
Total comprehensive income for the year attributable to :-
Equity holders of the Company 42,648 21,237
Minority interests 16 –
42,664 21,237
The accompanying accounting policies and explanatory notes form an integral part of the financial statements.

for the financial year ended 31 December 2009
Statements of Changes in Equity
Annual Report 2009 CSE Global Ltd 8
Attributable to equity holders of the Company
Sharecapital
Treasury shares
Revenue reserve
Share-based
payment reserve
Foreign currency
translation reserve Total
Minorityinterests
Totalequity
$’000 $’000 $’000 $’000 $’000 $’000 $’000 $’000
2008Group
At 1 January 2008 90,343 – 54,545 653 (9,176) 136,365 14 136,379
Total comprehensive income for the year – – 48,253 – (27,016) 21,237 – 21,237
Dividends (Note 34) – – (22,813) – – (22,813) – (22,813)
Exercise of employee share options (Note 17a) 1,521 – – – – 1,521 – 1,521
Cancellation of employee share options (Note 18) – – – (19) – (19) – (19)
Transfer from share-based payment reserves on exercise of share options (Note 17a) 634 – – (634) – – – –
Purchase of treasury shares (Note 17b) – (28,043) – – – (28,043) – (28,043)
At 31 December 2008 92,498 (28,043) 79,985 – (36,192) 108,248 14 108,262
2009Group
At 1 January 2009 92,498 (28,043) 79,985 – (36,192) 108,248 14 108,262
Total comprehensive income for the year – – 43,659 – (1,011) 42,648 16 42,664
Minority interest in newly incorporated company – – – – – – 78 78
Dividends (Note 34) – – (14,281) – – (14,281) – (14,281)
At 31 December 2009 92,498 (28,043) 109,363 – (37,203) 136,615 108 136,723
The accompanying accounting policies and explanatory notes form an integral part of the financial statements.

for the financial year ended 31 December 2009
Statements of Changes in Equity
9 CSE Global Ltd Annual Report 2009
Attributable to equity holders of the Company
Sharecapital
Treasury shares
Revenuereserve
Share-based paymentreserve
Foreign currency
translation reserve
Totalequity
$’000 $’000 $’000 $’000 $’000 $’000
2008Company
At 1 January 2008 90,343 – 9,774 653 31 100,801
Total comprehensive income for the year – – 16,132 – (23) 16,109
Transfer from share-based payment reserve on exercise of share options (Note 17a) 634 – – (634) – –
Dividends (Note 34) – – (22,813) – – (22,813)
Cancellation of employee share options (Note 18) – – – (19) – (19)
Exercise of share options (Note 17a) 1,521 – – – – 1,521
Purchase of treasury shares (Note 17b) – (28,043) – – – (28,043)
At 31 December 2008 92,498 (28,043) 3,093 – 8 67,556
2009Company
At 1 January 2009 92,498 (28,043) 3,093 – 8 67,556
Total comprehensive income for the year – – 21,598 – (8) 21,590
Dividends (Note 34) – – (14,281) – – (14,281)
At 31 December 2009 92,498 (28,043) 10,410 – – 74,865
The accompanying accounting policies and explanatory notes form an integral part of the financial statements.

for the financial year ended 31 December 2009
Consolidated Statement of Cash Flows
Annual Report 2009 CSE Global Ltd 10
2009 2008$’000 $’000
Cash flows from operating activities :Profit before taxation 59,022 65,526Adjustments for : Depreciation of fixed assets 2,703 2,585 Amortisation of intangible assets 1,315 1,314 Share of results of associated companies, net of tax (55) (274) Impairment of investment in associated company 161 – Intangible assets written off 3,754 – Interest expense 5,474 5,338 Interest income (360) (991) (Gain)/loss on disposal of fixed assets (5) 55 Gain on disposal of associated company – (40) Fair value changes in value of derivative financial instruments (3,880) 3,905 Writeback of share-based payment expense on cancellation of share options – (19) Currency realignment 54 (12,390)
Operating income before reinvestment in working capital 68,183 65,009Decrease/(increase) in debtors and prepayments 19,288 (11,111)Increase in projects-in-progress, net and stocks (4,509) (13,994)Decrease in creditors (6,382) (3,118)
Cash generated from operations 76,580 36,786Interest paid (5,474) (5,338)Interest received 360 991Income tax paid (22,249) (12,824)
Net cash generated from operating activities 49,217 19,615
Cash flows from investing activities :Purchase of fixed assets (2,875) (2,621)Acquisition of subsidiary companies, net of cash acquired – (6,734)Share of minority interest in newly incorporated company 78 –Additions of intangible assets – (34)Repayment from/(advances to) associated companies 412 (637)Proceeds from disposal of fixed assets 61 87Proceeds from disposal of equity interest in associated company – 40Refund of purchase consideration from acquisition of subsidiary company 74 –
Net cash used in investing activities (2,250) (9,899)
Cash flows from financing activities :Net proceeds from issuance of shares – 1,521Acquisition of treasury shares – (28,043)(Repayment of) /proceeds from short-term borrowing (69,576) 28,577Proceeds from long-term borrowing 49,892 –Dividends paid to shareholders (14,281) (22,813)Repayment of finance lease obligations (43) (328)
Net cash used in financing activities (34,008) (21,086)Net effect of exchange rate changes on cash and cash equivalents 455 (4,899)
Net increase/(decrease) in cash and cash equivalents 13,414 (16,269)Cash and cash equivalents at beginning of financial year (Note 27) 42,639 58,908
Cash and cash equivalents at end of financial year (Note 27) 56,053 42,639
The accompanying accounting policies and explanatory notes form an integral part of the financial statements.

- 31 December 2009
Notes to the Financial Statements
11 CSE Global Ltd Annual Report 2009
1. Corporate information
CSE Global Limited (the “Company”) is a limited liability company which is incorporated in the Republic of Singapore. The registered office of the Company is located at 50 Raffles Place, Singapore Land Tower #32-01, Singapore 048623 and its principal place of business is No. 2 Ubi View Level 5 Singapore 408556.
The principal activities of the Company are those relating to provision of total integrated industrial automation, information technology and intelligent transport solutions and investment holding. The principal activities of the subsidiary companies are those relating to design, delivery, commissioning as well as provision of comprehensive maintenance to a wide array of industrial systems and investment holding. There have been no significant changes in the nature of these activities during the financial year.
2. Significant accounting policies
2.1 Basis of preparation
The consolidated financial statements of the Group and the balance sheet and statement of changes in equity of the Company have been prepared in accordance with Singapore Financial Reporting Standards (FRS).
The financial statements have been prepared on a historical cost basis except as disclosed in the accounting policies below.
The financial statements are presented in Singapore Dollars (SGD or $) and all values are rounded to the nearest thousand ($’000) except where otherwise indicated.
2.2 Changes in accounting policies
The accounting policies have been consistently applied by the Group, except for the changes in accounting policies discussed below.
The Group adopted the following revised standards mandatory for annual financial periods beginning on or after 1 January 2009.
FRS 1 : Presentation of Financial Statements (Revised)
FRS 18 : Amendments to FRS 18 Revenue
FRS 23 : Amendments to FRS 23 Borrowing Costs
FRS 32 : Amendments to FRS 32 Financial Instruments: Presentation
FRS 1 : Presentation of Financial Statements – Puttable Financial Instruments and Obligations Arising on Liquidation
FRS 101 : Amendments to FRS 101 First-time Adoption of Financial Reporting Standards and FRS 27 Consolidated and Separate Financial Statements – Cost of an Investment in a Subsidiary, Jointly Controlled Entity or Associate
FRS 102 : Amendments to FRS 102 Share-based Payment – Vesting Conditions and Cancellations
FRS 107 : Amendments to FRS 107 Financial Instruments: Disclosures
FRS 108 : Operating Segments
INT FRS 113: Customer Loyalty Programmes
INT FRS 116: Hedges of a Net Investment in a Foreign Operation
INT FRS 109: Reassessment of Embedded Derivatives
FRS 39 : Financial Instruments: Recognition and Measurement – Embedded Derivatives
INT FRS 118: Transfers of Assets from Customers
Adoption of these standards and interpretations did not have any effect on the financial performance or position of the Company. They did however give rise to additional disclosures.

- 31 December 2009
Notes to the Financial Statements
Annual Report 2009 CSE Global Ltd 12
2. Significant accounting policies (cont’d)
2.2 Changes in accounting policies (cont’d)
The principal effects of these changes are as follows:
FRS 1 Presentation of Financial Statements – Revised Presentation
The revised FRS 1 separates owner and non-owner changes in equity. The statement of changes in equity includes only details of transactions with owners, with all non-owner changes in equity presented in the statement of other comprehensive income. In addition, the Standard introduces the statement of comprehensive income which presents income and expense recognised in the period. This statement may be presented in one single statement, or two linked statements. The Group has elected to present this statement as two linked statements.
Amendments to FRS 107 Financial Instruments: Disclosures
The amendments to FRS 107 require additional disclosure about fair value measurement and liquidity risk. Fair value measurements are to be disclosed by source of inputs using a three level hierarchy for each class of financial instrument. In addition, reconciliation between the beginning and ending balance for Level 3 fair value measurements is now required, as well as significant transfers between Level 1 and Level 2 fair value measurements. The amendments also clarify the requirements for liquidity risk disclosures. The liquidity risk disclosures are presented in Note 31 to the financial statements respectively.
FRS 108 Operating Segments
FRS 108 requires disclosure of information about the Group’s operating segments and replaces the requirement to determine primary and secondary reporting segments of the Group. The Group determined that the reportable operating segments are the same as the business segments previously identified under FRS 14 Segment Reporting. Additional disclosures about each of the segments are shown in Note 28, including revised comparative information.
Improvements to FRSs issued in 2008
In 2008, the Accounting Standards Council issued an omnibus of amendments to FRS. There are separate transitional provisions for each amendment. The adoption of the following amendments resulted in changes to accounting policies but did not have any impact on the financial position or performance of the Group:
FRS 1 Presentation of Financial Statements: Assets and liabilities classified as held for trading in accordance with FRS 39 Financial Instruments: Recognition and Measurement are not automatically classified as current in the balance sheet. The Group amended its accounting policy accordingly and analysed whether Management’s expectation of the period of realisation of financial assets and liabilities differed from the classification of the instrument. This did not result in any re-classification of financial instruments between current and non-current in the balance sheet.
FRS 16 Property, Plant and Equipment: Replaces the term “net selling price” with “fair value less costs to sell”. The Group amended its accounting policy accordingly, which did not result in any change in the financial position.
FRS 23 Borrowing Costs: The definition of borrowing costs is revised to consolidate the two types of items that are considered components of “borrowing costs” into one – the interest expense calculated using the effective interest rate method calculated in accordance with FRS 39. The Group has amended its accounting policy accordingly which did not result in any change in its financial position.

- 31 December 2009
Notes to the Financial Statements
13 CSE Global Ltd Annual Report 2009
2. Significant accounting policies (cont’d)
2.3 Future changes in accounting policies
The Group has not adopted the following standards and interpretations that have been issued but not yet effective:
Effective for annual periods beginning on or after
Amendments to FRS 27 Consolidated and Separate Financial Statements 1 July 2009Amendments to FRS 39 Financial Instruments: Recognition and Measurement – Eligible Hedged Item 1 July 2009Revised FRS 103 Business Combinations 1 July 2009Amendments to FRS 105 Non-current Assets Held for Sale and Discontinued Operations 1 July 2009INT FRS 117 Distributions of Non-cash Assets to Owners 1 July 2009
Improvements to FRSs issued in 2009:
– Amendments to FRS 38 Intangible Assets 1 July 2009
– Amendments to FRS 102 Share-based Payment 1 July 2009
– Amendments to FRS 108 Operating Segments 1 July 2009
– Amendments to INT FRS 109 Reassessment of Embedded Derivatives 1 July 2009
– Amendments to INT FRS 116 Hedges of a Net Investment in a Foreign Operation 1 July 2009
– Amendments to FRS 1 Presentation of Financial Statements 1 January 2010
– Amendments to FRS 7 Statement of Cash Flows 1 January 2010
– Amendments to FRS 17 Leases 1 January 2010
– Amendments to FRS 36 Impairment of Assets 1 January 2010
– FRS 39 Financial Instruments: Recognition and Measurement 1 January 2010
– Amendments to FRS 105 Non-current Assets Held for Sale and Discontinued Operations 1 January 2010
– Amendments to FRS 108 Operating Segments 1 January 2010
Except for the revised FRS 103 and the amendments to FRS 27, the directors expect that the adoption of the standards and interpretations above will have no material impact on the financial statements in the period of initial application. The nature of the impending changes in accounting policy on adoption of the revised FRS 103 and the amendments to FRS 27 are described below.
Revised FRS 103 Business Combinations and Amendments to FRS 27 Consolidated and Separate Financial Statements
The revised standards are effective for annual periods beginning on or after 1 July 2009. The revised FRS 103 introduces a number of changes in the accounting for business combinations occurring after 1 July 2009. These changes will impact the amount of goodwill recognised, the reported results in the period that an acquisition occurs, and future reported results. The Amendments to FRS 27 require that a change in the ownership interest of a subsidiary (without loss of control) is accounted for as an equity transaction. Therefore, such transactions will no longer give rise to goodwill, nor will they give rise to a gain or loss. Furthermore, the amended standard changes the accounting for losses incurred by the subsidiary as well as the loss of control of a subsidiary. Other consequential amendments were made to FRS 7 Statement of Cash Flows, FRS 12 Income Taxes, FRS 21 The Effects of Changes in Foreign Exchange Rates, FRS 28 Investments in Associates and FRS 31 Interests in Joint Ventures. The changes from revised FRS 103 and Amendments to FRS 27 will affect future acquisitions or loss of control and transactions with minority interests. The standards may be early applied. However, the Group does not intend to early adopt.

- 31 December 2009
Notes to the Financial Statements
Annual Report 2009 CSE Global Ltd 14
2. Significant accounting policies (cont’d)
2.4 Significant accounting estimates and judgements
Estimates, assumptions concerning the future and judgements are made in the preparation of the financial statements. They affect the application of the Group’s accounting policies, reported amounts of assets, liabilities, income and expenses, and disclosures made. They are assessed on an on-going basis and are based on experience and relevant factors, including expectations of future events that are believed to be reasonable under the circumstances.
(a) Key sources of estimation uncertainty
The key assumptions concerning the future and other key sources of estimation uncertainty at the balance sheet date, that have a significant risk of causing a material adjustment to the carrying amounts of assets and liabilities within the next financial year are discussed below.
(i) Impairment of goodwill
The Group determines whether goodwill is impaired on an annual basis. This requires an estimation of the value in use of the cash-generating units to which the goodwill is allocated. Estimating the value in use requires the Group to make an estimate of the expected future cash flows from the cash-generating unit and also to choose a suitable discount rate in order to calculate the present value of those cash flows. The carrying amount of the Group’s goodwill at 31 December 2009 approximated $59,115,000 (2008 : $56,604,000). More details are given in Note 8.
(ii) Depreciation of fixed assets
Fixed assets are depreciated on a straight-line basis over their estimated useful lives. Management estimates the useful lives of these fixed assets to be within 2 to 57 years. The carrying amount of the Group’s fixed assets at 31 December 2009 approximated $12,986,000 (2008 : $12,669,000). Changes in the expected level of usage and technological developments could impact the economic useful lives and the residual values of these assets. Therefore, future depreciation charges could be revised.
(iii) Income taxes
The Group has exposure to income taxes in numerous jurisdictions. Significant judgement is involved in determining the Group-wide provision for income taxes. There are certain transactions and computations for which the ultimate tax determination is uncertain during the ordinary course of business. The Group recognises liabilities for expected tax issues based on estimates of whether additional taxes will be due. Where the final tax outcome of these matters is different from the amounts that were initially recognised, such differences will impact the income tax and deferred tax provisions in the period in which such determination is made. The carrying amount of the Group’s current and deferred tax payables at 31 December 2009 approximated $8,015,000 (2008: $12,497,000).
(iv) Deferred tax assets
Deferred tax assets are recognised for all unused tax losses and capital allowances to the extent that it is probable that taxable profit will be available against which the losses and capital allowances can be utilised. Significant management judgement is required to determine the amount of deferred tax assets that can be recognised, based upon the likely timing and level of future taxable profits together with tax planning strategies. The carrying value of recognised tax losses and capital allowances at 31 December 2009 was $15,571,000 (2008: $14,121,000)
(v) Provision for warranties
The Group has exposure to warranties arising from warranty obligations stated in its project contracts. Management estimates the amount of warranty to be provided based on available information and its prior experience. The carrying amount of the Group’s provision for warranties at 31 December 2009 approximated $1,402,000 (2008: $1,582,000).

- 31 December 2009
Notes to the Financial Statements
15 CSE Global Ltd Annual Report 2009
2. Significant accounting policies (cont’d)
2.4 Significant accounting estimates and judgements (cont’d)
(b) Critical judgements made in applying accounting policies
The following are the judgements made by management in the process of applying the Group’s accounting policies that have the most significant effect on the amounts recognised in the financial statements.
(i) Impairment of loans and receivables
The Group assesses at each balance sheet date whether there is any objective evidence that a financial asset is impaired. To determine whether there is objective evidence of impairment, the Group considers factors such as the probability of insolvency or significant financial difficulties of the debtor and default or significant delay in payments.
Where there is objective evidence of impairment, the amount and timing of future cash flows are estimated based on historical loss experience for assets with similar credit risk characteristics. The carrying amount of the Group’s loans and receivables at the balance sheet date is disclosed in Note 12 to the financial statements.
(ii) Construction contracts
The Group recognises revenue arising from contracts using the percentage of completion method when the stage of contract completion can be reliably determined, cost to date can be clearly identified, and the total contract revenue and costs to complete can be reliably estimated. Significant judgement is involved in the recoverability of gross amount due from customers and the adequacy of foreseeable losses, if any. The net carrying amounts due from customers for contract work (Note 10) is approximately $71,965,000 (2008 : $69,764,000).
2.5 Foreign currency
Transactions in foreign currencies are measured in the respective functional currencies of the Company and its subsidiaries and are recorded on initial recognition in the functional currencies at exchange rates approximating those ruling at the transaction dates. Monetary assets and liabilities denominated in foreign currencies are translated at the closing rate of exchange ruling at the balance sheet date. Non-monetary items that are measured in terms of historical cost in a foreign currency are translated using the exchange rates as at the dates of the initial transactions. Non-monetary items measured at fair value in a foreign currency are translated using the exchange rates at the date when the fair value was determined.
Exchange differences arising on the settlement of monetary items or on translating monetary items at the balance sheet date are recognised in the profit and loss account except for exchange differences arising on monetary items that form part of the Group’s net investment in foreign subsidiaries, which are recognised initially in other comprehensive income and accumulated under foreign currency translation reserve in equity. The foreign currency translation reserve is reclassified from equity to profit or loss of the Group on disposal of the foreign operation.
Goodwill and fair value adjustments arising on the acquisition of foreign operations are treated as assets and liabilities of the foreign operations and are recorded in the functional currency of the foreign operations and translated at the closing rate at the balance sheet date.
The assets and liabilities of foreign operations are translated into SGD at exchange rates ruling at balance sheet date and their statement of comprehensive income are translated at weighted average exchange rates for the year. The exchange differences arising on the translation are taken directly to other comprehensive income. On disposal of a foreign operation, the cumulative amount recognised in other comprehensive income relating to that particular foreign operation is recognized in the profit or loss.
- 31 December 2009
Notes to the Financial Statements
Annual Report 2009 CSE Global Ltd 16
2. Significant accounting policies (cont’d)
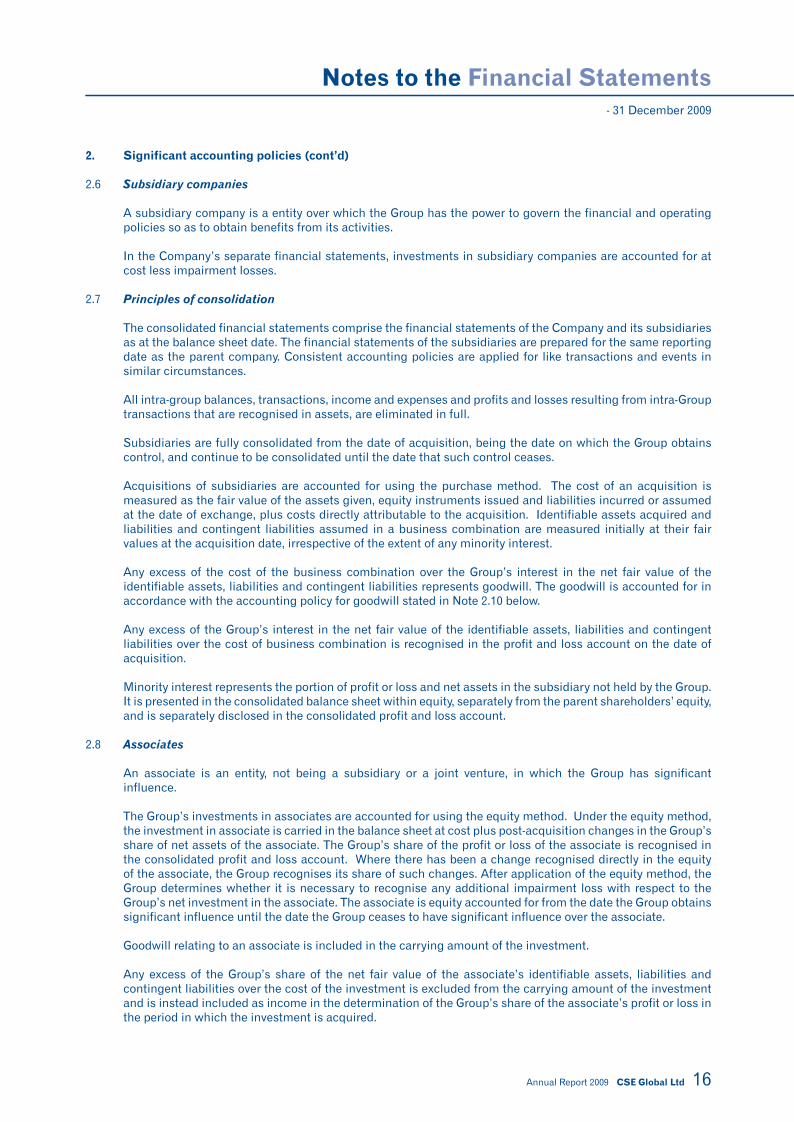
2.6 Subsidiary companies
A subsidiary company is a entity over which the Group has the power to govern the financial and operating policies so as to obtain benefits from its activities.
In the Company’s separate financial statements, investments in subsidiary companies are accounted for at cost less impairment losses.
2.7 Principles of consolidation
The consolidated financial statements comprise the financial statements of the Company and its subsidiaries as at the balance sheet date. The financial statements of the subsidiaries are prepared for the same reporting date as the parent company. Consistent accounting policies are applied for like transactions and events in similar circumstances.
All intra-group balances, transactions, income and expenses and profits and losses resulting from intra-Group transactions that are recognised in assets, are eliminated in full.
Subsidiaries are fully consolidated from the date of acquisition, being the date on which the Group obtains control, and continue to be consolidated until the date that such control ceases.
Acquisitions of subsidiaries are accounted for using the purchase method. The cost of an acquisition is measured as the fair value of the assets given, equity instruments issued and liabilities incurred or assumed at the date of exchange, plus costs directly attributable to the acquisition. Identifiable assets acquired and liabilities and contingent liabilities assumed in a business combination are measured initially at their fair values at the acquisition date, irrespective of the extent of any minority interest.
Any excess of the cost of the business combination over the Group’s interest in the net fair value of the identifiable assets, liabilities and contingent liabilities represents goodwill. The goodwill is accounted for in accordance with the accounting policy for goodwill stated in Note 2.10 below.
Any excess of the Group’s interest in the net fair value of the identifiable assets, liabilities and contingent liabilities over the cost of business combination is recognised in the profit and loss account on the date of acquisition.
Minority interest represents the portion of profit or loss and net assets in the subsidiary not held by the Group. It is presented in the consolidated balance sheet within equity, separately from the parent shareholders’ equity, and is separately disclosed in the consolidated profit and loss account.
2.8 Associates
An associate is an entity, not being a subsidiary or a joint venture, in which the Group has significant influence.
The Group’s investments in associates are accounted for using the equity method. Under the equity method, the investment in associate is carried in the balance sheet at cost plus post-acquisition changes in the Group’s share of net assets of the associate. The Group’s share of the profit or loss of the associate is recognised in the consolidated profit and loss account. Where there has been a change recognised directly in the equity of the associate, the Group recognises its share of such changes. After application of the equity method, the Group determines whether it is necessary to recognise any additional impairment loss with respect to the Group’s net investment in the associate. The associate is equity accounted for from the date the Group obtains significant influence until the date the Group ceases to have significant influence over the associate.
Goodwill relating to an associate is included in the carrying amount of the investment.
Any excess of the Group’s share of the net fair value of the associate’s identifiable assets, liabilities and contingent liabilities over the cost of the investment is excluded from the carrying amount of the investment and is instead included as income in the determination of the Group’s share of the associate’s profit or loss in the period in which the investment is acquired.

- 31 December 2009
Notes to the Financial Statements
17 CSE Global Ltd Annual Report 2009
2. Significant accounting policies (cont’d)
2.8 Associates (cont’d)
When the Group’s share of losses in an associate equals or exceeds its interest in the associate, including any other unsecured receivables, the Group does not recognise further losses, unless it has incurred obligations or made payments on behalf of the associate.
After application of the equity method, the Group determines whether it is necessary to recognise an additional impairment loss on the Group’s investment in its associates. The Group determines at each balance sheet date whether there is any objective evidence that the investment in the associate is impaired. If this is the case, the Group calculates the amount of impairment as the difference between the recoverable amount of the associate and its carrying value and recognises the amount in the profit or loss.
The financial statements of the associates are prepared as of the same reporting date as the Company unless it is impracticable to do so. When the financial statements of an associate used in applying the equity method are prepared as of a different reporting date from that of the Company, adjustments are made for the effects of significant transactions or events that occur between that date and the reporting date of the Company. Consistent accounting policies are applied for like transactions and events in similar circumstances.
In the Company’s separate financial statements, investments in associates are accounted for at cost less impairment losses.
2.9 Fixed assets
Fixed assets are stated at cost less accumulated depreciation and any accumulated impairment losses. The initial cost of fixed assets comprises its purchase price and any directly attributable costs of bringing the asset to its working condition and location for its intended use, any trade discounts and rebates are deducted in arriving at the purchase price. Expenditure incurred after the fixed assets have been put into operation, such as repairs and maintenance and overhaul costs, is normally charged to the profit and loss account in the period in which the costs are incurred. In situations where it can be clearly demonstrated that the expenditure has resulted in an increase in the future economic benefits expected to be obtained from the use of an item of fixed assets beyond its originally assessed standard of performance, the expenditure is capitalised as an additional cost of fixed assets.
Depreciation is calculated on the straight-line method to write off the cost of fixed assets over their estimated useful lives at the following annual rates :-
Leasehold land - 57 years Buildings - 20 to 39 years Leasehold improvements - 2 to 20 years Plant and machinery - 4 to 5 years Tools and equipment - 5 years Office furniture and fittings - 5 years Computer equipment - 2 to 5 years Motor vehicles - 5 to 7 years
No depreciation is provided on freehold land and construction in progress.
The carrying values of fixed assets are reviewed for impairment when events or changes in circumstances indicate that the carrying value may not be recoverable.
The residual values, useful life and depreciation method are reviewed annually to ensure that the amount, method and period of depreciation are consistent with previous estimates and the expected pattern of economic benefits from items of fixed assets.
An item of fixed assets is derecognised upon disposal or when no future economic benefits are expected from its use or disposal. Any gain or loss arising on derecognition of the asset is included in the profit and loss account in the year the asset is derecognised.
- 31 December 2009
Notes to the Financial Statements
Annual Report 2009 CSE Global Ltd 18
2. Significant accounting policies (cont’d)
2.10 Intangible assets
Goodwill
Goodwill acquired in a business combination is initially measured at cost being the excess of the cost of the business combination over the Group’s interest in the net fair value of the identifiable assets, liabilities and contingent liabilities. Following initial recognition, goodwill is measured at cost less any accumulated impairment losses. Goodwill is reviewed for impairment, annually or more frequently if events or changes in circumstances indicate that the carrying value may be impaired.
For the purpose of impairment testing, goodwill acquired in a business combination is, from the acquisition date, allocated to each of the Group’s cash-generating units, or groups of cash-generating units, that are expected to benefit from the synergies of the combination, irrespective of whether other assets or liabilities of the Group are assigned to those units or groups of units. Each unit or group of units to which the goodwill is so allocated:
represents the lowest level within the Group at which the goodwill is monitored for internal management purposes; and
is not larger than a segment based on either the Group’s primary or the Group’s secondary reporting format.
A cash-generating unit (or group of cash-generating units) to which goodwill has been allocated are tested for impairment annually and whenever there is an indication that the unit may be impaired, by comparing the carrying amount of the unit, including the goodwill, with the recoverable amount of the unit. Where the recoverable amount of the cash-generating unit (or group of cash-generating units) is less than the carrying amount, an impairment loss is recognised.
Where goodwill forms part of a cash-generating unit (or group of cash-generating units) and part of the operation within that unit is disposed of, the goodwill associated with the operation disposed of is included in the carrying amount of the operation when determining the gain or loss on disposal of the operation. Goodwill disposed of in this circumstance is measured based on the relative values of the operation disposed of and the portion of the cash-generating unit retained.
Goodwill and fair value adjustments arising on the acquisition of foreign operations on or after 1 January 2005 are treated as assets and liabilities of the foreign operations and are recorded in the functional currency of the foreign operations and translated at the closing rate at the balance sheet date.
Goodwill and fair value adjustments which arose on acquisitions of foreign subsidiaries before 1 January 2005 are deemed to be assets and liabilities of the parent company and are recorded in SGD at the rates prevailing at the date of acquisition.
The Group does not reverse in a subsequent period, any impairment loss recognised for goodwill.
Other intangible assets
Acquired both separately and from a business combination
Intangible assets acquired separately are measured on initial recognition at cost. The cost of intangible assets acquired in a business combination is their fair values as at the date of acquisition. Following initial recognition, intangible assets are carried at cost less any accumulated amortisation and any accumulated impairment losses. The useful lives of intangible assets are assessed to be either finite or indefinite. Intangible assets with finite lives are amortised on a straight-line basis over the estimated economic useful lives and assessed for impairment whenever there is an indication that the intangible asset may be impaired. The amortisation period and the amortisation method for an intangible asset with a finite useful life are reviewed at least at each financial year-end. The amortisation expense on intangible assets with finite lives is recognised in the profit or loss in the expense category consistent with the function of the intangible asset.

- 31 December 2009
Notes to the Financial Statements
19 CSE Global Ltd Annual Report 2009
2. Significant accounting policies (cont’d)
2.10 Intangible assets (cont’d)
Intangible assets with indefinite useful lives are tested for impairment annually or more frequently if the events or changes in circumstances indicate that the carrying value may be impaired either individually or at the cash-generating unit level. Such intangibles are not amortised. The useful life of an intangible asset with an indefinite life is reviewed annually to determine whether the useful life assessment continues to be supportable.
Cost directly attributable to the development of intellectual property on the intangible assets are capitalised as intangible assets only when technical feasibility of the project is demonstrated, the Group has an intention and ability to complete and use the technology and the cost can be measured reliably.
Licenses and intellectual property rights
Costs relating to licenses and intellectual property rights, which are acquired, are capitalised and amortised on a straight-line basis over their 10 to 15 year useful lives.
2.11 Impairment of non-financial assets
The Group assesses at each reporting date whether there is an indication that an asset may be impaired. If any such indication exists, or when annual impairment testing for an asset (i.e. goodwill acquired in a business combination) is required, the Group makes an estimate of the asset’s recoverable amount.
An asset’s recoverable amount is the higher of an asset’s or cash-generating unit’s fair value less costs to sell and its value in use and is determined for an individual asset, unless the asset does not generate cash inflows that are largely independent of those from other assets or groups of assets. In assessing value in use, the estimated future cash flows are discounted to their present value using a pre-tax discount rate that reflects current market assessments of the time value of money and the risks specific to the asset. Where the carrying amount of an asset exceeds its recoverable amount, the asset is considered impaired and is written down to its recoverable amount.
Impairment losses are recognised in the profit or loss except for assets that are previously revalued where the revaluation was taken to other comprehensive income. In this case, the impairment is also recognised in other comprehensive income up to the amount of any previous revaluation.
An assessment is made at each reporting date as to whether there is any indication that previously recognised impairment losses recognised for an asset other than goodwill may no longer exist or may have decreased. If such indication exists, the recoverable amount is estimated. A previously recognised impairment loss is reversed only if there has been a change in the estimates used to determine the asset’s recoverable amount since the last impairment loss was recognised. If that is the case the carrying amount of the asset is increased to its recoverable amount. That increase cannot exceed the carrying amount that would have been determined, net of depreciation, had no impairment loss been recognised for the asset in prior years. Reversal of an impairment loss is recognised in the profit and loss account unless the asset is carried at revalued amount, in which case the reversal in excess of impairment loss previously recognised through the profit and loss account is treated as a revaluation increase. After such a reversal, the depreciation charge is adjusted in future periods to allocate the asset’s revised carrying amount, less any residual value, on a systematic basis over its remaining useful life.
2.12 Financial assets
Financial assets are recognised on the balance sheet when, and only when, the Group becomes a party to the contractual provisions of the financial instrument.
Non-derivative financial assets with fixed or determinable payments that are not quoted in an active market are classified as loans and receivables. Such assets are initially recognised at fair value, plus directly attributable transaction costs and subsequently carried at amortised cost using the effective interest method. Gains and losses are recognised in profit and loss account when the loans and receivables are derecognised or impaired, as well as through the amortisation process. A financial asset is derecognised where the contractual right to receive cash flows from the asset has expired.
- 31 December 2009
Notes to the Financial Statements
Annual Report 2009 CSE Global Ltd 20
2. Significant accounting policies (cont’d)
2.12 Financial assets (cont’d)
On derecognition of a financial asset, the difference between the carrying amount and the sum of (a) the consideration received and (b) any cumulative gain or loss that has been recognised directly in equity is recognised in the profit and loss account.
Derivative financial instruments are classified as held for trading unless they are designated as effective hedging instruments and gains or losses are recognised in the profit and loss account.
2.13 Cash and cash equivalents
Cash and cash equivalents consist of cash and bank balances and short-term deposits.
Cash and bank balances and short term deposits carried in the balance sheets are accounted for as loans and receivables under FRS 39. The accounting policy for this category of financial assets is stated in Note 2.12.
2.14 Trade and other debtors
Trade and other debtors include amounts due from subsidiaries and associated companies. These are classified and accounted for as loans and receivables under FRS 39. The accounting policy for this category of financial assets is stated in Note 2.12.
An allowance is made for uncollectible amounts when there is objective evidence that the Group will not be able to collect the debt. Bad debts are written off when identified. Further details on the accounting policy for impairment of financial assets are stated in Note 2.15 below.
2.15 Impairment of financial assets
The Group assesses at each balance sheet date whether there is any objective evidence that a financial asset or group of financial assets is impaired.
(a) Assets carried at amortised cost
If there is objective evidence that an impairment loss on loans and receivables or held-to-maturity investments carried at amortised cost has been incurred, the amount of the loss is measured as the difference between the asset’s carrying amount and the present value of estimated future cash flows (excluding future credit losses that have not been incurred) discounted at the financial asset’s original effective interest rate (i.e. the effective interest rate computed at initial recognition). The carrying amount of the asset is reduced through the use of an allowance account. The amount of the loss is recognised in the profit and loss account.
When the asset becomes uncollectible, the carrying amount of impaired financial assets is reduced directly or if an amount was charged to the allowance account, the amounts charged to the allowance account are written off against the carrying value of the financial asset.
To determine whether there is objective evidence that an impairment loss on financial assets has been incurred, the Group considers factors such as the probability of insolvency or significant financial difficulties of the debtor and default or significant delay in payments.
If, in a subsequent period, the amount of the impairment loss decreases and the decrease can be related objectively to an event occurring after the impairment was recognised, the previously recognised impairment loss is reversed. Any subsequent reversal of an impairment loss is recognised in the profit and loss account, to the extent that the carrying value of the asset does not exceed its amortised cost at the reversal date.

- 31 December 2009
Notes to the Financial Statements
21 CSE Global Ltd Annual Report 2009
2. Significant accounting policies (cont’d)
2.15 Impairment of financial assets (cont’d)
(b) Assets carried at cost
If there is objective evidence that an impairment loss on an unquoted equity instrument that is not carried at fair value because its fair value cannot be reliably measured, or on a derivative asset that is linked to and must be settled by delivery of such an unquoted equity instrument has been incurred, the amount of the loss is measured as the difference between the asset’s carrying amount and the present value of estimated future cash flows discounted at the current market rate of return for a similar financial asset. Such impairment losses are not reversed in subsequent periods.
2.16 Stocks and projects-in-progress
Stocks are stated at the lower of cost and net realisable value. Cost comprises the cost of materials calculated on a first-in-first-out basis. Net realisable value represents the estimated selling price less anticipated cost of disposal and after making allowance for damaged, obsolete and slow-moving items.
Projects-in-progress are stated at cost plus attributable profits less progress payments received and receivable and provision for foreseeable losses. Cost of projects-in-progress includes direct materials, labour and an appropriate proportion of overheads.
2.17 Financial liabilities
Financial liabilities within the scope of FRS 39 are recognised on the balance sheet when, and only when, the Group becomes a party to the contractual provisions of the financial instrument.
Financial liabilities are recognised initially at fair value, plus, in the case of financial liabilities other than derivatives, directly attributable transaction costs.
Subsequent to initial recognition, derivatives are measured at fair value. Other financial liabilities (except for financial guarantee) are measured at amortised cost using the effective interest method.
For financial liabilities other than derivatives, gains and losses are recognised in profit or loss when the liabilities are derecognised, and through the amortisation process. Any gains or losses arising from changes in fair value of derivatives are recognised in profit or loss. Net gains or losses on derivatives include exchange differences.
A financial liability is derecognised when the obligation under the liability is extinguished. When an existing financial liability is replaced by another from the same lender on substantially different terms, or the terms of an existing liability are substantially modified, such an exchange or modification is treated as a derecognition of the original liability and the recognition of a new liability, and the difference in the respective carrying amounts is recognised in the profit or loss.
2.18 Interest bearing loans and borrowings
All loans and borrowings are initially recognised at the fair value of the consideration received less directly attributable transaction costs.
After initial recognition, interest-bearing loans and borrowings are subsequently measured at amortised cost using the effective interest method.
Gains and losses are recognised in the profit and loss account when the liabilities are derecognised as well as through the amortisation process.

- 31 December 2009
Notes to the Financial Statements
Annual Report 2009 CSE Global Ltd 22
2. Significant accounting policies (cont’d)
2.19 Borrowing costs
Borrowing costs are generally expensed as incurred. Borrowing costs are capitalised if they are directly attributable to the acquisition, construction or production of a qualifying asset. Capitalisation of borrowing costs commences when the activities to prepare the asset for its intended use or sale are in progress and the expenditures and borrowing costs are being incurred. Borrowing costs are capitalised until the assets are ready for their intended use. If the resulting carrying amount of the asset exceeds its recoverable amount, an impairment loss is recorded.
2.20 Provisions
Provisions are recognised when the Group has a present obligation (legal or constructive) where, as a result of a past event, it is probable that an outflow of resources embodying economic benefits will be required to settle the obligation and a reliable estimate can be made of the amount of the obligation.
Provisions are reviewed at each balance sheet date and adjusted to reflect the current best estimate. If it is no longer probable that an outflow of economic resources will be required to settle the obligation, the provision is reversed. If the effect of the time value of money is material, provisions are discounted using a current pre-tax rate that reflects, where appropriate, the risks specific to the liability. When discounting is used, the increase in the provision due to the passage of time is recognised as a finance cost.
2.21 Employee benefits
(a) Defined contribution plans
As required by law, the Group’s companies in Singapore, Malaysia, India, Australia and New Zealand make contributions to their respective countries’ state pension schemes, being the Central Provident Fund (“CPF”) in Singapore, the Employees Provident Fund (“EPF”) in Malaysia and India, the Superannuation in Australia and the KiwiSaver in New Zealand. These state pension schemes are defined contribution plans that serve as the national retirement benefits plan for the employees of the Group working in those countries.
As required by law, the Group’s companies in the United Kingdom operate a defined contribution pension scheme. Assets of the scheme are held separately from those of the companies in the United Kingdom in an independently administered fund.
The contributions that are made towards the above mentioned contribution pension schemes are recognised as compensation expenses in the same period as the employment that gives rise to the contributions.
Details of the defined contribution pension schemes are as disclosed in Note 24 under employees’ provident fund.
(b) Employee leave entitlement
Employee entitlements to annual leave are recognised as a liability when they accrue to employees. The estimated liability for leave is recognised for services rendered by employees up to balance sheet date.
(c) Employee share option scheme
The Company’s share option schemes have expired and there are presently no share option schemes during the financial year.

- 31 December 2009
Notes to the Financial Statements
23 CSE Global Ltd Annual Report 2009
2. Significant accounting policies (cont’d)
2.22 Leases
The determination of whether an arrangement is, or contains a lease is based on the substance of the arrangement at inception date: whether fulfilment of the arrangement is dependent on the use of a specific asset or assets or the arrangement conveys a right to use the asset. For arrangements entered into prior to 1 January 2005, the date of inception is deemed to be 1 January 2005 in accordance with the transitional requirements of INT FRS 104.
(a) As lessee
Finance leases, which effectively transfer to the Group substantially all the risks and benefits incidental to ownership of the leased item, are capitalised at the present value of the minimum lease payments at the inception of the lease term and disclosed as leased fixed assets. Any initial direct costs are also added to the amount capitalised. Lease payments are apportioned between the finance charges and reduction of the lease liability so as to achieve a constant rate of interest on the remaining balance of the liability. Finance charges are charged directly to profit and loss account. Contingent rents, if any, are charged as expenses in the periods in which they are incurred.
Capitalised leased assets are depreciated over the shorter of the estimated useful life of the asset or the lease term, if there is no reasonable certainty that the Group will obtain ownership by the end of the lease term.
Operating lease payments are recognised as an expense in the income statement on a straight-line basis over the lease term. The aggregate benefit of incentives provided by the lessor is recognised as a reduction of rental expense over the lease term on a straight-line basis.
(b) As lessor
Leases where the Group retains substantially all the risks and rewards of ownership of the asset are classified as operating leases. Initial direct costs incurred in negotiating an operating lease are added to the carrying amount of the leased asset and recognised over the lease term on the same bases as rental income. The accounting policy for rental income is set out in Note 2.23.
2.23 Revenue recognition
Project revenue from contracts is recognised on an individual contract basis using the percentage of completion method when the stage of contract completion can be reliably determined, cost-to-date can be clearly identified, and the total contract revenue and costs to complete can be reliably estimated. The stage of completion is measured by either:
− the percentage of costs incurred to estimated total costs to complete the contracts; or − the proportion of labour costs incurred for work to date to the total estimated labour costs to be incurred;
or
− upon completion of designated phases of a contract.
An expected loss on the contract is recognised as an expense immediately when it is probable that total contract costs will exceed total contract revenue.
Revenue from sale of goods and services rendered is recognised upon delivery of goods/ services and acceptance by customers.

- 31 December 2009
Notes to the Financial Statements
Annual Report 2009 CSE Global Ltd 24
2. Significant accounting policies (cont’d)
2.23 Revenue recognition (cont’d)
Maintenance revenue is recognised on a straight line basis over the specified contract period. Maintenance revenue received in advance is deferred as unearned income and recognised as income over the life of the maintenance contracts.
Dividend income is recognised when the Group’s right to receive payment is established.
Rental income is recognised on a straight-line basis.
Interest income is recognised using the effective interest method.
2.24 Income taxes
(a) Current tax
Current tax assets and liabilities are measured at the amount expected to be recovered from or paid to the taxation authorities. The tax rates and tax laws used to compute the amount are those that are enacted or substantively enacted by the balance sheet date.
Current taxes are recognised in the income statement except to the extent that the tax relates to items recognised outside profit and loss, either in other comprehensive income or directly in equity.
(b) Deferred tax
Deferred income tax is provided using the liability method on temporary differences at the balance sheet date between the tax bases of assets and liabilities and their carrying amounts for financial reporting purposes.
Deferred tax liabilities are recognised for all temporary differences, except:
− Where the deferred income tax liability arises from the initial recognition of goodwill or of an asset or liability in a transaction that is not a business combination and, at the time of the transaction, affects neither the accounting profit nor taxable profit or loss; and
− In respect of taxable temporary differences associated with investments in subsidiaries and associates, where the timing of the reversal of the temporary differences can be controlled and it is probable that the temporary differences will not reverse in the foreseeable future.
Deferred income tax assets are recognised for all deductible temporary differences, carry forward of unused tax credits and unused tax losses, to the extent that it is probable that taxable profit will be available against which the deductible temporary differences, and the carry forward of unused tax credits and unused tax losses can be utilised except:
– where the deferred income tax asset relating to the deductible temporary difference arises from the initial recognition of an asset or liability in a transaction that is not a business combination and, at the time of the transaction, affects neither the accounting profit nor taxable profit or loss; and
– in respect of deductible temporary differences associated with investments in subsidiaries and associates, deferred income tax assets are recognised only to the extent that it is probable that the temporary differences will reverse in the foreseeable future and taxable profit will be available against which the temporary differences can be utilised.
The carrying amount of deferred income tax assets is reviewed at each balance sheet date and reduced to the extent that it is no longer probable that sufficient taxable profit will be available to allow all or part of the deferred income tax asset to be utilised. Unrecognised deferred income tax assets are reassessed at each balance sheet date and are recognised to the extent that it has become probable that future taxable profit will allow the deferred tax asset to be utilised.

- 31 December 2009
Notes to the Financial Statements
25 CSE Global Ltd Annual Report 2009
2. Significant accounting policies (cont’d)
2.24 Income taxes (cont’d)
(b) Deferred tax (cont’d)
Deferred income tax assets and liabilities are measured at the tax rates that are expected to apply to the year when the asset is realised or the liability is settled, based on tax rates (and tax laws) that have been enacted or substantively enacted at the balance sheet date.
Deferred income tax relating to items recognised outside profit or loss is recognised outside profit or loss. Deferred tax items are recognised in correlation to the underlying transaction either in other comprehensive income or directly in equity and deferred tax arising from a business combination is adjusted against goodwill on acquisition.
Deferred tax assets and deferred tax liabilities are offset, if a legally enforceable right exists to set off current tax assets against current tax liabilities and the deferred taxes relate to the same taxable entity and the same taxation authority.
(c) Sales tax
Revenues, expenses and assets are recognised net of the amount of sales tax except:
− where the sales tax incurred on a purchase of assets or services is not recoverable from the taxation authority, in which case the sales tax is recognised as part of the cost of acquisition of the asset or as part of the expense item as applicable; and
− receivables and payables that are stated with the amount of sales tax included.
The net amount of sales tax recoverable from, or payable to, the taxation authority is included as part of receivables or payables in the balance sheet.
2.25 Derivative financial instruments and hedging activities
The Group may use derivative financial instruments such as foreign currency contracts to hedge its risks associated with foreign exchange rate fluctuations. Such derivative financial instruments are initially recognised at fair value on the date on which a derivative contract is entered into and are subsequently remeasured at fair value. Derivative financial instruments are carried as assets when the fair value is positive and as liabilities when the fair value is negative.
Any gains or losses arising from changes in fair value on derivative financial instruments that do not qualify for hedge accounting are taken to the profit and loss account for the year.
The fair value of forward currency contracts is calculated by reference to current forward exchange rates for contracts with similar maturity profiles.
For the purpose of hedge accounting, hedges are classified as :
Fair value hedges when hedging the exposure to changes in the fair value of a recognised asset or liability or an unrecognised firm commitment, that is attributable to a particular risk and could affect profit or loss;
Cash flow hedges when hedging exposure to variability in cash flows that is either attributable to a particular risk associated with a recognised asset or liability or a highly probable forecast transaction and could affect profit or loss; or
Hedges of a net investment in a foreign operation.

- 31 December 2009
Notes to the Financial Statements
Annual Report 2009 CSE Global Ltd 26
2. Significant accounting policies (cont’d)
2.25 Derivative financial instruments and hedging activities (cont’d)
At the inception of a hedge relationship, the Group formally designates and documents the hedge relationship to which the Group wishes to apply hedge accounting and the risk management objective and strategy for undertaking the hedge. The documentation includes identification of the hedging instrument, the hedged item or transaction, the nature of the risk being hedged and how the entity will assess the hedging instrument’s effectiveness in offsetting the exposure to changes in the hedged item’s fair value or cash flows attributable to the hedged risk. Such hedges are expected to be highly effective in achieving offsetting changes in fair value or cash flows and are assessed on an ongoing basis to determine that they actually have been highly effective throughout the financial reporting periods for which they were designated.
Hedges which meet the strict criteria for hedge accounting are accounted for as follows:
(a) Fair value hedges
For fair value hedges, the carrying amount of the hedged item is adjusted for gains and losses attributable to the risk being hedged, the derivative is remeasured at fair value and gains and losses from both are taken to the profit and loss account.
For fair value hedges relating to items carried at amortised cost, the adjustment to carrying value is amortised through the profit and loss account over the remaining term to maturity. Any adjustment to the carrying amount of a hedged financial instrument for which the effective interest method is used is amortised to the profit and loss account.
Amortisation begins as soon as an adjustment exists but no later than when the hedged item ceases to be adjusted for changes in its fair value attributable to the risk being hedged.
When an unrecognised firm commitment is designated as a hedged item, the subsequent cumulative change in the fair value of the firm commitment attributable to the hedged risk is recognised as an asset or liability with a corresponding gain or loss recognised in the profit and loss account. The changes in the fair value of the hedging instrument are also recognised in the profit and loss account.
The Group discontinues fair value hedge accounting if the hedging instrument expires or is sold, terminated or exercised, the hedge no longer meets the criteria for hedge accounting or the Group revokes the designation. Any adjustment to the carrying amount of a hedged financial instrument for which the effective interest method is used is amortised to the profit and loss account. Amortisation begins as soon as an adjustment exists but no later than when the hedged item ceases to be adjusted for changes in its fair value attributable to the risk being hedged.
(b) Cash flow hedges
For cash flow hedges, the effective portion of the gain or loss on the hedging instrument is recognised directly in the other comprehensive income, while the ineffective portion is recognised in the profit and loss account.
Amounts taken to other comprehensive income are transferred to the profit and loss account when the hedged transaction affects profit or loss, such as when hedged financial income or financial expense is recognised or when a forecast sale or purchase occurs. Where the hedged item is the cost of a non-financial asset or liability, the amounts taken to hedging reserve are transferred to the initial carrying amount of the non-financial asset or liability.
If the forecast transaction is no longer expected to occur, amounts previously recognised in hedging reserve are transferred to the profit and loss account. If the hedging instrument expires or is sold, terminated or exercised without replacement or rollover, or if its designation as a hedge is revoked, amounts previously recognised in hedging reserve remain in equity until the forecast transaction occurs. If the related transaction is not expected to occur, the amount is taken to the profit and loss account.

- 31 December 2009
Notes to the Financial Statements
27 CSE Global Ltd Annual Report 2009
2. Significant accounting policies (cont’d)
2.25 Derivative financial instruments and hedging activities (cont’d)
(c) Hedges of a net investment
Hedges of a net investment in a foreign operation, including a hedge of a monetary item that is accounted for as part of the net investment, are accounted for in a way similar to cash flow hedges. Gains or losses on the other comprehensive income under instrument relating to the effective portion of the hedge are recognised directly in the foreign currency translation reserve while any gains or losses relating to the ineffective portion are recognised in the profit and loss account. On disposal of the foreign operation, the cumulative value of any such gains or losses recognised directly in the foreign currency translation reserve is transferred to the profit and loss account.
2.26 Treasury shares
When shares recognised as equity are reacquired, the amount of consideration paid is recognised directly in equity. Reacquired shares are classified as treasury shares and presented as a deduction from total equity. No gain or loss is recognised in the income statement on the purchase, sale, issue or cancellation of treasury shares.
2.27 Contingencies
A contingent liability or asset is a possible obligation or asset that arises from past events and whose existence will be confirmed only by the occurrence or non-occurrence of uncertain future event(s) not wholly within the control of the Group.
Contingent liabilities and assets are not recognised on the balance sheet of the Group.
2.28 Segment reporting
For management purposes, the Group is organised into operating segments based on their products and services which are independently managed by the respective segment managers responsible for the performance of the respective segments under their charge. The segment managers report directly to the management of the Company who regularly review the segment results in order to allocate resources to the segments and to assess the segment performance. Additional disclosures on each of these segments are shown in Note 28, including the factors used to identify the reportable segments and the measurement basis of segment information.

- 31 December 2009
Notes to the Financial Statements
Annual Report 2009 CSE Global Ltd 28
3. Group companies
Details of subsidiary companies of the Company at 31 December are :-
Name of Company(Country of incorporation)
Principal activities(Place of business) Cost
Percentageof equity
held by theGroup
2009 2008 2009 2008$’000 $’000 % %
iii CSE Systems & Engineering (Thailand) Limited (13)
(Thailand)
Sales and provision of computer network systems(Thailand)
758 758 100 100
iii CSE Systems & Engineering (India) Private Limited (6)
(India)
Sales and provision of computer network systems(India)
360 360 100 100
iii Transtel Engineering (Tianjin) Co. Ltd (7)
(China)
Sales and provision of computer network systems(China)
212 212 100 100
iv CSE Systems & Engineering (America), Inc.(America)
Sales and provision of computer network systems(America)
759 759 100 100
i CSE-Myers Pte Ltd (Singapore)
Systems integration solution and sales and provision of computer network systems(Singapore)
– 25,060 100 100
ii CSE-EIS (Malaysia) Sdn Bhd (1)
(Malaysia)
Sales and provision of computer network systems(Malaysia)
1,431 1,431 100 100
i CSE Global (Asia) Limited (formerly known as CSE-Infotech Limited)(Singapore)
e-business integration, research and development and investment holding(Singapore)
8,446 8,446 100 100
v W-Industries, LLC.(America)
Sale and provision of system integration services(America)
36,200 36,200 100 100
ii CSE-Global (UK) Limited(2)
(United Kingdom)Design, manufacture, installation and commissioning of controlof management information systems and development, manufacture and sale of electronic and micro processor monitoring equipment (United Kingdom)
57,300 57,300 100 100

- 31 December 2009
Notes to the Financial Statements
29 CSE Global Ltd Annual Report 2009
3. Group companies (cont’d)
Name of Company(Country ofincorporation)
Principal activities(Place of business) Cost
Percentageof equity
held by theGroup
2009 2008 2009 2008$’000 $’000 % %
iii CSE Technology (Beijing) Co., Ltd (8)
(China)
Sale and provision of computer network systems(China)
2,524 493 100 100
i TransTel EngineeringPte Ltd(Singapore)
Provision of turnkey telecommunications solutions (Singapore)
25,158 25,158 100 100
i CSE-IAP Pte Ltd(Singapore)
Provision of computer systems integration services (Singapore)
5,000 5,000 100 100
i CSE-EIS Pte Ltd(Singapore)
Provision of computer systems integration services (Singapore)
1,500 1,500 100 100
i CSE Semaphore Singapore Pte Ltd (formerly known as RTUnet (Asia) Pte Ltd)(Singapore)
Distribution and marketing of remote terminal units(Singapore)
– * – # – 100
iii CSE-Global (Australia) Pty Ltd (10)
(Australia)
Distribution of electrical engineering equipment and distribution and marketing of remote terminal units(Australia)
16,796 16,796 100 100
iv CSE Environment System Inc (America)
Sales and marketing of air injection technology and energy storage projects(America)
3,356 6,524 100 100
iii CSE-Hankin Inc (15)
(America)Design and install high temperature thermal process and incineration systems(America)
6,631 6,705 100 –
166,431 192,702
* Shareholding has been transferred from CSE Global Limited to CSE Global (Asia) Limited in financial year ended 31 December 2009.
# 2 ordinary shares of S$1 each.

- 31 December 2009
Notes to the Financial Statements
Annual Report 2009 CSE Global Ltd 30
3. Group companies (cont’d)
Details of subsidiary companies held by the Group at 31 December are :-
Name of Company(Country of incorporation)
Principal activities(Place of business)
Percentageof equity
held by theGroup
2009 2009% %
Held by CSE Global (Asia) Limited
i CSE-ITS Pte Ltd(Singapore)
Provision of computer software applications(Singapore)
100 100
iii CSE Semaphore Belgium S.A. (merger of CSE (Global) Belgium and CSE-Semaphore (Belgium)) (12) (Belgium)
Distribution and marketing of remote terminal units and investment holding (Belgium)
100 100
vi CSE Hankin (Singapore) Pte Ltd(Singapore)
Provision of process plant and environmental engineering services(Singapore)
100 –
i CSE Semaphore Singapore Pte Ltd (Singapore)
Distribution and marketing of remote terminalunits (Singapore)
100* –
Held by CSE Semaphore Singapore Pte Ltd
iii CSE SemaphoreAustralia Pty Ltd (10)
(Australia)
Distribution and marketing of remote terminalunits (Australia)
100 ** –
Held by CSE Semaphore Belgium S.A.
iv CSE Semaphore Inc.(America)
Distribution and marketing of remote terminalunits (America)
100 100
Held by CSE-Global (UK) Limited
ii CSE Healthcare Systems Limited (formerly known as CSE-Servelec Limited) (2)
(United Kingdom)
Design, manufacture, installation and commissioning of control and management information systems(United Kingdom)
100 100
ii CSE-Seprol Limited (2)
(United Kingdom)Development, manufacture and sale of electronic and microprocessor monitoring equipment(United Kingdom)
100 100
iii CSE-Controls s.r.o (9)
(Slovakia)Provision of oil and gas pipeline management systems (Slovakia)
100 100
** Shareholdings has been transferred from CSE-Global (Australia) Pty Ltd to CSE Semaphore Singapore Pte Ltd.

- 31 December 2009
Notes to the Financial Statements
31 CSE Global Ltd Annual Report 2009
3. Group companies (cont’d)
Name of Company(Country of incorporation)
Principal activities(Place of business)
Percentageof equity
held by theGroup
2009 2009% %
ii CSE-Controls Limited ( 2)
(United Kingdom)Design, installation and commissioning of control and management information systems(United Kingdom)
100 100
vi CSE-Servelec Limited (formerly known as CSE-Sevelec 2009 Limited)(United Kingdom)
Design, installation and commissioning of control and management information systems(United Kingdom)
100 –
Held by W-Industries, LLC.
v W-Industries of Louisiana, Inc. (America)
Sale and provision of system integration services(America)
100 100
Held by TransTel Engineering Pte Ltd
iv P.T. TransTel Engineering(Indonesia)
Provision of turnkey telecommunications solutions (Indonesia)
100 100
iv TransTel Engineering (Nigeria) Ltd (Nigeria)
Provision of turnkey telecommunications solutions (Nigeria)
80 80
iii Transtel Engineering (Tianjin) Co. Ltd (7)
(China)
Provision of turnkey telecommunications solutions (China)
100 100
ii CSE-Transtel Engineering Europe Ltd (2)
(United Kingdom)
Provision of turnkey telecommunications solutions (United Kingdom)
100 100
ii Transtel Engineering Thailand Ltd (3)
(Thailand)
Provision of turnkey telecommunications solutions (Thailand)
100 100
iv Transtel EngineeringPty Ltd (Australia)
Provision of turnkey telecommunications solutions (Australia)
100 100
iii TransTel Engineering(M) Sdn Bhd (14) (Malaysia)
Provision of turnkey telecommunications solutions (Malaysia)
80 40
vi Transtel Engineering Arabian Limited Co.(Saudi Arabia)
Provision of turnkey telecommunications solutions (Saudi Arabia)
60 –
vi Transtel Engineering PNGLimited (Papua New Guinea)
Provision of turnkey telecommunications solutions (Papua New Guinea)
100 –

- 31 December 2009
Notes to the Financial Statements
Annual Report 2009 CSE Global Ltd 32
3. Group companies (cont’d)
Name of Company(Country ofincorporation)
Principal activities (Place of business)
Percentageof equity
held by theGroup
2009 2009% %
Held by CSE-Global (Australia) Pty Ltd
iii CSE-Uniserve Corporation Pty Ltd (10) (Australia)
Distribution of electrical engineering equipment and investment holding (Australia)
100 100
iii CSE SemaphoreAustralia Pty Ltd (10)
(Australia)
Distribution and marketing of remote terminal units(Australia)
–** 100
iii CSE-Uniserve Pty Ltd (10)
(Australia)Distribution of electrical engineering equipment(Australia)
100 100
iii CSE-Uniserve Engineering Pty Ltd (10) (Australia)
Dormant(Australia)
100 100
iii CSE-W Arthur Fisher Limited(11) (merger of CSE-W Arthur Fisher Limited and W Arthur Fisher Limited) (New Zealand)
Distribution of electrical engineering equipment(New Zealand)
100 100
Held by CSE- W Arthur Fisher Limited
iii W Arthur Fisher Limited (New Zealand) (11)
Manufacture of process control and automation equipment (New Zealand)
– 100

- 31 December 2009
Notes to the Financial Statements
33 CSE Global Ltd Annual Report 2009
3. Group companies (cont’d) Details of associated companies include :-
Name of Company(Country ofincorporation)
Principal activities(Place of business) Cost
Percentageof equity
held by theGroup
2009 2008 2009 2008$’000 $’000 % %
Held by CSE Global (Asia) Limited
iv Infiniteinfo, Inc (America) Dormant(America)
– 551 43 43
ii eBworx Berhad (1) (Malaysia)
Provision of computer software applications and dealing in computer software and hardware for the financial services industry (Malaysia)
168 168 26 26
Held by TransTel Engineering Pte Ltd
iv TransTel Engineering Qatar(Qatar)
Dormant(Qatar)
– 92 49 49
iii TransTel Engineering(M) Sdn Bhd (14) + (Malaysia)
Provision of turnkey telecommunications solutions for the oil and gas and petrolchemical industries(Malaysia)
– 17 – 40
iv TransTel Engineering & Co LLC (Oman)
Dormant (Oman)
– 318 49 49
iv TransTel Engineering Kish Co Ltd (Iran)
Provision of turnkey telecommunications solutions for the oil and gas and petrochemical industries (Iran)
– ^ – ^ 49 49
168 1,146
^ represents capital contribution equivalent to Iranian Rial 490,000 (S$106).
+ On 31 October 2009, the Group’s subsidiary company, TransTel Engineering Pte Ltd, acquired an additional 40% equity interest in TransTel Engineering (M) Sdn Bhd. As a result of this acquisition, TransTel Engineering (M) Sdn Bhd became a subsidiary of TransTel Engineering Pte Ltd. (Note 5).

- 31 December 2009
Notes to the Financial Statements
Annual Report 2009 CSE Global Ltd 34
3. Group companies (cont’d)
Name of Company(Country ofincorporation)
Principal activities (Place of business)
Percentageof equity
held by theGroup
2009 2009% %
Held by eBworx Berhad
ii Digital Nervous System Sdn Bhd (1) (Malaysia)
Provision of computer software applications and dealing in computer software and hardware for the financial services industry(Malaysia)
26 26
i eBworx International Pte Ltd(Singapore)
Provision of computer software applications and dealing in computer software and hardware for the financial services industry(Malaysia)
26 26
iii eBworx Technology (Beijing) Co Ltd (8) (China)
Provision of computer software applications and dealing in computer software and hardware for the financial services industry(China)
26 26
(i) Audited by Ernst & Young LLP, Singapore
(ii) Audited by associated firms of Ernst & Young LLP, Singapore
(1) Audited by Ernst & Young, Kuala Lumpur
(2) Audited by Ernst & Young LLP, Leeds
(3) Audited by Ernst & Young Office Limited, Thailand
(4) Audited by SyCip Gorres Velayo & Co
(iii) Audited by other auditors
(6) Audited by M.V Guruprasad, Chartered Accountants
(7) Audited by Tianjin Jin Xiang, Certified Public Accountants
(8) Audited by Beijing Zhong Shi, Certified Public Accountants
(9) Audited by Tax Audit Consult s.r.o.
(10) Audited by Foster Raffan, Certified Public Accountants
(11) Audited by JSA Audit, Certified Public Accountants
(12) Audited by Delvaux, Fronville, Servais ET Associes
(13) Audited by ANS Audit Co., Ltd, Certified Public Accountants
(14) Audited by RSM Robert Teo, Kuan & Co.
(15) Audited by Flynn, Horlacher & Parker, P.C., Certified Public Accountants
(iv) Not required to be audited under the laws of the country of incorporation
(v) Not required to be audited under the laws of the country of incorporation, but audited by Ernst & Young LLP, Singapore for the purposes of consolidation of the Group.
(vi) Newly incorporated company, no audit is required during the year.
As required by Rule 716 of the Listing Manual of the Singapore Securities Trading Limited, the Audit Committee and the Board of Directors of the Company have satisfied themselves that the appointment of different auditors for its subsidiaries would not compromise the standard and effectiveness of the audit of the Group.

- 31 December 2009
Notes to the Financial Statements
35 CSE Global Ltd Annual Report 2009
4. Fixed assets
GroupFreehold
land
Free-hold
building
Leaseholdimprove-
ments
Plantand
machinery
Toolsand
equip-ment
Officefurniture
and fittings
Computerequipment
Motorvehicles Total
$’000 $’000 $’000 $’000 $’000 $’000 $’000 $’000 $’000
Cost
At 1 January 2008 780 6,197 1,365 1,675 2,377 5,894 3,715 2,786 24,789
Currency realignment (3) (29) (45) (413) (107) (647) (284) (97) (1,625)
Additions 229 215 92 55 568 920 580 285 2,944
Due to acquisition of subsidiaries – – 14 – 111 – 10 18 153
Disposals – – (86) – (3) (389) (424) (225) (1,127)
Write-off – – – – – (6) (36) – (42)
At 31 December 2008 and 1 January 2009 1,006 6,383 1,340 1,317 2,946 5,772 3,561 2,767 25,092
Currency realignment (30) (191) (10) 84 1 356 80 109 399
Additions – 568 663 419 237 342 472 174 2,875
Due to acquisition of subsidiaries – – 30 – 3 10 1 – 44
Disposals – – – – (14) (25) (4) (262) (305)
Write-off – – – – (1) (29) (50) – (80)
At 31 December 2009 976 6,760 2,023 1,820 3,172 6,426 4,060 2,788 28,025
Accumulated depreciation
At 1 January 2008 – 1,215 968 1,349 1,152 3,285 2,513 1,405 11,887
Currency realignment – (1) (23) (351) (52) (428) (143) (24) (1,022)
Charge for the year – 188 190 89 221 885 619 393 2,585
Disposals – – (80) – (3) (330) (408) (164) (985)
Write-off – – – – – (6) (36) – (42)
At 31 December 2008 and 1 January 2009 – 1,402 1,055 1,087 1,318 3,406 2,545 1,610 12,423
Currency realignment – (51) (15) 75 5 193 48 (13) 242
Charge for the year – 258 205 112 456 650 612 410 2,703
Disposals – – – – (5) (27) (2) (215) (249)
Write-off – – – – (1) (29) (50) – (80)
At 31 December 2009 – 1,609 1,245 1,274 1,773 4,193 3,153 1,792 15,039
Net book value
At 31 December 2009 976 5,151 778 546 1,399 2,233 907 996 12,986
At 31 December 2008 1,006 4,981 285 230 1,628 2,366 1,016 1,157 12,669
During the year, the Group acquired fixed assets with an aggregate cost of $Nil (2008: $323,000) by means of finance leases during the financial year. The carrying amount of fixed assets held under finance leases at the end of the financial year was $373,000 (2008: $422,000).

- 31 December 2009
Notes to the Financial Statements
Annual Report 2009 CSE Global Ltd 36
4. Fixed assets (cont’d)
CompanyLeasehold
improvements
Officefurniture
and fittingsComputerequipment
Motorvehicles Total
$’000 $’000 $’000 $’000 $’000
Cost
At 1 January 2008 248 102 307 301 958
Additions 2 3 9 – 14
Disposals – (41) (50) – (91)
Write off – (5) (36) – (41)
At 31 December 2008 and 1 January 2009 250 59 230 301 840
Additions 18 6 5 – 29
Write off – – (10) – (10)
At 31 December 2009 268 65 225 301 859
Accumulated depreciation
At 1 January 2008 209 79 302 146 736
Charge for the year 17 13 8 60 98
Disposals – (39) (50) – (89)
Write off – (5) (36) – (41)
At 31 December 2008 and 1 January 2009 226 48 224 206 704
Charge for the year 17 8 6 61 92
Write off – – (10) – (10)
At 31 December 2009 243 56 220 267 786
Net book value
At 31 December 2009 25 9 5 34 73
At 31 December 2008 24 11 6 95 136

- 31 December 2009
Notes to the Financial Statements
37 CSE Global Ltd Annual Report 2009
5. Subsidiary companies
Company2009 2008
$’000 $’000
Unquoted ordinary shares, at cost (Note 3) 194,659 192,702
Less :
Allowance for impairment losses (25,060) –
Investment written off directly to the profit and loss (3,168) –
Carrying amount of investments 166,431 192,702
Allowance for impairment losses
At 1 January – 8,197
Written off against cost – (8,197)
Provided during the year 25,060 –
At 31 December 25,060 –
Amounts due from subsidiary companies, current :-
Trade 4,393 9,575
Non-trade 1,987 2,630
Short term loans 28,442 33,277
Amounts due from subsidiary companies, current 34,822 45,482
Amounts due from subsidiary companies denominated in foreign currencies included in the Company’s amounts due from subsidiary companies are as follows :-
United States Dollars 18,880 18,333
British Sterling Pounds 2 388
Australia Dollars 1,916 2,397
Euro 64 5,658
Amounts due to subsidiary companies, current :-
Non-trade 2,612 6,277
Short term loans 17,014 47,669
Amounts due to subsidiary companies, current 19,626 53,946
Amounts due to subsidiary companies denominated in foreign currencies included in the Company’s amounts due from subsidiary companies are as follows :-
United States Dollars 9,090 1,486
British Sterling Pounds – 478
Others 3,317 –
The amounts due from/to subsidiary companies are unsecured and are repayable on demand. The short term loans due from subsidiary companies bear interest at 5.0% to 8.5% per annum (2008: 5.0% to 9.2%). The short term loans due to subsidiary companies are interest free.

- 31 December 2009
Notes to the Financial Statements
Annual Report 2009 CSE Global Ltd 38
5. Subsidiary companies (cont’d)
Acquisition in 2009
On 31 October 2009, the Group’s subsidiary company, Transtel Engineering Pte Ltd acquired an additional 40% equity interest in its 40%-owned associated company, Transtel Engineering (M) Sdn Bhd (‘TEM’). The consideration was satisfied through capitalisation of loans previously made to TEM. Upon the acquisition, TEM became a subsidiary of the Company.
From the date of acquisition, TEM has contributed S$66,000 to the net profit of the Group. If the combination had taken place at the beginning of the year, the profit for the Group would decrease by approximately $67,000.
The fair values of the identifiable assets and liabilities of the subsidiary as at the date of acquisition was:
Recognitionon
acquisition
Carryingamountbefore
combination
$’000 $’000
Property, plant and equipment 44 44
Trade and other receivables 210 210
254 254
Trade and other payables (516) (516)
Net identifiable assets acquired (262) (262)
Goodwill 346
Total purchase consideration 84
Cost of acquisition:
Settlement of purchase consideration via capitalisation of amount due from TEM 84
The fair value adjustments at 31 December 2009 were provisional as the allocation of the purchase price to the identifiable assets, liabilities and contingent liabilities acquired in this business combination was still being determined and had not been completed at the date the 2009 accounts were approved for issue by management.

- 31 December 2009
Notes to the Financial Statements
39 CSE Global Ltd Annual Report 2009
5. Subsidiary companies (cont’d)
Acquisitions in 2008
The Group acquired W Arthur Fisher Limited (“WAF”) on 20 August 2008, which is an unlisted company based in New Zealand specialising in the manufacture of process control and automation equipment and offering engineering services to diverse industries. The Group also acquired CSE-Hankin Inc.(“Hankin”) on 2 October 2008, which is an unlisted company based in America specialising in designs and installation of high temperature thermal process and incineration systems.
The fair values of the identifiable assets and liabilities of the subsidiaries as at the respective dates of acquisitions were:
WAF Hankin Total
Recognisedon
acquisition
Carryingamountbefore
combination
Recognisedon
acquisition
Carryingamountbefore
combination
Recognisedon
acquisition
Carryingamountbefore
combination
$’000 $’000 $’000 $’000 $’000 $’000
Property, plant and equipment 129 129 24 24 153 153
Trade and other receivables 1,151 1,151 3,011 3,011 4,162 4,162
Inventories 761 761 – – 761 761
Deferred tax assets 32 32 – – 32 32
Cash and cash equivalents 26 26 2,180 2,180 2,206 2,206
2,099 2,099 5,215 5,215 7,314 7,314
Trade and other payables (767) (767) (394) (394) (1,161) (1,161)
Long term liabilities (51) (51) (6) (6) (57) (57)
Provision for taxation (19) (19) (361) (361) (380) (380)
Work-in-progress – – (3,239) (3,239) (3,239) (3,239)
(837) (837) (4,000) (4,000) (4,837) (4,837)
Net identifiable assets acquired 1,262 1,262 1,215 1,215 2,477 2,477
Goodwill arising on acquisition (Note 8) 973 5,490 6,463
Total purchase consideration 2,235 6,705 8,940

- 31 December 2009
Notes to the Financial Statements
Annual Report 2009 CSE Global Ltd 40
5. Subsidiary companies (cont’d)
Acquisitions in 2008 (cont’d)
The total costs of the acquisitions were approximately $2,235,000 and $6,705,000 for WAF and Hankin respectively and comprised cash settlement.
WAF Hankin Total
Recognisedon
acquisition
Carryingamountbefore
combination
Recognisedon
acquisition
Carryingamountbefore
combination
Recognisedon
acquisition
Carryingamountbefore
combination
$’000 $’000 $’000 $’000 $’000 $’000
Cost of acquisition:
Cost paid 2,235 6,705 8,940
Cash outflow on acquisition:
Cash paid (2,235) (6,705) (8,940)
Net cash acquired with the subsidiary 26 2,180 2,206
Net cash outflow on acquisition (2,209) (4,525) (6,734)
The fair value adjustments at 31 December 2008 were provisional as the allocation of the purchase price to the identifiable assets, liabilities and contingent liabilities acquired in this business combination was still being determined and had not been completed at the date the 2008 accounts were approved for issue by management.
During the finalization of the purchase price allocation, the purchase consideration of Hankin was revised by approximately $74,000 upon refund by the vendor to the Company as a result of a lower net tangible asset position of the acquiree as at 10 October 2008, which was finalised and agreed in April 2009. As such, the goodwill arising on business combination has been adjusted accordingly in the current financial year as disclosed in Note 8 to the financial statements.
Subsequent finalisation of the purchase price allocation for the acquisition of WAF did not indicate any changes to the provisional fair value adjustments. As such, there have been no changes to the fair value adjustments as compared to that of the previous financial year.
6. Associated companies
Group2009 2008
$’000 $’000
Quoted shares, at cost 168 168
Unquoted shares, at cost – 978
168 1,146
Share of net post-acquisition reserves 7,003 6,137
Carrying amount of investments 7,171 7,283
Market value of quoted shares at 31 December 5,991 4,742

- 31 December 2009
Notes to the Financial Statements
41 CSE Global Ltd Annual Report 2009
6. Associated companies (cont’d)
Allowance for impairment losses
Group Company2009 2008 2009 2008
$’000 $’000 $’000 $’000
At 1 January – 566 – –
Write off against cost – (566) – –
At 31 December – – – –
The summarised financial information of the associated companies is as follows:
Group
2009 2008
$’000 $’000
Results
Turnover 12,181 14,043
Net profit for the year 839 1,063
Assets and liabilities
Non-current assets 8,032 8,431
Current assets 20,729 24,895
Total assets 28,761 33,326
Non-current liabilities – (41)
Current liabilities (371) (3,141)
Total liabilities (371) (3,182)
Net assets 28,390 30,144
Amounts due from associated companies :-
Non-trade 145 717
Amounts due to associated companies :-
Non-trade – 77
The amounts due from/to associated companies are unsecured, interest-free and are repayable on demand.
7. Other investment
Group Company2009 2008 2009 2008
$’000 $’000 $’000 $’000
Available-for-sale investment
- Equity instruments (unquoted) at cost 190 190 190 190

- 31 December 2009
Notes to the Financial Statements
Annual Report 2009 CSE Global Ltd 42
8. Intangible assets
Group Goodwill Licenses
Intellectualproperty
rights Total
$’000 $’000 $’000 $’000
Cost
At 1 January 2008 63,570 299 13,793 77,662
Currency realignment (7,606) (39) (276) (7,921)
Additions – – 34 34
Due to acquisition of subsidiaries 6,463 – – 6,463
At 31 December 2008 and 1 January 2009 62,427 260 13,551 76,238
Currency realignment 2,203 6 (100) 2,109
Written off during the year – – (4,769) (4,769)
Due to acquisition of subsidiary 346 – – 346
Adjustment (Note 5) (74) – – (74)
At 31 December 2009 64,902 266 8,682 73,850
Accumulated amortisation and impairment loss
At 1 January 2008 5,834 94 1,277 7,205
Currency realignment (11) (13) (32) (56)
Provided during the year – 29 1,285 1,314
At 31 December 2008 and 1 January 2009 5,823 110 2,530 8,463
Currency realignment (36) 2 (25) (59)
Provided during the year – 29 1,286 1,315
Written off during the year – – (1,015) (1,015)
At 31 December 2009 5,787 141 2,776 8,704
Net carrying value
At 31 December 2009 59,115 125 5,906 65,146
At 31 December 2008 56,604 150 11,021 67,775
Remaining amortisation period (years) – 2009 NA 6 7 to 10 NA
Remaining amortisation period (years) – 2008 NA 7 8 to 11 NA

- 31 December 2009
Notes to the Financial Statements
43 CSE Global Ltd Annual Report 2009
8. Intangible assets (cont’d)
Intellectual property rights
Intellectual property rights mainly relate to the rights and technology relating to the Kingfisher Remote Telemetry Unit (RTU) and the technology relating to the TBOXTM brand of RTU that were acquired in business combinations and related product development costs incurred to further develop the technology.
Company Licenses
$’000
Cost
At 1 January 2009 and 31 December 2009 147
Accumulated amortisation
At1 January 2008 44
Provided during the year 30
At 31 December 2008 74
Provided during the year 29
At 31 December 2009 103
Net carrying value
At 31 December 2009 44
At 31 December 2008 73
Amortisation of licenses and intellectual property are included in the line “other operating costs” in the profit and loss statement.
Impairment testing of goodwill
Goodwill acquired through business combinations has been allocated to the Group’s cash-generating units (CGU) identified according to each individual business unit for impairment testing, as follows :-
Group2009 2008
$’000 $’000
W-Industries, Inc. 15,135 15,600
CSE-Global (UK) Limited 14,470 13,689
CSE-Global (Australia) Pty Ltd 7,816 6,258
CSE-Infotech Limited 1,282 1,282
CSE-Semaphore Belgium 9,252 9,318
CSE-Semaphore Australia 2,864 2,279
TransTel Engineering Pte Ltd 2,752 2,406
CSE-EIS (Malaysia) Sdn Bhd 486 486
CSE-Hankin, Inc 5,058 5,286
59,115 56,604

- 31 December 2009
Notes to the Financial Statements
Annual Report 2009 CSE Global Ltd 44
8. Intangible assets (cont’d)
The recoverable amounts of the CGUs are determined based on value-in-use calculations. The value-in-use calculations use 5-years cash flow projections based on financial budgets approved by management. Management have considered and determined the factors applied in these financial budgets which include budgeted gross margins and average growth rates. The budgeted gross margins are based on past performance and its expectation of market development. Average growth rates of 0% - 20% (2008: 0% - 20%) used are consistent with forecasts based on existing contracts and book orders. The discount rate applied is assumed at 10.4% (2008: 10.4%) for value-in-use calculations, which approximates the industry weighted average cost of capital.
The calculations of value-in-use for the CGUs are most sensitive to the following assumptions:
Budgeted gross margins – Gross margins are based on average values achieved in the year preceding the start of the budget period. These have been forecasted to remain constant over the budget period.
Discount rate – Discount rate used reflect management’s estimate of the risks and the expected returns from the CGUs.
9. Deferred tax assets/liabilities
Group Company2009 2008 2009 2008
$’000 $’000 $’000 $’000
Deferred tax assets 6,645 4,225 181 26
Deferred tax liabilities (3,915) (3,672) – –
2,730 553 181 26
This can be analysed as follows :-
Differences in depreciation and amortisation (3,755) (2,189) (6) (9)
Difference in valuation of intangible asset (1) – (1,285) – –
Provisions 1,182 629 194 30
Unutilised tax losses 4,544 3,069 – –
Unutilised capital allowances 224 237 –
Unremitted foreign sourced interest expense – 30 – –
Profits recognised on percentage of completion 571 690 – –
Development cost capitalised – (458) – –
Other deferred tax assets (36) (170) (7) 5
2,730 553 181 26
(1) Difference in the previous financial year arose mainly as a result of preliminary purchase price allocation relating to the business combination of ESPC. The intellectual property was fully impaired during the current financial year.
Unrecognised tax losses
As at 31 December 2009, the Group has no tax losses (2008 : $Nil) available for offset against future taxable profits of the companies in which the losses arose, for which no deferred tax asset is recognised due to uncertainty of its recoverability. The use of the tax losses is subject to the agreement of the tax authorities and compliance with tax regulations of the respective countries in which the subsidiary companies operate.
At 31 December 2009, no deferred income tax liability has been recognised (2008 : $Nil) for taxes that would be payable on the unremitted earnings of certain of the Group’s subsidiaries and associates, to the extent over which the Group has control over its remittance.
There are no income tax consequences attached to the dividends proposed by CSE Global Limited but not recognised as a liability in the financial statements (Note 34).

- 31 December 2009
Notes to the Financial Statements
45 CSE Global Ltd Annual Report 2009
10. Projects-in-progress, net
Group2009 2008
$’000 $’000
Cost incurred and attributable profits less recognised losses 439,394 402,895
Less: Progress billings (367,429) (333,131)
Amounts due from customers for contract work, net 71,965 69,764
Presented as :
Gross amount due from customers for contract work 89,250 88,720
Gross amount due to customers for contract work (17,285) (18,956)
71,965 69,764
11. Stocks
Group2009 2008
$’000 $’000
Raw materials 5,019 4,058
Stocks work-in-progress 840 122
Finished goods 7,072 7,380
Stocks in transit 1,299 362
Total stocks at lower of cost and net realisable value 14,230 11,922
Stocks are stated after deducting allowance for stock obsolescence 597 566
Allowance for stock obsolescence
Balance at 1 January 566 582
Currency realignment 23 (146)
Allowance during the year 103 186
Allowance utilized during the year (95) (56)
Balance at 31 December 597 566

- 31 December 2009
Notes to the Financial Statements
Annual Report 2009 CSE Global Ltd 46
12. Trade and other debtors
Group Company2009 2008 2009 2008
$’000 $’000 $’000 $’000
Trade debtors 75,531 93,648 2,047 5,684
Other debtors 1,091 786 503 1
Deposits 557 730 28 245
Staff loans and advances 221 254 – 2
Tax recoverable 1,418 1,043 854 680
GST receivables 795 396 – –
Total trade and other debtors 79,613 96,857 3,432 6,612
Add :
Amounts due from subsidiary companies (Note 5) – – 34,822 45,482
Amounts due from associated companies (Note 6) 145 717 – –
Cash and cash equivalents (Note 27) 56,053 42,639 3,891 999
Total loans and receivables 135,811 140,213 42,145 53,093
Trade debtors
Trade debtors are non-interest bearing and are generally on 30 to 120 days’ terms. They are recognised at their original amounts which represent their fair values on initial recognition.
Included in the Group’s trade and other debtors balances at 31 December are the following foreign currency denominated balances as follows:
Group2009 2008
$’000 $’000
United States Dollars 46,890 59,868
British Sterling Pounds 10,734 9,807
Australia Dollars 7,547 9,027
Euro 5,213 4,380
Receivables that are past due but not impaired
The Group has trade debtors amounting to $7,766,000 (2008: $8,025,000) that are past due date at the balance sheet date but not impaired. These receivables are unsecured and the analysis of their aging at the balance sheet date is as follows:
Group2009 2008
$’000 $’000
Trade receivables past due:
Less than 30 days 3,113 4,151
30 to 60 days 1,532 1,455
61 to 90 days 3,097 2,419
91 to 120 days 24 –
7,766 8,025

- 31 December 2009
Notes to the Financial Statements
47 CSE Global Ltd Annual Report 2009
12. Trade and other debtors (cont’d)
Receivables that are impaired
The Group’s trade receivables that are impaired at the balance sheet date and the movement of the allowance account used to record the impairment are as follows:
GroupIndividual impaired2009 2008
$’000 $’000
Trade receivables – nominal amounts 2,823 742
Less: Allowance for impairment (1,273) (742)
1,550 –
Movement in allowance account :
At 1 January 742 716
Currency realignment 11 (78)
Due to acquisition of subsidiaries – 3
Charge for the year 820 101
Written back (62) –
Written off (238) –
At 31 December 1,273 742
Trade receivables that are individually determined to be impaired at the balance sheet date relate to debtors that are in significant financial difficulties and have defaulted on payments. These receivables are not secured by any collateral or credit enhancements.
13. Derivative financial instruments
Group and Company2009 2008
Assets Liabilities Assets Liabilities
$’000 $’000 $’000 $’000
Derivative contracts # (Note 32) – – – 3,905
Derivative contracts * (Note 32) – – – 1,259
– – – 5,164
# These were designated as fair value through profit and loss financial instruments.
* This contract was designated as a hedging instrument for the hedge of a net investment in a foreign subsidiary.
The settlement dates on open forward contracts ranged between 1 to 10 months.

- 31 December 2009
Notes to the Financial Statements
Annual Report 2009 CSE Global Ltd 48
14. Trade creditors and accruals
Group Company2009 2008 2009 2008
$’000 $’000 $’000 $’000
Trade creditors and accruals 61,081 61,603 5,703 5,518
Add :
Amounts due to subsidiaries (Note 5) – – 19,626 53,946
Amounts due to associated companies (Note 6) – 77 – –
Finance leases (Note 29) 532 575 – –
Amounts due to bankers (Note 15) 108,524 128,208 108,524 113,742
Total financial liabilities carried at amortised cost 170,137 190,463 133,853 173,206
Trade creditors and accruals denominated in foreign currencies included in the Group’s trade creditors and accruals at 31 December are as follows:
United States Dollars 22,354 24,209 15,307 644
British Sterling Pounds 11,356 11,253 23 –
Australia Dollars 5,425 6,620 2,379 30
Euro 2,682 4,117 129 256
15. Amounts due to bankers
Group Company2009 2008 2009 2008
$’000 $’000 $’000 $’000
Short term loans, unsecured
- Singapore Dollars 19,950 29,030 19,950 29,030
- British Sterling Pounds 6,567 6,430 6,567 6,430
- United States Dollars 4,912 61,264 4,912 46,798
- Euro – 15,591 – 15,591
- New Zealand Dollars – 415 – 415
Current portion of long term loans, unsecured - Singapore Dollars 1,250 – 1,250 –
- United States Dollars 15,790 4,701 15,790 4,701
Less: Unamortised facility fees (614) – (614) –
47,855 117,431 47,855 102,965
Long term loans, unsecured
- Singapore Dollars 625 – 625 –
- United States Dollars 60,701 10,777 60,701 10,777
Less: Unamortised facility fees (657) – (657) –
60,669 10,777 60,669 10,777
Total amounts due to bankers 108,524 128,208 108,524 113,742
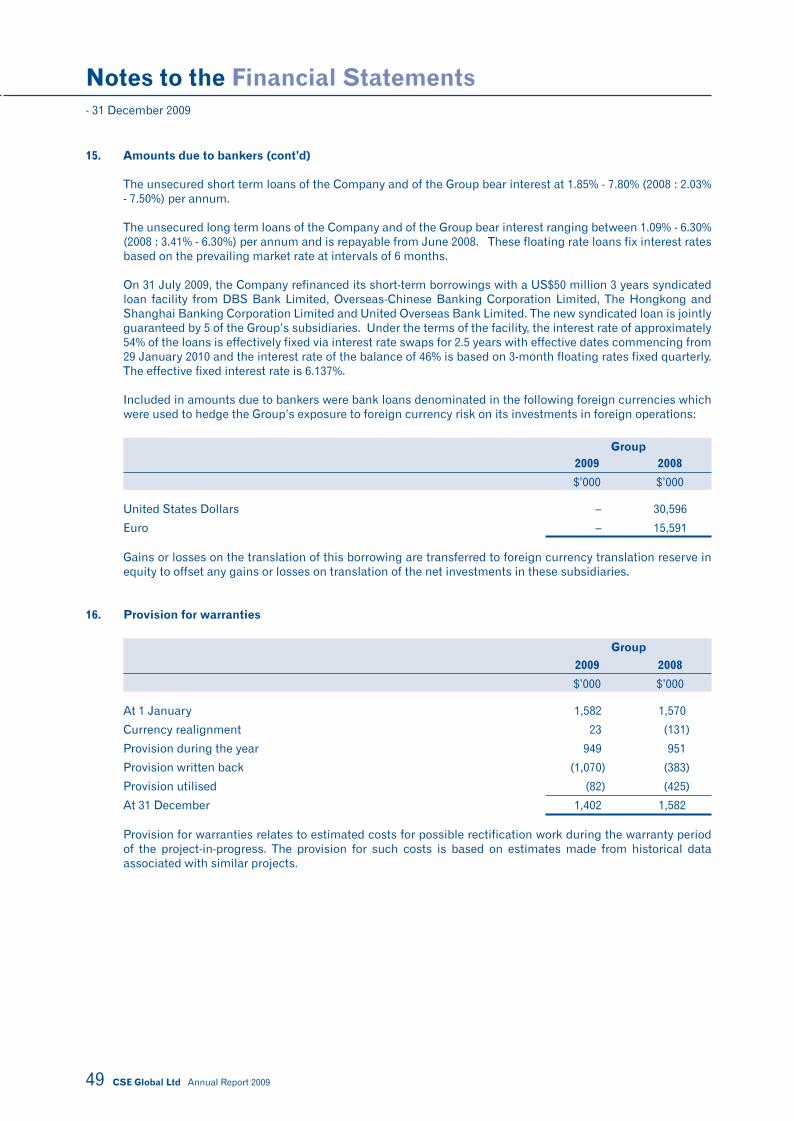
- 31 December 2009
Notes to the Financial Statements
49 CSE Global Ltd Annual Report 2009
15. Amounts due to bankers (cont’d)
The unsecured short term loans of the Company and of the Group bear interest at 1.85% - 7.80% (2008 : 2.03% - 7.50%) per annum.
The unsecured long term loans of the Company and of the Group bear interest ranging between 1.09% - 6.30% (2008 : 3.41% - 6.30%) per annum and is repayable from June 2008. These floating rate loans fix interest rates based on the prevailing market rate at intervals of 6 months.
On 31 July 2009, the Company refinanced its short-term borrowings with a US$50 million 3 years syndicated loan facility from DBS Bank Limited, Overseas-Chinese Banking Corporation Limited, The Hongkong and Shanghai Banking Corporation Limited and United Overseas Bank Limited. The new syndicated loan is jointly guaranteed by 5 of the Group’s subsidiaries. Under the terms of the facility, the interest rate of approximately 54% of the loans is effectively fixed via interest rate swaps for 2.5 years with effective dates commencing from 29 January 2010 and the interest rate of the balance of 46% is based on 3-month floating rates fixed quarterly. The effective fixed interest rate is 6.137%.
Included in amounts due to bankers were bank loans denominated in the following foreign currencies which were used to hedge the Group’s exposure to foreign currency risk on its investments in foreign operations:
Group2009 2008
$’000 $’000
United States Dollars – 30,596
Euro – 15,591
Gains or losses on the translation of this borrowing are transferred to foreign currency translation reserve in equity to offset any gains or losses on translation of the net investments in these subsidiaries.
16. Provision for warranties
Group2009 2008
$’000 $’000
At 1 January 1,582 1,570
Currency realignment 23 (131)
Provision during the year 949 951
Provision written back (1,070) (383)
Provision utilised (82) (425)
At 31 December 1,402 1,582
Provision for warranties relates to estimated costs for possible rectification work during the warranty period of the project-in-progress. The provision for such costs is based on estimates made from historical data associated with similar projects.

- 31 December 2009
Notes to the Financial Statements
Annual Report 2009 CSE Global Ltd 50
17. Share capital and treasury shares
(a) Share capital
Group and Company2009 2008
No ofshares
No ofshares
’000 $’000 ’000 $’000
At 1 January 511,068 92,498 506,773 90,343
Exercise of employee share options – – 4,295 1,521
511,068 92,498 511,068 91,864
Transfer from share-based payment reserve to share capital – – – 634
At 31 December 511,068 92,498 511,068 92,498
As at 31 December 2009, there was no issue of new shares (2008: 4,295,250) in the share capital of the Company arising from the exercise of options to subscribe for 1 ordinary shares (2008: 4,260,000 and 35,250) in the share capital of the Company under the CSE Global Limited Executives’ Share Option Plan and the CSE (U.S. Subsidiaries) Incentive Stock Option Plan respectively, both of which has expired as at 31 December 2008.
The holders of ordinary shares (except treasury shares) are entitled to receive dividends as and when declared by the Company. All ordinary shares carry one vote per share without restriction. The ordinary shares have no par value.
(b) Treasury shares
Group and Company2009 2008
No ofshares
No ofshares
’000 $’000 ’000 $’000
At 1 January 35,022 28,043 – –
Acquired during the financial year – – 35,022 28,043
At 31 December 35,022 28,043 35,022 28,043
Treasury shares relate to ordinary shares of the Company that are held by the Company.
The Company did not acquire any new shares (2008: 35,022,000) in the Company through purchase on the Singapore Exchange during the financial year. The total amount paid to acquire the shares in financial year 2008 was $28,043,000 and this was presented as a component within shareholders’ equity.

- 31 December 2009
Notes to the Financial Statements
51 CSE Global Ltd Annual Report 2009
18. Share-based payment reserve
Group and Company2009 2008
$’000 $’000
At 1 January – 653
Exercise of share options – (634)
Cancellation of share options – (19)
At 31 December – –
Share-based payment reserve represents the equity-settled share options granted to employees. The reserve is made up of the cumulative value of services received from employees recorded over the vesting period commencing from the grant date of equity-settled share options, and is reduced by the expiry or exercise of the share options. All share option schemes have expired as at 31 December 2008.
19. Foreign currency translation reserve
The foreign currency translation reserve represents exchange differences arising from the translation of the financial statements of foreign operations whose functional currencies are different from that of the Group’s presentation currency.
20. Revenue
Revenue mainly represent the revenue recognised on projects-in-progress.
21. Miscellaneous income
Group2009 2008
$’000 $’000
Rental income 413 409
Commission income 53 72
Miscellaneous income 16 245
Gain on disposal of an associated company – 40
Grant income from Job Credit Scheme 753 –
1,235 766
22. Finance income
Group2009 2008
$’000 $’000
Interest income – short-term deposits 360 991

- 31 December 2009
Notes to the Financial Statements
Annual Report 2009 CSE Global Ltd 52
23. Finance costs
Group2009 2008
$’000 $’000
Interest expense – bank loans 5,474 5,338
Bank charges 887 330
6,361 5,668
24. Profit before taxation
Group2009 2008
$’000 $’000
The following items have been included in arriving at profit before taxation :-
Non-audit services paid to: -
Auditors of the Company 3 91
Other auditors of subsidiary companies 149 84
Impairment of investment in associated company 161 –
Depreciation of fixed assets (Note 4) 2,703 2,585
(Gain)/loss on disposal of fixed assets (5) 55
Intangible assets written off 3,754 –
Amortisation of intangible assets (Note 8) 1,315 1,314
Allowance for stock obsolescence, net (Note 11) 8 130
Stock written off directly to profit and loss account 86 –
Allowance for doubtful trade debts, net (Note 12) 758 101
Bad trade debts written off/(back) directly to/(from) the profit and loss 37 (113)
(Write-back of)/provision for warranties, net (Note 16) (121) 568
Personnel and related costs comprising :-
Salaries and bonuses 41,282 48,831
Employees’ provident fund 2,933 2,636
Share-based payment expense written back – (19)
Other personnel and related costs 11,377 14,032
Directors’ fees
- Directors of the Company 223 229
Net exchange loss 3,039 2,343
Fair value changes in value of derivative financial instruments (3,880) 3,905

- 31 December 2009
Notes to the Financial Statements
53 CSE Global Ltd Annual Report 2009
25. Taxation
The major components of income tax expense for the years ended 31 December are :
Group2009 2008
$’000 $’000
Current taxation:
- Singapore 3,578 5,062
- Foreign 13,390 12,570
Deferred taxation:
- Singapore 233 (888)
- Foreign (2,410) (1,216)
14,791 15,528
Withholding tax 645 839
Overprovision for prior years’ taxation – current (89) (523)
Underprovision for prior years’ taxation – deferred – 1,429
Taxation 15,347 17,273
A reconciliation between the tax expense and the product of accounting profit before taxation multiplied by the applicable tax rate for the financial years ended 31 December can be analysed as follows :
Profit before taxation (excluding share of results of associated companies) 58,967 65,252
Taxation at statutory tax rate of 17% (2008: 18%) 10,024 11,745
Adjustments :
Expenses not deductible for tax purposes 509 562
Temporary differences previously not recognised, now recognised – 274
Utilisation of tax losses and capital allowance previously not recognised (94) (279)
Income not subject to taxation (591) (29)
Deferred tax assets not recognised – (116)
Unabsorbed losses transferred under Group relief – (3)
Effect of tax deductions and reliefs (577) (708)
Income subject to lower tax rate (282) (673)
Different effective tax rates of other countries 5,901 4,590
Effect of change in tax rate 20 –
Others (119) 165
14,791 15,528
Share of tax of associated companies – 4
The corporate income tax rate applicable to Singapore companies of the Group was reduced to 17% for the year of assessment 2010 onwards from 18% for year of assessment 2009.

- 31 December 2009
Notes to the Financial Statements
Annual Report 2009 CSE Global Ltd 54
26. Earnings per share
Basic earnings per share
Basic earnings per share amounts are calculated by dividing profit for the financial year that is attributable to ordinary equity holders of the Company by the weighted average number of ordinary shares outstanding during the financial year.
Diluted earnings per share amounts are calculated by dividing profit for the financial year that is attributable to ordinary equity holders of the Company by the weighted average number of ordinary shares outstanding during the financial year plus the weighted average number of ordinary shares that would be issued on the conversion of all the dilutive potential ordinary shares into ordinary shares.
The following tables reflect the profit and loss account and share data used in the computation of basic and diluted earnings per share for the years ended 31 December:
Group2009 2008
$’000 $’000
Profit for the year attributable to ordinary equity holders of the Company used in computation of basic and diluted earnings per share 43,659 48,253
No. of shares2009 2008
’000 ’000
Weighted average number of shares for basic earnings per share computation :- *
Outstanding during the year 476,046 506,773
Issued during the year – 2,430
Purchase of treasury shares – (9,252)
476,046 499,951
* Rounded to the nearest thousand.
Diluted earnings per share
The weighted average number of ordinary shares adjusted for the effect of all dilutive potential ordinary shares is determined as follows :-
No. of shares2009 2008
’000 ’000
Weighted average number of shares outstanding during the year, used in the computation of basic earnings per share 476,046 499,951
Weighted average number of unissued ordinary shares under share options – 2,003
Number of shares that would have been issued at fair value under share options – (814)
Weighted average number of ordinary shares adjusted for the effect of dilution 476,046 501,140

- 31 December 2009
Notes to the Financial Statements
55 CSE Global Ltd Annual Report 2009
27. Cash and cash equivalents
Group Company2009 2008 2009 2008
$’000 $’000 $’000 $’000
Short-term deposits 3,155 3,696 – –
Cash and bank balances 52,898 38,943 3,891 999
56,053 42,639 3,891 999
Cash and cash equivalents denominated in foreign currencies included in the Group’s cash and cash equivalents balance at 31 December are as follows:
Group2009 2008
$’000 $’000
United States Dollars 30,251 22,177
British Sterling Pounds 10,645 6,546
Australia Dollars 3,181 2,986
Euro 4,533 2,880
Included in the Company’s cash and cash equivalents balance at 31 December 2009 is an amount of approximately $3,359,000 (2008: $209,000) denominated in US Dollars.
28. Segment information
For management purposes, the Group is organised as one business unit with a single reportable operating segment. The Group is in the business of systems integration solution and the provision of computer network systems. The provision of these services provides the Group with similar risks and rates of returns. For this reason, the management and the directors are of the opinion that the Group only has one operating segment.
Geographical information
The turnover by geographical segments is based on the location of customers regardless of where the goods are produced.
The following table presents revenue and non-current assets information regarding geographical segments for the year ended 31 December 2009 and 2008 :
Asia-Pacific* AmericaEurope/Middle
East Consolidated2009 2008 2009 2008 2009 2008 2009 2008
$’000 $’000 $’000 $’000 $’000 $’000 $’000 $’000
Sales to external customers 125,380 143,261 138,714 161,291 140,966 136,966 405,060 441,518
Non-current assets 20,140 18,308 28,587 34,018 29,405 28,117 78,132 80,443
* Projects in Asia-Pacific cover countries such as Singapore, China, Hong Kong, Korea, Japan, Thailand, Malaysia, Indonesia, Vietnam and Australia.
Information about a major customer
Revenue from two major customers amount to approximately $50,400,000 (2008: $48,100,000).

- 31 December 2009
Notes to the Financial Statements
Annual Report 2009 CSE Global Ltd 56
29. Commitments
(a) Operating lease commitments – As lessee
As at the balance sheet date, the Group has the following minimum lease payments under non-cancellable operating lease on premises and equipment with initial or remaining term of one year or more :-
Group2009 2008
$’000 $’000
Payable within 1 year 4,710 3,758
Payable later than 1 year but not later than 5 years 14,647 8,255
Payable later than 5 years 9,752 7,084
29,109 19,097
Rental expenses (principally for offices and equipment) 5,968 5,004
The Group leases a number of office premises under operating leases. These leases typically run for an initial tenure of between one to ten years. Certain leases include options to renew the leases after the expiry of the initial tenure. Lease payments under these leases are usually fixed for the entire initial tenure.
The leases generally do not contain any escalation clauses with the exception of one lease which provides for an increase in rental at a fixed rate of 7% over the preceding year’s rent at the commencement of the 4th and 7th year of lease term. There are no restrictions placed upon the Group or the Company by entering into these leases.
(b) Operating lease commitments – As lessor
As at the balance sheet date, the Group and Company have the following minimum lease receivables under non-cancellable operating lease on rental premises located within its leasehold building with a remaining term of one year or more :-
Group2009 2008
$’000 $’000
Receivable within 1 year 228 363
Receivable later than 1 year but not later than 5 years 272 340
500 703
Rental income (Note 21) 413 409

- 31 December 2009
Notes to the Financial Statements
57 CSE Global Ltd Annual Report 2009
29. Commitments (cont’d)
(c) Finance lease commitments
The Group conducts a portion of its operations from leased office equipments and motor vehicles. These leases are classified as finance leases and expire over the next four years.
As at the balance sheet date, the Group has the following future minimum lease payments under finance leases together with the present value of the net minimum lease payments on equipment with initial or remaining term of one year or more :-
GroupTotal
minimum lease
payments
Present value of
payments
Total minimum
lease payments
Present value of
payments2009 2009 2008 2008
$’000 $’000 $’000 $’000
Payable within 1 year 255 218 218 177
Payable later than 1 year but not later than 5 years 348 314 447 398
603 532 665 575
Less: Amounts representing finance charges (71) – (90) –
Present value of minimum lease payments 532 532 575 575
Included in lease creditors of the Group is an amount of approximately $491,000 (2008 : $575,000) denominated in Australian dollars.
The finance leases do not contain any escalation clauses and do not provide for contingent rents. Lease terms do not contain restrictions on the Group’s activities concerning dividends, additional debt or entering into other leases agreements.
30. Key management personnel compensation
Group2009 2008
$’000 $’000
Short-term employee benefits 7,654 6,652
Central Provident Fund contribution 114 201
Directors fees 223 229
7,991 7,082
Comprise amounts paid to:
Directors of the Company 2,608 2,415
Other key management personnel 5,383 4,667
7,991 7,082

- 31 December 2009
Notes to the Financial Statements
Annual Report 2009 CSE Global Ltd 58
31. Financial risk management objectives and policies
The Group’s principal financial instruments, other than derivative financial instruments, comprise bank loans, finance leases, cash and short term deposits. The main purpose of these financial instruments is to finance the Group’s operations. All financial transactions with the banks are governed by banking facilities duly accepted with Board of Directors resolutions with banking mandates which define the permitted financial instruments and facilities limits, approved by the Board of Directors. All financial transactions require dual signatories. The Group has various other financial assets and liabilities such as trade receivables and trade payables, which arise directly from its operations.
Exposure to foreign currency risk, credit risk, interest rate risk and liquidity risk arise in the normal course of the Group’s business. The Group uses pre-dominantly foreign exchange forward contracts and options in connection with its risk management activities to reduce the Group’s exposure to fluctuations in foreign exchange rates. While these are subject to the risk of market rates changing subsequent to the contract date, such changes are generally offset by the opposite effects on the items being hedged. The Group does not hold any foreign exchange forward contracts for trading or speculative purposes.
The Group has established processes to monitor and control hedging transactions in respect of the foreign exchange forward contracts on a timely and effective manner as part of the Group’s risk management procedures. These risk management processes are reviewed by the management on a periodic basis to ensure its effectiveness in managing the Group’s risk in respect of the above.
The Group’s accounting policies in relation to derivative financial instruments are set out in Note 2.25. Details of the foreign exchange forward contracts and options outstanding as at 31 December 2009 are disclosed in Note 32.
Foreign currency risk
The Group has transactional currency exposures arising from sales or purchases that are denominated in a currency other than the respective functional currencies of Group entities, primarily Singapore Dollar (SGD), U.S. Dollar (USD), British Pound (GBP), Euro (EUR), and Australia Dollar (AUD). Approximately 96% (2008: 96%) of the Group’s sales are denominated in functional currencies whilst approximately 77% (2008: 80%) of costs including taxes are denominated in the respective functional currencies of the Group entities. The Group’s trade debtors and trade creditors balances at the balance sheet date have similar exposures with 94% (2008: 94%) and 76% (2008: 77%) denominated in their respective functional currencies respectively.
The Group and the Company also hold cash and cash equivalents denominated in foreign currencies for working capital purposes. At the balance sheet date, such these balances (mainly SGD) amount to $6,140,000 and $3,486,000 for the Group and the Company respectively.
The Group is exposed to currency translation risk as it consolidates revenue, expenses and profit from its foreign subsidiaries, in the United Kingdom (UK), America (US), Australia, Malaysia, Belgium, Thailand, People’s Republic of China, India and Indonesia, at average exchange rates for the year, which approximates the exchange rates on the dates of transactions.
The Group is also exposed to currency translation risk arising from its net investments in foreign operations. To mitigate structural currency exposure arising from the subsidiaries net assets, the Company borrowed and designated bank loans in the subsidiaries’ functional currencies as hedges on its investments in foreign operations. Details of such hedges are disclosed in Note 15 to the financial statements. The Group’s net investment in the rest of the foreign subsidiaries are not hedged as currency positions in GBP, AUD, Malaysia Ringgit, Thai Baht, Indonesia Rupee, India Rupee and Renminbi are considered to be long-term in nature.

- 31 December 2009
Notes to the Financial Statements
59 CSE Global Ltd Annual Report 2009
31. Financial risk management objectives and policies (cont’d)
Foreign currency risk (cont’d)
Sensitivity analysis for foreign currency risk
The following table demonstrates the sensitivity of the Group’s profit net of tax to a 1% (2008 : 1%) change in the USD, GBP, AUD, EUR and SGD exchange rates against the respective functional currencies of the Group entities, with all other variables held constant.
GroupTransactional exposure
2009 2008Profit after
tax EquityProfit after
tax Equity
S$’000 S$’000 S$’000 S$’000
USD/SGD Strengthened (766) – (606) –
Weakened 766 – 606 –
GBP/SGD Strengthened (44) – (61) –
Weakened 44 – 61 –
AUD/SGD Strengthened (1) – (1) –
Weakened 1 – 1 –
EUR/SGD Strengthened 7 – (92) –
Weakened (7) – 92 –
SGD/USD Strengthened (25) – 66 –
Weakened 25 – (66) –
Credit risk
Credit risk is the risk of loss that may arise on outstanding financial instruments should a counterparty default on its obligations. The Group’s exposure to credit risk arises primarily from trade receivables. For other financial assets, the Group minimise credit risk by dealing exclusively with high credit rating counterparties.
In the aspect of credit risk arising from the inability of customers of the Group to make payments when their receivables fall due, it is the Group’s policy to provide credit terms to creditworthy and reputable customers. These receivables are continually monitored on an ongoing basis to ensure that issues arising from non-collectibility are minimised. Therefore, the Group does not expect material credit losses on its debts with customers.
In the aspect of credit risk arising from the Group’s foreign exchange derivative contracts, it is the Group’s policy to enter into foreign exchange derivative contracts with a diversity of creditworthy and reputable financial institutions. Therefore, the Group does not expect material credit losses on its foreign exchange derivative contracts.
Exposure to credit risk
The Group’s maximum exposure to credit risk, in the event that the counter-parties to the transactions with the Group fail to perform their obligations as of balance sheet date in relation to each class of recognised financial assets, is the carrying amount of those assets as indicated in the balance sheet, and is generally limited to the amounts, if any, by which the counter-parties’ obligations exceed the obligations of the Group.
The Group has no significant concentration of credit risk.

- 31 December 2009
Notes to the Financial Statements
Annual Report 2009 CSE Global Ltd 60
31. Financial risk management objectives and policies (cont’d) Credit risk (cont’d)
Credit risk concentration profile
The Group determines concentrations of credit risk by monitoring the geographical segments profile of its trade receivables on an on-going basis. The credit risk concentration profile of the Group’s trade at the balance sheet date is as follows:
Group 2009 2008
$’000 % of total $’000 % of total
By geographical segments:
Asia-Pacific 26,631 35 27,708 30
The Americas 22,742 30 37,579 40
Europe/Middle East/Africa 26,158 35 28,361 30
Total 75,531 100 93,648 100
Financial assets that are neither past due nor impaired
Trade and other receivables that are neither past due nor impaired are creditworthy debtors with good payment record with the Group. Cash and cash equivalents are placed with or entered into with reputable financial institutions or companies with high credit ratings and no history of default.
Financial assets that are either past due or impaired
Information regarding financial assets that are either past due or impaired is disclosed in Note 12.
Interest rate risk
Interest rate risk is the risk that the fair value or future cash flows of the Group’s and the Company’s financial instruments will fluctuate because of changes in market interest rates. The Group’s and the Company’s exposure to interest rate risk arises primarily from their loans and borrowings, interest-bearing loans given to related companies and bank deposits. The Company’s loans at floating rate given to related parties form a natural hedge for its current floating rate bank loan. All the Group’s and Company’s financial assets and liabilities at floating rates are contractually repriced at intervals of less than 6 months (2008: less than 6 months) from the balance sheet date.
The Group’s policy is to manage interest cost using a mix of fixed and floating rate debts. The Group took 38% and 4.2% of its loans and borrowings at fixed rate of interest for financial ended 31 December 2009 and 31 December 2008 respectively. In respect of the syndicated loan discussed in Note 15, the Group also engages in interest rate swaps to reduce the interest rate risk arising from the portion of the syndicated loan subject to floating interest rates.
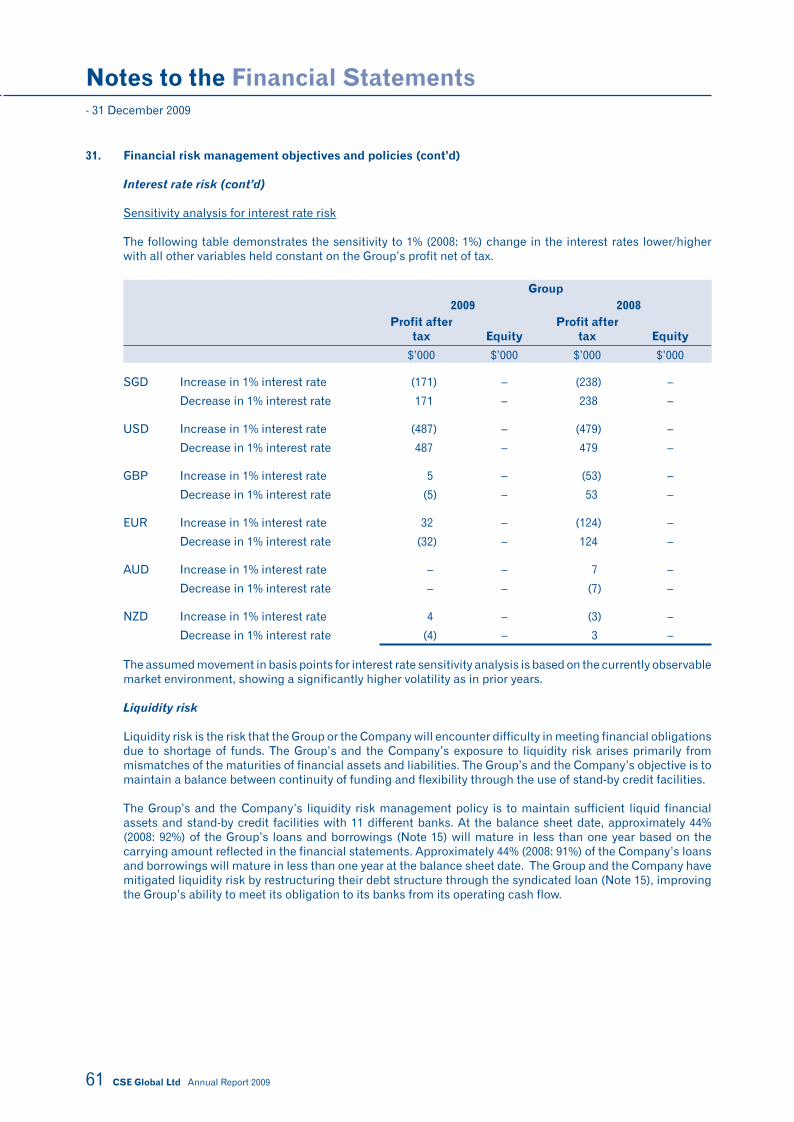
- 31 December 2009
Notes to the Financial Statements
61 CSE Global Ltd Annual Report 2009
31. Financial risk management objectives and policies (cont’d)
Interest rate risk (cont’d)
Sensitivity analysis for interest rate risk
The following table demonstrates the sensitivity to 1% (2008: 1%) change in the interest rates lower/higher with all other variables held constant on the Group’s profit net of tax.
Group2009 2008
Profit after tax Equity
Profit after tax Equity
$’000 $’000 $’000 $’000
SGD Increase in 1% interest rate (171) – (238) –
Decrease in 1% interest rate 171 – 238 –
USD Increase in 1% interest rate (487) – (479) –
Decrease in 1% interest rate 487 – 479 –
GBP Increase in 1% interest rate 5 – (53) –
Decrease in 1% interest rate (5) – 53 –
EUR Increase in 1% interest rate 32 – (124) –
Decrease in 1% interest rate (32) – 124 –
AUD Increase in 1% interest rate – – 7 –
Decrease in 1% interest rate – – (7) –
NZD Increase in 1% interest rate 4 – (3) –
Decrease in 1% interest rate (4) – 3 –
The assumed movement in basis points for interest rate sensitivity analysis is based on the currently observable market environment, showing a significantly higher volatility as in prior years.
Liquidity risk
Liquidity risk is the risk that the Group or the Company will encounter difficulty in meeting financial obligations due to shortage of funds. The Group’s and the Company’s exposure to liquidity risk arises primarily from mismatches of the maturities of financial assets and liabilities. The Group’s and the Company’s objective is to maintain a balance between continuity of funding and flexibility through the use of stand-by credit facilities.
The Group’s and the Company’s liquidity risk management policy is to maintain sufficient liquid financial assets and stand-by credit facilities with 11 different banks. At the balance sheet date, approximately 44% (2008: 92%) of the Group’s loans and borrowings (Note 15) will mature in less than one year based on the carrying amount reflected in the financial statements. Approximately 44% (2008: 91%) of the Company’s loans and borrowings will mature in less than one year at the balance sheet date. The Group and the Company have mitigated liquidity risk by restructuring their debt structure through the syndicated loan (Note 15), improving the Group’s ability to meet its obligation to its banks from its operating cash flow.

- 31 December 2009
Notes to the Financial Statements
Annual Report 2009 CSE Global Ltd 62
31. Financial risk management objectives and policies (cont’d)
Liquidity risk (cont’d)
The table below summarises the maturity profile of the Group’s and the Company’s financial assets and liabilities at the balance sheet date based on contractual undiscounted payments.
Group Company2009 2008 2009 2008
1 yearor less
1 to5 years Total
1 yearor less
1 to5 years Total
1 yearor less
1 to5 years Total
1 yearor less
1 to5 years Total
$’000 $’000 $’000 $’000 $’000 $’000 $’000 $’000 $’000 $’000 $’000 $’000
Trade and other debtors 79,613 – 79,613 96,857 – 96,857 3,432 – 3,432 6,612 – 6,612
Short term deposits 3,155 – 3,155 3,696 – 3,696 – – – – – –
Cash and bank balances 52,898 – 52,898 38,943 – 38,943 3,891 – 3,891 999 – 999
Amounts due from subsidiary – – – – – – 34,822 – 34,822 45,482 – 45,482
Amounts due from associated companies 145 – 145 717 – 717 – – – – – –
135,881 – 135,881 140,213 – 140,213 42,145 – 42,145 53,093 – 53,093
Trade and other payables 61,081 – 61,081 61,603 – 61,603 5,703 – 5,703 5,518 – 5,518
Finance leases 255 348 603 218 447 665 – – – – – –
Loans and borrowings 48,469 61,326 109,795 117,431 10,777 128,208 48,469 61,326 109,795 102,965 10,777 113,742
Amounts due to subsidiary – – – – – – 19,626 – 19,626 53,946 – 53,946
109,805 61,674 171,479 179,252 11,224 190,476 73,798 61,326 135,124 162,429 10,777 173,206
32. Financial instruments Fair value
The fair value of a financial instrument is the amount at which the instrument could be exchanged or settled between knowledgeable and willing parties in an arm’s length transaction, other than in a forced or liquidation sale.
Financial instruments whose carrying amount approximate fair value
Management has determined that the carrying amounts of cash and short term deposits, current trade and other receivables, current trade and other payables and current bank loans, based on their notional amounts, reasonably approximate their fair values because these are mostly short term in nature or are repriced frequently.
Management has determined that the carrying amounts of the non-current portions of the finance leases amounting to $314,000 (2008 : $398,000) approximate their fair values.
Financial instruments carried at cost
Fair value information has not been disclosed for the Group’s investment in equity instrument that is carried at cost (Note 7) because the fair value cannot be measured reliably. This equity instrument represent ordinary shares in an US company that is not quoted on any market and does not have any comparable industry peer that is listed. The Group does not intend to dispose of this investment in the foreseeable future.

- 31 December 2009
Notes to the Financial Statements
63 CSE Global Ltd Annual Report 2009
32. Financial instruments (cont’d)
Fair value (cont’d)
Derivative financial instruments and hedging activities
In financial year 2008, the Group and Company held written options that were accounted for as fair value through profit and loss financial instruments. The terms of these contracts are as follows:
Foreign exchange contractsMaturity
dates
Contract ornotional amounts Fair value adjustments
Assets Liabilities
US$/million $’000 $’000
2008
Option to sell USD and buy SGD 26.6.2009 14 to 28 – 1,193
Option to sell USD and buy SGD 7.10.2009 40 to 80 – 2,712
– 3,905
Option to sell USD and buy SGD # 1.9.2009 18 to 36 – 1,259
– 5,164
# This derivative instrument was designated as hedging instrument to hedge the Group’s foreign currency risk on the net investments in foreign operation.
The above foreign exchange contracts contain various terms and conditions which include escalation clauses on notional amounts and expiration of contract on occurrence of certain stipulated events and conditions agreed between the Group and the financial institutions. The foreign exchange contracts are repriced on a bi-weekly basis.
There were no outstanding foreign currency contracts for the year ended 31 December 2009.
33. Capital management
The primary objective of the Group’s capital management is to ensure that it maintains healthy capital ratios in order to support its business activities and maximise shareholders’ value.
The Group manages its capital structure through an issue of new shares, adjustment of the dividend payout and returning capital to the shareholders. No changes were made in the objectives, policies or processes during the years ended 31 December 2009 and 31 December 2008.
The Group monitors capital using a gearing ratio, which is computed by dividing net debt by total capital and net debt. The Group does not have a target gearing ratio. Net loans and borrowings are defined as amounts due to bankers less cash and cash equivalents.

- 31 December 2009
Notes to the Financial Statements
Annual Report 2009 CSE Global Ltd 64
33. Capital management (cont’d)
The Group and the Company are in compliance with all externally imposed capital requirements for the financial years ended 31 December 2009 and 2008.
Group2009 2008
Amounts due to bankers (Note 15) 108,524 128,208
Finance leases (Note 29) 532 575
Less: Cash and cash equivalents (Note 27) (56,053) (42,639)
Net debt 53,003 86,144
Equity attributable to the equity holders of the parent 136,615 108,248
Capital and net debt 189,618 194,392
Gearing ratio 28% 44%
34. Dividends
Group and Company2009 2008
$’000 $’000
Declared and paid during the financial year:
Dividends on ordinary shares:
- Final exempt (one-tier) dividend for 2007: $0.035 per share – 17,764
- Interim exempt (one-tier) dividend for 2008: $0.01 per share – 5,049
- Final exempt (one-tier) dividend for 2008: $0.03 per share 14,281 –
14,281 22,813
Proposed but not recognised as a liability as at 31 December:
Dividends on ordinary shares, subject to shareholders’ approval at the AGM:
- Final exempt (one-tier) dividend for 2009: $0.035 (2008: $0.03) per share 16,662 14,281
36. Authorisation of financial statements
The financial statements of CSE Global Limited for the financial year ended 31 December 2009 were authorised for issue in accordance with a resolution of the Directors on 16 March 2010.

This page has been intentionally left blank.