DIRECTORS’ REPORT Alloys.pdf · · 2013-08-07DIRECTORS’ REPORT ... The Directors are pleased...
29
S-484 EWAC ALLOYS LIMITED DIRECTORS’ REPORT The Directors have pleasure in presenting their Report and Audited Accounts for the year ended March 31, 2013. 1. FINANCIAL RESULTS 2012-2013 v in Lakhs 2011-2012 v in Lakhs Gross Profit 8,957.25 8,467.24 Less: Depreciation 304.82 285.14 Profit before taxes 8,652.43 8,182.10 Provision for Current taxes (2,715.00) (2,718.00) Add: Deferred Tax Asset for the current year (130.00) 65.09 Leaving a balance available for disposal 5,807.43 5,529.19 Add: Balance b/f from previous year 984.67 690.86 Appropriations Dividend 3,442.18 4,022.78 Tax on Dividend 558.41 652.60 General Reserve 590.00 560.00 Profit & Loss A/c- Balance c/o 2,201.51 984.67 2. YEAR IN RETROSPECT/ PERFORMANCE OF THE COMPANY The sales (inclusive of excise) and other income for the financial year under review are v 40,169 lakhs as against v 36,787 lakhs for the previous financial year. The profit before tax (after interest and depreciation charges) is v 8,652 lakhs and profit after tax is v 5,807 lakhs for the financial year under review as against v 8,182 lakhs and v 5,529 lakhs respectively for the previous year. The Company had closed its entire manufacturing operations at its Powai Works, Mumbai as at the end of the previous year (ending March 31, 2012) and majority of the moveable assets existing at Powai works have now been shifted to Ankleshwar. There was no material impairment of assets required to be made on completion of shifting and re-installation at Ankleshwar. DIVIDEND The Directors have declared and paid during the year three interim dividends aggregating to v 415 per share on 829,440 equity shares of v 100 each. The Directors do not recommend any further dividend for the year. 3. CAPITAL EXPENDITURE As at March 31, 2013 the gross fixed assets stood at v 10,052 Lakhs and the net fixed assets at v 8,050 Lakhs. Additions during the year (net) amounted to v 3,276 Lakhs. 4. AUDITORS’ REPORT The Auditors’ Report to the Shareholders does not contain any qualifications. The notes to the accounts referred to in the Auditors’ Report are self-explanatory and therefore do not call for any further comments of Directors. 5. DISCLOSURE OF PARTICULARS Information as per the Companies (Disclosure of Particulars in the Report of Board of Directors) Rules, 1988 relating to conservation of energy, technology absorption, foreign exchange earnings and outgo are given in Annexure ‘A’ forming part of the report. 6. OTHER DISCLOSURES Information regarding Safety, Health & Environment is given in Annexure ‘B’. 7. COST AUDITORS The Board of Directors at its meeting held on 28 June, 2012 appointed M/s. R. Nanabhoy & Co. Cost Accountant within the meaning of Cost & Works Accountants Act as the Cost Auditor for conducting the Cost Audit for the financial year 2013. 8. PERSONNEL There are no employees covered by the provisions of the Section 217(2A) of the Companies Act, 1956 read with the Companies (Particulars of Employees) Rules, 1975. 9. DIRECTORS RESPONSIBILITY STATEMENT The Board of Directors of the Company confirms: i) that in the preparation of the annual accounts, the applicable Accounting Standards have been followed and there has been no material departure; ii) that the selected Accounting Policies were applied consistently and the directors made judgements and estimates that are reasonable and prudent so as to give a true and fair view of the state of affairs of the Company as at March 31, 2013 and of the profit of the Company for the year ended on that date;
-
Upload
nguyentram -
Category
Documents
-
view
229 -
download
1
Transcript of DIRECTORS’ REPORT Alloys.pdf · · 2013-08-07DIRECTORS’ REPORT ... The Directors are pleased...

S-484
EWAC ALLOYS LIMITED
EWAC ALLOYS LIMITED
DIRECTORS’ REPORT
The Directors have pleasure in presenting their Report and Audited Accounts for the year ended March 31, 2013.
1. FINANCIAL RESULTS
2012-2013 v in Lakhs
2011-2012 v in Lakhs
Gross Profit 8,957.25 8,467.24Less: Depreciation 304.82 285.14
Profit before taxes 8,652.43 8,182.10Provision for Current taxes (2,715.00) (2,718.00)Add: Deferred Tax Asset for the current year (130.00) 65.09
Leaving a balance available for disposal 5,807.43 5,529.19Add: Balance b/f from previous year 984.67 690.86Appropriations Dividend 3,442.18 4,022.78 Tax on Dividend 558.41 652.60 General Reserve 590.00 560.00
Profit & Loss A/c- Balance c/o 2,201.51 984.67
2. YEAR IN RETROSPECT/ PERFORMANCE OF THE COMPANY The sales (inclusive of excise) and other income for the financial year under review are v 40,169 lakhs as against v 36,787 lakhs for the previous
financial year. The profit before tax (after interest and depreciation charges) is v 8,652 lakhs and profit after tax is v 5,807 lakhs for the financial year under review as against v 8,182 lakhs and v 5,529 lakhs respectively for the previous year.
The Company had closed its entire manufacturing operations at its Powai Works, Mumbai as at the end of the previous year (ending March 31, 2012) and majority of the moveable assets existing at Powai works have now been shifted to Ankleshwar. There was no material impairment of assets required to be made on completion of shifting and re-installation at Ankleshwar.
DIVIDEND The Directors have declared and paid during the year three interim dividends aggregating to v 415 per share on 829,440 equity shares of v
100 each. The Directors do not recommend any further dividend for the year.
3. CAPITAL EXPENDITURE As at March 31, 2013 the gross fixed assets stood at v 10,052 Lakhs and the net fixed assets at v 8,050 Lakhs. Additions during the year (net)
amounted to v 3,276 Lakhs.
4. AUDITORS’ REPORT The Auditors’ Report to the Shareholders does not contain any qualifications. The notes to the accounts referred to in the Auditors’ Report are
self-explanatory and therefore do not call for any further comments of Directors.
5. DISCLOSURE OF PARTICULARS Information as per the Companies (Disclosure of Particulars in the Report of Board of Directors) Rules, 1988 relating to conservation of energy,
technology absorption, foreign exchange earnings and outgo are given in Annexure ‘A’ forming part of the report.
6. OTHER DISCLOSURES Information regarding Safety, Health & Environment is given in Annexure ‘B’.
7. COST AUDITORS The Board of Directors at its meeting held on 28 June, 2012 appointed M/s. R. Nanabhoy & Co. Cost Accountant within the meaning of Cost
& Works Accountants Act as the Cost Auditor for conducting the Cost Audit for the financial year 2013.
8. PERSONNEL There are no employees covered by the provisions of the Section 217(2A) of the Companies Act, 1956 read with the Companies (Particulars
of Employees) Rules, 1975.
9. DIRECTORS RESPONSIBILITY STATEMENT The Board of Directors of the Company confirms: i) that in the preparation of the annual accounts, the applicable Accounting Standards have been followed and there has been no material
departure; ii) that the selected Accounting Policies were applied consistently and the directors made judgements and estimates that are reasonable
and prudent so as to give a true and fair view of the state of affairs of the Company as at March 31, 2013 and of the profit of the Company for the year ended on that date;

S-485
EWAC ALLOYS LIMITED
EWAC ALLOYS LIMITED
iii) that proper and sufficient care has been taken for the maintenance of adequate accounting records in accordance with the provisions of the Companies Act, 1956 for safeguarding the assets of the Company and for preventing and detecting fraud and other irregularities;
iv) that the Annual Accounts have been prepared on a going concern basis; and v) that proper systems are in place to ensure compliance of all laws applicable to the Company
10. BOARD OF DIRECTORS The Corporate Governance framework in the Company is based on an effective independent Board, the separation of the Board’s functions
of governance and executive management and the constitution of the Board generally comprising a majority of independent Directors.
In accordance with provisions of Articles of Association of the Company, Mr. V. J. Shukla will retire from the Board by rotation and is eligible for re-appointment.
11. AUDIT COMMITTEE The Audit Committee consists of three non executive directors. The present members of the Committee are Mr. J. P. Nayak, Mr. S. Raghavan
and Mr. V. J. Shukla.
Mr. J. P. Nayak is the Chairman of the Audit Committee
The role, terms of reference, the authority and power of Chairman are in conformity with the requirements of the Companies Act, 1956.
The Committee met periodically during the year and had discussions with the auditors on internal control systems and internal audit report.
12. AUDITORS The Auditors, M/s. Sharp & Tannan, hold office until the conclusion of the ensuing Annual General Meeting and are recommended for re-
appointment. Certificate from the auditors has been received to the effect that their re-appointment, if made, would be within the limits prescribed under Section 224(1B) of the Companies Act, 1956.
13. COMPLIANCE WITH VOLUNTARY CORPORATE GOVERNANCE GUIDELINES, 2009 The Company has familiarized itself with the requirement of the Corporate Governance Voluntary Guidelines 2009 issued by the Ministry of
Corporate Affairs and it is in the process of implementing many of the suggestions. Our compliance with the said guidelines is given below –
A. SEPARATION OF OFFICES OF CHAIRMAN & CHIEF EXECUTIVE The roles and offices of Chairman and Chief Executive are separated. Mr. J. P. Nayak chairs the meetings of the Board and Shareholders
and Mr. A. Shivkumar is the Chief Executive and Manager of the Company under Companies Act, 1956.
B. INDEPENDENT DIRECTORS All the members of the Board of the Company are independent in the sense that none of them are involved in the day-to-day management
of the Company. Directors are updated about their role, responsibilities and liabilities.
C. NUMBER OF COMPANIES IN WHICH AN INDIVIDUAL MAY BECOME A DIRECTOR The Directors of the Company comply with the requirements of the maximum number of other directorships prescribed under the
Guidelines.
D. STATUTORY AUDITORS The Company has obtained a certificate from the auditors certifying its independence.
E. INTERNAL AUDITORS The Corporate Audit Services department of Larsen & Toubro Limited provides internal audit services to all its group companies including
the Company.
F. INTERNAL CONTROL The Board ensures the effectiveness of the Company’s system of internal controls.
G. SECRETARIAL AUDIT The Corporate Secretarial department of Larsen & Toubro Limited provides secretarial services to many of its group companies including
the Company.
14. ACKNOWLEDGEMENTS The Board of Directors thanks 1) Bankers 2) Vendors 3) Suppliers 4) Customers for their continued co-operation and support to the Company. The Directors are pleased to place on record their appreciation for the valuable
contribution made by the employees of the Company.
For and on behalf of the Board
J. P. NAYAK V. J. SHUKLA Director Director
Place: MumbaiDate: April 19, 2013

S-486
EWAC ALLOYS LIMITED
EWAC ALLOYS LIMITED
ANNNEXURE ‘A’
THE COMPANIES (DISCLOSURE OF PARTICULARS IN THE REPORT OF BOARD OF DIRECTORS) RULES, 1988 AND FORMING PART OF DIRECTORS’ REPORT FOR THE YEAR ENDED MARCH 31, 2013
A. CONSERVATION OF ENERGY a) Energy conservation measures taken • Programmable timers to put off Cooling Fans for Electrode baking oven after completion of baking cycle.
• Timers for putting off Water Coolers after working hours.
• On line Data logger for on line monitoring of oven baking cycles leading to energy control.
• Installation of TFT screen for office computers leading to energy conservation.
• Administrative Control on Continual basis.
• Replacement of Tube lights with PL/CFL lamps on continual basis.
• Modification of oven panels for precise control of Heater energy.
• Installation of cooling fan for Melting Furnace Panel for effective utilization of Thyristorised control circuitry.
• Remote on/off control for ease of Air Compressor operation towards energy Saving.
• T-5, energy saving tube light fitting for offices area.
• Modification of conveyor shrink packing machine of packing line-II to reduce heat loss and energy saving.
• Inverter type welding power sources for wear plate manufacturing.
• Astronomical timer for street lighting.
• Modification of vacuum dryer (Thermic fluid) insulation to avoid Heat loss.
b) Impact of the measure at (a) above for reduction of energy consumption and consequent impact on the cost of production of Goods
• The measures taken have resulted in energy conservation with consequent reduction in cost.
c) Total consumption and energy consumption per unit of production as per Form A in respect of industries specified in the schedule hereto
• Not Applicable
B. TECHNOLOGY ABSORPTION a) Efforts made in technology absorption as per Form B.
Details are furnished in Form B attached.
b) Foreign exchange earnings and outgo.
• Activities relating to exports initiatives taken to increase exports, development of new export market for products and services.
c) Total foreign exchange used and earned in 2012-13
v Lakhs
Used 6,295
Earned 431
ANNEXURE ‘B’INFORMATION REGARDING THE SAFETY HEALTH & ENVIRONMENT:a) Installation of tertiary level Effluent Treatment & Sewage Treatment Plant based on latest MBBR technology.
b) Conservation of natural resource - water by reusing it in the factory after treatment.
c) Installation & Commissioning of Fume Extraction with air pollution control devices.
d) Installation & commissioning of Fire Protection & Firefighting system.
e) Installation & commissioning of Air ventilation system for improving the workplace Environment.
f) Safety Performance
Criteria Ankleshwar Works
No. of Reportable Accidents 0
Accident frequency Rate 0
Severity Rate 0
Accident Free period 01.04.2012 to 31.03.2013
S-487
EWAC ALLOYS LIMITED
EWAC ALLOYS LIMITED
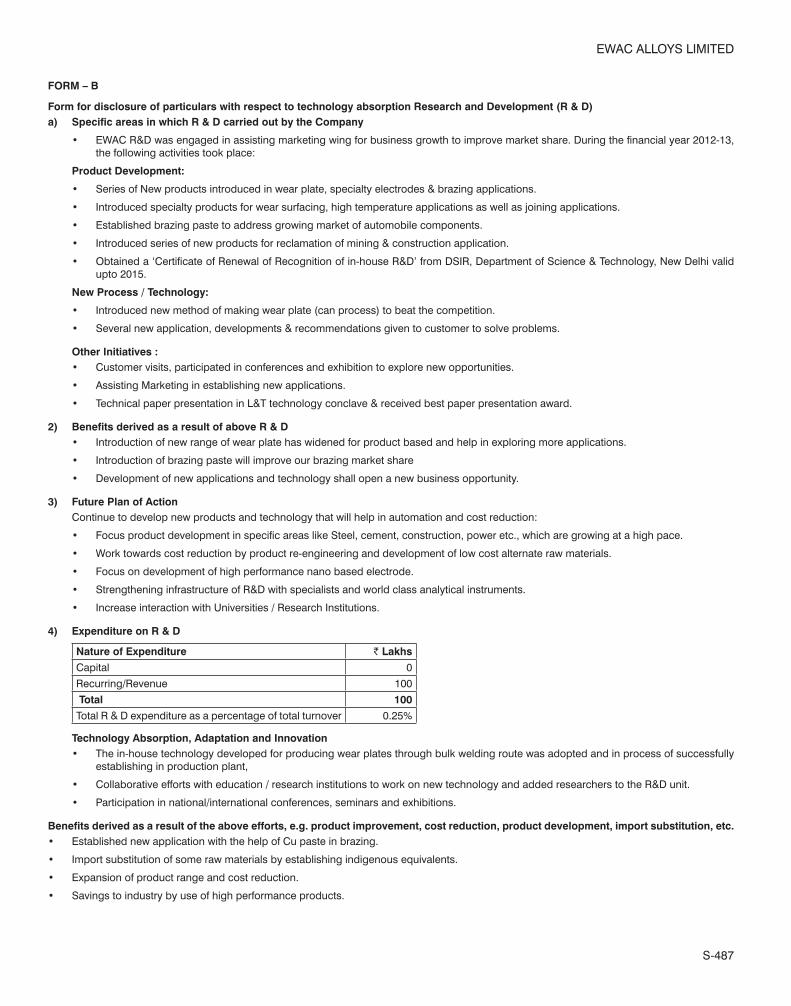
FORM – B
Form for disclosure of particulars with respect to technology absorption Research and Development (R & D)a) Specific areas in which R & D carried out by the Company
• EWAC R&D was engaged in assisting marketing wing for business growth to improve market share. During the financial year 2012-13, the following activities took place:
Product Development:
• Series of New products introduced in wear plate, specialty electrodes & brazing applications.
• Introduced specialty products for wear surfacing, high temperature applications as well as joining applications.
• Established brazing paste to address growing market of automobile components.
• Introduced series of new products for reclamation of mining & construction application.
• Obtained a ‘Certificate of Renewal of Recognition of in-house R&D’ from DSIR, Department of Science & Technology, New Delhi valid upto 2015.
New Process / Technology:
• Introduced new method of making wear plate (can process) to beat the competition.
• Several new application, developments & recommendations given to customer to solve problems.
Other Initiatives : • Customer visits, participated in conferences and exhibition to explore new opportunities.
• Assisting Marketing in establishing new applications.
• Technical paper presentation in L&T technology conclave & received best paper presentation award.
2) Benefits derived as a result of above R & D • Introduction of new range of wear plate has widened for product based and help in exploring more applications.
• Introduction of brazing paste will improve our brazing market share
• Development of new applications and technology shall open a new business opportunity.
3) Future Plan of Action Continue to develop new products and technology that will help in automation and cost reduction:
• Focus product development in specific areas like Steel, cement, construction, power etc., which are growing at a high pace.
• Work towards cost reduction by product re-engineering and development of low cost alternate raw materials.
• Focus on development of high performance nano based electrode.
• Strengthening infrastructure of R&D with specialists and world class analytical instruments.
• Increase interaction with Universities / Research Institutions.
4) Expenditure on R & D
Nature of Expenditure v Lakhs
Capital 0
Recurring/Revenue 100
Total 100
Total R & D expenditure as a percentage of total turnover 0.25%
Technology Absorption, Adaptation and Innovation • The in-house technology developed for producing wear plates through bulk welding route was adopted and in process of successfully
establishing in production plant,
• Collaborative efforts with education / research institutions to work on new technology and added researchers to the R&D unit.
• Participation in national/international conferences, seminars and exhibitions.
Benefits derived as a result of the above efforts, e.g. product improvement, cost reduction, product development, import substitution, etc.• Established new application with the help of Cu paste in brazing.
• Import substitution of some raw materials by establishing indigenous equivalents.
• Expansion of product range and cost reduction.
• Savings to industry by use of high performance products.

S-488
EWAC ALLOYS LIMITED
EWAC ALLOYS LIMITED
INDEPENDENT AUDITORS’ REPORT
TO THE MEMBERS OF EWAC ALLOYS LIMITED
Report on the Financial StatementsWe have audited the accompanying financial statements of EWAC ALLOYS LIMITED (the ‘Company’), which comprise the Balance Sheet as at March 31, 2013, the Statement of Profit and Loss and the Cash Flow Statement for the year then ended, and a summary of significant accounting policies and other explanatory information.
Management’s Responsibility for the Financial StatementsManagement is responsible for the preparation of these financial statements that give a true and fair view of the financial position, financial performance and cash flows of the Company in accordance with the accounting standards referred to in Section 211(3C) of the Companies Act, 1956. This responsibility includes the design, implementation and maintenance of internal control relevant to the preparation and presentation of the financial statements that give a true and fair view and are free from material misstatement, whether due to fraud or error.
Auditor’s ResponsibilityOur responsibility is to express an opinion on these financial statements based on our audit. We conducted our audit in accordance with the Standards on Auditing issued by the Institute of Chartered Accountants of India. Those Standards require that we comply with ethical requirements and plan and perform the audit to obtain reasonable assurance about whether the financial statements are free from material misstatement.
An audit involves performing procedures to obtain audit evidence about the amounts and disclosures in the financial statements. The procedures selected depend on the auditor’s judgment, including the assessment of the risks of material misstatement of the financial statements, whether due to fraud or error. In making those risk assessments, the auditor considers internal control relevant to the Company’s preparation and fair presentation of the financial statements in order to design audit procedures that are appropriate in the circumstances. An audit also includes evaluating the appropriateness of accounting policies used and the reasonableness of the accounting estimates made by management, as well as evaluating the overall presentation of the financial statements.
We believe that the audit evidence we have obtained is sufficient and appropriate to provide a basis for our audit opinion.
OpinionIn our opinion and to the best of our information and according to the explanations given to us, the financial statements give the information required by the Companies Act, 1956, in the manner so required and give a true and fair view in conformity with the accounting principles generally accepted in India:
(a) in the case of the Balance Sheet, of the state of affairs of the Company as at 31st March, 2013;
(b) in the case of the Statement of Profit and Loss, of the profit for the year ended on that date; and
(c) in the case of the Cash Flow Statement, of the cash flows for the year ended on that date.
Report on Other Legal and Regulatory Requirements
1. As required by the Companies (Auditor’s Report) Order, 2003 and amended by the Companies (Auditor’s Report) (Amendment) Order, 2004 (together the ‘Order’) issued by the Central Government of India in terms of Section 227(4A) of the Companies Act, 1956, we give in the Annexure, a statement on the matters specified in paragraphs 4 and 5 of the Order.
2. As required by Section 227(3) of the Companies Act, 1956, we report that:
(a) we have obtained all information and explanations, which to the best of our knowledge and belief were necessary for the purposes of our audit;
(b) in our opinion, proper books of account as required by law have been kept by the Company, so far as appears from our examination of those books;
(c) the Balance Sheet, the Statement of Profit and Loss and the Cash Flow Statement dealt with by this report are in agreement with the books of account;
(d) in our opinion, the Statement of Profit and Loss, the Balance Sheet and the Cash Flow Statement comply with the accounting standards referred to in Section 211(3C) of the Companies Act, 1956; and
(e) on the basis of the written representations received from directors of the Company as on March 31, 2013, and taken on record by the Board of Directors, we report that none of the directors is disqualified as on March 31, 2013, from being appointed as a director in terms of Section 274(1)(g) of the Companies Act, 1956.
SHARP & TANNANChartered Accountants
Registration No.109982Wby the hand of
MILIND P. PHADKEPartner
Membership No. 033013Place : MumbaiDate : April 19, 2013

S-489
EWAC ALLOYS LIMITED
EWAC ALLOYS LIMITED
ANNEXURE TO THE INDEPENDENT AUDITOR’S REPORT(Referred to in paragraph 1 of our report of even date)
(i) (a) The Company is maintaining proper records showing full particulars, including quantitative details and situation of fixed assets.
(b) As explained to us, these fixed assets have been physically verified by the management, in accordance with a phased programme of verification, which in our opinion, is reasonable, having regard to the size of the Company and nature of its assets. The frequency of physical verification is reasonable and no material discrepancies were noticed on such verification.
(c) The Company has not disposed of any substantial part of its fixed assets during the year so as to affect its going concern status.
(ii) (a) As explained to us, inventories have been physically verified by management at reasonable intervals during the year. In our opinion, the frequency of such verification is reasonable.
(b) As per the information given to us, the procedures of physical verification of inventory followed by management are, in our opinion, reasonable and adequate in relation to the size of the Company and the nature of its business.
(c) The Company is maintaining proper records of inventory. No material discrepancies were noticed on physical verification.
(iii) According to the information and explanations given to us, the Company has neither granted nor taken any loans, secured or unsecured to companies, firms or other parties covered in the register maintained under Section 301 of the Companies Act, 1956. Accordingly, the Paragraph 4(iii)(b), (c), (d), (f) and (g) of the Order are not applicable.
(iv) In our opinion and according to the information and explanations given to us, there is an adequate internal control system commensurate with the size of the Company and the nature of its business, for the purchase of inventory and fixed assets and for the sale of goods and services. Further, we have neither come across nor have been informed of any continuing failure to correct major weaknesses in internal control system.
(v) (a) According to the information and explanations given to us, we are of the opinion that the particulars of contracts or arrangements that need to be entered in to the register maintained under Section 301 of Companies Act 1956 have been so entered.
(b) In our opinion and according to the information and explanations given to us, the transactions made in pursuance of such contracts or arrangements entered in the register maintained under Section 301 of the Companies Act, 1956 and exceeding the value of rupees five lakhs in respect of any party during the year, have been made at prices which are reasonable having regard to the prevailing market prices at the relevant time.
(vi) The Company has not accepted any deposits during the year from the public to which the directives issued by the Reserve Bank of India and the provisions of Section 58A, 58AA and any other relevant provisions of the Companies Act, 1956 and the rules framed thereunder apply.
(vii) In our opinion, the Company has an internal audit system commensurate with its size and the nature of its business.
(viii) We have broadly reviewed the books of account maintained by the Company pursuant to the rules prescribed by the Central Government for the maintenance of cost records under Section 209(1)(d) of the Companies Act, 1956 in respect of manufacture of welding consumables and are of the opinion that prima facie, the prescribed accounts and records have been made and maintained. However, we have not made a detailed examination of the records.
(ix) (a) According to the information and explanations given to us, the Company is regular in depositing undisputed statutory dues including provident fund, investor education and protection fund, employees’ state insurance, income tax, sales tax, wealth tax, service tax, custom duty, excise duty, cess and any other statutory dues with the appropriate authorities. According to the information and explanations given to us, there are no arrears of outstanding statutory dues as at the last day of the financial year for a period of more than six months from the date they became payable.
(b) According to the information and explanations given to us and the records of the Company examined by us, the particulars of sales tax and excise duty as at March 31, 2013 which have not been deposited on account of a dispute pending, are as under:
Name of the Statute Nature of the disputed dues v* Period to which the amount relates
Forum where disputes are pending
The Central Sales Tax Act and Local Sales Tax Acts.
Disallowances of high sea sales and other related matters.
10,849,497 2002-03 to 2004-05
Joint Commissioner of Sales Tax (Appeals)-II
Disallowances CST sales, Non-submission of C Forms
107,875 2002-03 Joint Commissioner of Sales Tax (Appeals)-II
Disallowance of Form - N - 14B sale by Appellate authority which was earlier allowed by assessing authority.
1,083,330 2001-02 Sales Tax Tribunal
The Central Excise Act, 1944
Demand for duty on sales through interconnected units.
683,214,268 2006-07 to 2010-11
CESTAT
(*net of pre-deposit paid in getting the stay/ appeal admitted)
(x) The Company has no accumulated losses as at March 31, 2013 and it has not incurred cash losses in the financial year and in the immediately preceding financial year.
(xi) According to the information and explanations given to us and as per the records of the Company examined by us, the Company has not defaulted in repayment of dues to banks. The Company did not have any outstanding dues to any financial institutions. The Company has not issued any debentures. Accordingly, the Paragraph 4(xi) of the Order is not applicable.

S-490
EWAC ALLOYS LIMITED
EWAC ALLOYS LIMITED
(xii) According to the information and explanations given to us, the Company has not granted loans and advances on the basis of security by way of pledge of shares, debentures and other securities. Accordingly, the Paragraph 4(xii) of the Order is not applicable.
(xiii) The provisions of any special statute applicable to chit fund / nidhi / mutual benefit fund / societies are not applicable to the Company.
(xiv) In our opinion and according to the information and explanations given to us, the Company is not dealing or trading in shares, securities, debentures and other investments. The Company has invested surplus funds in mutual funds. According to the information and explanations given to us, proper records have been maintained of the transactions and contracts and timely entries have been made therein. The investments in mutual funds have been held by the Company in its own name.
(xv) According to the information and explanations given to us, the Company has not given any guarantee for loans taken by others from banks or financial institutions. Accordingly, the Paragraph 4(xv) of the Order is not applicable.
(xvi) In our opinion and according to the information and explanations given to us and on an overall basis the term loan have been applied for the purpose for which it was obtained.
(xvii) According to the information and explanations given to us and on an overall examination of the Balance Sheet of the Company, we report that no funds raised on short-term basis have been used for long-term investment.
(xviii) The Company has not made any preferential allotment of shares to parties and companies covered in the register maintained under Section 301 of the Companies Act, 1956 during the year. Accordingly, the Paragraph 4(xviii) of the Order is not applicable.
(xix) According to the information and explanations given to us, the Company has not issued any debentures during the year. Accordingly, the Paragraph 4(xix) of the Order is not applicable.
(xx) The Company has not raised any money by public issues during the year. Accordingly, the Paragraph 4(xx) of the Order is not applicable.
(xxi) During the course of our examination of the books and records of the Company, carried out in accordance with generally accepted auditing practices in India and according to the information and explanations given to us, we have neither come across any fraud on or by the Company noticed or reported during the year, nor have we been informed of such case by management.
SHARP & TANNANChartered Accountants
Registration No.109982Wby the hand of
MILIND P. PHADKEPartner
Membership No. 033013Place : MumbaiDate : April 19, 2013

S-491
EWAC ALLOYS LIMITED
EWAC ALLOYS LIMITED
BALANCE SHEET AS AT MARCH 31, 2013As at 31.03.2013 As at 31.03.2012
Note No. v v v v
EQUITY AND LIABILITIESShareholders’ funds Share capital A 82,944,000 82,944,000 Reserves and surplus B 669,985,612 489,300,829
752,929,612 572,244,829 Non-current liabilities Long-term borrowings C (1) 320,000,000 80,000,000 Deferred tax liabilities (net) C (2) 29,875,697 16,876,067 Long-term provisions C (3) 12,352,877 8,382,605
362,228,574 105,258,672 Current liabilities Short-term borrowings D (1) 115,000,000 - Current maturities of long-term borrowings D (2) - 80,000,000 Trade payables D (3) 537,554,554 587,180,903 Other current liabilities D (4) 41,207,911 237,407,711 Short-term provisions D (5) 94,666,005 383,042,577
788,428,470 1,287,631,191
TOTAL 1,903,586,656 1,965,134,692
ASSETSNon-current assetsFixed assets Tangible assets E (1) 749,868,756 169,408,978 Intangible assets E (2) 5,159,131 - Capital work-in-progress E (3) 49,984,700 332,330,430 Intangible assets under development E (4) - 4,428,300 Asset held for sale - 350,000 Long-term loans and advances F (1) 41,555,394 71,412,303 Other non-current assets F (2) 15,401,361 7,177,331
861,969,342 585,107,342 Current assets Current investments G (1) - 81,964,744 Inventories G (2) 469,310,559 616,195,043 Trade receivables G (3) 430,407,398 533,213,640 Cash and bank balances G (4) 83,567,439 93,667,697 Short-term loans and advances G (5) 58,331,918 54,986,226
1,041,617,314 1,380,027,350
TOTAL 1,903,586,656 1,965,134,692
COMMITMENTS (Capital and others) HCONTINGENT LIABILITIES ISIGNIFICANT ACCOUNTING POLICIES O
The accompanying notes are an integral part of the financial statements.
As per our report attached
SHARP & TANNANChartered AccountantsRegistration No. 109982WBy the hand of
For and on behalf of the Board of Directors
MILIND P. PHADKEPartnerMembership No. 033013
A. SHIVKUMAR SUBHODH SHETTY J. P. NAYAK V. J. SHUKLAChief Executive Company Secretary Director Director
Place: MumbaiDate : April 19, 2013
Place: MumbaiDate : April 19, 2013

S-492
EWAC ALLOYS LIMITED
EWAC ALLOYS LIMITED
STATEMENT OF PROFIT AND LOSS FOR THE YEAR ENDED MARCH 31, 2013
2012-2013 2011-2012 Note No. v v v v
REVENUE
Revenue from operations (gross) J 4,001,840,579 3,669,927,982
Less: Excise duty 156,583,823 157,791,147
Revenue from operations (net) 3,845,256,756 3,512,136,835
Other income K 15,027,435 8,758,890
TOTAL 3,860,284,191 3,520,895,725
EXPENSES
Manufacturing and operating expenses
Cost of materials consumed L (1) 489,764,273 869,184,754
Purchases of stock-in-trade L (2) 1,152,589,713 1,393,368,689
Store, spares and tools L (3) 15,812,659 18,657,173
Sub-contracting charges L (4) 454,504,271 219,716,007
Changes in inventories of finished goods, work-in-progress and stock-in-trade
L (5) 155,027,163 (349,786,647)
Other manufacturing and operating expenses L (6) 46,589,966 35,875,848
Employee benefits expense M 294,274,172 264,745,000
Sales, administration and other expenses N 330,875,596 220,925,843
Finance costs 25,121,405 1,485,116
Depreciation, obsolescence and amortisation expense E (1) 30,482,260 28,513,746
TOTAL 2,995,041,478 2,702,685,529
Profit before tax 865,242,713 818,210,196
Tax expense:
Current tax 271,500,000 271,800,000
Deferred tax P (15) 12,999,630 (6,508,678)
284,499,630 265,291,322
Profit after tax 580,743,083 552,918,874
Earnings Per Share - (Basic and Diluted) P (12) 700.16 666.62
Face value per equity share (v) 100.00 100.00
SIGNIFICANT ACCOUNTING POLICIES O
The accompanying notes are an integral part of the financial statements.
As per our report attached
SHARP & TANNANChartered AccountantsRegistration No. 109982WBy the hand of
For and on behalf of the Board of Directors
MILIND P. PHADKEPartnerMembership No. 033013
A. SHIVKUMAR SUBHODH SHETTY J. P. NAYAK V. J. SHUKLAChief Executive Company Secretary Director Director
Place: MumbaiDate : April 19, 2013
Place: MumbaiDate : April 19, 2013

S-493
EWAC ALLOYS LIMITED
EWAC ALLOYS LIMITED
CASH FLOW STATEMENT FOR THE YEAR ENDED MARCH 31, 2013 2012-2013
v 2011-2012
v
A. Cash flows from operating activitiesNet profit before tax 865,242,713 818,210,196 Adjustments for:Depreciation, obsolescence and amortisation 30,482,260 28,513,746 Interest income (364,404) (339,222)Income from investments (3,576,084) (6,533,840)Provisions for compensated absences/leave encashment 1,399,007 9,237,222 Provisions for long service award – (1,115,071)Interest paid 25,121,405 1,485,116 Profit/loss on sale of fixed assets (net) (1,392,576) (1,105,378)
Operating profit before working capital changes 916,912,321 848,352,769 Adjustments for:(Increase)/decrease in trade and other receivables 125,381,352 (309,852,639)(Increase)/decrease in inventories 146,884,484 (362,101,109)Increase/(decrease) in provisions (188,950,352) 73,584,279 Increase/(decrease) in trade payables (49,626,349) 500,580,012
Cash generated from operations 950,601,456 750,563,312 Direct taxes paid (275,787,923) (277,161,277)
Net cash from operating activities (A) 674,813,533 473,402,035
B. Cash flows from investing activitiesPurchase of fixed assets (345,550,231) (403,745,346)Sale of fixed assets 17,965,668 6,303,798 Purchase of investments (480,000,000) (506,533,840)Sale of Investments 561,964,744 492,689,264 Interest income 364,404 339,222 Income from investments 3,576,084 6,533,840
Net cash (used in)/from investing activities (B) (241,679,331) (404,413,062)
C. Cash flows from financing activitiesTerm loan taken 240,000,000 160,000,000 Term loan repaid (80,000,000) – ICD taken 230,000,000 – ICD repaid (115,000,000) – Dividend paid (596,367,360) (150,128,640)Tax paid on dividend (96,745,695) (24,354,619)Interest paid (25,121,405) (1,485,116)
Net cash (used in)/from financing activities (C) (443,234,460) (15,968,375)
Net (decrease)/increase in cash and cash equivalents (A+B+C) (10,100,258) 53,020,598 Cash and cash equivalents at the beginning of the year 93,667,697 40,647,099
Cash and cash equivalents at the end of the year 83,567,439 93,667,697
Notes:1. Cash Flow Statement has been prepared under the indirect method as set out in the Accounting Standard (AS) 3 Cash Flow Statements.2. Purchase of fixed assets includes movement of Capital work-in-progress during the year.3. Cash and cash equivalents at the end of the year represent cash and bank balances.4. Previous year figures have been regrouped wherever necessary.
As per our report attached
SHARP & TANNANChartered AccountantsRegistration No. 109982WBy the hand of
For and on behalf of the Board of Directors
MILIND P. PHADKEPartnerMembership No. 033013
A. SHIVKUMAR SUBHODH SHETTY J. P. NAYAK V. J. SHUKLAChief Executive Company Secretary Director Director
Place: MumbaiDate : April 19, 2013
Place: MumbaiDate : April 19, 2013

S-494
EWAC ALLOYS LIMITED
EWAC ALLOYS LIMITED
NOTES TO THE FINANCIAL STATEMENTS
As at 31.03.2013 As at 31.03.2012
v v v v
A. SHARE CAPITAL
Authorised:
1,500,000 Equity Shares of v 100 each 150,000,000 150,000,000
Issued and subscribed:
829,440 Equity Shares of v 100 each fully paid–up 82,944,000 82,944,000
(1) There were no movements in the number of equity shares outstanding at the beginning and at the end of the year.
(2) There are no rights, preferences and restrictions attaching to shares inluding restrictions on the distribution of dividends and the repayment of capital.
(3) All the equity shares are held by Larsen & Toubro Limited, the holding Company and its nominees.
(4) The shares in the Company held by each shareholder holding more than 5% shares – (Please see note (3) above).
(5) There are no shares reserved for issue under options and contracts/commitments for the sale of shares/disinvestment, including the terms and amounts.
(6) For the period of five years immediately preceeding the date as at which the Balance Sheet is prepared:
– No shares were alloted as fully paid–up pursuant to contract(s) without payment being received in cash.
– No shares were alloted as fully paid–up by way of bonus shares.
– No shares were bought back.
(7) There are no securities convertible into equity/preference shares at a later date.
(8) There are no calls unpaid on issued share capital.
(9) There are no forfieted shares.
As at 31.03.2013 As at 31.03.2012
v v v v
B. RESERVES AND SURPLUS
Capital redemption reserve
As per last Balance Sheet 64,512,000 64,512,000
Addition/(dedution) during the year – –
64,512,000 64,512,000
General reserve
As per last Balance Sheet 326,322,213 270,322,213
Addition/(dedution) during the year 59,000,000 56,000,000
385,322,213 326,322,213
Statement of profit and loss
As per last Balance Sheet 98,466,616 69,085,756
Profit for the year 580,743,083 552,918,874
679,209,699 622,004,630
Less: Dividend paid 344,217,600 150,128,640
Additional tax on dividend paid 55,840,700 24,354,619
Proposed Dividend – 252,149,760
Additional tax on proposed dividend – 40,904,995
Transfer to General reserve 59,000,000 56,000,000
220,151,399 98,466,616
TOTAL 669,985,612 489,300,829

S-495
EWAC ALLOYS LIMITED
EWAC ALLOYS LIMITED
NOTES TO THE FINANCIAL STATEMENTS (Contd.)
As at 31.03.2013 As at 31.03.2012
v v v v
C. NON–CURRENT LIABILITIES
(1) Long–term borrowings
Unsecured
Term loan from related party [Also refer Note No. P (2)] 320,000,000 80,000,000
(2) Deferred tax liabilities (Net)
Deferred tax liabilities 43,239,618 28,594,074
Less: Deferred tax assets [Also refer Note No. P (15)] 13,363,921 11,718,007
29,875,697 16,876,067
(3) Long–term provisions
Post retirement medical benefits [Also refer Note No. P (9)] 12,352,877 8,382,605
12,352,877 8,382,605
TOTAL 362,228,574 105,258,672
D. CURRENT LIABILITIES
(1) Short–term borrowings
Loan repayable on demand from banks – –
(Secured by hypothecation of stock, book debts and receivables)
Loan from a related party 115,000,000 –
(2) Current maturities of long–term borrowings
Term loan from a related party [Also refer Note No. P (2)] – 80,000,000
(3) Trade payables
Due to micro and small enterprises 7,217,441 6,895,835
[Also refer Note No. P (6)]
Due to other than micro and small enterprises 530,337,113 580,285,068
537,554,554 587,180,903
(4) Other current liabilities
Advances from customers 16,371,457 24,815,260
Other payables 24,836,454 212,592,451
41,207,911 237,407,711
(5) Short–term provisions
Provision for employee benefits
Post retirement medical benefits 1,106,283 1,275,884
Compensated absences/leave encashment 58,109,646 56,710,639
[Also refer Note No. P (9)]
Others
Current taxes – 5,361,277
Proposed dividend – 252,149,760
Additional tax on dividend – 40,904,995
Other provisions [Also refer Note No. P (16)] 35,450,076 26,640,022
94,666,005 383,042,577
TOTAL 788,428,470 1,287,631,191

S-496
EWAC ALLOYS LIMITED
EWAC ALLOYS LIMITED
NOTES TO THE FINANCIAL STATEMENTS (Contd.)E. FIXED ASSETS (Amount in v)
GROSS BLOCK (AT COST) DEPRECIATION/OBSOLESCENCE/AMORTISATION NET BLOCK
PARTICULARS As at 01.04.2012
Additions on transfer
Additions Deductions As at 31.03.2013
Upto 31.03.2012
On transfer For the year Deductions Upto 31.03.2013
As at 31.03.2013
As at
31.03.2012
(1) Tangible Assets Leasehold land 1,029,113 – – – 1,029,113 303,606 – 10,292 – 313,898 715,215 725,507
Buidings 72,643,765 – 531,803,392 23,957,526 580,489,631 41,133,666 – 9,228,887 8,933,785 41,428,768 539,060,863 31,510,099
Plant and equipments 240,145,172 – 79,857,447 1,794,406 318,208,213 122,226,622 – 16,074,187 1,448,762 136,852,047 181,356,166 117,918,550
Furniture and fixtures 22,803,409 – 13,252,520 7,014 36,048,915 18,581,950 – 1,278,557 7,007 19,853,500 16,195,415 4,221,459
Office equipments 56,644,019 – 1,197,810 3,408,300 54,433,529 47,996,398 – 2,067,628 2,645,234 47,418,792 7,014,737 8,647,621
Vehicles 8,846,850 – 55,876 110,929 8,791,797 2,461,108 – 824,624 20,295 3,265,437 5,526,360 6,385,742
Sub–total 402,112,328 – 626,167,045 29,278,175 999,001,198 232,703,350 – 29,484,175 13,055,083 249,132,442 749,868,756 169,408,978
(2) Intangible assets – – 6,157,216 – 6,157,216 – – 998,085 – 998,085 5,159,131 –
(3) Capital work–in–progress – – – – – – – – – – 49,984,700 332,330,430
(4) Intangible assets under development
– – – – – – – – – – – 4,428,300
Total 402,112,328 – 632,324,261 29,278,175 1,005,158,414 232,703,350 – 30,482,260 13,055,083 250,130,527 805,012,587 –
Previous year 361,355,594 63,613,921 19,460,908 42,318,095 402,112,328 207,555,409 33,403,870 18,722,821 26,978,750 232,703,350 – 506,167,708
(a) Buildings include v 24,660,984 (Previous year v 3,497,633 as Capital work–in–progress) being borrowing costs capitalised in accordance with Accounting Standard (AS) 16 Borrowing Costs
(b) Expenses capitalised as a part of Building / capital work–in–progress;
Current year Previous year
v v
1. Professional charges and other expenses 16,024,612 9,349,079
2. Traveling and conveyance 176,412 78,012
16,201,024 9,427,091
As at 31.03.2013 As at 31.03.2012
v v v v
F. Long-term Loans and Advances
(1) Loans and advances
Unecured,
Considered good
Capital advances 113,000 18,871,094
Security deposits 41,044,517 52,475,835
Others 397,877 65,374
41,555,394 71,412,303
Considered doubtful
Security deposits 6,855,084 6,855,084
48,410,478 78,267,387
Less: Allowance for bad and doubtful advances 6,855,084 6,855,084
41,555,394 71,412,303
(2) Other non-current assets
Earnest money deposit 15,401,361 7,177,331
15,401,361 7,177,331
TOTAL 56,956,755 78,589,634

S-497
EWAC ALLOYS LIMITED
EWAC ALLOYS LIMITED
NOTES TO THE FINANCIAL STATEMENTS (Contd.)
As at 31.03.2013 As at 31.03.2012
v v v v
G. CURRENT ASSETS(1) Current investments (at cost)
Mutual fundsL&T Ultra STF Institutional -Daily Dividend Reinvestment Plan8,071,209.258 Units of Rs 10.1552 each (Sold during the year) – 81,964,744
– 81,964,744Note:Unquoted investmentsBook value – 81,964,744
(2) Inventories (at lower of cost and net realisable value)Materials 87,868,440 80,787,642 [(including in transit v 10,358,015; (Previous year v1,396,239)]Work-in-progress 47,631,145 54,916,535 Finished goods 126,443,001 236,265,494 Stock-in-trade [(including in transit v 11,598,258; 203,545,263 241,464,543 (Previous year v 18,320,042)]Consumables, stores and spare parts 3,822,710 2,760,829
469,310,559 616,195,043(3) Trade receivables
Unsecured, outstanding for more than six months from due dateConsidered good 80,133,036 98,333,989 Considered doubtful 25,027,892 18,064,892 Other debts, considered good 350,274,362 434,879,651
455,435,290 551,278,532 Less: Allowance for bad and doubtful debts 25,027,892 18,064,892
430,407,398 533,213,640(4) Cash and bank balances
Balances with banks 83,545,917 93,480,963 Cash on hand 21,522 186,734
83,567,439 93,667,697(5) Short-term loans and advances
Considered goodAdvances to suppliers 13,208,684 13,200,928 Advance payment of taxes (net of provisions v 271,500,000) 4,287,923 – Advances recoverable in cash or in kind or for value to be received 25,206,878 19,403,647 Balances with central excise 15,628,433 22,381,651
58,331,918 54,986,226
TOTAL 1,041,617,314 1,380,027,350
H. COMMITMENTS (CAPITAL AND OTHERS)Estimated amounts of contracts remaining to be executed on capital accounts and not provided for (net of advances) 3,316,554 155,409,474
I. Contingent LiabilitiesSales tax liabilty that may arise in respect of matters in appeals 33,858,103 33,858,103 Excise Duty liability that may arise in respect of matters in appeals 54,372,588 –
TOTAL 88,230,691 33,858,103
1. It is not practicable to estimate the timing of cash outflows, if any, in respect of above matter pending appellate proceedings.
2. The Company does not expect any reimbursements in respect of above contingent liabilities.

S-498
EWAC ALLOYS LIMITED
EWAC ALLOYS LIMITED
2012-2013 2011-2012
v v v v
J. REVENUE FROM OPERATIONSSale of products 3,296,126,891 3,321,398,361Sale of services 695,354,213 330,374,435Other operational revenues:Commission 10,356,475 16,791,299 Other operating income 3,000 1,363,887
10,359,475 18,155,186
TOTAL 4,001,840,579 3,669,927,982
K. OTHER INCOMERent – 753,600Interest 364,404 339,222Income from investments 3,576,084 6,533,840Profit on sale of fixed assets (net) 1,392,576 1,105,378Other non-operating income 9,694,371 26,850
TOTAL 15,027,435 8,758,890
L. MATERIALS, MANUFACTURING AND OPERATING EXPENSES(1) Cost of materials consumed
Opening stock 83,548,471 71,234,009 Add: Purchases 510,392,031 889,239,535 Less: Closing stock 91,691,150 83,548,471
502,249,352 876,925,073 Less: Scrap sales 12,485,079 7,740,319
489,764,273 869,184,754(2) Purchases of stock-in-trade 1,152,589,713 1,393,368,689(3) Stores, spares and tools 15,812,659 18,657,173(4) Sub-contracting charges 454,504,271 219,716,007(5) Changes in inventories of finished goods,
work-in-progress .and stock-in-tradeClosing stock Finished goods 126,443,001 236,265,494 Work-in-progress 47,631,145 54,916,535 Stock-in-trade 203,545,263 241,464,543
377,619,409 532,646,572
Less: Opening stock Finished goods 236,265,494 55,978,868 Work-in-progress 54,916,535 39,134,238 Stock-in-trade 241,464,543 87,746,819
532,646,572 182,859,925
155,027,163 (349,786,647)(6) Other manufacturing and operating expenses
Excise duty on finished goods (net) (2,517,839) (4,955,324)Power and fuel 17,338,343 18,770,586 Royalty 11,508,684 12,368,574 Repairs to : Buildings 9,515,911 2,798,760 Plant and equipments 10,744,867 6,893,252
46,589,966 35,875,848
TOTAL 2,314,288,045 2,187,015,824
NOTES TO THE FINANCIAL STATEMENTS (Contd.)

S-499
EWAC ALLOYS LIMITED
EWAC ALLOYS LIMITED
2012-2013 2011-2012
v v v v
M. EMPLOYEE BENEFITS EXPENSE
(1) Salaries, wages and bonus 250,934,142 222,175,393
(2) Contribution to / Provisions for
Provident funds and pension scheme 9,103,050 7,620,022
Superannuation fund – 3,652,902
Gratuity fund 553,759 530,654
Compensated absences/Leave encashment 1,399,007 9,237,222
11,055,816 21,040,800
(3) Staff welfare expenses 32,284,214 21,528,807
TOTAL 294,274,172 264,745,000
N. SALES, ADMINISTRATION AND OTHER EXPENSES
Rent (including lease rentals v Nil; Previous year v 236,600) 7,303,744 4,780,258
Rates and taxes 9,448,515 6,238,837
Repairs and maintenance - others 5,491,010 3,634,367
Insurance 1,306,190 433,218
Travelling and conveyance 72,962,751 54,107,640
Postage, telephone and courier 6,575,232 5,930,950
Printing and stationery 3,891,733 2,636,697
Legal and professional charges 36,473,243 29,060,439
Auditors remuneration [Also refer Note No. P (4)] 839,274 674,517
Service charges 41,276,675 32,602,786
Analysis and testing expenses 2,702,256 2,730,979
Software expenses 7,710,466 3,733,195
Security service charges 2,930,935 3,771,588
Selling agency commission 3,325,913 7,319,290
After sales services including warranties 13,556,445 11,337,678
Advertising and publicity 27,174,073 13,747,306
Packing and forwarding 35,240,686 23,327,028
Bank charges 5,991,975 5,166,583
Allowance for bad and doubtful debts 6,963,000 –
Miscellaneous expenses 39,711,480 9,692,487
TOTAL 330,875,596 220,925,843
O. SIGNIFICANT ACCOUNTING POLICIES 1. Basis of accounting
The Company maintains its accounts on accrual basis following the historical cost convention in accordance with Generally Accepted Accounting Principles (’GAAP’) and in compliance with the provisions of the Companies Act, 1956 and the Accounting Standards as specified in the Companies (Accounting Standards) Rules, 2006 notified by the Central Government. Further, the guidance notes/ announcements issued by the Institute of Chartered Accountants of India are also considered, wherever applicable.
The preparation of financial statements in conformity with GAAP requires that the management of the Company makes estimates and assumptions that affect the reported amounts of income and expenses of the period, the reported balances of assets and liabilities and the disclosures relating to contingent liabilities as of the date of the financial statements. Examples of such estimates include the useful lives of tangible and intangible assets, provision for doubtful debts/advances, future obligations in respect of retirement benefit plans, etc. Difference, if any, between the actual results and estimates is recognised in the period in which the results are known.
2. Revenue recognition Revenue is recognised based on the nature of activity when consideration can be reasonably measured and there exists reasonable
certainty of its recovery.
NOTES TO THE FINANCIAL STATEMENTS (Contd.)

S-500
EWAC ALLOYS LIMITED
EWAC ALLOYS LIMITED
a. Sales include excise duty and adjustments made towards discount, if any, given to customers.
b. Revenue from the sale of manufactured and traded goods is recognised when the substantial risks and rewards of ownership are transferred to the buyer under the terms of the contract.
c. Revenue from service related activities is recognised using the proportionate completion method.
d. Commission income is recognised as and when the terms of contract are fulfilled.
e. Interest income is accrued at applicable interest rate.
f. Other items of income are accounted as and when the right to receive arises.
3. Research and development a. Revenue expenditure on research is expensed under respective heads of account in the period of which it is incurred.
b. Development expenditure on new products is capitalised as intangible asset, if all of the following can be demonstrated:
i. The technical feasibility of completing the intangible asset so that it will be available for use or sale.
ii. The Company has intention to complete the intangible asset and use or sell it.
iii. The Company has ability to use or sell the intangible asset.
iv. The manner in which the probable future economic benefits will be generated including the existence of a market for output of the intangible asset or intangible asset itself of if it is to be used internally, the usefulness of intangible assets.
v. The availability of adequate technical, financial and other resources to complete the development and to use or sell the intangible asset and
vi. The Company has ability to measure the expenditure attributable to the intangible asset during its development reliably.
The development expenditure capitalised as intangible asset is amortised over its useful life.
Other development costs that do not meet above criteria are expensed in the period in which they are incurred.
4. Employee benefits
a. Short-term employee benefits All employee benefits falling due wholly within twelve months of rendering the service are classified as short-term employee benefits.
Benefits, such as, salaries, wages, short-term compensated absences, etc., and the expected cost of bonus, ex-gratia are recognised in the period in which the employee renders the related service.
b. Post employment benefits i. Defined contribution plans: The Company’s superannuation scheme, provident fund scheme, employees’ state insurance
scheme and employees’ pension scheme are defined contribution plans. The contribution paid/payable under the schemes is recognised during the period in which the employee renders the related service.
ii. Defined benefit plans: The employees’ gratuity fund schemes and post-retirement medical care benefit plan are the Company’s defined benefit plans. The present value of the obligation under such defined benefit plans is determined based on actuarial valuation using the Projected Unit Credit Method, which recognizes each period of service as giving rise to additional unit of employee benefit entitlement and measures each unit separately to build up the final obligation.
The obligation is measured at the present value of the estimated future cash flows. The discount rates used for determining the present value of the obligation under defined benefit plans, is based on the market yield on Government securities as at the Balance Sheet date, having maturity periods equivalent to the weighted average maturity profile of related obligations.
Actuarial gains and losses are recognised immediately in the Statement of Profit and Loss.
The interest element in the actuarial valuation of defined benefits plans, which comprises the implicit interest cost and impact of changes in discount rate, is classified under finance costs. The balance charge is recognised as employee benefit expense in the Statement of Profit and Loss.
In case of funded plans, the fair value of the plan assets is reduced from the gross obligation under the defined benefit plans to recognise the obligation on net basis.
Gains and losses on the curtailment or settlement of any defined benefit plan are recognised when the curtailment or settlement occurs. Past service cost is recognised as expense on a straight-line basis over the average period until the benefits become vested.
c. Long-term employee benefits The obligation for long-term employee benefits, such as, long-term compensated absences, long service award, etc., is recognised
in the same manner as in the case of defined benefit plans as mentioned in (b) (ii) above.
d. Termination benefits Termination benefits are recognised as expenses in the period in which they are incurred.
NOTES TO THE FINANCIAL STATEMENTS (Contd.)

S-501
EWAC ALLOYS LIMITED
EWAC ALLOYS LIMITED
5. Fixed assets a. Fixed assets are stated at original cost (net of duty credits availed,if any) less accumulated depreciation and accumulated amortisation.
b. Administrative and other general overhead expenses that are specifically attributable to acquisition of fixed assets or bringing the fixed assets to working condition are allocated and capitalised as a part of the cost of the fixed assets.
c. Expenditure relating to existing fixed assets is added to the cost of the assets, where it increases the performance / life of the asset as assessed earlier.
d. Fixed assets are eliminated from financial statements either on disposal or when retired from active use.
e. Own manufactured assets are capitalised at cost including an appropriate share of overheads.
6. Leases a. Assets acquired under leases where the Company has substantially all the risks and rewards of ownership are classified as finance
leases. Such assets are capitalised at the inception of the lease at the lower of fair value or present value of minimum lease payments and a liability is created for an equivalent amount. Each lease rental paid is allocated between the liability and the interest cost, so as to obtain a constant periodic rate of interest on the outstanding liability for each period.
b. Assets acquired on leases where a significant portion of the risks and rewards of ownership are retained by the lessor are classified as operating leases. Lease rentals are charged to the Statement of Profit and Loss on accrual basis.
7. Depreciation a. Depreciation on assets is provided on written down value method on assets added upto 30th September,1986 and on straight-line
method on assets added after that date, at the rates and in the manner specified in Schedule XIV of the Companies Act, 1956, as amended from time to time, except for computers, the depreciation is provided at the rate of 33.33%, which is higher rate, in line with their estimated useful life.
b. Depreciation on additions to/deductions from is calculated pro-rata from/to the month of additions/deductions during the year. Individual assets costing less than v 5,000 are depreciated at 100% in the year of purchase.
c. Assets acquired under finance leases are depreciated on a straight-line method over the lease term.
8. Intangible assets and amortisation a. Intangible assets are stated at original cost net of tax/duty credits availed, if any, less accumulated amortization and cumulative
impairment. Intangible assets are recognised when it is probable that the future economic benefits that are attributable to the asset will flow to the enterprise and the cost of the asset can be measured reliably. Intangible assets are amortised as follows:
i. Leasehold land: Over the period of lease.
ii. Specialised software: Over a period of three years.
b. Administrative and other general overhead expenses that are specifically attributable to acquisition of intangible assets are allocated and capitalised as a part of cost of the intangible assets.
c. Intangible assets not ready for the intended use on the date of the Balance Sheet are disclosed as ‘Intangible assets under development’.
d. Amortisation on impaired assets is provided by adjusting the amortisation charges in the remaining period, so as to allocate the asset’s revised carrying amount over its remaining useful life.
9. Impairment of assets a. As at each Balance Sheet date, the carrying amount of assets is tested for impairment so as to determine:
i. the provision for impairment loss, if any; and
ii. the reversal of impairment loss recognised in previous periods, if any.
b. Impairment loss is recognised when the carrying amount of an asset exceeds its recoverable amount.
c. Recoverable amount is determined:
i. in the case of an individual asset, at the higher of net selling price and the value in use; and
ii. in the case of a cash generating unit (a group of assets that generates identified, independent cash flows), at the higher of cash generating unit’s net selling price and value in use.
(Value in use is determined as the present value of estimated future cash flows from the continuing use of an asset and from its disposal at the end of its useful life.)
10. Investments a. Investments, which are readily realizable and are intended to be held for not more than one year from the date of acquisition, are
classified as current investment. All other investments are classified as long-term investments.
b. Long-term investments are carried at cost, after providing for any diminution in value, if such diminution is other than temporary in nature.
NOTES TO THE FINANCIAL STATEMENTS (Contd.)

S-502
EWAC ALLOYS LIMITED
EWAC ALLOYS LIMITED
c. Current investments are carried at lower of cost and fair value. The determination of carrying amount of such investments is done on the basis of specific identification.
11. Inventories Inventories are valued, after providing for obsolescence, as under:
a. Materials, stores, spares and loose tools, at lower of weighted average cost and net of realisable value.
b. Work-in-progress and finished goods, at lower of weighted average cost and net realisable value.
c. Cost include directly related to production cost and systematic allocation of fixed and variable production overheads.
d. Finished goods are inclusive of excise duty paid/payable on such goods.
12. Borrowing costs a. Borrowing costs that are attributable to the acquisition, construction or production of qualifying assets are capitalised as part of
the cost of such asset till such time as the asset is ready for its intended use or sale. A qualifying asset is an asset that necessarily requires a substantial period of time to get ready for its intended use or sale.
b. All other borrowing costs are recognised as an expense in the period in which they are incurred.
13. Foreign currency transactions a. The reporting currency of the Company is Indian Rupee.
b. Foreign currency transactions are recorded on initial recognition in the reporting currency, using the exchange rate at the date of the transaction. At each Balance Sheet date, foreign currency monetary items are reported using the closing rate. Exchange differences that arise on settlement of monetary items are recognised as income or expense in the period in which they arise. Non-monetary items which are carried at historical cost denominated in foreign currency are reported using the exchange rate at the date of transaction.
c. Forward contracts, other than those entered into to hedge foreign currency risk on unexecuted firm commitments or highly probable forecast transactions are treated as foreign currency transactions and accounted accordingly as per Accounting Standard (AS) 11 ‘The Effects of Changes in the Foreign Exchange Rates’. Exchange differences arising on such contracts are recognised in the period in which they arise and the premium paid/received is accounted as expense/income over the period of contract.
Gains and losses arising on account of roll over/cancellation of forward contracts are recognised as income/expense of the period in which such roll over/cancellation takes place.
Derivative contracts, including forward contracts entered into to hedge foreign currency risks on unexecuted firm commitments and highly probable forecast transactions are recognised in the Statement of Profit and Loss or Balance Sheet, as the case may be, in pursuance of the Announcement of the Institute of Chartered Accountants of India dated 29th March, 2008 on accounting of derivatives. The gains or losses are recognised in the Balance Sheet where the hedge is effective, while the same is recognised in the Statement of Profit and Loss where the hedge is ineffective. The premium paid/received on a foreign currency forward contract is accounted as expense/income over the life of the contract.
14. Segment accounting Segment accounting policies are in line with the accounting policies of the Company. In addition, the following specific accounting policies
have been followed for segment reporting:
a. Segment revenue includes sales and other income directly identifiable with/allocable to the segment.
b. Expenses that are directly identifiable with /allocable to segments are considered for determining the segment results. Expenses which relate to the Company as a whole and not allocable to segments are included under ‘Unallocable expenditure’.
c. Income which relates to the Company as a whole and not allocable to segments is included in ‘Unallocable income’.
d. Segment assets and liabilities include those directly identifiable with the respective segments. Unallocable assets and liabilities represent the assets and liabilities that relate to the Company as a whole and not allocable to any segment.
15. Taxes on income a. Tax on income for the current period is determined on the basis of taxable income and tax credits computed in accordance with the
provisions of the Income Tax Act, 1961 and based on the expected outcome of assessments/appeals.
b. Deferred tax is recognised on timing differences between the income accounted in financial statements and the taxable income for the year and quantified using the tax rates and laws enacted or substantively enacted as on the Balance Sheet date.
c. Deferred tax assets relating to unabsorbed depreciation/business losses/losses under the head ‘capital gains’ are recognised and carried forward to the extent there is virtual certainty that sufficient future taxable income will be available against which such deferred tax assets can be realised.
d. Other deferred tax assets are recognised and carried forward to the extent that there is a reasonable certainty that sufficient future taxable income will be available against which such deferred tax assets can be realised.
NOTES TO THE FINANCIAL STATEMENTS (Contd.)

S-503
EWAC ALLOYS LIMITED
EWAC ALLOYS LIMITED
16. Provisions, Contingent liabilities and Contingent assets Provisions are recognised for liabilities that can be measured only by using a substantial degree of estimation, if
a. the Company has a present obligation as a result of a past event,
b. the probable outflow of resources is expected to settle the obligation; and
c. the amount of the obligation can be reliably estimated.
Reimbursement by another party, expected in respect of expenditure required to settle a provision, is recognised when it is virtually certain that reimbursement will be received if, obligation is settled.
Contingent liability is disclosed in case of
a. a present obligation arising from past events, when it is not probable that an outflow of resources will be required to settle the obligation.
b. a present obligation arising from past events, when no reliable estimate is possible; and
c. a possible obligation arising from past events where the probability of outflow of resources is not remote.
Contingent assets are neither recognised, nor disclosed.
Provisions, Contingent liabilities and Contingent assets are reviewed at each Balance Sheet date.
17. Commitments Commitments are future liabilities for contractual expenditure. Commitments are classified and disclosed as follows:
a. Estimated amount of contracts remaining to be executed on capital account and not provided for.
b. Other commitments related to sales/procurements made in the normal course of business are not disclosed.
P(1) The Company had closed its operations at its Powai Works, Mumbai as at the end of the previous year (ending March 31, 2012) and majority of the moveable assets existing at Powai works have now been shifted to Ankleshwar. There was no material impairment of assets required to be made on completion of shifting and re-installation at Ankleshwar.
P(2) The Company had obtained sanction for a term loan of v 400,000,000 from L&T Finance Limited, a fellow subsidiary of L&T, for its expansion project at Ankleshwar in the year 2011-12 at a pre-determined rate and the tenure is 5 years. During the year, the Company has availed additional term loan of v 240,000,000 against the sanctioned amount and has also repaid first installment of v 80,000,000.
P(3) Pursuant to the Employees Stock Options Scheme established by L&T, the holding company, the stock options were granted to the employees of the Company. Total cost incurred by the holding Company, in respect of the same is v 19,158,084 and is being recovered over the period of vesting. Accordingly, cost of v 14,024,639; (Previous year v 8,905,788) has been recovered by the holding Company upto current year and out of which, v 5,118,851 (Previous year v 8,905,788) was recovered during the year and the balance v 5,133,445 will be recovered in future periods.
P(4) Auditors’ remuneration and expenses (exclusive of service tax and education cess) charged to accounts:
2012-2013 v
2011-2012 v
Audit fees 400,000 400,000
Tax audit fees 75,000 67,500
Certification fees 56,666 111,000
Other services 288,484 94,000
Reimbursement of expenses 19,124 2,017
839,274 674,517
P(5) The Manager’s salary and perquisites charged to accounts
2012-2013 v
2011-2012 v
Salaries 3,406,050 4,776,024
Perquisites 1,509,785 1,315,538
Retirement benefits 110,520 147,450
5,026,355 6,239,012
NOTES TO THE FINANCIAL STATEMENTS (Contd.)

S-504
EWAC ALLOYS LIMITED
EWAC ALLOYS LIMITED
P(6) The Company has amounts due to suppliers under the Micro, Small and Medium Enterprises Development Act, 2006 (the Act) as at March 31, 2013. The disclosure pursuant to the said Act is as under:
2012-2013 v
2011-2012 v
Principal amount due to suppliers under the Act, 2006 5,555,961 6,221,661
Interest accrued and due to suppliers under the Act, on the above matters 859,078 674,174
Payment made to the suppliers (other than interest) beyond the appointed day, during the year 72,991,267 61,076,592
Interest paid to suppliers under the Act, (other than Section 16) – –
Interest paid to suppliers under the Act, (Section 16) – –
Interest due and payable to suppliers under the Act, for payment already made 859,078 674,174
Interest accrued and remaining unpaid at the end of the year to suppliers under the Act. 1,661,480 674,174
Note: The information has been given in respect of such vendors to the extent they could be identified as ‘Micro and Small enterprises’ on the basis of the information available with the Company. This has been relied upon by the auditors.
P(7) Details of sales and materials consumed, purchase of trading goods and work in progress. a. Sales (net of excise duty):
2012-2013 v
2011-2012 v
Special Welding Electrodes and Gas Welding Rods 1,251,423,680 1,170,067,665
Welding Fluxes 19,915,871 20,160,918
Welding Torches and Accessories 5,709,489 7,476,770
Atomized Metal Powder Alloys 19,169,422 22,450,112
Flux-cored continuous Electrodes 21,069,264 33,343,155
Cold repair Compounds 10,433,681 9,798,598
Wear Plates/ Parts 230,118,692 215,347,756
Oxyfuel 316,891,009 252,233,997
Welding Equipment and accessories 577,874,832 559,563,756
Cutting Equipment and accessories 657,516,589 857,596,081
Others 29,420,539 15,568,406
TOTAL 3,139,543,068 3,163,607,214
b. Materials consumed: 1. Materials
2012-2013 v
2011-2012 v
Metals, Wires, Strips, Plates 215,381,684 313,930,726
Chemicals 95,943,914 164,194,073
Others 178,438,675 391,059,955
TOTAL 489,764,273 869,184,754
2. Value of imported and indigenous materials and stores and spares consumed and percentage to total consumption
2012-2013 2011-2012
Materials v % v %
Imported 28,851,434 6% 34,230,173 4%
Indigenous 460,912,839 94% 834,954,581 96%
TOTAL 489,764,273 100% 869,184,754 100%
2012-2013 2011-2012
Stores and spares v % v %
Imported 2,477,963 16% 1,013,991 5%
Indigenous 13,334,696 84% 17,643,182 95%
TOTAL 15,812,659 100% 18,657,173 100%
NOTES TO THE FINANCIAL STATEMENTS (Contd.)

S-505
EWAC ALLOYS LIMITED
EWAC ALLOYS LIMITED
3. Purchase of trading goods
2012-2013 v
2011-2012 v
Welding, Cutting Equipments and accessories 1,152,589,713 1,393,368,689
4. Work-in-progress
2012-2013 v
2011-2012 v
Special Welding Electrodes and Gas Welding Rods 32,741,728 35,993,479
Welding Fluxes
Atomized Metal Powder Alloys 464,395 578,318
Flux-cored continuous Electrodes 1,888,023 2,444,130
Cold repair Compounds 94,926 224,834
Wear Plates/ Parts 12,442,073 15,675,774
TOTAL 47,631,145 54,916,535
c. Value of imports (on CIF basis):
2012-2013 v
2011-2012 v
Materials 12,417,907 32,245,583
Finished goods 13,263,346 15,714,589
Spare parts 2,477,963 1,013,991
Capital goods 468,249 5,954,902
Trading goods 590,417,886 648,104,380
TOTAL 619,045,351 703,033,445
d. Expenditure in foreign currency:
2012-2013 v
2011-2012 v
Royalty 10,452,957 3,413,624
Other matters – traveling, etc., – 149,500
e. Earnings in foreign exchange
2012-2013 v
2011-2012 v
Export of goods (on FOB basis) 37,225,410 47,596,944
Commission 5,896,800 16,791,229
f. Expenditure on Research and Development activities (as certified by the Management).
2012-2013 v
2011-2012 v
Revenue expenditure 10,026,041 13,611,128
Capital expenditure – 5,507,821
P(8) An amount of v 520,271(net loss) [Previous year v 2,914,940 (net gain)] has been accounted under respective revenue heads in the Statement of Profit and Loss towards exchange differences arising on foreign currency transactions and forward contracts covered under Accounting Standard (AS) 11The Effects of Changes in Foreign Exchange Rates.
P(9) Disclosures as required by Accounting Standard (AS) 15 Employee Benefits:
a. Defined Contribution Plans:
Amount of v 9,379,643; (Previous year v 11,505,909) is recognised as an expense and included in Employee benefits expense (Refer Note No.M) in the Statement of Profit and Loss.
NOTES TO THE FINANCIAL STATEMENTS (Contd.)

S-506
EWAC ALLOYS LIMITED
EWAC ALLOYS LIMITED
b. Defined Benefit Plans:
The amounts recognised in Balance Sheet are as follows:
Particulars
Gratuity Plan31.03.2013
v
Post Retirement Medical Benefit Plan
31.03.2013v
A. Amount to be recognized in Balance Sheet
present value of Defined benefit obligation
- Wholly funded 28,168,604 –
(31,322,585) (–)
- Wholly unfunded – 13,459,160
(–) (9,658,489)
Less: Fair value of plan assets -27,829,845 –
(-32,989,747) (–)
Unrecognised past service costs – –
(–) (–)
Amount not recognised as an asset – –
(–) (–)
Amount to be recognised as liability or (asset) 338,759 13,459,160
(-1,667,162) (9,658,489)
B. Amounts reflected in Balance Sheet
Liability 338,759 13,459,160
(–) (9,658,489)
Assets – –
(1,667,162) (–)
Net liability/ (asset) 338,759 13,459,160
(–) (9,658,489)
Figures in brackets relate to previous year The amounts recognised in Statement of Profit and Loss are as follows:
Particulars
Gratuity Plan 2012-13
v
Post Retirement Medical
Benefit Plan 2012-13
v
1 Current service cost 2,532,984 589,664 (2,794,182) (189,417)2 Interest on defined benefit obligation 2,728,212 825,765 (1,581,680) (430,208)3 Expected return on plan assets -2,413,065 –
(-874,544) (–)4 Net actuarial losses/(gains) -2,294,372 3,390,954
(1,349,789) (197,360)5 Past service cost – – (–) (–)6 Effect of any Acquisition/Divestiture – –
(-4,320,453) (–)7 Actuarial gain not recognised in books – – (–) (–)8 Effect of amount not recognised as an asset – –
(–) (–) Total included in staff expenses 553,759 4,806,383
(530,654) (816,985) Actual return on plan assets 5,594,566 –
(788,259) (–)
Figures in brackets relate to previous year
NOTES TO THE FINANCIAL STATEMENTS (Contd.)

S-507
EWAC ALLOYS LIMITED
EWAC ALLOYS LIMITED
c. The changes in the present value of defined benefit obligation representing reconciliation of opening and closing balance thereof are as follows:
Particulars
Gratuity Plan31.03.2013
v
Post Retirement Medical Benefit Plan
31.03.2013v
Balance of the present value of defined benefit obligation as at 1.04.2012 31,322,585 9,658,489 (11,552,629) (5,995,638)Add: Current service cost 2,532,984 589,664
(2,794,182) (189,417)Add: Interest cost 2,728,212 825,765
(1,581,680) (430,208)Add/(less): Actuarial losses/(gains) 887,129 3,390,954
(1,263,504) (197,360)Add: Past service cost – –
(–) (–)Add/(less): Actuarial losses/(gains) due to Curtailment – –
(–) (–)Add: Liabilities extinguished on settlements – –
(–) (–)Add: Liabilities assumed on acquisition/(settled on divestiture) – –
(16,059,560) (4,121,750)Add: Exchange difference on foreign plans – –
(–) (–)Less: Benefits paid -9,302,306 -1,005,712
(-1,928,970) (-1,275,884)Defined Benefit Obligation as at 31.03.2013 28,168,604 13,459,160
(31,322,585) (9,658,489)
Figures in brackets relate to previous year d. Changes in the fair value of plan assets representing reconciliation of the opening and closing balances thereof are as follows:
Particulars
Gratuity Plan31.03.2013
v
Post Retirement Medical
Benefit Plan 31.03.2013
vOpening balance of the fair value of the plan assets as at 1.04.2012 32,989,747 –
(11,820,381) (–)Add: Expected return on plan assets 2,413,065 –
(874,544) (–)Add/(less): Actuarial gains/(losses) 3,181,501 –
(-86,285) (–)Add: Assets distributed on settlements – –
(–) (–)Add: Contributions by employer -1,452,162 1,005,712
(1,930,064) (1,275,884)Add: Assets acquired on acquisition/(distributed on divestiture) – –
(20,380,013) (–)Add: Exchange difference on foreign plans – –
(–) (–)
Less: Benefits paid -9,302,306 -1,005,712(-1,928,970) (-1,275,884)
Closing balance of the plan assets as at 31.03.2013 27.829,845 –(32,989,747) (–)
Figures in brackets relate to previous year
NOTES TO THE FINANCIAL STATEMENTS (Contd.)

S-508
EWAC ALLOYS LIMITED
EWAC ALLOYS LIMITED
e. The broad categories of plan assets as a percentage of total plan assets as at 31.03.2013, are as follows:
Particulars
Gratuity Plan 31.03.2013
Post Retirement Medical
Benefit Plan 31.03.2013
1 Government of India Securities 45% 0%
(19%) (0%)
2 Corporate Bonds 36% 0%
(12%) (0%)
3 Special Deposit Scheme 9% 0%
(7%) (0%)
4 Equity shares of listed companies 10% 0%
(3%) (0%)
5 Property 0% 0%
(0%) (0%)
6 Insurer managed funds 0% 0%
(0%) (0%)
7 Others 0% 0%
(59%) (0%)
Basis used to determine the overall expected return:
The Investments of Provident Fund and Gratuity Fund are managed by separate Trusts. Expected rate of return on investment is determined based on the assessment made by the Company at the beginning of the year on the return expected on its existing portfolio, along with the estimated incremental investments to be made during the year. Yield on the portfolio is calculated based on suitable mark-up over the benchmark Government securities of similar maturities.
f. Principal actuarial assumptions at the Balance Sheet date (expressed as weighted averages):
1. Discount rate as at 31.03.2013 8.05%
2. Expected return on plan assets as at 31.03.2013 7.50%
3. Annual increase in healthcare costs (see note below)
4. Salary growth rate:
Gratuity scheme 6.00%
g. Attrition rate:
a. For post-retirement medical benefits, the attrition rate varies from 1% to 2% for various age groups.
b. For gratuity scheme, the attrition rate varies from 1% to 2% for various age groups.
h. The estimates for future salary increases, considered in actuarial valuation, take into account inflation, seniority, promotion and other relevant factors, such as supply and demand in the employment market.
i. The obligation of the Company under the post-retirement medical benefit plan is limited to the overall ceiling limits. At present healthcare cost, as indicated in the principal actuarial assumption given above, has been assumed to increase at 5% p.a.
j. A one percentage point change in assumed healthcare cost trend rates from the central rate assumed in this valuation would have the following effects on the aggregate of the service cost and interest cost and defined benefit obligation:
ParticularsEffect of
1% increase 1% decreasev v
Effect on the aggregate of the service cost and interest cost 336,998 (250,936)
Effect on defined benefit obligation 1,155,134 (926,083)
NOTES TO THE FINANCIAL STATEMENTS (Contd.)

S-509
EWAC ALLOYS LIMITED
EWAC ALLOYS LIMITED
The amounts pertaining to defined benefit plans are as follows:
Particulars As at 31.03.2013v
1. Post-Retirement Medical Benefit Plan (unfunded)
Defined benefit obligation 13,459,160
(9,658,489)
2. Gratuity plan
Defined benefit obligation 28,168,604
(31,322,585)
Plan assets 27,829,845
(32,989,747)
Surplus/(Deficit) -338,759
(1,667,162)
3. Leave encashment
Defined benefit obligation 58,109,646
(56,710,639)
k. General description of defined benefit plans:
i. Gratuity Plan:
The Company operates gratuity plan through a separate trust wherein every employee is entitled to the benefit equivalent to fifteen days salary last drawn for each completed year of service. The same is payable on termination of service, or retirement, whichever is earlier. The benefit vests after five years of continuous service. The Company’s scheme is more favorable compared to the obligation under the Payment of Gratuity Act, 1972.
ii. Post-retirement Medical Benefit Plan:
The Post-retirement Medical Benefit plan provides for reimbursement of health care costs to certain categories of employees post their retirement. The reimbursement is subject to an overall ceiling sanctioned at the time of retirement. The ceiling is based on cadre of the employee at the time of retirement.
P(10) Disclosures as required by Accounting Standard (AS) 17 Segment Reporting
Particulars Consumables Equipments Common Total
2012-13 2011-12 2012-13 2011-12 2012-13 2011-12 2012-13 2011-12
v v v v v v v v
Revenue including excise duty
2,419,324,404 1,976,428,040 1,582,516,175 1,693,499,942 – – 4,001,840,579 3,669,927,982
Total Revenue 2,419,324,404 1,976,428,040 1,582,516,175 1,693,499,942 – – 4,001,840,579 3,669,927,982
Segment results 741,237,680 582,625,352 149,126,438 228,311,070 – – 890,364,118 810,936,422
Unallocable income – 8,758,890 – 8,758,890
Operating Profit (PBIT)
741,237,680 582,625,352 149,126,438 228,311,070 – 8,758,890 890,364,118 819,695,312
Finance costs 25,121,405 1,485,116 25,121,405 1,485,116
Profit before tax (PBT)
741,237,680 582,625,352 149,126,438 228,311,070 (-25,121,405) 7,273,774 865,242,713 818,210,196
Tax expense:
Current tax 271,500,000 271,800,000 271,500,000 271,800,000
Deferred tax 12,999,630 (-6,508,678) 12,999,630 (-6,508,678)
Profit after tax (PAT) 741,237,680 582,625,352 149,126,438 228,311,070 (-309,621,035) -258,017,548 580,743,083 552,918,874
NOTES TO THE FINANCIAL STATEMENTS (Contd.)

S-510
EWAC ALLOYS LIMITED
EWAC ALLOYS LIMITED
Particulars Consumables Equipments Common Total
2012-13 2011-12 2012-13 2011-12 2012-13 2011-12 2012-13 2011-12
v v v v v v v v
Other information
Segment assets 1,261,001,786 1,152,020,264 281,495,350 408,201,166 – – 1,542,497,136 1,560,221,430
Unallocable assets 361,089,520 404,913,262 361,089,520 404,913,262
Total A ssets 1,261,001,786 1,152,020,264 281,495,350 408,201,166 361,089,520 404,913,262 1,903,586,656 1,965,134,692
Segment liabilities 133,417,223 350,970,429 141,191,345 214,351,636 – – 274,608,568 565,322,065
Unallocable liabilities 1,628,978,088 1,399,812,627 1,628,978,088 1,399,812,627
Total Liabilities 133,417,223 350,970,429 141,191,345 214,351,636 1,628,978,088 1,399,812,627 1,903,586,656 1,965,134,692
1. Primary/secondary reportable segment:
a. The risk-return profile of the Company’s business is determined predominantly by the nature of its products and services. Accordingly, the business segments constitute the primary segments for disclosure of segment information.
b. The Company do not have any secondary reportable segment as per the criteria specified.
2. Segment identification:
Business segments have been identified on the basis of the nature of products/services, the risk-return profile of individual businesses, the organisational structure and the internal reporting system of the Company.
3. Segment composition:
The Composition of the Segment comprises of Consumables and Equipments.
P(11) Disclosures as required by Accounting Standard (AS) 18 Related Party Disclosures
1. List of related parties having direct control:
Holding Company:
1. Larsen & Toubro Limited
2. Names of the related parties with whom transactions were carried out during the year and description of relationship
Holding Company:
1. Larsen & Toubro Limited
Fellow Subsidiaries:
1. Tractor Engineers Limited
2. Larsen & Toubro Infotech Limited
3. L&T Finance Limited
Key Managerial Personnel and their relatives
1. Mr. A. Shivkumar - Chief Executive
2. Mrs. Jayashree Shivkumar - Wife of Mr. A. Shivkumar
3. Disclosure of related party transactions:
Sr. no
Nature of relationship / Transactions Holding Company Key Management Personnel
Fellow Subsidiary Total
v v v v
1 Purchase of goods and services including commission –(1,366,031)
Nil(Nil)
3,795(250,000)
3,795(1,616,031)
2 Sale of goods (excluding excise duty and taxes) 299,882,645(643,424,225)
Nil(Nil)
Nil(1,980,975)
299,882,645 (645,405,200)
3 Purchase/ lease of fixed assets 267,484,520 (331,944,393)
Nil(Nil)
81,253(64,529)
267,565,773 (332,008,922)
4 Receiving of services and overhead charges 54,416,996 (40,635,982)
Nil(Nil)
Nil (1,101,000)
54,416,996 (41,736,982)
5 Charges for deputation of employees Nil(20,602,643)
Nil(Nil)
Nil(Nil)
Nil(20,602,643)
NOTES TO THE FINANCIAL STATEMENTS (Contd.)

S-511
EWAC ALLOYS LIMITED
EWAC ALLOYS LIMITED
Sr. no
Nature of relationship / Transactions Holding Company Key Management Personnel
Fellow Subsidiary Total
v v v v
6 Rent paid 838,399 (Nil)
Nil(Nil)
Nil(Nil)
838,399(Nil)
7 Transfer of Business from Nil(163,936,944)
Nil(Nil)
Nil(Nil)
Nil(163,936,944)
8 Manager’s remuneration Nil (Nil)
5,026,355(6,239,012)
Nil (Nil)
5,026,355 (6,239,012)
9 Rent received Nil(753,600)
Nil(Nil)
Nil(Nil)
Nil(753,600)
10 Sale of fixed assets 14,832,442 (4,476,075)
Nil(Nil)
Nil(Nil)
14,832,442 (4,476,075)
11 Inter Corporate Deposit Nil(Nil)
Nil(Nil)
115,000,000(Nil)
115,000,000(Nil)
12 Term Loan Nil(Nil)
Nil(Nil)
320,000,000(160,000,000)
320,000,000 (160,000,000)
13 Interest paid on term loan 5,852,603(Nil)
Nil(Nil)
38,365,129(3,497,633)
44,217,732(3,497,633)
14 Amounts due from/ (due to) related parties 52,014,459(-88,300,587)
Nil(Nil)
-455,623,450(-176,777,115)
-403,608,991(-265,077,702)
(Figures in bracket are in respect of previous year)
P(12) Disclosures as required by Accounting Standard (AS) 20 Earnings Per Share
2012-2013 v
2011-2012 v
Profit after taxes as per Statement of Profit and Loss 580,743,083 552,918,874
Equity shares outstanding 829,440 829,440
Earnings Per Share (Basic and Diluted) 700.16 666.62
Nominal value of equity share 100.00 100.00
P(13) Disclosures as required by Accounting Standard (AS) 28 Impairment of Assets
The Company has reviewed potential generation of economic benefits from fixed assets and concluded that the fixed assets employed in the business will generate adequate economic returns over their useful lives. Consequently, no provision of impairment loss is required.
P(14) Foreign Currency transactions, Forward contracts and Derivatives:
The Company uses delivery based forward contracts to mitigate its risks associated with foreign currency fluctuations. The Company does not enter into any forward contracts which are intended for trading or speculative purposes.
Unhedged foreign currency exposures as at March 31, 2013 are as under:
31.03.2013 v
31.03.2012 v
Receivables, including firm commitments and HPFT 21,119,112 21,314,300
Payables, including firm commitments and HPFT 107,633,266 258,851,119
(Note: HPFT means Highly Probable Forecast Transactions)
P(15) Deferred tax
The major components of deferred tax assets and deferred tax liabilities are as under:
31.03.2013 v
31.03.2012 v
Deferred tax liabilities
Difference between written down value as per books and as per income tax 43,239,618 28,594,074
TOTAL 43,239,618 28,594,074
NOTES TO THE FINANCIAL STATEMENTS (Contd.)

S-512
EWAC ALLOYS LIMITED
EWAC ALLOYS LIMITED
31.03.2013 v
31.03.2012 v
Deferred tax assets
Expenditure claimed on payment basis for tax purposes 7,066,681 7,888,907
Royalty payable outside India disallowed u/s 40(a)(i) 3,930,516 3,829,100
Allowance for bad and doubtful debts 2,366,724 Nil
TOTAL 13,363,921 11,718,007
Net deferred tax liabilities 29,875,697 16,876,067
Net incremental liability charged / (credited) to Statement of Profit and Loss 12,999,630 (6,508,678)
P(16) Disclosures as required by Accounting Standard (AS) 29 Provisions, Contingent Liabilities and Contingent Assets
a. Movement in provisions
Particulars of disclosure Product Warrantiesv
Sales Taxv
Totalv
Balance at the beginning 12,067,701(5,008,124)
14,572,321(–)
26,640,022(5,008,124)
Additional provisions 12,546,775(19,196,495)
3,417,679(15,588,867)
15,964,454(34,785,362)
Provisions used during the year 7,154,400(12,136,918)
–(1,016,546)
7,154,400(13,153,464)
Provisions reversed during the year –(–)
–(–)
–(–)
Balance at close 17,460,076(12,067,701)
17,990,000(14,572,321)
35,450,076(26,640,022)
(Figures in brackets are in respect of previous year)
b. The Company gives warranties on certain products and services, undertaking to repair or replace the items that fail to perform satisfactorily during the warranty period. Provision made as at March 31, 2013 represents the amount of the expected cost of meeting such obligations of rectification/replacement. The timing of the outflows is expected to be within a period of 18/24 months.
c. Provision for sales tax mainly represents the differential sales tax liability on account of non-collection of declaration forms for the period prior to five years.
P(17) Figures for the previous year have been regrouped, wherever necessary.
Signatures to Note Nos. A to P
As per our report attached
SHARP & TANNANChartered AccountantsRegistration No. 109982WBy the hand of
For and on behalf of the Board of Directors
MILIND P. PHADKEPartnerMembership No. 033013
A. SHIVKUMAR SUBHODH SHETTY J. P. NAYAK V. J. SHUKLAChief Executive Company Secretary Director Director
Place: MumbaiDate : April 19, 2013
Place: MumbaiDate : April 19, 2013
NOTES TO THE FINANCIAL STATEMENTS (Contd.)