Director Perceptions of their Boards’ Dynamics, and ...
72
1 Director Perceptions of their Boards’ Effectiveness, Size and Composition, Dynamics, and Internal Governance J. Yo-Jud Cheng, Boris Groysberg, Paul Healy and Rajesh Vijayaraghavan * Harvard Business School December, 2017 Abstract We surveyed 2,390 directors of global companies about their boards’ size and composition, internal dynamics, internal governance, and effectiveness. Most directors rated their board size as “just right” despite wide variation in board size, consistent with optimal board size being endogenous. New board members were typically identified through social networks of executives and board members, rather than through executive search firms, partially explaining the low frequency of women and minorities seated on typical boards. In terms of internal governance, 70% of the sample used regular self- assessments. Their use was markedly higher for boards of public companies in common and civil law countries (84% and 75% respectively) than for boards of private companies in common and civil law countries (47% and 42% respectively). Although responding directors typically rated their board’s effectiveness highly, the weakest ratings were for the board’s role in evaluating the CEO and in succession planning, suggesting that these activities are either more difficult or less focal. Finally, ratings of board effectiveness in various functions are related to measures of board composition, internal dynamics, and internal governance. Keywords: corporate governance, boards of directors * J. Yo-Jud Cheng is a doctoral student at Harvard Business School, Boris Groysberg and Paul Healy are Professors of Business Administration at Harvard Business School, and Rajesh Vijayaraghavan is an Assistant Professor at the University of British Columbia Sauder School of Business. We thank participants at the 2016 American Accounting Association Annual Meeting (and discussant Volkan Muslu) and a seminar at Harvard Business School for their helpful comments. This project was supported by financial assistance from the Department of Faculty Research and Development of the Harvard Business School. Contact emails: Yo-Jud Cheng, [email protected]; Boris Groysberg, [email protected]; Paul Healy, [email protected]; Rajesh Vijayaraghavan, [email protected].
Transcript of Director Perceptions of their Boards’ Dynamics, and ...
1
Director Perceptions of their Boards’ Effectiveness, Size and Composition,
Dynamics, and Internal Governance
J. Yo-Jud Cheng, Boris Groysberg, Paul Healy and Rajesh Vijayaraghavan *
Harvard Business School
December, 2017
Abstract
We surveyed 2,390 directors of global companies about their boards’ size and
composition, internal dynamics, internal governance, and effectiveness. Most directors
rated their board size as “just right” despite wide variation in board size, consistent with
optimal board size being endogenous. New board members were typically identified
through social networks of executives and board members, rather than through executive
search firms, partially explaining the low frequency of women and minorities seated on
typical boards. In terms of internal governance, 70% of the sample used regular self-
assessments. Their use was markedly higher for boards of public companies in common
and civil law countries (84% and 75% respectively) than for boards of private companies
in common and civil law countries (47% and 42% respectively). Although responding
directors typically rated their board’s effectiveness highly, the weakest ratings were for
the board’s role in evaluating the CEO and in succession planning, suggesting that these
activities are either more difficult or less focal. Finally, ratings of board effectiveness in
various functions are related to measures of board composition, internal dynamics, and
internal governance.
Keywords: corporate governance, boards of directors
* J. Yo-Jud Cheng is a doctoral student at Harvard Business School, Boris Groysberg and Paul Healy are
Professors of Business Administration at Harvard Business School, and Rajesh Vijayaraghavan is an
Assistant Professor at the University of British Columbia Sauder School of Business. We thank participants
at the 2016 American Accounting Association Annual Meeting (and discussant Volkan Muslu) and a
seminar at Harvard Business School for their helpful comments. This project was supported by financial
assistance from the Department of Faculty Research and Development of the Harvard Business School.
Contact emails: Yo-Jud Cheng, [email protected]; Boris Groysberg, [email protected]; Paul Healy,
[email protected]; Rajesh Vijayaraghavan, [email protected].
2
1. Introduction
In the wake of recent financial crises, there has been increased interest from
regulators, practitioners, and researchers in improving the effectiveness of corporate
boards (Aebi et al., 2012; Board of Governors of the Federal Reserve System, 2017;
Erkens et al., 2012; Kirkpatrick, 2009). Prior research on board effectiveness focuses on
how board characteristics, such as size and composition, affect firm profitability or
observable board actions (see Adams et al., 2010; Hermalin and Weisbach, 2003 for
summaries of these studies); however, few studies have examined the internal operations
of boards (Adams et al., 2010), which are also likely to affect board performance.
A thorough review of the corporate governance literature reveals many open
questions about the inner workings of boards. For example, the types of directors that are
selected when vacancies arise are likely to influence how the board operates, yet we
know little of how new outside directors are identified and selected. What role do social
networks and search firms play in the director recruitment process? In addition, we know
little about the internal dynamics of the board itself. Since boards are teams of
individuals, how do team dynamics affect board performance? How does the board’s
relationship with the CEO affect its ability to carry out key board functions? (Adams et
al., 2010 highlight these questions as profitable areas of future research at the end of their
review of the corporate governance literature). What practices do boards use to internally
govern themselves? Do they conduct regular reviews? If so, who conducts these reviews,
and how are poorly performing board members addressed? Finally, how do boards judge
their own effectiveness?
3
Many of these questions are difficult to address based on externally-observable
characteristics of boards. Adams et al. (2010, p. 59) note that “outside of detailed
fieldwork, it is difficult to observe differences in behavior. … Consequently, empirical
work in this area has focused on structural differences across boards that are presumed to
correlate with differences in behavior.” While this approach has proven to be fruitful for
academic researchers, it may fail to capture many of the complexities around how boards
function. Lorsch (2017, p. 43) argues that “a data-dependent research approach … is
incapable of capturing the systemic dynamics of boards” and other methods are necessary
to gain a “deeper analysis of the board as a complex social system.” We seek to address
this gap by conducting interviews and a large-sample survey across a broad sample of
firms to deeply explore the inner operations of boards that are typically unobservable to
researchers.
Our survey and interviews of directors posed questions about their views on their
boards’ size and composition, internal dynamics, internal governance, and performance.
We use board members’ responses to explore: (1) how directors view their own board’s
overall effectiveness and effectiveness on a variety of specific board functions; (2) how
directors rate the inner workings of their boards, information that cannot be captured
through traditional archival research; and (3) which board characteristics, internal
dynamics and governance factors are most strongly related to ratings of board
effectiveness. We use our findings to offer suggestions for future research.
Our sample comprises 2,390 directors who responded to surveys administered in
2012 and 2015. We supplemented this survey by collecting detailed information on
director perspectives through semi-structured interviews with more than 75 directors. The

4
responding directors represented public and private firms from a wide variety of
industries and countries, allowing us to examine how board operations vary across public
and private boards, and in both common law and civil law countries. The average
responding director in our sample has considerable boardroom experience, serving on
10.8 boards over the course of their careers, with the longest period of service being 10.0
years on average.
1.1 Board Performance
A report from the National Association of Corporate Directors (NACD) notes that
“under normal circumstances, there is no outside apparatus to assess how effectively
boards are discharging their fundamental duties and responsibilities” (West, 2002, p. 20).
Our survey offers insights into how directors themselves view the effectiveness of the
boards on which they serve. Directors were asked to rate the overall performance of their
boards as well as their boards’ effectiveness at overseeing firm strategy, CEO
evaluations, succession planning, and stewardship of company assets on behalf of
shareholders. Participating directors typically rated their boards’ overall performance
highly, with 88% giving a grade of 4 or 5 out of 5. Whether this high rating reflects a
tendency for underperforming boards to quickly improve in response to market pressures,
survey participants’ over-optimism about their boards’ performance, or perceived social
pressure to paint their boards in a good light, is unclear.
The lowest ratings were for effectiveness in evaluating the CEO and in succession
planning, suggesting that the sample boards felt more comfortable providing advice to the
CEO than in overseeing the CEO’s performance. Interviews with directors revealed that
boards with ineffective succession planning tended not to discuss the matter at all, in

5
some cases because of the influence of a powerful CEO. For CEO evaluations, directors
observed that ineffective board practices typically arose when the CEO was too
influential in board deliberations about compensation.
1.2 Board Composition and Size
Social networks appear to play an important role in the identification of new
board members. Twenty-six percent of the responding directors knew the CEO prior to
joining the board, and 37% knew other executives or directors. Only 27% of new board
members were identified by a search firm. The role of social networks in director
selection raises questions about how researchers should classify independent directors
based on whether they are insiders or outsiders, since so many appointees are known by
top management and/or other board members prior to their appointment.
In addition, the role of social networks potentially explains the small number of
female executives elected to corporate boards. Female directors in our sample are
significantly less likely to have been known to the CEO prior to joining the board than
male directors and more likely to have been recruited through an executive search firm,
suggesting that male-dominated social networks at the most senior levels help men to
secure board seats and that firms seeking greater board diversity used search firms to
identify a wider pool of candidates than would emerge through social networks. Search
firms were more than twice as likely to be used to recruit new directors for boards with
greater gender, ethnic, and nationality diversity.
However, we find no evidence of any relationship between demographic diversity
on boards and perceptions of board effectiveness. In contrast, skill diversity on the board,
captured by director ratings of whether their boards had the right mix of skills and

6
experiences to help perform board functions, was strongly related to board effectiveness
ratings.
We examined directors’ ratings of whether their board size is “too big,” “too
small,” or “just right” to address Hermalin and Weisbach’s (2003) contention that
optimal board size varies across firms. We find evidence consistent with this assertion:
most directors viewed their board size as “just right” despite wide cross-sectional
variation observed in the number of directors per board.
1.3 Board Internal Dynamics
Prior research recognizes that board internal dynamics are likely to be important for
board performance; however, evidence on this relationship has been largely anecdotal
(e.g., Lorsch and MacIver, 1989). Survey respondents rated their board’s internal
dynamics highly overall. In our multivariate analysis, we find that participating directors’
ratings of board effectiveness are highly correlated with ratings of boards’ internal
dynamics, such as the board’s ability to work as a team, the CEO’s openness in
communicating and consulting with the board, and the tone for the company set by the
CEO and board together. These findings provide systematic evidence that directors
perceive that the internal dynamics of the board plays an important role in board
performance.
1.4 Board Internal Governance
Given the challenges associated with viewing the inner workings of the board,
current research provides few insights about the internal governance practices that
individual boards choose to adopt. In our survey, 70% of respondents reported that their
boards conducted annual assessments, most of which were administered by the board

7
itself. Only 33% of the assessments were conducted by external advisors or consultants.
Our findings indicate that high-performing boards were more likely to conduct
assessments than poorly performing boards, suggesting that board assessments were not
utilized by the boards that could potentially benefit most from this process.
Many respondents (46% of the sample) were not convinced that their boards were
very effective in dealing with underperforming directors. This proportion was higher
among boards that conducted assessments (60%) than among those that did not (40%);
but boards that used external advisors to conduct assessments were no better equipped to
address poorly performing directors than boards with self-administered assessments. We
find that several internal governance measures (in particular, director preparedness for
meetings, use of regular assessments, and the ability to deal with poorly performing
directors) are positively correlated with directors’ perceptions of board effectiveness.
The rest of this paper is organized as follows: section 2 discusses our research
method; section 3 reports director ratings of board effectiveness; sections 4, 5, and 6
describe findings on board composition and size, board internal dynamics, and board
internal governance respectively; section 7 reports multivariate tests of factors associated
with board effectiveness ratings; section 8 examines the relation between board and
actual performance outcomes; and section 9 presents the conclusions.
2. Research Method
2.1 Survey Design
Prior studies have noted that despite their limitations, surveys provide valuable
practitioner insight into questions that are unresolved through theory or large sample
archival studies (see Dichev et al., 2013; Graham et al., 2005). Survey methodology is

8
particularly well-suited to study the internal operations of boards, where the absence of
public data has limited opportunities for research (Lorsch, 2017). We follow the approach
recommended by Lorsch (2017, p. 46) to “access … actual behavior in the boardroom”
by using a large-sample survey methodology and in-depth interviews to explore
directors’ backgrounds and their perceptions of their boards’ internal operations and
effectiveness in a variety of activities.1 To develop our survey questions, we draw on
practitioner assessments of best board practices, research on internal board dynamics and
team effectiveness, and prior archival research on boards.
The survey questions request directors to provide data on: their personal
background and experience; company information (including allowing the survey
respondent to disclose the name of their company); the size and composition of the board
(including information on how board members are appointed); the internal dynamics of
board meetings (covering the board’s teamwork and relations with the CEO); the internal
governance of the board (including time commitments for meetings, director attendance
and preparation, and the use of board assessments); and evaluations of effectiveness in
specific functions (alignment with the firm’s strategy, stewardship of company assets,
evaluation of the CEO, and succession planning) and overall board performance. Some
qualitative questions are included in the survey to more deeply probe respondents’ views;
however, most questions are quantitative (many use a Likert scale from 1 to 5, where a 1
signifies a rating of “strongly disagree,” 2 “disagree,” 3 “unsure,” 4 “agree,” and 5
“strongly agree”).
1 Adams (2009) also uses survey methodology to study directors’ perceptions of their roles and their
relationships with management. Her survey of directors of Swedish companies finds that directors that see
themselves as focusing more on monitoring CEOs tend to say less in the boardroom, get asked less by the
CEO for their advice, and have a weaker personal relationship with management.
9
2.2 Sample Composition
We developed our survey in 2011 in cooperation with a board association, an
independent researcher, and a leading executive search and consulting firm that had a
network of more than 50 offices around the world, and clients that included Fortune 1000
companies, public and private entities, and nonprofit organizations. A trial survey was
sent out in 2011 to a subset of directors and their feedback was incorporated into a
revised survey. This final survey was sent out in 2012 to directors of large companies in
the CapitalIQ database and to directors in the executive search firm’s contact database. In
2015, we conducted another survey wave that targeted additional directors of large
companies (compiled from the CapitalIQ database) and contacts of a second executive
search firm.
As shown in Table 1, the total survey population was significantly increased for the
2015 survey, which aimed to expand the survey sample population, rather than re-survey
respondents from 2012. The survey population comprised 55,396 directors from the
CapitalIQ database as well as 29,776 directors of search firm clients. This set was
reduced by 14,549 undeliverable messages, resulting in a total of 70,623 survey
recipients. We received responses from 4,765 directors (an overall response rate of
6.7%), 2,390 of which had usable responses.2 The final sample represents 1,547 public
company boards and 816 boards of private companies.3
Because the survey was mailed separately to multiple directors for the same firm
over two survey waves, we could have received multiple responses from directors from
2 We excluded any responses that did not include a rating of overall board effectiveness from our final data
sample. The number of responses for any given question is typically less than the usable sample of 2,390,
since most participants did not answer every survey question. 3 27 respondents did not indicate the ownership status of their company.

10
the same company or the same director in both survey waves. Repeat observations would
affect the independence of the survey responses and our statistical inferences. To test for
this possibility, we sort the data on industry, country of origin, board size, board
composition, public/private classification, and respondent demographics to identify
responses from multiple directors for the same company. We identify 94 observations
where there is a possibility that more than one director from the same board responded to
the survey or that the same director responded to the survey in both years. The results are
not sensitive to eliminating these observations.
Table 2 reports data on the backgrounds and characteristics of sample directors.
Where possible, we compare our survey sample to data on directors from the BoardEx
database, one of the most comprehensive global databases of corporate directors, and
widely used in academic research studies (e.g. Aggarwal et al., 2011; Cohen et al., 2008,
2010; Erkens et al., 2012). These comparisons are reported in Appendix Table A1. The
typical sample director is similar in age and boardroom experience to the average
BoardEx director. The mean sample (BoardEx) director was 59 (58) years old, received
his/her first directorship at age 41 (44), served on 3.5 (3.1) public boards and 6.3 (6.0)
private boards, and had spent 10 (8) years on their longest-serving board. The similarity
in the number of directorships held by survey respondents and directors in the BoardEx
database suggest that our survey sample does not disproportionately represent highly
experienced or inexperienced directors. Eighty percent of our sample were male and 30%
were retired. Forty-three percent were either the lead director or chairperson, 63% served
on the audit/finance committee, and 51% were members of the compensation committee.
11
2.3 Listing Status and Legal System
Corporate governance practices in publicly-owned firms may differ from privately-
owned firms for several reasons, in large part due to regulations imposed only upon
public firms. In the United States, for example, public firms are required to file financial
statements and disclose specific types of events to the Securities and Exchange
Commission (SEC), while privately-owned firms are not subject to these requirements.
Furthermore, only publicly-owned firms are bound by the corporate governance
regulations passed through the Sarbanes-Oxley Act, such as the requirement for audit
committee independence. Listing requirements for specific stock exchanges, such as the
New York Stock Exchange, often impose their own corporate governance standards.
Although privately-owned firms are not directly bound by these corporate
governance regulations, private firms may choose to adopt many of these practices to
attract investors when seeking external financing, to lower insurance premiums, or to
comply with corporate laws implemented at the national or state level (Diamond, 2008).
Also, to the extent that ownership and management are more closely linked in private
companies than in public companies, privately-owned companies may be less susceptible
to the agency issues that can arise when ownership and management are separated.
For these reasons, we expect that corporate governance practices will differ based
on the firm’s ownership status, and we therefore analyze survey responses separately for
public and private firms. Data on the ownership status of the sample firms is shown in
Panel A of Table 3. Sixty-five percent of the sample companies were public and 35%
private. The private companies were more likely to be family-owned (22%) versus public
companies (5%).

12
In addition to differences between public and private firms, we expect that
corporate governance practices will differ based on the legal system of the country in
which the firm is domiciled. Most legal systems in place today build upon one of two
primary traditions: common law, which originates from English law; and civil law, which
originates from Roman law. Common law legal systems, which are in use in the United
States, United Kingdom, Australia, and Canada (among other countries), are based upon
legal precedents and judicial decisions. The common law legal system was originally
developed to protect the rights of individual property owners and, therefore, common law
regimes typically offer strong protections to shareholders and investors over other types
of stakeholders (Crossland and Hambrick, 2011; La Porta et al., 1998, 2000). Civil law
legal systems, in use in Switzerland, Germany, Sweden, Italy, and France (among other
countries), are based upon statutes passed by legislatures, and were developed more as a
means to reinforce state power (Crossland and Hambrick, 2011; La Porta et al., 1998,
2000). Under civil law, top managers and the board of directors are required to consider
the interests and needs of a wide range of stakeholders and constituencies (such
employees and customers) when formulating strategies and making decisions (Crossland
and Hambrick, 2011). Due to these differences in legal traditions, we examine survey
responses separately for common and civil law countries.
Comparisons between directors of public/private boards and those from
common/civil law countries reveal several differences in experience across these
subsamples (see Table 2). In both common and code law countries, responding public-

13
company directors were about three years older than their private board peers4 and were
twice as likely to be retired.
Respondents from civil law countries were younger than their common law peers
(55-58 versus 58-61), less likely to be retired (10-25% versus 20-39%), and more likely
to be an executive director (13-32% versus 10-27%). In addition, directors of private
boards in civil law countries, the youngest and least experienced respondents, were less
likely to be on the audit/finance or compensation committees.
2.4 Industry
As reported in Panel B of Table 3, the sample firms represent a broad cross-section
of industries. Twenty-eight percent of the responses were from financial and professional
services firms, 13% from industrial firms, and 12% each from consumer discretionary,
healthcare, and IT & Telecom. These percentages are similar to those for firms
represented on the BoardEx database (see Panel C, Table A1 in the Appendix).
2.5 Country of Domicile
The geographic distribution of the sample boards’ headquarters is reported in Panel
C of Table 3. U.S. boards represented 43% of the observations. Boards from Western
Europe made up 31% of the sample, 8% each were from Australia and Canada, and 4%
were from Asia. Seventy-seven percent of the sample companies were domiciled in
common law countries, and 23% in civil law countries. Private company boards were
more likely to be domiciled in civil law countries (49% versus 30%), whereas public
country boards were more likely to be from common law countries (70% versus 51%).
4 Panel A of Table A1 (in the Appendix) compares director characteristics for U.S. public and private firms
in our sample with those from BoardEx. There appear to be no material differences in age and experience.
14
As a result, we report findings separately for public and private boards in common and
civil law countries to explore how listing and legal status affect our findings.
2.6 Research Limitations
As noted earlier, survey research has its limitations. First, directors’ perceptions of
board performance and internal processes are subject to bias and pressures for socially
desirable responses. As this is particularly a concern when survey respondents are asked
to disclose the name of their company, our survey did not require this information,
though respondents had the option to include it. Second, director ratings of board
effectiveness are subjective, and might not always align with real behavior. Third,
directors may respond in ways that confirm theories they have learned in business school
or that are popularized in the financial press, rather than because they truly represent their
opinions (Graham et al., 2005; Graham and Harvey, 2001). Finally, respondents represent
only a small proportion of the population, raising questions about generalizability.
These concerns notwithstanding, surveys may be one of the only ways to collect
data for a large sample of companies on the types of internal board processes examined in
this paper, given that public data on boards are unlikely to provide direct measures of
these variables. Another option is to collect field data on specific companies (e.g., Lorsch
and MacIver, 1989; Vancil, 1987), but these studies raise even more questions about
generalizability.
3. Director Ratings of Board Effectiveness
Prior research has inferred the causes of board effectiveness by examining the
relationship between the firm’s financial performance and various characteristics of the
board (e.g., independence or size). As Hermalin and Weisbach (2003) note, a challenge
15
with this approach is that optimal board characteristics are likely to vary with context,
making it difficult to interpret the findings. An alternative approach is to examine the
relationship between the outcomes of various board’s responsibilities (e.g., replacing a
poorly performing CEO, compensating the CEO, approving mergers, or appointing a new
CEO) and board characteristics. However, as Hermalin and Wesibach (2003) argue, even
these studies are open to alternative interpretations and concerns about spurious
correlation.
We adopt a different approach from prior research and instead directly ask directors
about their boards’ internal functions and effectiveness in order to capture properties of
boards “through the eyes of the directors who participate in boardroom activities
themselves” (Lorsch, 2017, p. 46). We ask survey participants to rate how well their
boards perform a variety of responsibilities: (a) aligning with the CEO on vision and
strategy, (b) evaluating the CEO, (c) succession planning, (d) stewardship of the
company’s assets on behalf of shareholders, and (e) overall performance. Table 4 reports
summary response data for questions on each of these dimensions of effectiveness.
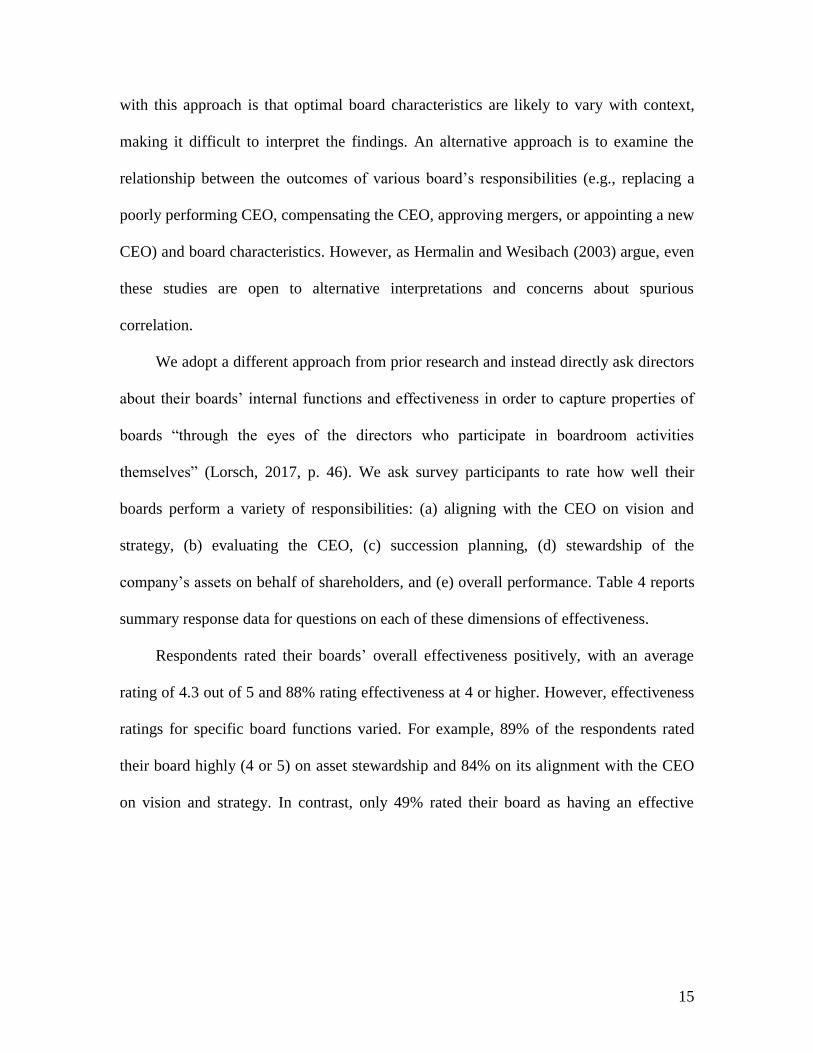
Respondents rated their boards’ overall effectiveness positively, with an average
rating of 4.3 out of 5 and 88% rating effectiveness at 4 or higher. However, effectiveness
ratings for specific board functions varied. For example, 89% of the respondents rated
their board highly (4 or 5) on asset stewardship and 84% on its alignment with the CEO
on vision and strategy. In contrast, only 49% rated their board as having an effective
16
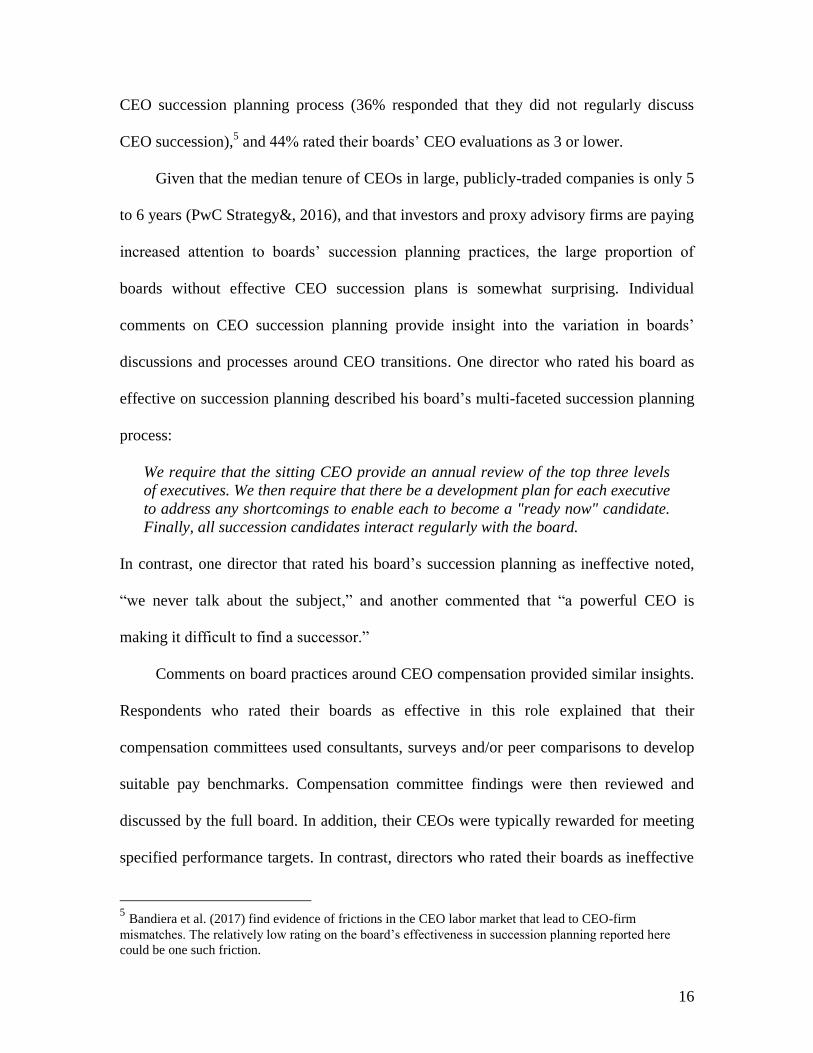
CEO succession planning process (36% responded that they did not regularly discuss
CEO succession),5 and 44% rated their boards’ CEO evaluations as 3 or lower.
Given that the median tenure of CEOs in large, publicly-traded companies is only 5
to 6 years (PwC Strategy&, 2016), and that investors and proxy advisory firms are paying
increased attention to boards’ succession planning practices, the large proportion of
boards without effective CEO succession plans is somewhat surprising. Individual
comments on CEO succession planning provide insight into the variation in boards’
discussions and processes around CEO transitions. One director who rated his board as
effective on succession planning described his board’s multi-faceted succession planning
process:
We require that the sitting CEO provide an annual review of the top three levels
of executives. We then require that there be a development plan for each executive
to address any shortcomings to enable each to become a "ready now" candidate.
Finally, all succession candidates interact regularly with the board.
In contrast, one director that rated his board’s succession planning as ineffective noted,
“we never talk about the subject,” and another commented that “a powerful CEO is
making it difficult to find a successor.”
Comments on board practices around CEO compensation provided similar insights.
Respondents who rated their boards as effective in this role explained that their
compensation committees used consultants, surveys and/or peer comparisons to develop
suitable pay benchmarks. Compensation committee findings were then reviewed and
discussed by the full board. In addition, their CEOs were typically rewarded for meeting
specified performance targets. In contrast, directors who rated their boards as ineffective
5 Bandiera et al. (2017) find evidence of frictions in the CEO labor market that lead to CEO-firm
mismatches. The relatively low rating on the board’s effectiveness in succession planning reported here
could be one such friction.

17
observed that the CEO was active in setting compensation, either directly or indirectly,
causing discomfort among directors.
Table 5 reports correlations among the different measures of board effectiveness.
There are relatively high correlations between ratings of overall effectiveness, strategy
alignment, CEO evaluations, and asset stewardship. CEO succession planning ratings are
less highly correlated with the other effectiveness ratings, perhaps reflecting lower
consistency in board effectiveness in carrying out this function.
The results by listing and legal status (see Panel B of Table 4) show that directors of
public company boards in common law countries rated their effectiveness more highly
than their peers at private companies and in civil law countries. Fifty-eight percent rated
their board as effective at succession planning, compared to 47% for public company
respondents in civil law countries, and 39% (30%) for private company directors in
common law (civil law) countries. For CEO evaluations, 38% of public board directors in
common law countries rated effectiveness as 3 or lower, compared to 48% of directors in
civil law public and common law private companies, and 57% of respondents in civil law
private companies. Directors of companies in common law countries consistently rated
their boards higher on these functions than civil law boards. Public common law country
respondents also rated their asset stewardship and strategy alignment performances as the
higher than peers at other types of boards, although the differences were more modest.
Overall, these findings suggest that responding directors rated their boards as highly
effective in providing counsel to the CEO and in acting as a steward of the firm’s assets.
Where they appear to be more doubtful about their performance is as evaluators of the
CEO and in succession planning. The respondents’ high overall perception of their

18
boards’ effectiveness suggests that they view strategy advice and stewardship of assets as
more important roles than CEO evaluation and succession planning, in line with prior
research that demonstrates that boards see their primary function as providing counsel to,
rather than monitoring, the CEO (Demb and Neubauer, 1992; Lorsch and MacIver, 1989;
Mace, 1971).
Of course, the respondents’ high ratings of their own performance could reflect
ratings bias. Indeed, given evidence of the poor track record of large strategic
acquisitions and the failures of many financial institutions during the financial crisis of
2008, one might conclude that respondents had an inflated opinion of their effectiveness
in strategic or stewardship matters. Further, regulatory changes designed to enhance the
board’s monitoring role and increased activist pressure on boards to monitor management
(Linck et al., 2009; Wu, 2004) make it somewhat surprising that respondents appeared to
view these functions as relatively less important in judging overall board effectiveness.
Nevertheless, this observed pattern could arise if, for example, the same psychological
processes that lead directors to overstate their boards’ overall performance also lead them
to dismiss the relative importance of areas where their boards underperform.
4. Board Composition and Size
4.1 Appointing New Directors
Practitioners argue that effective boards should have strong processes for
identifying and recruiting new board members whose skills complement those of existing
board members. However, critics of boards assert that in reality, new board members are
typically drawn from a relatively narrow set of individuals who are well-connected to
current board members and executives, reducing the breadth of expertise and experience

19
available to the board, and raising questions about whether even outside board members
are truly independent of management.
To examine how new directors are identified, we surveyed directors about how they
were nominated to their current board (summary statistics are reported in Panel A of
Table 6). Prior to their nomination, the preponderance of the survey respondents knew
either a member of top management or a board member: 26% knew the CEO, 13% a
member of executive management, 31% knew one of the directors, 13% were a current or
former executive of the company, and 22% were appointed by a major shareholder. Only
27% were identified through an executive search firm.
When describing how they received their most recent board appointment, many
directors emphasized the importance of contacts through prior professional engagements:
I was approached through contacts that I had previously conducted business with
when they formed a new company and asked me to serve on the board.
I was asked by the Chief Financial Officer if I [was] interested in joining the board of
a private venture backed technology company that looked like it was going to go
public in the 1-2 year timeframe. I had come to know this CFO when he was the
CFO of another company where my firm was the auditor and I was the audit partner.
… I interviewed with the founder and the major investor and was asked to join the
board and chair the audit committee.
Other directors noted the role of social connections, with one director recalling that “[I
was] invited to stand for nomination by friends who were already board members,” while
another director reported that “[a] CEO friend begged me to accept it.”
As reported in Panel B of Table 6, relative to private board directors, public board
directors were more likely to be identified by an executive search firm (30-34% versus
13-16%). Public company common law directors were also less likely to be appointed to
represent a significant shareholder (13%) versus 29% for private common law directors,

20
37% for civil law public directors, and 41% for respondents at civil law private
companies.
The importance of social networks for identifying and appointing new directors
informs two questions that have been debated in the governance literature: whether
outside directors are independent, and whether there is a bias against the selection of
female board members. Director independence has long been viewed as critical if boards
are to play an effective role in monitoring executives (Hermalin and Weisbach, 2003).
Prior to the Enron and WorldCom scandals, the New York Stock Exchange required audit
committees to have at least one independent director, defined as a person having no
material financial or family ties to the company or management (other than through
director’s fees). The Sarbanes-Oxley Act, passed in response to those scandals, required
boards to have a majority of independent directors. Similar recommendations were
adopted in the U.K., Japan, and China, as they sought to improve corporate governance
practices.
A critical assumption underlying these legal requirements is that outside board
members with no financial or family ties to management are truly independent. Yet our
evidence suggests that a majority of the directors appointed to boards were known to and
presumably supported by the CEO, other executives, directors, and/or a major
shareholder, suggesting that there are potentially strong social connections. These social
ties between newly appointed directors and top managers may explain why respondents
rated their boards higher on providing counsel to the CEO than on monitoring and
succession planning, and explain why prior research finds that CEO replacements tend to
21
be accompanied by board turnover (see Hermalin and Weisbach, 2003 for a summary of
these studies).
Of course, appointees’ social connections do not necessarily bias directors towards
management. However, it might explain why prior studies that do not control for
directors’ social connections have found little clear evidence that outside director
representation on boards is associated with better CEO replacement decisions, responses
to takeover bids, value-enhancing acquisitions, executive compensation, or overall firm
performance (Bhagat and Black, 1999). In contrast, Hwang and Kim (2009) report that
boards with outside directors who have fewer social connections with the CEO (e.g.,
same alma mater, military service, regional origin, academic discipline and industry) pay
lower compensation that is more closely tied to performance.
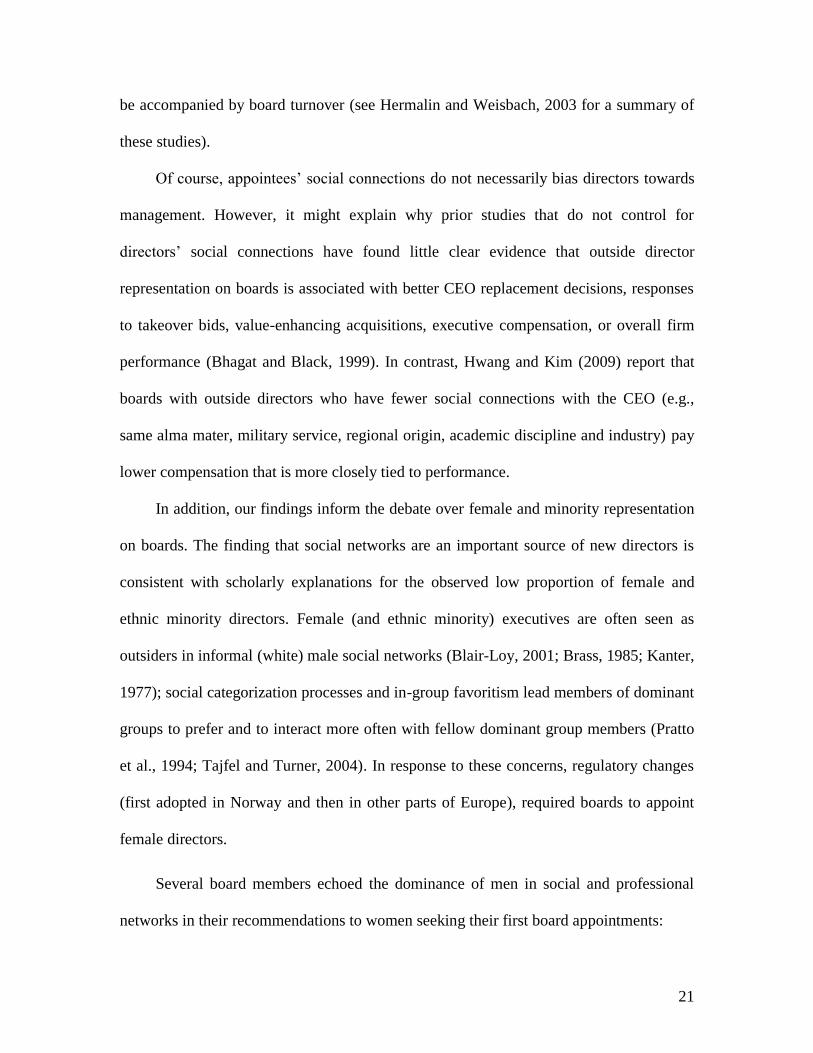
In addition, our findings inform the debate over female and minority representation
on boards. The finding that social networks are an important source of new directors is
consistent with scholarly explanations for the observed low proportion of female and
ethnic minority directors. Female (and ethnic minority) executives are often seen as
outsiders in informal (white) male social networks (Blair-Loy, 2001; Brass, 1985; Kanter,
1977); social categorization processes and in-group favoritism lead members of dominant
groups to prefer and to interact more often with fellow dominant group members (Pratto
et al., 1994; Tajfel and Turner, 2004). In response to these concerns, regulatory changes
(first adopted in Norway and then in other parts of Europe), required boards to appoint
female directors.
Several board members echoed the dominance of men in social and professional
networks in their recommendations to women seeking their first board appointments:
22
I think the path for a woman requires more work because business networks at the
board level are less available to women.
Meet all the (male) board members and board chairs you can, and nourish those
relationships. … they are the people who control the process.
Be sure to join networks that have men and women. There are still not enough women
to help you.
Other directors described how director recruitment processes differ for men and women
because of differences in how women are perceived and treated within social networks:
Men can do it through [their] network, women need to prove [their] ability through
qualifications or experience.
The process of attempting to join a board is not different for women and men, but the
outcomes are different because of unconscious as well as conscious bias. In most
cases, the desire to maintain the status quo in terms of board culture creates barriers
for women.
Women [need to] play within the boys’ club correctly.
Results reported in Panel C of Table 6 show that men appointed to the board were
significantly more likely to have been known to the CEO (27%) than women (22%), but
were no more likely to be known to other executives or board members, providing some
evidence that male-dominated social networks at the most senior levels helped men to
secure board seats. In addition, women candidates were significantly more likely to have
been recruited through an executive search firm (36%) than men (24%), suggesting that
firms seeking greater board diversity used search firms to generate a wider pool of
candidates than would emerge through social networks.
The use of executive search firms to increase diversity is also supported by
summary statistics reported in Panel D of Table 6. Boards with at least one female
director were more than twice as likely to recruit using an executive search firm than
boards with no female directors (32% versus 12%). Search firms were also more active in

23
recruiting directors for boards with greater diversity in ethnicities and nationalities. One
director advised that female directors should, “Stay in touch with executive search firms
that have expressed interest in you.” However, another survey respondent lamented the
limitations of search firms when she sought to join a board:
I connected with the CEO myself after a search firm told the Nominating and
Compensation [Committee] that “there were no qualified women available.” I have
over 30 years in the industry; I have already been a public company CEO; I have
extensive domain expertise in the area; and I am not the only woman with this
background in my industry, so the search firm did little work.
Overall, our findings suggest that male-dominated social networks may partially
explain the low frequency of women on boards. As a result, boards that appear to desire
greater director diversity are more likely to use search firms to expand director
recruitment efforts beyond the social networks of current management and directors.
4.2 Board Size
Research has suggested that large boards are less likely to be effective than small
boards because they are more likely to suffer from free-rider problems and become
symbolic rather than central to management oversight (Jensen, 1993; Lipton and Lorsch,
1992). Small boards, however, may lack the breadth of skills required to perform their
functions (Coles et al., 2008). Empirical research has sought to examine these hypotheses
by estimating the relation between board size and Tobin’s Q: Yermack (1996) finds
consistent evidence of a negative relationship between board size and firm value for a
sample of U.S. firms, and Eisenberg et al. (1998) come to the same conclusion in a
sample of small and midsize Finnish firms. Gertner and Kaplan (1996) examine the board
size of reverse-leveraged buyout firms, which they argue are more likely to have optimal
board sizes due to strong incentives to maximize shareholder value, and find that they
24
have smaller boards than typical public companies. Wu (2004) finds that board size
declines over the 1988-95 period and attributes some of the decline to pressure from
activist investors that publicly identify companies with poor corporate governance.
However, Hermalin and Weisbach (2003) argue that optimal board size is unlikely
to be constant across firms. For example, more complex firms are likely to require more
diversity of expertise to accomplish their functions, thus expanding optimal board size.
As a result, it is difficult to interpret the observed relation between board size and
performance. One director stated that determining the appropriate board size “requires a
structured approach. The relevant skills and competences should be listed, and members
with different profiles should be targeted.” Another recommended setting board size
“through a judicious combination of selection of the right profile of directors based on the
needs of the organization. This is a moving target and doesn’t necessarily remain static.”
To address the question of optimal board size, we asked survey respondents to
report the size of their board, and to also rate whether they thought their board size was
“too big,” “too small,” or “just right.” Panel A of Table 7 provides a summary of the size
of boards in our survey. The median board had 8 directors. The median public company
board in both common and civil law countries also had 8 directors, versus 7 for private
common law companies and 6 for private civil law peers. However, there is evidence that
board size varies markedly across companies: Boards at the first quartile have only six
members, and those at the third quartile have 10.
As reported in Panel B of Table 7, for our full sample, 86% rated their board’s size
as “just right,” whereas 5% viewed their board as “too small” and 9% “too big.” These

25
frequencies were similar for public and private company boards in common law and civil
law countries.
Conditional responses on optimal board size by actual board size is reported in
Panel C of Table 7. A comparable proportion of sample directors (roughly 90%) rated
boards with 5-6, 7-8, and 9-10 directors as about the right size, suggesting that either a
broad range of board sizes are equally efficient, or, as Hermalin and Weisbach (2003)
hypothesize, that optimal board size varies across firms. These findings could also imply
that directors are unable to determine whether changing board size would improve the
effectiveness of their boards.
In contrast, a disproportionate percentage of directors on the largest and smallest
sample boards perceived that their board size was sub-optimal: 21% of directors on
boards with only 1-4 directors rated their boards as being too small, whereas 27% of
directors on boards with more than 10 directors rated their boards as being too large.
However, one director emphasized that “Larger boards can be effective if you have
strong leadership and significant attention is paid to behavioral compatibility at the time
of recruitment. Leadership needs to be committed to ensuring that everyone has
airtime/contributes.”
Finally, Table 5 shows univariate correlations between board size, responses on
optimal board size and various ratings of board effectiveness. There was a modest
positive correlation between board size and ratings of the board’s effectiveness in
succession planning, and a negative relation between director perceptions that board size
was too large and ratings of overall board effectiveness and strategy oversight

26
effectiveness. But in general, there was little systematic evidence that either board size or
ratings of optimal board size were strongly correlated with ratings of board performance.
4.3 Director Busyness
Research on board composition has also examined the impact of so-called “busy”
directors. Directors who are actively employed in high-level jobs in addition to their
board directorships and those who hold multiple concurrent directorships may have
valuable experience to contribute to their boards, but competing demands may preclude
them from making the necessary time commitment (Adams et al., 2010). The net effect of
busy directors is ambiguous theoretically (Adams et al., 2010). However, empirical
studies have found that director busyness may be detrimental for board attendance and
valuation. Adams and Ferreira (2008) find that directors that hold more concurrent
directorships have lower attendance rates at board meetings, while Fich and Shivdasani
(2006) find that market-to-book ratios are lower among companies in which a majority of
directors hold more than two concurrent directorships. One survey respondent disparaged
the appointment of busy directors, stating: “I do not see how CEOs of Fortune 1,000
companies can effectively serve on boards, yet many do. There is no way they can run
their companies properly and put in 200 hours per outside board position.”
As reported in Panel A of Table 8, 15% of the members of the average sample
board were current CEOs, 41% current executives, and 33% retired CEOs/executives
(including those from the sample company). This composition differed across types of
boards. Forty-two percent of the members of public common law company boards were
retired CEOs/executives versus 25% for public civil law, 24% for private common law
and 15% for private civil law boards.
27
Evidence from univariate correlations in Table 5 show a weak negative relation
between director busyness and board effectiveness. Boards with more current executives
had moderately lower effectiveness ratings for CEO evaluation and succession planning.
In contrast, boards with more retired executives had somewhat higher effectiveness
ratings for CEO evaluations, succession planning, asset stewardship, and overall board
performance.
4.4 Board Diversity
As reported in Panel A of Table 8, female directors comprised 17% of the members
of the average sample board (equivalent to 1.4 members), ethnic minorities 7% (or 0.7
members), and non-home country citizens 17% (or 1.1 members). Civil law boards had
higher representation of foreign nationals as compared to common law boards, but other
demographics did not differ materially for public and private boards, or for boards from
common and civil law countries. As noted above, these low frequencies may be due to
reliance on social networks to identify new directors.
Despite the attention often paid to demographic diversity, most directors
emphasized the importance of a breadth of backgrounds, experiences, and perspectives
when asked to define diversity on a board:
All board members should bring a solid level of general business acumen, but they
also should bring certain special skills and/or experiences such as finance,
technology, banking, M&A, operations, international, general management, specific
industries, etc. These different skills and experiences give the board the diversity
needed to ensure [sic] there are different perspectives on the board. Gender,
minority and country of origin are part of this diversity, but only as they pertain to
diversity of skills and experiences.
Diversity of ideas, backgrounds and experience is more important than gender or
ethnic diversity -- although gender and ethnic diversity do contribute to diversity of
backgrounds and experience.
28
Range of backgrounds, experiences and styles leading to diverse inputs. However,
this is not as visible as gender and ethnicity.
In terms of skill diversity (reported in Panel B of Table 8), directors rated their
boards as having a moderate mix of perspectives and experiences (with a mean of 3.6 out
of 5), and 39% rated their boards 3 or lower on skill diversity. Public boards in both
common and civil law countries appeared to have stronger assessments of skill diversity
(33% and 38% rated 3 or lower respectively) than private boards in these jurisdictions
(48% and 49% respectively).
As reported in Table 5, the univariate correlations show little evidence that
demographic diversity was related to board effectiveness. However, the board’s diversity
of skills and experience was strongly positively correlated with all of the board
effectiveness ratings: overall effectiveness (=0.45), strategy alignment (=0.33), CEO
evaluations (=0.32), CEO succession planning (=0.22), and stewardship of company
assets (=0.35). Consistent with this finding, the directors we interviewed recognized the
importance of carefully selecting directors with diverse areas of knowledge and expertise.
One director summarized a sentiment that was typical among other respondents:
In my experience in selecting board members, finding the appropriate mix of
skills of different directors and combining them in the board is key to
guarantee depth and breadth.
5. Board Internal Dynamics
Research findings on the relationship between board internal dynamics and
effectiveness are mixed. Westphal (1999) argues that personal social ties and
relationships between C-level executives and directors critically impair the board’s
capacity to monitor executive performance. However, a counterargument is that close
relations between the CEO and board members can facilitate candor and the CEO’s

29
willingness to seek board advice for key actions, thereby enhancing the potential for
effective oversight on the part of the board (Adams and Ferreira, 2007; Westphal, 1999).
In addition, boards of directors share many of the characteristics of other
organizational teams, and their effectiveness is likely to be driven by many of the same
factors documented by prior academic research on teams (Edmondson et al., 2003;
Hackman and Morris, 1975; Wageman et al., 2005). Hackman (2002) argues that a
team’s effectiveness (defined as the degree to which the team’s decisions and output
enhance organizational performance) is a function of its members’ commitment to
implementing team decisions, their willingness to work together in the future, and the
extent to which team processes meet members’ growth and satisfaction needs.6 Given the
high status and power of many individual board members, egos and competition for local
status may impede the group’s ability to collaborate, and thereby hamper the ability of
these boards to operate as effective teams (Groysberg et al., 2011).
Although prior studies argue that board effectiveness is likely to be affected by
boardroom dynamics (Adams et al., 2010), data limitations have made it difficult to
examine this factor in any systematic manner, a limitation that our survey and interviews
sought to address. In our interviews, directors described a variety of practices designed to
reinforce strong communication and internal dynamics with the CEO and between
directors:
We have developed a culture of discussing issues with the CEO present in the first
part of the executive session, which tends to get concerns out on the table while he is
there to respond to them, rather than engaging in protracted discussions in session
without him. The CEO then leaves the session, the independent directors meet by
themselves, and then we ask the CEO to return to the session so we can give him
feedback or additional questions based on the independent directors’ private
6
This definition has been widely used by in the teams literature (eg., Banker et al., 1996; Groysberg et al.,
2011).

30
discussions. This means that the board’s messages to the CEO get stated with
everyone present, rather than relying on the lead director’s sole translation to the
CEO in private after the session.
The CEO also calls and meets with each director at least every quarter and when
there are important developments.
[We] consistently start and end each meeting with executive sessions so they raise no
red flags and are part of the routine. Sometimes we have major issues to discuss and
sometimes we don’t, but it sets the right tone and is very important to have discussion
time without executives present from the management team.
Another director attributed his board’s strong internal dynamics to “open, candid
conversation conducted by [a] chair that encourages participation” who “goes around the
table to solicit final comments from each director” at the end of each meeting.
Quantitative survey questions covered a wide range of topics, including whether the
board performed effectively as a team, the CEO’s communication and consultation with
the board, how the CEO-board relationship set the tone for the company, whether or not
board discussions were candid, if they felt their own voice was heard, if they enjoyed
serving on the board, and the effectiveness of executive sessions. Responses are
summarized in Table 9.
For all but one of these questions, more than 80% of respondents gave ratings of 4
or 5 out of 5 (see Panel A). This is probably not surprising to scholars who argue that
market forces and activist investors help ensure that boards operate effectively on behalf
of shareholders (Fama and Jensen, 1983; Jensen and Meckling, 1976; Shleifer and
Vishny, 1997). For those who contend that frictions prevent ineffective boards and
directors from facing market discipline (Bebchuk, 2009), the positive responses likely
reflect over-confidence by directors, or, worse, capture by the CEO.

31
The responses for public and private boards, however, suggest that there was
systematic variation among directors in their ratings of internal processes. Ratings for the
internal dynamics of common law public boards were stronger than for civil law public or
private boards (see Panel B). For example, public common law directors gave fewer
ratings of 3 or below than private board directors on questions about teamwork (10%
versus 16-21%), candor of board discussions (8% versus 11-16%), feeling in sync with
other board members (10% versus 15-20%), and executive session effectiveness (17%
versus 32-40%).
As reported in Table 5, several of the measures of internal board dynamics were
strongly positively associated with ratings of board effectiveness. For example, univariate
correlations with various performance ratings ranged from 0.26 to 0.75 for board
teamwork, 0.26 to 0.64 for CEO communication with the board, and 0.27 to 0.68 for the
tone of CEO/board relationship, all economically and statistically significant.
6. Board Internal Governance
Market forces, pressure from activist and institutional investors, the regulatory
environment, and other factors can induce boards to adopt and maintain various internal
governance measures (Fama and Jensen, 1983; Shleifer and Vishny, 1997; Wu, 2004).
While some information on boards’ internal governance, such as meeting attendance, can
be collected through proxy statements and other disclosures (Adams and Ferreira, 2008),
most internal governance mechanisms are not publicly observable. To explore differences
in internal governance practices across boards, our survey asks directors to report on
governance practices such as training for new directors, number of meetings,
preparedness for meetings, clear guidelines for acceptable (and unacceptable) behavior,

32
whether agenda topics reflected the board’s priorities, and the board’s use of self-
assessments and handling of poorly performing directors. Table 10 reports summary
statistics on the responses to these questions.
6.1 Training New Directors
Survey responses reveal wide variation in the training of new directors. As reported
in Panel A of Table 10, only half of our respondents rated their boards a 4 or 5 (out of 5)
on this dimension. Panel B indicates that these ratings were even lower for public boards
in civil law countries (44%) and private boards in common and civil law countries (37%
and 28% respectively). Yet, as reported in the univariate correlations in Table 5, ratings
of training for new directors were strongly positively correlated with all of the board
effectiveness ratings: overall effectiveness (=0.40), strategy alignment (=0.29), CEO
evaluations (=0.34), CEO succession planning (=0.31), and stewardship of company
assets (=0.30).
6.2 Meeting Governance
On average, boards in our sample met 6.7 times per year, and directors reported that
mean attendance rates at these meetings was 95%. Directors reported that on average they
allocated 155 hours per year to the board. As reported in Panel B, the frequency and
attendance of meetings for public and private boards, and for boards in civil law and
common law countries were similar. However, directors of public common law boards
reported spending 16% more hours per year on board activities (176.5 hours) than public
civil law board members (151.9 hours), 41% more than private common law board
directors (125.2 hours), and 50% more than private civil board members (117.5 hours).

33
Survey respondents typically considered directors on their board to be well prepared
for meetings and that meeting agendas reflected the board’s priorities (both questions had
means of 4.2). Directors of highly-rated boards reported disseminating agendas well in
advance of meetings and circulating “thorough, well-compiled and timely board papers
that all directors read thoroughly prior to meetings” so that directors were aware of all
agenda items and could address simpler issues and questions via email or phone calls
prior to meeting in person. One director described how meeting agendas were planned
and structured:
The board meetings are well structured. The agenda is 60% fixed (macro review,
financial review, audit comm. reports, etc.). The board materials are distributed to
the members 3 days prior to the meeting. All members come prepared to the meetings.
At each board meeting 2 to 3 different subjects are discussed.
There was also typically clarity on acceptable and unacceptable director behavior
(mean of 4.0), with public common law boards (mean of 4.1) rated somewhat higher than
public civil law, private common law and private civil law boards (means of 3.9, 3.8, and
3.9 respectively, see Panel B).
As univariate correlations reported in Table 5 indicate, two meeting governance
variables were strongly correlated with ratings of board effectiveness. Director
preparedness for meetings had correlations with various measures of board effectiveness
that ranged from 0.23 to 0.51, and clarity on acceptable board behaviors had estimates
that ranged from 0.24 to 0.48. There was little evidence that the number of board
meetings per year was correlated with board performance, and weak evidence of a
positive correlation between meeting attendance rates and board performance.
34
6.3 Self-Assessments
Effective boards are believed to develop processes for assessing board performance
and screening out non-contributing directors where needed (Forbes and Milliken, 1999).
To assess board performance, sample directors favored tracking financial and operational
results, customer and employee evaluations, voting patterns at meetings, and using
externally-managed evaluations. The decision to employ a self-assessment, and whether
it is conducted internally or through external advisors, is likely to be endogenous. Table
10 reports summary statistics on responses to quantitative survey questions on board
assessments. Sixty-eight percent of boards in our sample tracked decisions over time to
assess their effectiveness. This proportion was highest for public common law boards
(71%) and lowest for private civil law boards (60%).
In addition, 70% of the sample directors responded that their boards had regular
performance evaluations. Most conducted their reviews internally; only 33% used an
external advisor to oversee the board assessment. Many directors noted that their
assessments included feedback provided by other board members, executive
management, and occasionally leading shareholders. The use of board assessments was
markedly higher for public boards (84% and 75% in common and civil law countries
respectively) than private boards (47% and 42%, see panel B).
Despite the widespread use of board assessments, our findings suggest that many
boards struggle with addressing poorly performing directors. Only 54% of the sample
directors believed that their boards had effective means of dealing with poorly
performing directors; although this proportion was higher for boards that conducted
assessments (60%) than for those that did not (40%); and for public common law boards

35
(60%) than for public civil law, and private common and civil law boards (49%, 48% and
45% respectively).
Several interviewees explained how they managed poorly performing directors,
noting the critical roles of board leaders in these situations:
If I was uncomfortable with a director’s performance, I would go to the lead director
and tell him what’s going on--for example, this director is missing meetings or
doesn’t seem to be doing his homework. The lead director would then talk to the
person and find out what’s going on. Because we have directors who have a history
of being extremely reliable, we make the assumption that something else must be
going on and we need to understand what that is.
When I was Chairman of a board, we had a couple of directors who just weren’t
performing. I went to them and said: Here are the problems we’re seeing, and if you
can’t correct these things, then we really think you should resign from the board. In
both instances, they became very upset and resigned. But it was a very
straightforward conversation. … In some cases, people respond to that, and in some
cases, they just get mad and quit. I’ve seen both happen.
Using external advisors to conduct assessments did not appear to enhance the
ability of boards to address poorly performing directors. Among boards that conducted
assessments, the percentage of respondents who rated their boards as effectively
addressing poorly performing directors was identical for reviews conducted by external
advisors and internally (33%, see Panel C). As one director explained:
[I’m] not really big on individual assessment by each person. [We] have this on one
board, and the range of differences is too small to make it valuable. [It] only works if
there is a clear outlier who is not effective.
Our finding that most boards (particularly in public companies) conducted internal
assessments, yet almost half were not able to effectively address poorly performing
directors suggests that many of these assessment processes are not being utilized as tools
for improving director performance. This may occur if boards are adopting cursory
assessment processes solely to safeguard against legal liability and scrutiny from

36
investors and proxy advisory firms, or if they are not assessing standards that can serve as
the basis for concrete improvements (National Association of Corporate Directors, 2012;
West, 2002).
Table 5 shows that the univariate correlations between various ratings of board
effectiveness and the use of self-assessments range from 0.14 to 0.24. Reviews were
conducted by 79% of the most effective boards in our sample, compared to only 57% of
the least effective. More effective boards were also more likely to use an external advisor
to conduct their assessments, suggesting that external parties are not primarily used to
increase credibility and build acceptance among poorly functioning boards. The
relationship between board effectiveness and use of self-assessment could indicate that it
is easier for well-functioning boards to build the consensus required for such reviews, or
that reviews themselves help to create effective boards.
Taken together, our results indicate that processes for monitoring and improving
board effectiveness, such as assessments and procedures for tracking decisions, tend to be
used more frequently by boards that already operate at a high level.
7. Multivariate Analysis
There were strong univariate correlations between ratings of board effectiveness,
board size and composition, internal dynamics, and board governance. For example, as
reported in Table 5, there was a strong positive relationship between how well the board
functions as a team and several of the other ratings of boardroom dynamics and
governance: the tone of the CEO/board relationship (ρ=0.59); director preparedness for
meetings (ρ=0.50); clarity of acceptable director behavior (ρ=0.49); the CEO’s
communication with the board (ρ=0.49); and the mix of members on the board (ρ=0.43).
37
The tone of the CEO/board relationship was also positively correlated with many of these
same measures: the CEO’s communication with the board (ρ=0.76); director
preparedness for meetings (ρ=0.42); and clarity of acceptable director behavior (ρ=0.40).7
Finally, univariate correlations show a strong positive relation between lagged firm
performance and ratings of board effectiveness, consistent with directors correctly or
incorrectly attributing strong firm results to the performance of the board.
We therefore use a multivariate model to estimate the relationship between director
perceptions of various measures of board effectiveness, and their ratings of board size
and composition, internal dynamics, and internal governance. To ensure that the board
effectiveness estimates do not simply reflect firm performance, we control for survey
respondent ratings of the firm’s performance over the prior 36 months in our multivariate
analysis. Given the lack of any well-specified theory on the determinants of board
effectiveness, we consider our analysis to be exploratory in nature rather than testing
specific hypotheses. Estimates for ordered probit models, which allow for the ordinal
nature of the dependent variable ratings, are reported in Table 11.8
7.1 Board Size and Composition
We find a curvilinear (inverted U-shaped) relationship between board size and
ratings of overall board effectiveness and succession planning. However, as Hermalin
and Weisbach (2003) point out, these estimates are difficult to interpret given potential
7 To examine how these correlations affect the subsequent reported regression findings, we compare model
estimates after excluding ratings of the how the board performs as a team, the tone of the CEO/board
relationship, and the clarity of acceptable director behavior. These exclusions increase the weight attached
to the highly correlated included variables, but the findings for other variables are similar to those reported
below. 8 We also estimate a probit model in which ratings below 3 are classified as weak board effectiveness, and
ratings of 4 and 5 as strong effectiveness. The findings (unreported) are very similar to those reported in the
paper.
38
variation in optimal board size. The main size variables examined are therefore ratings of
whether board size is “too big” or “too small.” Boards rated as “too big” were associated
with a lower effectiveness in CEO succession planning, but none of the estimates for
other measures of effectiveness were significant or meaningful, suggesting that non-
optimal board size is not a critical factor in explaining director perceptions of board
effectiveness.9
Estimates reported in Table 11 also indicate that director busyness and board
demographic diversity are generally unrelated to ratings of board effectiveness. Boards
with a higher proportion of retired executives serving as directors were associated with
lower alignment between the CEO and board on vision and strategy, and higher ratings of
asset stewardship, while the proportion of directors who are current non-CEO executives
(of the focal company or other companies) was negatively associated with the
effectiveness of CEO evaluations. None of the other busyness or demographic diversity
variables were strongly associated with measures of board effectiveness.
However, the mix of skills and experiences of directors was an important
explanatory variable for all of the effectiveness ratings except succession planning. An
increase in the ratings of the mix of directors’ skills and experiences from 2 to 4 (on a 1-5
scale) increased the probability that overall board effectiveness was rated at 5 from 24%
to 39%, holding other variables at their mean values. The lack of a statistically significant
relationship between diversity in directors’ skills and experiences and succession
planning (as well as the weakly significant relationship with the effectiveness of CEO
9 To further assess whether suboptimal board size is related to board performance, we estimate the model
replacing the optimal board rating with two dummy variables. The first takes the value one for boards with
more than 10 members where respondents rated the board as “too big,” and zero otherwise. The second
takes the value one for boards with less than 5 members where respondents rated the board as “too small,”
and zero otherwise. The estimates for these variables were statistically insignificant.

39
evaluations) suggests that a diverse mix of director skills contributes positively to the
board’s ability to provide advice to the CEO, but is less important in explaining the
board’s ability to monitor the CEO.
7.2 Board Internal Dynamics
Several measures of internal board dynamics were positively related to ratings of
board effectiveness. Ratings of the board’s performance as a team were related to overall
board performance ratings as well as to ratings of all specific board functions (strategy
alignment, CEO evaluations, CEO succession planning, and asset stewardship). An
increase in ratings of board teamwork (from 2 to 4) increased the probability that overall
board effectiveness was rated at 5 from less than 1% to 26% (holding other variables at
their mean values), suggesting that director teamwork has an economically significant
impact on perceptions of board effectiveness.
Ratings of CEO communications with the board were related to overall
effectiveness ratings as well as ratings of all specific board functions except for CEO
succession planning. An increase in ratings of CEO communication and consultation with
the board from 2 to 4 increased the probability of a 5 rating for overall board
effectiveness from 21% to 35%. In addition, ratings of whether the relationship between
the CEO and board set the right tone for the organization were related to overall board
effectiveness, and to effectiveness in all four specific board functions. An increase in
ratings of the tone of the CEO-board relationship from 2 to 4 increased the likelihood that
overall board effectiveness was rated 5 from 13% to 34%.
The importance of the board’s interactions and relationship with the CEO and
senior executives was widely discussed by survey respondents. As the following quotes

40
reveal, directors judged the relationship as healthy when their board felt comfortable
challenging the CEO and senior management:
This board is highly engaged and not averse to challenging management. We
identify weaknesses and then ensure controls are put in place and evidenced.
This board holds the executives accountable for strategy implementation.
However, many directors observed that their boards were not able to effectively hold
management accountable for firm performance:
We have not been effective in dealing with a highly aggressive CEO.
Our board has been too slow to move on poorly performing CEOs.
We put too much trust in [the] CEO and management team.
7.3 Board Internal Governance
The estimates in Table 11 show that several measures of internal board governance
were associated with ratings of board effectiveness. Director preparedness for meetings
was significantly related to overall board effectiveness ratings, as well as effectiveness in
asset stewardship. The likelihood that directors assigned the top board effectiveness
rating of 5 was only 18% when director preparedness was rated 2, versus 34% when it
was rated 4. Several directors we interviewed specifically commented on the importance
of preparation for board meetings and of holding directors accountable for preparation:
To have an effective board you need diligence and active participation by all the
directors. It’s so important to do the work. It sounds so basic, but what you don’t
want is a director who shows up who hasn’t even read the material or who falls
asleep or spends all of the meeting with his Blackberry under the table texting.
You’ve got to have board members who are paying attention, who are prepared,
and who are active participants. To be effective, you have to have a fully engaged
board.
The most effective boards I’ve been on hold board members accountable to do
our homework, to attend the board meetings and to be actively engaged.
41
Clarity around acceptable (and unacceptable) board behaviors was positively related
to the board’s overall effectiveness, and its effectiveness in CEO evaluations and asset
stewardship. When clarity around acceptable board behaviors was rated as 2, the
likelihood of an overall board effectiveness rating of 5 was 25%, versus 36% when
clarity around behavior was rated 4.
Finally, several ratings of board effectiveness were related to the use of annual
assessments and follow-up with poorly performing directors. Annual assessment usage
was positively associated with CEO evaluation and succession planning ratings. The
likelihood that boards with annual assessments were rated 5 on the effectiveness of CEO
evaluations was 11%, compared to 7% for boards that did not conduct assessments
(holding other variables at their mean values); and 51% of boards that conducted annual
assessments reported also having effective CEO succession planning practices as
compared to 44% for boards with no assessments. These findings suggest that boards’
evaluative capabilities for both directors and CEOs are related and relatively distinct from
other board capabilities.
Ratings of the board’s ability to successfully address poorly performing directors
was related to ratings of overall board effectiveness and three of the four specific
functions rated (CEO evaluations, CEO succession planning, and stewardship of
company assets). The likelihood that boards that did not effectively address poorly
performing directors were rated 5 on overall board effectiveness was 30%, versus 41%
for boards that effectively addressed these directors.

42
7.4 Estimates for Public/Private and Common Law/Civil Law Boards
The main model includes controls for whether the board is a public common or civil
law company, and whether it is a private common or civil law firm. The estimates for
these variables are largely insignificant, indicating that univariate differences in board
effectiveness across legal systems and listing status are primarily explained by
differences in board size and composition, internal dynamics, and internal governance
rather than listing status and legal systems per se.
In addition, we re-estimate the models separately for these four types of boards. The
findings (unreported) are generally consistent with those reported above. However,
associations between board effectiveness in CEO succession planning and board size and
composition, internal dynamics, and internal governance variables are notably stronger
for public common law boards.
Finally, given the coarseness of the common law/civil law country breakdown, we
re-estimate the main model including country fixed effects using data for all countries
with more than 25 usable observations. The findings (unreported) are consistent with and
very similar in magnitude to the full sample analysis.
8. Board Effectiveness and Actual Performance
One limitation of our use of ratings of board effectiveness is that they reflect
director perceptions of board performance, rather than the board’s actual performance
and actions. A natural follow-up question is whether directors’ perceptions of board
performance are reflected in future financial performance or other outcomes for their
firms. Graham et al. (2017) find that senior executives believe that effective boards

43
influence culture, and hence performance, indirectly by setting the tone at the top and
appointing the CEO.
To examine whether ratings of board effectiveness are related to subsequent firm
outcomes, we estimate the associations between effectiveness ratings and a variety of
performance and outcome measures for the subset of sample firms identified by
respondents. The findings of these tests are difficult to interpret for several reasons. First,
they are subject to selection bias since the respondents voluntarily opted to disclose their
company’s name. These firms are typically larger, and have higher ratings of board and
prior firm performance than firms not identified. Second, they are subject to the
endogeneity concerns discussed extensively in the governance literature. And finally, we
have only a small number of such observations (111 at most) to conduct the tests,
reducing their power. As a result, we interpret the findings with caution.
Our measures of future performance include traditional financial returns (ROS,
ROA, and ROE for the subsequent two years), risk measures (losses, impairments or
write-offs, discontinued operations, restatements, lawsuits, reduced corporate guidance,
dividend decreases, auditor changes, bankruptcy or auditor going concern opinions,
special/extraordinary shareholder meetings, filing delays, and activist letters to the
company over the subsequent two years), as well as CEO compensation and turnover
metrics (percent of compensation based on stock, excess compensation, and CEO
replacements with outsiders, again for the next two years).
Several ratings of specific board responsibilities are correlated with relevant
variables of interest. For example, boards with weak vision and strategy alignment with
the CEO are more likely to report goodwill impairments after the survey was conducted,
44
consistent with such firms making unwise acquisitions. Boards with weaker CEO
succession planning ratings are more likely to appoint a new outside CEO following poor
financial performance, suggesting that they have not groomed potential internal
candidates. And boards with weak ratings of CEO evaluations use a lower proportion of
stock-based remuneration for CEO compensation, suggesting that they have weaker
incentives in place.
Nonetheless, as noted above, there is reason to interpret these results cautiously.
The results are likely to be affected by selection bias and, given the small sample size, we
control for only a small number of potentially confounding variables. Finally, given the
large number of variables considered through separate statistical tests, the number of
significant correlations we find could be attributable solely to chance (Bettis, 2012;
Goldfarb and King, 2016).
9. Conclusions
Recent events have highlighted the importance of improving the effectiveness of
corporate boards. Existing research primarily addresses this challenge indirectly: by
focusing on how externally observable characteristics of boards affect firm profitability
and board actions. Meanwhile, corporate governance rating firms and proxy advisory
firms (and consequently, many investors) rate board effectiveness by comparing
companies’ governance practices against rules and corporate governance benchmarks
using an algorithmic approach (Daines et al., 2010; Larcker et al., 2013). Our study
explores the drivers of board effectiveness by directly surveying directors about their
perceptions of their boards’ inner operations and overall performance. We make three
main contributions. First, we provide insight into directors’ perceptions of their boards’
effectiveness in a variety of activities. Next, we document the variation in the inner

45
workings of boards with respect to size and composition, internal dynamics, and internal
governance. Lastly, we use directors’ views about their boards to identify the factors
most strongly related to board effectiveness and use these findings to offer suggestions to
inform future research.
Directors responding to our survey rated their boards as performing highly. On most
questions on board effectiveness, 80% or more rated their performance as 4 or 5 out of 5.
The lowest-rated board functions were for CEO evaluations and CEO succession
planning. Although these results confirm findings of prior research that boards place
more emphasis on providing counsel to the CEO than on monitoring, they suggest that
recent regulatory changes designed to enhance the board’s monitoring role, and the
increased pressure to monitor management provided by activist investors have been less
than effective.
The broad range of companies included in our survey sample allows us to expand
upon previous empirical findings that primarily focus on large, publicly-traded firms in
the United States. We find that public boards, particularly those in common law
countries, consistently outperform private boards (in both common and civil law
jurisdictions) across various board functions. Directors of public common law companies
tend to be older and more experienced, and internal dynamics and internal governance
practices on their boards are typically rated higher.
Our findings on new director appointments indicate that social networks of
company executives and board members play an important role in identifying new
directors. This has several implications. First, it raises questions about how to judge the
real independence of many directors. Second, it potentially explains the limited
46
demographic diversity of most boards. Boards with no female, minority, or foreign
directors were more likely to use the CEO’s social network to identify new directors,
whereas boards with one or more female, minority or foreign directors, were more likely
to use executive search firms to identify qualified candidates.
Tools for improving board effectiveness (e.g., self-assessments and tracking the
effectiveness of decisions over time) were primarily used by boards that already
performed well, and utilized less by poorly performing boards. However, whether this
finding reflected cross-sectional variation in adoption of best practices, agency problems
across boards, or some other form of endogeneity in board decisions on governance
practices is unclear.
Multivariate findings indicate that director perceptions of board effectiveness, both
overall and in fulfilling specific functions, were related to board composition (notably the
mix of directors’ skills and experiences), internal board dynamics (such as the board’s
ability to operate as a team rather than a collection of talented individuals, the extent to
which the CEO communicates and consults with the board, and the tone for the company
set by the board and CEO), as well as board governance factors (such as director
preparedness for meetings, its use of regular assessments, and its ability to deal with
poorly performing directors). We find little evidence that board effectiveness perceptions
were related to optimal board size, demographic diversity, the busyness of directors,
meeting attendance rates, or training for new directors. For the small sample of responses
where the company name was disclosed, we find some evidence that ratings of specific
board functions are related to relevant subsequent outcomes. However, given the
potential selection bias and low power of the tests, we interpret these finding cautiously.

47
Based on these findings, we have several suggestions for future research on board
effectiveness. First, given the large differences in board characteristics and board
performance that we document between public/private boards and common/civil law
boards, researchers should exercise caution when extrapolating from the many studies
that focus only on publicly-traded firms in the United States.
Second, we identify several factors that directors perceive to be strongly associated
with board effectiveness, and therefore deserve greater consideration in empirical
research on board performance. Due to the influence of social and professional networks
in recruiting new directors, identifying directors that were appointed by the current CEO
(e.g., Core et al., 1999) may offer more power in explaining director behavior than
categorizing directors as insiders or outsiders. Additional research that examines
directors’ social and educational ties could also help us understand how these connections
influence director behavior (e.g., Cohen et al., 2008, 2010).
Our results suggest that directors associate greater diversity in directors’ skills and
experiences, rather than demographic diversity, with board effectiveness. Measuring
director diversity in terms of functional backgrounds and other prior experiences using
data sources such as BoardEx, LinkedIn, or financial filings could provide deeper insights
than relying solely on measures of demographic diversity (see, e.g., Anderson et al.,
2011; Zajac and Lungeanu, 2016 for novel approaches to measuring heterogeneity in
director experiences). Finally, the strong associations we find between the internal
dynamics of boards and directors’ perceptions of board effectiveness reinforce findings
from small sample field studies, and suggest that research that delves into quantifying
these dynamics remains a fruitful area of future inquiry (see Westphal, 1999; Westphal

48
and Stern, 2007; Westphal and Zajac, 1995 for examples of how boardroom dynamics
have been measured on a large scale).
We conclude by acknowledging the limitations and exploratory nature of our study.
Survey analyses are subject to questions about respondent bias, subjectivity, and
generalizability. We recognize these concerns, but note that, by eliciting views of
practitioners with considerable experience serving as directors, the survey responses and
interviews used in this paper can provide rare insights into the internal operations of
boards that otherwise would not be available. Our study complements existing empirical
studies that have “left the [inner] working of the board as a black box” (Adams et al.,
2010, p. 86), and offers suggestions for future work that can continue to advance our
understanding of boards as “dynamic social systems” (Lorsch, 2017, p. 45).

49
Table 1
Sample composition
2012 2015 Total
Author mailing 3,298 52,098 55,396
Search firm mailing 5,932 23,844 29,776
Less: undeliverable messages 1,159 13,390 14,549
Total survey sample 8,071 62,552 70,623
Responses 879 3,886 4,765
Response rate 10.9% 6.2% 6.7%
Usable responses 511 1,879 2,390
Usable response rate 6.3% 3.0% 3.4%
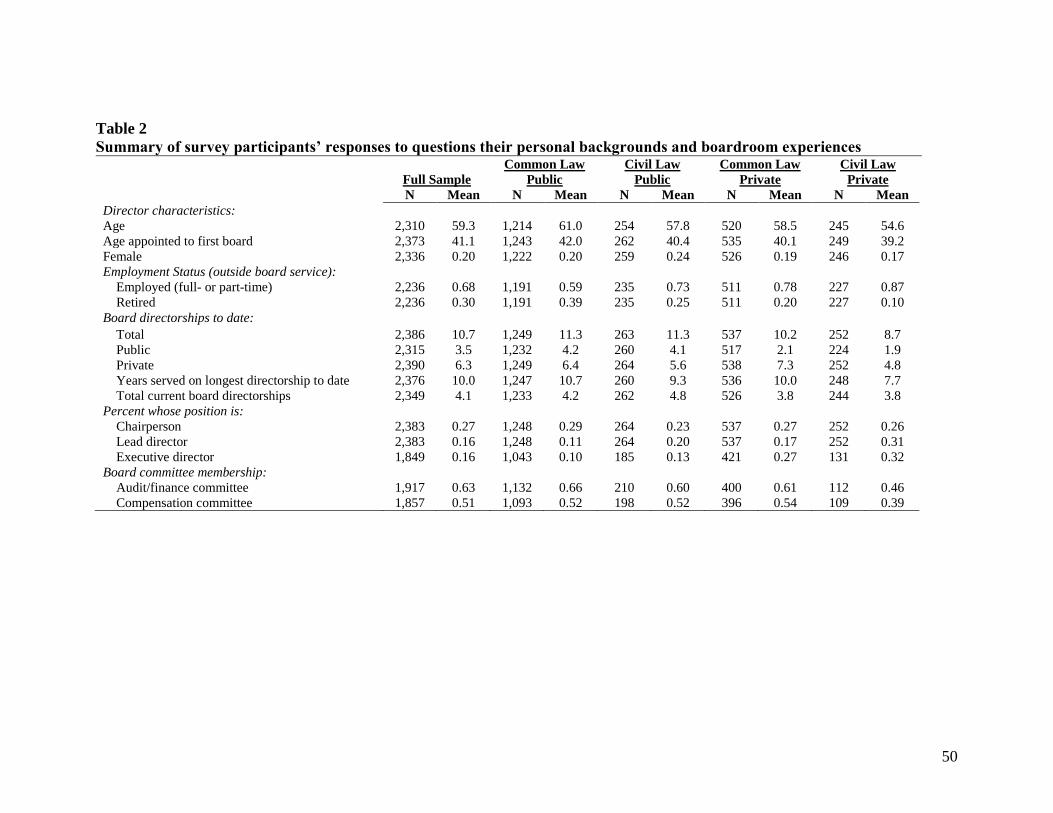
50
Table 2
Summary of survey participants’ responses to questions their personal backgrounds and boardroom experiences
Full Sample
Common Law
Public
Civil Law
Public
Common Law
Private
Civil Law
Private
N Mean N Mean N Mean N Mean N Mean
Director characteristics:
Age 2,310 59.3 1,214 61.0 254 57.8 520 58.5 245 54.6
Age appointed to first board 2,373 41.1 1,243 42.0 262 40.4 535 40.1 249 39.2
Female 2,336 0.20 1,222 0.20 259 0.24 526 0.19 246 0.17
Employment Status (outside board service):
Employed (full- or part-time) 2,236 0.68 1,191 0.59 235 0.73 511 0.78 227 0.87
Retired 2,236 0.30 1,191 0.39 235 0.25 511 0.20 227 0.10
Board directorships to date:
Total 2,386 10.7 1,249 11.3 263 11.3 537 10.2 252 8.7
Public 2,315 3.5 1,232 4.2 260 4.1 517 2.1 224 1.9
Private 2,390 6.3 1,249 6.4 264 5.6 538 7.3 252 4.8
Years served on longest directorship to date 2,376 10.0 1,247 10.7 260 9.3 536 10.0 248 7.7
Total current board directorships 2,349 4.1 1,233 4.2 262 4.8 526 3.8 244 3.8
Percent whose position is:
Chairperson 2,383 0.27 1,248 0.29 264 0.23 537 0.27 252 0.26
Lead director 2,383 0.16 1,248 0.11 264 0.20 537 0.17 252 0.31
Executive director 1,849 0.16 1,043 0.10 185 0.13 421 0.27 131 0.32
Board committee membership:
Audit/finance committee 1,917 0.63 1,132 0.66 210 0.60 400 0.61 112 0.46
Compensation committee 1,857 0.51 1,093 0.52 198 0.52 396 0.54 109 0.39

51
Table 3
Summary data on sample firm characteristics
Panel A: Sample boards by listing status and ownership
Freq. Percent
Publicly owned 1,547 0.65
Family owned (public) 73 0.05
Privately owned 816 0.35
Family owned (private) 176 0.22
Panel B: Sample boards by industry
Full Sample Public Private
Freq. Percent Freq. Percent Freq. Percent
Consumer Discretionary 264 0.12 157 0.11 104 0.13
Consumer Staples 118 0.05 69 0.05 49 0.06
Energy & Utilities 252 0.11 198 0.13 52 0.07
Financial & Professional
Services 627 0.28 386 0.26 233 0.30
Healthcare 274 0.12 171 0.12 99 0.13
IT & Telecom 272 0.12 170 0.12 101 0.13
Industrials 290 0.13 193 0.13 96 0.12
Materials 173 0.08 134 0.09 38 0.05
Total 2,270 1.00 1,478 1.00 772 1.00
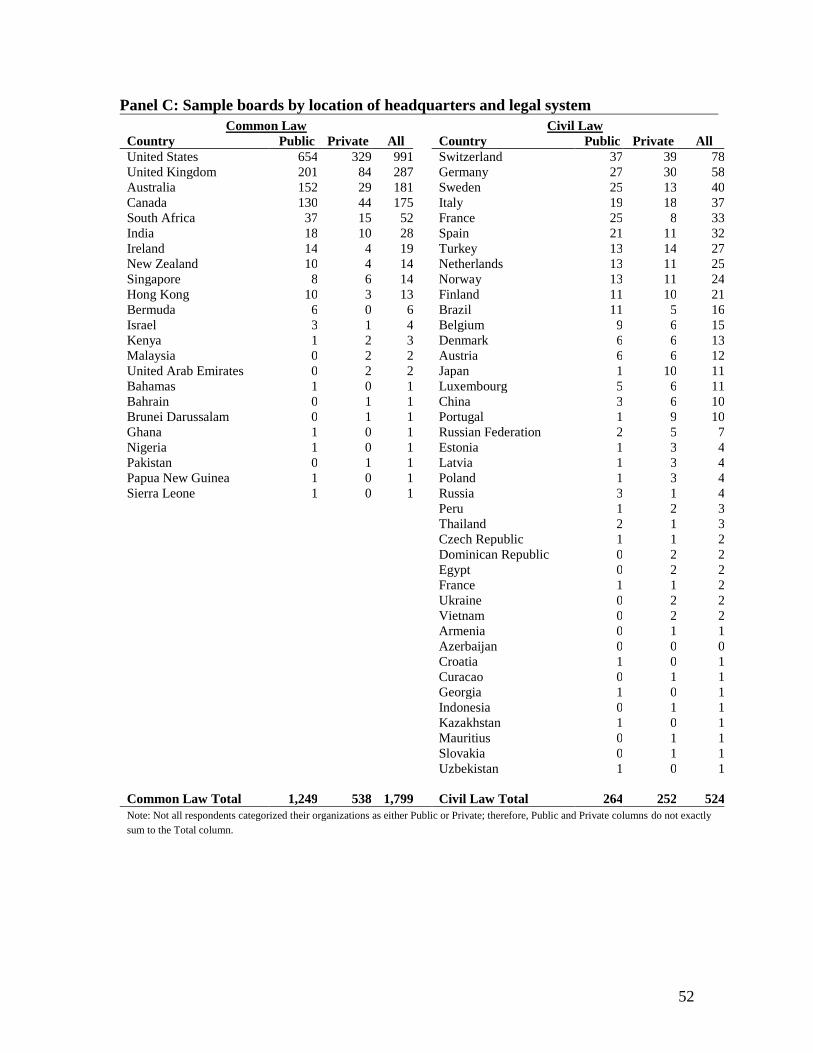
52
Panel C: Sample boards by location of headquarters and legal system
Common Law Civil Law
Country Public Private All
Country Public Private All
United States 654 329 991
Switzerland 37 39 78
United Kingdom 201 84 287
Germany 27 30 58
Australia 152 29 181
Sweden 25 13 40
Canada 130 44 175
Italy 19 18 37
South Africa 37 15 52
France 25 8 33
India 18 10 28
Spain 21 11 32
Ireland 14 4 19
Turkey 13 14 27
New Zealand 10 4 14
Netherlands 13 11 25
Singapore 8 6 14
Norway 13 11 24
Hong Kong 10 3 13
Finland 11 10 21
Bermuda 6 0 6
Brazil 11 5 16
Israel 3 1 4
Belgium 9 6 15
Kenya 1 2 3
Denmark 6 6 13
Malaysia 0 2 2
Austria 6 6 12
United Arab Emirates 0 2 2
Japan 1 10 11
Bahamas 1 0 1
Luxembourg 5 6 11
Bahrain 0 1 1
China 3 6 10
Brunei Darussalam 0 1 1
Portugal 1 9 10
Ghana 1 0 1
Russian Federation 2 5 7
Nigeria 1 0 1
Estonia 1 3 4
Pakistan 0 1 1
Latvia 1 3 4
Papua New Guinea 1 0 1
Poland 1 3 4
Sierra Leone 1 0 1
Russia 3 1 4
Peru 1 2 3
Thailand 2 1 3
Czech Republic 1 1 2
Dominican Republic 0 2 2
Egypt 0 2 2
France 1 1 2
Ukraine 0 2 2
Vietnam 0 2 2
Armenia 0 1 1
Azerbaijan 0 0 0
Croatia 1 0 1
Curacao 0 1 1
Georgia 1 0 1
Indonesia 0 1 1
Kazakhstan 1 0 1
Mauritius 0 1 1
Slovakia 0 1 1
Uzbekistan 1 0 1
Common Law Total 1,249 538 1,799
Civil Law Total 264 252 524
Note: Not all respondents categorized their organizations as either Public or Private; therefore, Public and Private columns do not exactly
sum to the Total column.

53
Table 4
Summary of survey participants’ responses to questions on board effectiveness across various functions (questions with 1-5
rating scale)
Panel A: Unconditional responses for all boards
N Mean % 1-3 % 4-5
Overall, this is an effective board 2,390 4.25 0.12 0.88
CEO and board aligned on vision and strategy 2,367 4.10 0.16 0.84
Board effectively evaluates the CEO 2,368 3.56 0.44 0.56
Board has effective CEO succession planning process (yes/no) 2,338 0.49
Board serves as a good steward of company's assets 2,370 4.27 0.11 0.89
Panel B: Conditional responses by listing status and legal system
Common Law
Public
Civil Law
Public
N Mean % 1-3 % 4-5 N Mean % 1-3 % 4-5
Overall, this is an effective board 1,249 4.39 0.08 0.92 264 4.13 0.16 0.84
CEO and board aligned on vision and strategy 1,238 4.16 0.14 0.86 262 4.03 0.17 0.83
Board effectively evaluates the CEO 1,242 3.71 0.38 0.62 261 3.43 0.48 0.52
Board has effective CEO succession planning process (yes/no) 1,225 0.58 259 0.47
Board serves as a good steward of company's assets 1,240 4.38 0.07 0.93 262 4.11 0.16 0.84
Common Law
Private
Civil Law
Private
N Mean % 1-3 % 4-5 N Mean % 1-3 % 4-5
Overall, this is an effective board 538 4.11 0.15 0.85 252 4.06 0.15 0.85
CEO and board aligned on vision and strategy 533 4.05 0.16 0.84 250 4.01 0.20 0.80
Board effectively evaluates the CEO 531 3.43 0.48 0.52 249 3.23 0.57 0.43
Board has effective CEO succession planning process (yes/no) 526 0.39 245 0.30
Board serves as a good steward of company's assets 537 4.24 0.11 0.89 248 4.00 0.20 0.80

54
Table 5
Correlation matrix [1] [2] [3] [4] [5] [6] [7] [8] [9] [10] [11] [12] [13] [14] [15] [16] [17] [18] [19]
[1] Overall board effectiveness 1.00
[2] CEO/board aligned on vision and strategy 0.60 1.00
[3] Board effectively evaluates the CEO 0.51 0.44 1.00
[4] Board has effective CEO succession plan 0.31 0.26 0.38 1.00
[5] Board serves as good steward of company assets 0.60 0.51 0.42 0.24 1.00
[6] Board size 0.07 0.00 0.11 0.21 0.05 1.00
[7] Board size^2 0.03 -0.04 0.06 0.12 0.03 0.87 1.00
[8] Board size is too small -0.08 -0.03 -0.05 -0.07 -0.01 -0.16 -0.09 1.00
[9] Board size is too big -0.13 -0.13 -0.07 -0.07 -0.11 0.33 0.28 -0.07 1.00
[10] Board has nearly ideal mix of members 0.45 0.33 0.32 0.22 0.35 0.02 0.00 -0.11 -0.15 1.00
[11] Pct. current CEO directors 0.03 0.01 0.04 -0.03 0.01 -0.07 -0.02 0.02 -0.02 0.02 1.00
[12] Pct. current executive directors -0.04 -0.02 -0.10 -0.11 -0.05 -0.16 -0.09 0.03 -0.04 -0.05 0.04 1.00
[13] Pct. retired CEO/exec. directors 0.14 0.05 0.11 0.12 0.13 0.05 -0.02 -0.03 -0.02 0.09 -0.21 -0.19 1.00
[14] Pct. female directors 0.08 0.05 0.07 0.09 0.04 0.21 0.14 -0.01 0.02 0.19 -0.03 -0.08 0.06 1.00
[15] Pct. ethnic minority directors 0.05 0.03 0.05 0.06 0.00 0.12 0.08 0.01 0.02 0.09 0.05 0.02 0.00 0.13 1.00
[16] Pct. foreign national directors -0.02 -0.02 -0.02 -0.02 -0.07 -0.07 -0.05 -0.01 -0.01 0.02 -0.05 0.06 -0.05 -0.08 0.07 1.00
[17] Board performs well as a team 0.75 0.60 0.45 0.26 0.56 0.00 -0.02 -0.05 -0.16 0.43 0.03 -0.04 0.14 0.06 0.01 -0.05 1.00
[18] CEO communicates/consults appropriately w/ board 0.54 0.64 0.43 0.26 0.43 0.04 -0.01 -0.03 -0.11 0.28 0.00 -0.04 0.08 0.06 0.05 -0.03 0.49 1.00
[19] CEO/board relationship sets right tone for company 0.62 0.68 0.46 0.27 0.51 0.04 -0.01 -0.04 -0.14 0.34 0.02 -0.03 0.11 0.07 0.03 -0.07 0.59 0.76 1.00
[20] Able to have open and candid discussions 0.65 0.51 0.40 0.22 0.53 -0.03 -0.04 -0.03 -0.12 0.37 0.03 -0.04 0.11 0.01 0.01 -0.03 0.68 0.46 0.52
[21] Voice is heard on the board 0.60 0.50 0.37 0.18 0.51 -0.02 -0.02 -0.03 -0.05 0.32 0.02 -0.05 0.08 0.01 -0.02 -0.03 0.67 0.45 0.49
[22] Feel in sync with other directors 0.71 0.56 0.43 0.25 0.54 -0.01 -0.02 -0.03 -0.15 0.40 0.02 -0.02 0.12 0.02 -0.01 -0.03 0.80 0.46 0.55
[23] Enjoy serving on the board 0.74 0.52 0.40 0.23 0.54 0.08 0.05 -0.06 -0.08 0.36 0.01 -0.04 0.09 0.09 -0.01 -0.03 0.64 0.44 0.51
[24] Effectiveness of executive sessions 0.27 0.23 0.25 0.22 0.31 0.11 0.06 -0.02 -0.04 0.17 0.01 -0.09 0.16 0.03 0.04 -0.04 0.26 0.20 0.25
[25] Times per year full board meets -0.02 -0.05 -0.07 -0.04 -0.01 -0.03 -0.02 0.08 0.04 -0.01 -0.08 0.05 -0.04 0.06 -0.05 -0.05 -0.05 -0.04 -0.03
[26] Mean board meeting attendance rate 0.18 0.11 0.16 0.15 0.16 -0.10 -0.14 0.06 -0.09 0.09 -0.10 -0.10 0.20 -0.04 -0.08 -0.04 0.17 0.15 0.13
[27] Hours p/ year dedicated to board 0.08 0.00 0.09 0.10 0.05 0.10 0.03 -0.01 0.03 0.10 -0.13 -0.06 0.20 0.07 0.00 0.07 0.07 0.06 0.06
[28] Board uses annual board assessment process 0.20 0.14 0.24 0.24 0.16 0.18 0.08 -0.06 0.00 0.16 -0.06 -0.13 0.21 0.14 0.01 -0.02 0.16 0.14 0.16
[29] If yes: Assessment conducted by external advisor 0.01 -0.03 -0.04 0.02 0.00 0.12 0.07 -0.01 0.07 0.01 -0.04 -0.05 0.07 0.18 0.00 0.06 -0.02 -0.05 -0.05
[30] Board addresses poorly performing directors 0.37 0.29 0.33 0.24 0.31 0.00 -0.01 -0.04 -0.11 0.27 -0.01 -0.04 0.08 0.03 0.03 0.01 0.38 0.25 0.30
[31] Board tracks decisions over time 0.29 0.21 0.24 0.18 0.20 0.02 -0.01 -0.03 -0.08 0.21 -0.01 0.00 0.09 0.01 0.01 0.01 0.26 0.21 0.24
[32] Board provides effective training for new directors 0.40 0.29 0.34 0.31 0.30 0.21 0.12 -0.08 -0.04 0.35 -0.07 -0.08 0.22 0.19 0.03 -0.03 0.36 0.31 0.33
[33] Directors are well prepared for meetings 0.51 0.40 0.35 0.23 0.40 -0.01 -0.03 -0.01 -0.13 0.32 -0.02 -0.09 0.18 0.08 -0.02 -0.06 0.50 0.37 0.42
[34] Acceptable board member behavior is clear 0.48 0.38 0.33 0.24 0.39 0.04 0.02 -0.05 -0.08 0.32 -0.02 -0.01 0.08 0.05 0.00 -0.02 0.49 0.34 0.40
[35] Agenda topics reflect board priorities 0.48 0.49 0.34 0.18 0.45 0.00 0.01 -0.05 -0.10 0.28 0.03 -0.04 0.08 0.03 0.04 -0.05 0.48 0.45 0.45
[36] Public company 0.14 0.06 0.15 0.18 0.10 0.21 0.10 -0.04 0.00 0.14 -0.06 -0.19 0.31 0.08 -0.01 -0.01 0.12 0.07 0.07
[37] Common law legal system 0.11 0.06 0.13 0.12 0.16 0.11 0.06 0.04 -0.06 0.05 -0.06 -0.06 0.25 0.01 0.11 -0.26 0.12 0.07 0.07

55
[20] [21] [22] [23] [24] [25] [26] [27] [28] [29] [30] [31] [32] [33] [34] [35] [36] [37]
[20] Able to have open and candid discussions 1.00
[21] Voice is heard on the board 0.70 1.00
[22] Feel in sync with other directors 0.64 0.65 1.00
[23] Enjoy serving on the board 0.59 0.62 0.65 1.00
[24] Effectiveness of executive sessions 0.27 0.22 0.25 0.25 1.00
[25] Times per year full board meets -0.03 -0.01 -0.03 -0.01 -0.07 1.00
[26] Mean board meeting attendance rate 0.19 0.15 0.18 0.15 0.12 0.01 1.00
[27] Hours p/ year dedicated to board 0.07 0.07 0.05 0.05 0.05 0.18 0.15 1.00
[28] Board uses annual board assessment process 0.15 0.12 0.14 0.15 0.20 0.08 0.24 0.20 1.00
[29] If yes: Assessment conducted by external advisor -0.02 -0.01 -0.03 0.00 0.01 0.03 0.01 0.11 0.08 1.00
[30] Board addresses poorly performing directors 0.34 0.27 0.35 0.30 0.17 -0.01 0.14 0.07 0.18 0.00 1.00
[31] Board tracks decisions over time 0.26 0.18 0.23 0.21 0.15 0.04 0.13 0.11 0.20 0.00 0.23 1.00
[32] Board provides effective training for new directors 0.32 0.23 0.36 0.31 0.21 0.02 0.15 0.19 0.33 0.05 0.28 0.27 1.00
[33] Directors are well prepared for meetings 0.43 0.41 0.48 0.42 0.23 -0.05 0.26 0.10 0.19 -0.01 0.28 0.18 0.36 1.00
[34] Acceptable board member behavior is clear 0.51 0.43 0.49 0.41 0.19 0.04 0.18 0.10 0.23 -0.03 0.32 0.25 0.43 0.39 1.00
[35] Agenda topics reflect board priorities 0.44 0.47 0.46 0.43 0.22 -0.08 0.13 0.06 0.11 -0.07 0.25 0.19 0.24 0.46 0.35 1.00
[36] Public company 0.10 0.07 0.11 0.10 0.16 0.01 0.24 0.17 0.39 0.12 0.10 0.07 0.23 0.14 0.11 0.07 1.00
[37] Common law legal system 0.09 0.06 0.11 0.08 0.14 -0.11 0.17 0.08 0.13 -0.03 0.08 0.05 0.16 0.15 0.07 0.11 0.16 1.00
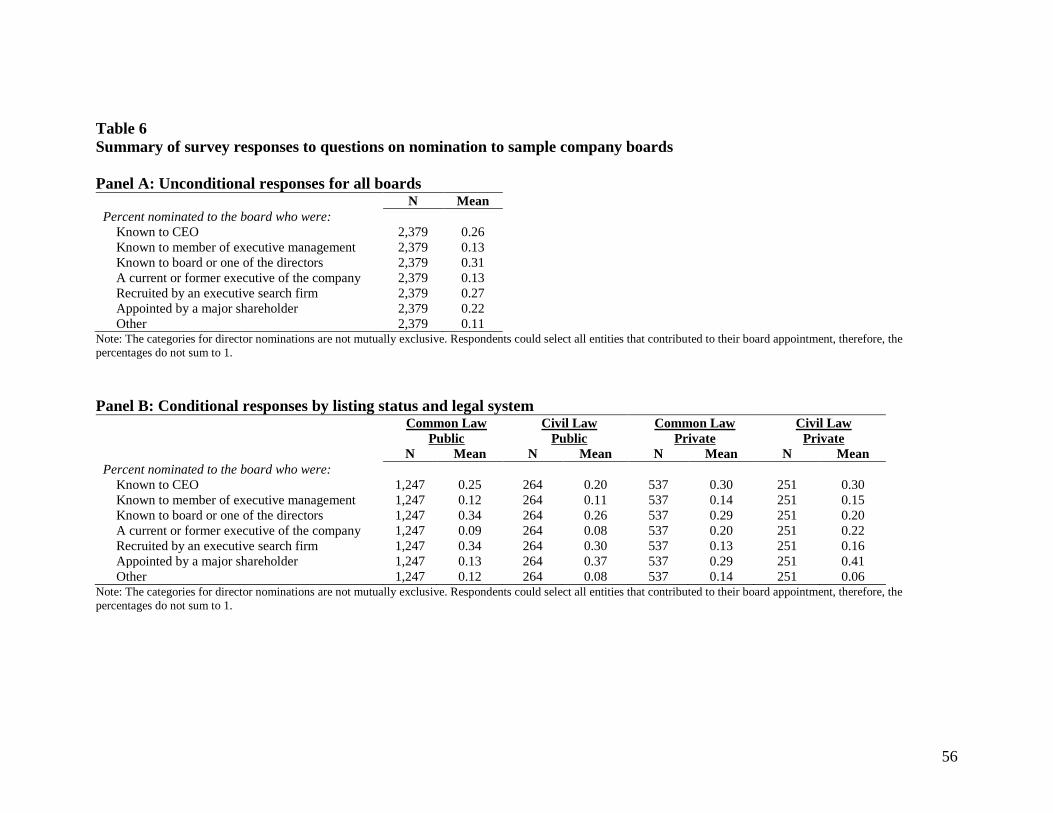
56
Table 6
Summary of survey responses to questions on nomination to sample company boards
Panel A: Unconditional responses for all boards
N Mean
Percent nominated to the board who were:
Known to CEO 2,379 0.26
Known to member of executive management 2,379 0.13
Known to board or one of the directors 2,379 0.31
A current or former executive of the company 2,379 0.13
Recruited by an executive search firm 2,379 0.27
Appointed by a major shareholder 2,379 0.22
Other 2,379 0.11 Note: The categories for director nominations are not mutually exclusive. Respondents could select all entities that contributed to their board appointment, therefore, the
percentages do not sum to 1.
Panel B: Conditional responses by listing status and legal system
Common Law
Public
Civil Law
Public
Common Law
Private
Civil Law
Private
N Mean N Mean N Mean N Mean
Percent nominated to the board who were:
Known to CEO 1,247 0.25 264 0.20 537 0.30 251 0.30
Known to member of executive management 1,247 0.12 264 0.11 537 0.14 251 0.15
Known to board or one of the directors 1,247 0.34 264 0.26 537 0.29 251 0.20
A current or former executive of the company 1,247 0.09 264 0.08 537 0.20 251 0.22
Recruited by an executive search firm 1,247 0.34 264 0.30 537 0.13 251 0.16
Appointed by a major shareholder 1,247 0.13 264 0.37 537 0.29 251 0.41
Other 1,247 0.12 264 0.08 537 0.14 251 0.06 Note: The categories for director nominations are not mutually exclusive. Respondents could select all entities that contributed to their board appointment, therefore, the
percentages do not sum to 1.
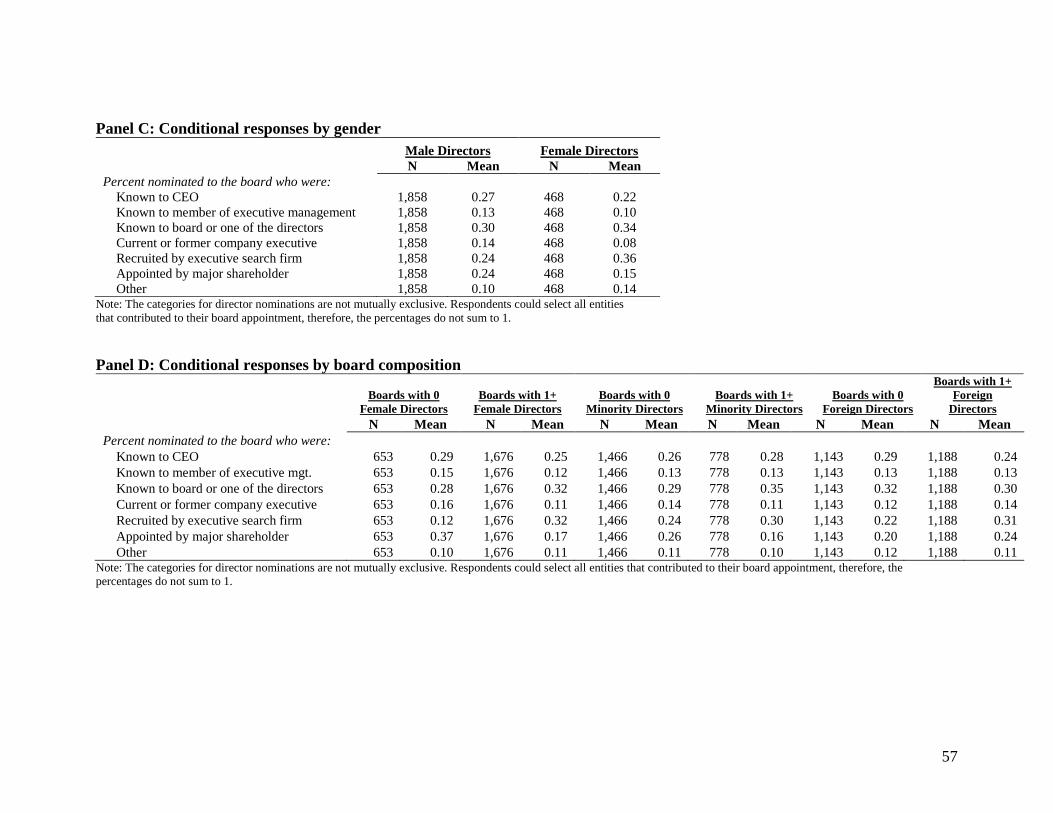
57
Panel C: Conditional responses by gender
Male Directors Female Directors
N Mean N Mean
Percent nominated to the board who were:
Known to CEO 1,858 0.27 468 0.22
Known to member of executive management 1,858 0.13 468 0.10
Known to board or one of the directors 1,858 0.30 468 0.34
Current or former company executive 1,858 0.14 468 0.08
Recruited by executive search firm 1,858 0.24 468 0.36
Appointed by major shareholder 1,858 0.24 468 0.15
Other 1,858 0.10 468 0.14 Note: The categories for director nominations are not mutually exclusive. Respondents could select all entities
that contributed to their board appointment, therefore, the percentages do not sum to 1.
Panel D: Conditional responses by board composition
Boards with 0
Female Directors
Boards with 1+
Female Directors
Boards with 0
Minority Directors
Boards with 1+
Minority Directors
Boards with 0
Foreign Directors
Boards with 1+
Foreign
Directors
N Mean N Mean N Mean N Mean N Mean N Mean
Percent nominated to the board who were:
Known to CEO 653 0.29 1,676 0.25 1,466 0.26 778 0.28 1,143 0.29 1,188 0.24
Known to member of executive mgt. 653 0.15 1,676 0.12 1,466 0.13 778 0.13 1,143 0.13 1,188 0.13
Known to board or one of the directors 653 0.28 1,676 0.32 1,466 0.29 778 0.35 1,143 0.32 1,188 0.30
Current or former company executive 653 0.16 1,676 0.11 1,466 0.14 778 0.11 1,143 0.12 1,188 0.14
Recruited by executive search firm 653 0.12 1,676 0.32 1,466 0.24 778 0.30 1,143 0.22 1,188 0.31
Appointed by major shareholder 653 0.37 1,676 0.17 1,466 0.26 778 0.16 1,143 0.20 1,188 0.24
Other 653 0.10 1,676 0.11 1,466 0.11 778 0.10 1,143 0.12 1,188 0.11 Note: The categories for director nominations are not mutually exclusive. Respondents could select all entities that contributed to their board appointment, therefore, the
percentages do not sum to 1.

58
Table 7
Summary of survey participants’ responses to questions on sample board size
Panel A: Number of board members
N Mean Q1 Median Q3
Number of board members
Full sample 2,375 8.21 6 8 10
Common law country, public boards 1,245 8.74 7 8 10
Civil law country, public boards 263 8.59 6 8 11
Common law country, private boards 535 7.56 5 7 9
Civil law country, private boards 252 6.49 5 6 8
Panel B: Conditional responses on views about optimal board size by listing status and legal system
Full Sample Common Law
Public
Civil Law
Public
Common Law
Private
Civil Law
Private
N Mean N Mean N Mean N Mean N Mean
Too small 2,285 0.05 1,207 0.05 254 0.02 516 0.07 230 0.04
Too big 2,285 0.09 1,207 0.08 254 0.16 516 0.10 230 0.08
Just right 2,285 0.86 1,207 0.87 254 0.81 516 0.83 230 0.88
Panel C: Conditional responses on views about optimal board size by actual board size
Board Size
1-4 Directors 5-6 Directors 7-8 Directors 9-10 Directors 11+ Directors
N Mean N Mean N Mean N Mean N Mean
Percent that think their board size is:
Too small 160 0.21 495 0.08 693 0.05 510 0.02 419 0.01
Too big 160 0.00 495 0.02 693 0.05 510 0.10 419 0.27
Just right 160 0.79 495 0.90 693 0.90 510 0.88 419 0.72
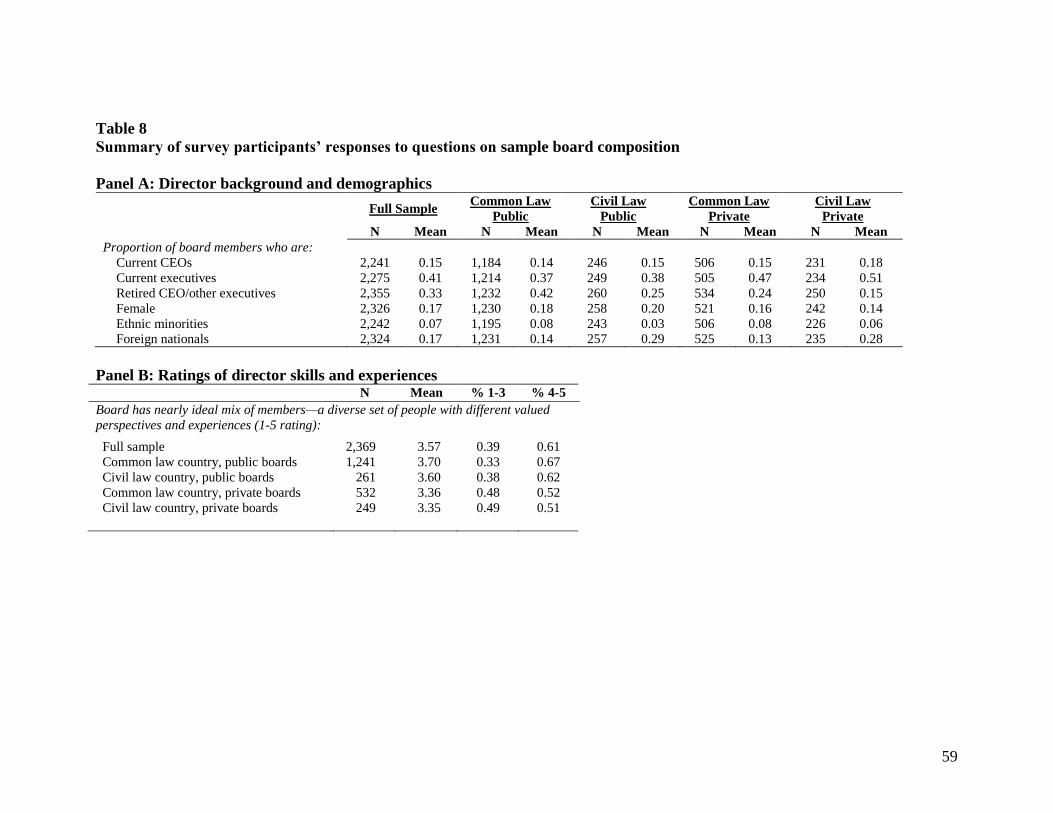
59
Table 8
Summary of survey participants’ responses to questions on sample board composition
Panel A: Director background and demographics
Full Sample Common Law
Public
Civil Law
Public
Common Law
Private
Civil Law
Private
N Mean N Mean N Mean N Mean N Mean
Proportion of board members who are:
Current CEOs 2,241 0.15 1,184 0.14 246 0.15 506 0.15 231 0.18
Current executives 2,275 0.41 1,214 0.37 249 0.38 505 0.47 234 0.51
Retired CEO/other executives 2,355 0.33 1,232 0.42 260 0.25 534 0.24 250 0.15
Female 2,326 0.17 1,230 0.18 258 0.20 521 0.16 242 0.14
Ethnic minorities 2,242 0.07 1,195 0.08 243 0.03 506 0.08 226 0.06
Foreign nationals 2,324 0.17 1,231 0.14 257 0.29 525 0.13 235 0.28
Panel B: Ratings of director skills and experiences N Mean % 1-3 % 4-5
Board has nearly ideal mix of members—a diverse set of people with different valued
perspectives and experiences (1-5 rating):
Full sample 2,369 3.57 0.39 0.61
Common law country, public boards 1,241 3.70 0.33 0.67
Civil law country, public boards 261 3.60 0.38 0.62
Common law country, private boards 532 3.36 0.48 0.52
Civil law country, private boards 249 3.35 0.49 0.51
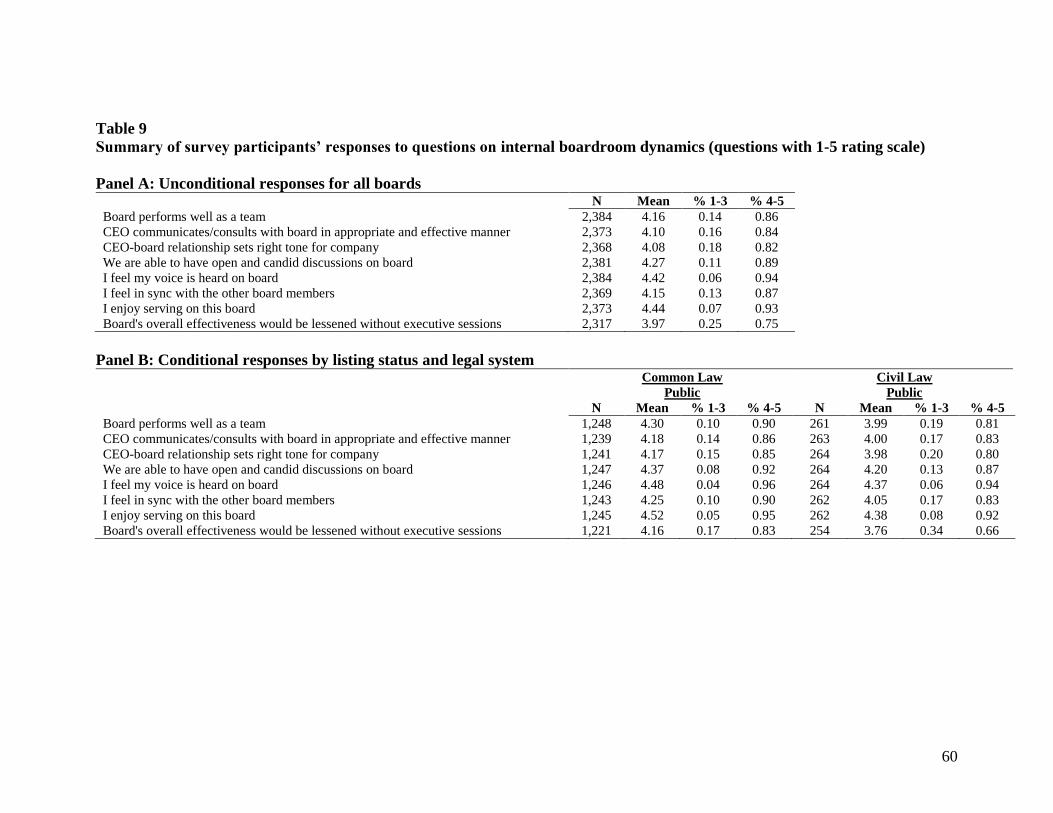
60
Table 9
Summary of survey participants’ responses to questions on internal boardroom dynamics (questions with 1-5 rating scale)
Panel A: Unconditional responses for all boards
N Mean % 1-3 % 4-5
Board performs well as a team 2,384 4.16 0.14 0.86
CEO communicates/consults with board in appropriate and effective manner 2,373 4.10 0.16 0.84
CEO-board relationship sets right tone for company 2,368 4.08 0.18 0.82
We are able to have open and candid discussions on board 2,381 4.27 0.11 0.89
I feel my voice is heard on board 2,384 4.42 0.06 0.94
I feel in sync with the other board members 2,369 4.15 0.13 0.87
I enjoy serving on this board 2,373 4.44 0.07 0.93
Board's overall effectiveness would be lessened without executive sessions 2,317 3.97 0.25 0.75
Panel B: Conditional responses by listing status and legal system
Common Law
Public
Civil Law
Public
N Mean % 1-3 % 4-5 N Mean % 1-3 % 4-5
Board performs well as a team 1,248 4.30 0.10 0.90 261 3.99 0.19 0.81
CEO communicates/consults with board in appropriate and effective manner 1,239 4.18 0.14 0.86 263 4.00 0.17 0.83
CEO-board relationship sets right tone for company 1,241 4.17 0.15 0.85 264 3.98 0.20 0.80
We are able to have open and candid discussions on board 1,247 4.37 0.08 0.92 264 4.20 0.13 0.87
I feel my voice is heard on board 1,246 4.48 0.04 0.96 264 4.37 0.06 0.94
I feel in sync with the other board members 1,243 4.25 0.10 0.90 262 4.05 0.17 0.83
I enjoy serving on this board 1,245 4.52 0.05 0.95 262 4.38 0.08 0.92
Board's overall effectiveness would be lessened without executive sessions 1,221 4.16 0.17 0.83 254 3.76 0.34 0.66
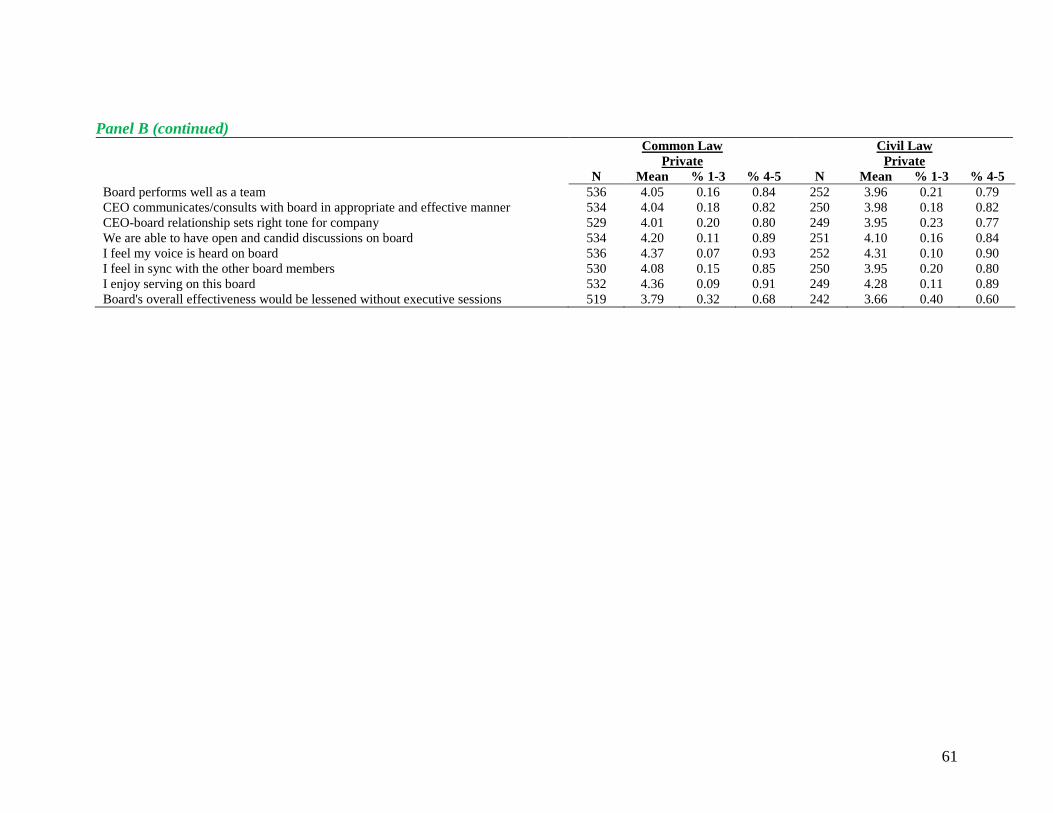
61
Panel B (continued)
Common Law
Private
Civil Law
Private
N Mean % 1-3 % 4-5 N Mean % 1-3 % 4-5
Board performs well as a team 536 4.05 0.16 0.84 252 3.96 0.21 0.79
CEO communicates/consults with board in appropriate and effective manner 534 4.04 0.18 0.82 250 3.98 0.18 0.82
CEO-board relationship sets right tone for company 529 4.01 0.20 0.80 249 3.95 0.23 0.77
We are able to have open and candid discussions on board 534 4.20 0.11 0.89 251 4.10 0.16 0.84
I feel my voice is heard on board 536 4.37 0.07 0.93 252 4.31 0.10 0.90
I feel in sync with the other board members 530 4.08 0.15 0.85 250 3.95 0.20 0.80
I enjoy serving on this board 532 4.36 0.09 0.91 249 4.28 0.11 0.89
Board's overall effectiveness would be lessened without executive sessions 519 3.79 0.32 0.68 242 3.66 0.40 0.60

62
Table 10
Summary of survey participants’ responses to questions on internal board governance
Panel A: Unconditional responses for all boards
N Mean Q1 Median Q3
Number of times full board meets per year 2,336 6.73 4 6 8
Average board meeting attendance rate 2,358 0.95 0.90 0.98 1.00
Number of hours per year dedicated to board 2,337 154.5 60 110 200
Yes/no questions:
Board uses an annual board assessment process 2,372 0.70
If yes: assessment is conducted by an external advisor 1,340 0.33
Board effectively addresses poorly performing directors 2,324 0.54
Board tracks decisions over time to review effectiveness 2,340 0.68
Questions with 1-5 rating scale: N Mean % 1-3 % 4-5
Board provides effective training for new directors 2,362 3.29 0.50 0.50
All directors well prepared for board meetings 2,380 4.15 0.12 0.88
Clear what is and is not acceptable behavior on board 2,367 3.97 0.21 0.79
Agenda topics and materials accurately reflect board priorities 2,389 4.23 0.07 0.93
Panel B: Conditional responses by listing status and legal system
Common Law
Public
Civil Law
Public
N Mean Q1 Median Q3 N Mean Q1 Median Q3
Number of times full board meets per year 1,228 6.59 5 6 8 262 7.71 5 6 10
Average board meeting attendance rate 1,241 0.97 0.95 1.00 1.00 263 0.93 0.90 0.95 1.00
Number of hours per year dedicated to board 1,222 176.45 80 146 240 262 151.94 60 120 200
Yes/no questions:
Board uses an annual board assessment process 1,243 0.84 261 0.75
If yes: assessment is conducted by an external advisor 884 0.35 148 0.44
Board effectively addresses poorly performing directors 1,217 0.60 259 0.49
Board tracks decisions over time to review effectiveness 1223 0.71 262 0.68
Questions with 1-5 rating scale: N Mean % 1-3 % 4-5 N Mean % 1-3 % 4-5
Board provides effective training for new directors 1,243 3.53 0.40 0.60 262 3.17 0.56 0.44
All directors well prepared for board meetings 1,242 4.30 0.07 0.93 264 3.95 0.21 0.79
Clear what is and is not acceptable behavior on board 1,236 4.09 0.16 0.84 260 3.86 0.25 0.75
Agenda topics and materials accurately reflect board priorities 1,248 4.31 0.05 0.95 264 4.09 0.13 0.87
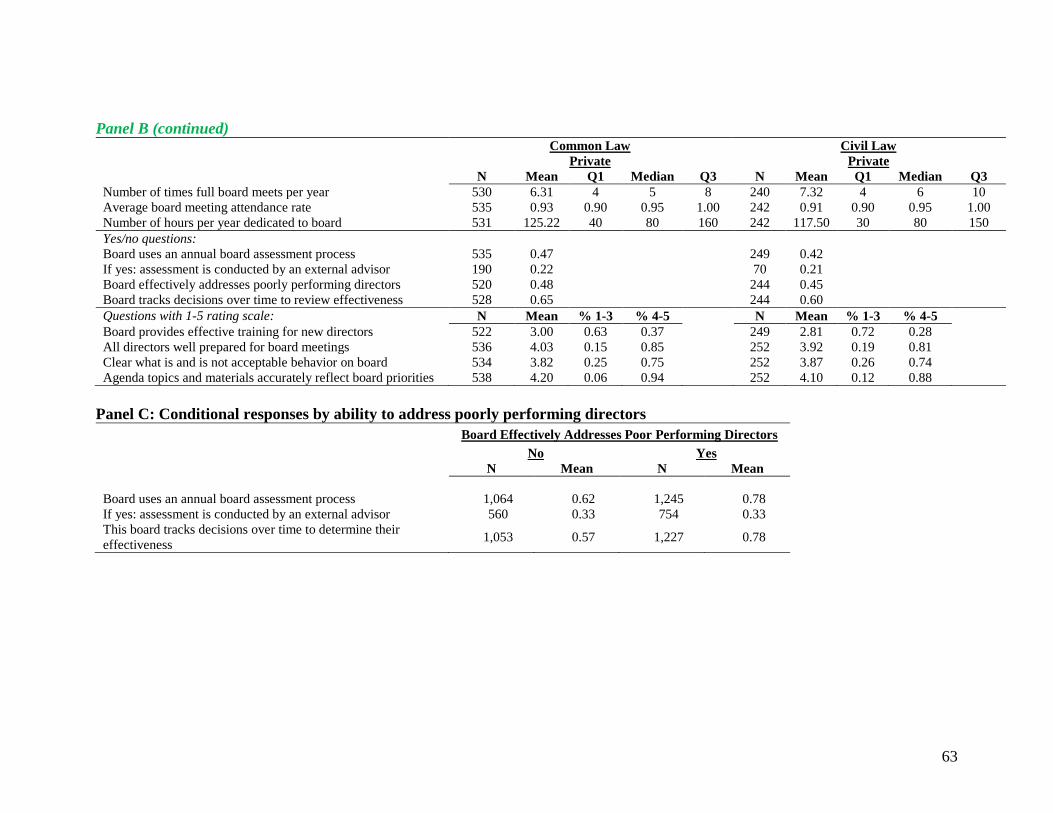
63
Panel B (continued)
Common Law
Private
Civil Law
Private
N Mean Q1 Median Q3 N Mean Q1 Median Q3
Number of times full board meets per year 530 6.31 4 5 8 240 7.32 4 6 10
Average board meeting attendance rate 535 0.93 0.90 0.95 1.00 242 0.91 0.90 0.95 1.00
Number of hours per year dedicated to board 531 125.22 40 80 160 242 117.50 30 80 150
Yes/no questions:
Board uses an annual board assessment process 535 0.47 249 0.42
If yes: assessment is conducted by an external advisor 190 0.22 70 0.21
Board effectively addresses poorly performing directors 520 0.48 244 0.45
Board tracks decisions over time to review effectiveness 528 0.65 244 0.60
Questions with 1-5 rating scale: N Mean % 1-3 % 4-5 N Mean % 1-3 % 4-5
Board provides effective training for new directors 522 3.00 0.63 0.37 249 2.81 0.72 0.28
All directors well prepared for board meetings 536 4.03 0.15 0.85 252 3.92 0.19 0.81
Clear what is and is not acceptable behavior on board 534 3.82 0.25 0.75 252 3.87 0.26 0.74
Agenda topics and materials accurately reflect board priorities 538 4.20 0.06 0.94 252 4.10 0.12 0.88
Panel C: Conditional responses by ability to address poorly performing directors
Board Effectively Addresses Poor Performing Directors
No Yes
N Mean N Mean
Board uses an annual board assessment process 1,064 0.62 1,245 0.78
If yes: assessment is conducted by an external advisor 560 0.33 754 0.33
This board tracks decisions over time to determine their
effectiveness 1,053 0.57 1,227 0.78

64
Table 11
Ordered probit estimates of the relation between survey participant responses to questions on board effectiveness and questions about
board size and composition, internal board dynamics, and internal board governance, including controls for lagged financial performance
Overall
effectiveness
Strategy
alignment
CEO
evaluation
Succession
plan
Asset
stewardship
VARIABLES (1-5 rating) (1-5 rating) (1-5 rating) (yes/no) (1-5 rating)
Board size:
Board size 0.082***
-0.002 0.027 0.150***
0.014
(0.022) (0.020) (0.021) (0.025) (0.021)
Board size2 -0.0012
*** -0.0004 0.0002 -0.0018
*** 0.0003
(0.0004) (0.0004) (0.0007) (0.0006) (0.0005)
Board size too small -0.084 0.058 0.287**
0.212 0.347**
(0.177) (0.141) (0.134) (0.183) (0.171)
Board size too big -0.208 0.166 -0.021 -0.396***
-0.054
(0.136) (0.129) (0.126) (0.153) (0.160)
Board composition:
Board has ideal mix of members 0.214***
0.169***
0.072* 0.059 0.097
**
(1-5 rating) (0.048) (0.043) (0.037) (0.045) (0.040)
% current CEO directors 0.077 -0.207 0.266 0.028 0.203
(from focal or other companies) (0.279) (0.236) (0.212) (0.268) (0.217)
% current executive directors 0.214 -0.0146 -0.196* -0.175 0.068
(from focal or other companies) (0.148) (0.130) (0.118) (0.148) (0.137)
% retired CEO/exec. directors -0.0096 -0.228* 0.057 0.157 0.239
*
(from focal or other companies) (0.148) (0.137) (0.120) (0.150) (0.135)
% female directors -0.209 -0.377 -0.0312 -0.092 -0.219
(0.276) (0.248) (0.222) (0.269) (0.311)
% ethnic minority directors 0.176 -0.329 0.388 0.192 -0.207
(0.324) (0.340) (0.293) (0.324) (0.295)
% foreign national directors 0.447**
-0.124 0.184 -0.110 -0.143
(0.178) (0.150) (0.146) (0.187) (0.158)

65
Robust
standard errors
in parentheses.
*** p<0.01,
** p<0.05,
* p<0.1
Board internal dynamics:
Board performs well as a team 1.169***
0.484***
0.242***
0.131* 0.454
***
(1-5 rating) (0.084) (0.066) (0.057) (0.068) (0.068)
CEO communicates/consults approp. 0.214***
0.489***
0.192***
0.107 0.131*
with board (1-5 rating) (0.072) (0.070) (0.062) (0.075) (0.070)
CEO/board relationship sets right tone 0.354***
0.545***
0.173***
0.136* 0.295
***
for company (1-5 rating) (0.082) (0.074) (0.067) (0.082) (0.073)
Board internal governance:
Board provides effective training for 0.057 0.017 0.064 0.127***
-0.035
new directors (1-5 rating) (0.047) (0.045) (0.042) (0.048) (0.043)
Times per year full board meets 0.008 -0.008 -0.012 -0.012 -0.010
(0.011) (0.011) (0.009) (0.013) (0.010)
Directors well prepared for meetings 0.245***
0.090 0.062 0.052 0.105*
(1-5 rating) (0.064) (0.060) (0.056) (0.066) (0.057)
Mean board meeting attendance rate 0.553 -0.086 1.036**
1.618**
0.520
(0.742) (0.538) (0.511) (0.723) (0.600)
Clear acceptable board member 0.158**
0.058 0.091* 0.058 0.216
***
behavior (1-5 rating) (0.064) (0.057) (0.051) (0.062) (0.059)
Board uses annual board assessment 0.041 0.083 0.286***
0.180* 0.135
process (yes/no) (0.097) (0.086) (0.082) (0.097) (0.089)
Board addresses poorly performing 0.292***
-0.0152 0.398***
0.186**
0.277***
directors (yes/no) (0.087) (0.077) (0.066) (0.082) (0.075)
Firm performance relative to market:
For past 36 months 0.193***
0.088***
0.049* 0.070
* 0.154
***
(0.035) (0.032) (0.029) (0.036) (0.032)
Listing status and legal system (Common law, public is the excluded category):
Common law, private -0.191* 0.169
* 0.087 -0.078 0.037
(0.099) (0.094) (0.089) (0.109) (0.097)
Civil law, public -0.248 0.101 -0.173 -0.0315 -0.238*
(0.153) (0.115) (0.109) (0.139) (0.129)
Civil law, private -0.197 -0.105 -0.110 -0.0970 -0.180
(0.172) (0.169) (0.148) (0.171) (0.164)
Number of observations 1,362 1,353 1,354 1,339 1,357
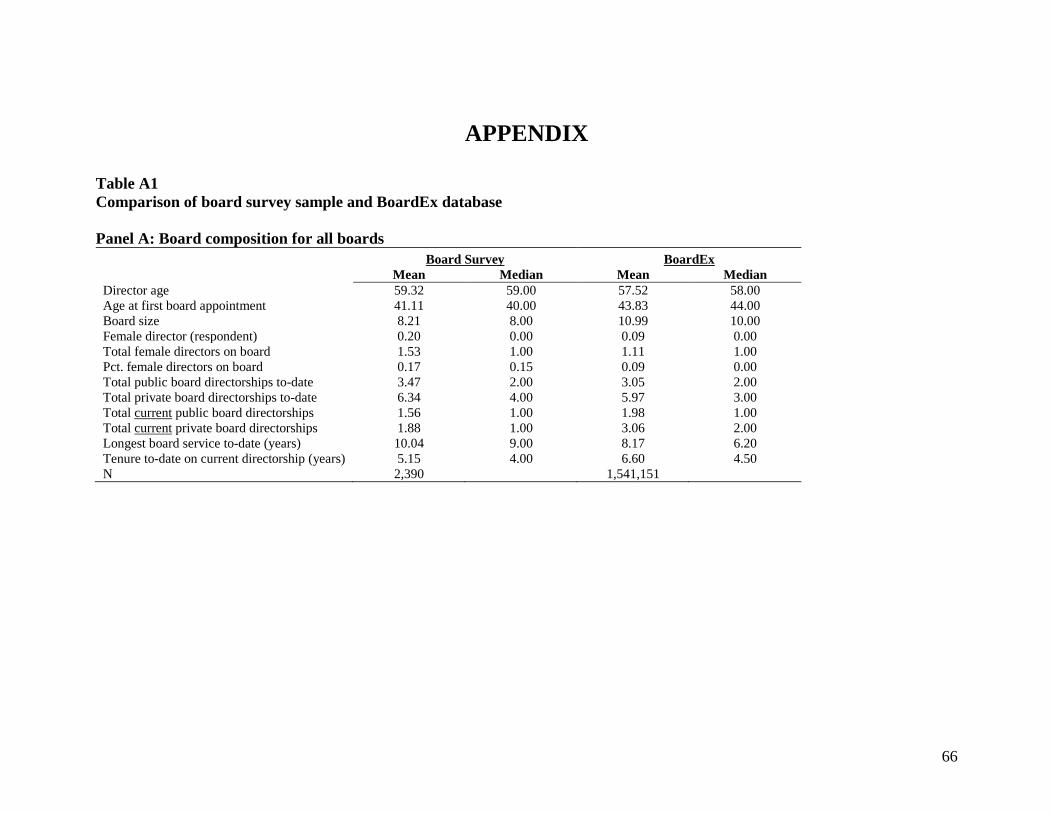
66
APPENDIX
Table A1
Comparison of board survey sample and BoardEx database
Panel A: Board composition for all boards
Board Survey BoardEx
Mean Median Mean Median
Director age 59.32 59.00 57.52 58.00
Age at first board appointment 41.11 40.00 43.83 44.00
Board size 8.21 8.00 10.99 10.00
Female director (respondent) 0.20 0.00 0.09 0.00
Total female directors on board 1.53 1.00 1.11 1.00
Pct. female directors on board 0.17 0.15 0.09 0.00
Total public board directorships to-date 3.47 2.00 3.05 2.00
Total private board directorships to-date 6.34 4.00 5.97 3.00
Total current public board directorships 1.56 1.00 1.98 1.00
Total current private board directorships 1.88 1.00 3.06 2.00
Longest board service to-date (years) 10.04 9.00 8.17 6.20
Tenure to-date on current directorship (years) 5.15 4.00 6.60 4.50
N 2,390
1,541,151

67
Panel B: Board composition by listing status
Public, US Boards Private, US Boards
Board Survey BoardEx Board Survey BoardEx
Mean Median Mean Median Mean Median Mean Median
Director age 61.63 61.00 61.07 61.00 59.28 59.00 56.78 57.00
Age at first board appointment 43.47 43.00 44.89 45.00 40.67 40.00 42.45 42.00
Board size 9.06 9.00 10.38 9.00 7.65 7.00 8.99 7.00
Female director (respondent) 0.17 0.00 0.12 0.00 0.17 0.00 0.08 0.00
Total female directors on board 1.49 1.00 1.34 1.00 1.39 1.00 0.88 0.00
Pct. female directors on board 0.15 0.14 0.11 0.11 0.16 0.14 0.07 0.00
Total public board directorships to-date 3.42 3.00 3.70 2.00 1.68 1.00 3.18 2.00
Total private board directorships to-date 6.42 5.00 4.87 3.00 7.47 6.00 5.84 3.00
Total current public board directorships 1.78 1.00 2.35 1.00 0.44 0.00 1.60 1.00
Total current private board directorships 1.11 1.00 2.43 2.00 2.22 2.00 3.18 2.00
Longest board service to-date (years) 10.72 10.00 10.32 8.60 10.09 8.00 7.98 6.00
Tenure to-date on current directorship
(years) 6.37 5.00 8.21 6.20 3.94 3.00 6.28 4.30
N 654
48,621
329
28,362

68
Panel C: Board sample by industry
Board Survey BoardEx Data
Freq. Pct. Freq. Pct.
Consumer Discretionary 264 0.12 209,705 0.14
Consumer Staples 118 0.05 64,254 0.04
Energy & Utilities 252 0.11 210,367 0.14
Financial & Professional Services 627 0.28 464,162 0.30
Healthcare 274 0.12 126,093 0.08
IT & Telecom 272 0.12 156,565 0.10
Industrials 290 0.13 193,397 0.13
Materials 173 0.08 116,608 0.08
Total 2,270 1,541,151
Panel D: Board sample by industry and listing status
Public, US Boards Private, US Boards
Board Survey BoardEx Data Board Survey BoardEx Data
Freq. Pct. Freq. Pct. Freq. Pct. Freq. Pct.
Consumer Discretionary 77 0.12 7,224 0.15 314 0.11 1,830 0.06
Consumer Staples 25 0.04 2,292 0.05 314 0.09 643 0.02
Energy & Utilities 82 0.13 7,699 0.16 314 0.08 2,817 0.10
Financial & Professional Services 135 0.21 14,466 0.30 314 0.24 10,374 0.37
Healthcare 93 0.15 4,473 0.09 314 0.16 4,613 0.16
IT & Telecom 98 0.16 4,559 0.09 314 0.18 5,154 0.18
Industrials 83 0.13 5,362 0.11 314 0.11 1,784 0.06
Materials 35 0.06 2,546 0.05 314 0.05 1,147 0.04
Total 628 48,621 314 28,362

69
References
Adams, R.B., 2009. Asking Directors about their Dual Roles. SSRN Work. Pap. No
1362339.
Adams, R.B., Ferreira, D., 2008. Do directors perform for pay? J. Account. Econ. 46,
154–171. doi:10.1016/j.jacceco.2008.06.002
Adams, R.B., Ferreira, D., 2007. A theory of friendly boards. J. Finance 62, 217–250.
Adams, R.B., Hermalin, B.E., Weisbach, M.S., 2010. The Role of Boards of Directors in
Corporate Governance: A Conceptual Framework and Survey. J. Econ. Lit. 48,
58–107. doi:10.1257/jel.48.1.58
Aebi, V., Sabato, G., Schmid, M., 2012. Risk management, corporate governance, and
bank performance in the financial crisis. J. Bank. Finance 36, 3213–3226.
doi:10.1016/j.jbankfin.2011.10.020
Aggarwal, R., Erel, I., Ferreira, M., Matos, P., 2011. Does governance travel around the
world? Evidence from institutional investors. J. Financ. Econ. 100, 154–181.
doi:10.1016/j.jfineco.2010.10.018
Anderson, R.C., Reeb, D.M., Upadhyay, A., Zhao, W., 2011. The Economics of Director
Heterogeneity. Financ. Manag. 40, 5–38. doi:10.1111/j.1755-053X.2010.01133.x
Bandiera, O., Hansen, S., Prat, A., Sadun, R., 2017. CEO Behavior and Firm
Performance. Harv. Bus. Sch. Work. Pap. 17-083.
Banker, R.D., Field, J.M., Schroeder, R.G., Sintia, K.K., 1996. Impact of Work Teams on
Manufacturing Performance: A Longitudinal Field Study. Acad. Manage. J. 39,
867–890. doi:10.2307/256715
Bebchuk, L.A., 2009. Pay without performance: The unfulfilled promise of executive
compensation. Harvard University Press, Boston, MA.
Bettis, R.A., 2012. The search for asterisks: Compromised statistical tests and flawed
theories. Strateg. Manag. J. 33, 108–113. doi:10.1002/smj.975
Bhagat, S., Black, B., 1999. The Uncertain Relationship Between Board Composition and
Firm Performance. Bus. Lawyer 54, 921–963.
Blair-Loy, M., 2001. It’s Not Just What You Know, It’s Who You Know: Technical
Knowledge, Rainmaking, and Gender among Finance Executives. Res. Sociol.
Work 10, 51–83.
Board of Governors of the Federal Reserve System, 2017. Proposed Guidance on
Supervisory Expectation for Boards of Directors (No. Docket No. OP-1570),
Federal Register: Notices. Federal Reserve System.
Brass, D.J., 1985. Men’s and Women’s Networks: A Study of Interaction Patterns and
Influence In an Organization. Acad. Manage. J. 28, 327–343. doi:10.2307/256204
Cohen, L., Frazzini, A., Malloy, C., 2010. Sell-Side School Ties. J. Finance 65, 1409–
1437. doi:10.1111/j.1540-6261.2010.01574.x
Cohen, L., Frazzini, A., Malloy, C., 2008. The Small World of Investing: Board
Connections and Mutual Fund Returns. J. Polit. Econ. 116, 951–979.
doi:10.1086/592415
Coles, J.L., Daniel, N.D., Naveen, L., 2008. Boards: Does one size fit all? J. Financ.
Econ. 87, 329–356. doi:10.1016/j.jfineco.2006.08.008

70
Core, J.E., Holthausen, R.W., Larcker, D.F., 1999. Corporate governance, chief executive
officer compensation, and firm performance. J. Financ. Econ. 51, 371–406.
doi:10.1016/S0304-405X(98)00058-0
Crossland, C., Hambrick, D.C., 2011. Differences in managerial discretion across
countries: How nation-level institutions affect the degree to which CEOs matter.
Strateg. Manag. J. 32, 797–819. doi:10.1002/smj.913
Daines, R.M., Gow, I.D., Larcker, D.F., 2010. Rating the ratings: How good are
commercial governance ratings? J. Financ. Econ. 98, 439–461.
doi:10.1016/j.jfineco.2010.06.005
Demb, A., Neubauer, F.-F., 1992. The Corporate Board: Confronting the Paradoxes.
Oxford University Press, New York.
Diamond, I.M., 2008. Corporate Governance for Public and Private Companies, in:
Compliance Issues and Trends: Leading Lawyers on Evaluating Benchmarks,
Educating Clients, and Mitigating Risks, Inside the Minds. Thomson
Reuters/Aspatore.
Dichev, I.D., Graham, J.R., Harvey, C.R., Rajgopal, S., 2013. Earnings quality: Evidence
from the field. J. Account. Econ., Conference Issue on Accounting Research on
Classic and Contemporary Issues 56, 1–33. doi:10.1016/j.jacceco.2013.05.004
Edmondson, A.C., Roberto, M.A., Watkins, M.D., 2003. A dynamic model of top
management team effectiveness: Managing unstructured task streams. Leadersh.
Q. 14, 297–325. doi:10.1016/S1048-9843(03)00021-3
Eisenberg, T., Sundgren, S., Wells, M.T., 1998. Larger board size and decreasing firm
value in small firms. J. Financ. Econ. 48, 35–54. doi:10.1016/S0304-
405X(98)00003-8
Erkens, D.H., Hung, M., Matos, P., 2012. Corporate governance in the 2007–2008
financial crisis: Evidence from financial institutions worldwide. J. Corp. Finance
18, 389–411. doi:10.1016/j.jcorpfin.2012.01.005
Fama, E.F., Jensen, M.C., 1983. Separation of ownership and control. J. Law Econ. 26,
301–325.
Fich, E.M., Shivdasani, A., 2006. Are Busy Boards Effective Monitors? J. Finance 61,
689–724. doi:10.1111/j.1540-6261.2006.00852.x
Forbes, D.P., Milliken, F.J., 1999. Cognition and Corporate Governance: Understanding
Boards of Directors as Strategic Decision-Making Groups. Acad. Manage. Rev.
24, 489–505. doi:10.2307/259138
Gertner, R.H., Kaplan, S.N., 1996. The Value-Maximizing Board. SSRN Work. Pap. No
10975.
Goldfarb, B., King, A.A., 2016. Scientific apophenia in strategic management research:
Significance tests & mistaken inference. Strateg. Manag. J. 37, 167–176.
doi:10.1002/smj.2459
Graham, J.R., Harvey, C.R., 2001. The theory and practice of corporate finance:
Evidence from the field. J. Financ. Econ., Complementary Research
Methodologies: The InterPlay of Theoretical, Empirical and Field-Based
Research in Finance 60, 187–243. doi:10.1016/S0304-405X(01)00044-7
Graham, J.R., Harvey, C.R., Popadak, J., Rajgopal, S., 2017. Corporate Culture:
Evidence from the Field. NBER Work. Pap. No 23255.

71
Graham, J.R., Harvey, C.R., Rajgopal, S., 2005. The economic implications of corporate
financial reporting. J. Account. Econ. 40, 3–73.
doi:10.1016/j.jacceco.2005.01.002
Groysberg, B., Polzer, J.T., Elfenbein, H.A., 2011. Too Many Cooks Spoil the Broth:
How High-Status Individuals Decrease Group Effectiveness. Organ. Sci. 22, 722–
737. doi:10.1287/orsc.1100.0547
Hackman, J.R., 2002. Leading Teams: Setting the Stage for Great Performances. Harvard
Business Review Press, Boston, MA.
Hackman, J.R., Morris, C.G., 1975. Group Tasks, Group Interaction Process, and Group
Performance Effectiveness: A Review and Proposed Integration. Adv. Exp. Soc.
Psychol. 8, 45–99. doi:10.1016/S0065-2601(08)60248-8
Hermalin, B.E., Weisbach, M.S., 2003. Boards of Directors as an Endogenously
Determined Institution: A Survey of the Economic Literature. Fed. Reserve Bank
N. Y. Econ. Policy Rev. 9, 7–26.
Hwang, B.-H., Kim, S., 2009. It pays to have friends. J. Financ. Econ. 93, 138–158.
doi:10.1016/j.jfineco.2008.07.005
Jensen, M.C., 1993. The modern industrial revolution, exit, and the failure of internal
control systems. J. Finance 48, 831–880. doi:10.2307/2329018
Jensen, M.C., Meckling, W.H., 1976. Theory of the firm: Managerial behavior, agency
costs and ownership structure. J. Financ. Econ. 3, 305–360. doi:10.1016/0304-
405X(76)90026-X
Kanter, R.M., 1977. Some Effects of Proportions on Group Life: Skewed Sex Ratios and
Responses to Token Women. Am. J. Sociol. 82, 965–990. doi:10.1086/226425
Kirkpatrick, G., 2009. The Corporate Governance Lessons from the Financial Crisis,
Financial Market Trends. OECD.
La Porta, R., Lopez-de-Silanes, F., Shleifer, A., Vishny, R., 2000. Investor protection and
corporate governance. J. Financ. Econ., Special Issue on International Corporate
Governance 58, 3–27. doi:10.1016/S0304-405X(00)00065-9
La Porta, R., Lopez-de-Silanes, F., Shleifer, A., Vishny, R.W., 1998. Law and finance. J.
Polit. Econ. 106, 1113–1155. doi:10.1086/250042
Larcker, D.F., McCall, A.L., Ormazabal, G., 2013. Proxy advisory firms and stock option
repricing. J. Account. Econ. 56, 149–169. doi:10.1016/j.jacceco.2013.05.003
Linck, J.S., Netter, J.M., Yang, T., 2009. The Effects and Unintended Consequences of
the Sarbanes-Oxley Act on the Supply and Demand for Directors. Rev. Financ.
Stud. 22, 3287–3328. doi:10.1093/rfs/hhn084
Lipton, M., Lorsch, J.W., 1992. A modest proposal for improved corporate governance.
Bus. Lawyer 48, 59–77.
Lorsch, J.W., 2017. Understanding Boards of Directors: A Systems Perspective. Ann.
Corp. Gov. 2, 1–49.
Lorsch, J.W., MacIver, E., 1989. Pawns or Potentates: The Reality of America’s
Corporate Boards. Harvard Business School Press, Boston, MA.
Mace, M.L., 1971. Directors: Myth and Reality. Harvard University Press, Boston, MA.
National Association of Corporate Directors, 2012. Board Evaluations (Custom Research
Memo), ExcesSource Service. National Association of Corporate Directors.

72
Pratto, F., Sidanius, J., Stallworth, L.M., Malle, B.F., 1994. Social dominance orientation:
A personality variable predicting social and political attitudes. J. Pers. Soc.
Psychol. 67, 741–763. doi:10.1037/0022-3514.67.4.741
PwC Strategy&, 2016. 2015 CEO Success Study: Outsider CEOs (Briefing Document).
PwC.
Shleifer, A., Vishny, R.W., 1997. A survey of corporate governance. J. Finance 52, 737–
783. doi:10.2307/2329497
Tajfel, H., Turner, J.C., 2004. The Social Identity Theory of Intergroup Behavior, in:
Jost, J.T., Sidanius, J. (Eds.), Key Readings in Social Psychology. Political
Psychology: Key Readings. Psychology Press, New York, pp. 276–293.
Vancil, R.F., 1987. Passing the baton: Managing the process of CEO succession. Harvard
Business School Press, Boston, MA.
Wageman, R., Hackman, J.R., Lehman, E., 2005. Team Diagnostic Survey: Development
of an Instrument. J. Appl. Behav. Sci. 41, 373–398.
doi:10.1177/0021886305281984
West, B.K., 2002. NACD Blue Ribbon Commission Report on Board Evaluation:
Improving Director Effectiveness, The Corporate Governance Advisor. National
Association of Corporate Directors.
Westphal, J.D., 1999. Collaboration in the boardroom: Behavioral and performance
consequences of CEO-board social ties. Acad. Manage. J. 42, 7–24.
doi:10.2307/256871
Westphal, J.D., Stern, I., 2007. Flattery Will Get You Everywhere (Especially If You Are
a Male Caucasian): How Ingratiation, Boardroom Behavior, and Demographic
Minority Status Affect Additional Board Appointments at U.S. Companies. Acad.
Manage. J. 50, 267–288. doi:10.2307/20159854
Westphal, J.D., Zajac, E.J., 1995. Who shall govern? CEO/board power, demographic
similarity, and new director selection. Adm. Sci. Q. 40, 60–83.
doi:10.2307/2393700
Wu, Y., 2004. The impact of public opinion on board structure changes, director career
progression, and CEO turnover: Evidence from CalPERS’ corporate governance
program. J. Corp. Finance 10, 199–227. doi:10.1016/S0929-1199(03)00024-5
Yermack, D., 1996. Higher market valuation of companies with a small board of
directors. J. Financ. Econ. 40, 185–211. doi:10.1016/0304-405X(95)00844-5
Zajac, E.J., Lungeanu, R., 2016. Venture Capital Ownership as a Contingent Resource:
How Owner-Firm Fit Influences IPO Outcomes. Acad. Manage. J. 59, 930–955.
doi:10.5465/amj.2012.0871