Paradigm Precision Paradigm Precision Proprietary Information.
Directionall well design using Paradigm Sysdrillsimulator
Japundžić, Silvio
Master's thesis / Diplomski rad
2015
Degree Grantor / Ustanova koja je dodijelila akademski / stručni stupanj: University of Zagreb, Faculty of Mining, Geology and Petroleum Engineering / Sveučilište u Zagrebu, Rudarsko-geološko-naftni fakultet
Permanent link / Trajna poveznica: https://urn.nsk.hr/urn:nbn:hr:169:125811
Rights / Prava: In copyright
Download date / Datum preuzimanja: 2022-02-18
Repository / Repozitorij:
Faculty of Mining, Geology and Petroleum Engineering Repository, University of Zagreb

UNIVERSITY OF ZAGREB
FACULTY OF MINING, GEOLOGY AND PETROLEUM ENGINEERING
Graduate study program Petroleum Engineering
Directionall well design using Paradigm Sysdrill simulator
Master thesis
Silvio Japundţić
N - 130
Zagreb, 2015.
University of Zagreb Master‟s Thesis
Faculty of Mining, Geology
and Petroleum Engineering
DIRECTIONAL WELL DESIGN USING PARADIGM SYSDRILL SIMULATOR
SILVIO JAPUNDŢIĆ
Thesis completed in: University of Zagreb
Faculty of Mining, Geology and Petroleum engineering
Institute of Petroleum engineering,
Pierottijeva 6, 10 000 Zagreb
Abstract
The aim of this thesis was to present a general overview of Paradigm Sysdrill 10 well planning
software, with a comparison of torque and drag results calculated by the Sysdrill 10 Torque
and Drag module for different BHA at the same depth. The data regarding a geothermal well
drilling were given by the drilling company Cougar that operates in Turkey. Geothermal well
drilling was presented in the thesis to show the complexity of such operations, particularly in
directional drilling, and the benefits that such software has on it, in terms of planning and
monitoring directional wells.
Keywords: Sydrill 10, geothermal well, directional drilling, torque, drag.
Thesis contains: 77 pages, 9 tables, 35 figures and 20 references.
Original in: English
Thesis deposited in: Library of Faculty of Mining, Geology and Petroleum Engineering,
Pierottijeva 6, Zagreb
Supervisor: PhD. Zdenko Krištafor, Full Proffesor
Technical support and assistance: PhD. Gursat Altun, Full Proffesor
Reviewers: PhD. Zdenko Krištafor, Full Proffesor
PhD. Borivoje Pašić, Assistant Proffesor
PhD. Katarina Simon, Full Proffesor
Date of defense: 18. december 2015.

Sveučilište u Zagrebu Diplomski rad
Rudarsko-geološko-naftni fakultet
PROJEKTIRANJE USMJERENE BUŠOTINE KORIŠTENJEM PARADIGM SYSDRILL
SIMULATORA
SILVIO JAPUNDŢIĆ
Diplomski rad izrađen: Sveučilište u Zagrebu
Rudarsko-geološko-naftni fakultet
Zavod za naftno inţenjerstvo
Pierottijeva 6, 1000 Zagreb
Saţetak
Cilj ovog rada bio je prikazati opće značajke Paradigm Sysdrill 10 sustava za projektiranje
bušotina, uz konkretnu usporedbu vrijednosti torzije i natega za različite BHA na istoj dubini
duţ kanala bušotine. Podaci vezani za geotermalnu bušotinu dobiveni su na korištenje od
strane kompanije za usmjereno bušenje Cougar, čije se djelatnosti odvijaju u Turskoj.
Objašnjena je izrada geotermalnih bušotina u cilju prikaza sloţenosti tih postupaka, s
naglaskom na usmjereno bušenje i kako sustav poput Sysdrill 10 moţe pomoći u
projektiranju i praćenju usmjerenih bušotina.
Ključne riječi: Sysdrill 10, geotermalna bušotina, usmjereno bušenje, torzija, nateg.
Diplomski rad sadrţi: 77 stranica, 9 tablica, 35 slika, i 20 referenca.
Jezik izvornika: engleski
Diplomski rad pohranjen: Knjiţnica Rudarsko-geološko-naftnog fakulteta
Pierottijeva 6, Zagreb
Voditelj: Prof. dr. sc. Zdenko Krištafor, redoviti profesor RGNF-a
Pomoć pri izradi: Prof. dr. sc. Gursat Altun redoviti profesr Istanbul Technicsl University
Ocjenjivači: Prof. dr. sc. Zdenko Krištafor, redoviti profesor, RGNF-a
Dr. sc. Borivoje Pašić, docent, RGNF-a
Prof. dr. sc. Katarina Simon, redovita profesorica, RGNF-a
Datum obrane: 18. prosinca 2015.

I
Content
LIST OF ABREVATIONS…….............................................................................................III
TABLE OF FIGURES…………………….……………………………………..………....IV
LIST OF TABLES……………...……………………………..……………………………..V
1. INTRODUCTION .............................................................................................................. 1
2 DIRECTIONAL DRILLING ............................................................................................ 2
3. DIRECTIONAL SURVEY ................................................................................................ 4
3.1. Inclination .................................................................................................................... 4
3.2. Magnetic survey tools ................................................................................................. 5
3.2.1. Magnetic single shot .............................................................................................. 5
3.2.2. Magnetic multishot ................................................................................................ 6
3.2.3. Measurement While Drilling (MWD) .................................................................... 6
3.3. Gyroscopic sensors ...................................................................................................... 7
3.4. Survey quality control ................................................................................................ 9
4. DRILL RIG ....................................................................................................................... 10
4.1. Stabilizers .................................................................................................................. 11
4.2. Reamers ..................................................................................................................... 12
4.3. Shock subs ................................................................................................................. 12
4.4. Jars ............................................................................................................................. 13
4.5. Pump capacity ........................................................................................................... 14
4.6. Mud program (drilling fluids) ................................................................................. 14
5. BOTTOM HOLE ASSEMBLY (BHA) .......................................................................... 17
5.1. Pendulum principle ................................................................................................... 18
5.2. Packed hole stabilization principle .......................................................................... 18
5.3. Fulcrum principle ..................................................................................................... 19
5.4. Standard BHA components ..................................................................................... 19
5.5. Non – magnetic Drill Collars ................................................................................... 20
6. POSITIVE DISPLACEMENT MOTOR ....................................................................... 22
7. GENERAL ABOUT PARADIGM SYSDRILL 10 ....................................................... 26

II
8. SYSDRILL TORQUE AND DRAG ANALYSES FOR DIFFERENT BHA’S
APPLIED IN DRILLING A REAL GEOTHERMAL WELL ........................................... 43
8.1. Wellpath planning ..................................................................................................... 51
8.2. Well design ................................................................................................................. 55
8.3. Well design of the geothermal well .......................................................................... 57
8.4. Torque and drag analyses ........................................................................................ 59
8.4.1. Torque and drag results for Packed Hole BHA .................................................. 59
8.4.2. Torque and drag results for Pendulum BHA ....................................................... 63
8.4.3. Torque and drag results for Steerable BHA ........................................................ 67
8.5. Observation and results ............................................................................................ 72
9. CONCLUSION ................................................................................................................. 74
10. BIBLIOGRAPHY ............................................................................................................ 75

III
LIST OF ABREVATIONS
API - American Petroleum Institute
BHA - Bottom Hole Assembly
BHHP - Bit Hydraulic Horse Power
CMC - Carboxymethyl Cellulose
DEG - Degree
DLS - Dog Leg Severity
ECD - Equivalent Circulating Density
ESD - Equivalent Static density
HPHT - High Pressure High Temperature
HWDP - Heavy Weight Drill Pipe
ID - Inside Diameter
INC - Inclination
JIF - Jet Impact Force
KOP - Kick Off Point
LCM - Lost Circulation Materials
LWD - Logging While Drilling
MD - Measured Depth
MMS - Magnetic Multy Shot
MSS - Magnetic Single Shot
MWD - Measuring While Drilling
OD - Outside Diameter
PDM - Positive displacement motor
TVD - True Vertical Depth
TFA - Total Flow Area
WOB - Weight on Bit

IV
TABLE OF FIGURES
Figure 3-1. Magnetic single shot device ...................................................................................... 6
Figure 4-1. A typical drilling rig .............................................................................................. 10
Figure 4-2. Stabilizers ............................................................................................................... 11
Figure 4-3. Reamers ................................................................................................................. 12
Figure 4-4. Shock Sub ............................................................................................................... 13
Figure 4-5. Jars ......................................................................................................................... 13
Figure 4-6. 3 cylinder mud pump .............................................................................................. 14
Figure 4-7. Mud window with casing shoe depth .................................................................... 15
Figure 5-1. Schematic view of the drillstring with BHA .......................................................... 17
Figure 5-2. Pendulum and Packed Hole assemblies .................................................................. 19
Figure 5-3. Non – magnetic drill collar ..................................................................................... 21
Figure 6-1. Schematic figure of a PDM .................................................................................... 22
Figure 6-2. Components of a PDM ........................................................................................... 23
Figure 6-3. Operation of a By pass valve ................................................................................ 23
Figure 6-4. Typical rotor / stator configurations ...................................................................... 24
Figure 8-1. A tipical large diamter bit used in geothermal drilling ......................................... 46
Figure 8-2.2D view of the well .................................................................................................. 54
Figure 8-3. 3D view of the well ................................................................................................. 54
Figure 8-4. Example of a geothermal well design .................................................................... 56
Figure 8-5. Casing and hole section depths .............................................................................. 58
Figure 8-6. Graphical view of Packed Hole BHA ..................................................................... 60
Figure 8-7. Surface torque vs. density for Packed Hole BHA .................................................. 62
Figure 8-8. Torsional yield vs. density for Packed Hole BHA ................................................. 62
Figure 8-9. Von Miesses stress vs. density for Packed hole BHA ............................................ 63
Figure 8-10. Graphical view of Pendulum BHA ....................................................................... 64
Figure 8-11. Surface torque vs. density for Pendulum BHA ................................................... 66
Figure 8-12. Torsional Yield vs. density for Pendulum BHA ................................................... 66
Figure 8-13. Von Miesses Stress vs. density for Pendulum BHA ............................................. 67
Figure 8-14. Graphical view of Steerable BHA ....................................................................... 68

V
Figure 8-15. Surface torque vs. density for Steerable BHA ...................................................... 70
Figure 8-16. Torsional Yield vs. density for Steerable BHA .................................................... 70
Figure 8-17. Von Miesses Stress vs. density for Steerable BHA .............................................. 71
Figure 8-18. Surface torque vs. density for different BHA‟s .................................................... 72
Figure 8-19. Torsional yield vs. density for different BHA‟s ................................................... 72
Figure 8-20. Von Miesses stress vs. density for different BHA‟s ............................................. 73
LIST OF TABLES
Table 7-1. Choosing assembly option ....................................................................................... 33
Table 8-1. Survey values .......................................................................................................... 51
Table 8-2. Cougar well planning path ....................................................................................... 52
Table 8-3. Hole section profile .................................................................................................. 57
Table 8-4. Casing profile ........................................................................................................... 57
Table 8-5. Defined values for torque and drag calculations ..................................................... 59
Table 8-6. Torque and drag results for Packed Hole BHA ....................................................... 61
Table 8-7. Torque and drag results for Pendulum BHA........................................................... 65
Table 8-8. Torque and drag results for Steerable BHA ........................................................... 69

1
1. INTRODUCTION
Sysdrill 10 was developed by the company Paradigm, and it is one of the industry most
advanced software for directional drilling, well planning and survey management system. It is
used both by operating and drilling service companies, to plan, drill and monitor directional
wells.
In geothermal drilling, the high temperature and hardness of the rock cause some major
drilling problems such as: abrasion of the down hole components (mostly bit and drill collars),
reduction of the steel strength, uses of special down hole motors.
Geothermal wells directional drilling is a complex technology and there is a number of ways
to drill a deviate hole, the most usual is to use a down hole motor to drive the bit without
rotating the drill string, hydraulically powered by drilling fluid flowing throw it.
Directional drilling in geothermal wells is more difficult because both the electronic tool used
to control and survey the well trajectory and elastomer elements in the motor are affected by
high temperatures. Progress has been made in this area, but it is still a technical challenge.
High values of drill string torque and drag is a common problem in directional drilling while
increasing the inclination of the well. That is why a good modeling program, such as Sysdrill
10 Torque and Drag can be a reliable tool to effectively calculate values for torque and drag
analyses. During the planning phase of a well the models are used to optimize the trajectory
design, to minimize torque and drag and contact forces between the drill string and borehole.
The models are also used to monitor the hole conditions while drilling, detecting potential hole
cleaning problems, watching out for differential sticking materials, monitoring for high torque
in planned highly tortuous trajectories.
Accurate torque and drag modeling gives the opportunity to build reliable well trajectories,
wıth consideration of the rig capabilities and geological complexity of the structures where the
drilling will be achieved.
In this case torque and drag analysis were made using an actual geothermal directional drilling
data, which was given by the drilling company Cougar that operates in Turkey.

2
2 DIRECTIONAL DRILLING
Controlled directional drilling is the process of deviating a wellbore along a predetermined
course to a target whose location is given as a lateral distance from the vertical (Adams 1985).
The need for directional drilling is dictated by geological targets, in order to intersect as many
fractures as possible or lease boundaries, which are included in the well design. Quite often a
target zone lies beneath a surface location that is impractical as a rig site. Common examples
include: mountains, riverbeds, residential locations, roads, etc…
Rotary systems
In directional drilling the bit is turned with the rotary system or a down hole motor device, the
conventional rotary system has the bit connected directly to the drill string, and is rotated from
the surface. Down hole motors/turbines are receiving a significant amount of use because they
can be used in connection with bents subs and steering tools. Motors and turbines are provided
in a wide range of sizes, torque characteristics and operating speeds (Adams, 1985).
MWD (Measurement While Drilling) is also a common method of measuring parameters
down hole and sending results to the surface without interrupting routine drilling operations. A
special tool containing sensors, transmitters and power supply is installed as a part of the
BHA. The information is transmitted to the surface by a telemetry system using mud pulses.
High - temperature turbines have been demonstrated, and service companies have recently
begun to offer positive displacement motors (PDM). This technology is relatively new, but
could be a significant asset for geothermal drilling.
Neither PDM or MWD operate reliably at high temperatures, so corrections are mostly done
at depths are still cooler than 175°C (Blankenship and Finger, 2010).

3
Drilling parameters
There are three drilling parameters whıch guarantee, in the right combination, an optimum rate
of penetration. One of the most important parameter is the flow rate of the drilling mud, which
serves as a transportation mean for cuttings, and cleaning the bit. The efficiency of the flow
rate depends on the borehole diameter, mud and rocks parameters (Bracke et al, 2013).
The next parameter is WOB (weight on bit) and it has the purpose to overcome the
compressive strength of the formations to produce the cuttings, which is mostly created by
3/4rd of the drill collars weight.
The rotation additionally reduces the drag and torque of the drilling equipment (Bracke et al,
2013).

4
3. DIRECTIONAL SURVEY
Directional survey is the method used to obtain the needed measurement to calculate and plot
the 3D well path. There are three parameters measured at multiple locations along the well:
- measured depth (MD);
- inclination;
- hole direction
MD is the actual depth of the hole drilled to any point along the wellbore, inclination is the
angle measured in degrees and hole direction is the angle, measured in degrees, of the
horizontal component of the borehole or survey-instrument axis from a known north reference.
The measurements are used together to calculate the 3D coordinates, which can then be
presented as a table of numbers called a survey report.
The purposes of directional survey are to (Lake, 2006):
- determine the exact bottomhole location;
- monitor the actual well path to ensure the target will be reached;
- orient deflection tools for navigating well paths;
- ensure that the drilled well does not intersect nearby wells (avoid collision);
- calculate the TVD of the various formations to get a proper geological mapping;
- evaluate the dog leg severity (DLS), which is the total angular inclination and azimuth
in the wellbore, calculated;
- to fulfill requirements by the regulatory authorities.
3.1. Inclination
Inclination angle is normally measured by a mechanical pendulum positioned in a special
barrel.

5
The instrument measures the hole inclination in degrees and records this measurement on a
paper disc when punched by the pendulum stylus. The paper disc is divided into concentric
circles, each circle representing one degree of deviation. The device is also equipped with a
timing device to control the movement of the paper when the survey depth is reached. The
instrument is usually called, Totco, after the company who firstly produced it. (Rabia, 2002)
Another way of measuring hole inclination is by using the Teledrift Inclination only with
MWD tool.
It measures deviation angles up to 10 ½ °. The tool generates signals in the form of pressure
surges in the mud stream. Those signals are then detected on the surface by a chart recorder.
3.2. Magnetic survey tools
Magnetic Survey Tools are designed for measure both hole inclination and azimuth.
The common magnetic survey tools used in the industry (Rabia, 2002):
- magnetic single shot (MSS): either photomechanical or electronic;
- magnetic multishot (MMS): either photomechanical or electronic;
- measurement while drilling (MWD).
3.2.1. Magnetic single shot
The instrument measures hole inclination and magnetic north direction. The instrument
consists of:
- compass card;
- pendulum: (gives hole inclination);
- camera: to capture the image of direction and inclination on film;

6
- timing device: to turn the light on;
- battery.
Magnetic single shot are often run if MWD fails (Rabia, 2002). Figure 3-1.shows a typical
magnetic single shot device.
Figure 3-1. Magnetic single shot device (www.china-ogpe.com)
3.2.2. Magnetic multishot
The electronic magnetic multishot use the same components as the electronic single-shot; the
only difference is that electronic multishots record multiple survey records. The instruments
measures both hole inclination and directions, and records data on a photographic film or
digitally.
3.2.3. Measurement While Drilling (MWD)
MWD measures hole inclination and azimuth in real time. The magnetic survey information is
obtained with an electronic compass, but, unlike previous systems that stored the information,
the MWD relays the data through the mud. The real-time survey information enables the

7
drillers to make directional-drilling decisions while drilling. The tool contains a plunger which
send signals through the mud inside the drill string. The tool is called positive pulse MWD.
MWD tools which sends signals through the annulus are called negative pulse MWD. It sends
signals through an aperture inside the casing of the MWD tool through mud in the annulus to
be detected at the surface. When the plunger is operated it partially restricts the flow of mud
through the tool, this is observed in the surface as an increase in the standpipe pressure. When
the tool is operated a series of mud pulses are observed at the surfaces and decoded into
directional data.
MWD can also have other sensors to measure a variety of down hole data including:
temperature, direction, drill string dynamic and formation evaluation data (gamma ray,
resistivity and density). When other than directional data, namely also formation evaluation
data are measured, the combined tool is called LWD (Logging While Drilling).
3.3. Gyroscopic sensors
Gyroscopic survey instruments are mostly used when the results of other magnetic survey
systems may be influenced by extraneous parameters, such as cased holes, production tubing,
and geographic location or nearby existing wells. A rotor gyroscope is composed by a
spinning wheel positioned on shaft, also called gimbal , it is powered by an electric motor, and
it can reach speeds up to 40, 000 rev/min. The rotor can be orientated or pointed in a known
direction (Lake, 2006).
The direction in which the Gyro rotates is maintained by its own inertia, and it can be used as
a reference for measuring the azimuth.
There are three types of Gyros:
- conventional or free Gyro;
- rate or north seeking Gyro;
- inertial navigation systems.

8
Conventional or free Gyro
The main parts of conventional or free Gyro is a rapidly spinning rotor mounted on a frame or
gimbals. The spinning top of the Gyro should maintain a vertical direction as long as the top
spins fast enough and no other external forces act on it. The rotation is maintained by a
electrical motor. Although, it is almost impossible to maintain a perfectly vertical direction
because of the external forces. A typical Gyro used in the oil and gas industry has two frames
(gimbals) which remain perpendicular to each other and they allow free rotation of the rotor.
There are outer and inner gimbals. The gimbal is the one holding the rotor.
The rotor has two other basic components: a compass and a plumb bob assembly over the
compass for measuring hole inclination.
North seeking Gyros
The north seeking Gyros use electronics to calculate the rate of rotation of the earth, and then
determine the direction of true north. These use the horizontal component of the Earths
rotational rate to determine north. The Earth rotates 360° in 24 hours, or 15° in 1 hour.
North seeking Gyros can be run inside drillpipe or casing, they provide surface readout of the
wellbore survey through a conducting wireline. They are often used for orientation purpose
and can provide a section or complete wellbore survey (Rabia, 2002).
Inertial navigation system
Inertial navigation system uses group of gyros to establish the true north, and accelerometers
to measure movements in the x, y and z axes of the wellbore. It is more expensive than the
previous two.

9
3.4. Survey quality control
The problem of a directional surveying is that it can never be precisely verified. It is very
difficult to go down the well and get sure that the calculations is right and the bottom is
located where the calculations claim. The most efficient way of verifying survey results is to
have surveys obtained from two different sensor types such as a combination of MWD and
gyroscopic systems.

10
4. DRILL RIG
To ensure maximum operating efficiency, the rig must be properly sized for the well. Usually,
the rig is specified on the depth range and the hoisting horse power. Less rig power means a
lower price, but if the lower powered rig does not meet the specifications, it will increase the
costs for the contractor. On the other hand an oversized rig well insures higher costs as
necessary (Bracke et al, 2013). Figure 4-1 shows a typical drilling rig.
Figure 4-1. A typical drilling rig (Aydin, 2015)
The rig requirements also change with well diameter and depth. When the drilling rates are
decreasing the wellbore size becomes smaller or bit runs decrease ass less rotary torque and
pump power is needed (Bracke et al, 2013).
The weight of the drill string is much greater than the desirable force on the bit, so the rig
should have a hoisting capability to hold back some of the string weight to control force on the
bit. The outside diameter of the drill collars is defined by the necessary annulus between the
collars and the wellbore. The inside diameter of the drill collar is determined by hydraulic
considerations (large enough to prevent excessive pressure drop, the necessity to pass logging
tools, etc..) Although very large diameters holes for geothermal wells, the outer diameter of
the drill collars is limited by the practicalities of handling large diameter tools with the current

11
equipment. Because most of the BHA is in compression, the increase loading susceptible for
H2S, requiring special attention to material specifications. Therefore, there are usually used,
special designed stress relief connections to minimize the cyclic stresses. Other components of
the BHA assembly usually include:
- stabilizers;
- reamers;
- shock subs;
- jars.
4.1. Stabilizers
Because the drill collars and other components must be smaller than the wellbore diameter to
provide a space for circulation, they can have major lateral deflections. Stabilizers that have
full wellbore diameters and ribs along the outside surface, but leave a flow path between the
ribs, are usually used at multiple points in and above the bottom – hole assembly. A minimum
number of stabilizers should be run to reduce the risk of getting stuck in cuttings
(Blanckenship and Finger, 2010). Figure 4-2.shows a standardly used stabilizer.
Figure 4-2. Stabilizers ( Aydin, 2015)
12
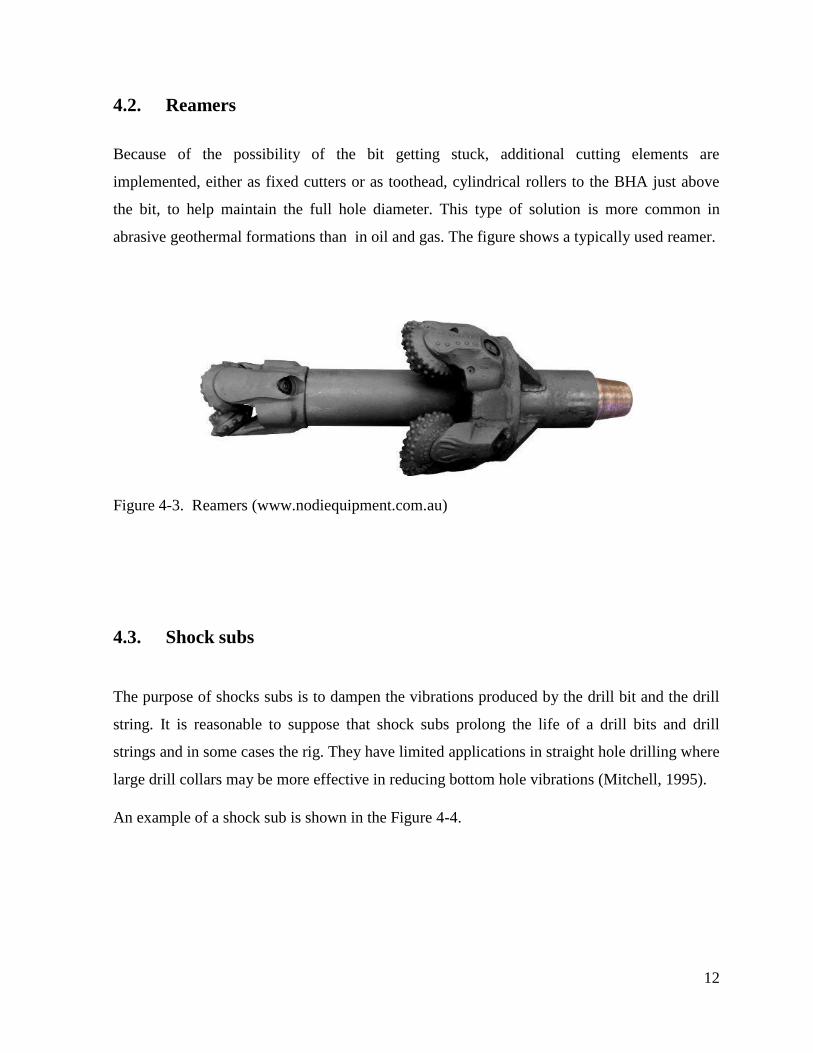
4.2. Reamers
Because of the possibility of the bit getting stuck, additional cutting elements are
implemented, either as fixed cutters or as toothead, cylindrical rollers to the BHA just above
the bit, to help maintain the full hole diameter. This type of solution is more common in
abrasive geothermal formations than in oil and gas. The figure shows a typically used reamer.
Figure 4-3. Reamers (www.nodiequipment.com.au)
4.3. Shock subs
The purpose of shocks subs is to dampen the vibrations produced by the drill bit and the drill
string. It is reasonable to suppose that shock subs prolong the life of a drill bits and drill
strings and in some cases the rig. They have limited applications in straight hole drilling where
large drill collars may be more effective in reducing bottom hole vibrations (Mitchell, 1995).
An example of a shock sub is shown in the Figure 4-4.

13
Figure 4-4. Shock Sub (www.tubetechnologiesinc.com)
4.4. Jars
If the drill string is stuck in the hole, it can be released by the impact force produced by jars.
When getting stuck while going down, the pipe need to be jarred up. When getting stuck while
going up, the pipe needs to be jarred down. The jar‟s function is to release energy stored in the
drill string by pulling up on it and stretching, or setting down and compressed it (Blanckenship
and Finger, 2010).
There are two principle types of jars: mechanical and hydraulic jars. They both operate at the
same principle. Correct placement of the jars in the BHA is critical to maximize their
effectiveness and avoid causing failure. Figure 4-5. shows a jar pulled on the rig.
Figure 4-5. Jars (Aydin, 2015)

14
4.5. Pump capacity
The pumps should have enough volumetric capacity to give sufficient velocity in the annulus
to lift the cuttings. Their pressure capacity must provide the desire pressure drop through the
bit, compensate all pipe pressure losses and possible drive a down hole motor (Bracke et al,
2013).
Because of the generally larger hole sizes (and volumes) in geothermal wells, pumps will be
bigger than for oil wells of comparable depth. The pumps should also be able to handle lost
circulation materials (LCM). As a primary part of geothermal well control is the ability to
pump cooling water into the well (reinjection), it is desirable to have a standby diesel driven
mud pump on diesel electric rigs. Figure 4-6. shows a typically used mud pump.
Figure 4-6. 3 cylinder mud pump ( Aydin, 2015)
4.6. Mud program (drilling fluids)
The drilling fluid flows down through the inside of the drill pipe, through the nozzles in the bit
and back up in the annulus between the borehole wall and drill pipe, carrying the cuttings

15
produced by the bit action on the rock. However, the mud has to be adjusted to the formation
rock and fluid chemistry in order to reduce interaction between the two (Bracke et al, 2013).
The main objective for the mud is to control formation pressure, stabilize the well, to transport
produced cuttings and to help them stay in suspension while there is no circulation.
Other functions of the mud is to: cool and clean the bit, lubricate the drill string, allow
collection of geological information, form a semi – permeable filter cake to seal the pore
spaces in the formations, transmit hydraulic horse power for down hole motors.
İn order to control the formation pressure and stabilize the well, the mud pressure must be
controlled in a small window between the pore pressure and the formation pressure/fracture
gradient of the rock. The mud pressure is dictated by the density of the cutting loaded mud
with consideration of additional friction losses and the true vertical depth. Figure 4-7. shows a
graphical view of mud window and casing shoes.
Figure 4-7. Mud window with casing shoe depth (Bracke et al, 2013)

16
Viscosity is another important parameter of the mud that increases the efficiency of the
cuttings transport. Increasing viscosity means hıgh pressure loss due to friction effects. This
affect the ECD (Equivalent Circulating Density).
Drilling fluid can be either liquid or gas, and liquid based fluid is universally called “mud”
because the first fluids where just a mixture of water and clay. Large hole volumes and
frequent loss mean that expensive mud has a significant impact on drilling cost.
Drilling record from a number of geothermal wells in several reservoirs showed the typical
property range bellow (Blanckenship and Finger, 2010).
- Density 1.03 – 1.15 g/cm3
- Funnel Viscosity 35 – 55 sec
- pH 9.5 – 11.5
- Plastic vıscosity 0.01 – 0.02 Pas
- Yield point 25 – 125 Pa.

17
5. BOTTOM HOLE ASSEMBLY (BHA)
The BHA is a portion of the drill string that affects the trajectory of the bit and, consequently,
of the wellbore. The BHA design objective for directional control is to provide the directional
tendency that will match the planned trajectory of the well. The bit side force is the most
important factor affecting the drilling tendency. The direction and magnitude of the bit side
force determine the build, drop, and turn tendencies.
The bottom hole assembly refers to the drill collars, heavy wall drill pipes (HWDP), stabilizers
and other accessories used in the drill string. All wells whether vertical or directional require
careful design of the bottom hole assembly (BHA) to control the direction of the well in order
to achieve the targets objectives. Stabilizers and drill collars are the main components used to
control hole inclination (Rabia, 2002).Figure 5-1. shows a schematic view of drillstring as well
as BHA.
Figure 5-1. Schematic view of the drillstring with BHA (www.abdn.ac.uk)

18
There are three ways in which BHA may be used for directional control (Rabia, 2002):
- pendulum principle;
- packed hole stabilization principle fulcrum principle;
- fulcrum principle.
5.1. Pendulum principle
Pendulum principle is used to drop angle especially on high angle wells where it is usually
very easy to drop angle. The pendulum technique relies on the principle that the force of
gravity can be used to deflect the hole back to vertical. The force of gravity is related to the
length of the drill collars between the drill bit and the first point of tangency between the drill
collars and hole (Rabia, 2002).
Increasing the length of the drill collars causes the side force to increase more rapidly than the
along hole component. High WOB‟s used with a pendulum assembly may bend the BHA and
cause the hole angle to build instead of drop.
5.2. Packed hole stabilization principle
This is used to hold or maintain the hole inclination and direction, and are typically used to
drill a tangent section of a well. The packed BHA relies on the principle that two points will
contact and follow a sharp curve, while three points will follow a straight line. Packed BHA
have several full gauge stabilizers in the lowest portions of the BHA, typically three or four
stabilizers (Rabia, 2002).
Figure 5-2. shows the difference between pendulum and packed hole assemblies.

19
Figure 5-2. Pendulum and Packed Hole assemblies (www.oilngasdrilling.com)
5.3. Fulcrum principle
This principle is used to build angle (or increase hole inclination) by using a near bit stabilizer
to act as a pivot or fulcrum of a lever. The lever is a length of the drill collars from the point of
contact with the low side of the hole and top of the stabilizers. The drill bit is pressed to the
high side of the hole causing angle to be built as drilling ahead.. Since the drill collars bend
more as more WOB is applied, the rate of angle build will also increase with WOB (Rabia,
2002).
5.4. Standard BHA components
Using the three principles of BHA, there are five basic types of BHA‟s which may be used to
control the direction of the well (Rabia, 2002):

20
1. Pendulum assembly
2. Packed bottom hole assembly
3. Rotary build assembly
4. Rotary bottom assembly
5. Steerable assembly
6. Mud motor and bent sub assembly.
5.5. Non – magnetic Drill Collars
The primary purpose of non –magnetic drill collars is to reduce the interference of the
magnetic field associated with those sections of the BHA which are both above the magnetic
compass contained in the survey tool with the earth‟s magnetic field. The non – magnetic
collars reduce this type of interference by moving the BHA section away from the survey
compass.
Magnetic surveys suffer from the following sources of errors (Rabia, 2002):
- drill string magnetization;
- magnetic effects from casing strings or BHA;
- geological structures containing magnetic materials;
- magnetic storm effects;
- wireline magnetization;
- magnetic declination;
- tool misalignment;
- depth measurement.
There are four critical factors in selecting nonmagnetic collars:

21
a) the total length;
b) the location of the survey compass;
c) the type of materials of which the compass is made;
d) distinguished “hot spots “.
“Hot spots” are zones of high magnetic field strengths within the material of the collars. Hot
spots can affect compasses by a much of 4 degrees (Rabia, 2002).
Non – magnetic collars may be manufactured by many type of materials. The selection is
based primarily on the corrosion resistance of the material. The most common non – magnetic
material is stainless steel, while monel, which is 60% nickel and 30% cooper, is seldom used.
A practical method of ascertaining the best location for the survey compass and the requisite
non – magnetic collar length is to run a BHA into the drill hole and pull a compass through the
nonmagnetic collars. The portion of the non - magnetic collars which do not show the effects
of the fields of the BHA may be removed from the BHA. The figure bellow (figure 5-3.)
shows a non – magnetic drill collar.
Figure 5-3. Non – magnetic drill collar (Aydin, 2015)

22
6. POSITIVE DISPLACEMENT MOTOR
The first commercial positive displacement motor (PDM) was introduced to the petroleum
industry in the late 1960s. Since then, PDM use has been accelerated greatly for directional-
drilling applications.
A positive displacement motor is a hydraulically driven downhole motor that uses the
Moineau principle to rotate the bit, independent of drill string rotation.
Figure 6-1. Schematic figure of a PDM (www.laser-ndt.com)
The PDM is made of several sections:
- by – pass valve or dumps sub;
- motor section;
- universal joint or connecting rod section;
- bearing section with drive sub.
Figure 6-2.shows the components of a PDM.

23
Figure 6-2. Components of a PDM (www.BakerHughes.com)
By – pass valve
The by pass valve allows fluid to fill the drill string while tripping in the hole and to drain
while tripping out. When mud is pumped, the valve closes causing fluid to move through the
tool. Most valves are of a spring piston which closes under pressure to seal off ports to the
annulus. When there is no downward pressure, the spring forces the piston up so fluid can
channel through the ports of the annulus. Figure 6-3. Shows the operation that allows a By
pass valve.
Figure 6-3. Operation of a By pass valve (Inglis, 1987)

24
Motor section
The PDM consist of a helical steel motor fitted inside a spirally – shaped elastomer modeled
stator. A rotor/stator pair converts the hydraulic energy of the pressurized circulating fluid to
mechanical energy for that allows rotate the rotor.
The magnitude of rotation produced is proportional to the volume of mud pumped through the
motor. The torque generated in the PDM is proportional to WOB and to the pressure drop in
the motor. The highest the value of WOB, the highest is the differential pressure in the power
section. Which means that an increase in WOB will cause an increase in pumping pressure due
to increased differential pressure across the power section. This must be a concern in drilling
operations when only a limited pumping pressure is available.
The rotor and stator are of lobed design. Both rotor and stator lobe profiles are similar, with
the steel rotor having one less lobe than the elastomeric stator. The rotor / stator configuration
(or lobe ratio) currently in use are: 1/2, 3/4, 5/6, 7/8, 9/10. The speed and torque of a power
section is linked directly to the number of lobes on the rotor and stator. The greater the number
of lobes, the greater the torque and the lower the rotary speed. Figure 6-4. shows a typical
rotor / stator configuration from a PDM.
Figure 6-4. Typical rotor / stator configurations (www.BakerHughes.com)

25
Universal joint
It is connected to the lower end of the rotor. It transmits the torque and rotational speed to the
drive shaft and bit.
Bearing section
It transmits drilling thrust and rotational power to the drill bit.
Steerable positive displacement motor
A steerable motor can be used in oriented mode (sliding) or rotary mode. In rotary mode the
steerable motor becomes ''locked'' with respect to the trajectory and the hole direction and
inclination are maintained while drilling. In the sliding mode, the drill string remains
stationary (the rotary table or top drive is locked) while the drill bit is rotated by the motor.
The use of steerable motors with the correct bit and BHA reduces the time needed to get the
desired inclination / azimuth.

26
7. GENERAL ABOUT PARADIGM SYSDRILL 10
Paradigm Sysdrill 10 as a well planning program allows drilling engineers to perform
advanced engineering analysis in integrated software with minimal effort in order to enhance
well planning accuracy.
Sysdrill modules
The software allows the use of different modules, such as: well design, engineering analyses,
torque and drag analyses, hydraulics analyses, cementing and casing analyses.
Benefits of Sysdrill 10
- minimize training time using flexible spreadsheet‟s, given by Paradigm that allow the
drilling engineer to quickly plan wells;
- plan the most precise and cost effective directional survey programs to ensure the
wellbore placement wıthin the driller target;
- reduce drilling risk by minimizing the possibility of collision wellbore using wellbore
positional uncertainty incorporated into the anti-collisions analysis;
- save time by using directional survey data that can be entered manually or imported
from a file.
Well planning
The software allows the drilling engineer to visualize the target including shape, dimension,
rotations, thickness, position, dip and offsets. It is also possible to import surfaces created
27
from both Paradigm and 3rd
party geological packages into Sysdrill to create a 3D model, for
visualization and computing intersection for casing placement. Sysdrill can be used to plan
sidetrack, multilateral and reentry wells by tying to existing wellbores stored in the Sysdrill
database. Casings, hole sections, comments, and survey errors tools can also be defined.
Field & data management
Sysdrill has been designed a corporate data base for wellbore data. The global position of
field, rigs and slots can be specified in geographic, UTM or Lambert coordinates from over
1000 coordinate system included as standard formats. In Sysdrill targets can be created at
either Fields or Wellbore levels, they can be associated wıth field, well and wellbore objects in
the data hierarchy so as to enable easier target management. Targets entered at field level are
available to all wells and wellbore that are defined beneath the field. As well as manually
entered targets the software allows to import targets from other software applications. Lease
lines and local boundaries can also be entered and visualized. Unit definitions, clearance rules,
and other defaults settings can be specified on an individual operator basis.
Slots and rig datum
A slot defines the surface position from which a wellbore is drilled. A rig datum is a depth
reference point against which subsequent depth measurement should be taken. This is
commonly the rotary table of the drilling rig and similar and may be subject to change over
time, for example if different drilling rigs are used to drill the original hole and subsequent
sidetrack.
Individually rig kelly bushing (RKB) elevations and slot permanent datum are stored for each
wellbore, allowing wells to be entered wıthout having to modify the original data. This ensures
the integrity of the database and provides a definitive wellbore history, including RKB
elevations, overlapping surveys, and errors models. A sophisticated security function using a
28
set of access controls allows permissions and a history log that permits to restrict and to
monitor access to individual users and group.
Creating a planned wellpath
A planned wellpath is a description of the shape and orientation of a proposed wellbore.
Wellpaths can be relatively simple for vertical wellbores but can become very complicated for
directional and horizontal wellbores.
Sysdrill uses values entered by the user to calculate a minimum curvature wellpath between
the stations, certain combinations of values have to be entered to allow the calculations to be
calculated.. To help wıth this calculation Sysdrill supports a series of predefined profiles that
can be solved by entering constraints at the stations.
These profiles correspond to commonly used sequences of curving, (build/drop/turn) and
straight (hold) sections used in wellpath design. Both 2D (constant azimuth) and 3D (changing
azimuth) profiles are supported. There are often many different ways to solve a planned
wellpath.
The wellpath spreadsheet uses dıfferent colors to indicate dıfferences within the data. Values
which constrain the design (targets positions, manually entered values etc.) are displayed as
white text on a green background while values calculated by the system (based on the entered
values) appear as black text on a white background.
Survey error models
As with any form of measurement there is a positional uncertainty associated with the exact
location of all wells drilled. This positional uncertainty will vary in size depending upon
which survey tools are run and which Survey Error Models are therefore applied to the
Planned Wellbore. It is possible to apply one or more Survey Error Models to the Planned
Wellpath to determine the overall extent of the position uncertainty. The definitive wellbore is

29
created by specifying to/from depths for each survey section resulting in the definitive
wellbore position and its positional uncertainty. Once the final survey has been loaded, it can
be locked as definitive, thus ensuring the integrity of the database for anti-collision analysis or
future re-entry.
Anti-collision analysis
Anti – collisions analysis can be performed against an unlimited number of offset wells stored
in the Paradigm Sysdrill Database.If positional uncertainty has been specified at surface, than
it can also be included in the anti – collision analysis.
Pressure & temperature data
Pressure and temperature data is used in the sysdrill for engineering calculatıons. Data such as
pore pressure, fracture gradient, hole collapse gradient and temperature profiles can be defined
in Sysdrill in SI Metric, API Oilfield, API Metric units. Pressure and temperature data can be
entered as values or gradients and as MD or TVD.
Casing design
Sysdrill allows the user to design the minimal number of casing string required in order to
safely complete a well, reducing the well costs as much as possible. The design of the load
cases can be specıfied according to company policy and stored in catalogs. It is also possible
to get a graphical view of the casing positioned in the well.

30
Casing seat calculations
Casing setting depths can be automatically calculated based upon the pressure data, swab and
surge margin and maximal open hole distance. It is possible to get than a graphical display of
the proposed casing depths.
Kick tolerance calculator
Sysdrill 10 offers two calculation methods in the Well Control Analysis module.
Firstly the Kick Pressure Test calculates the safe casing shoe depth or point at which a fixed
volume of gas would cause fracture whilst circulating out the kick. Secondly the Maximum
Influx Calculation calculate the maximum possible influx of gas at TD before fracture would
occur while circulating out the kick.
The kick tolerance uses a Single Bubble Method to determine the volume and the density of a
bubble as it is circulated out of the wellbore.

31
Creating a rig
A rig is defined by the physical operating parameters of the surface equipment. The defined
items are:
- rig name;
- rig type;
- block weight;
- max torque;
- max hook load;
- surface equipment.
Sysdrill also allows to choose a required mud pump from the catalogue, the Sysdrill catalogue
has a various number of mud pumps, every pump is defined by their specifications (name,
type, rod diameter, stroke length, max SPM, mechanical power, pop off pressure, volumetric
efficiency, maximal operating pressure, volume per stroke).Figure 7-1. shows the proprieties
of a mud pump from Sysdrill database.
Figure 7-1. Mud pump taken from the Sysdrill 10 catalogue (Sysdrill 10)

32
Plotting & reporting
Sysdrill offers an extensive set of predefined plots and reports templates for calculations.
Users can set up their favorite (most used) plots and reports for planned and actual wellbore.
3D Visualization
The actual wellbore can be viewed interactively in the 3D viewer and compared against the
planned wellbore, and other wells in the field. Geological surfaces, casings, uncertainty, and
drillers targets may also be displayed. Figure 7-2. shows a 3D visualization of the wellpath
with casing strings.
Figure 7-2. 3D view of a well (Sysdrill 10)

33
Assemblies
Sysdrill allows complex BHA‟s by rapid filtering of extensive catalogs of drilling equipment
including bits, collars, pressure loss devices, centralizers, stabilizers, torque reduction subs,
and accessories. BHA‟s that are created can be stored in catalogs for future usage and new
catalogs can be added. A customizable graphical view combines mechanical properties and
physical dimensions. The Assembly Builder includes tools to allow definition of complex
assemblies. Accessory components are those that can be inserted between or clamped on a
tubular item. Common accessories are stand – off devices, torque reducers, pipe protectors,
centralizers etc. Casing couplings and connections are also defined in this manner.
Sysdrill also provides a few simple mechanisms that allow defined assemblies to be copied
between different projects between different projects in the database.
The Assembly Wizard allows the user to specify the assembly type and the creation method.
Table 7-1. shows the different assembly‟s options.
Table 7-1. Choosing assembly option (Sysdrill 10)
Option Description
Type Indicates that the assembly is to be manually defined.
Existing The new assembly is to be crated as copy of an existing assembly within a
the database .A filter – based search mechanism allows rapid identification
of a particular assembly in the database
Catalogue The new assembly is to be crated as a copy that exist within en equipment
catalogue. A filter based search mechanism allows rapid identification of
particular assembly or group of potential assemblies within available
catalogues.
File The new assembly is to be created from an external file.

34
Figure 7-3. shows a graphical view of a chosen BHA assembly.
Figure 7-3. Graphical view of a BHA assembly (Sysdrill 10)
Torque & drag analysis
The torque & drag calculation involves mechanical analysis of a string within a particular hole
section. It is used to validate well design and to prevent loss of rig time by eliminating drill
string failure. The torque & drag calculation editor allows efficient definitions of inputs,
execution of calculations and analysis of results, plus access to other related calculations and
functions.

35
Functional feature
Sysdrill functional features include:
- any number and combination of operating modes may be defined and used in a
calculation;
- calculation may be run as a static depth analysis or over a depth interval range;
- calculation can be run using „Soft String‟ or „Stiff String‟ models;
- visualize effective tension, true tension, torque, slide force, twist/stretch, drag, pressure
and stress loads against operating limits;
- import and display of surface torque and hook load values for comparison with
calculated results;
- vibration, stuck point, friction and packer calculations are also available within the
Torque & Drag calculation.
Figure 7-4. shows Sysdrill torque and drag features.
Figure 7-4. Sysdrill 10 Torque and Drag features (Sysdrill 10)

36
Defining wellbore fluid
Fluid must be defined for the torque and drag calculations as they are used in the calculation
of buoyancy and viscous forces while circulating. Sysdrill allows the definition of one or more
fluids and their position in the well. It is also possible to access predefined fluids from
catalogues. The picture shows the wellbore fluid defined in the program. The figure bellow
(figure 7-5.) shows input data for defining drilling fluids.
Figure 7-5. Defined drilling fluid (mud) (Sysdrill 10)
Friction factor & tortuosity
The friction factor sensitivity module performs analyses at varying depths using common
friction factors, one for the open hole and for the close hole. The friction factor is defined as
the ratio of the force required to move an object to the force between the object and the surface
on which is resting.
Friction factors for synthetic OBM: Cased Hole (0.15 -2.0) and Open Hole (0.17-0.26)

37
Soft & stiff string analysis
Soft & stiff string analysis options allow calculations of all the forces acting upon the BHA,
including torque, drag force, stresses and side forces.
By default Sysdrill uses soft string analysis for torque and drag calculations. This assumes that
all the components lies on the low side of the hole and all of them are in contact; consequently
all components contribute to the overall drag effect.
There is also a second method, stiff string. Stiff string assumes that only the tool joints or
other external upsets are in contact with the wellbore. The position of the tubular elements can
also be calculated. It can be seen that part of the string that is no in contact with the wellbore.
This parts do not contribute to the overall drag force, resulting more exact analysis of torque &
drag.
Advanced assembly definition
The Assembly Builder includes tools to allow definition of complex assemblies. Accessory
components are those that can be inserted between or clamped on to a tubular item. Common
Accessories are stand – off devices, torque reducers, pipe protectors, centralizers, casing
couplings etc. All these complex assemblies can be find in the Sysdrill catalogue or be
imported or defined directly in Sysdrill.
Jar placement
The position of the jar is determined by the operating parameters and hole conditions. In order
for getting the proper position the drilling parameters such as: WOB, flow rate, bit total flow
area (TFA), if drilling rotary should be defined. Also safety margins have to be defined.
38
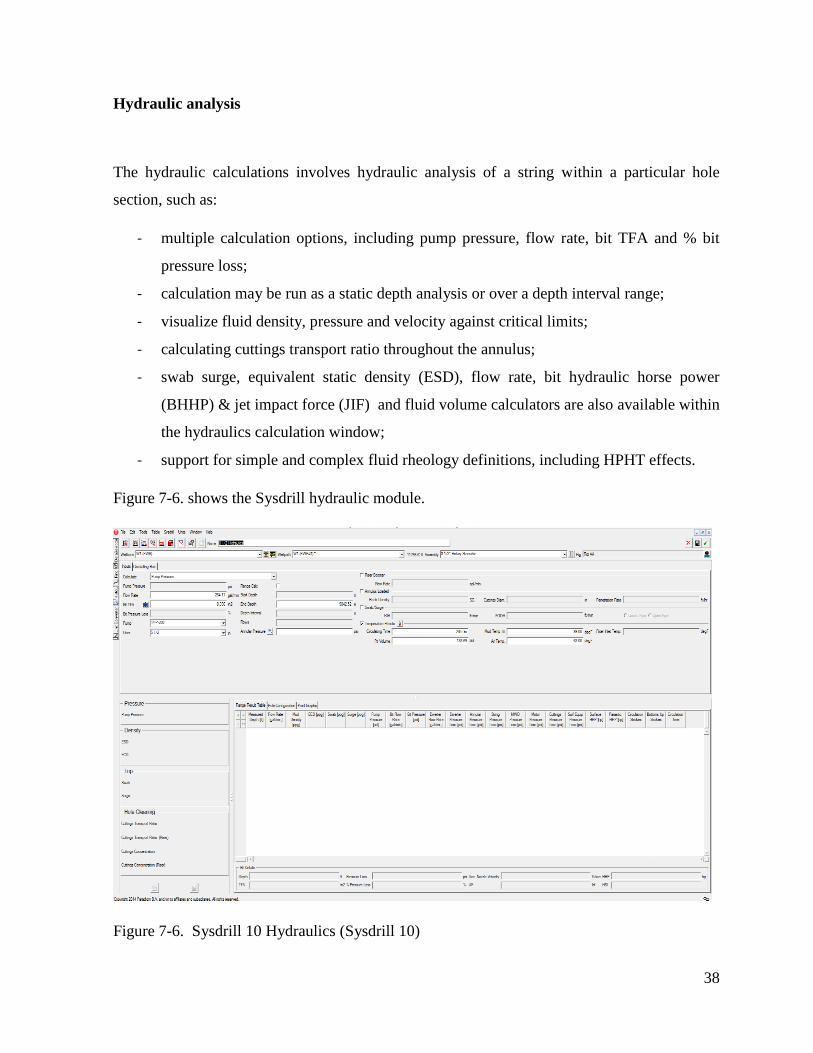
Hydraulic analysis
The hydraulic calculations involves hydraulic analysis of a string within a particular hole
section, such as:
- multiple calculation options, including pump pressure, flow rate, bit TFA and % bit
pressure loss;
- calculation may be run as a static depth analysis or over a depth interval range;
- visualize fluid density, pressure and velocity against critical limits;
- calculating cuttings transport ratio throughout the annulus;
- swab surge, equivalent static density (ESD), flow rate, bit hydraulic horse power
(BHHP) & jet impact force (JIF) and fluid volume calculators are also available within
the hydraulics calculation window;
- support for simple and complex fluid rheology definitions, including HPHT effects.
Figure 7-6. shows the Sysdrill hydraulic module.
Figure 7-6. Sysdrill 10 Hydraulics (Sysdrill 10)

39
Rheology
The Fluid Builder allows accurate definition of fluid proprieties for use in all engineering
calculations. Fluid can be stored in catalogues for re – use in another analysis. A rheology
model selector can analyze drilling fluids and automatically select the most suitable rheology
model based upon viscosimetar readings. Bingham plastic, power low, Herschel Bulkley &
Robert Stiff models are supported.
HPHT can be defined using multiple HPHT readings.
Swab/Surge pressure
The Swab Surge calculator allows the evaluation of swab/surge effects over varying run
speeds. It reports swab/surge densities at both the beginning and end of the currently selected
hole section. The maximum running speed for BHA‟s and casing string (both open and closed
pipe) can be calculated to improve efficiency and safely reduce rig costs reducing the risk of
formation breakdown or swab induced influxes.
Edit the assembly (pressure loses)
The Assembly editor is used to set the hydraulic parameters of the various components. The
system uses the body OD and ID for calculating frictional pressure losses. Tool joint OD & ID
are used to calculate and additional pressure losses associated with them.

40
BHHP & JIF Optimization
The Sysdrill Hydraulics allows several modes of optimization, including bit hydraulic horse
power (BHHP) and jet impact force (JIF) is possible by varying the flow rate and TFA against
a fixed pressure or varying pressure and TFA against a fixed flow rate. BHHP curves and JIF
curves can be generated, showing impact force and hydraulic power with different flow rate
and bit TFA (figure 7-7.).
Nozzle configuration and TFA can be calculated based on flow rate and surface pressure.
Figure 7-7. Graphical view of BHHP and JIF for different flow rate (Sysdrill 10)
ESD & ECD calculations
The ESD (Equivalent Static Density) allows evaluation of the transient thermal effects of the
circulating system. ECD (Equivalent Circulating Density) can also be calculated at varying
flow rates.

41
Cementing analysis
Cementing analysis allows simulation of cementing hydraulics for multiple fluids. Fluids are
defined by their densities and rheological proprieties and they can be entered by volume or
depth. Fluids are positioned in order to produce a fluid train in the annulus (Figure 7-8.).
A fluid flow regime is simulated by the program and shows in shematic displays fluid flow
regimes, bottom hole pressures, ECD‟s and flow rate as cement is circulated into position.
Also, hook load, volum pumped and velocıty are defined in the graphs (figure 7-8.).
Figure 7-8. Sysdrill cementing simulation casing analysis (Sysdrill 10)
The casing analysis allows analysis of casing for a given wellbore and wellpath with various
user defined pressure profile or load cases. A casing string design should be capable to
withstand any load it may experience during the life of the well.
The load cases are generally set up to model the worst case scenario for all the stages of a
well: instalation, drilling and production. every load case is defined by a combination of

42
internal and external pressure profiles and specific design factor for each of the failure modes
(axial, burst, collapse and triaxial). Figure 7-9. shows Sysdrill casing analyses module.
Figure 7-9. Sysdrill casing analysis (Sysdrill 10)
43
8. SYSDRILL TORQUE AND DRAG ANALYSES FOR DIFFERENT
BHA’S APPLIED IN DRILLING A REAL GEOTHERMAL WELL
The meaning of geothermal comes from the Greek word gea which means Earth and thermal
which means hot (Blankenship and Finger 2010). Geothermal resources include the natural
heat of the Earth, concentrated in a place such the groundwater can transport the heat to the
surface.
Geothermal reservoirs are distributed in unique positions in the Earth‟s crust. Spatial
variations of the thermal energy within the deep crust and mantle of the Earth gives rise to
concentrations of thermal energy near to the surface of the Earth that can be used as an energy
resource. Heat is transferred from deeper portions of the Earth by conducting trough rocks, by
the movement of hot, deep rock toward the surface, and by deep circulation of water. Most
high – temperature geothermal resources are associated with the heat gained from the
movement of magma (melted rock) to positions relatively close to the surface where the heat
is stored (Blankenship and Finger 2010).
High temperature geothermal resources are generally found along the margins of crustal
plates. Along the margins, molten rock is generated and moves upward through the crust
(Ramey, 1981). The earth is broken in huge plates that move apart or push together.
Convection of semi – molten rock in the upper mantle helps drive plate tectonics.
The theory of all applications of geothermal energy is to use a circulating fluid to carry the
heat from depth to its use at the surface.
If geothermal resources are to be used for generation of electricity by conventional turbines,
the necessary temperature from a geothermal reservoir must be greater than about 150°C.
Even more important the reservoir must have a sufficient permeability and fluid content to
permit movement of the heat to the surface of the Earth. The most efficient fluid for
transmission is water (Ramey, 1981).
In most cases, when the fluid originates in the geothermal reservoir, but the permeability is
lower, or where there is no fluid, there are techniques for injecting cooler water at the surface,

44
cırculate the water through the fractures in the rock to gain heat, and then returning it to the
surface for use.
Produced fluids with lower temperatures (bellow about 150°C) are suitable for space heating,
product processing, agriculture heating, air conditioning and other process involving low –
grade thermal energy. These applications can be very economical, effectively when the prices
of conventional fuels are high, but the disadvantage is that they have to be near the resource.
With higher temperatures and sufficient flow rate, geothermal energy can be used to generate
electricity, in that case there is no demand for the user to be geographically close to the
geothermal resource (Blankenship and Finger 2010). However, this requirement emphasizes
the need for drilling. Except for the few cases where direct use application can be supplied
from natural hot springs, the usage of geothermal fluid can only be achieved through drilling
in to the formation to get to the reservoir and in most of the cases the fluid must be re –
injected in the reservoir.
Exploration for geothermal resources is mostly based on geologic mapping, geochemical
analysis, geophysical analysis and exploration drilling (Blankenship and Finger 2010).
Geochemical analysis involve sampling waters and gases from hot springs. Chemical analysis
of these samples provides data which may determine whether a potential geothermal system is
liquid or vapor dominated system. Also, geochemical analysis can indicate the minimum
temperature that we can aspect at the depth. (Ramey,1981).
Geophysical method involves direct measurement of physical parameters of the Earth which
include geothermal temperature, electrical conductivity, propagation of elastic waves,
measurement of density, lıquid saturation and other parameters (Ramey, 1981).
Exploration drilling is a method based on drilling shallow exploratory holes for the purpose of
determining geothermal gradients and surface heat flux for determine the site for exploratory
drilling. However the final proof of any exploration program, is the drilling of an exploratory
well.

45
Typical rock types in a geothermal reservoir include, granite, granodiorite, quartzite, basalt,
rhyolite and volcanic stuff. Geothermal formations are hot, hard compressive strength,
abrasive, (content of quartz above 50%), highly fractured and under pressured (Blankenship
and Finger, 2010). This conditions indicate that drilling is usually difficult, rate of penetration
and bit life are usually low, corrosion is often a problem, and the most of this problems are
related to high temperatures.
Geothermal systems almost always contain dissolved or free carbon dioxide (CO2) and
hydrogen sulfide gases. Those gases contribute to corrosion problems, H2S particularly
presents a substantial safety hazard during the drilling process. The material limitations and
the associated safety hazards increase the cost of geothermal wells. The productivity of
geothermal systems is related to the high fracture permeability, which is also the cause of lost
circulation problems encountered when drilling geothermal wells.
Time and material for lost circulation treatment can achieve 15% of well cost, and the under
pressured formation can also be the cause of differential sticking, so these can be major
impacts on drilling costs (Blankenship and Finger, 2010). The loss of circulation is often
massive, with complete loss of the drilling fluid is also common for geothermal wells to be
abandoned because of the inability to get through a lost zone. Short bit life, due to hard,
fractured, abrasive and high temperature conditions increases tripping time dramatically. Low
penetration rates are common in hard, abrasive rock conditions.
Geothermal drilling is more expensive in cost per depth than onshore oil and gas drilling.
There are three principal reasons:
- technical challenge – special tools and techniques are required for the complex down
hole conditions;
- large diameters – because the produced fluids, either water or steam are of intrinsically
low values, large flow rates and thus large holes and casing are required;
- uniqueness – geothermal wells, even in the same field, are more different then the oil
and gas wells in the same field.
Figure 8-1. shows a typically used large diameter bit for geothermal drilling.

46
Figure 8-1. A tipical large diamter bit used in geothermal drilling ( Aydin, 2015)
Another big cost comes from the fact that almost all produced fluids must be re – injected, that
requires drilling other wells, so it is of major importance to drill the well as effectively and
inexpensively as possible (Blankenship and Finger 2010).
Potentional problems
The major potential risks are driven by increased temperatures and fractured rocks. This may
lead to situations lıke lost circulation, wellbore instability and may complicate cementation
and even require additional casing strings.
a) Lost circulation
The most expensive problem encountered in geothermal drilling is lost circulation, which is
the loss of drilling fluid to pores or fractures in the rock formation being drilled .The lost
circulation can represent 10% of total well cost in mature geothermal areas (Blankenship and
Finger, 2010). Loses of drilling fluids in the pores or into existing fractures of the formation

47
result into wellbore instability or wellbore control problems such as blowout. The following
problems occur through lost circulation.
- Drilling fluids, especially those used in high temperature formations, are expensive
and loosing them into the formations instead of recirculating is costly.
- In geothermal wells, the production zone is usually a lost circulation zone, so it is
sometimes difficult to cure a harmful lost circulation zone while preserving its
productive potential and try to seal the lost zones with some materials that can be
drilled out as the borehole advances.
If fluid loss occurred while drilling with mud motors, the addition of fresh mud sometimes
makes it possible for the bit to drill ahead into the hole. Trips back into the hole are often the
reason of motor failure in addition high temperature problems. The ability of a top drive unite
to circulate while tripping into or out of the hole is a significant advantage for this operating
method. High temperature in geothermal wells can also be a major problem for electronic
parts and steering tools.
In addition to temperature limitations, down hole motors sometimes can also restrict drilling
parameters, such as hydraulics and WOB that can be used. When drilling through aggressive
formations motors can also be the mechanical weak point of the BHA.
As the direction of the well becomes more extensive, the drill string will be affected by more
torque and drag. That can be a big problem, and finally limit the well depth.
b) High temperature
The high temperature in geothermal reservoirs is transferred through the whole steel drill pipe,
and it has a big effect on the down hole equipment due to the bath in hot fluids. There are
different problems due to high temperature (Bracke et al, 2013):
- Elastomer components (seals, down hole motor stators, bridge plugs) are
challenged;
- high temperatures tend to increase corrosion rates;

48
- expensive and delicate electronic steering and logging tools can be damaged or
destroyed.
c) Wellbore instability
Wellbore instability results for a number of reasons which can cause widely varying kind of
problems. The wellbore may become mechanically unstable because of the pre – fractured
rock or due to degradation of the well from the invasion of liquid from the drilling fluid
(Bracke et al, 2010).
- When the drilling fluid fails to clean the hole and doesn‟t return cuttings to the surface due to
missing height, the cuttings may fall back on the BHA assembly and bury the drill bit and
BHA.
- Lost circulation can suddenly lower the fluid level in a well, decreasing the static head of
drilling fluid in a hot formation can allow the formation gas, hot water or steam to enter the
wellbore, causing a loss of well control.
- In the intervals that are not to be produced, the lost circulation zone must be “sealed”, to
provide the wellbore to be cased and cemented to the surface. This represents a major cost.
The most common ways to combat these losses are as follows:
- Drill ahead with lost circulation. Drill with a light weight fluid that will have a static head
less than the pore pressure in the formation, mix the drilling fluid with fibrous materials or
particles that will plug the loss apertures in the formation, when the wellbore is completely
clean, it can be considered to pause the drilling process and try to seal the lost zones with
some materials that can be drilled out as the borehole advances.
The wellbore hole, especially in formations with significant clay content may become unstable
by adsorption of water into the clay of the wellbore rock.

49
Under consolidated formations from the overburden can deteriorate hole cleaning problems,
can fall in around the drill pipe to stick it, in addition a very large diameter can be washed.
Large washout not only complicate cementing, but also lower fluid velocity in the larger
diameter, which leads to a reduce carrying capacity for cuttings.
Swelling or squeezing clays may reduce hole diameters to a point that will either stick the pipe
or prevent running casing.
Differential stresses may cause the borehole to become unstable. This is a particular problem
whenever boreholes are deviated away from vertical.
A solution to advance drilling is to slow the water adsorption process into clay. The way to
reduce the swelling is to use CMC, which acts inhibitive for clays.
Cementation and casing
Casing requirements for geothermal wells include the following: nominal well production rate,
depth of the production zone, expected temperatures, brine chemistry, whether the completion
will be open hole or slotted liner, well trajectory, KOP, length of individual casing intervals,
need for special casing or connection material (Blanckenship and Finger, 2010).
Because geothermal casing must be cemented completely back to the surface, there is often a
problem getting a quality cement job done where the formations have shown either low
strength or lost circulation. This results from the cement higher density, and thus higher
hydrostatic head compared to drilling fluids. Additionally, it is also critical that no water is
trapped between the cement and casing, for the possibility that it can collapse the casing as the
wellbore goes through its temperature cycles (Bracke et al, 2013).
Methods using very light – weight cement (less than 1, 5 g/cm3) have been successfully used
in low pressure and low strength zones. Lost circulation during cementing often results in bed
cement jobs where the cement either does not reach the surface or falls back after reaching the

50
surface. İf the cement is not very far from the top where the cement is placed into the annulus
via small diameter tubing, called “tremie” pipe.
Casing and cement can account for 30 to 35% of the total well cost (Valmor et al, 2013). This
is particularly important in geothermal wells, where the economically necessary mass flow
rates requıre larger diameters production intervals compared to typical oil and gas wells.
Failed cement jobs are very difficult to repair. As a last resort, the casing can be perforated
and squeeze cemented, but another casing string will have to be run over the perforations, in
addiction to that, the production casing will become smaller than planned, reducing the
potential flow rate. To guard against such situation the casing program is often designed with
the upper casing on size larger than required, in case a contingent string is required.

51
8.1. Wellpath planning
For well planning, data including measured depth, inclination and azimuth, of some
characteristically points were given by the drilling company Cougar that operates in the south
west part of Turkey. Input data are shown in Table 8-1.
Table 8-1. Survey values (Cougar, 2015)
MD (m) Inc (deg) Azi (deg)
0 0 0
736,400 0,490 137,550
778,00 1,180 255,700
951,00 10,390 249,410
1076,00 16,270 246,410
1307,00 17,500 239,990
1509,00 20,710 245,210
1711,00 20,340 242,400
1865,00 21,050 244,840
1990,00 19,770 245,720
2234,80 21,030 243,750
Given data were implemented in the Sysdrill well planning module, getting additional survey
data regarding TVD (m), North (m), East (m), Dogleg (deg/30m), shown in the table 8-2. In
this case the survey data was updated in accordance with the procedure and it lunched a 2D
and 3D view of the proposed wellpath. Schematic view of the wellpath is shown in the Figures
8–2. and 8–3.

52
Table 8-2. Cougar well planning path (Sysdrill 10)

53

54
Figure 8-2.2D view of the well (Sysdrill 10)
Figure 8-3. 3D view of the well (Sysdrill 10)

55
8.2. Well design
The well design defines the desired final well performance. The design defines: casing sizes,
grades, weights, connections and sitting positions, positions of permanent packers, perforation
intervals, down hole sand control measures, required completion design, wellhead and x -mas
three. Surface locations and directional requirements are also part of the well design.
Once the well design is known, then the drilling program can be written to achieve the proper
well design.
The steps to obtain a proper well design include:
- identify all potential hazards, surface and subsurface problematic areas. Establish the
problems and determine how they can be controlled or solved;
- identify completion design, including fluid, necessary sand control measures and down
hole equipment. This should be done before running the casing string;
- chose casing setting depth that allows kick tolerance, minimize potential down hole
hazards and drilling problems. Define the casing properties (outside diameter, weight,
grade connections, etc.), for each casing string.
- define the wellhead and x - mas three requirements;
- estimate time and cost for each step.
Fluid gradients, temperatures and potential surface pressure will dictate the minimum strength
of the casing required during production. Where a well intersects several zones where the
production should be achieved, from it is possible to run two completion strings using pakers
to separate two zones.
The design of a geothermal well is based on a “bottom – up” approach. The required flow rate
determinates the diameter at the bottom of the hole and the location of the pay zone
determines the well‟s overall length. The well profile above the production zone is set by
iteration of successively larger casing strings. Because geothermal well‟s producing relatively
low – value fluids (hot water or steam) , flow rate must be much higher (often > 100, 000
kg/hr.) than for oil and gas wells and produce directly through casing from the reservoir

56
instead through tubing string inside casing like most of the oil and gas wells. The typical
casing sizes in geothermal production are from 20 to 34 cm (Blankenship and Finger, 2010) .
Figure 8-4. shows a possible casing profile for a geothermal well, with defined casing and hole
size.
Figure 8-4. Example of a geothermal well design (Blankenship and Finger, 2010)

57
8.3. Well design of the geothermal well
The hole section and casing of the geothermal well were also defined by their nominal OD and
MD as shown in the table 8–3.
Table 8-3. Hole section profile (Cougar, 2015)
Diameter
(in)
From MD
(m)
To MD
(m)
24 0,00 92,00
17 92,00 404,00
12 1/4 404,00 1281,00
8 1/2 1281,00 2234,80
Properties of the chosen casings are shown in table 8-4.
Table 8-4. Casing profile
Diameter
(in)
Start MD
(m)
Shoe Depth
(m)
Material
(N/m)
Type
20,0 0,00 92,00 127,45 N/m, K55 Conductor
13 3/8 92,00 404,00 82,7 N/m, K55 Surface
Casing
9 5/8 404,00 1281,00 58,98 N/m, L80 Production
Casing
7,0 1216,00 2210,00 Production
Liner
(Sloted)

58
The program allows a graphical view of the hole sections and casing strings, with setting
depths of each casing and hole section, both in MD and TVD as it is shown in the Figure 8-5.
By defining the casing OD and material, it was possible to choose the production liner and
casing string from the Sysdrill catalogue (Figure 8-5.).
Figure 8-5. Casing and hole section depths (Sysdrill 10)

59
Torque and drag increased values can represent a big problem while drilling a directional well.
In the next part will be applied Sydrill 10 Torque and Drag module for the previously designed
wellpath.
8.4. Torque and drag analyses
For the analyses, Sysdrill 10 torque and drag module was used, to give a presentation of the
Sysdrill 10 capability. The scope of the analysis was to observe the differences in surface
torque, torsional yield and Von Miesses stress, using different BHA‟s for the same depth of
1000 m. The BHA used were: Packed hole BHA, Pendulum BHA and Steerable BHA.
In order to run the calculations, it was necessary to define parameters such as: WOB, RPM
and flow rate (table 8-5.).
Table 8-5. Defined values for torque and drag calculations
WOB (tons) RPM (rotation/min) Flow rate
(l/min)
Fluid density
kg/m3
6 40 1500 1030 – 1130
8.4.1. Torque and drag results for Packed Hole BHA
Data regarding the components of the Packed Hole BHA (type, grade, length, OD, ID, weight,
wall thickness) are shown in the figure 8-6.
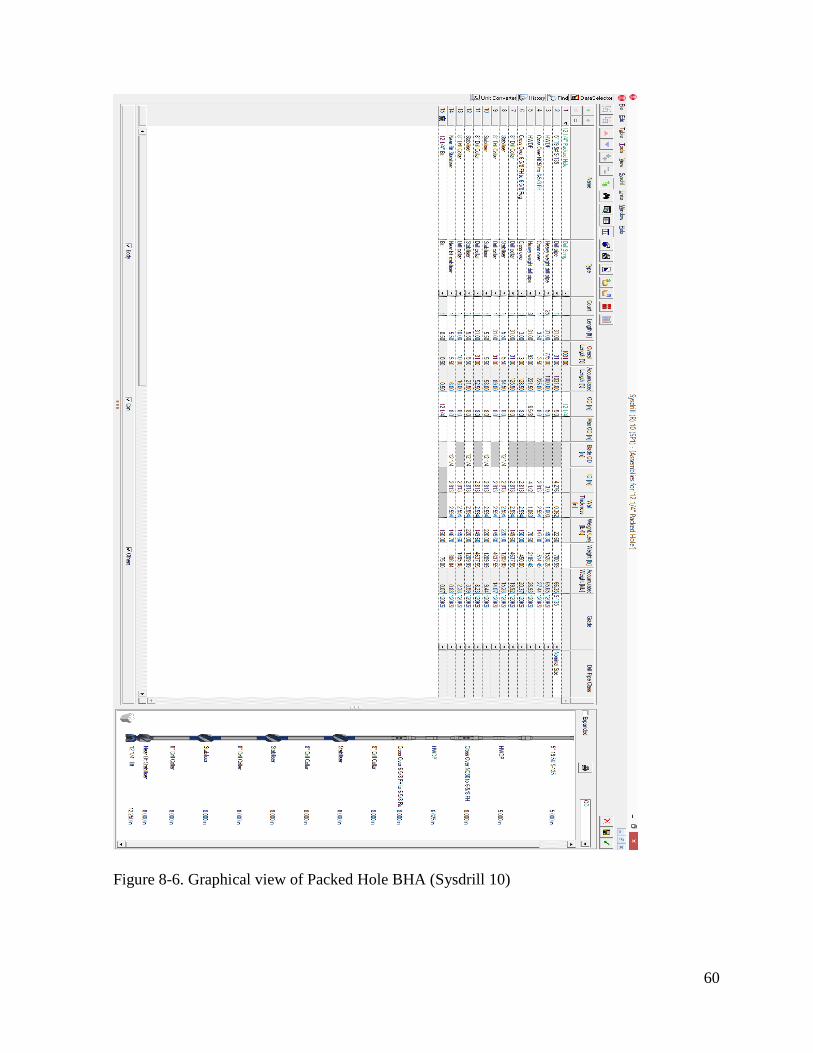
60
Figure 8-6. Graphical view of Packed Hole BHA (Sysdrill 10)

61
Torque and drag results were obtained using the Sysdrill Torque and Drag module (Table 8-
6.).
Table 8-6. Torque and drag results for Packed Hole BHA
Density
(Kg/m3)
Surface
Torque
(N x m)
Torsional Yield
(N x m.)
Von Miesses
Stress
(MPa)
1030 1692,54 99614,25 121,132
1040 1695,49 99616,59 120,969
1050 1698,47 99618,92 120,806
1060 1701,47 99621,26 120,644
1070 1704,5 99623,58 120,481
1080 1707,57 99625,91 120,319
1090 1710,67 99628,23 120,156
1100 1713,82 99630,54 119,994
1110 1717,01 99632,86 119,832
1120 1720,25 99635,17 119,67
1130 1723,54 99637,48 119,508
By looking at the charts bellow, it is clear that by increasing mud density, surface torque and
torsional yield will increase almost linearly (figures 8-7. and 8-8.), while for Von Miesses
stress, increasing mud density will result as a decrease of Von Miesses stress (Figure 8-9).

62
Figure 8-7. Surface torque vs. density for Packed Hole BHA (Sysdrill 10)
Figure 8-8. Torsional yield vs. density for Packed Hole BHA (Sysdrill 10)
1690
1695
1700
1705
1710
1715
1720
1725
1730
1020 1040 1060 1080 1100 1120 1140
Surf
ace
Torq
ue
(N x
m)
density (kg/m3)
Packed Hole 12 1/4'' at 1000m
99610
99615
99620
99625
99630
99635
99640
1020 1040 1060 1080 1100 1120 1140
To
rsio
nal
Yie
ld (
N x
m)
Density (kg/m3)
Packed Hole 12 1/4'' at 1000m

63
Figure 8-9. Von Miesses stress vs. density for Packed hole BHA (Sysdrill 10)
8.4.2. Torque and drag results for Pendulum BHA
Data regarding the components of the Pendulum BHA (type, grade, length, OD, ID, weight,
wall thickness) are shown in the Figure 8-10.
119,4
119,6
119,8
120
120,2
120,4
120,6
120,8
121
121,2
121,4
1020 1040 1060 1080 1100 1120 1140
Vo
n M
ises
Str
ess
(MP
a)
Density (kg/m3)
Packed Hole 12 1/4'' at 1000m

64
Figure 8-10. Graphical view of Pendulum BHA (Sysdrill 10)
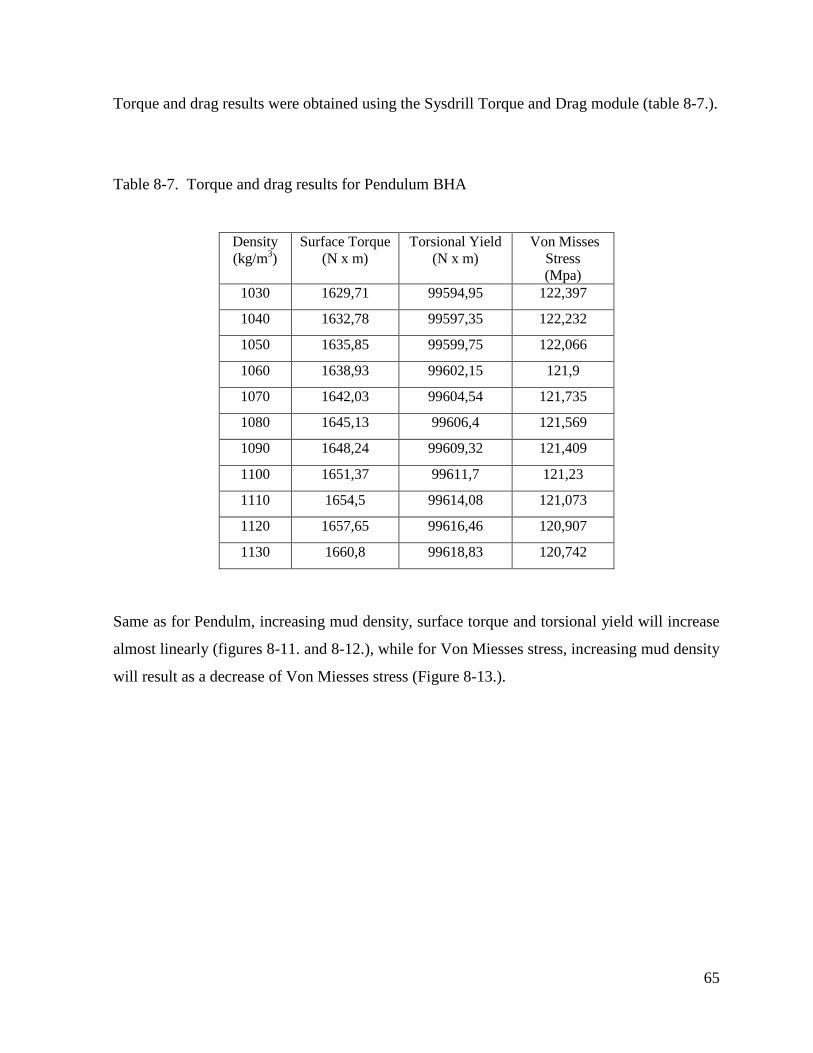
65
Torque and drag results were obtained using the Sysdrill Torque and Drag module (table 8-7.).
Table 8-7. Torque and drag results for Pendulum BHA
Density
(kg/m3)
Surface Torque
(N x m)
Torsional Yield
(N x m)
Von Misses
Stress
(Mpa)
1030 1629,71 99594,95 122,397
1040 1632,78 99597,35 122,232
1050 1635,85 99599,75 122,066
1060 1638,93 99602,15 121,9
1070 1642,03 99604,54 121,735
1080 1645,13 99606,4 121,569
1090 1648,24 99609,32 121,409
1100 1651,37 99611,7 121,23
1110 1654,5 99614,08 121,073
1120 1657,65 99616,46 120,907
1130 1660,8 99618,83 120,742
Same as for Pendulm, increasing mud density, surface torque and torsional yield will increase
almost linearly (figures 8-11. and 8-12.), while for Von Miesses stress, increasing mud density
will result as a decrease of Von Miesses stress (Figure 8-13.).

66
Figure 8-11. Surface torque vs. density for Pendulum BHA (Sysdrill 10)
Figure 8-12. Torsional Yield vs. density for Pendulum BHA (Sysdrill 10)
1625
1630
1635
1640
1645
1650
1655
1660
1665
1020 1040 1060 1080 1100 1120 1140
Surf
ace
To
rqu
e (N
x m
)
Density (kg/m3)
Pendulum 12 1/4'' at 1000m
99590
99595
99600
99605
99610
99615
99620
99625
1020 1040 1060 1080 1100 1120 1140
To
rsio
nal
Yie
ld (
N x
m)
Density (kg/m3)
Pendulum 12 1/4'' at 1000m

67
Figure 8-13. Von Miesses Stress vs. density for Pendulum BHA (Sysdrill 10)
8.4.3. Torque and drag results for Steerable BHA
Data regarding the components of the Pendulum BHA (type, grade, length, OD, ID, weight,
wall thickness) are shown in the Figure 8-14.
120,6
120,8
121
121,2
121,4
121,6
121,8
122
122,2
122,4
122,6
1020 1040 1060 1080 1100 1120 1140
Vo
n M
iess
es S
tres
s (M
Pa)
Density (kg/m3)
Pendulum 12 1/4'' at 1000m

68
Figure 8-14. Graphical view of Steerable BHA (Sysdrill 10)

69
Torque and drag results were obtained using the Sysdrill Torque and Drag module (Table 8-8).
Table 8-8. Torque and drag results for Steerable BHA
Density
(kg/m3)
Surface
Torque
(N x m.)
Torsional Yield
(N x m.)
Von Misses
Stress
(MPa)
1030 2913,05 99312,41 142,19
1040 2911,26 99315,39 142,08
1050 2909,42 99318,51 141,815
1060 2907,62 99321,64 141,623
1070 2905,87 99324,76 141,432
1080 2904,17 99327,87 1412,4
1090 2902,52 99330,98 141,048
1100 2900,91 99334,09 140,856
1110 2899,35 99337,15 140,665
1120 2897,84 99340,29 140,473
1130 2896,37 99343,38 140,282
By looking at the charts bellow, it is clear that by increasing mud density, surface torque and
Von Miesses stress will decrease almost linearly (figures 8-15. and 8-17), while for torsional
yield , increasing mud density will result as an increase of torsional yield (figure 8-16).

70
Figure 8-15. Surface torque vs. density for Steerable BHA (Sysdrill 10)
Figure 8-16. Torsional Yield vs. density for Steerable BHA (Sysdrill 10)
2894
2896
2898
2900
2902
2904
2906
2908
2910
2912
2914
1020 1040 1060 1080 1100 1120 1140
Surf
ace
Torq
ue
(N.m
)
Mud Densıty (kg/m3)
Steerable 12 1/4'' at 1000m
99310
99315
99320
99325
99330
99335
99340
99345
1020 1040 1060 1080 1100 1120 1140
Tors
ion
al Y
ield
(N
x m
)
Density (kg/m3)
Steerable 12 1/4'' at 1000m
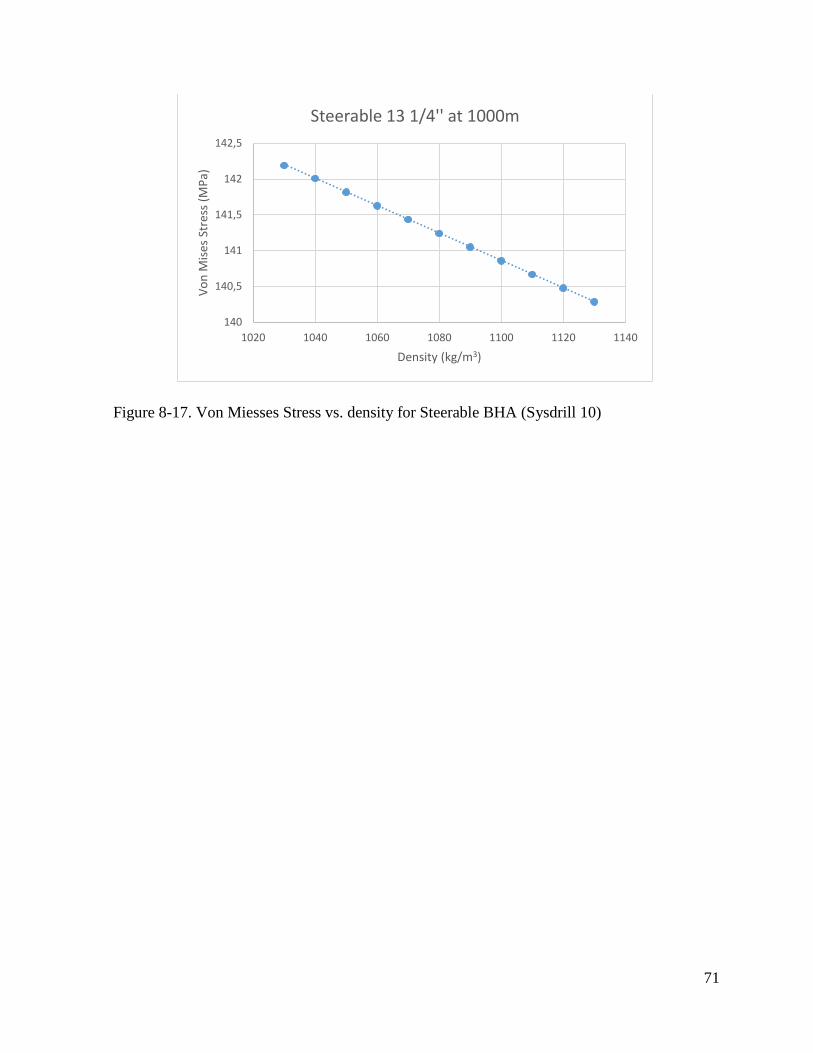
71
Figure 8-17. Von Miesses Stress vs. density for Steerable BHA (Sysdrill 10)
140
140,5
141
141,5
142
142,5
1020 1040 1060 1080 1100 1120 1140
Vo
n M
ises
Str
ess
(MP
a)
Density (kg/m3)
Steerable 13 1/4'' at 1000m

72
8.5. Observation and results
Comparing the results for different BHA‟s for the same depth (1000m), it was possible to
obtain the following results:
Figure 8-18. Surface torque vs. density for different BHA‟s
Figure 8-19. Torsional yield vs. density for different BHA‟s
0
500
1000
1500
2000
2500
3000
3500
1020 1040 1060 1080 1100 1120 1140
Surf
ace
Torq
ue
(N x
m)
Density (kg/m3)
Comparation of 12 1/4'' different BHA's Surface Torque vs. Density
Packed Hole
Pendulum
Steerable
99250
99300
99350
99400
99450
99500
99550
99600
99650
99700
1020 1040 1060 1080 1100 1120 1140
To
rsio
nal
Yie
ld (
N x
m)
Density (kg/m3)
Comparation of 12 1/4'' differnt BHA's Torsional Yield vs. Density
Packed Hole
Pendulum
Steerable

73
Figure 8-20. Von Miesses stress vs. density for different BHA‟s
By looking at the charts it is clear that surface torque values will be less if it is used pendulum
BHA, in terms of torsional yield the lowest values will be using a steerable BHA and the
minimal values for Von Miesses stress would be obtained by using a packed hole BHA.
115
120
125
130
135
140
145
1020 1040 1060 1080 1100 1120 1140
Vo
n M
iess
es S
tres
s (M
Pa)
Density (kg/m3)
Comparation of 12 1/4'' differnt BHA's Von Misses Stress vs. Density
Packed Hole
Pendulum
Steerable

74
9. CONCLUSION
To get a general overview of the Sysdrill 10 capacity using the actual geothermal well data, it
was necessary to present the complexity of geothermal directional drilling.
Today, most of the directional well planning is done using well planning software‟s. Modern
computer technologies, such as 3D visualization, have provided engineers integrated and
interactive tools to create, visualize, and optimize well paths.
Drilling directional wells can be very complex, and an increased knowledge of torque and
drag modeling and interpretation can be very useful. High costs and increased risks in these
wells make torque and drag analysis important part of the drilling process.
Sysdrill 10 also offers significant engineering solutions in terms of applying hydraulics, casing
design, cementing and well control modules.

75
10. BIBLIOGRAPHY
1. Adams, N., 1985. Drilling Engineering A Complete Well Planning Approach. Tulsa
(Oklahoma): Penn Well Publishing Company.
2. Baker Hughes INTEQ, 1995. Drilling Engineering Workbook Training &
Development, 80270H Rev. B, Houston, United States of America.
3. Blankenship, D., Finger, J., 2010. Handbook of Best Practices for Geothermal Drilling,
Prepared for the International Energy Agency,Geothermal Implementing Agreement
Sandia National Laboratories. Albuquerque, New Mexico.
4. Bourgoyne, A., Chenevert, M., Milheim, K., Young Jr, F., 1991, Applied Drilling
Engineering, Second Printing. Richardson, (Texas): Society of Petroleum Engineers.
5. Bracke, R., Volmar, D., Witting, V., 2013. Geothermal Drilling Best Practices: The
Geothermal translation of conventional drilling recommendations - main potential
challenges. IGA Academy Report 0104-2013.Presented at the International
Geothermal Centre, Bochum / Germany.
6. Chemwotei, S., Geothermal Drilling Fluids. 2011. Reports 2011 Number 10. Kenya
Electricity Generating Company Ltd. – KenGen. Presented at the GEOTHERMAL
TRAINING PROGRAMME Orkustofnun, Grensásvegur 9, Number 10, IS-108
Reykjavík, Iceland.
7. Hahn, D., Klotz, C., Wasserman, I., SPE, Baker Hughes INTEQ. 2008. Highly Flexible
Mud Pulse Telemetry: A New System. SPE 113258. Presented at the 2008 Oil and Gas
Technical Conference and Exhibition held in Mumbay (India), 4 – 6 March 2008.
8. Lake, L., 2006. Petroleum Engineering Handbook. U. of Texas at Austin.
Austin:.Society of Petroleum Engineers.
9. Mitchel, B., 1995. Advanced Oil Well Drilling Engineering. Mitchel Enginnering,
West New Mexico Place Lakewood, USA.
10. Lapeyrouse, N., 2002. Formulas and Calculations for Drilling Production, and
Workover (Second Edition). Hosuton (Texas): Gulf Proffesional Publishing.
11. Rabia, H., 2002. Well Engineering and Constructions. Entrac Consulting.
76
12. Ramey, H.J., 1981. Reinjection (Chapter 10) in Reservoir Engineering Assessment of
Geothermal Systems, Stanford University.
13. Short, J., Drilling A Source Book On Oil and Gas Well Drilling From Exploration To
Completion. 1983. Tulsa (Oklahoma): Penn Well Publishing Company.
Web sources:
1. Baker Hughes. Components of PDM,
URL: http://www.bakerhughes.com (26.09.2015).
2. China – ogpe. Magnetic Single Shot Device,
URL:http://www.china-ogpe.com/catalog/10/geological_logging_instrument_155/
(10.10.2015).
3. Laser – ndt. Shematic view of PDM,
URL: http://www.laser-ndt.com/applications_cavity%20pump.html (26.09.2015).
4. Nodie equipment. Reamers,
URL: www.nodiequipment.com.au (08.05.2015).
5. Oil and Gas drilling. Pendulum and Packed Hole assemblies,
URL: http://www.oilngasdrilling.com/tag/pendulum (15.09.2015).
6. Tube technology. Shock Sub,
URL:http://www.tubetechnologiesinc.com/markets/water-resources/subs-adaptors.php
(01.07.2015).
7. University of Aberdeen. Schematic view of the drillstring with BHA,
URL: http://www.abdn.ac.uk/engineering/research/modeling-and-analysis-of-bha-and-
drillstring-vibrations-149.php (15.09.2015).

77
Statement
I declare that this thesis is my own work, and that it was made based on the
knowledge gained at the Faculty of Mining, Geology and Petroleum
Engineering using the specified literature.
____________________________
Silvio Japundţić