DIRECTIONAL BROADCAST ANTENNAS - American … · DIRECTIONAL BROADCAST ANTENNAS: ... thus...
211
DIRECTIONAL BROADCAST ANTENNAS: A Guide to Adjustment, Measurement, & Testing by Jack Layton www.americanradiohistory.com
Transcript of DIRECTIONAL BROADCAST ANTENNAS - American … · DIRECTIONAL BROADCAST ANTENNAS: ... thus...

DIRECTIONAL BROADCAST ANTENNAS: A Guide to Adjustment, Measurement, & Testing by Jack Layton
www.americanradiohistory.com
No. 733 $12.95
CLA-1-)1,A,
DIRECTIONAL BROADCAST ANTENNAS: A Guide to Adjustment, Measurement, & Testing by Jack Layton
TAB BOOKS Blue Ridge Summit, Pa. 17214
www.americanradiohistory.com

FIRST EDITION
FIRST PRINTING -DECEMBER 1974
Copyright ©1974 by TAB BOOKS
Printed in the United States of America
Reproduction or publication of the content in any manner, with- out express permission of the publisher, is prohibited. No liability is assumed with respect to the use of the information herein.
Hardbound Edition: International Standard Book No. 0- 8306 -4733 -3
Library of Congress Card No. 74 -14318
www.americanradiohistory.com

Preface
After having associated for many years with fellow members of the broadcast fraternity that are charged with the maintenance of Directional Antenna systems, itbecame evident that a book on this subject, written in a language that broadcasters can readily understand, was urgently needed.
While there have been many books published on the de- sign of directional antenna systems, this is the first to deal primarily with the practical aspects of installing, adjusting, and maintaining them. This book should not be taken as a substitute For the advice of consulting engineer during the construction of a directional antenna system. Rather, it will serve both the ex- ?erienced and the uninitiated in improving their ability to deal with problems of directional antennas.
A subject as complex as the directional antenna requires some mathematics for explanation. The theory and mathematics presented here are only the minimal require- ments for meeting the objectives of the book.
The ideas presented herein have been drawn, for the most part, from personal experiences. As in everything encountered In life there is usually more than one way to accomplish the same end result. It is hoped that at some later date this writing may be expanded upon to incorporate more information, and thus disseminate more knowledge, on a practical, easily un- derstood level, on this subject. To this end, the writer invites comments, suggestions, and ideas.
I wish to thank my wife for the many hours she spent in typ- ing and proofreading the manuscript.
Jack Layton
www.americanradiohistory.com

To Mr. Douglas N. Lapp, who introduced me to amateur radio and electronics.
www.americanradiohistory.com

Contents
The Theory Of Directional Antennas 7
The Vertical Radiator -Base Impedance -Field Strength and Ground Conductivity -Power vs Radiated Field- Vertical Angles of Radiation- Summary- Purpose of the DA System - Phase Relationships -Nulls -Two Towers With a Null in Line With the Towers -The Effect of Phase and Spacing on Pat- tern -The Effect of Current Ratio on Pattern -Driving -Point Impedance- Feeder Systems -Directional Antennas Using More Than Two Radiators - Arrays Using Radiators of Dif- ferent Heights- Losses in Directional Antenna Systems
Planning The Directional Antenna System 42 Selection of the Transmitter Site - Automatic DA Nondirec- tional Switching -Tower Lighting Isolation- Location of Buildings, Towers and Other Essentials- Transmission Lines -Phase -Sampling System -The Ground System - Towers- Phasor Considerations- Line -Terminating Units - The Transmitter Building
Building The DA System Preparation of the Site -Alignment of the Tower Bases - Installation of the Towers -Installation of Transmission and Phase -Sampling Lines -Installation of the Ground System - Installation of the Line -Terminating Units -Installation of Phase -Sampling Loops -Installation of the Transmitter and Phasor
65
The Nondirectional Proof 90 The Purpose of a Nondirectional Proof -Preparation of Maps- Matching the Reference Tower and Detuning Unused Towers -Check of Equipment -Close -In Nondirectional Measurements -Nondirectional Measurements Beyond Two Miles- Selection of Permanent Monitoring Points- Analyzing the Nondirectional Proof
www.americanradiohistory.com

5 Setup Adjustments Of The DA System 115 Introduction to DA Adjustment -The Setup of Base -Coupling Networks -The Adjustment of L- Networks- Adjustment of T- Networks- Phase -Control Networks -Adjustment of LC Phase -Control Networks -Adjustment of T Phase -Control Networks -Setup of the Power- Divider Network - Adjustment of the Common -Point Matching Network - Preenergization Checks
Operating Adjustments Initial Application of Power to the DA Sstem -Calibration of the Phase -Sampling System -Adjusting the Array for Proper Current Ratios and Phase -Spot Check of the Radiation Pat- tern -Final Adjustment of the Radiation Pattern- Reradiation From Parasitic Sources -Doing the DA Proof -Determining Inverse Field- Determining RMS- Preparation of Data for Submission to the FCC
143
Directional Antenna Maintenance 172
Introduction to DA Maintenance -Maintenance Equip- ment- Preventive Maintenance -Transmission Lines - Maintenance and Troubleshooting the Phase -Sampling System -Monitor Points -What to Stock as Spares for the DA -What To Do If Operating Parameters Creep -When Dis- aster Strikes! -Vector Analysis of Monitoring Points
Appendix I Vector Computations Polar- Rectangular Conversions -Arithmetic Operations on Vectors
Appendix II Glossary Appendix III Tables
194
198
207
Index 208
www.americanradiohistory.com

Chapter 1
The Theory Of Directional Antennas
It is not the intent of this book to go deeply into the theory of the design and operation of directional antenna systems. The overall subject, however, is inherently complex. A basic background in their theoretical operation is necessary to comprehend the practical aspects of construction, adjustment, and maintenance of directional antennas.
It is with this thought that this material on theory is presented. You will more fully appreciate this material as you progress through the book.
THE VERTICAL RADIATOR The standard antenna used by all AM broadcast stations
in the United States is the vertical radiator. It comes in a variety of shapes and heights. Some radiators are insulated at thebase (series fed);others(shunt fed)arenot. Self- supporting towers and uniform cross -section guyed towers are other variations. The one thing they all have in common is that their radiated signal is vertically polarized.
Standard broadcast stations are mainly interested in covering the city to which they are licensed and its suburban area with as much signal as possible. Thus there is a need for a strong ground -wave signal. Energy that is radiated upward at high vertical angles is usually absorbed in the ionosphere during daytime, and is wasted. The antenna system that best fits the bill, providing a strong ground wave signal, is the vertical radiator.
About one -third of the some four -thousand AM radio stations licensed in the United States use two or more vertical radiators to increase the amount of radiated signal in some directions and reduce it in others. These configurations of multitower vertical antennas are commonly called directional antenna (DA) systems. There are few, if any, of the 1300 or so directional antenna systems in use that are identical in their
7
www.americanradiohistory.com

R36 R¿36
20
A
Fig. 1 -1. Base impedances.
physical construction (tower heights, spacings, orientation, etc.) and electrical parameters (phase and current ratios). Each one has been custom designed and built to fill a particular need. The one thing that all have in common is that they use vertical radiators.
The operation of a DA system is in many ways directly related to how each element in the system performs individually. Next, we will examine some of the characteristics of the vertical antenna.
BASE IMPEDANCE
Let's consider the case of a quarter -wavelength, uniform cross -section, guyed tower that is insulated at its base and erected on a plot of land at a location that is reasonably free from external influences (i.e., removed from surrounding tall structures etc.). Below this tower, a ground system of 120 buried radial wires has been installed. This consists of one wire every 3 degrees, fanning out from the base of the tower and extending outward one -quarter wavelength.
The measured base impedance of this tower will be on the order of 36 ohms of resistance and about 20 ohms of inductive reactance. (See Fig. 1 -1A.) This base impedance is expressed as 36 + j20. If there were capacitive reactance of 20 ohms (Fig. 1 -1B), the figure would then be 36 -j20 ( +j for inductive reactance and -j for capacitive reactance). (The usual procedure for determining the base impedance of a tower is to measure it with an rf bridge. Resistance and reactance can be independently determined this way.)
If the quarter -wavelength antenna (or any other multiple of a quarter wavelength) had a velocity factor of unity; that is,
8
www.americanradiohistory.com

if electrons flowed in the antenna at the velocity of light (186,000 miles per second), this antenna would show no reactance at the base. Of course, the electron flow in the steel tower is somewhat less than the speed of light. This means that an antenna slightly less than one - quarter wavelength in height will show no reactance at its base. Such an antenna is referred to as a resonant length antenna, because in a resonant circuit capacitive reactance (Xc) and inductive reactance (XL) are equal, and cancel out, leaving only the pure resistance (R) in the circuit.
The 36 ohms of measured resistance (R) is the sum of radiation resistance (RR) and loss resistance (RL). (See Fig. 1 -2.) The radiation resistance in the power formula (P = I2R) represents power radiated by the antenna. The loss resistance represents power dissipated in the resistances of the ground system and the tower itself, such as the resistance between joints in the tower sections and the actual ohmic resistance of the sections. (See Fig. 1 -3.)
When the tower is energized with rf current and the base meter reads 5.27A, power into the antenna system can be determined by the I2R formula to be about 1000W. If our 36 ohms for R is broken down to assume 34 ohms for RR and 2 ohms for RL, by the I2R formula, loss power of 56W and radiated power of 944W can be determined.
The actual RL (loss resistance) is difficult to determine accurately. If care has been taken to install an adequate ground system and there are no excessive losses in tower joints etc., 2 -3 ohms of loss resistance is a reasonable figure to assume.
Now let's take a look at a vertical radiator whose height is considerably less than one -quarter wavelength. As the length,
R <RADIATION RESISTANCE
Fig. 1 -2. Base resistances.
LOSS RESISTANCE
9
www.americanradiohistory.com

\ /
R
R
/IM
Fig. 1 -3. Typical antenna system, showing losses.
or height, of the tower is decreased in terms of wavelength, the radiation resistance becomes less, and so does the measured base resistance. However, the actual value of RL remains substantially the same.
For a tower similar in construction to the quarter -wavelength tower described but only one -sixth wavelength in height, the actual measured base resistance that you might expect would be on the order of 20 ohms. With the same 2 ohms of loss, the radiation resistance is 18 ohms. If the tower were energized with 1000W, the measured base current would be 7.07A (7.072 x 20 = 1000W). Using the power formula and substituting radiation resistance for the base resistance, we find 900W of radiated power (7.072 x 18 = 900W). Using the loss resistance, we can determine the loss to be 100W (7.072 x 2 = 100W). As can be seen from this example, the shorter the radiator, the higher the
10
www.americanradiohistory.com

loss resistance will be in proportion to the radiation resistance.
FIELD STRENGTH AND GROUND CONDUCTIVITY When dealing with radiation from an antenna -whether a
single vertical radiator or a directional antenna -there is the unattenuated radiation, which is called inverse field, and the actual radiation, which is called measured field. It is very important to know the difference between the se two term s.The unattenuated, or inverse, field at a given distance will always be more than the measured field.
All antenna pattern formulas and specifications set forth for radiation limitations on FCC construction permits refer to inverse field. This is the field strength radiated by the antenna, taking into account no ground path losses between the antenna system and the point where we are measuring. Inverse field decreases as the distance increases. For example, if an inverse field of 100 mV /m (100 millivolts per meter) at one mile exists, then at 2 miles an inverse field of 50 mV /m exists (1/2 x 100); and at 5 miles from the antenna, an inverse field of 20 mV /m exists (1 /5 x 100). Therefore, as distance is doubled, the inverse field is halved. Inverse field is usually referenced to one mile of distance.
In practice, the signal strength drops off much faster than the inverse proportion law says it should. At frequencies used for AM broadcasting, the ground wave -that is, the signal traveling along the surface of the earth -is attenuated by the conductivity of the ground over which it travels.
Actual signal losses caused by ground conductivity increase as frequency increases. At 540 kHz, an antenna system producing an inverse field of 100 mV /m at one mile will deliver more signal to a point 10 miles from the antenna than an identical system located at the same place and radiating 100 mV /m inverse field at one mile on 1600 kHz.
Figure M -3 of Volume III of the FCC Rules and Regulations contains a map showing average ground conductivities for all areas of the United States. Actual values of ground conductivities and inverse field for any particular antenna system must be measured, and the technique used is
11
www.americanradiohistory.com

0 TOWER
0 TOWER
THEORETICAL PATTERN ACTUAL PATTERN
Fig. 1 -4. The difference between theoretical and measured radiation from a typical tower.
discussed in the section on nondirectional and DA
proof -of- performance measurement. The tern mV /m (millivolts per meter) has been thrown
around rather freely in the past few paragraphs. It is a measure of voltage (signal strength) induced into a receiving antenna one meter long. The instrument used for measuring field strength, or radiated field, is called a field intensity meter (FIM). The modern field intensity meter uses a loop antenna. Its indicating instrument is calibrated in ranges from 100 uV /m (microvolts per meter) to 10 V/m (volts per meter) full scale.
For a moment, let's get back to the quarter -wave radiator described in the base impedance section. With a power of 1000W into this antenna, the inverse field produced at one mile from the antenna will approximate 190 mV /m. The actual measured field at one mile could be anywhere from very close to 190 mV /m (for very high ground conductivity) to considerably less than 190 mV /m )for very poor ground conductivity). If the frequency is low(e.g., 540 kHz), the actual measured field for this quarter -wave radiator over a given path will be higher in value than if the frequency were high (e.g., 1600 kHz).
Moving the point of measurement around the vertical radiator -keeping the distance between the radiator and
12
www.americanradiohistory.com

measuring point at one mile -we find that if ground conductivity remains constant, measured signal will remain constant (Fig. 1 -4A). In other words, the radiation pattern produced along the ground from the single tower will be circular. Variations in the symmetry of the radiation pattern can be traced to such external influences upon the radiator as water tanks, other towers, etc., which can (and usually do) distort the circular pattern (Fig. 1 -4B).
In actual practice, many measurements along each azimuth must be taken to determine field strength and ground conductivity. Single measurements at one mile can be in serious error due to external influence on the actual measuring point.
POWER vs RADIATED FIELD In most antenna discussions, radiation in millivolts
per meter is referred to a power of one kilowatt.For example, the inverse field of our previously described vertical radiator can be said to be 190 mV /m at one mile per kilowatt. If the same antenna is energized with 500W, the current in the antenna will drop to 0.707 of its previous value. The inverse radiation is proportional to antenna current, so it also falls to 0.707 of its previous value, or 134.5 mV /m at one mile. If we had actually measured 180 mV /m at one mile, it too would drop to 0.707 of its previous value, or to about 127 mV /m. On the other hand, if power is increased to 5000W, the antenna current, inverse field, and actual measured fields will increase to approximately 2.23 times those for a kilowatt.
Antenna current, inverse field, and actual measured fields increase or decrease in proportion to the square root of the power ratios.
Example 1. Power decreased from 1000W to 500W.
500/1000 = 0.5
Current, inverse field, and measured field decreased by V0.5 or 0.707.
VERTICAL ANGLES OF RADIATION
Up to this point, when the term "radiated field" was mentioned, it referred to the ground -wave
13
www.americanradiohistory.com

V. WAVELENGTH 90- DEGREE VERTICAL TOWER
5/eWAVELENGTH 225- DEGREE VERTICAL TOWER
Fig. 1 -5. Relative horizontal radiation for 1/4- and 5/6- wavelength antennas.
radiation -radiation along the surface of the earth. Another term frequently used, meaning the same as ground -wave radiation, is "horizontal radiation." However, our practical quarter -wave radiator also radiates power in directions other than along the ground.
If we were able to start at our measuring point (one mile from the antenna on the ground) and transport the field intensity meter into the air to a point one mile directly above the top of the tower, we would find radiation decreasing from the value found on the ground to zero (Fig. 1 -5A). Thus all of the radiation from the antenna is not confined to the horizontal plane. By increasing the height of the radiator up to approximat °ly 5/s wavelength, the amount of signal radiated in the horizontal plane (along the ground) will increase (Fig. 1 -5B). At the same time, radiated signal at some angles above the ground (vertical angles) will decrease.
For daytime use, we are interested in the ground -wave signal; the vertical -angle radiation isn't of too much concern. If the radiator is to be used at night, however, serious complications with vertical -angle radiation can occur. At night, some of the radiation going up at vertical angles is reflected back to the surface of the earth by the ionosphere. This radiation can be reflected into the coverage area of another station many hundreds of miles away, causing severe interference.
For each tower height, there is a term called the vertical radiation characteristic. It appears in various directional antenna equations and is usually expressed in those calculations as fo. Values of fo are tabulated in engineering tables (NAB Handbook) for various tower heights.
14
www.americanradiohistory.com

SUMMARY Up to now, all discussion has centered on the single
vertical tower being used as a radiator for an AM broadcast station. Actually, several vertical radiators with characteristics exactly as described herein make up the DA system. From this point on, instead of referring to tower height in terms of wavelength, it also will be referred to in electrical degrees. For example, a one -quarter wavelength tower is 90 degrees high.
To determine tower height in degrees, multiply 360 times the height in wavelengths. Tower height is also referred to as G in antenna pattern equations. For example, G = 90 degrees would indicate that the tower height is one -quarter wavelength, or 90 degrees in height.
PURPOSE OF THE DA SYSTEM
Our discussion of the single vertical radiator pointed up the fact that radiation along the surface of the earth (horizontal plane) at all azimuth angles was the same. In many cases, if a single vertical radiator were to be used, excessive interference to other stations operating on the same or adjacent frequencies would be experienced. The main objective of a directional antenna system usually is to reduce radiation at certain azimuths toward other stations operating on the same or adjacent frequencies, thus reducing or eliminating interference. On occasion, a station will install a directional antenna with its main objective being to increase radiation over a large metropolitan area, which otherwise could not be covered with adequate amounts of signal from a single nondirectional antenna.
Any directional antenna will cause an increase in radiated field at some azimuth angles and a decrease at other azimuth angles when compared to a nondirectional antenna. If we visualize radiation as an inflated balloon and then squeeze it in at one point to reduce radiation, it becomes apparent that the other side bulges: The squeezed portion indicates the nulls or minima, and the bulged portion the major lobe.
Some directional antenna radiation patterns have many nulls and lobes. Some lobes will be small, and the energy radiated in these lobes will not approach that radiated by a
15
www.americanradiohistory.com

+1
4VOLTS OVOLTS
2V
IN PHASE A B 1800 OUT OF PHASE
Fig. 1 -6. Addition of dc voltages.
single tower in the nondirectional mode using identical power. These are known as minor lobes. When the energy radiated along any azimuth exceeds that of a nondirectional system using identical power, the areas of relatively strong radiation are referred to as major lobes. The DA system radiation pattern will contain at least one and can contain several major lobes.
PHASE RELATIONSHIPS If two dc voltages from two batteries are combined in
series as shown in Fig. 1 -6A, the output voltage will be the sum of the two individual voltages. We might say that these batteries are connected in phase. In Fig. 1 -6B, the polarities are reversed. Here we will call the batteries out of phase. The output voltage with this configuration is zero volts. Now if the lower battery in each of the examples were 3V instead of 2V,
the output voltage in Fig. 1 -6A (the in -phase condition) would be 5V (2V + 3V), and the resultant voltage in the out -of -phase condition (Fig. 1 -6B) would be one volt (3V -2V). These conditions are seen easily enough when dealing with dc voltages. However, when we get to an ac circuit, the visualization becomes a little more complex, because polarities are constantly changing. However, the same principle applies.
Figure 1 -7A shows two sources of ac voltages connected in series and in phase. At a given instant, if the polarity of the voltage at point A is positive in respect to point B and the voltage at point C is positive in respect to point D (which it
will be if they are in phase), the resultant voltage will be 4V.
16
www.americanradiohistory.com

In Fig. 1 -7B, connections D and C have been reversed, causing the two ac sources to be out of phase. The instantaneous ac voltages act much the same as the dc voltages in Fig. 1 -6B, resulting in zero volts output. Again, as in the dc battery example, if source 2 is made 3V, then the output of Fig. 1 -7A will be 5V (2V + 3V) and that of 1 -7B will be one volt instead of zero volts. When in phase, the individual sources will add; when 180 degrees out of phase, the sources will subtract.
If both sources are equal in magnitude (voltage), the resultant voltage will be zero when they are 180 degrees out of phase, and will be the sum of the individual sources when they are in phase. A condition can exist where source No. 1
and source No. 2 are neither exactly in phase nor exactly 180 degrees out of phase. In this case, the resultant voltage will be neither zero nor the sum of the individual sources, but somewhere between zero and the maximum that occurs when both are in phase.
Now, instead of batteries and transformers, we shall use towers as sources. However, first we must further consider some basic terminology used in discussing towers and patterns.
NULLS
The simplest form of directional antenna system is one consisting of two towers. They will always produce at least one null or minimum, and possibly more than one.
2V
1
4V
A
t
D`i` IN PHASE
t 2V
1
D,./1
1800 OUT OF PHASE
Fig. 1 -7. Addition of ac voltages.
17
www.americanradiohistory.com

NULL ZERO SIGNAL
MINIMA SOME VALUE
GREATER AN ZERO
11%
TH
'1.J s
Fig. 1 -8. Typical radiation patterns.
A null is a particular azimuth angle in the radiation pattern of the directional antenna system where the theoretical amount of radiation is zero. A minimum can be defined as a particular azimuth angle in the radiation pattern where the signal is reduced below that which would be radiated from a nondirectional antenna with the same power, but the value of signal in the minimum does not go all the way to zero (Fig. 1 -8).
TWO TOWERS WITH A NULL IN LINE WITH THE TOWERS
In Fig. 1 -9, the layout of two towers is shown. The 90
degrees between the towers is the spacing. It is referred to as
S in directional antenna equations. Spacing will always be referred to in electrical degrees. Electrical degrees of spacing can be determined by multiplying the spacing in wavelength by 360. For example, a spacing of 3/s wavelength is 360 x 3/8,
or 135 degrees. A line drawn through the two towers will run north and south. This is the orientation line of the towers.
Let's take tower 1 and excite it with a given amount of rf current to produce 100 mV /m of signal at some observation
TOWER 2
N Ai-- 1/900
90°
G= HEIGHT =90° S= SPACING =90°
Fig. 1 -9. Two -tower directional system.
18
1/00
www.americanradiohistory.com
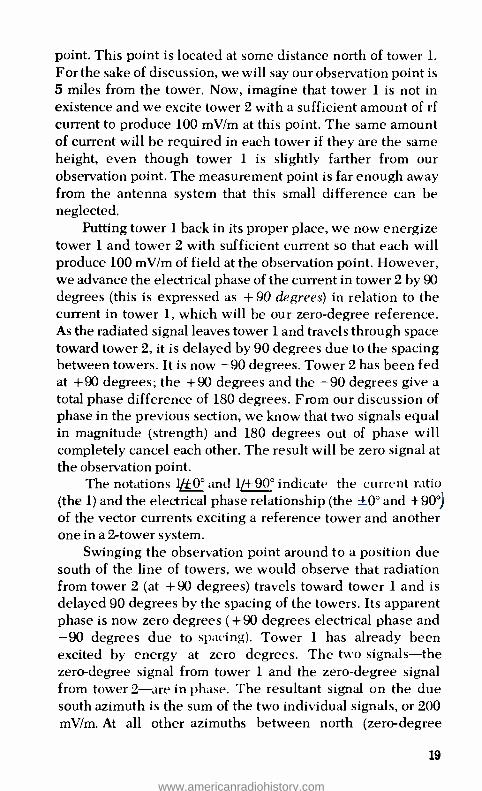
point. This point is located at some distance north of tower 1.
For the sake of discussion, we will say our observation point is 5 miles from the tower. Now, imagine that tower 1 is not in existence and we excite tower 2 with a sufficient amount of rf current to produce 100 mV/rn at this point. The same amount of current will be required in each tower if they are the same height, even though tower 1 is slightly farther from our observation point. The measurement point is far enough away from the antenna system that this small difference can be neglected.
Putting tower 1 back in its proper place, we now energize tower 1 and tower 2 with sufficient current so that each will produce 100 mV /m of field at the observation point. However, we advance the electrical phase of the current in tower 2 by 90 degrees (this is expressed as + 90 degrees) in relation to the current in tower 1, which will be our zero -degree reference. As the radiated signal leaves tower 1 and travels through space toward tower 2, it is delayed by 90 degrees due to the spacing between towers. It is now 90 degrees. Tower 2 has been fed at +90 degrees; the +90 degrees and the 90 degrees give a total phase difference of 180 degrees. From our discussion of phase in the previous section, we know that two signals equal in magnitude (strength) and 180 degrees out of phase will completely cancel each other. The result will be zero signal at the observation point.
The notations 1/±0° and 1/+ 90° indicate the current ratio (the 1) and the electrical phase relationship (the 0° and +90 °)
of the vector currents exciting a reference tower and another one in a 2 -tower system.
Swinging the observation point around to a position due south of the line of towers, we would observe that radiation from tower 2 (at +90 degrees) travels toward tower 1 and is delayed 90 degrees by the spacing of the towers. Its apparent phase is now zero degrees ( +90 degrees electrical phase and 90 degrees due to spacing). Tower 1 has already been excited by energy at zero degrees. The two signals -the zero -degree signal from tower 1 and the zero -degree signal from tower 2 -are in phase. The resultant signal on the due south azimuth is the sum of the two individual signals, or 200 mV /m. At all other azimuths between north (zero-degree
19
www.americanradiohistory.com

30. 20- 1Ó 350 340' 330' 30 340 350 10 20 30
1 tV
150 210
160 200
v0 190
Fig. 1 -10. Plotted inverse field data for DA.
150
bearing) and south (180- degree bearing), the amount of signal received at the observation point (keeping it the same distance from the antenna system) will be somewhere between zero (not equal to zero) and 200 mV /m (see Fig.1 -10).
In actual practice, the signal will not come down to zero in the null. Reradiation from guy wires and other external
20
www.americanradiohistory.com

effects on the antenna system will prevent full cancellation. Signal strength will approach zero but never quite reach it.
The radiation pattern for this example can be defined by the equation;E = 2E2cos(S /2 cos 0 +42/2) where
E = unattenuated field intensity from the directional antenna in millivolts per meter radiated in the horizon- tal plane (along the ground) E2 = unattenuated horizontal field intensity from each tower in millivolts per meter S = spacing in degrees between the two towers
= azimuth angle toward the measuring point in degrees
= electrical phase in degrees of tower 2 referenced to tower 1
cos = the cosine of the angle, determined from a table of natural trigonometric functions
With this formula, one can now determine the actual radiation that will occur at any azimuth angle around the directional antenna system. For example, to determine the unattenuated field strength on the 90- degree bearing (due east) you would proceed as follows:
E = 2(100) cos (90/2 cos 90° + 90/2) = 200 cos (45 x 0 +45) = 200 cos 45° = 200 (0.707) = 141.5 mV /m on the 90- degree bearing
(Note: cos 90° = 0, and cos 45° = 0.707.)
This formula is usable for 2 -tower configurations under the following conditions:
1. When tower 2 is set directly north of tower 1 (No. 1 is the reference tower, with a 0- degree phase)
2. When the towers are excited by equal amounts of current (current ratio 1 :1)
Condition 1 is easily met for all configurations, because after the pattern has been calculated, the line of towers can be positioned to place the null on the desired azimuth. As a matter of fact, most pattern plots are made using a north -south
21
www.americanradiohistory.com

line as the tower line; then they are rotated to place the nulls and minima in their proper positions.
Condition 2 is not always a fact. If it were desired to fill the null(thus making it a minimum), the current ratio would not be 1:1.
The value of E2, as we can see from the 2 -tower formula, will determine actual pattern size; that is, the actual amount of radiation produced at each azimuth angle. The value of E2 is dependent on power into the antenna system and the actual current ratios, spacing, height of the towers, and the phase relationship of the individual towers. Some configurations of directional antennas have a higher rms (root mean square) radiation than that of a single tower of the same height, and for others the rms will he lower. The rms value indicates the efficiency of an antenna system. In a nondirectional pattern, the inverse field is the same in all directions, and this is also the rms value of radiation. The measured rms value of the array is usually determined by measuring the area of the plotted pattern with a planimeter and comparing it to the area of a known nondirectional pattern drawn to the same scale.
The value of E2 can be determined mathematically. This procedure will not be discussed, as it is not considered a necessity for proper DA setup or maintenance once the pattern has been calculated by the consultant. It is of more interest to those designing a DA system.
Table 1 -1 shows actual calculated values of horizontal field intensity for the antenna system described here, using 100 mV /m as a value for E2. The actual horizontal radiation pattern produced by this system is shown in Fig. 1 -10. Calculations for any in -line array are carried out only for 180 degrees of azimuth, as the pattern will be symmetrical on both sides of the line of towers.
THE EFFECT OF PHASE AND SPACING ON PATTERN
In the 2 -tower array illustrated in Fig. 1 -9, tower 2 phase has been selected to produce a null in line with the towers. If the phase angle of No. 2 tower is advanced more than 90 degrees, two nulls will appear, one on either side of the line of towers, as shown in Fig. 1 -11. The azimuth angle of these
22
www.americanradiohistory.com

Table 1 -1. Inverse -Field Data for a Directional Antenna.
A=D B=cos0 C=BxS/2 D=C +V)/2 E=cosD F=Ex2E2
0 1.00 45 90 0 0 10 0.984 44.25 89.25 0.011 2.2 20 0.939 42.25 87.25 0.046 9.2 30 0.866 39.0 84.0 0.104 20.8 40 0.766 34.5 79.5 0.182 36.4 50 0.642 29.0 74.0 0.275 55 60 0.500 22.5 67.5 0.382 76.5 70 0.342 15.4 60.4 0.492 98.4 80 0.173 7.8 52.8 0.604 120.8 90 0 0 45 0.707 141.5
100 -0.173 -7.8 37.2 0.796 159 110 -0.342 -15.4 29.6 0.868 174 120 -0.500 -22.5 22.5 0.923 184 130 -0.642 -29.0 16.0 0.961 192 140 -0.766 -34.5 10.5 0.983 196.6 150 -0.866 -39.0 6.0 0.994 199.0 160 -0.939 -42.25 2.75 0.998 199.7 170 -0.984 -44.25 0.75 0.999 199.8 180 -1.00 -45.0 0 1.00 200.00
nulls will be equally spaced about the tower line. A minor lobe will appear centered on the line of towers. As the No. 2 phase is further advanced to x-180 degrees, the two nulls will lie broadside to the line of towers. As one advances the phase angle of No. 2 even further to +270 degrees, the null will appear due south; that is, off the end of No. 1 tower. (Note that +270 degrees can also be expressed as -90 degrees.) As the phase advances even further to 360 degrees (this is also 0 degrees), no complete null can exist for this tower spacing and phasing, because nowhere will radiated fields from towers 1
and 2 appear exactly 180 degrees out of phase. The expression S cos cf)° +q2 = ±180° indicates the
azimuth angle of the nulls, where
S = spacing tower 1 to 2 On= azimuth angle of the nulls from the tower line 412 = electrical phase of No. 2 tower
Example 2. The spacing between towers of a certain 2 -tower array is 105 degrees. Tower 2 phase is + 135 degrees. Upon which azimuth angle, from the line of towers, do the two nulls lie?
S cos 4+4/2 = -±.180° 105 cos On +135° _ ±- 180° 105 cos On = +45° or -315° cos O. = 0.4285
= 64.5°
23
www.americanradiohistory.com

Fig. 1 -11. Directional pattern when phase angle of No. 2 is more than 90 degrees.
The nulls will lie at ±64.50 degrees from the line of towers, as
illustrated in Fig. 1 -12. It can be seen that if the spacing is changed and it is
desired to keep the nulls in the same direction, phasing must also be changed.
Example 3. The spacing between towers in a certain 2 -tower array is 120 degrees. It is desired to position the pair of nulls 64.5 degrees from the line of towers. What must the phase (ßr2) of tower 2 be?
S cos 0 +02 = ±180° 120 cos 64.5 ° +Jr2 = ±180° 120 (0.4285) +42 = ±180° 51.42 ° +q2 = ±180° JJ2 = 128.58°
Electrical phase and tower spacing together will determine the azimuth angle of the two nulls from the line of
24
Fig. 1 -12. Illustration of example 2.
www.americanradiohistory.com

towers. For a given tower spacing, only one phase relationship exists for positioning the nulls at a particular azimuth angle.
For tower spacings up to 180 degrees, one or two nulls can exist. If there is only one null, it will be in line with the towers. For spacings between 180 degrees and 360 degrees, two, three, or four nulls can exist. The number of nulls and their azimuths will depend on the exact spacing and phasing of the two elements.
THE EFFECT OF CURRENT RATIO ON PATTERN
From our previous examples, it is evident that when the currents in both towers are equal, a null will be produced. The current ratio is then said to be 1:1, or unity. As the current in tower 2 is lowered, the current ratio between tower 1 and tower 2 is no longer unity. When the current in tower 2 is one -half that in tower 1, the current ratio will be 2:1. When the signals from tower 1 and tower 2 arrive at the measuring point and are 180 degrees out of phase but not equal in magnitude, as will be the case for other than unity current ratio, complete cancellation will not occur; hence, no null. The measured signal strength at this point will be the minimum for any azimuth around the array, but not zero. As mentioned previously, these points are called minima.
When the current in one tower is reduced to zero, all radiation is from the other tower and a nondirectional pattern occurs. For a given current ratio, pattern shape will remain constant regardless of which tower has the maximum amount of current. In the case where both towers are of equal height (which has been assumed all along), the current ratio is sometimes referred to as the field ratio. Current ratio will affect only the depth of the minimas, reducing them to nulls when it becomes unity (1:1) (Fig. 1 -13).
DRIVING -POINT IMPEDANCE In a single -tower nondirectional antenna system there is
one impedance which is of interest, the feedpoint impedance. When the radiator is of the insulated type, the feedpoint is at
25
www.americanradiohistory.com

CURRENT RATIO .8:1 CURRENT RATIO .9:1
CURRENT RATIO 1:1
Fig. 1 -13. The effect of current ratio on nulls.
30mV /m 20mV /m 10mV /m
the base of the tower. Thus feedpoint impedance and base impedance are synonymous. The height of the radiator, in terms of wavelength, will determine the actual resistance and reactance values present at its base. This is easily measured at the operating frequency by using an rf bridge. When the radiator is energized, the impedance remains constant (or at least should) and the point at which it was measured has become the driving point of the tower. In the nondirectional system, the self- impedance and the driving -point impedance are the same.
When another tower is introduced into the system, as in the case of a directional antenna, the situation changes somewhat. Each of the towers has its self- impedance, as measured by the rf bridge and determined mainly by its height. If all of the radiators are symmetrical and of equal height, the self- impedance of each should be identical, or at least very close in value. However, when the array is tuned up and operating, the value of resistance and reactance (impedance) present at the feedpoint of each radiator is no longer the same as the measured self -impedance. The operating value of feedpoint impedance in a DA is called the driving -point impedance. This change in value from the self- impedance is due to the effect of coupling which exists between the radiators. This effect is called mutual impedance and is similar to what occurs when two inductors are placed in close proximity to each other. The value of mutual impedance between radiators is dependent on their height and spacing (Fig. 1 -14).
The actual driving -point impedance of each radiator in the DA system will be dependent on the radiator's
26
www.americanradiohistory.com

/' self - impedance, its height and the height of each of the other radiators in the system, its spacing to each of the other radiators, and the electrical phase and current ratio of each radiator. From this it can be seen that any change of current or phase in any tower will produce a change in the driving -point impedance of each radiator. It is also evident that direct measurement of the driving -point impedances cannot be made until the array has been tuned up and each radiator energized with proper currents and phase relationships. However, knowledge of the driving -point impedance is necessary before any design work on the actual phasing system can begin. The antenna- tuning units, which are part of the feeder system, must be designed to match the driving -point impedance to the respective feedlines. The driving -point impedances of the radiators will also determine loss in the DA system and will have some effect on the electrical stability of the array. Therefore, the driving -point impedance of each radiator must be calculated. In almost all cases, the driving -point impedance of each radiator in the array will be different from that of any other radiator. Calculation must be made for each.
The formula for determining the driving -point impedance of tower No. 1 of a 3 -tower directional antenna system is
Z1 = Z11+ I2 Z12+ I3
I1 I1
For tower No. 2 in the DA
50
40
30
20
10
Z13
Z2 = Z22+ 12
Z12+ Z23 I2
- MAGN 1TUD e
40 80 120 160 200 TOWER SPACING IN DEGREES
Fig. 1 -14. Mutual impedance between 90- degree vertical radiators.
240
180
144
108
72
36
280 0
27
www.americanradiohistory.com
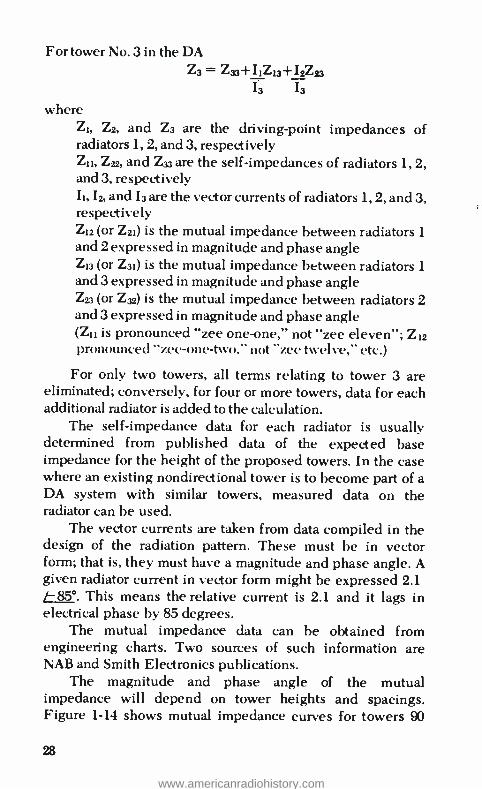
For tower No. 3 in the DA Z3 = 43 +I1Z13 +I2Z23
I3 I3
where Z1, Z2, and Z3 are the driving -point impedances of radiators 1, 2, and 3, respectively Z11, Z22, and Zaa are the self -impedances of radiators 1, 2, and 3, respectively I1, I2, and I3 are the vector currents of radiators 1, 2, and 3, respectively Z12 (or Z21) is the mutual impedance between radiators 1
and 2 expressed in magnitude and phase angle Z13 (or Z31) is the mutual impedance between radiators 1
and 3 expressed in magnitude and phase angle Z23 (or Z32) is the mutual impedance between radiators 2 and 3 expressed in magnitude and phase angle (Z11 is pronounced "zee one -one," not "zee eleven "; Z12 pronounced "zee-one-two," -two," not "zee twelve," etc.)
For only two towers, all terms relating to tower 3 are eliminated; conversely, for four or more towers, data for each additional radiator is added to the calculation.
The self -impedance data for each radiator is usually determined from published data of the expected base impedance for the height of the proposed towers. In the case where an existing nondirectional tower is to become part of a DA system with similar towers, measured data on the radiator can be used.
The vector currents are taken from data compiled in the design of the radiation pattern. These must be in vector form; that is, they must have a magnitude and phase angle. A given radiator current in vector form might be expressed 2.1 /-85 °. This means the relative current is 2.1 and it lags in electrical phase by 85 degrees.
The mutual impedance data can be obtained from engineering charts. Two sources of such information are NAB and Smith Electronics publications.
The magnitude and phase angle of the mutual impedance will depend on tower heights and spacings. Figure 1 -14 shows mutual impedance curves for towers 90
28
www.americanradiohistory.com

degrees (1/4 wavelength) in height and for spacings from 0 to 280 electrical degrees. For other tower heights, another chart must be used.
Now, let's proceed to calculate the driving point impedances for towers 1 and 2 of the 2 -tower array shown in Fig. 1 -10.
Tower 1 Data Height = 90° Vector current = 1/0° Spacing to No. 2 tower = 90°
Tower 2 Data Height = 90° Vector current = 1/ +90° = I2
Spacing to No. 1 tower = 90°
From published engineering data, the uniform cross- section guyed towers that are being used in our imaginary installation will have a base impedance of 38 +j20 for a height of 90 degrees. The expression 38 +j20 means the base resistance is 38 ohms and the base reactance is an inductive 20 ohms.
Thus 38 +j20 becomes Z11 and Z22 in the driving -point calculations, where Z1, and Z22 are the self -impedance values for both towers as each tower is identical to the other.
By referring to Fig. 1 -14, the mutual impedance can he determined. Move along the bottom of the chart until you come to a spacing of 90 degrees; now, go vertically upward until you intersect the curved line marked "magnitude." The value of the magnitude of mutual impedance is read on the left side of the chart and is found to be 24. Follow the same procedure across the bottom of the chart to a spacing of 90 degrees, then upward to the straight line marked "phase." On the right side of the chart, phase is read as 40 degrees; noting the negative sign above the straight line, the phase angle is -40 degrees. The mutual impedance then is 24 / -40 °. This becomes Z,2 and Z2, in the calculations. Since the spacing between towers 1 and 2 is the same as the spacing between towers 2 and 1, Z,2 and Z2, are always equal.
29
www.americanradiohistory.com

The formula for No. 1 radiator's driving -point impedance is
Z1 = Z11+12 Z12 I1
Substituting the numerical values, we then have
Z1 = (38 +j20)+ r(1 / +90 °) 24 -1(1`11 L(1/ 0 °)
= (38 +j20)+ [(1 / +90 °) 24 / -40°] = (38 +j20) +(24 / +50 °)
Change the second term to rectangular form and add.
Z1 = (38 +j20) +(15.4 +j18.4) = 53.4 +j38.4 ohms
The same procedure is then followed for calculating the No. 2 driving -point impedance.
Z2 = Z22 +11Z21 12
= (38 +j20) +[1Ú 24 40 °] 1 / +90°
= (38 +j20)+ [(1 / -90 °) (24 / -40 °)] = (38 +j20) + )24 / -130 °)
The second term is changed to rectangular form and added.
Z2 = (38 +j20) +(- 15.4- j18.4) = 22.6 +j1.6 ohms
(Note: If you are not familiar with vector addition, multiplication, etc., see Appendix I.)
Two towers with the same self- impedance can and usuallydo have different driving -point impedances. Whe n both radiators are fed with equal currents and equal electrical phases, both driving -point impedances are equal -but they are not the same as the self- impedance.
When the driving -point impedances are known, the power distribution of the array can be determined. From the original design parameters the current ratio was shown to be unity; that is, equal current in each radiator. Remembering that power is I2R, it is evident that the radiator with the
30
www.americanradiohistory.com

highest driving -point impedance will be energized with the most power.
By multiplying each driving -point impedance by the square of the current ratio in the respective radiator, adding the two, and deriving a proportion, power distribution can be determined.
Ratio2 X driving -point Z = power 12 x 53.4 = 53.4 12 x 22.6 = 22.6
53.4 +22.6 = 76.0W = 100 percent power Tower 1 power = 53/76 = 0.703 = 70.3 percent
Tower 2 power = 22.6/76 = 0.297 = 29.7 percent Now, if the total power is 1000W, No. 1 will carry 703W
and No. 2 will carry 297W. This information is necessary for the design of the feeder system, because the components in the antenna -coupling units must be capable of handling the powers involved.
FEEDER SYSTEMS
The radiation pattern of the directional antenna is determined by, among other things, the current ratios and electrical phase of the currents in each radiator. All of these parameters are taken into account when the pattern is calculated. The job of the feeder system -which includes the phasor, transmission lines, and antenna- coupling units -is to produce the proper currents and phases in the radiators as efficiently as possible.
Since a certain amount of overall phase shift will be produced in the transmission lines, it is necessary to determine line lengths to each radiator before starting design of the other feeder equipment. Knowledge of the location of the transmitter building (and phasor) in relation to the elements in the array is a must. Figure 1 -15 shows a typical plot plan for the imaginary radio station that has been the topic of discussion in previous sections. The air -dielectric coaxial cable that will be used has a velocity factor of 85 percent or 0.85. (This is referred to the velocity of radio waves in free space.) Our station, which we will call XYZ, is operating on 1120 kHz with a power of 1 kW.
31
www.americanradiohistory.com

219.75' Ono
Fig. 1 -15. Station plot showing lengths of feedlines.
From the plot plan it can be seen that the line to No. 1 is 100 ft long. The first order of business is to convert this length to electrical degrees. Wavelength in feet equals 984.5 divided by thesfrequency in megahertz. / << <f 7 .; z y X t
(!:b'35- 7ic 'uos ) 984.5 984.5 - 879 ft = one wavelength at 1120 kHz
f - 1.12
Since the No. 1 transmission line is 100 ft, we determine the wavelength by
line length feet 100 one wavelength ß79 = 0.114 wavelength
Because one wavelength is equal to 360 degrees, the following operation will enable us to determine the physical length of the line in degrees.
0.114 x 360° = 41°
This is the physical length of the line. We must determine its electrical length taking the velocity factor of the transmission line (0.85) into account.
41 - 48° electrical length of No. 1 line 0.85
32
www.americanradiohistory.com

Following the same procedure, the electrical length of the No. 2 transmission line is determined
189 = 0.215 wavelength 879 0.215 x 360 = 77.5° (physical length)
0.85 - 91° (electrical length)
This means simply that from the input end to the output end of transmission lines No. 1 and No. 2, there will be phase lags of 48 and 91 degrees, respectively (Fig. 1 -16).
At the base of each tower there will be a matching network to efficiently couple energy from the 50 -ohm coaxial cable to the driving -point impedance of each tower. In addition to effecting a match between line and radiator, these networks will introduce phase shifts that must be considered.
Figure 1 -17 shows the complete layout of the feeder system. Starting at the point where the transmitter feeds the input to the phasor, we will next consider the function of each network and component.
Meter M1 is the common -point meter. Common -point impedance will later be measured at this point (after the array is in tune). Power into the antenna system will be determined by MI.
+900
o-- LINE 1 -480 COMMON -POINT MATCHING
LTU 1
-910 INPUT NETWORK FROM XMTR
POWER CONTROL 2
00
LINE 2 -910 PHASE CONTROL 2
LTU 2
-480
1/0
1/900
v
Fig. 1 -16. Block diagram of feeder system.
33
www.americanradiohistory.com
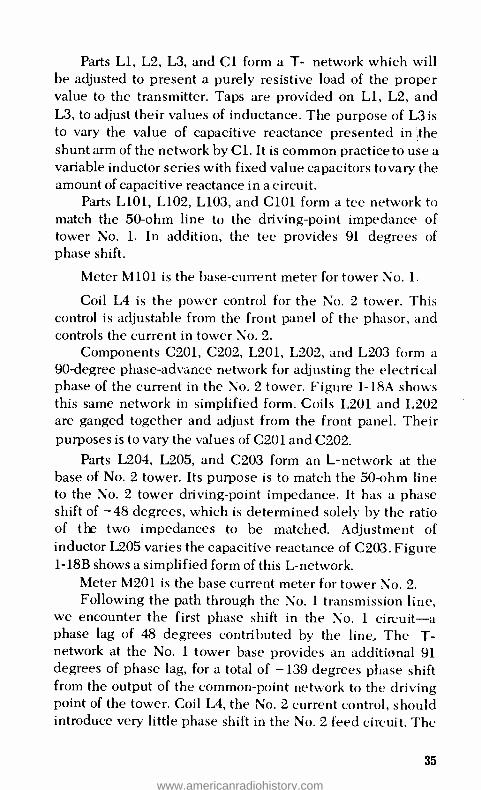
Parts Ll, L2, L3, and C1 form a T- network which will be adjusted to present a purely resistive load of the proper value to the transmitter. Taps are provided on L1, L2, and L3, to adjust their values of inductance. The purpose of L3 is to vary the value of capacitive reactance presented in 'the shunt arm of the network by Cl. It is common practice to use a variable inductor series with fixed value capacitors to vary the amount of capacitive reactance in a circuit.
Parts L101, L102, L103, and C101 form a tee network to match the 50 -ohm line to the driving -point impedance of tower No. 1. In addition, the tee provides 91 degrees of phase shift.
Meter M101 is the base- current meter for tower No. 1.
Coil L4 is the power control for the No. 2 tower. This control is adjustable from the front panel of the phasor, and controls the current in tower No. 2.
Components C201, C202, L201, L202, and L203 form a 90- degree phase -advance network for adjusting the electrical phase of the current in the No. 2 tower. Figure 1 -18A shows this same network in simplified form. Coils L201 and L202 are ganged together and adjust from the front panel. Their purposes is to vary the values of C201 and C202.
Parts L204, L205, and C203 form an L- network at the base of No. 2 tower. Its purpose is to match the 50-ohm line to the No. 2 tower driving -point impedance. It has a phase shift of 48 degrees, which is determined solely by the ratio of the two impedances to be matched. Adjustment of inductor L205 varies the capacitive reactance of C203. Figure 1 -18B shows a simplified form of this L- network.
Meter M201 is the base current meter for tower No. 2. Following the path through the No. 1 transmission line,
we encounter the first phase shift in the No. 1 circuit -a phase lag of 48 degrees contributed by the line, The T- network at the No. 1 tower base provides an additional 91 degrees of phase lag, for a total of 139 degrees phase shift from the output of the common -point network to the driving point of the tower. Coil L4, the No. 2 current control, should introduce very little phase shift in the No. 2 feed circuit. The
35
www.americanradiohistory.com

C201
I
A
C202
L203
TEE NETWORK
L204 lYYlfl
C203
/77 Fig. 1 -18. Phasing network (in A) and impedance- matching network (in
NETWORK
B).
phase control T- network advances the phase by 90 degrees, the No. 2 line introduces a lag of 91 degrees, and the L- matching network a lag of 48 degrees. Adding all of these phase shifts together, we have a total of -49 degrees of phase shift.
To reduce the No. 1 tower back to a reference of 0 degrees, we merely add 139 degrees to each phase shift.
No. 1 tower: -139 °+ 139° = 0° No. 2 tower: -49 °+ 139° = +90°
By adding the same figure to each phase shift, nothing has been altered. The No. 1 tower has been reduced to zero for use as a reference for measuring the phase of the No. 2 radiator. The No. 2 tower could be used as a reference by adding 49 degrees to each, and the new figures would be
No. 1 tower = -90° No. 2 tower = 0°
These figures are the same as the previous ones. If No. 1
tower lags by 90 °, then the No. 2 tower must be at plus 90 °.
The usual procedure is to use the radiator which carries the largest amount of power as a reference. In this case, it is the No. 1 tower.
By using the formulas for T- and L- networks contained in the section "Producing the DA Pattern," the actual values of inductive and capacitive reactances needed in these networks can be calculated.
36
www.americanradiohistory.com

A No. 1
A NO.1
A A NO.1 NO.2
A A NO.2 NO.2
A A A A NO.3 NO.3 NO.3 NO.4
IN-LINE DOGLEG PARALLELOGRAM
Fig. 1 -19. Different configurations of directional arrays.
DIRECTIONAL ANTENNAS USING MORE THAN TWO RADIATORS
Every DA system must have at least two towers. However, the maximum number of radiators in such a system is unlimited, at least theoretically. There are arrays of six and more towers in use in the U.S. today. Multitower arrays are capable of producing many nulls or minima; hence very wide angles of signal suppression. These systems usually will take the form of in -line arrays (all towers in line), dogleg arrays (one tower offset), and parallelogram arrays (four towers arranged in a square (Fig. 1 -19).
Each configuration (and others not mentioned) has its own properties that can be used to good advantage in particular situations. The in -line array will produce symmetrical nulls and lobes on either side of the line of towers; the other arrays are used where asymmetrical patterns are required.
The design and tuning of these antenna systems require a great amount of ingenuity and skill, even though the basic procedures used for all are the same. Each time another radiator is added to a system, the complexity of the array probably increases by the square of the number of towers. Each radiator will affect each of the other radiators due to mutual impedance; therefore, it will increase the time required to effect the proper tuning of such an array.
37
www.americanradiohistory.com

ARRAYS USING RADIATORS OF DIFFERENT HEIGHTS
All of the DA material presented thus far assumed each of the radiators to be of the same type and height. Situations in which an AM radiator serves as the support for an FM antenna might call for a particularly tall tower to be used in conjunction with a more conventional quarter -wave tower. Providing that the taller tower is no higher than 5/8
wavelength, this is entirely practical. The FM feedline, of course, must be designed so that it does not short circuit the rf energy at the AM frequency.
When two towers are of the same height and each is excited individually by a given amount of rf power, each will radiate the same amount of signal as measured at a distant point. However, if we had one quarter -wave tower and one half -wave tower and excited each individually with a given amount of rf power, the half -wave tower would radiate about 120 percent of the signal radiated by the quarter -wave tower. To cancel completely, the radiation from each radiator has to be equal and 180 degrees out of phase. With equal- height towers, current and radiation are synonymous. If current is up 10 percent, actual measured field will be up 10 percent. Therefore, we were able to use current ratios as the magnitude for our vectors. However, to get the same amount of radiation from the quarter -wavelength radiator as we are getting from the half -wave radiator, more power will be required in the shorter tower. With the situation of unequal towers, all thoughts of using current ratios in calculations must be forgotten. Field ratio is used instead. Field ratios are the actual amounts of radiation (in millivolts per meter) from each tower.
After the pattern calculations are made using field ratios, actual base currents (taking base resistance and radiation efficiency into account) can be calculated and used in the tuneup of the array.
For example, suppose we wished to use a quarter -wave tower and a half -wave tower in a 2 -tower array where the field ratios had to be equal to produce a complete null. From engineering tables, the following data is obtained:
38
www.americanradiohistory.com

Base Inverse Resistance Radiation
mV /m for 1 kW
Tower 1: 1/4 wavelength, 90° 38 ohms 195
Tower 2: 1/2 wavelength, 180° 700 ohms 235
For a power of 1 kW, the 180 -degree tower will radiate 235 mV /m inverse field and the 90- degree tower only 195
mV /m. Logically then, the power in the taller tower must he
lower to reduce radiation to 195 mV /m. Actual power ratio
can be determined by the formula
Power ratios = (F 0'2)2
where F1 = radiation from tower 1 in mV /m for a given power F2 = radiation from tower 2 in mV /m for the same power
¡2 Power ratio =( 35 J = 0.832 = 0.69
This means that only 69 percent of the power in tower 1
is required in tower 2 (the taller of the two) to produce the
same inverse field. Now, to determine the ratio of currents in tower 1 and 2
to produce the same inverse field, the arithmetic must be
carried further. In tower 1, if lA flows, the power in the
tower will be 12 x 38 =38W. To produce the same amount of inverse field in tower 2, only 69 percent of this power is
required. There is 38 x 0.69 = 26.22W in tower 2. The base
resistance of tower 2 is 700 ohms. Therefore, using I2R and substituting known values, we have
I2R = P I2700 = 26.22 I2 = 0.0375 I = V0.0375 = 0.194
Therefore, 0.194A of current in tower 2 will produce the same radiated field as lA in tower 1.
39
www.americanradiohistory.com

LOSSES IN DIRECTIONAL ANTENNA SYSTEMS Nothing in life -and certainly in electronics -is 100
percent efficient. The base resistance of each radiator in the system is made up of radiation resistance and loss resistance, as covered earlier. Besides this loss, feedlines and coupling units are not 100 percent efficient. In the case of nondirectional systems antenna power is measured at the base of the tower, past feedlines and coupling units. Any losses encountered in these components will not cause power measurement to be in error, as transmitter power output is adjusted upward to compensate for this. When using a directional antenna, power output is measured at the common point- before feedlines, power dividers, tuning units, etc. -as it is impractical and inaccurate to measure power in each element of the antenna system. Ero
1 compensate for these losses, FCC rules permit the actual measured value of common point resistance tobe reduced to 0.925 for stations using a power of 5 kW or less, and to 0.950 of its measured value for stations using 10 kW and more. For
L lower powered stations, this represents an increase in power of approximately 8 percent, and for the higher powered sta-
, tions, an increase of about 5.25 percent. For example, a 1 kW station with a measured
common -point resistance of 58 ohms would have a figure of 53.65 ohms entered on the license and would have a ! licensed common -point current of 4.32A. Using I2R, the authorized power is 4.322 x 53.65 = 1001W, by the license,
-; and 4.322 x 58 = 1082W actually delivered to the common point. Any losses beyond this 8 percent are not accounted for, and if excessive, will show up as a low rms value for the array.
In the DA proof required to be submitted with the application for a license, the rms value of radiation must be shown. A nondirectional system that radiates an inverse field of 200 mV /m also has an rms of 200 mV /m. With the nondirectional system, the inverse field is the same at all azimuth angles. The DA inverse field varies with direction (azimuth angle), and thus is not as easily determined. After the DA pattern has been determined, it is plotted to scale on
40
www.americanradiohistory.com

polar coordinate paper, and its area is measured with the aid
of a planimeter (an instrument used to measure the area of
irregular 2- dimensional drawings). While designing a DA system, care must be paid to the
driving -point impedances of the various elements. Very low
values of driving -point resistances, especially in towers that
carry considerable power, will result in excessive currents. This increases losses, as the radiation resistance decreases while the loss resistance remains constant.
The FCC rules specify certain minimum radiation values for antenna systems associated with the various classes of radio stations. Poor design, inadequate ground system, misadjustment of coupling or phase -shift networks, etc. can cause excessive losses and if severe enough, can prevent one from attaining a minimum acceptable value of rms radiation from the array.
41
www.americanradiohistory.com

A suitable location for a DA system must also be free of
tall structures in its immediate vicinity. When high- intensity
radiation contours lie over tall structures, reradiation is likely
to occur. This reradiation will cause distortion to the DA
radiation pattern. If this condition is severe, it will be
impossible to produce the radiation pattern called for in the
construction permit. Such structures include, but are not
limited to: existing radio or TV towers, water tanks, and steel
support towers for high -voltage transmission lines. In most
cases, it is possible to detune (make electrically invisible)
these offending structures at the operating frequency.
However, this process can be both lengthy and expensive.
Avoid these conditions if possible. Generally, structures of
less than 1/8 wavelength in height will not cause problems of
this nature unless they are very close to the array (closer than
one wavelength at the operating frequency).
In rural areas, locating a suitable site for a DA system may
not pose too much of a problem. Where a large tract of land is
required for a DA system to serve a highly populated
metropolitan area, site selection can be, and usually is, a major
problem. Land in close proximity to the city may be
prohibitively expensive or even completely unavailable. In
this case, a site considerably removed from the city must be
chosen. A consultant might then want to conduct actual on -site
tests to determine ground conductivity over the path from the
proposed site to the city's business district. In other cases,
where the only available site is far removed from the city,
waiver of FCC minimum field intensity rules may be applied a
for and granted. Local zoning laws can make an otherwise acceptable site
unavailable for use as an AM transmitter site. It is wise to
obtain a copy of the zoning code for each township or political
subdivision that you have under consideration. It is likely that
a special zoning exception will be required for the erection of
tall radio towers. At this stage of planning, one must also take into
consideration the availability of electric power and telephone
program transmission facilities at prospective sites. All
transmitters of 5 kW and above require a 3 -phase power
44
www.americanradiohistory.com

source of either 240 or 480V, the 480V source being required for 50 kW installations. If the availability of such circuits depends on the power company installing long runs of poles and lines, you might be required to either share the cost or make a large cash deposit in advance.
In some areas, the power companies will not run these circuits any farther than 100 ft onto private property. This means that if the transmitter building is to be more than 100 ft from the road, you may have to engage a private contractor to install poles and lines from the building to the road. Normal procedure is to run the high -voltage feed (4160V, for example, up to a point close to the building and then install a transformer on a pole or concrete pad to obtain the necessary 240 or 480V. All of this should be carefully considered during the initial planning stages.
Program transmission facilities, supplied by the telephone company, will also be required unless the studio will be housed in the transmitter building. Since the telephone company may have to go to a considerable expense to provide these facilities, an advance deposit or a sharing of the construction costs may also be demanded. You should check into the availability and cost of required services as a part of the selection of the transmitter site.
AUTOMATIC DA NONDIRECTIONAL SWITCHING Before the design of the phasing system is started it is a
good idea to give some thought to installing the necessary equipment to allow switching from DA to nondirectional operation at the push of a button. All construction permits for a new DA system require that a nondirectional proof of performance be made and submitted with the application for a license. After the array has been operating for a time, circumstances could dictate that a new nondirectional proof be made. For the station that has the foresight to install the necessary switching equipment, there will be little or no problem.
The cost of this extra equipment is not excessive, considering the overall cost of the phasing equipment. The dollars spent on this equipment may be saved tenfold if the need to do a new nondirectional proof arises.
45
www.americanradiohistory.com

The required equipment consists of a relay at each tower, installed in the line- tuning unit and the necessary reactive components to detune each unused tower. In the reference tower line- terminating unit, components for matching the self- impedance of the tower to the characteristic impedance of the transmission line will be required. Sometimes it is possible to use the same components already installed in this terminating unit for DA operation.
In the phasor, another relay is installed to feed the transmission line to the reference tower directly from the transmitter output.
The purpose of this circuitry is to open the feed to each unused tower and insert the proper detuning elements to make them ineffective radiators, while suppling the transmitter rf power output to the reference tower when the circuitry is energized.
TOWER LIGHTING ISOLATION Any AM tower that requires aircraft hazard lighting must
have some means to get ac power across the base insulator. At the same time, the ac wiring must not short out the tower at rf frequencies. One of two means are generally used, a lighting choke or an O -ring lighting transformer.
The lighting choke's main advantage is that it is the less expensive of the two alternatives. The choke consists of two or three bifilar windings. The number of windings will depend on whether 120 or 240V is needed on the tower. The windings are made of No. 10 or 12 wire through which the 120 or 240V ac is fed to the lights. This choke appears as a high value of inductive reactance across the base insulator, causing little change in the self- resistance and reactance of the tower. Its disadvantage is that as it ages, it is possible for the value of reactance of the choke to change slightly. This change is likely to cause a change in the driving -point impedance of the tower, which will manifest itself as a change in the phase or current in the radiator.
The 0-Iring lighting transformer looks like two interlaced doughnuts. One doughnut (the transformer primary) remains at rf ground potential, and the second doughnut is attached to the tower and serves as the secondary. The O -ring transformer
46
www.americanradiohistory.com

acts as a small capacitance across the base insulator. The chance of changes occurring in the value of capacitance are remote. The only possibility of change which exists is a physical change in the position of the secondary or primary. This would be evident by inspection.
Both lighting chokes and lighting transformers are available with several current- carrying capabilities. The transformers are usually constructed so that they may be wired for 120- to -120V or 240- to -120V operation simply by changing jumpers.
In summation, the lighting chokes are less expensive, but they can become unstable as they age, and sometimes have a considerable effect on the self- impedance of some towers (especially at the low end of the AM broadcast band). If tower height is close to 1 wavelength, a high impedance (and high rf voltages) will be present at the base insulator. In this situation, the chokes should not be used.
The O -ring transformer's main disadvantage is initial cost. The cost is between two and three times that of a choke with a similar ac power -handling capability. One other negative factor concerning the O -ring transformer is the fact that the flasher mechanism for the beacon (where beacon and side lights are required) must be mounted on the tower. Even though this would normally be at ground level, it is "hot" when the system is in use. This will preclude, or at least complicate, maintenance and repair of the flasher mechanism while the station is on the air. The O -ring transformer is, however, capable of withstanding high rf voltages encountered when using tall towers or high power.
LOCATION OF BUILDINGS, TOWERS AND OTHER ESSENTIALS
After the transmitter site has been selected, it is imperative that a complete plot plan be drawn. Several copies of this plan should be made showing the location of towers, building access roads, and other necessities such as power lines. At this point, the plan is being prepared for our own use. The actual positioning of the tower bases with respect to orientation and spacing should be made only by a qualified
47
www.americanradiohistory.com

surveyor. This will be accomplished when you start the ac-
tual construction of the facilities. In essence, you lay out the approximate locations of the
tower bases, guy anchors, paths of the transmission lines to the towers (line length data will be required before the de- sign of the phasing equipment can begin), and building loca-
tion. It is not a bad idea to include the proposed locations of such items as septic tanks, wells, drain pipes and access roads.
Fairly accurate positioning of the tower line azimuth can be made on the plot plan with the use of a protractor and the north bearing line shown on the plan. This north bearing line more than likely will be shown in terms of magnetic north, but all of our bearing calculations for the array will be re- ferenced to true north. The actual difference between magnetic and true north varies from 0 to plus or minus 15 or
20 degrees, depending on the location. Navigational and aeronautical charts of your area will show magnetic vs true north variation.
Guy anchor locations will be spaced every 120 degrees around the towers. There will usually be an inner and an out- er anchor. The required distance in feet from the base of the towers to the inner and outer anchors should be obtained from the tower manufacturer.
When selecting the location of the building, the length of each transmission line to its respective tower base must be given careful consideration. If the efficiency of the array is
considered to be marginal, then the shorter the transmission lines the better. Less line means less loss.
If a central location in relation to the array is impossible or impractical, then consider locating it nearest the tower with the maximum amount of power. Sometimes it is feasi- ble to locate the building adjacent to a tower and install the line terminating unit inside, or even eliminate it completely and go right to the phasor with the tower feed. The driving - point impedance of the tower and the relative phase rela- tionship of the tower will dictate if elimination of the line terminating unit is practicable.
Another factor to be considered when placing the build- ing on the plot plan is an access road or driveway. Transmit-
48
www.americanradiohistory.com

ter, phasor, and other heavy equipment must be transported into the building -not delivered at curbside.
Under no circumstances should overhead power lines be permitted to run between towers. Power lines, if not buried, should be kept as far away from the radiators as possible.
If a storm sewer or other metallic drain pipe is to be in- stalled under the ground system, each section of pipe should be bonded together and connected to the ground system at several points.
Adequate thought should be given at this time to the type of fencing to be installed about the base of each tower. Some consultants will advise against metallic fencing because of the possible effect it might have on the stability of the finished system, if the fence is installed near the radiators. Check with the consultant before making a final selection. And check with your insurance company on any physical requirements that they might have for protective fencing. It could have a bearing on the availability or cost of liability insurance.
TRANSMISSION LINES
There is an old saying which states, "Out of sight, out of mind." Hiding the transmission lines underground can avoid a lot of problems and can create others. Ironically, by install- ing them above ground the same is also true.
Transmission lines, sample lines, ac lines for tower lighting, and a multiconductor cable must be run from the transmitter building to the base of each tower. The choice between underground or aboveground installation can best be made by considering the environs of the proposed transmitter site.
Rigid coax and open -wire transmission line cannot be buried. Open -wire line is rarely if ever used for AM broad- cast installations in this day and age, so this restriction would apply only where rigid coax is used.
Buried lines -including phase -sampling lines, ac wir- ing, etc. -offer two main advantages: Stray rf pickup on these cables is virtually eliminated, and damage due to van- dalism of the cables will be nonexistent.
49
www.americanradiohistory.com

All of the semiflexible coaxial cables with protective synthetic coverings are suitable for direct burial. Direct - burial power cable for tower lighting is also available. One popular type is designated "UF" cable. The life expectancy of this type of cable, when buried, is in excess of 30 years. If your choice is an underground installation, the minimum ac- ceptable depth is 3 ft. This will minimize accidental injury to the cables from surface excavations.
The one obvious disadvantage of using buried cables is that repair or replacement becomes a gigantic headache. These same lines installed above ground on a messenger ca- ble or an elevated raceway, are always available for inspec- tion or repair.
In an aboveground installation, care must be taken that no unwanted radiation or rf pickup occurs. This can be a pro- blem, especially in high -powered installations. To prevent this, the shields of transmission lines and phase -sampling lines must be tied to the ground system at frequent intervals.
Installations in elevated raceways 2 -3 ft above ground also have the disadvantage of making grass cutting more dif- ficult. Elevated raceways for transmission lines are usually constructed of 4 x 4 support posts and 1 x 6 or larger lumber. When a messenger cable is used, the support posts are usually made from 10 ft or higher utility poles.
At the time of this writing, there is a proposed rule that would require phase -sampling lines to be buried.
PHASE -SAMPLING SYSTEM The energy exciting each one of the radiators in the DA
system is a vector quantity. All vectors consist of magnitude and phase angle. The magnitude of the vectors can be readi- ly observed in the various elements of the DA system by re- ading the base currents of the elements. The phase angle is not quite as simple to measure. For this process, each tower in the DA system is referenced against one othertower in the system. This tower is known as the reference tower and its phase angle will always be 0 degrees. The phase angle of all the other towers in the system is then measured in degrees (plus or minus) relative to the reference tower. Accurate and
50
www.americanradiohistory.com

reliable determination of the phase angle of the current in
each tower, besides being required by the FCC, is an all -
important tool in maintaining the radiation pattern of the directional antenna system.
To measure phase angle, a small amount of current is
sampled from each radiator and returned to the phase monitor in the transmitter building. This sample is taken at
the point on each tower where the current is at maximum by a loop of wire placed close to the tower. The point of max-
imum current is 90 electrical degrees (1/4 wavelength) down from the top of the tower. Coaxial cable is used to connect the current pickup device to the phase monitor. This line is
called the phase- sampling line. The phase monitor compares the phase angle of the current in the reference tower to the tower which is being monitored. The resultant phase angle is
displayed on an indicating instrument on the monitor. If two one volt ac sources of the same frequency are ex-
actly in phase, when combined, the resultant will be 2V. If the two sources are equal in magnitude (one volt each) and 180 degrees out of phase, the resultant will be zero volts.
These combinations of voltages can be read on a
voltmeter -in phase, 2V; 180 degrees out of phase, zero volts. If the 2V point on the indicating instrument is marked "zero degrees" and the zero -voltage point marked "180 degrees," we have the basis of the phase monitor. Points between zero and 2V are then calibrated in degrees. The ac-
tual circuitry of the modern phase monitor is somewhat more complex, consisting of limiters and other associated circuits to assure that the two sources being sampled are of equal magnitude. The indicating instrument on the phase monitor is calibrated for all values of phase between zero and 180
degrees. All values of phase angle between zero and 360
degrees can be read on an instrument of this type since positive phase angles of more than 180 degrees can also be expressed as negatice angles of less than 180 degrees.
The phase monitor forms only one small part of the en- tire phase -sampling system. No matter how accurate the monitor is in comparing the relative phase differences, it can only compare what is delivered to it by the pickup loops and the coaxial lines which connect the loops with the monitor.
51
www.americanradiohistory.com

There are currently several different types of pickup devices available. One has the choice between the insulated and noninsulated loops, between shielded and nonshielded loops, and the newer current transformer pickup device.
As mentioned earlier, the point on the tower whe re the rf sample is taken should be close to the point of maximum cur- rent on the radiator. This point is called the current loop. It is located 90 electrical degrees down from the top of the tower. In the case of radiators that are 90 degrees or less in height, the sample is taken at or near the base. If towers con- siderably higher than 90 degrees are used, the sample will have to be taken higher on the tower. The physical height of the towers, hence the point where we wish to simple cur- rent, will place some restrictions on what type of sample pickup device that can be used.
Where the radiators are of 90 degrees or less in height, a logical choice for the sample pickup device is the current transformer or an insulated loop. The current transformer is mounted inside the line terminating unit on the feed to the tower. This type of device has the advantage of not being ex- posed to the elements. An insulated loop should be mounted on the tower on standoffs about 15 ft or so from ground level to remove it from external influences. The feedline for the loop is also mounted on standoff insulators and its shield securely grounded in the line terminating unit. Phase sam- ple pickup loops are usually rectangular, with dimensions of approximately 18 x 36 in.
When the sample must be taken at a considerable dis- tance up the tower, one runs into the problem of coupling between the tower and the rather large length of sample line in close proximity, even if the line is mounted on standoff in- sulators. The logical choice of sample pickup device for this type of installation is an uninsulated loop with the sample line wraplocked to the tower. An isolation coil, consisting of enough turns of the sample line cable to form a large value of inductive reactance across the base insulator, is a must. The shield of the sample line at the bottom of the isolation coil must he securely grounded. The isolation coil itself is
52
www.americanradiohistory.com

mounted either in its own weatherproof housing or in the line terminating unit.
The FCC, in report No. 11318, proposes certain minimum standards for the phase -sampling system. Among the proposals under consideration is a requirement that the coaxial cable used for phase -sampling lines be constructed with a solid outer conductor. This would outlaw the use of RG -8 and other similar types of cable that have braided shields. Coaxial cable with stable temperature and phase - shift characteristics is available and is definitely preferable for use as sample line.
Each of the phase -sampling lines will have to bemade of
equal lengths of cable, to reflect equal amounts of phase lag
from each pickup device to the phase monitor. In other words, if one run of cable to a tower is 300 ft, then the second run to another tower must also be 300 ft, even though the tower might only be 100 ft distant. The extra 200 ft should be stored in the same environment as the longer cable.
The choice of the sample loops and lines should be made with the full concurrence of your consultant. Keep in mind that cutting corners can result in erroneous indications of the phase angle between towers, showing the array ap- parently unstable, when actually the "eyes" of the system are at fault.
FCC regulations now require that all new directional antenna installations be equipped with a type -approved phase monitor. The FCC term for these monitors is "Anten- na monitor." Existing monitors currently in operation are permitted to he used by some stations until June, 1977. Type -approved antenna monitors consist of two indicating instruments; one reads the phase angle in degrees, and the other reads the realative amplitude of the current in the radiator being monitored. A switch selects which tower's parameters are to be displayed. Except for a periodic check of calibration as outlined in the instruction book, modern phase monitors are relatively maintenance free. All type - approved phase monitors have provisions for the remote in- dication of both phase and current.
53
www.americanradiohistory.com
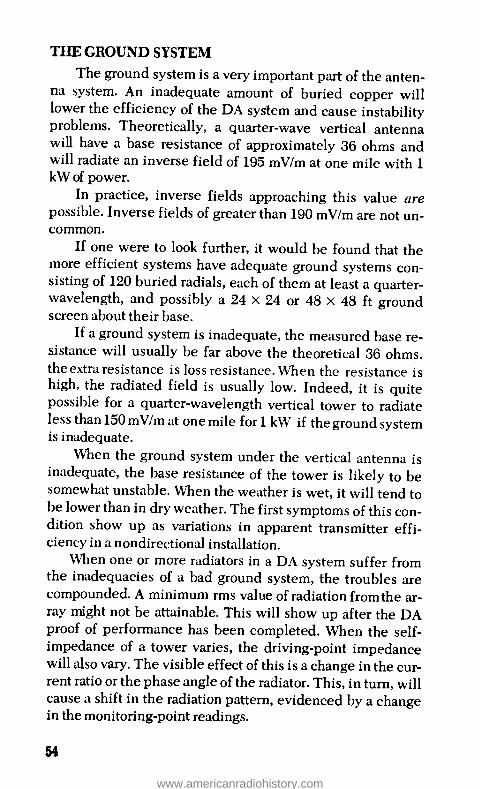
THE GROUND SYSTEM The ground system is a very important part of the anten-
na system. An inadequate amount of buried copper will lower the efficiency of the DA system and cause instability problems. Theoretically, a quarter -wave vertical antenna will have a base resistance of approximately 36 ohms and will radiate an inverse field of 195 mV /m at one mile with 1 kW of power.
In practice, inverse fields approaching this value are possible. Inverse fields of greater than 190 mV /m are not un- common.
If one were to look further, it would be found that the more efficient systems have adequate ground systems con- sisting of 120 buried radials, each of them at least a quarter - wavelength, and possibly a 24 x 24 or 48 x 48 ft ground screen about their base.
If a ground system is inadequate, the measured base re- sistance will usually be far above the theoretical 36 ohms. the extra resistance is loss resistance. When the resistance is high, the radiated field is usually low. Indeed, it is quite possible for a quarter -wavelength vertical tower to radiate less than 150 mV /m at one mile for 1 kW if the ground system is inadequate.
When the ground system under the vertical antenna is inadequate, the base resistance of the tower is likely to be somewhat unstable. When the weather is wet, it will tend to be lower than in dry weather. The first symptoms of this con- dition show up as variations in apparent transmitter effi- ciency in a nondirectional installation.
When one or more radiators in a DA system suffer from the inadequacies of a bad ground system, the troubles are compounded. A minimum rms value of radiation from the ar- ray might not be attainable. This will show up after the DA proof of performance has been completed. When the self - impedance of a tower varies, the driving -point impedance will also vary. The visible effect of this is a change in the cur- rent ratio or the phase angle of the radiator. This, in turn, will cause a shift in the radiation pattern, evidenced by a change in the monitoring -point readings.
54
www.americanradiohistory.com

The minimum adequate ground system for each radiator in a DA system is 120 radials evenly spaced about the base of each tower and extending out 1/4 wavelength, or a distance equal to the height of the radiator. These radials must be brazed or silver soldered (never soft soldered) to a ring around the cement foundation of the tower. At least 2 in. (and preferably 4 in.) copper strap should be connected to the ring and should crisscross the top of the foundation, un- der the tower base plate. Where radials have to be cut short, because of crossing the adjoining tower's ground system, strap must be buried and each radial brazed or silver soldered to it. Additionally, a strap should be buried and run between the line of towers, bonding each ground system together. Plan on bringing a 2- or 4 -inch strap into the build- ing for grounding the transmitter and phasor.
It is often advantageous to install a ground screen under each tower. It must be installed after the radial system is in place and brazed to each radial along its edge. These screens are available in 8 x 24 ft pieces and must be brazed together to form the 24 x 24 or 48 x 48 ft screens.
Remember, the ground system must he installed after transmission line, drain pipes, and oher underground work is in place. Plan to have a responsible representative of the sta- tion on hand at all times when the ground system is being in- stalled. Make sure that everything called for goes into the ground.
Inadequate ground systems are rarely planned that way. When they occur, you can usually trace their origin back to sloppy installation or insufficient supervision of the actual construction.
TOWERS Some tower manufacturers supply their own installation
crews; other subcontract the actual erection work. Both ar- rangements have their advantages and disadvantages. When the manufacturer does his own work, the erection crew is usually more familiar with the specific requirements of the broadcasting industry. This same crew travels around the country doing this type of work all the time. When the work is subcontracted, the crews are pulled from the local iron
55
www.americanradiohistory.com

workers union and need somewhat more supervision...supervision not from the standpoint of erecting the towers themselves, but supervision and insistence upon their carrying out such specialized requirements as spot welding tower legs for good electrical contact.
During the planning stages, a competent surveyor should be retained to later lay out the tower base locations. More about the importance of this in the section on tower alignment.
When choosing the type of towers to be installed, one should keep in mind possible future requirements such as the addition of F\I or two -way communications antennas on the structures. If this is even a remote possibility, one should consider using towers with a larger cross -section and heavier support members than would be normal for the particular height installed. The addition of fm or communications an- tennas will cause more wind loading on the structures.
Lighting equipment should he part of the tower package. Wiring on the tower should preferably be installed in conduit. If wire is to be run in the open, make sure that weatherproof cable capable of withstanding exposure to sun- light is specified. Actual requirements as to the number of lights will depend on the height of the towers. Photocell and beacon flasher mechanisms should also be part of the light- ing package.
Flasher mechanisms come in both electromechanical and solid -state models. The electromechanical flasher de- vice uses a motor to drive a mercury switch. Careful thought should be given to the effect of lightning discharges on the solid -state flashers. Additional precautions may be in order if they are used.
Power will be required at the base of each tower for tem- porary lighting during erection, and permanent lighting after completion. Plans for this should be made if the permanent wiring circuits will not be in place when construction starts.
PHASOR CONSIDERATIONS There is an old saying that we have all heard many
times: "You only get what you pay for." This holds true for everything in life, from used cars to phasing equipment.
56
www.americanradiohistory.com

Your construction permit (CP) is a legal contract with the FCC which says, in effect: "If you produce the theoretical radiation pattern which was shown in your application for the construction permit and are able to prove it, we will grant you a license to operate the equipment -provided you main- tain this radiation pattern."
Sometimes this is easier said than done, especially if corners have been cut in the design and construction of the phasing equipment that is responsible for producing the pat- tern.
Everything from the point where the transmitter feeds the phasor - through the common -point matching network, power divider, phase -control networks, line- terminating un- its, towers, and ground system -will determine if the theoretical radiation pattern can be produced. Possibly even more important -after it is produced, can it be kept within the specifications set forth in the license? Skimping on com- ponent size to reduce cost can cause heating, hence drift in component value. The components changing value show up as a drift in the operating parameters of the DA system.
Not locating all phase and current controls in one place, near the phase monitor in the transmitter building, causes in- creased cost and headaches when trying to adjust or readjust a DA system. Consider the system shown in Fig. 2 -1. The 3- tower array has separate feedlines from each tower to the phasor, which is located in the transmitter building. All
TRANSMITTER BUILDING
TOWER NO. 3
Fig. 2-1. A 3 -tower array with separate feedlines.
TOWER NO.2
TOWER NO. 1
57
www.americanradiohistory.com

Fig. 2 -2. Three -tower array with a common feed I i ne.
TRANSMITTER BUILDING
TOWER NO. 1
power and phase controls are located in one place, near the transmitter and phase monitor. The effect of any adjustment can be immediately read on the phase monitor.
Now, let's look at the same system using a different feeder configuration. in Fig. 2 -2, one common feedline runs from the building to the base of tower No. 1. Here, through power division and phase- control devices, No. 1 is energized; the feedline continues to tower No. 2, where a similar process takes place, and then to tower No. 3.
The configuration in Fig. 2 -2 costs less than the one in Fig. 2 -1, because it uses fewer components and less transmission line. However, when it comes to making adjust- ments in the initial tuneup of the array, the "economy" system can be a real headache -if not a nightmare.
Adjustment of phase and current in the several elements must be made at the base of each tower. But the phase monitor is in the transmitter building! If this inconvenience is not enough discouragement, the thought that adjustments to tower 1 will cause radical, undesirable changes (other than those due to mutual coupling between towers) in the current and phase relationships of towers 2 and 3 might be convinc- ing. The design defects in the system shown here in Fig. 2 -2 has purposely been much exaggerated to make a point. There are, however, many variations of this same configura- tion that will, to a greater or lesser degree, cause many of the previously mentioned difficulties.
If individual transmission lines are run from the phasor to each of the radiators, the difficulties encountered while
58
www.americanradiohistory.com

adjusting the DA system are not compounded by unexpected and unexplained interaction of adjustments. In addition, the phase and current indications of each element are easily ob- served in the transmitter building as the respective adjust- ments are made. In the event of failure of a component in the antenna system, it is also easier to track down and isolate the trouble to a particular tower feed when separate transmission lines are used.
If the budget can stand the added cost, it is wise to specify vacuum capacitors in critical circuits of the system. The vacuum capacitors are less prone to drift in value, and are not as vulnerable to destruction by lightning as the stan- dard mica capacitors.
The voltage rating of the capacitors used in the DA system should be at least four times the normal expected rms voltage to which they will be subjected. All large transmit- ting capacitors have current ratings marked on them. Current ratings of capacitors should be 1.4 times the normal expected rms current, or more.
Capacitor current ratings are given in amperes at 1 MHz. To determine the safe current rating at your operating fre- quency, apply the following formula:
If = I1 MHz Voperating freq (MHz)
where I1 MHz = current capability at 1 MHz.
Consider the following example. A capacitor has a rating of l0A at I MHz. The operating frequency of the station is 1440 kHz. What is the current -carrying capability?
I1= 10 V1.44 Ir =10x 1.2 = 12A
It can be seen from the example that the current capability will be more than the nameplate rating for fre- quencies above 1 MHz, and less than the nameplate rating at frequencies below 1 MHz.
If the current rating is exceeded, heating of the capacitor occurs and its value slowly changes, causing a drift in phase and current ratios in the DA system. Continued abuse of the capacitor will eventually cause a sudden dramatic change in
59
www.americanradiohistory.com

value, which means excessive deviation from the licensed operating parameters of the array.
While not absolutely necessary, an operating type of rf bridge, built into the phasor to continuously monitor the common -point impedance is a convenience which should be seriously considered. Any drift in component value or other change in the DA system will first show up as a change in the common -point impedance. When a day -to -day record of the resistance and reactance present at the input to the antenna system is recorded in the station maintenance log, any trend toward abnormality is easily seen. This type of device will enable the maintenance staff to look for potential trouble long before the trouble comes looking for them. LINE -TERMINATING UNITS
Line -terminating units (LTUs), sometimes referred to as antenna -coupling units are an intregal part of the overall feeder system. They must be located close to the base of the tower.
The function of the components in the LTU is to match the driving -point impedance of the radiator to the charac- teristic impedance of the transmission line. In the process of accomplishing this, the LTU will contribute phase advance or phase lag to the feeder circuit.
The actual configuration of the LTU will usually be of the T- or L- type. Because impedance matching and phase shift are taking place, malfunction or drift in the component values of these networks will cause a change in the operating parameters of the DA system. The same advice and precau- tions outlined in the section "Phasor Considerations" also apply to the components in the LTU networks.
In the broader sense of the term, "LTU" usually means the entire housing situated at the base of each tower. This housing can take the form of a weatherproof box, a small con- crete block, or similar type structure. The box, or building, is home for the base -curent meter, the tower -lighting choke (when used), and the phase -sample line isolation coil (when used), as well as the components which make up the actual coupling network.
60
www.americanradiohistory.com

The manufacturers of phasing equipment supply the LTU tuning networks in either a weatherproof box or con- structed on a metal plate for wall mounting inside an LTU building -your choice.
The only disadvantage of the building is its higher cost; therefore, some of the advantages will be pointed out. A careful survey of the stability of various DA systems would no doubt reveal that the most stable systems are using build- ings. It stands to reason that capacitor values are apt to re- main more stable in the semicontrolled environment of a blockhouse than in a sealed metal box. During sunny sum- mer days, the temperatures inside metal LTU housings have been known to reach 140 degrees! When trouble with the system develops, luck has it that it will usually happen when the outside temperature is zero and a blizzard is in progress. Conditions such as these make it difficult, if not impossible, to set up and use an rf bridge for troubleshooting. The small house, while not having all of the comforts of home, does of- fer a somewhat better environment for working on the system.
If construction of LTU houses is planned, the ground screen should be installed after the footings have been poured and the excavation made for the concrete slab. This assures continuity of the screen in an area of high rf currents. If it is impossible to install the screen under the floor, care must be taken to bond the screen to a copper strap around the perimeter of the building. At least one 2- or 4 -inch copper strap must be brought inside to bond the LTU mounting plate and other components to ground. Provisions for bring- ing the transmission line, phase sampling line, ac wiring, etc. into the building should also be included in the plans.
Of course, both the weatherproof box and the building type of LTU housings must keep out vermin. Mice, rats, snakes, and other undesirables can raise havoc with a DA system when permitted to inhabit the LTU.
Provisions for insulating the tower feed, tower -lighting wiring (if the isolation unit is in the LTU), and phase - sampling line where they enter the housing are mandatory.
61
www.americanradiohistory.com

THE TRANSMITTER BUILDING When a station is built from scratch, those involved in
the planning and construction have a golden opportunity to incorporate ideas and conveniences so that the facilities will not become obsolete after a few years. The transmitter build- ing will be the focal point of the operation. Careful planning of the size, type of construction, and arrangement of equip- ment in the transmitter building will go a long way to insure ease of maintenance and operation for many years to come. In addition, it will be a project of which you can be proud.
Under the present rules, a new DA system can not be operated by remote control until the antenna system has been proved stable. This takes at least one year of operation and, in many cases, longer. The plans of the building must take into consideration that the site will be manned at least for a year. FCC rules require that adequate sanitary facilities be provided for the duty operators. In cooler climates, provision for heating the transmitter plant in the winter is a must for both manned and remote -controlled sites. During the summer months, disposing of excess heat from the transmitter and associated equipment must be taken into account. Adequate workbench facilities must be provided for maintenance activities. Last, but certainly not least, the arrangement of the transmitter, phasor, audio equipment, and monitors must be planned for safety and convenience.
Other extras that might be included are a small studio and a shed for tools (lawn mower, shovel, etc.).
If the building is to be constructed on a concrete slab, planning of wire ducts and conduit to be installed in the floor should be completed long before the cement truck pulls up.
Suitable provisions for the housing of external power supply components must be made in high -power installa- tions. All transmitters in the 10 -50 kW class have external cooling equipment and power supply components.
The cost of building construction is directly related to the square footage. Careful advance planning will assure adequate space and avoid waste.
62
www.americanradiohistory.com

Figure 2 -3 shows the arrangement and layout of a typical transmitter building that houses a 10 kW transmitter, a 1 kW
auxiliary transmitter, a phasor, a small studio, audio equip- ment, sanitary facilities, and a small work area. All of this has
been accomplished in a 600 sq ft floor area. The building is of concrete block, the windows of glass
brick. While admitting as much natural light as possible, glass brick windows deter vandalism and give the building more security than plate glass ones would. The double doors
in the rear of the building are necessary for getting transmit- ters and other large equipment in.
The ceiling is 9 ft high to accommodate a plenum chamber on top of the transmitter. All of the equipment is
housed behind a paneled wall, with only the front panels protruding into the operating area. Rear access to the equip- ment and racks is in the work shop. Cool air is brought in
through a closable vent in the rear wall of the building. The hot air from the 10 kW transmitter can either be directed out-
H
I LEGEND
1. Built.in 30A in. (height) operating counter.
2. Equipment rack. 3. 240V 3 phase ac
distribution panel. 4. 120V ac distribution
panel. 5 Phasor. 6 10 kW transmitter. 7. Monitor equipment rack. 8. Audio equipment rack. 9. t kW auxiliary trans.
matter. to 10 kW dummy Joao. 11. Work bench. 12. Closable vent through
outside wall (under bench).
-3 f- WINDOW
-{ f- DOOR
3
STUDIO
12 I
1 LAVATORY
(T 3
20'
T
6
I 1T
3
Fig. 2 -3. Transmitter building layout.
i 63
www.americanradiohistory.com

side via two 18 in. ducts in the summer, or blown back into the operating area in the winter to augment the electric building heat. With this arrangement, a 12,000 Btu air condi- tioner keeps the operational area comfortable in the warmer months.
The small studio, even though consisting of only some 60 sq ft of floor area, houses a 4- channel console, two turntables, and tape equipment. It has proved adequate for the limited announcer -engineer type of programing that originates at the transmitter site in the early morning hours. A thermopane window gives the operator full view of the transmitter when seated at the console.
Four -inch square duct, set flush with the concrete floor, carries ac wiring, control wiring, and phase monitor sample lines. A 12 in. wide trough, constructed by placing a wooden form on the floor before the concrete is poured, serves as an underground entrance for the transmission lines and phase sample lines. The ac circuits for tower lighting leave the building through the rear of the 120V breaker box, and are carried underground in a 2 in. conduit.
Three 1 in. conduits connect the studio console with the equipment racks. The telephone line terminations and equalizers are housed in a cabinet on the wall of the studio.
The concrete floor should be covered with tile or linoleum. If this is not done, there will remain a never - ending problem of dust from the unsealed cement being sucked into the air intakes of the transmitter. With the use of the readily available do- it- yourself aluminum angle, mounts can be made for holding two filters in the air flow of the out- side air intake. In areas where dust is a problem, this is a worthwhile project.
While the building illustrated is not the answer to all situations, it will give some food for thought. The floor plan is best arrived at by drawing to scale on graph paper the loca- tions of the transmitters, phasor, etc. and shifting their posi- tions until a satisfactory arrangement is found. After decid- ing on the size of the proposed building, you will have to work with the building contractor on the details of building layout.
64
www.americanradiohistory.com

Chapter 3
Building The DA System
The theoretical radiation pattern of the DA system is based on the assumption that near perfect conditions exist. In the real world, one rarely if ever encounters perfect conditions. Such variables as nearby objects will invariably affect the overall operation of the antenna.
While realizing that the perfect cannot be achieved, extreme care exercised during the construction of the directional antenna system will assure one of having a workable finished product. Taking the time and pains when building the DA will in the long run save time and money in its adjustment and maintenance.
PREPARATION OF THE SITE As a starter, the services of someone with a tractor and a
large rotary mower attachment should be secured. This type of mower, commonly called a brush hog, will cut tall grass, weeds, and small trees up to an inch or so in diameter. Mow the entire site. Any remaining trees that lie within the confines of the ground system should be removed. For ecological reasons, a few trees on the outer edges of the ground system can probably be left standing. It is advisable to remove any tall trees (above 60 ft or so), even at the outer edges of the ground field. This is especially true if the operating frequency is at the high end of the broadcast band. An 80 ft tree is an appreciable portion of a wavelength in height at these frequencies. Any large roots that remain near the surface must be removed to facilitate plowing for the ground system. For this same reason, large boulders must also be removed.
The area that surrounds the tower bases, out to 25 or 30 ft in each direction, should be perfectly level. The ground
65
www.americanradiohistory.com

screen, if specified by the consultant, will be installed here. Each of the tower bases should lie within 5 -10 ft above or below the others in the system. Where grading is required, it is better to remove soil from the higher areas rather than to fill the lower ones. The average weight of a 250 ft tower is better than 2 tons. With the guy wire weight, the downward pressure is twice this. If a tower is based in a filled area, trouble is likely. This also applies to the guy anchor foundations. Where it is absolutely necessary to place tower bases or guy anchor foundations in a filled area, a civil engineer should be retained to determine the possibility or necessity of installing pilings. In some coastal areas, pilings are necessary even though the site has not been filled.
The area beyond the ground screen can have some slope. A good rule of thumb is to keep the slope in the ground field area to less than one foot of slope for each 10 ft of distance. The radials can be installed in properly settled fill. If the grade will exceed the figure mentioned, bring it to the attention of your consultant.
The tower manufacturer should provide you with the dimensions of the tower foundations and guy anchor foundations. If an anchor is to be placed in a wet, marshy area, an oversized foundation might be desirable. Keep in mind that the tower erector will have to get his equipment, including cement trucks, to each tower and anchor foundation. Where surface drainage ditches or natural drainage gullies exist, the best solution is to install a pipe or sufficient size where they run through the ground system. If you don't, spring rains will continually uncover the radials. This in itself is no disaster, but when the area is mowed in the summer, half of the ground system will end up in the mower blades. If a small stream that runs all year is encountered, the radials can either be elevated above the high -water mark or buried in the bottom. Care must be taken to assure that the ground system remains intact when the creek swells after heavy rainfalls. In cases where a creek runs between towers, some sort of crossing must be provided. If no other access is available to the tower erector, a bridge or a large cement pipe will have to be installed. Where some other access for
66
www.americanradiohistory.com

equipment is available, a foot bridge for the transmitter engineer will suffice. The base currents of the towers must be read periodically, and provisions for the operator to get to the tower base are necessary.
An access road or driveway will have to be provided to the transmitter building. Transmitters and phasors are heavy pieces of equipment. Large trucks will deliver them, and they must go inside the building. Have the driveway area properly graded and some crushed stone dumped into it. The stone will provide the required base for asphalt paving later on. Do not have the asphalt installed at this time. Heavy trucks will ruin the paving, and if the ground system must be laid through this area, it can be plowed through the stone but not asphalt.
One other suggestion along these lines. Try to avoid stripping the entire plot of all vegetation root masses. They prevent erosion and will help in the fight against mud. If a considerable time lag between grading and further construction is contemplated, give serious thought to planting the area with rye grass or some other vegetation suitable for the climate. This will also help prevent washouts.
ALIGNMENT OF THE TOWER BASES In order for the DA system to produce the required nulls
or minima in the proper directions, it must be very carefully placed, with the towers lying on a specific azimuth angle in relation to each other. The whole system must be properly oriented in relation to true north. The spacing between the elements of the system is also of prime importance.
In an in -line array, each element must be exactly in line with each of the others and the entire line of towers must lie along a specified azimuth angle referenced to true north. In other type of arrays, the orientation of each tower, referenced to another tower is the system and true north, will be specified in the construction permit.
The usual procedure for determining a true north bearing is to use Polaris (the North Star) as a reference. The direction of Polaris, however, is not always true north. Polaris traces a small circle about the earth's polar axis and crosses the meridian only twice each day. This apparent movement is due
67
www.americanradiohistory.com

to the rotation of the earth and must be taken into account when establishing a true north -south line on the ground.
Another procedure utilizes the sun for a reference. At solar noon -not local time -the sun will be on a bearing true south of the observer. With the proper skill and equipment, one can establish a true north -south line on the ground, using either of these methods.
The responsibility for the determination of the tower alignment and spacing should be placed in the hands of someone familiar with these procedures. The safest way to accomplish this is to retain the services of a certified surveyor. An error during this stage of construction will be very expensive to correct later on.
The surveyor should be instructed to indicate the base location of each tower with substantial markers. While he is on the property, he can, with very little additional effort, mark the location of each guy anchor and stake out the location of the transmitter building. The markers for the tower bases must be given every protection possible. If the location is lost, it will mean getting the surveyor back. Stakes 18 in. or so in length should be driven into the ground so that their tops are just an inch or so above the surface. Immediately adjacent to these markers, a taller marker, painted red for ease of identification, should be positioned. The idea behind this is that if the taller marker is knocked down, the smaller of the two will remain intact. Occasionally, vandals remove survey markers. The smaller one, with only an inch protruding above the surface, will go unnoticed. It may take a little effort, especially if the vegetation is dense, to locate the remaining markers, but it is better than losing the location entirely.
The towers must be positioned on the plot so that there is sufficient room for the guy anchors and ground system. Have the surveyor supply you with a couple of copies of the entire plot plan with the tower base locations marked on it. If he has laid out the locations of the guy anchors and building, have him indicate this on the plan. Use one of these as a work copy to mark the location of buried feedlines, septic tanks, drain pipes, etc. This will be worth its weight in gold if a line or drain pipe must be dug up years later.
68
www.americanradiohistory.com

INSTALLATION OF THE TOWERS
If all is going according to schedule, the transmitter building should be well under construction when the tower erection crew arrives on the site. The erection crew usually also installs the ground system. Have the towers installed first, then the ground system. If a separate contract has been let for the ground system, have its installation put off until the towers are erected. The heavy equipment necessary for erecting towers will damage the ground system badly.
A knowledgeable representative of the station should be on hand at all times during this phase of construction. Normally, this should be the chief engineer or his assistant. Make sure that all specifications called for in the contract are being met. Tower base foundations and guy anchor foundation excavations should be checked for size and depth against the data supplied by the tower manufacturer. After the cement is poured and the excavation backfilled, you will never know if they were installed properly. Normally, all of this data will have been filed with the local building inspector with the application for a building permit for the towers. If you are in doubt about anything concerning the proper installation of these foundations, call him for advice. It's to your advantage and it's his job to assure that a guy anchor won't pull loose after the crew has left. The station owners are paying a good price for a good installation; insist upon getting it.
More than likely, the erection crew will subcontract the foundation excavation work or locally rent a backhoe or tractor to do this work themselves. Make sure, by asking for receipts or invoices, that the fees for such equipment are billed to or paid by the erection company, or as otherwise called for in the contract. The radio station has its reputation in the community to protect long after the tower crew has gone. It is not a bad idea to have the station's diplomatic representative pay a visit to the firms with which the tower company is doing business and quietly make it clear who is going to pay for what.
The actual construction begins by excavating the foundations for the tower bases and guy anchors. A bottomless
69
www.americanradiohistory.com

plywood form is placed over each excavation. Cement is then poured to fill the form. This will become the pier upon which the tower will rest. After sufficient time for the cement to partially set up, the hardware for the base insulator mounting plate must be imbedded in the concrete. This hardware consists of three or more long half -inch (or larger) diameter bolts. The mounting plate must be fastened to the threaded end of these bolts to insure proper positioning.
At this point, have the surveyor return and verify that the bases are in the proper position. This is cheap insurance against having to later move a tower. Bases cost much less to dismantle than erected towers do.
The guy anchors should be positioned in their respective excavations at the appropriate vertical and horizontal angles. Positioning should be such that when the guys are attached the pull on the anchor will be nearly in line with it. Any side pull on the anchor is definitely undesirable. The actual size of the anchor will depend on the type of tower and its height. For AM towers of 250 to 350 ft, the anchors will be about 6 ft long. Half -inch diameter, or larger, concrete reinforcing rods are run through holes in the anchor perpendicular to its axis. At least 2 cubic yards of concrete is then poured into the ex- cavation. The reinforcing rods insure that the entire block of concrete is in contact with the upward pull that will be ex- erted on the anchor. The surface of the poured concrete should be below the surface of the ground. After a week to 10 days, the hole should be backfilled. The exact sizes of the bases and anchors as well as some of the other details of con- struction might vary slightly from what is described here. You should be guided by the data supplied by the manufacturer.
When cement is poured during the winter months, pre- cautions against its freezing must be taken. Chemical ad- ditives in the cement plus a covering of Mylar or straw are adequate measures unless temperatures are extreme. The ce- ment should "cure" for a period of 7 to 10 days before any tower erection is attempted.
During the period when the cement is curing, the tower crew usually assembles the tower lighting equipment and guy wires. Guy wires must be broken up with "Johnny ball" in-
70
www.americanradiohistory.com

sulators at intervals of less than Vs wavelength. Fifty ft in- tervals between insulators is normal spacing. Where the guy wire attaches to the tower, three such insulators in series should be used. The same goes for the lower level where the guy is connected to the turnbuckle. If top loading in the form of a noninsulated portion of the guy wires is required, long fiber -glass insulators at the end of the loading cap are desira- ble. This is a very high -voltage point in the system and is prone to arcing under certain climatic conditions. Power com- panies use these insulators in great quantity and are possible sources of supply where none other can be found.
Standard sections of tower are usually 20 ft lengths. The average weight of a single section is 300 lb. The first several sections will be assembled on the ground. The exact number of sections thus assembled will depend on the height of the first set of guy wires. (These assembled sections are referred to in tower crew lingo as "stubs. ") The guys are attached while the assembled sections are still on the ground. The base in- sulator is bolted to the bottom section.
At this point, if it has not already been accomplished, two pieces of 2 -inch (or heavier) copper strap should be placed un- der the base insulator mounting plate on the cement pier. These straps will cross each other under the mounting plate and should be long enough to be later connected to the tower's ground system.
With the help of an A -frame and winch or a small crane, these first few sections will be stood up on the pier. The first set of guys, already connected to the stub, will be fastened to the anchors. With the aid of a transit, the guys are pulled to proper tautness, and at the same time, the tower is plumbed.
The arrangement of the base insulator and its associated mounting plate forms a modified ball joint. The tower will be free to swivel or sway. Horizontal movement of the insulator is prevented by the ball, and vertical movement is prevented by the weight of the tower. If this or a similar arrangement were not used, the base insulator would crack even under minor side stress.
From here on a gin pole is used along with a power winch to haul each section up and into place. Three or more bolts on
71
www.americanradiohistory.com

each tower leg secure each section. After a tower section has been secured, the gin pole is moved up and into position for the next section.
When a section requires guys, they are attached to it on the ground. After it is bolted into place, the guys are secured to the anchors. A check of proper tower plumb is necessary as each set of guys is tightened. An experienced tower crew foreman can usually check for plumb by eyeing the newly in- stalled sections from the tower base. You can't, so become familiar with the use of a transit. Check each tower after they are all up and before the tower crew leaves.
If the top section of guy wires is used for top loading, the guy wires must be mechanically connected to the tower for strain and then brazed to the top section for electrical con- tinuity. Insist that the brazing be done on the ground. Be cer- tain of a good electrical joint between the guy wire and tower. After the brazing is completed, there will be bare, unpainted steel around the joint. Have it touched up with paint to pre- vent rusting. A loose joint here will be very hard to isolate later. A wire skirt around the guy wires just above the first in- sulator should be part of the top -loading system. It is difficult to install this skirt on the ground and impossible to braze this connection without weakening the guy cable. The normal pro- cedure is to double clamp it to each guy wire.
As the towers go up, FAA and FCC regulations require that they be lighted. If the permanent lighting circuits have not been installed, temporary lighting circuits must be run in- to the transmitter building. Check the lenses and the gaskets on each lighting fixture before it is installed on the tower. Bad gaskets will cause broken bulbs due to water seepage. If the contract calls for lighting wiring in conduit, make sure that you get it. The conduit, or wiring, will be wraplocked to the tower. Check each side of the lighting circuit to the tower with an ohmmeter. If any shorts exist, insist that they be found and repaired. The lights may function even when a short to the tower exists; however, the phase monitor may give strange in- dications later. This condition is also apt to cause the lighting choke to burn out under some circumstances. Make certain that all control and flasher mechanisms are functioning pro- perly.
72
www.americanradiohistory.com

One leg of each tower must be spot welded where the tower sections join. This is to insure absolute electrical continuity. If you can con the foreman into spot welding all of the legs, all the better.
The towers were probably painted before they were shipped. Make sure that the painting is correct for theggler height. Normal bumps and scrapes during installation will cause some scratches and flaking of the paint. Insist that each tower be touched up where needed. Use a pair of binoculars, if you are not a climber, to assure that all of the bad spots have been touched up.
Each turnbuckle, at the guy anchor, should be secured with a small piece of guy wire and a crosby clamp. This wire should be run through the center of the turnbuckles, then through the eye on the anchor end of the turnbuckle, forming a closed loop. Without this protection, the turnbuckles can unwind and eventually come apart.
The crew foreman will likely present you with an acceptance form to be signed and notarized before he leaves. Don't be pressured into signing before everything is completed to your satisfaction. Have anything that is substandard brought up to par. If any defect is impractical to fix momentarily, either refuse to sign or at least note the discrepancy on the forms. If you need time to carry out your inspection, the excuse of having to okay it with the front office is always a good stall!
A good idea is to find someone to climb each tower and look for any potential problems. The local power company employs one or more climbing inspectors to check all of their new high -line installations made by private contractors. He should know what to look for in the way of existing and potential problems. The trick is to find out who he is and negotiate a fee for his moonlighting. A reasonable fee will be much less than having a tower crew come back to rectify even a minor problem. If you get different stories from your man and the tower crew foreman, send your inspector up with a Polaroid camera. With the picture in hand, you be the referee. Once you have found a local man that will climb, note his name and phone number. He is probably your best
73
www.americanradiohistory.com

bet if you need tower work such as lamp replacement in a hurry.
Go over the following checklist before the tower crew leaves.
Are all of the towers plumb? Does each tower have a grounding strap under the
base insulator mounting plate? Are all lighting systems functional? Any shorts to the
towers? Was each tower spot welded on at least one leg?
Are all turnbuckles protected properly? Is the top -loading structure bonded to the towers to
your satisfaction? Has each tower been touched up with paint where
needed? Has the crew foreman paid all locally incurred debts
or has payment been arranged for? Has all debris (paint cans, wood forms, pieces of guy
wire, trash, etc.) caused by the tower erector been cleaned up to your satisfaction?
Have all terms of the contract been met?
INSTALLATION OF TRANSMISSION AND PHASE- SAMPLING LINES
If you have decided to bury the transmission lines, phase -sampling lines, and ac tower -lighting lines, this must be accomplished before the ground system is installed. Where the lines are to be above ground, this task is better left until after the ground system is installed.
Ascertain that underground power feeds, septic tanks, wells, etc. and all of their associated underground piping systems will be installed before the ground system installers arrive.
Necessary cabling to each tower includes the transmission line, the phase -sampling line, and ac power feeders for the tower lights. Not always necessary but certainly desirable is the installation of a multiconductor cable to each tower from the transmitter building. If a DA -N or DA -2 installation is being made, the extra wiring is
74
www.americanradiohistory.com

necessary for the control of pattern- switching relays. Portable phones and remote base current ammeters are two other uses for extra cable pairs.
Where the lines are to be buried, a trench 3-4 ft deep must be dug from the transmitter building to each tower. The routing of the cables must conform to the data supplied to the phasing -equipment manufacturer as to line length. If the transmission line is made materially shorter or longer than that for which the DA feeder system has been designed, there might be some difficulty in making up the difference in the phase delay specified for the line. Indicate to scale on your plot plan the locations of these trenches for future reference.
Lay the transmission line in the trench first. It is the hardest to handle and could cause damage to the smaller and more fragile sampling and ac power lines. The lines will, no doubt, be on a large spool. Using a pair of cable jacks and a tractor is the easiest way to unwind this without causing damage to it. The telephone or power company is the logical place to obtain cable jacks. Even though the Heliax -type cable is classified "semiflexible," it is difficult to handle, especially in the larger diameters.
After the cable is in the trench, cut it to the proper length with a tubing cutter. Remember to leave enough to go inside the building and into the phasor on one end and the LTU on the other end. Do not use a hacksaw for cutting this cable. Metal filings from the hacksaw cut will fall into the cable and could later cause serious difficulty. Seal each end of the cable immediately against water and dirt.
Enough sampling line to reach from the phase monitor to the farthest tower's sampling loop should be uncoiled. Provide at least 20 ft extra before cutting. Protect each end from dirt and moisture. If the line is of the air -dielectric type, again use a tubing cutter -not a hacksaw. Lay the sample line out on a flat area and cut a run for each tower, all exactly the same length.
A sample line should be placed in each trench. There will be a considerable excess of cable from the nearer towers. This excess must be laid back upon itself in the trench. Do not
75
www.americanradiohistory.com

attempt to store the excess inside the building. Twenty feet of excess from each of the towers should be doubled back upon itself inside the building. This can be done in the basement or wiring duct. The idea is to subject equal lengths of sampling lines to the same environmental conditions (temperature, humidity, etc.). When the velocity factor of one line changes due to temperature, the same effect will occur on all lines.. The end result will be no observable phase change on the phase monitor.
If the farthest tower has 400 ft of buried sample line and 25 ft inside the building, the nearest tower should also have 400 ft of buried line and 25 ft inside the building. Some excess line in the building is desirable so that the lines may be trimmed slightly, if necessary, during the calibration of the phase -sampling system.
The ac power lines andmulticonductor cable must also be placed in the trench before backfilling. It is a good idea to check each of the lines for continuity and shorts before filling the trenches. Large rough -cut planks placed in the trench over the cables will give some protection against damage due to future digging operations.
Two types of aboveground cable runs have been successfully used. A messenger cable can be strung along utility poles and all lines then fastened to it. The second method is to construct a wooden raceway, about 3 ft off the ground, from the building to each tower. The raceway is constructed from 1 x 8 in. or larger lumber and supported on treated cedar 4 x 4s buried at least 2 ft deep and about 6 ft apart. When the lines are installed above ground, the same stipulations of equal amounts of phase- sampling lines exposed to the same environmental conditions apply.
A ground strap from the outer conductor of both the transmission and sample lines to the system ground installation at intervals of 20 to 25 ft is a necessity when the cables are above ground. These lines are exposed to very high rf fields. The phase -sampling lines are apt to pick up radiated energy, causing a phase indication or loop current indication error. And the transmission lines can radiate energy if the grounding procedures are not carefully carried out. When
76
www.americanradiohistory.com

either of these conditions exists, the tuneup of the array can be very difficult, if not impossible. An rf pickup on the ac wiring is another possibility. This will show up as erratic transmitter operation or severe audio distortion. The rf will get back into the ac wiring in the building and into low -level stages of the transmitter or audio equipment.
INSTALLATION OF THE GROUND SYSTEM In the section devoted to the installation of the towers, I
recommended that a knowledgeable representative of the station be on hand at all times. This applies equally to the in- stallation of the ground system. After it has been buried, no one can tell for sure if it is all there or if what is there has been properly installed. Problems of inefficiency and in- stability are sure to result if this part of the system does not function properly.
Generally, requirements for the ground system will be 120 buried copper radial wires. These wires will be No. 10 soft -drawn copper. They will be spaced evenly about the base of each tower. This means one every 3 degrees. They will be '/4 wavelength, or longer. This will be specified in the construction permit. Where they would overlap between towers, they are cut short and bonded to a buried copper strap. A ground screen of anywhere from 24 x 24 ft to 48 x 48 ft will usually be installed about the base of each tower. In lieu of this, an extra 120 short radials 50 ft or so in length will be interspersed between the longer radials. The requirements as to ground screen or short radials will be specified in the construction permit also. Two -inch or larger strapping should run along the line of towers. Where the ar- ray is other than an in -line type, the strap must run to the base of each tower. Any buildings located in the ground field should have copper strap installed along their perimeter. Radials must be bonded to this strap and then continued at the other side of the building. A strap from the innercon- nected matrix of strap in the ground system must run into the building and tie the phasor, transmitters, and all equipment racks together.
Using a radial wire cut to the proper length, mark a circle about the base of each tower with a wire plow. The location
77
www.americanradiohistory.com

of the bonding straps between towers should also be marked on the ground in the same manner. This will be anywhere that the màrked circles intersect. With the aid of a transit, a marker is placed every 3 degrees around the tower on the outer edge of the circle. The outer edge will be the location where the radials will end. A double run of wire is posi- tioned in the form of a ring about the cement tower pier at ground level. Radials are attached to this ring and run above ground to the outer edge of the ground screen, if one is to be installed later. From here on, they are buried 6 to 12 inches deep, using a wire plow. The actual depth is not critical, but should be sufficient to protect the wires from injury. If a ground screen is not to be part of the system, they should be buried from the point where they leave the termination ring at the tower base. If short radials are called for, they are in- stalled in the same manner.
Ground screen comes in 8 x 24 ft pieces. Three each are required for a 24 x 24 ft screen, and 12 for a 48 x 48 ft screen. Each screen is laid out in its proper position and the edges twisted together for good mechanical stability. The joints between the screens must then be brazed or silver soldered (not soft soldered) at intervals of one inch or so. At the outer perimeter of the screen, the radials must be elec- trically bonded (brazed or silver soldered) to the screen. Likewise, all radials must be brazed or silver soldered to the wire ring around the cement tower base pier. The 2 in. (or larger) copper strap running the line of towers, along with the four ends of the strap under each base insulator, are joined together and bonded to the wire ring. Brazing or silver solder must be used for these connections. Soft solder will deteriorate when exposed to the elements. It is important that all radials be bonded to the screen at the outer edge. If they are not, they may make a good connection one day but not the next, causing unaccountable instability in the array.
Midway between the towers a copper strap is installed. Each of the radials that have been cut short at this point must be bonded to this strap. The strap running the line of towers should also be bonded at its point of intersection.
78
www.americanradiohistory.com

Keep a close eye on those doing the work to insure that all joints are properly brazed. The area where underground transmission lines enter the building, if they are near the sur- face, should be marked "off limits" to the wire plow.
INSTALLATION OF THE LINE- TERMINATING UNITS Each element in the DA system will have an LTU as-
sociated with it. The only exception would be a tower located adjacent to the transmitter building. Then it is sometimes feasible to run the tower feed directly to the phasor.
If you plan to use small cinder block or frame construc- tion buildings to house the LTU at the base of each tower, the coupling units will be supplied on an open steel chassis. Its dimensions will vary, depending on the power level in- volved. In this case, the transmission lines should surface in- side the building. Copper strap from the ring at the tower base should be brazed to the LTU chassis ground. The outer conductor of the transmission line and the shield on the phase -sampling line must also be properly grounded at the LTU.
When an isolation coil for the phase- sampling line is re- quired, it should be mounted inside the tuning house. Sample -line cable, when using an isolation coil, and ac wir- ing, when using lighting chokes, are hot with rf on the tower side of these coils -treat them accordingly. Insulated bushings through the wall of the tuning house or the LTU weatherproof box are necessary. Of course, the rf connection to the tower must also be properly insulated where it enters the LTU. Each insulator must have a gasket to insure a watertight fit.
If the lines are to be buried, a piece of 11/2 in. conduit (or larger) should be provided from the bottom of the box to a point below ground level to carry the sample line, ac power line, and multiconductor cable into the LTU. The transmission line has enough protection to run from the ground into the LTU without the need of conduit. Be sure to provide an ac outlet in the LTU. Power for the tower lights will run through this box, so there should be no problem.
79
www.americanradiohistory.com

The LTU must be solidly grounded with at least one run of 2 in. or larger copper strap directly to the radial termina- tion ring at the base of the tower. For mechanical stability, the strap should be fastened to the support posts on the LTU mount. The ideal situation is one where a length of strap is installed inside the LTU to pick up all grounds (transmission line outer conductor, sample line outer conductor, power - line bypasses, coupling- network shunt elements, etc.). This strap should be carried to the outside of the box and then to the ground system.
Some manufacturers construct the LTUs so that the out- side door can not be closed while the base current ammeter is in the circuit. This arrangement makes it impossible to leave the ammeter in the circuit to be damaged by lightning. If it is mechanically impossible to do this and you are using current transformers for phase sampling, the current transformer can be placed on the loop and used for washing out phase and current changes when the meter is in the circuit. Then if the meter is inadvertently left in the circuit, the phase monitor will be inoperative when switched to the tower where the meter reader has goofed! Besides ruining the base current meter when the meter is left in the circuit, this condition is apt to cause a change in phase by one degree or more as indicated on the monitor. If the meter is in the circuit and lightning does open it, failure of the system will develop as there will be an open tower feed.
If O -ring transformers are used for tower lighting, the primary is usually mounted on the cement base pier. Mount it on one of the copper straps that go under the base insulator mounting plate. Braze the transformer mounting plate to the strap. The ac feed from inside the LTU to the primary of the lighting transformer should be made through rigid conduit. No flexible conduit should be used anywhere near the base of the towers. As weatherproof conduit of the flexible type ages, it tends to look like a large inductor to rf currents. An enormous rf field exists at the base of an energized tower. The flexible conduit can cause unexplained shifts in the operating parameters of the array and, in some cases, actually become hot enough to burn the ac wiring inside it.
80
www.americanradiohistory.com

The rf connection to the tower should be made with Y
in. or larger copper tubing. A 1- or 2 -turn loop 18 -24 in. in diameter can be useful in keeping lightning out of the LTU. This loop must be mechanically rigid. Any instability in the value of the inductance of this loop can cause phase or cur- rent changes in the radiator. When you wind the loop, fill the tubing with sand to prevent kinking.
The rf feed must be brazed to the tower to insure good electrical contact. Unless you are experienced in the use of an acetylene torch, retain the services of a professional for this task. The large steel mass of the tower will conduct heat away very fast and if too much heat is applied to the copper, it will disintegrate. Bend the end of the tubing that is con- nected to the tower downward to prevent water from enter- ing the tubing. When a lighting choke is used for the tower lights, the ac wiring can be fed through this tubing into the LTU. Put the wiring in the tubing only after brazing.
Each radiator in the system should have a static drain. The purpose of this is to drain static buildup on the tower to ground. This is caused by electrical storms; very low humidity; or dry, windy snow storms; among other things. If a static drain is not employed, the spark gap at the tower hase will repeatedly arc. The arc will be sustained by transmitter power and the overload relays will operate. If a 3 -wire light- ing choke is employed and only 120V (2 wires) is needed for the ac feed, the extra winding of this choke can be used for a static drain. One end of the winding is connected to the tower and the other end to the ground system. Do not ground the cold side of a 120 -240V feed to the tower. It can result in strange readings on the phase monitor or remote base current meter when the lights are operative.
If O -ring transformers are used for the lighting circuits, some other means of accomplishing a drain must be pro- vided. A large rf choke will usually be satisfactory for lower power. Where higher powers are utilized, a string of ten 10K, 20W resistors connected in series between the tower rf feed and ground will suffice. Do not attempt to accomplish this with only one resistor. The high rf voltage will cause even- tual failure of the resistor.
81
www.americanradiohistory.com

Fences must be provided around the base of each tower. If the fence is metallic, it must be securely grounded in several places. Two -inch strap to the ground system is re- commended. Chain link fence does not have electrically bonded joints. Under some circumstances, this type of fence can cause instability in the array -one day it's grounded, the next day it isn't. This results in a change in resistance or reac- tance at the tower feedpoint. Be careful when drilling holes for the fenceposts. Try to avoid putting a hole in buried transmission lines!
Treat the soil inside the fence to permanently prevent weed growth. An application of crankcase oil followed by the application of finely crushed stone is effective. If a soil sterilizer is used, make sure that it will not he corrosive to the ground screen and radials. One product that meets these re- quirements goes under the trade name of Deter. It is manufactured by Chemical Industries,. Inc., of New York Ci- ty.
THE INSTALLATION OF PHASE -SAMPLING LOOPS The phase- sampling system consists of the phase
monitor, sampling lines, and pickup devices. The operation and installation of the phase monitor is adequately covered in its instruction book. The installation of the sampling lines is covered elsewhere in this book. We will cover the installa- tion of the sampling devices in this section.
The proper location for the phase -sampling device is at or near the current loop on the tower. This is approximately 90 degrees (' /a wavelength) down the tower from its top. For towers 90 degrees or less in height, this point is at the tower base. For a 135 -degree tower (3 /s wavelength), the current maximum is 45 degrees (1/8 wavelength) up from the base. This is one -third of the way up from the base. When the sam- ple loop is up this far on the tower, the sample line must run a considerable distance in close proximity and parallel to the tower. Even if the loop is insulated and the sample line is supported on standoff insulators, an excessive amountof coupling between the line and tower will exist. Under these conditions, the sample line must be treated similarly to the
82
www.americanradiohistory.com

lighting wires. Entrance into the LTU must be through an in- sulator. The line must be wound into an inductor to provide isolation across the tower hase insulator and bring the outer conductor of the cable down to ground potential. The bottom side of this isolation coil must be securely bonded to the LTU ground strap.
When a90- degre_e or shorter tower is.us.d..,an insulated.. .~ample lo op can be mounted near the base. It should be mounted at least 15 -20 ft up from ground level (Fig. 3 -1).
This provides reasonable insurance of long -term, tamper - free operation and also removes it from the external effects that could occur if it were mounted close to the ground. The line in this type of installation should he mounted on two or three standoff insulators on the tower and taken into the
INSULATORS
LTU
SAMPLE LINE
INSULATORS
1
10' TO 15'
Fig. 3 -1. Sample pickup installed on tower 90 degrees or less in height.
83
www.americanradiohistory.com

SAMPLE LOOPS
IN.LINE
SAMPLE LOOPS
PARALLELOGRAM
Fig. 3 -2. Mounting of sample loops on a parallelogram array.
LTU where its shield must be bonded to the ground strap. If an uninsulated loop is used, even though it is near the bot- tom of the radiator, the same isolation measures that apply to the loops high on towers will apply; namely, isolation coils. Current transformers can also be used as pickup devices when tower heights are 90 degrees or less. These units are mounted inside the tuning house or LTU. The pickup point for these devices should be as close as practicable to the point where the rf feed for the tower leaves the LTU hous- ing. Any large differences in the length of the feeds from the various LTU to their respective towers will cause errors in the indicated phase when using current transformers. If the feed from LTU No. 1 is electrically 5 degrees longer than the feed from LTU No. 2, an error of 5 degrees will be indicated on the phase monitor.
The pickup loops on each tower must be at the same height above the base insulators. If they are not, errors in phase indications will occur as previously described. Where radiators of unequal heights are used, check with your con- sultant on the placement of the sample loops.
The purpose of the pickup device is to sample rf current from one particular tower. Contamination (unintentional pickup from the other towers in the system) is to be avoided. If current ratios are extreme -that is, if one element in an ar- ray carries much more current than an adjacent element - that can present a problem. Proper orientation of the loops is necessary to minimize unwanted pickup. Maximum induced current occurs in line with the two sides of the loop. Minimum pickup occurs at right angles to the loop. In an in- line array, the loops should be positioned at right angles to t he line of towers.
84
www.americanradiohistory.com

A parallelogram array presents a different problem. When a loop is positioned for minimum pickup for one adjoining tower, it will be at or near maximum for one of the others. Some experimentation - taking spacing and relative currents into consideration -may have to be done. Other lines on the towers (ac wiring, FM transmission lines, etc.) should be located on a tower face away from the sampling loop. Figure 3 -2 shows some suggested mountings.
The same side of the loop on each tower must be positioned toward its respective tower. A 180 -degree inversion of phase, as indicated on the monitor, is likely to occur if this is not done. On a single -turn, unshielded loop, position the side of the loop connected to the outer conductor of the sample line toward the tower. When shielded loops are used, position the insulated opening in the shield toward the tower.
When a low- powered transmitter feeds a multitower array, some difficulty may be encountered in obtaining sufficient rf pickup from elements carrying small amounts of current. Various schemes have been successfully employed to bring the sample up to a sufficient level to operate the phase monitor. Resonating the loop to the operating frequency is one solution. If this is done for one loop, it must be done to all of the others to insure proper relative phase indications. Normal maintenance should include checking each loop to insure that it is in resonance. Any drift in the resonant frequency of the loop will show up as an erroneous indication of phase or loop current. The exact feeling of the FCC on this arrangement is not clear. Possibly by the time this appears in print, definite restrictions or complete outlawing of the use of resonant sample loops will be part of the rules.
INSTALLATION OF THE TRANSMITTER AND PHASOR Once the transmitter and phasor are in place, the actual
wiring can begin. If the building was planned properly, wiring ducts will run under the transmitter, phasor, and equipment racks. A separate oversized duct, usually formed in the concrete floor, should exist where underground
85
www.americanradiohistory.com

transmission lines are to enter the building. It must be deep enough to bend the transmission lines at a 90- degree angle up into the phasor.
The phasor construction should be such that a copper strap picks up all grounds including the outer conductor of the transmission lines. If such a strap does not exist, securely connect copper strap (at least 2 in. wide) to the shield of each line and run it to the strap brought into the building from the system ground. The phasor cabinets, transmitter cabinets, and all equipment racks must be tied together with 2 in. or larger strap. This strap is then connected to the ground strap from the ground system.
If the run between the transmitter and phasor is short (2 or 3 ft), 3/4 in. copper tubing can be used to connect the transmitter output to the phasor. It must be in an inaccessible place to avoid danger of injury to operating personnel. Where the run is longer, coaxial cable of sufficient power -handling capability must be used.
The phasor cabinets will usually be shipped with all (or most) of the components removed. Carefully install them in their proper locations. Vacuum capacitors, especially the glass ones, are very fragile. Do not force them into their mounting brackets. Take special care to avoid dropping screwdrivers, wrenches, etc. on these capacitors. This may ruin the component. A definite danger from flying glass also exists. These capacitors are under a very high vacuum and, if they're broken, the resulting implosion is much the same as what results when a TV picture tube is broken.
All rf connections in the phasor and elsewhere must be made with strap or copper tubing. Wire will not suffice.
Where two transmitters are involved (i.e., main and auxiliary), provisions for connecting them to a common point must be made. The manufacturer will build this provision into the phasor, if specified in advance. The switching should be arranged so that when the main transmitter is on the antenna, the auxiliary transmitter is on the dummy load, and vice versa. Adequate provision for interlocking the water or air flow of the dummy load to the transmitter connected to it should be made. This will prevent the possibility of destroying the dummy load.
86
www.americanradiohistory.com

O
w
zo aú z o- x° a a0 O
D
ww3 á00 Lr, Q IX2Ce 8Uw °aQ Z3 ó z áaQ z z z Www _ = 2 333 °°° www N N N U U U a a CZ W W W Z Z Z W W W
ce Y W Y -
Y Y o.
U H U 0 O J - J ce
W W ce w
Z i- 1_ Z Z _~ S,,, } F-Z
3Q 3F O ¡=, O O Wz O
u -ce .7(- a Ña Ñ > ° z zz -O -0
87
www.americanradiohistory.com

LTU 1 .1 LTU 2
S3 S4
O O IN SERIES WITH XMTR
INTERLOCK CKT
Fig. 3 -4. Pattern -switching interlock.
The phasor doors, likewise, misst be interlocked with the on- the -air transmitter. Figure 3 -3 shows the wiring diagram of such an arrangement. Relay K1 is energized by the interlocks on the phasor doors. Another relay contact which will open during any rf switching should be inserted in series with the door interlock switches. This will remove rf from the system during switching to prevent the relay contacts from arcing. Relay K2 transfers the door interlock connection from the main to the auxiliary transmitter, depending on which one is feeding the phasor. It must be energized by a microswitch on the antenna changeover relay. Relay K2 is energized when the auxiliary transmitter is on the antenna. Relay K3 is energized from the air -flow or water -flow switch on the dummy. It will close the interlock on the transmitter connected to the dummy.
Where DA -2 or DA -N switching is required, the FCC requires that all pattern- switching relays be interlocked with the transmitter(Fig.3 -4) if Third -Class operators are used for duty shifts. All of the rf- switching relays used in the system
88
www.americanradiohistory.com

for transmitter changeover and pattern switching should be the spring -loaded type. These require only momentary energizing of one of the two solenoids to switch. All relays of this type have microswitches that close for each position. When these switches are wired in series and tied into the interlock system, the transmitter will not operate if any one of these relays fails to close. This system prevents energy from being applied to the antenna system if all radiators are not properly connected. When using any of these interlocking systems, it's not a bad idea to provide tally lights at one location to determine where trouble exists, should any part of the system fail.
89
www.americanradiohistory.com

Chapter 4
The Nondirectional Proof
To secure a license to operate a DA system, sufficient proof that the antenna is actually producing the specified radiation pattern must be submitted to the FCC. The process of producing the radiation pattern and proving that it is in compliance with the specifications set forth in the original application requires more than just plugging all of the equipment into a power source and reading the meters!
Even if you never had the occasion to adjust a DA system from scratch, the following section will give you a broad insight into the inner workings of it.
THE PURPOSE OF A NONDIRECTIONAL PROOF As discussed earlier, the actual amount of signal
delivered to a given place on the surface of the earth will depend on the inverse radiation field toward the point under consideration, its distance from the transmitting antenna, and the ground conductivity of the path over which the signal will travel. By radiating a known amount of power from a single vertical tower, making many measurements of the actual amount of signal received at accurately known distances from the tower, and comparing these values of measured field with graphs of ground wave field intensity vs distance (in Volume III of the FCC Rules and Regulations), an accurate determination of radiated inverse field and ground conductivity over the signal path can be made. Later, in the DA proof, the same points along the same paths will be remeasured. With both sets of data in hand, it will then be possible to determine accurately the value of inverse field radiated by the directional antenna.
There are two obvious advantages to making the nondirectional measurements first. To get meaningful
90
www.americanradiohistory.com

measurements from any antenna system, whether it is a DA or a single tower, one must get far enough away from the radiator so that the far field is being measured. For a single tower, the rule of thumb is that the first measurement that will be reliable should be at a distance of at least 5 times the height of the radiator. For example, if the tower is 250 ft tall, the first measurement would be made at a distance of 1000 ft. For the DA system, meaningful measurements should start at 10 times the spacing between the farthest towers in the system. Typical spacing might be 500 ft. Therefore, one would have to start measurements 5000 ft from the system. The closer we are to the antenna, the less will be the effect of ground conductivity and, therefore, the actual inverse radiation field can be more accurately determined.
Another fact in favor of doing a nondirectional proof is that a single tower acts more as a point source of radiation than a DA system. That is, the signal seems to come from one point rather than from many towers scattered over a 20 -acre field. Thus the measured signal strength will behave in a manner closer related to theory. It will decrease in a fairly uniform manner in agreement with the inverse distance law and actual ground conductivity. Radiation from the directional antenna, while still conforming to these natural phenomena, is subject to considerable scatter. This scatter will be noted during the directional proof, when measured field bounces up and down in value as distance is increased. This effect is especially noticeable in null areas and can be attributed to small amounts of reradiation from objects close to the measuring point.
For these reasons, it is much easier and more accurate to analyze the nondirectional radiation pattern first and then compare it to the measured DA pattern. In effect, we have set up a reference of known value by making a nondirectional proof. The ground conductivities of the various radials measured will remain the same for both the nondirectional and DA proofs if both sets of measurements have been taken within a reasonable amount of time of one another.
It is well known that ground conductivities in certain parts of the country will vary from summer to winter. Actual causes of these variations are subject to much debate. For that
91
www.americanradiohistory.com

320'
310'
300'
290'
280'
270'
260
250'
240'
230'
220'
, ., i 1
330 300 350 0' 10 20 0' ....PIP r +#0 0
''
Viiiiiittett1411 '', ,,.. ',.;. .. ,-j1 ' l, ! ,
0. ,,. Iy, , b,,.F,®s . _ r': il//° ! =: 44\3, %- ==. j
``%1It1: : 1 R'\' .. S1j *MRS 1 ,-....,,,. Iii 1+ ti
4*4iIr*4b ® / 11 r/ 1 s1rr 11 1 iír 20, 210' 190' 180' 170 160' 150'
70'
100' -
110'
120' -
130'
140'
Fig. 4 -1. Horizontal radiation pattern of station XYZ. The construction permit specified inverse field limitations are: 0-degree field not to exceed 45 mV/ m, 22.5-degree field not to exceed 80 mV/ m, 315- degree field not to exceed 100 mV / m.
reason, temperature, humidity, underground water level, and frozen -ground conditions will be ignored here. They are better debated by the experts during the cocktail hour at NAB engineering conferences. This subject is covered adequately by saying that these variations do occur and one should
92
www.americanradiohistory.com

conduct the nondirectional and DA proofs under the same seasonal conditions.
PREPARATION OF MAPS
Figure 4 -1 shows the theoretical radiation pattern for station XYZ. The portion of the pattern centered on 315 degrees is an expanded view of the minima and minor lobe in the pattern. The dotted line around this portion of the pattern shows the meov, or maximum expected operating value. It is a tolerance over and above the actual calculated values of field strength. The values of specified maximum on inverse radiation put on the FCC construction permit are taken from these meov data. Under no conditions can the inverse field exceed the meov after the array is in adjustment.Forallocation purposes, the meov is used for determining possible interference to other broadcast services on cochannel and adjacent -channel frequencies.
In the example presented here, the Commission has specified in the construction permit maximum values of inverse field at azimuths of 0, 22.5, and 315 degrees. These maximum values are 45, 80, and 100 mV /m, respectively. Permanent monitoring points must be established on these azimuths. In addition to measuring the entire radial out to 20 miles in these three specified directions, we must also measure several other radials (different azimuths) to show that the theoretical and actual patterns are in fact the same, or very similar. Logical choices of other azimuths to be measured would be: 90, 135, and 180 degrees, to properly identify the major lobe; 247.5 degrees, as this is the complementary azimuth of 22.5 degrees and will show up any serious pattern distortion; 270 degrees, as it is in a minimum; and 292.5 and 337.5 degrees. These two along with the required 315 degrees radial will properly identify the minor lobe. Table 4 -1 shows the data taken from the polar plot of the radiation pattern for each radial to be measured.
Suitable maps of these areas, covering the actual radials out to a distance of 20 miles from the antenna, must be purchased. This could involve as many as 20 to 25 individual quadrangle maps. The U.S. Government topographic maps of
93
www.americanradiohistory.com

Table 4 -1. Data for Each Radial to be Measured.
Radial Azimuth in Degrees
0 Required by CP. 22.5 Required by CP.
135 180
247.5 270 292.5 315 R by Required b CP. 337.5
1Major I Lobe Minor Lobe
Maximum Inverse Field (mV /m)
45 80 255 268 255 80 45 77 100 77
the 7.5- minute series are the best choice for this task. The easiest way to determine exactly which maps are required is to obtain a copy of the topographic map index for your area. This will show the areas encompassed by the individual maps.
First, locate the transmitter site on the map index; then with the aid of a protractor, draw and identify the various radials. Most major cities have one or more map dealers from which the individual maps can be purchased. The maps are also available directly from the U.S. Geological Survey, Washington, D.C. These maps have a scale of 1:24,000. This means that on the map one inch equals 24,000 in. on the ground.
On the proper map, carefully locate the center of the array and mark it. The geographic coordinates on the construction permit and identifiable landmarks shown on the map will be of assistance in this procedure. These maps are laid out so that the vertical edges will run true north -south and the horizontal edges true east -west.
Using a protractor and pencil, carefully lay out and draw each radial on the map which shows the transmitter site location. When this has been completed for all 10 radials, take the quadrangle map which adjoins the top of the one just completed. Continue the 10 radials across this map. Follow this procedure out to 20 miles using the adjoining maps. Exercise extreme care where the radial runs from one map to the next to insure its continuity along the proper azimuth. An error of a few degrees can make the difference between success and failure in proofing an array with tight nulls. When the process has been completed for all of the radials, put the maps away in a safe place.
94
www.americanradiohistory.com

A good idea is to lay out each of these same radials on a road map also. Do not attempt to use the road map to determine actual distances and azimuths for the purpose of making measurements. These maps are notoriously inaccurate when it comes to precise azimuths and distances. The road map will give you a good overall picture of the area surrounding the transmitter.
MATCHING THE REFERENCE TOWER AND DETUNING UNUSED TOWERS
The tower that will radiate the most power in the DA system will be used as the radiator for the nondirectional proof. Later this same tower will be used as the reference tower in the array. For the time being, open the feed at the base of each of the other towers. With the aid of an rf bridge, the resistance and reactance at the base of the nondirectional radiator must be determined at the operating frequency. Provisions for matching the characteristic impedance of the transmission line to this measured base impedance must be made. More than likely, the components in the LTU will be adequate for this task. If not, possibly additional components from other LTU can be borrowed.
With the aid of an rf bridge, set up the matching network to effect a match to the transmission line. (The section on the setup of base -coupling networks in this book covers the tuning and matching of antenna elements.) The transmission line, feeding the nondirectional tower must be disconnected from the phasor and connected to the transmitter output.
All of the remaining towers in the DA system must be detuned so that they will not distort the nondirectional radiation pattern. Towers near 90 degrees in height are most easily made ineffective radiators by installing parallel- resonant circuits across their base insulators. This effectively isolates the tower from ground, thus preventing any current flow.
Towers in the vicinity of 180 degrees in height are usually disabled by installing a series- resonant circuit across the base insulator. Since the base of a tower of this height is at a high- voltage point, the series- resonant circuit looks like a
95
www.americanradiohistory.com

short circuit to ground. The most practical spot for the physical location of these networks is in the enclosure used to house the LTU components. Some of the components in the LTU can be used for these tuned circuits.
There are several methods of accomplishing the actual adjustment of the detuning networks. These vary from the use of the rfammeter in the LTUto indications of loopcurrent on the phase monitor. The indication on the rf ammeter will usually go so low (when tuning a 90- degree tower) when resonance is approached that the effect of minute adjustments becomes difficult or impossible to observe. The phase monitor loop- current indication can be used for this purpose, but it is inside the transmitter building and all of our adjustments will be made at the tower base. Several methods using specially constructed loops and diode detectors with appropriate indicating devices have been used to good advantage. However, the field intensity meter is a readily available device that can be pressed into service and effectively used as an indicator of proper adjustment.
__ A stable support such as a tripod or stepladder must be used for the meter. The meter should be set up 10 -15 ft from the tower to be detuned. Its positioning must be such that the axis of its built -in loop antenna is pointing toward the tower to be detuned and at a right angle to the energized nondirectional radiator.
The minimum amount of power that is available should be applied to the reference tower. The tuning network is then adjusted for minimum radiation from the unused tower, as indicated on the field intensity meter. Careful orientation of the field intensity meter and slow tuning of the resonant circuit will result in a very deep null indication.
When the desired results have been achieved, follow the same procedure for all other towers in the system. When this has been completed, go back and recheck. Mutual coupling between towers tends to upset previous adjustments made to the detuning networks.
When you are satisfied that all unused towers have been properly detuned, a complete set of resistance and reactance measurements should be made on the reference tower at 5
96
www.americanradiohistory.com

kHz intervals, out to 30 kHz either side of the operating frequency. This information must be submitted to the FCC as part of the application for a license.
Adjustments to the LTU components should be made if necessary to effect a proper match between the feedline and the base impedance of the reference tower, while the rf bridge is still set up.
Of course, the detuning procedure described herein requires a signal to be radiated. Equipment test authority must be obtained from the FCC before starting this operation.
CHECK OF EQUIPMENT The nondirectional proof will require that considerable
manpower be expended. Therefore, it is wise to double -check all equipment that will be used to minimize any chance of creating measurement errors. Every rf ammeter (base- current meters, common -point meters) and any spares that will be used in the DA system should be tested against each other.
Group these meters together according to their full -scale range. Each meter of the same range should be wired in series. The entire string is then connected to the dummy load. If a dummy load is not available, connect the string of meters in series with the feed to the base of the nondirectional tower. Apply enough power to deflect the meters into their normal operating range. They should all read the same; any discrepancies must be investigated.
Meters with other full -scale ranges should be checked in a similar manner. This can also be accomplished with a Variac and a dummy resistor, using 60 Hz ac power. The rf method is to be preferred, as it shows any effect due to frequency that could affect calibration. All spare meters should be carefully repackaged and put in a safe place. They can be used to good advantage if meter error is suspected later.
If more than one field intensity meter is to be used, they should be tested at a spot where all of the readings can be compared on the highest scale. After this comparison, move out farther and compare all of them on the next lowest scale. Do this for each range on the meter. For the lowest scales, a
97
www.americanradiohistory.com

station close in frequency to your operating frequency can be used as a measuring reference. The meters should also be compared on some intermediate full -scale range each day before starting out on the proof measurements.
Be certain of the measured base resistance of the reference tower. Any errors will cause power measurement to be in error. Serious errors can negate the results of the nondirectional measurements. Precision resistors should be used to verify the accuracy of the rf bridge.
The product of plate current, plate voltage, and the manufacturer's stated efficiency should substantially agree with the actual operating parameters of the transmitter when it is feeding power to the nondirectional radiator. Any excursions in efficiency of more than a few percent should be verified by measuring power into a reliable dummy load.
All fences and other equipment associated with, or in close proximity to, any of the towers should be installed before any attempt is made to detune towers, measure base impedances, or start the nondirectional proof.
CLOSE -IN NONDIRECTIONAL MEASUREMENTS Close -in measurements at intervals of 0.1 mile out to a
distance of 2 miles from the antenna must be made. Our first measurement will be at a distance of five times the height of the nondirectional radiator. If the tower is 300 ft high, the first nondirectional measurement should be made at a distance of 1500 ft. For this example 0.3 mile would be our starting point. Measurements made closer to the tower than this are in the induction field of the antenna and are thus meaningless.
Determination of the correct distance for each of these close -in measurements is imperative. A small miscalculation of distance when you are close to the antenna will be large in terms of overall percentage error. For this reason, some type of distance -measuring standard is necessary. A steel tape is fine; however, a length of rope cut to 264 ft is easier to handle. With two men handling the rope and placing a wooden stake every two lengths (528 ft = 0.1 mile), a third man can follow behind to operate the field intensity meter and keep a record of the measured values.
98
www.americanradiohistory.com

An extra topographic map with the radials drawn on it, inscribed with circles every 0.1 mile (Fig. 4 -2), will be a
valuable adjunct for keeping you on the proper course and in the proper place. As you pass the point that is 10 times the distance between the farthest radiators in the DA system, start leaving the stakes in the ground wherever practical. Also note a brief description of these points for future identification.
Fig. 4 -2. A portion of the quadrangle map on which the transmitter site is located, showing the concentric circles drawn at 0.1 mi. in- tervals and the 10 radials. Invervals are shown out only to the 0.5 mi. point for clarity.
99
www.americanradiohistory.com

During the DA proof, points from here on out will be remeasured.
A surveyor's theodolite or transit can sometimes be helpful in getting started on the proper azimuth. Correct azimuths can be measured using the line of towers as a reference. If a measuring point (one of the 0.1 -mile intervals) happens to be inaccessible, such as in the middle of a lake or at the bottom of a quarry, make a measurement at the 0.05 -mile interval before the obstruction and then another at the first accessible 0.05 -mile interval that follows. For example, if the 0.9 -mile interval falls in the middle of a lake make a measurement at 0.85 mile and one at 0.95 mile, then continue on to the 1.0 -mile measurement. You will, of course, have broken the continuity of the rope- measuring technique by having to go around the lake, but the lake will be shown on the topographic map and distances from this point on can be picked up again.
Care must be exercised when calibrating the field intensity meter in proximity to the antenna. Radiated fields of very high values will exist at these distances. Radiation from a typical 5 kW source will be in the neighborhood of 2000 mV /m at 0.25 mile from the antenna. If the field intensity meter is not carefully oriented for a null when calibrating, radiated signals of this magnitude will cause a calibration error, thus a measurement error.
Undoubtedly, some of these measuring points will fall on private property. Most people will not object to your crossing and measuring on their property, if you ask permission first.
In a highly built -up area, or a recently developed area, any agreement between the topographic map and reality can be purely coincidental. Where the map shows open fields, a housing development might very well exist. In most instances, a local map prepared by the town or city engineer is available at little cost. Use this for determination of location and distance whenever necessary. However, before using such a map, compare its accuracy with that of the topo map by using landmarks common to both.
The written record of such measurements should contain the date and time the measurement was made, azimuth of the
100
www.americanradiohistory.com

radial, measured field, and a description of the point for future reference. Do not rely on memory for any of this information. After you have collected 10 sheets of measurements and you suddenly realize that none have the azimuths of the radials on them, you have a disaster on your hands!
Depending on terrain, a team of three can do one radial out to 2 miles on foot in about 4 hours. It is not really quite as tough as it might seem at first. Before you start, leave an automobile near the point where you will finish. It saves time and miles of walking.
NONDIRECTIONAL MEASUREMENTS BEYOND TWO MILES
Beyond 2 miles, and out to 20 miles, instead of picking a distance and making a measurement, we will pick convenient locations, make the measurement, and then measure distance from the antenna. Using the automobile for transportation, and a topographic map for guidance, we will make between 15 and 20 measurements at distances between 2 and 20 miles on each radial.
Before starting, mark exactly one mile (on a relatively straight road) on the topographic map. Use the scale on the map for this purpose. There should be some identifiable landmark at the beginning and end of the one -mile stretch on the map. Using the automobile, check the odometer for accuracy against the map. There will be places where you will wish to measure distance and there will be no identifiable landmark. An accurate odometer will assist you in finding these places. Where the radial crosses a road 0.3 mile from an intersection, the built -in instrumentation of the automobile will come in handy.
It is important to stay on the radial when taking field intensity measurements. When the DA proof is attempted, especially when a deep null is measured, any straying from the radial will cause higher values of measured field than expected. Keep in mind that each one of these nondirectional measurements will be measured again during the DA proof. Keep an accurate description of the exact location of each measuring point. The DA measurement should later be made
101
www.americanradiohistory.com

Table 4 -2. Nondirectional Proof Data.
RADIO STATION XYZ 1120 kHz RADIAL: 292.50
1 kW NONDIRECTIONAL PROOF DATE: 10 -10 -72
Point Distance (Miles) mV / m
Time (EDT) Description P
23
24
25
26
27
28
3.0
3.5
3.75
4.20
4.70
5.30
32
24
20
19.5
16
15.5
1258
1310
1319
1326
1335
1343
On Rt. 581, 0.1 mi west of Zietz Rd. in pasture 50 ft north of Rd. 75 ft from corner of large barn on Tad Rd. 0.05 mi north of kink In Tad Rd. by opening in cement wall. Halfway between Golf Rd. and small creek. On Rt. 162, 100 ft in driveway of house No. 1337.
On Clam Rd., 50 feet before triangular intersection (bad null on meter).
in exactly the same location as the nondirectional measurement. Table 4 -2 shows a suggested form for tabulation of all pertinent data.
Section 73.186 (FCC Rules and Regulations) calls for measurements to be made at approximately half mile intervals from 2 to 6 miles from the antenna. In addition, measurements must be made at approximate intervals of 2 miles at distances from 6 to 15 or 20 miles from the center of the array. These locations, for convenience, should be picked at locations where the radial approaches or crosses a road shown on the map. After making a measurement at an identified location, mark it on the map and number it so that it corresponds to the point numbered on the tabulated data. Figure 4 -3 shows a portion of a topographic map with the radial so marked. Data from this map corresponds to the data shown in Table 4 -2. Later, the distance from the antenna to each of these marked locations must be measured using the scale on the map and entered on the data tabulation. This information is necessary for plotting the information on the field intensity graphs for determination of inverse field and ground conductivity. These marked maps must also be submitted to the FCC with your application for license.
When making these measurements, care must be taken to ascertain that the measured radiation is coming directly from the antenna system. Reradiation from nearby objects can cause trouble when you try to analyze the measured data.
The field intensity meter's loop antenna is very directional. When rotated 90 degrees to the wavefront, there
102
www.americanradiohistory.com

should be at least a 10:1 ratio in measured signal. If this is not the case, the reading obtained when the meter is pointed toward the station should be used. A notation of this condition should be included under the description of this point.
In situations where it is impossible to make a sufficient number of measurements at the specified intervals, additional measurements at more frequent intervals beyond 6 miles should be made. Generally speaking, it is advisable to make
Fig. 4 -3. A portion of the topographic map showing the measuring points used in the data in Table 4 -2.
103
www.americanradiohistory.com

more than just the bare minimum of required measurements. The more reliable the data that you have on the antenna system, the more reliable will be the prediction of its performance.
SELECTION OF PERMANENT MONITORING POINTS Every construction permit (CP) for a new AM directional
antenna facility will specify certain azimuths on which maximum values of inverse field cannot be exceeded. The CP will also specify that a permanent monitoring point shall be established on each one of these azimuths. Limits on the distance from the center of the array to the monitoring point will also be spelled out. These limits are usually not less than 1 nor greater than 4 miles. These specified azimuths are in directions where radiation limits are required to reduce or eliminate interference to facilities on the same and adjacent frequencies. In addition, the CP will specify that the radiated field at these points be measured and entered in the station's maintenance log at least once every seven days. When the station license is issued, it will include a description of each one of these points and a maximum value of measured field in millivolts per meter that shall not be exceeded. After a period of operation, during which the array is proved stable, the FCC will relax this requirement to once every 30 days.
The use of monitoring points is an attempt to equate measured field at a particular point with inverse radiation from the antenna system. All interference and allocation studies are based on inverse fields. The reasoning behind this: If measured field on a monitoring point increases by 10 percent, then it can be assumed that the inverse field along the entire radial has increased by 10 percent. This is not always a fact, but this is the best practical way, short of a full or partial antenna proof, to evaluate the performance of the system at regular short-term intervals. Actual maxima that are put on the monitoring points by the FCC are computed by comparing the measurement taken on the point to the measured inverse field along the entire radial during the DA proof.
While doing the nondirectional proof, one should select several prospective monitoring points along each specified
104
www.americanradiohistory.com

radial. One of these points will later be used as a permanent monitoring point -in general, the closer to the array, the better. r.
There are two limitations that must be kept in mind on distance. The CP says no closer than one mile, and if the array has a large number of elements -or if the elements are wide spaced-another factor must be taken into consideration. A monitoring point cannot be located closer than 10 times the distance between the farthest two elements in the system.
A 4 -tower in -line array, with an element spacing of 250 ft, would have 750 ft between the farthest -spaced elements. Ten times this spacing is 7500 ft; a little more than 1.4 miles. Closer than this, the actual DA pattern is not fully formed. Therefore, it is obvious that a meaningful monitoring point could not be established at the one -mile limit on the CP.
By keeping the monitoring point as close to the center of the array as possible, seasonal ground conductivity changes will have less effect on the actual measured radiation. Because monitoring points are used to correlate measured field with inverse field, the effect of changing conductivities can cause erroneous conclusions to be drawn about the performance of the antenna system.
A monitoring point must be accessible at all times of the year -a mountaintop location, snowed -in 6 months of the year, is obviously no good. The selected points should be free from wires, tall structures, and any other objects which might tend to cause measured radiation at the point to vary even when inverse radiation from the antenna system remains constant.
By selecting several prospective points along each specified radial dining the nondirectional proof that meet the criteria described herein, you should be in a good position to choose a permanent monitoring point. After the results of both the nondirectional and DA proofs have been analyzed, you can see whether or not the proposed monitoring point falls close to the conductivity curve. A point that is far above or below the curve should be suspect.
When this occurs, there is some external influence acting on this point. If in the future this external influence were to
105
www.americanradiohistory.com
change, the monitoring -point reading would also !change. in turn would cause you to suspect that there had been a change in the inverse field radiated by the array -when in fact it had not varied.
There are times when good engineering judgment indicates that a particular location would make a good monitoring point, but after the array has been in operation for a few months it becomes apparent that the point is very unstable and any relation that measured field on the point has to actual inverse field is coincidental. To enable yourself to identify such occurrences, it is recommended that a second point be selected along each specified radial and read along with the monitor point on a regular basis. A complete record of the measurements made on this alternate point should be kept. If the legal monitoring point starts to wander around and the other point remains stable, it is a pretty good indication that the point -not the array has gone sour.
In certain geographic locations, it might be physically impossible to select a monitoring point within the 4 -mile limitation. A river, lake, or bay in the path of the array could cause such a problem. When this happens (and you can prove it) the FCC will waive the 4 -mile limitation on the CP.
A cemetery, school playground, or park usually makes a
good monitoring point. The chance of a service station or house being built in such places is nil. If this should happen to a monitoring point after the array is in operation, it will be necessary to go back to the FCC and apply for a change in location of the monitoring point.
ANALYZING THE NONDIRECTIONAL PROOF
Table 4 -3 shows the tabulation of nondirectional measurements made on station XYZ along the 270° radial. From this information we will now determine the inverse field and ground conductivities along this path. This is
accomplished by a technique called curve matching. First, however, we must understand the workings of the ground - wave-vs- distance field- intensity curves.
Volume III, Section 73.184, of the FCC Rules and Regula- tions contains a whole series of ground -wave -vs- distance
106
www.americanradiohistory.com

Table 4 -3. Nondirectional Field Intensity Measurements.
RADIO STATIONXYZ 1120 kHz
ANTENNA PROOF RADIAL: 270 0 TRUE 1 kW DA -D MEASUREMENTS DATE: 9 -8 -72
Point Distance (Miles)
NON -D Time mV /m EDT
DA Time mV /m EDT
RATIO DA /NON -D
1 0.25 702 0835 2 0.30 590 0844 3 0.40 409 0848 4 0.50 447 0853 5 0.60 273 0859 6 0.70 234 0908 7 0.80 196 0916 8 0.90 186 0926 9 1.0 156 0933
10 1.05 152 0939 11 1.20 148 0950 12 1.30 136 0958 13 1.40 115 1007 14 1.50 97 1014 15 1.65 90 1021 16 1.70 89 1031 17 1.80 80 1040 18 1.90 73 1049 19 2.00 66 1057 20 2.20 58.5 1202 21 2.40 51 1209 22 2.60 43 1218 23 3.00 39 1225 24 3.50 29 1238 25 4.00 24 1247 26 4.75 17.5 1255 27 6.25 9.50 1311 28 6.75 8.00 1320 29 7.05 7.10 1328 30 8.25 5.30 1339 31 8.95 4.30 1350 32 10.05 3.50 1404 33 11.45 2.70 1414 34 13.10 2.05 1427 35 14.50 1.50 1439 36 16.10 1.25 1452 37 17.10 1.10 1505 38 18.60 0.91 1517 39 19.20 0.83 1533
field- intensity graphs. Each graph covers a 40 -60 kHz range of frequencies.
Figure 4 -4 is a reproduction of the graph for the frequency range of 1110 to 1170 kHz. The straight line running from top left to a lower point on the right represents inverse distance. It is drawn to the scale of 100 mV /m at one mile. Note that this line crosses the one -mile line (distance is read at the top) at exactly 100 mV /m.
As discussed earlier in the book, the inverse -distance law states: as distance is doubled, the field intensity is halved.
107
www.americanradiohistory.com

... I rr ...11 .1
rr.1....11. rr r :1 I.. . sl1 1 1 1111111
11.11n 11III 1I I11I11
11111ii1 II i n. n11ñ 111111 w 11 noun
IIIIIIIIIlIIiIIlIlllll in Rif
3: :---- 4r ;. r.in sw.O1 - -- . ::::: i7 . r f? in s slrNV1 lí:p !tÌ'1Ì Ä 'J raÑJlÌtHtrÌ it uÌ6%
e°I raa muu acSPJ. r 1 ill. A... Ilnln /I rl r a75:iti i 1
üs:1fLS?r SIF '.rl S'iÍ Idl:mllilu nmui%l',a:LI:::ihAl:I u ou: Iiai'/,SÌ:11 Ra1íII;uP:ilal! :1 1 I : 'Ul;i'/'/,''IY'II ill:flli'Ih ii:71:11i1 1P,4;=EgP,1lle' ll1I 111E111111 1111111
,al,OJa 1111111111111 111111101111111
R lu
t...:i3i?ä:N g:y.lr-1 IRSit{al..°B 11IÌ E:.I:: :é:e:a::rss »aI.E5..» ' u.a
9s g w M':..:
w
: ï:1 11111E 1SñiYlrir`liñ::llili:ril:iii:m{ii i! ri:=uuiiil a, s1 III ósl!ili"it d. ........ ....... .... .. .7ri' .IU71aaIl.sOS1 I1O.sl IIIIWa.I ..1 _Is I:.:.a.IIIII 5 :r IIIr. 1.JS' vii ::.rr : .: l: a::: i I.11:.: s1/1: 1. I:a1I Miring a::91e:17 1 t il =: f. r1::illal ssrrl-a'.rl 1u:17 :ï?.. s:::e:a. 1 eciM 111 s! ttr
11.11t1 i:el:. Ii1'i""il , IIÌ 1:u.sr:::ar '.air T ': LI r:! :la:lf III1:1111 I1lettfll1111111:1
; 111111 II e=1e111i IIiI1V i11.1. {il,::$ 11i Ì!afal:'d1111r
.:T.:Y,.:. a s: a : imams 1.1111 II 1111111131 i lr wry r111`.a1:0aeróas Ii1 'Uri :7.iíllÏ
iw SI
1
in Iss CI!11fqIÌiÌ t 1L11 Ì i
amo iL11i CSiifiti i`NüÌrÍllld Ì''11 Íil i:ÁÚu'e11=`Ìitil!1IIIliÌti °! :''rjrnö "" S 18Sa aalil us:
WHIM mg Iii 1. ::sBill:lE 1SSl,'i7 11r1 l" +° ?í :SY.i.' iil11116aSÌäI IN i
LL:"''' ... _ :MIMI ill II r1I:i6 Säilai :.:::.:. 71:1::"'1"S. ; I. .r1 r° 1' :5:5:'3 iII:SaL'::i'tfL'
i i':':' a°Ö1'"'Ö ° riiilîi:i,aii:zi'ï imii:i":üï i'i; iiii :i: ;iiiii ;' iiéii ó ü í:iäió iiiii=iii 1
'1; iI
llllllll ';;i ;111i11iii6 ëiiiin
i Ï i:::aiÌi
.::111;1iü6i;il iii, i iiI=.....;aB :l.:';,ii1'i i.;i' ' TAU i:: a.ii 'i iï'ilii"
1:4' N//I111111111111.IIIIIIIIIIIIIOU111111 el 111111 1 e I11111111 Ie1011114 r1 7r1111' 11/.11'01114 AMU rn SP.=dOIIIIIIII11111III.IIII111III1e1111111.Ieeilllll111llellilil I1II111111eI1e1111HUIle%Il!Illllidílr.la1.N11K /A11051111;111111111111
io$
www.americanradiohistory.com

1GIU.IHI::':.::5 i:i::i,...::iC::i:::.:I:i:ii'-:::isift... I tat11efLii:11:8::i:'i i ti:::e: i :111uiíi::eii:ii::i
al:iilsl íll: u:``i11ii::i JJ : :'aliaafigiiitii:iH. 1 i.ai u.R:ais 1e::1ie11 :1 : r muumuu 1: u: 'ai:eia::a:e ;i RI:: :tau-
1'i :11e:
xelr.l IBiu ::1 "'°°i:i'" ii'°'i ' :'i::1 '::. :q11a 1:1.a1:iaií:ll.A in4 i1 i
AMP iiiiiiClililIIiliiim Ì111'1'i iiú h ai I lii =MI 1111R1Niiiillillli 1d{6RUB11111::S:i11111q111 _ _ ,_:_
-'=_ " = :~.=-::::..:::. NEAR :s:,'
Ap§'` f : N.Riil >. ti
P ,sf
.ailiirl _úii LliL. 1
Pr ,_; ;i;iáilas 11
P. .::1,
.. :s sss f;.: z. : ï# !Ir.
iíi`:ii5iii.ái r :3 :i:"i,iii
a e lá;á5 :r1 -Ñi1. s: - ii::iti: "pyí :w^N: ;.:z:iiG N.1. ..i I .bi In ás ua. i uU i l 1 J\ 1i.iltl slit iii IIIi itO9lii UO IGG Ilit . 1i11í11: G1111 tGli Y
dg
: IIIII 7 t iitiI 11 it ligi Ili Y: Iö111rAPr 1 .: iilitltl li i 11tit.GiGGifi
Gii:tlP.ltii'ir ii'aiIIG i..ii íiiiAGi Hu :i til7 iif tiYtiWWI11 i/G GY.:3f5lli/i l'.liiii yii iii .^.CJ
ihru Aii.i üiti: IN :lliiiiii 1i ÌIG i I'iltc i It Itti : C:ISli::G 11ittaiIi11lsiL iatsirlúiiNtas. ü: ;i:.'.':::8 i au 1 Huüia 11ü:ai:1 "11iiR11S1i=Ii
=1iCi :11::::::1: i:: u;:1 IifiG11ü1ü111;;i .ÄÍ:':' :Il:!iße : 1::::::i: 6:1::::;;" :L:: :ie::i:l:ti::8::11
^d': RuR sag ..i:1i::: In U 11: ::I::::: ÌÍ: ":1 11111:1::: i . .i :i:ti::::1""'°6:x1 d ¡IPA! 111"':'1 ' I":1í:i::: "' i' II IIIII II:Ilüülla:Il::6 IIi ti1 : ii i:: L.i.°"' l' 11 ....1 1..illli N Ii 1
hi' q...i .
i1111 i iiilii.li liatl l 11 1 1 i11 11 Ili:ti 1 1 1
111 11111111 i111 111 11111111111111111 IlllittaIIIIiltill 11111i
IIIIIII II tiI Ii 111111111i1111IIIIIIIIII11atIIII .OII I Y
il 11f111iiiiiliiiii111II::i IIl11li1iilliill 1111III II::ii.:I Iiii111111
ii 1111111
I::iS:: nun; una
'''' iit1tI iiiiittUilii111lÌlIllfUiiiii111i1111 iliiiililiCi 1iiiiimliiiiiiilill w
109
www.americanradiohistory.com

Note also that the inverse- distance line crosses the 2 -mile point at 50 mV /m, the 4 -mile point at 25 mV /m, etc. This line represents the amount of signal that would be measured for a system radiating an inverse field of 100 mV /m if it were attenuated only as distance is increased.
To convert the scale to a value other than 100 mV /m inverse field at one mile, we merely multiply all values of field intensity by the new value of inverse field divided by 100. For example, for an inverse field of 250 mV /m all values of mV /m on the left side of the graph would be multiplied by 2.5. The curved lines below the inverse- distance line represent ground conductivities, ranging from the near -perfect seawater, with a value of 5000 mmhos /m down to the very poor value of 0.5 mmhos /m encountered in some types of soil. (The abbreviation "mmhos /m" means "millimhos per meter." A mho is a measure of conductivity and is the reciprocal of one ohm.)
The values of conductivity corresponding to each curve are indicated on the right side of the graph in the upper portion and on the curves in the lower portion of the graph. The upper curves can be used for distances up to 20 miles and the lower curves for distances beyond 10 miles.
A 250 mV /m inverse field at 1 mile, would produce at a distance of 10 miles a field intensity of 25 mV /m if there were no ground losses. The inverse- distance line crosses the 10 -mile point on the graph at 10 mV /m. Since this line is drawn to a scale of 100 mV /m inverse field, the value read on the graph must be multiplied by 250 /100, or 2.5.
In the real world, with a ground conductivity of 4 mmhos /m, we would measure 4.62 mV /m at 10 miles when the inverse field at one mile is 250 mV /m. This is found by following the curved line representing a conductivity of 4 mmhos /m (Fig. 4 -4) to where it crosses the 10 -mile line, and reading the mV /m value on the left side of the graph. This figure, 1.85 mV /m, is the value for an inverse field of 100 mV /m. For a value of 250 mV /m, we must multiply 1.85 mV /m by 2.5 (answer: 4.62 mV /m).
Blank log -log graph paper in the same scale and size used on the FCC -published charts must be obtained. (This paper,
110
www.americanradiohistory.com

with a grid size of 7 x 91/2 in. and a scale of 2.2 x 7 cycles, is available from Keuffel and Esser Co., with offices in most major cities. Their product number for this paper is 467802.) On this paper, each of the nondirectional measurements must be plotted with respect to distance and absolute values of measured field. Small dots are drawn on the paper, one corresponding to each measurement.
The plotted measurements are now compared to the FCC -published curves. A box with a 15- or 25 -watt lightbulb inside and a piece of glass for the top is very convenient for this part of the operation. Lay the FCC graph on the glass with the sheet of plotted measurements on top of it. It is sometimes convenient to attach the FCC graph to the glass with a small piece of tape to keep it in position. Keep the vertical edges of the grids on both sheets in line and move the top sheet up and down. The idea is to match the plotted data to a corresponding conductivity curve on the FCC graph. To complicate matters, all of the dots will probably not fall right on any one curve. The ground conductivity curve that an equal number of plotted measurements fall above or below (with the majority falling on or very close to the curve) will be the correct one.
It is also quite possible to encounter three or more different ground conductivities along the 20 -mile path of the radial. This change in conductivity is usually evidenced by a
sharp break in the continuity of the plotted data, and the measurements will then fall in along another curve.
Figure 4 -5 is the graph of plotted data shown in Table 4 -3. Notice that a change in ground conductivity from 4 mmhos /m to 3 occurs about 5 miles from the antenna. Care and a considerable amount of skill, which will come from practice, are required to properly identify the conductivities when several changes occur over the radial.
Once the plotted measurements and the FCC curves are properly positioned, note the value in millivolts per meter where the inverse- distance line on the FCC graph crosses the 1 -mile distance line on your graph. This is the value of inverse field being radiated by the antenna system along this radial. In our example, Fig. 4 -5, this is 195 mV /m, which is about the value to be expected for one kilowatt and a quarter -wave
111
www.americanradiohistory.com

mull ASHUII R UUllUt 11m lu inn: In 81111113.111 11111 alla 1311Mill 11111111M:1! 41:44111:111/ uarn Inns; new IIRMIIISILIM 11111, AN es
HirisrqUM i1e/11/1111011111 FejlilMnireu -
Ingo ignmohm itiv..16llmum1ul: neuem rum:eel:se 1111111121Flipepumpun 1111113133111 riumniniim 1111111tpid Ill lllJllIuillLlI ni:.
111110 'k1 liviErmdmInquig
UM' MIMI 1111111111111111111,1191 quisum. - : r -TEE
acu 15 .0=
>C at 02> o:;-1 - .c 01 0 -0
C ul C o o - 'o 'o c
x o e .- a 671: E
c?44 3 '.o g E .c o E
E
E E o o
E (0 yl c rut3 >
' 0 -o cp 4- w o
4-, c 4- VI
-5 E Gcl) , > 0 C _ w-
Q) 4.4 .0 O C
CI) in .0 4.11 70 gt > C
LLI- CD 412
.0 X G)
113
www.americanradiohistory.com
antenna. Draw in the inverse- distance line and the curves on your graph, tracing from the FCC graph.
The art of curve matching is subject to some individual interpretation. Two experienced persons comparing identical sets of measurements might very well come up with slightly different values of inverse field. As long as the two interpretations are reasonably close in value, both might be considered correct. Any large error in matching the plotted data to the proper ground conductivity curve will result in an unacceptable error in the determination of inverse field. This will cause much weeping and wailing and gnashing of teeth when the DA proof is made.
Inverse field from an antenna, when it is operating nondirectionally, can be expected to correspond closely to published data. If it does not, you have made an error in curve matching or the antenna is not radiating as efficiently as it should. Either of these is cause for concern and should be investigated before any attempt is made to tune the directional antenna.
114
www.americanradiohistory.com

Chapter 5 Setup Adjustments Of The DA System
After you have a complete set of nondirectional field -intensity measurements, the next step will be to concentrate on the problems connected with producing a directional radiation pattern that will be in substantial agreement with the calculated radiation pattern. The first objective is to energize each element in the system with rf current of the proper magnitude and phase angle as called for in the theoretical parameters.
INTRODUCTION TO DA ADJUSTMENT You are well advised, if it has not already been done, to
measure the base impedance of each of the radiators in the system. Leave the detuning networks intact on the unused towers and open each feed, in turn, to measure. Put the detuning network back in the circuit when finished. erroneous indications of resistance and reactance are likely to occur if the other towers are not detuned.
While the rf bridge is nulled, shake the tower by pulling on a guy wire. Resistance and reactance should remain constant. The towers will be subject to wind, and if the impedance is subject to change when vibrated, a very unstable array will result.
All radiators, if they are physically of the same construction (cross section, height, etc.), should exhibit similar base resistance and reactance. If they do not, try to ascertain why. This may or may not be an indication of trouble.
Every network in the DA system will have a bearing on the magnitude and phase angle of the current in the radiator. The more care that is given to setting up each individual
115
www.americanradiohistory.com

component in each network to its proper value, the easier and quicker the overall system will be brought into proper adjustment.
Rarely (if ever) can the system be initially energized after setup of the networks and have phase angles and currents exactly as called for. However, if proper procedures are followed, a reasonable approximation of required operating parameters can be expected. In the long run, this will save time in the overall setup of the system and, most important, it will give you an insight into the function of and inner workings of each and every component in the system that you will have to maintain.
All of the calculations on the various networks carried out in this chapter refer to reactance in ohms. Inductive reactance has a positive sign ( +) and capacitive reactance a negative ( -) sign. It is a good idea to prepare a chart from 5 through 100 ohms, in increments of 5 ohms, showing actual values of inductance in microhenrys and capacity in microfarads plotted versus reactance in ohms at your operating frequency. This will save time in arriving at real values for coils and capacitors during the tuneup procedure. Such a chart is shown in Table 5 -1.
THE SETUP OF BASE -COUPLING NETWORKS Each of the radiators in the system will more than likely
have a tuning network at its base. Each of these networks serves two functions which are not completely inseparable. One function is to match the driving -point impedance of the tower to the characteristic impedance of the transmission line.
Table 5 -1. Inductance and Capacitance for Various Reactances at 1120 kHz.
L (uH) X (Ohms) C(uF) L (uH) X (Ohms) C (uF)
0.71 5.0 0.0284 7.82 55 0.0026 1.42 10 0.0142 8.53 60 0.0024 2.13 15 0.0095 9.25 65 0.0022 2.84 20 0.0071 9.96 70 0.0020 3.56 25 0.0057 10.67 75 0.0019 4.27 30 0.0047 11.38 80 0.0018 4.98 35 0.0041 12.09 85 0.0017 5.69 40 0.0036 12.80 90 0.0016 6.40 45 0.0032 13.51 95 0.0015 7.11 50 0.0028 14.22 100 0.0014
116
www.americanradiohistory.com

The second function is to contribute a given amount of phase shift -either phase advance or phase retard -to the overall feeder system.
The calculated driving -point resistance and reactance of each radiator in the system must be known, along with the specified (designed -in) phase shift intended for the network. The characteristic impedance of the transmission line must also be known. All of this information was necessary to de- sign the phasing equipment and most likely can be found in the literature (instruction book, prints, etc.) furnished with it.
The base -tuning networks will usually take one of two forms: and L- network or a T- network. On rare occasions one might find a a- network. Because of its unusualness, tuning of a 7r- network will not be discussed. Both the L- and T- network tuning adjustments will be covered in detail.
THE ADJUSTMENT OF L-NETWORKS
The L- network consists of two reactances -one capacitive and one inductive. The value of phase shift, either positive or negative, is determined solely by the ratio of the two resistances to be matched. The Q of the network, likewise, is determined only by the ratio of the two re- sistances to be matched.
The actual configuration of the L- network will depend on whether the load impedance is greater or less than the line impedance, and whether the network was designed to advance or retard phase. Figure 5 -1 shows these variations. The actual L- network will usually have a small tapped in- ductor in series with the fixed capacitive element to vary the value of capacitive reactance. Variable capacitors are rarely used and are to be avoided in new installations.
The formulas for determining actual values of XL and Xc are shown in Fig. 5 -2. Once the actual required values have been calculated, an rf bridge, signal generator, null detector, and load for the network are needed to do the actual setup.
It must he remembered that matching networks are de- signed for, and capable of matching only pure resistances. In almost all cases the driving -point impedance of radiators in a DA system will consist of both resistance and reactance. The
117
www.americanradiohistory.com

PHASE RETARD -WHERE LINE R PHASE ADVANCE -WHERE LINE R IS LESS THAN LOAD R. IS LESS THAN LOAD R.
LINE
A
m
LOAD LINE
PHASE RETARD -WHERE LINE R IS GREATER THAN LOAD R.
LINE LOAD LINE
C
LOAD
B
PHASE ADVANCE -WHERE LINE R IS GREATER THAN LOAD R.
/l/
I I
D
/// Fig. 5 -1. Typical L- network configurations.
reactance must be canceled out by a series reactance of the opposite sign. Inductive reactance is canceled with a series capacitor, and capacitive reactance is canceled with a series inductor.
LOAD
A WHERE LINE R IS LESS THAN LOAD R
SERIES X=/(R LOAD X R LINE) - RLOAD2
PARALLEL X- R LOAD X R LINE
X SERIES
B WHERE LINE R IS GREATER THAN LOAD R
PARALLEL X =R LOAD/ R LINE R LOAD -R LINE
SERIES X- R LINE X R LOAD PARALLEL X
C Q_ /R LOAD
/ R LINE
D COS PHASE SHIFT R LINE
118
R LOAD
LINE I LOAD IN OUT
LIN OAD IN OUT
/J/
LINE IN
// ' LC7AD
OUT
LIN pAD IN OUT
/T/
Fig. 5 -2. Formulas for L- network series and parallel reactances.
www.americanradiohistory.com

Sometimes it is convenient to use the driving -point reactance as part of the series reactance in the network itself. For example, if the antenna driving -point reactance is +j20 when one is using the network shown in Fig. 5 -1C and the value of the series arm of the L- network inductor is 35 ohms, a value of XL = 15 ohms will effect the correct match. The " +j20" in the driving -point impedance represents 20 ohms of the series inductance.
Another alternative, somewhat less desirable, would be to insert a series capacitor with a reactance of 20 ohms between the output of the L- network and the load.
A load is needed to simulate the driving -point resistance and reactance. This must consist of a resistor of the proper value in series with a reactance of the proper sign and value. A
small variable resistor and a small variable capacitor or inductor (as the situation calls for) will do fine, since only the power of the signal generator will appear across the load. The rf bridge should be used to adjust the load's resistance and reactance to the proper value. This value should be equal to the driving -point impedance of the radiator.
Another method of accomplishing the same thing is to use a noninductive resistor whose value is equal to the characteristic impedance of the transmission line. This resistor will be connected to the input side of the base coupling network. The rf bridge will be connected to the output side of the network and fine adjustments will be made to the network reactances to produce the conjugate of the driving -point impedance. In other words, if the driving -point impedance is 40 -j35, the network will be adjusted to produce 40 +j35 looking into the load end of the network, while the input side is terminated in the characteristic impedance of the transmission line. This method is entirely acceptable, although it is sometimes confusing to the uninitiated.
The individual components of the L- network should initially be adjusted to their calculated values with the aid of an rf bridge. The bridge should then be connected to the input side of the L- network in place of the transmission line. The simulated load (the resistor and reactance) must be connected in place of the tower on the output side of the network. The measured resistance that the bridge sees looking into the
119
www.americanradiohistory.com

network should now closely approximate the characteristic impedance of the transmission line. The reactance should be
close to zero if all calculations and the setup of components have been properly carried out. Slight adjustments to the series) and shunt components of the L- network can be made at
this time to bring the resistance to the proper value and the reactance to zero. The shunt element in an IL- network will adjust resistance, and the series element will affect reactance as seen at the transmission line end (input).
The tower cannot be used as a load for these adjustments. The driving -point impedance of the tower when operating in
the array will not be the same as the self -impedance. Example: A 50 -ohm transmission line is to matched to a
tower whose driving -point impedance is 30 +j20. The L- network used has a phase delay characteristic and is shown in Fig. 5 -3.
Reactances Xi and X2 are used to effect the necessary match. Varying X3 adjusts the net reactance of the combination of X2 and X3 to the proper value (determined below). Capacitive reactance X2 has a value of -60 ohms at the operating frequency.
Applying the formula for the parallel reactance as shown in Fig. 5 -2B.
50 I-20 XP =30 130 -50 30 = 30 J-7-52
= 30 13 = 30 (-1.58) =47.5
Using the formula for series reactance in Fig. 5 -2B.
50 x 30 1500 47.5 47.5
- 31.6 ohms
The phase shift through the L- network can be calculated as
follows, using the formula shown in Fig. 5 -2C:
1 1 1 = 0.775 cos phase shift = V50 /30 1.29
120
www.americanradiohistory.com

The cosine of the angle of phase shift is 0.775; the angle of phase shift is -39 degrees, as determined by a table of natural trigonometric functions. The configuration of the L- network with the series element an inductance always indicates a phase lag.
As mentioned earlier, a matching network will match only pure resistances. The driving -point impedance of this radiator (Fig. 5 -3) has 20 ohms of inductive reactance. The calculated series reactance for this L- network requires 31.6 ohms of inductive reactance. This leaves 11.6 ohms to be made up in X1. Using the rf bridge, X1 is adjusted to 11.6 ohms. The fixed value of X2 is -60 ohms. The calculated value for the parallel element is -47.5 ohms. If X3 is adjusted to 12.5 ohms, the capacitive reactance of the parallel arm will be correct ( -60 +12.5 = -47.5). The combination of X2 and X3 should be adjusted to -47.5 ohms by changing the tap setting on X3.
Now, with the rf bridge connected in place of the transmission line looking into the network, and with the simulated load of 30 + j20 connected to the output side of the network in place of the tower, the value of impedance as indicated by the bridge should be very close to 50 + j0. Exact adjustments to the series and shunt arm can be made if necessary. When this has been accomplished, the transmission line and the tower should be reconnected to the network.
The same procedure should be followed for each of the other L-networks in the LTUs. Remember, the simulated load must be readjusted each time to the resistance and reactance of the driving -point impedance of the radiator associated with each L- network.
Fig. 5 -3. The L- network of the example.
121
www.americanradiohistory.com
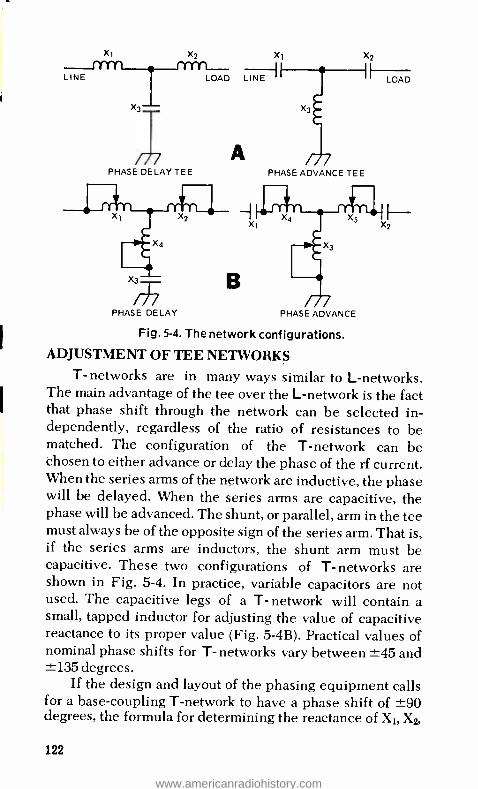
X1 X2 X1
LINE LOAD LINE '
Xg
/J/ PHASE DELAY TEE
A
PHASE DELAY
X2
II LOAD
PHASE ADVANCE TEE
X4 X5
PHASE ADVANCE
Fig. 5 -4. The network configurations.
ADJUSTMENT OF TEE NETWORKS T- networks are in many ways similar to L- networks.
The main advantage of the tee over the L- network is the fact that phase shift through the network can be selected in- dependently, regardless of the ratio of resistances to be matched. The configuration of the T- network can be chosen to either advance or delay the phase of the rf current. When the series arms of the network are inductive, the phase will be delayed. When the series arms are capacitive, the phase will be advanced. The shunt, or parallel, arm in the tee must always be of the opposite sign of the series arm. That is, if the series arms are inductors, the shunt arm must be capacitive. These two configurations of T- networks are shown in Fig. 5 -4. In practice, variable capacitors are not used. The capacitive legs of a T- network will contain a small, tapped inductor for adjusting the value of capacitive reactance to its proper value (Fig. 5 -4B). Practical values of nominal phase shifts for T- networks vary between ±45 and ±135 degrees.
If the design and layout of the phasing equipment calls for a base -coupling T- network to have a phase shift of ±90 degrees, the formula for determining the reactance of X1, X2,
122
www.americanradiohistory.com

ADDENDUM AND UPDATE SHEET
FCC rule changes have necessitated several minor alterations in the text of Directional Broadcast Antennas. The amendments cited herein will update the book to January 1976. Please mark your book on the pages as noted and write in the updated material. or place a note on all affected pages so that you can refer to this addendum when using the material on those pages. ( This sheet also includes notes for clarification of certain text passages.)
PAGE DELETE. SIATERIAI. TO RE SUBSTITUTED FOR DELETED TEXT
40 Last 7 To compensate for these losses. FCC rules permit the lines of actual measured value of power into the common point 1st para. plus to be above the nominal power for stations using a entire 2nd power of 5 kW or less and 5.3' above the nominal power para. for stations of 10 kW and greater power.
For example. a 1 kW station with a measured common -point resistance of 58 ohms would have a licensed common -point current of 4.32A. Using I'-R. the authorized common -point operating power would be 1082 watts. Any losses beyond the 8r allowance are not accounted for, and if excessive will show up as a low rms value for the array.
78 Last 3 sentences Some engineers believe that the radials should he only of 1st para. deep enough to afford protection. and that excessive
depth -particularly around the tower base -results in unnecessary losses. Ground screens are provided to reduce E -field losses near the antenna base. and should never be covered with soil. If protection is required. crushed rock or blacktop i asphalt is frequently used.
97 Italicized sentence If tests are to be performed during daytime. FCC that precedescuEcn approval is required: however, equipment tests during ur. WC/PA/ENT the experimental period i between midnight and local
sunrise) do not require advance FCC approval. Program test operation does require prior FCC approval: also. an existing station making major changes must obtain permission to continue programing using a new installation while making equipment tests and adjustments. Upon completion of tests and adjustments, the district engineer in charge must be notified that the station is ready for inspection.
118 In Fig. 5 -2. 2nd line. add 2 vertical lines to the equation so that it reads:
Ri.ixr: I'ARALLEL?C = RLO:V) Ri.nV-R.IXE
120 In the right half of the first equation. add 2 vertical lines so that it reads:
- 30 J I 'O I
- 3oJ i 1
www.americanradiohistory.com

PAGE DELETE MATERIAL TO BE SUBSTITUTED FOR DELETED TEXT
125 = 35.1 ohms -35.1 ohms ( solution for X3 equation)
139 All of 3rd Taking into account that the FCC rules call for an para. increase in the actual common -point resistance by a
factor of rr for nominal power of 5 kW and over, and 5.3rr for nominal powers of 10 kW and above, we can determine a resistance using Ohm's law that will allow easy reading of the current. If the resistance were adjusted to 54 ohms. the meter would read 10A for a station with a nominal power of 5 kW: 102 x 54 = 5000 x 1.08 = 5400W. For powers other than 5 kW. the 54 ohms will not cause the current to fall on exact graduations of the meter.
140 last 2 para. None
155 Last sentence in None 3rd para.
170 Last sent. ( which ends onp171)
2
A map showing the approaches to each monitoring point must be supplied. Although points are usually checked by traveling from one point to the next in a
circular route. directions to each point are sometimes written with the transmitter site as the starting point. This is based on the assumption that not all points may be checked. The directions to each point giving the route to the points as actually checked are also acceptable to the FCC. A description of landmarks and dimensions in describing the monitoring points is very important. Use the following guidelines:
1. Use standard units of length, avoiding such terms as steps, paces. 2. Use permanent landmarks; avoid items usch as "bush with red
flowers," "For -Sale sign," "cornfield," "hole in the road." or other landmarks subject to seasonal change.
3. Specify points of measurement clearly -i.e from center or edge of
roadways. 4. When possible install markers to identify the monitoring point or
measurement point. 5. Test the adequacy of all directions and point descriptions by having
someone not familiar with points attempt to use the written directions.
6. Review and revise monitoring -point directions and description periodically. Revised information can be submitted to FCC with
license renewal application. 7. Have more than one person on station staff familiar with the
monitoring -point locations.
www.americanradiohistory.com

and X3 is very simple. All three values are equal and only one calculation need be made.
X1 = X2 = X3 = VRIine X Rloed
One must remember that for a phase -retarding network X1 and X2 are inductive, and X3 is capacitive. For a phase- advancing network, Xi and X2 are capacitive, and X3 is inductive.
For a T- network where the desired phase shift is other than ±90 degrees, the following formulas must be used to determine each reactance.
X1 =
X2 =
X3
where
VRLne X Rioad [1- Rime cos°] Rioaa
sin°
V Rune X Rioaa [i- oad
Rime cos°
sin°
V Rune X Rioaa
sine
1
O = angle of desired phase shift cos O = cosine of the phase shift angle sin O = sine of the phase shift angle
Rime = characteristic impedance of the transmission line Rim = resistive part of the driving -point impedance
After one has calculated the reactive values of the series and shunt arms of the tee; X1, X2, and X3 should be adjusted using the rf bridge. Any reactance present in the driving -point impedance of the radiator must be taken into account as previously described in the section on L- networks. A series reactance of the opposite sign can be inserted or the driving -point reactance can be used to make up part of X2.
When this has been accomplished, the rf bridge is connected to the input side of the tee in place of the transmission line.
123
www.americanradiohistory.com

X1 50 OHM LINE
X3
/ /I
d
28
Fig. 5 -5. T- network for 80
degree phase shift.
The simulated load, set up to the correct values of resistance and reactance, is connected to the output side of the network, in place of the radiator. If all values of components have been calculated properly and set up correctly with the if bridge, a value of resistance close to the characteristic impedance of the transmission line should be indicated. The value of reactance should be zero.
Slight adjustments to the value of network components can be made to effect the proper resistance and zero reactance. Any large deviations from the calculated values of reactances should not be made, as this will materially affect the phase shift through the network, even though a proper match might be obtained. The value of X1 will affect the reactance measured at the input side. The values of X2 and X3 will affect the resistance. All three affect phase shift.
Under no circumstances in any T- network can the reactive value of the shunt element, X3, go below the geometric mean value of the two resistances to be matched. The geometric mean is the square root of the product of the input resistance and the output resistance of the network.
Example: The design of the feeder system for an element in a directional antenna system calls for a phase shift of -80 degrees through a T- network (Fig. 5 -5) which will match a 50 -ohm coaxial cable to the radiator's driving -point impedance of 24 +j28. The fixed value ofX3 is -42 ohms at the operating frequency. From the formulas given above, component reactive values are calculated.
124
www.americanradiohistory.com

X1 = - Y50 x 24 [
1 x (0.173) ]
-0.984
= -V 1200[1-2.08 (0.173)] -0.984
_ - 34.6[1 -0.36]_- 34.6(0.64) -22.2 = 22.5 ohms -0.984 -0.984 -0.984
X2 = -V 5o x 24[1-24 (0.173)] 50
-0.984
= -V 1200[1-0.48 (0.173)]
-0.984 `l b
_-.36A(1-0.083) _-34.6(0.917) -31.8 _ 32.2ohms -0.984 -0.984 -0.984
=V50x24 = VITO = 34.6 -0.984 -0.984 -0.984
5i ohms
Note: The negative sign for X3 indicates capacitive reactance. The antenna driving -point impedance is not pure
resistance in the example; it also contains the +j28, which is 28 ohms of inductive reactance. In this case the 28 ohms of reactance will be used as part of X2. The actual amount of reactance needed in X2 is then only 4.2 ohms (4.2+ 28 = 32.2).
Using the rf bridge, X1 (Fig. 5-5) is adjusted to 22.5 ohms at our operating frequency, X2 is adjusted to 4.2 ohms, and the combination of X3 and X4 is adjusted to +35.1 ohms. The capacitive shunt arm is varied by moving the tap on X4. The rf bridge is now connected to the input side of the network, in place of the transmission line, and the simulated load (set up to represent a load of 24 +j28) is connected in place of the tower.
125
www.americanradiohistory.com

If all calculations and the setup of the individual components have been made correcly, the bridge will indicate a value near 50 ohms resistance and zero reactance. Slight adjustments to network components to effect exact matching can now be made; only very minor adjustment should be needed. If the measured input impedance to the network is far from the 50 +j0 value, calculated values and actual values of reactance should be verified. Any large changes made to the reactances, even though providing a correct match, will change the phase shift through the tee.
The transmission line and antenna can now be reconnected to their respective terminals. The same procedure for all of the tee base -matching networks should be followed.
PHASE- CONTROL NETWORKS
Every well designed directional antenna feeder system will provide for convenient adjustment of phase in each of the radiating elements. The only exception to this rule might be the reference tower. The reference tower may or may not have a front panel control for phase.
As previously discussed, both the L- and T- networks have a certain amount of inherent phase shift. If one or more of the components is made variable in these networks, the phase shift through it can be varied. A pure phase -control network will change only the phase and not the current in the antenna element when adjusted. To accomplish this, the input impedance of the network must remain constant when the phase control is manipulated. If the input impedance goes up, the current will go down, and vice versa.
When the properties of the L- network are analyzed, it becomes immediately apparent that it is unsuitable as a phase -control network, since the ratio of the input and output resistances determine the phase shift through the network. If it is attempted to vary the phase shift through the L- network, the impedance will change.
In a T- network, however, phase shift and impedance can be separated. If the series arms of the tee are made variable, phase shift will change and the impedance will remain fairly
126
www.americanradiohistory.com

constant. This will hold true for variations in phase over a -±15- degree range from the nominal design. Small changes in impedance do occur under these conditions; and strictly speaking, the T- network cannot be made to work as a pure variable phase -shift network. For all practical purposes however, these variations are not serious handicaps when excursions from the nominal phase shift value of the network are held to the ±15- degree limit.
A series LC network, sometimes called a zero -degree phase -shift network, can be used to good advantage when only phase control and not a large amount of phase shift is needed in a feeder. Each of these networks is considered separately next.
ADJUSTMENT OF LC PHASE -CONTROL NETWORKS Series LC phase -control networks require very little in
the way of preliminary adjustment. The network will be operated near resonance. When the inductor- capacitor combination is at resonance, there will be no phase advance or lag through it. If the resonant frequency of the LC combination is below the operating frequency, the resultant reactance inserted in series with the transmission line will be inductive. Under these conditions, there will be a slight delay in phase.
When the resonant frequency of the LC network is above the operating frequency, capacitive reactance will predominate and the phase will be slightly advanced. Actual phase shift can be determined by the formula
reactance X tan0= - resistance R where
tan 0= tangent of the angle of phase shift X = value of series reactance in ohms R = characteristic impedance of the transmission line in ohms
By using this formula the actual amount of phase shift required in the circuit can be set up in advance. Phase excursions of more than ±15 degrees should not be attempted with this type of network. If, after power has been applied to
127
www.americanradiohistory.com

the array, it is found that a zero -degree phase shifter must be operated with a phase shift of more than this value, the base coupling network of the particular radiator should be recalculated and retuned to effect the proper amount of shift.
The accuracy of calculations using this formula will depend on how well the transmission line is matched to the driving -point impedance of the radiator. If a large mismatch exists on the tower end of the line, the resistance and reactance as seen by the network could be considerably different from the characteristic impedance of the line. Under these conditions, the actual amount of phase shift produced by this phase -control network will be other than that which is expected.
Since the value of phase shift contributed by the zero- degree phase -shift network is small, it is not always necessary to go to the trouble of setting ittothe specific required shift. The usual application of this type of network is where no actual phase shift is required, but standards of good engineering practice require that front panel control of phase be provided. Under these conditions, the rf bridge should be set up and the LC combination (disconnected from the circuit) tuned for series resonance. This is accomplished when reactance goes to zero, and the only resistance measured is the dc resistance of the inductor. For all practical purposes, this should also be zero. If it is desired to set the LC phase -shift network to a specific value of phase advance or delay, the following examples can be used as a guide.
Example: A series LC network between a transmission line and radiator in the directional antenna system is required to contribute 10 degrees of phase advance. The characteristic impedance of the transmission line is 52 ohms. It is desired to know what value of capacitive reactance will be needed in series with the line to achieve this.
tan 10° = 0.176 = X/52 X = 0.176 x 52 = 9.16 ohms
Using the rf bridge, the network should be adjusted to produce 9.16 ohms of capacitive reactance.
128
www.americanradiohistory.com

ADJUSTMENT OF TEE PHASE -CONTROL NETWORKS
Where a large amount of phase shift is required, a T- network is particularly useful. After a T- network is set up for its design center value of phase shift, the series reactances can be varied in unison to provide variable phase shift without seriously affecting the impedance match. Phase shift of x-15 degrees from the nominal design center is easily accomplished. The importance of being able to vary phase without changing the impedance of the network will be appreciated later when power is applied to the system and adjustment of phase becomes necessary. If the impedance as seen at the input side of the network changes, the amount of current in the radiator will change: thus the phase control can become an unwanted current control. This is a frustrating situation to say the least!
The T- networks used for phase control are similar in operation to those used in the base matching networks discussed earlier. There is one important difference: Their input and output impedances will be the same. No matching is required to be performed by the phase -control networks. The input and output impedances will be the same as the characteristic impedance of the transmission line. The series reactances of the T- network under these conditions will have the same value. They will be ganged together and made variable from the front panel of the phasor for phase adjustment.
If phase delay is required, the series reactances are inductive. If phase advance is required, the series reactances will be capacitive. The shunt element will always be opposite that of the series reactance (i.e., if the series elements are inductive, the shunt element will be capacitive). When dealing with the base coupling networks of a T- configuration, where capacitive reactance is required, a variable or tapped inductance is inserted in series with a fixed -value capacitor. The coil serves to adjust the value of capacitive reactance.
Formulas for T- networks, where the input and output impedances are the same, simplify to
129
www.americanradiohistory.com

X1=X2= R(1 -cos 0) sin O
X3 =sin O
where R = characteristic impedance of the transmission line
cos O = cosine of the phase shift angle sin O = sine of the phase shift angle When the phase shift is ±90 degrees, X1, X2 and X3 all
become equal and their reactive value in ohms is equal to the characteristic impedance of the transmission line.
Figure 5 -6 shows the actual configuration of a T- network used for phase control. As mentioned before, X1 and X2 will always be equal. The nominal value of required phase shift will be found in the instruction book for the phasing equipment or on the schematic of the phasor. Values of X1, X2, and X3 should be calculated and actually set up with an rf bridge. When the network is used to effect phase delay, X4 will be a tapped inductor used in conjunction with a fixed capacitor, X3, to obtain the proper value of capacitive reactance in the shunt arm of the network. Reactors Xl and X2 will be ganged roller- variable inductors with a front panel control. When the network is used for phase advance, X1 and X2 will be fixed capacitors and will form the capacitive reactance for the series arm. Reactors X4 and X5 will be roller -variable inductors with a front panel control. Their purpose is to vary the amount of capacitive reactance in the series arm. Reactor X3 in a phase- advance network will be a tapped inductor.
Example:A T- network used for phase control requires a nominal phase shift of +75 degrees. The impedance of the transmission line is 50 ohms, and the reactance of the series capacitors, X1 and X2, at the operating frequency is 55 ohms. Using the above formulas, reactance values can be determined.
50 (1-0.258) 50 (0.742) 37.1 Series X= Xl = X2 = 0.965 - 0.965 0.965 = 38.4ohms
130
www.americanradiohistory.com

50 parallel X = X3 = 0.965 = 51.75 ohms
cos 75° = 0.258 sin 75° = 0.965
The network reactive values are given in Fig. 5 -6.
With the aid of the rf bridge the tap on inductor X3 is set for a value of 51.75 ohms. Reactors X1 and X4 in series determine the final value of X1. These capacitors have a reactance of -55 ohms; therefore, X4 must be adjusted to 16.6 ohms to effect a total capacitive reactance of 39.4 ohms in the series arm (XL -Xc = 'Cwt.', or 16.6 -55 = -38.4). Parts X4 and X5 are ganged so that when the input arm is set correctly the output arm will have the same value.
As a check on the calculations and setup procedure, the network should be terminated with a 50 -ohm noninductive resistor. The input side of the network should be measured with an rf bridge. The bridge should measure 50 ohms resistance and zero reactance. If the measured values are within 5 percent or so, fine. If the measured value is considerably different from this, both the calculations and the setup procedure should be thoroughly rechecked. Any radical changes made to the value of shunt reactance will materially affect the phase shift through the network. The same procedure should be carried out for the other phase -control T- networks in the system.
On occasion it has been found that phasors with T- network phase -control elements have come from
- - -- - -,- - ---o FRONT -PANEL ADJUSTMENT
X4 X5 1 +116.6 +j16.6 X2
-j55 -j55 X3 +j51.75
Fig. 5 -6. Reactive and resistive va lues in a T- network.
131
www.americanradiohistory.com

manufacturers with the series- ganged coils wired incorrectly. The effect was to increase one inductor while the other decreased. When this happens, you get nowhere fast when trying to adjust phase. The error occurs when the strap from the roller is connected to the wrong end of one coil. It is easily corrected in the field.
SETUP OF THE POWER- DIVIDER NETWORK In the ideal DA system you would be able to adjust the
current in one element of the array and not affect the current ratio or phase angle of any other element in system. The ideal, of course, does not and really cannot exist. Phase -control networks will have some control on current, and current controls will affect phase to some extent. Proper state -of -the -art design of the DA feeder system, however, will hold these unwanted interaction of adjustments to a minimum.
Another variable which must be taken into account is the fact that the driving -point impedance of each element in a DA system is dependent on the magnitude and phase angle of the current present in every other element in the system. This means that as the current ratio or phase angle in tower 1 of a multielement array is adjusted, the resistance or reactance of the driving -point impedance of the other towers will also change. When the reactance changes, it will be accompanied by a shift in the phase angle. When the resistance changes, you are apt to see a change in current. This effect becomes less troublesome as the tower spacing is increased. If you analyze the mutual impedance charts, you will note that the magnitude of the mutual impedance decreases with increased spacing.
A third effect is that as power is increased to one tower, the loading on the power divider will change. When dealing with only two towers, this effect is not noticeable. When a multitower array is being tuned, the current in all elements is apt to change unpredictably.
With all of these effects combined, you might be led to believe that it is an impossible task to start from scratch and properly adjust a DA system. When the design of the power divider and phase -control networks is less than optimum, it is
132
www.americanradiohistory.com

indeed a complicated problem. When the current control for a particular tower has more effect on phase than on current, the problem is even worse.
All of this is pointed out here because some types of power dividers are particularly prone to excessive phase shifting when adjusted. We will examine three different variations of power dividers. Practical setup of these dividers will also be examined. There will no doubt be some "cut and try" required after power has been applied to the system. Individual phase- control networks may or may not follow each of the feeds. It will depend on the actual feeder system requirements.
The input side of two L- networks can be connected in parallel and connected to the output of the transmitter to form a power divider. The output sides of these networks are then connected to the phase -control networks or directly to the feedlines of the respective elements in the system. Resistors RL1 and R1.2 in Fig. 5 -7 (the feeds to each tower) ideally should be of equal impedance if both transmission lines are correctly matched to the driving -point impedance of their respective towers. In practical situations, they are not. Anything from a slight difference in impedance to a wide variation might exist. If both impedances were exactly equal and the lines were directly paralleled, half of the power would flow to tower 1
and half to tower 2. The impedance at the junction would be one -half that of the lines. Very rare is the case when equal powers are called for in both elements of a 2 -tower array.
INPUT FROM COMMON- POINT MATCHING NETWORK
o
NO. 1
FEED
NO.2 FEED o
RL1
L2
A
Fig. 5 -7. Parallel -L networks. B
133
www.americanradiohistory.com

Even if this were the case, there would be no practical method of making power adjustments.
If an L. network is inserted in the input of tower 1 and its input impedance is made to be 100 ohms, and if another L- network is inserted in the tower 2 feedline and its input impedance is 75 ohms, the power distribution in the array will not be equal. The input impedance to the combination of these networks will look like 100- and 75 -ohm resistors in parallel, or 42.8 ohms. Substituting resistors for the parallel -L networks, the circuit will look like Fig. 5 -7B.
From Ohm's law, it is easy to determine that tower 2 will receive 1.33 times as much power as tower 1. In a practical situation the power distribution figures for the array will be available, and the ratio of the resistance of one L- network to that of another can be determined.
P1/P2 = R2 /RI
where R2 /R1 = ratio of the L- network input resistances P1 /P2 = ratio of the powers in towers 1 and 2
Example: Power division for a 2 -tower array requires that 230W be distributed to tower 1 and 770W to tower 2. What would the ratio of input resistances be if parallel -L networks were used in the power divider?
P1 /P2 = R2 /R1 = 230/770 = 0.298
The input resistance of the L- network feeding tower 2 (the tower with the higher power) should be 0.298 times that of the input resistance of the L- network feeding tower 1. The exact numerical value of resistances used is not important from the standpoint of power distribution. However, if the combined resistances is very low, the current, thus the losses, will be high. If the input resistance to the network feeding tower 1 were chosen to be 100 ohms, the input of the other L- network would have to be 29.8 ohms. The result would be 22.95 ohms, or a current of 6.6A for one kilowatt. If the input to the L- network in tower 1 was set at 200 ohms, the input to the tower 2 L- network would be 59.6 ohms. The combined result would be 45.9 ohms, requiring a current of 4.66A for the
134
www.americanradiohistory.com

same power. The components cited in the first example would have to be capable of handling 41 percent more current than those of the second. This might not seem to be important in a kilowatt installation; however, when higher powers are used, components become much larger and much more expensive. Going to the other extreme (high input resistance) will increase the amount of rf voltage present across the various elements in the L- networks. A tradeoff (compromise) between high currents and high voltages must be made.
During the practical setup of this type of power divider, each network should be terminated with a noninductive resistor equal to the characteristic impedance of the transmission lines. An rf bridge can then be used to measure the input side of each network, choosing the proper values of L and C to arrive at the desired value of resistance. The section of this book covering L- networks can be used to determine the exact values of L and C required. The shunt element will have to be connected to the proper side of the series element, depending on whether the network will be used to step up or step down the load resistance.
The disadvantage of the parallel L- network power divider is the fact that power distribution and phase shift are inseparable. Power division changes are always accomplished only with a change in the phase angle of the current. The reason is that in an L- network, phase shift is a function of the ratio of resistances to be matched. This type of power divider is of no practical use in arrays of more than two elements. If the line impedance presented at the output to the L- networks is appreciably different from the value of load resistance used in the setup (because of mismatches in the LTUor phase-control networks), both phase and power division will be in error.
Figure 5 -8A shows a shunt divider. It consists of inductors in parallel across the rf feed from the transmitter to ground. Each element in the system has its associated variable coil. The operation of the shunt divider is probably best visualized by substituting variable resistors for the inductors and connecting the load between the arms of these resistors and ground. This is shown in Fig. 5-8B. The power consumed in each load is proportional to the square of the applied
135
www.americanradiohistory.com

INPUT FROM COMMON - POINT NETWORK
A B
INPUT
NO.1 FEED
NO. 1
FEED --0
rh-o
NO.2 FEED
NO.3 FEED
NO.2 FEED
NO.3 FEED
Fig. 5 -8. In A, the shunt -type power divider; in B, the resistor equivalent of the divider.
voltage. In this arrangement, the feed to any load can be taken from zero to any voltage up to the maximum. When the inductors are put back into the system, the same arrangement will exist. The only difference is that the reactance will store energy while the resistor will dissipate energy.
Each of the inductors should be variable from the front panel of the phasor. An exception might be the reference tower. Its feed will be a clip on the associated inductor, or it will be fed directly from the output of the common -point matching network.
The shunt type of power divider can be used successfully in arrays with up to four elements. It is inevitable that some shift in the phase angle of the current will accompany large changes in current through this network. The main disadvantage of the shunt power divider is the fact that each element in the system appears in parallel with each of the others. When many feeds are connected, as in the case of arrays using four or more elements, the total input resistance of this type of network will go to a very low value. Low resistance, of course, means high current and high losses.
The most practical way to approach the preliminary setup of the shunt divider is to set the taps on each coil to an approximate position in relation to the power to be delivered
136
www.americanradiohistory.com

to the respective elements in the array. The tower requiring the lowest amount of power would have its tap set closest to the bottom (ground side) of its inductor. The highest powered element would have its tap set near the top (hot side) of its inductor. All other tower feeds would be set midway on their inductors. When power is applied to the system, some cut and try will be necessary to ascertain the exact positioning of each tap.
Figure 5 -9A shows the basic series power divider. This is probably the most common type of divider for arrays of four or more towers. When visualized in a do circuit, using a resistor in place of an inductor (Fig. 5 -9B), it is easily seen that it is equivalent to a large resistor with many taps, connected across a power supply. This type of arrangement is used to good advantage to obtain several voltages from a single power supply. However, part of the resistor is common to all of the loads (the top part, between the feed and the first tap). Consequently, when one tap is moved to a different place on the resistor, the voltage distribution across the entire resistor will change to some extent. This applies as well to the series power divider using an inductor in place of a resistor in the DA system. This effect will cause some interaction between power controls on the phasor, making the initial adjustment a little trickier than that of the shunt divider previously described. The input resistance to this type of network is likely to vary considerably during adjustment, necessitating
INPUT FROM COMMON - POINT MATCHING NETWORK
NO.1 FEED
NO.2 FEED
NO.3 FEED
NO. 1
FEED
NO.2 FEED
NO.3 FEED
Fig. 5 -9. In A, the basic series power divider; in B, its equivalent.
137
www.americanradiohistory.com

INPUT FROM COMMON - POINT MATCHING NETWORK
REFERENCE O TOWER FEED
o NO. 2 TOWER FEED
o
o
NO. 3TOWER FEED
NO. 4 TOWER FEED
Fig. 5 -10. A practical series power divider.
that you carefully watch the load that the transmitter is looking into.
A practical arrangement for the series divider consists of a large coil connected from the rf feed to ground (Fig. 5 -10). The reference tower will be connected to the coil at the top (hot side). Smaller, roller -variable inductors, adjustable from the front panel of the phasor, are tapped across a portion of the large coil. The positioning of the taps on the large inductor will serve as a coarse adjustment of power division. The roller adjustment on the small coils is used for fine adjustment.
The actual setup of this type of divider is best accomplished by locating the reference tower feed and the rf input tap close to the top of the large coil. Each of the small rotary inductor taps is then positioned to straddle several turns on the main divider coil. Tower feeds are tapped off in order of power required; the lowest powered feed will straddle turns near the ground end. After applying power to the array, it will no doubt be necessary to make some changes in the positioning of the small coil taps across the main inductor to bring the front panel control into the proper range.
138
www.americanradiohistory.com

ADJUSTMENT OF THE COMMON -POINT MATCHING NETWORK
The purpose of the common -point matching network is to bring the input resistance of the power divider to a value that can be handled by the transmitter. The resistance looking into the power- dividing network will usually be a value wildly different from what the transmitter is capable of handling. More than likely it will also be reactive.
The load impedance that most modern -day transmitters are capable of handling is around 50 ohms. Enough variation in the tuning of the transmitter is usually designed so that a resistive value of ±10 ohms is easily accommodated. The in- put to the common -point network is the point where power output of the transmitter and power input to the antenna system will be measured. With some advance thinking, we can make the chore of reading and logging the common - point current -which corresponds to nominal transmitter power -a little easier. To accomplish this, we must select in advance a value of resistance for the input to the common - point network that will cause the common -point ammeter to read at an easily identifiable graduation on the instrument when the power output of the transmitter is at the licensed value. For example, it is easier to read 10.0A on the meter than 9.88A.
Taking into account that the FCC rules call for a reduc- tion in the actual common -point resistance by a factor of 0.925 for powers of 5 kW and under, and 0.950 for powers of 10 kW and above, we can by Ohm's law determine a re- sistance (somewhere near 50 ohms) that will allow easy read- ing of the current. If the resistance were to be adjusted to 54 ohms, the meter would read 1OA for 5 kW: 102 x 54 x 0.925 = 100 x 50 = 5000W. The value must be calculated taking the transmitter output power and the ap- propriate loss factor (0.925 or 0.950) into account. For powers other than 5 kW, the 54 ohms will not cause the current to fall on an exact graduation of the meter.
Having arrived at the desired value for the input re- sistance, it will now be actually set up. The common -point matching network will probably be an L -or T- network. (The procedure for adjusting these networks was covered pre-
139
www.americanradiohistory.com

viously.) The exact phase shift of the common -point network is unimportant. The usual approach is to open the phasor side of the rf common -point ammeter and insert an rf bridge "looking into" the antenna system. The values of the reac- tive components in the matching network can be "walked in" until our common -point resistance is the value desired. The reactance at this point in the system should then be ad- justed to zero.
Another approach is to actually measure the resistance and reactance at the input to the power divider. Calculations using the formulas in the sections on adjusting L- and T- networks are then made to determine the required values of the elements in the matching network in order to cancel any reactance and effect the proper resistive match. With the aid of the rf bridge, each element is set to the calculated value. The rf bridge is then placed at the input side of the network with the power divider as a load, and any necessary minor corrections to the shunt and series elements are made.
Common -point adjustments must be made as the last step in the initial setup. Any changes made in the power divider, the phase -control networks, or the base tuning networks will affect the common -point impedance. The network will have to be adjusted several times again as we walk the operating parameters of the array into their proper values. When all necessary phase and current adjustments have been made and the proper radiation pattern has been arried at, a complete set of resistance and reactance measure- ments, one every 5 kHz, covering ±30 kHz from the operat- ing frequency, will have to be made and submitted to the FCC as part of the DA proof and application for a license.
A note on measured transmitter efficiency when using a directional antenna is in order. When determining the power output of the transmitter using Ohm's law, you must use the actual measured common -point resistance and not the calculated value (reduced by a factor of 0.925 or 0.950) or the fictitious value that will appear on the station license. For ex- ample, if a certain transmitter requires 6250W input to pro- duce l0A common -point current, its output is 5400W and its efficiency is 5400/6250, or 86.4 percent.
The value of common -point resistance, when corrected as per the FCC Rules and Regulations, for a 5 kW station will be 50 ohms (54 x 0.925). If this value is used, the apparent efficiency will be only 5000/6250, or 80 percent -an error of 6 percent!
140
www.americanradiohistory.com

PREENERGIZATION CHECKS Before pressing the button on the transmitter, take a
good look at the phasor, the base tuning networks, and the towers themselves. (Especially check the spark gaps at the base -no short circuits!) Make sure that all jumpers and terminals have been put back into position. If you find one that has not, replace it, and recheck the common -point matching- network setup. Its input impedance will have changed.
The tower with the highest power in it will become the reference tower for the array. This is also the one used in the nondirectional proof. Modern type- approved phase monitors have an internal jumper whose position determines which tower will become the reference tower. Check to make sure it is in its proper position. All phase angles and current ratios will be referenced to this tower. Phase angle as measured on the monitor for the reference tower will always be zero. Phase angles of the other elements in the system will read in degrees plus or minus, referenced to this tower. Current ratios will be expressed as a decimal. They will be de- termined by dividing the current in each radiator by the cur- rent in the reference tower.
In a typical multitower array, the design parameters will probably look something like this:
Tower 1 1 / -50°
Tower 2 2.5 /+ 100°
Tower 3 2.5 / 100°
Tower 4 1 / +50°
To confuse matters more, the No. 2 tower is the re-
ference tower! To reduce its current ratio to unity, divide each of the other ratios by 2.5. To reduce the phase of the re-
ference tower to 0 degrees, subtract 100 degrees from each phase angle. After this operation the revised parameters will be as follows:
Tower 1 0.40 j -150°
Tower 2 1.0 0°
Tower 3 1.0 /- 200°
Tower 4 0.40 1-50°
141
www.americanradiohistory.com

The phase angle of the reference tower has been sub- tracted from the phase angle of each of the other towers; the current ratio of each of the other towers has been divided by the current magnitude of the reference tower. With the re- vised parameters everything except the tower 3 phase ( -200 degrees) looks reasonable. The phase monitor will only in- dicate up to -180 degrees; however, an angle of -200 degrees can be expressed as +160 degrees. This is the value that will be read on the phase monitor.
Before applying power to the array, turn all of the input pots on the phase monitor all the way down. Also turn the loop -current pots to zero. The location of these controls will be found in the phase -monitor instruction book.
142
www.americanradiohistory.com

Chapter 6
Operating Adjustments
The moment of truth is about to arrive! Remember, during the following steps, a signal will be radiated. Therefore, they must be carried out only during the experimental period between midnight and sunrise unless other arrangements are made with the FCC. Also, notification of the intention to con- duct equipment tests must be made to the FCC. The original notification made before starting the nondirectional proof will suffice.
INITIAL APPLICATION OF POWER
If a high -low power switch is available on the transmitter, by all means put it in the low -power position. If an auxiliary transmitter of an even lower power output is available, use it during the initial stages of the array tuning. It is possible that somewhere, something is not set up properly. The more power one applies under these conditions, the greater the risk one runs of destroying a capacitor or coil.
Assuming that everything holds together after the initial shock of applying power, with the aid of the phase- monitor in- struction book, set the input pots on the monitor for proper in- put levels. Again using the phase- monitor instruction book, set the loop current on the reference tower to 100. A pre- liminary reading of phase angles and loop current ratios can be taken at this time. If all prior steps have been carried out properly, these readings should indicate that we are somewhere in the ballpark. Calibration of the phase monitor as per the instruction book, for zero null, zero set, etc. should be done at this time. After the phase monitor has been calibrated, you should remove rf power from the system and proceed to calibrate the entire phase -sampling system.
143
www.americanradiohistory.com

PHASE MONITOR
REFERENCE INPUT ON PHASE MONITOR
PHASE- SAMPLING LOOP
REFERENCE LINE
v-....NO. 1 INPUT ON PHASE MONITOR
Fig. 6 -1. Test setup for checking sample line length.
CALIBRATION OF THE PHASE- SAMPLING SYSTEM
To facilitate calibration of the phase -sampling system, it is suggested that an extra line with connectors at each end be made. The line should be long enough to reach from the phase sample pickup device at the farthest tower to the input connector on the phase monitor in the transmitter building. It is not necessary that the line be of the same type as the phase -sample line. It should, however, be of the same characteristic impedance. A piece of RG -8 /U will suffice for installations where a 50 -ohm sample line is used. You will also need a coaxial T- connector and any other necessary adapters to connect the extra length of cable in parallel with the installed phase sample line right at the phase sample pickup device. This extra length of cable is called a reference line (Fig. 6 -1).
All lines should be disconnected at the phase monitor. The reference cable should be connected to reference tower input on the monitor. Connect the phase- sample line that is
in parallel with the reference line to the No. 1 tower input on
the monitor. To avoid damage to the monitor, all of the input - level pots should be turned down before application of rf
power. After rf power is applied to the system, the input pots should be properly adjusted for both the reference input and the No.1 tower input. The monitor is then switched to read the
144
www.americanradiohistory.com

phase angle as indicated in the No. 1 position. The actual tower number for which this sample line is under test should be noted along with the indicated phase angle. Take care to note whether the angle is leading or lagging.
This same procedure must be carried out for each of the sampling lines in the system. The reference line ma be paralleled with the sample line right at the output of the pickup device. The same reference line must be used for each of the towers. The data should be entered on a chart similar to that shown below.
Tower 1
2 3 4
Column 1
+2 +4 +4 -1
Column 2
-2 0
0
-5
Column .3
38.4 0
0
96.0 3
What we are doing is comparing the electrical length of each of the phase -sample lines to the reference line. If the indicated phase angle is +2 degrees, this means that the sample line under test is electrically 2 degrees shorter than the reference line. If the indicated phase angle were -2 degrees, this would indicate that the sample line is elec- trically 2 degrees longer than the reference line.
The data shown in "column 1" above indicates that sam- ple lines 2 and 3 are equal in length and the shortest in the system. The " +4 degrees" indicates that they are electrically 4 degrees shorter than the reference line. The tower 1 line is electrically 2 degrees longer than 2 and 3. The " +2" in- dicates that it is 2 electrical degrees shorter than the re- ference line. The No. 4 line is 1 electrical degree longer than the reference line and 5 degrees longer than the shortest lines in the system. "Column 2" of the chart shows the number of degrees that must be trimmed from lines 1 and 4 to make all of the lines the same electrical length.
The next task is to determine how many inches of line., make up one electrical degree. The formula 11808 /frequency (MHz) will tell us how many inches to a wavelength in free space. Since one wavelength is equal to 360 degrees, you must divide the answer by 360 to find how many inches are in one degree. One more fact must be taken into account:
145
www.americanradiohistory.com

The energy flow in a transmission line is slower than in free space. Hence the number of inches in one degree in free space must then be multiplied by the velocity factor of the cable. The entire formula then becomes
11808 x 1 x velocity factor = length in inches per degree f(\IHz) 360
Example: Using the chart data above we will determine how much the sample lines to towers 1 and 4 must be shortened. The sample line has a velocity factor of 0.66 and the operating frequency is 1120 kHz.
11808 1 1
1.120 x 360 x 0.66 = 10542 x 360 x 0.66
= 29.2 (0.66) = 19.2in.
Therefore, sample line 1 must he shortened by 38.4 in. (2 x 19.2) and sample line 4 must be shortened by 96.0 in.
(5 x 19.2).
If the advice given in the section on sample line installa- tion were followed and 20 ft of extra sample line were stored in the wire duct, basement, or some other accessible place, no problem would be encountered in cutting the 36.4 and 96 in. from these lines. After replacing the connectors on the shortened lines, recheck each line using the same procedure. When all lines are measured to be within 0.5 -1.0 degree of each other, they will be considered satisfactory.
All of the sample lines should be reconnected to their terminals on the phase monitor. The reference line should be put in a safe place. It is a valuable tool for checking sampl- ing lines at a later date should trouble be suspected.
Other methods of checking the accuracy of the phase - monitoring system can be used. One of these involves set- ting up two of the towers in the system to produce a null in line with the towers. This will involve two -way radio com- munication to a measuring point where the towers can be lined up and the array adjusted while field intensity readings are called back to the operator making the adjustments. When this is accomplished, the phase as indicated on the
146
www.americanradiohistory.com

monitor can be compared with the theoretical phase re- quired to cause this condition.
Still a third method can be used. If the resonant frequen- cy of each of the lines and sample loops is measured with an rf bridge, variations in resonant frequency can be expressed in electrical degrees, hence in inches. Corrections to line length can be made using this information. Even if this method is not used in the actual calibration procedure, the data obtained us- ing this procedure should be recorded in the instruction book for the monitor or phasor. It will give a quick check, by com- parison with new measurements, of the condition of the sampling system if unexplained trouble should develop.
ADJUSTING THE ARRAY FOR PROPER CURRENT RATIOS AND PHASE
After the sampling system has been calibrated, proceed to the task of setting up the proper current ratios and phase angles of the currents in the various elements in the system. Since the phase -sampling system has been calibrated, the in- dications of phase as read on the monitor can be believed. The next step is to verify the loop currents as read on the monitor.
Power should now be reapplied to the system. The input level controls on the monitor should be adjusted as per the in- struction book. Each base current should be read and its ratio to the reference base current set. It may be necessary to apply more power to the system to get the base currents high enough to be accurately read. With the normal square -law type of meter, the indications of current are crowded at the low end of the scale. Care should be taken to reduce the loop current con- trol and the input level controls on the phase monitor, if power is increased, to avoid any change of damage to the monitor or its indicating instruments. Base and loop current ratios, when read from the phase monitor, should be within a few percent of each other. If they are not, steps should be taken to ascertain why. Phase readings should not be taken when any of the base current meters are inserted in the circuit.
Even though measures have probably been taken by the manufacturer of the phasing equipment to wash out the ef- fects of the added reactance caused by the insertion of the rf
147
www.americanradiohistory.com

ammeter in series with the tower drive point, changes in
phase of 2 degrees or more are not uncommon. For this same reason, only one rf ammeter at a time should be inserted into the system. For example, if in order to save time two people are used to read base currents during the tuneup, each should pull the switch of the base current meter, read the current, and then remove the meter from the system before the next current is read. When two of these meters are in the circuit, you are apt to get a different reading than when only one is.
The current ratios and phases that were used in the de- sign of the array will now have to be "walked" into their pro- per values. If they are far from what they should be and the tuning networks, phase -control networks, and the power divider have been eliminated as the cause of error, it is quite possible that an error in the calculation of the driving -point impedances has occurred. In arrays where closely spaced towers (less than 90 degrees) are used, the magnitude of the mutual impedance will be very large, and calculated values are frequently in error. This also applies where tall towers (higher than 135 degrees) are used. For this reason, some consultants prefer to measure the magnitude of mutual im-
pedance between towers by energizing one tower and then measuring the current coupled into the others.
The only alternative is to try and bring the array into tune by the cut -and -try method. That consists of moving taps on coils to see which way the phase or current will go.
When this is done, some of the transmission lines will end up being mismatched. It is then necessary, when the theoretical values of phase and current ratios are reached, to
insert an in -line rf bridge at the feed to each tower (just
beyond the base current ammeter) and actually measure the driving -point impedance of each radiator.
With the system energized, the actual values of re-
sistance and reactances present at the drive point can be measured. The correct current ratio and phase must be pre- sent in all of the radiators if the measured driving -point im-
pedance is to be accurate. Armed with correct driving -point impedance data, the base -tuning networks can be re-
calcuated and reset.
148
www.americanradiohistory.com

On the brighter side of things, if the current ratios and phases are reasonably close to what is required when rf power is applied, and if the adjustment of the phasor controls brings the array into tune at the theoretical values, half of the battle is over. As the various controls are adjusted, it will be observed that phase control is not completely independent of current control, and vice versa. A phase adjustment of 10 degrees in one tower might produce a change in current of 5 percent in another tower. Most of this interaction, assuming state -of -the -art phasor design, is due to the driving -point im- pedance of the towers changing. As outlined in the section dealing with driving -point impedance, the driving -point im- pedance is dependent on, among other things, the current ratio and phase angle of each of the other radiators in the system. This means that as any operating parameter in the ar- ray is adjusted, all of the driving -point impedances will change.
A method which I will call "half adjustments" can sometimes be used when tuning up a multitower array. If the phase of the No. 1 tower is out by 20 degrees and all of the other parameters are close to being normal, adjust the No. 1
tower so its phase is within 10 degrees of being correct. Proceed from here to adjust the parameters of towers 2, 3, etc. to the values which existed before any adjustment was made to No. 1. When this has been accomplished, move the phase of the No. 1 tower 5 degrees closer and again readjust towers 2, 3, etc. to their previous conditions. The advantage of this method is that if tower No. 1 were to be moved 20 degrees in one adjustment, its phase will be correct, but towers 2, 3 -and who knows what others -may end up being 20 degrees or more out. In a simple 2 -tower array, you have only one current ratio and one phase to consider. This makes life a lot easier. In a multitower array, the above -mentioned symptoms are sure to occur. Of course, adjustment of tower No. 2 current in a 2 -tower array can -and no doubt will - cause a variation in the phase of the No. 2 tower.
Patient adjustment will eventually result in parameters that closely resemble those laid out on paper. When this con- dition is arrived at, it is a good idea to measure the actual driving -point impedances with an in -line rf bridge. If any
149
www.americanradiohistory.com

large discrepancies between the calculated values (those to which the base -matching networks were set) and measured impedances exist, you should reset the base -coupling networks to accommodate the actual driving -point im- pedances. Large mismatches on the transmission lines can, among other things, reduce the rms value of radiation from the array, eventually cause an arcover in the transmission line, or cause erratic and unexplained operation of the phase - adjusting networks. If any readjustment of the base -coupling networks is carried out, it will be necessary to bring the phases and current ratios back to their proper values.
Recheck and adjust the common -point impedance to its proper value. That is important at this time, as the exact amount of power being fed to the antenna system must be known. If the common -point impedance is in error, the system might be radiating only 750W instead of 1000W. This will cause the field intensity measurements which will follow to be in error.
SPOT CHECK OF THE RADIATION PATTERN With the phases and current ratios now under control, it
is time to grab the field intensity meter once again and take a look at the actual radiation pattern. During the nondirec- tional proof, we selected a permanent monitoring point on each of the specified azimuths. A measure of the nondirec- tional radiated field at this point was also made. What we now want to do is calculate the approximate amount of radia- tion that should reasonably be expected on these points in DA operation. We will then make actual field intensity measurements on these monitor points to see if the actual radiation pattern being produced is in substantial agreement with the theoretical radiation pattern.
During the nondirectional proof, the inverse field from the single tower was established and documented. The con- struction permit will specify the maximum inverse field permitted on each specified null or minimum. If one divides the specified inverse field by the inverse field established in the nondirectional proof, the result will be a decimal frac- tion. If the actual measured field that was recorded at the
150
www.americanradiohistory.com

monitor point during the nondirectional proof is multiplied by this decimal, the result will be the approximate value of radiated field to be expected during DA operation at this monitor point.
Example: The construction permit for station XYZ specifies that the inverse field on a true azimuth of 200 degrees shall not exceed 30 mV /m at one mile. The nondirec- tional inverse field along this same azimuth was established to be 195 mV /m at one mile. The actual nondirectional measured value of field strength on the proposed monitoring point was 102 mV /m. What preliminary approximate value of measured field can be expected to be measured on this monitor point in DA operation?
The expected field strength is
DA specified inverse field nondirectional Measured nondirectional inverse field X measured field
30 195 X 102 = 15.5 mV /m ¡ ,
This procedure should be carried out for the monitoring point and for two or three other points on each of the specified azimuths. Remember to use the specified DA in- verse field corresponding to the azimuth. With this data in hand, each of these points must be measured with the field intensity meter. These points must not be located closer than 10 times the distance between the farthest radiators in the DA system.
The value of specified inverse field in the construction permit is a maximum value. However, we do not want to pull the values of inverse field in the radiation pattern down to unrealistic values. This condition will reduce coverage in these areas and will also result in a situation where these low values of radiation can not be maintained. The lower the value of inverse field in the minima the more difficult it becomes to maintain. When very deep minima occur in the radiation pattern, any slight change in current ratio or phase will cause a large shift in the actual radiated field. Some situations require that very deep minima be produced by the radiation pattern to reduce or eliminate interference to other stations on the same or adjacent frequencies. When this is
151
www.americanradiohistory.com

necessary, you must live with it, but there is no point in creating such a situation.
The FCC policy today seems to be one of putting a 5- or 10- percent tolerance on monitoring points, over and above what was measured in the DA proof. This situation can result in problems if the values of radiated field as measured at the monitoring points change with the different seasons of the year.
Now, back to the three or four points that we have just measured on the specified azimuths. The average measured values must be below the calculated values, but not exceed- ingly far below. Values of 10 -20 percent on the low side are fine. If these values are way down, the consultant on the job will probably want to increase them. If they are very close to or above the calculated values, they definitely have to be lowered.
By making a few measurements on each radial, we are trying to determine the approximate value of inverse field being radiated. With this data in hand, adjustments in the value of radiation can be made before starting the DA proof. When we get to the DA proof, all of the previously measured nondirectional points beyond 10 times the radiator spacing must be remeasured. Each one will have its value of DA field compared to the measured value of nondirectional field. This will determine inverse radiation.
If your sampling of the radiation pattern seems to in- dicate that the array is in adjustment, the next step is to start the DA proof. If it indicates that some additional adjustment is necessary, some or all of the steps outlined in the next sec- tion will have to be carried out.
FINAL ADJUSTMENT OF THE RADIATION PATTERN The easiest way to make final adjustments on a new ar-
ray when required (or readjustment of an existing array) is using two -way radio communications between the monitor- ing points being measured and the transmitter building. The ideal situation exists when there are enough field intensity meters and two -way mobile units available to station one at each monitoring point. However, when adjusting a complex
152
www.americanradiohistory.com

radiation pattern produced by three or more towers, this might mean six, eight, or even more pieces of equipment. Some specified azimuths, thus locations of monitoring points, will be on minor lobes, and others at minima on the pattern. If the available equipment is stationed at the minima, the objective can usually be accomplished. If the minima are correctly positioned and are of the proper depth, the minor lobes probably will fall into place.
When making adjustments of this type, you will find that any one adjustment will usually affect all monitoring -point readings. Adjustments in increments of one degree of phase and one percent or less in current ratio should be made to each radiator. After each adjustment, monitoring -point read- ings should be relayed by two -way radio and noted along with the actual adjustment that was made. Before long, it will become evident which adjustment or combination of adjust- ments is needed to bring the pattern into proper shape.
After the minima are positioned, a check of the monitor- ing points located on minor lobes should be made. If the measured values of field at these points appear to be in or-
der, fine; if not, the usual procedure is to set up the measur- ing equipment again on the monitoring points in the nulls or minima and pull them in tighter. By pulling in the minimum - -that is, lowering the value of measured field on monitoring points in each miniumum -the minor lobe lying off to its side will come down in value.
If only one field intensity meter and two -way radio unit is available, it should first be placed on monitor point A. Ad- just tower l's phase + 1 degree and note the monitoring - point reading. The phase should then be adjusted 1 degree from the original setting and the effect at the monitoring point noted. When this has been completed, return the con- trol to the original value of phase. Do this for each tower in the system. Repeat the procedure- moving current up one percent and then down one percent -always recording the effect on the monitoring -point reading and always returning the adjustment back to its original value before going on to the next tower. When this is completed, move on to monitor- ing point B and perform the same operation. After this, move on to monitoring point C, etc.
153
www.americanradiohistory.com

When the data is tabulated, the effect of each current and phase change on the field intensity at each monitoring - point can be seen. Actually, the same information can be gathered without the use of two -way radio by going to one point, measuring the field, and then returning and making the adjustment. This procedure is a very long drawn -out af- fair if the DA system has more than two elements.
A vector analysis of each monitoring point can sometimes be used to good advantage during this operation. A procedure for vector analysis is explained in the main- tenance section of this book.
The type of two -way radio used will largely depend on what is available. Class D citizens band units are probably the most economical, if you can tolerate the screams and whistles prevalent on these 27 MHz frequencies. The monitoring points will be within 4 miles of the transmitter, and under all but the most rugged conditions of terrain, the signals both ways will normally override the interference.
Remote pickup broadcast facilities are also authorized by the Commission for this type of use. Frequencies in the 26, 160, and 450 MHz ranges are available for remote pickup licensing. Some ingenious individuals -not overly con- cerned with the finer points of the law -have even resorted to hiring taxicabs with two -way radios for the time required to make the necessary adjustments!
The actual amount of time required to adjust an array will depend on the type of array (in -line, dogleg, parallelo- gram, etc.), the number of towers in the array, the number of specified azimuths and monitoring points, and the required depth of the minima. With a radiation pattern that requires inverse radiation in the minima to be down to 2 or 3 percent of the nondirectional values, very slight changes in some of the operating parameters of the array will cause changes of 100 percent or more in monitoring -point readings.
An array of this nature will require considerable time and skill to properly adjust. A 2 -tower array with fairly loose minima (barring any unforeseen disasters) quite possibly could he adjusted by an experienced consultant in as little as one day. In arrays where there are few towers and loose
154
www.americanradiohistory.com

minima, it is possible that a legal radiation pattern will exist when the theoretical values of phase and current ratios are achieved. Little or no additional adjustment would then be required.
During the process of these walking -in adjustments, you should keep an eye on the power output of the transmitter. The common -point impedance will change when any adjust- ments are made. An in -line operating -type rf bridge installed to monitor common -point impedance can be used to good ad- vantage.
If the common -point impedance strays too far from the originally measured value, the value of I2R will be in serious error. A significant drop in transmitter output power in- directly caused by measurement error will cause a drop in the value of measured field intensity. When the power is restored to normal, the monitoring point readings could easi- ly exceed the values you are seeking. Do not forget to correct the measured common -point resistance by multiplying by 0.95 or 0.925, whichever is applicable to the situation.
When all of the final phase and current adjustments have been made, the common -point impedance must be checked and set to the desired value. Adjustments to the common -point matching network will have no effect on phase or current ratios in a properly designed phasor.
RERACIATION FROM PARASITIC SOURCES An in -line directional antenna system should produce a
symmetrical radiation pattern. If the line of towers lies on an azimuth of 300 degrees and there is a minimum on an azimuth of 350 degrees, a minimum of the same magnitude should exist on an azimuth of 250 degrees. When the inverse field along each one of these radials has been determined, each should have approximately the same value. If after al- lowing for a possible error of a few percent due to influences at various measuring points there is a radical difference in the values of inverse fields, only one conclusion can be re- ached: There is a parasitic radiator distorting the DA pattern.
The dictionary defines a parasite as "a hanger on, an animal, or a plant nourished by another to which it attaches itself; something depending solely upon another for its ex-
155
www.americanradiohistory.com

PARASITIC RADIATIONÌ' PATTERN (DOTTED LINE)
PARASITIC RADIATOR
___
B
A \ MEASURING POINTA (VALUE Ar--1- MEASURED FIELD TOO HIGH)
RADIATION PATTERN (SOLID LINE) /
DA / í`/'~
MEASURING POINT B (VALUE 4--OF MEASURED FIELD NORMAL)
FIELD INTENSITY METER POSITION FOR INDICATION OF. MAXIMUM RERADIATION
PARASITIC RADIATOR
DA SYSTEM
Fig. 6 -2. In A, the effect of parasitic reradiation on the DA pattern; In B, locating the parasitic radiator.
istence." This pretty well defines the parasitic radiator also. The directional antenna system supplies the rf energy, and the parasitic radiator reradiates part of this energy. Take away the DA system and the parasite's source of energy ceases to exist; the result, no radiation. The fact that the parasitic radiator reradiates this energy more or less non - directionally is where the problem lies. Figure 6 -2A il- lustrates the effect this has on the minima in the directional radiation pattern.
156
www.americanradiohistory.com

Severe asymmetry in the radiation pattern produced by an in -line array is a sure tipoff to this condition. A reading taken along a radial where a well- defined null in the field in- tensity meter indication does not occur as the meter is posi- tioned at right angles to the array is another sign of reradia- tion problems. In an existing array, where the parasitic radiator has been introduced after the system has been in operation, the effect is to raise monitoring -point readings above the permissible maxima. In a new array it is likely to show up as a condition where required minimum values of inverse field in some nulls cannot be realized.
The first step toward a remedy is to identify the source of reradiation. Parasitic radiators can take the form of water tanks, towers used for FM or TV broadcasting, towers used for two -way radio services, tall metallic smoke stacks, sup- port towers for high -voltage transmission lines, etc.
The parasitic radiator will have to be at least Y8
wavelength tall to cause a serious problem. In terms of physical length this will range from about 225 ft at the low end of the broadcast band down to 75 ft at 1600 kHz. Objects shorter than this are seldom troublesome as their radiation efficiency is too poor.
If the source of reradiation is evident, part of the pro- blem is solved. However, the apparent source might not be evident. You then must go looking. First, obtain a topo- graphic map of the area. The ones used in the antenna proof will be fine.
The field intensity meter will serve as a very good direc- tion finder. The direction of the axis of the loop antenna in the cover, when the meter indicates maximum measured field, is the direction of the wavefront. With the meter, measure two or three points that will place the direction of the reradiation at right angles to the direction of the DA. Mark the measuring point on the map and draw a line in the direction of the reradiated signal. Do this for two or more points, and the point where the lines intersect is the proba- ble location of the parasitic radiator (Fig. 6 -2B). An inspec- tion trip to this location will no doubt turn up the troublemaker.
157
www.americanradiohistory.com

To verify this, place yourself in a position so that the suspected source is about 100 ft away and at a 90 -degree angle to the array. Turn on the field intensity meter and measure. If this is the culprit, measured radiation will no doubt be higher with the meter oriented toward it than oriented toward the array.
When the source has been identified, the problem of making it invisible (electrically speaking, of course) at the operating frequency remains. The actual steps to be taken will depend on what the object is (water tank, TV tower, etc.). Sometimes, if the problem is not too severe, a change in the operating parameters of the array will correct the situation. Most consulting engineers have ecountered and successfully solved problems of this nature many times.
DOING THE DA PROOF When you are satisfied that the pattern appears to be in
proper adjustment, it is time to start the DA proof. The maps used in the nondirectional proof and the data recorded for each point along the radial should be in hand. Make sure it is a copy. If you should lose the original...disaster! Starting at a distance 10 times the distance of the farthest spaced radiators in the DA system, every point measured in the nondirectional proof will be remeasured.
It is a good idea to take the nondirectional measurements and multiply each one by the ratio of nondirectional measured inverse field to the DA maximum allowable inverse field. This is done by taking the value of inverse field specified in the construction permit for the radial being measured and dividing it by the nondirectional inverse field determined in the nondirectional proof. Multiply each nondirectional measured field by this ratio. The reasoning behind this is that when you get out a few miles and find all of these expected values exceeded, you know it is time to go back and do some more adjusting.
As discussed earlier, check all field intensity meters daily against one another. In addition, check the value of radiated field on each of the selected monitoring points daily before setting out to measure the radials. If something has changed
158
www.americanradiohistory.com

radically, it is best to find out before you set out to measure than to find out after having wasted the better part of a day. In the case of a new station the Commission will permit carrier -only operation (with station identification at half -hour intervals) while doing the DA proof. The man at the transmitter should be instructed to turn the carrier off if any of the operating parameters change value by an ap- preciable amount. Those doing the measuring will then stop, rather than continuing and making measurements that are in error. Of course, common -point impedance should be checked to assure proper operating power.
Care must be exercised when making measurements in a deep, close -in null. A difference of only a few feet one way or another can make the difference between being in the null itself or off to one side. It has been noted in some arrays which produce deep nulls that a measured field of more than three times the expected value can be found by moving only 100 ft. This is especially true if the null lies just off to the side of the major lobe. Where the carrier is modulated, as might be the case of an existing station changing facilities, the field intensity meter may jump considerably in deep nulls. The cause of this is that the carrier is attenuated more than the sidebands, because of bandwidth restrictions of the antenna system. Read the meter at a low point in the modula- tion. The recovered audio in a null may sound distorted.
When measuring the radials during the DA mode of operation, you will probably note that there will be a con- siderable amount of scattering. That is, the measured values of field will jump up and down from the expected values of radiation. This is not unusual. The finished set of measure- ments, however, when compared to individual measure- ments, must produce an average ratio less than the calculated value (nondirectional /DA).
Beware of locations where the measured field is very low or very high in relation to what it should be. This is due to reradiation. The field intensity meter, when rotated through an arc of 180 degrees, should drop to a value of at least one -tenth of the maximum value. When it does not, that is another indication of reradiation. The maximum measured
159
www.americanradiohistory.com

field should occur when the meter is oriented toward the sta- tion. If it does not, record the reading when the meter is pointed toward the station, and under a "remarks" column, record the maximum value of field and its approximate direc- tion of arrival.
DETERMINING INVERSE FIELD When all of the points along the radial previously
measured in the nondirectional proof have been remeasured using the DA mode, the actual inverse field being radiated along the radial can accurately be determined. The construc- tion permit calls for a limitation on inverse field, not measured field.
The construction permit for station XYZ calls for a max- imum inverse field of 45 mV /m at one mile on the 270 - degree radial for DA operation. The exact wording on the CP is "shall not exceed 45 mV /m at one mile." Literally, this means the inverse field shall be at or less than 45 mV /m. Practically, it means that the inverse field shall be less than 45 mV /m at one mile. If one were to supply a proof to the Commission on which it was shown that the inverse field along this radial was 45 mV /m, in all probability it would be returned with no action taken!
Since we are measuring in exactly the same places for the DA proof that we used during the nondirectional proof, logic says that if in nondirectional operation we measured an inverse field of 195 mV /m along the radial (which we did in the example shown in Fig. 4 -5), then a ratio between the two actually measured points (DA and nondirectional) and the inverse fields determined along this radial should exist. In- deed, this is the case.
Each DA measurement is divided by the nondirectional measurement made at the same point. The ratio is entered in the column provided for it as shown in Table 6 -1. An average of all these ratios is then made. That is, all of these ratios are added and the sum is divided by the number of measured points. In the example cited there are 35 points measured in both the DA and nondirectional modes. The nondirectional inverse field is then multiplied by the average ratio to de- termine the DA inverse field along this radial. The average
160
www.americanradiohistory.com

Table 6 -1.The DA and Nondirectional Measurement Data for the 270 -Degree Radial.
RADIO STATION XYZ RADIAL: 2700
1 kW DA -D 1120 kHz DATE: 9-8-72 NON D 9 -22-72 DA
Point Distance NON -D Time DA Time Ratio (Miles) mV /m (EDT) mV /m (EDT) DA /NON -D
1 0.25 702 0835 2 0.30 590 0844 3 0.40 409 0848 4 0.50 337 0853 5 0.60 273 0859 52 0902 0.190 6 0.70 234 0908 58.5 0909 0.250 7 0.80 196 0916 38 0916 0.193 8 0.90 186 0926 34 0922 0.183 9 1.0 156 0933 34 0929 0.218
10 1.05 152 0939 32 0935 0.210 11 1.20 148 0950 29.5 0944 0.199 12 1.30 136 0958 25 0952 0.169 13 1.40 115 1007 25.5 0959 0.222 14 1.50 97 1014 19.25 1007 0.198 15* 1.65 90 1021 16.50 1013 0.183 16 1.70 89 1031 19.50 1018 0.219 17 1.80 80 1040 11.25 1024 0.140 18 1.90 73 1049 13.00 1029 0178 19 2.00 66 1057 12.50 1038 0.189 20 2.20 58.5 1202 11.70 1059 0.200 21 2.40 51 1209 10.25 1106 0.201 22 2.60 43 1218 9.70 1113 0.225 23 3.00 39 1225 8.50 1119 0.217 24 3.50 29 1238 6.90 1126 0.238 25 4.00 24 1247 4.80 1135 0.200 26 4.75 17.5 1255 3.15 1143 0.180 27 6.25 9.50 1311 1.85 1152 0.194 28 6.75 -8.00 1320 1.50 1158 0.187 29 7.05 7.10 1328 1.42 1208 0.200 30 8.25 5.30 1339 1.15 1217 0.217 31 8.95 4.30 1350 0.96 1224 0.223 32 10.05 3.50 1404 0.60 1234 0.171 33 11.45 2.70 1414 0.49 1245 0.182 34 13.10 2.05 1427 0.397 1253 0.194 35 14.50 1.50 1439 0.330 1300 0.220 36 16.10 1.25 1452 0.250 1311 0.200 37 17.10 1.10 1505 0.213 1316 0.194 38 18.60 0.91 1517 0.172 1324 0.189 39 19.20 0.83 1533 0.165 1333 0.199
NOTES: Average ratio = 0.199' 195 x0.199 =38.8 mV / m *Monitor Point
in the example is 0.199, and the inverse field along this radial for DA operation is 38.8 mV /m at one mile (0.199 x 195 = 38.8).
Each directional measurement is now plotted on a new sheet of 2.2 x 7 -cycle log -log paper in the same manner as the nondirectional measurements. (See Fig. 6 -3.) Again, care must be used in the proper positioning of points on the graph as to exact value and distance. By use of a light box, or other means, the plotted points are compared to the proper FCC ground -wave field- intensity-vs- distance chart.
161
www.americanradiohistory.com

162
Ra
a
a
i
r
Z .4w ow
ÿQQ'
1
r
1
E E 82 2 R
W/AW o.mn4. 10
r
www.americanradiohistory.com

; .
a
1.1
s. 8 8 8 S: dddd
11111111
HiMhI
II
hulk 101111
I III MTh! UW s:-
ENE IHIPI 2: igh lUll psi
muu, or rnft
IL moue mimuloa ..... o o C:
0
w / A w
163
www.americanradiohistory.com

When the plotted points are properly positioned, using the same ground conductivity curves for the radial as used in the nondirectional proof, the inverse -distance line on the FCC chart should be seen to cross the one -mile distance line on our plotted data at 38.8 mV /m. as you can see, the points all lie in a cluster. Because of scattering, some will lie above the ground conductivity curve and some below. Still others may lie right on the line.
Remember, the same values of ground conductivity must be used when analyzing the DA proof as were determined in the nondirectional proof for a particular radial. There usually will be considerably more scattering of these points around the conductivity curve than there was for the nondirectional mode. This is normal and is because the DA radiation is less of a point source than was the nondirectional radiation. It is also caused by small amounts of reradiation from objects near the measuring point. The effect is usually more pronounced in deep nulls than it is in the major lobe of a DA system.
Check the position of the monitoring point on the plotted data in relation to the ground conductivity curve. Ideally, it should lie close to the curve; in our example, it does. If it is way above or below, in all probability it is being influenced by some external effect. Any changes that occur in this ex- ternal effect will show up in changes in the measured field on this point. Therefore, changes in measured field on this point might not necessarily reflect a change in inverse field along the radial. The end result is headaches. Selection of a new point is easier to accomplish now than later.
It is from this data that the FCC will derive a maximum permissible value of mea §ured field for this monitoring point. It will appear on the station license. The maximum value of measued field that could be assigned to the monitoring point in this example is 19.1 mV /m (point No. 15 in the tabulated values shown in Table 6 -1). This is determined by the follow- ing:
measurement at MP measured DA inverse field X specified maximum DA inverse field
164
www.americanradiohistory.com

where X is the absolute maximum that can be assigned to the monitoring point (MP).
If all points went up in direct proportion to each other, when the value of this monitoring point reached 19.1 mV /m,
the inverse field along this radial would be 45 mV /m at one mile. Very seldom does the Commission assign a tolerance that is this lenient, however. In all probability, a value that is
5 -10 percent above the measured value of 16.5 mV /m will he assigned.
The DA data for each of the radials measured in the non - directional proof is prepared and analyzed in the same man- ner. Measurements made in the major lobe will have ratios larger than unity. They are handled in the same manner as those in the nulls (or minima» and the minor lobes. The average ratio is multiplied by the nondirectional inverse field to determine the DA inverse field.
DETERMINING RMS
FCC rules require that antenna systems must meet cer- tain minimum values of efficiency. Efficiency is expressed as
the rms (root mean square) value of radiation. When a non - directional antenna is used and its pattern is circular, the way it should be, the rms is the inverse field produced at one mile. Minimum acceptable values of rms are referred to 1 kW in the FCC rules. When it is desired to compare rms values of radia- tion for powers other than 1 kW the following will apply:
Vpower in kW X measured rms = rms value of radiation for 1 kW
When the pattern for a nondirectional antenna is drawn on polar coordinate graph paper, it is a circle. In the example shown for the nondirectional proof, a value of 195 mV /m at one mile is the inverse field. Thus the radius of this circle would be 195 mV /m expressed on polar coordinate, paper. This circle has a given area. When the DA pattern is plotted using the same scale, it too will have a given area. If the area of the DA and nondirectional patterns were the same, the DA radiation pattern would have an rms of 195 mV /m.
165
www.americanradiohistory.com

Table 6 -2. Data to Facilitate the Calculation of RMS.
0 E E2 O E E2
0 37.5 1,406 180 284 80,656 10 25.5 650 190 308 94,864 20 20 400 200 339 114,921 30 21 441 210 360 129,600 40 25 625 220 370 136,900 50 21 441 230 365 133,225 60 20 400 240 341 116,281 70 25.5 650 250 306 93,636 80 38 1,444 260 271 73,441 90 50.5 2,550 270 224 50,176
100 55 3,025 280 170 28,900 110 50.5 2,550 290 110 12,100 120 42.5 1,806 300 57.5 3,306 130 37.5 1,406 310 37 1,369 140 62.5 3,906 320 40.5 1,640 150 115 13,225 330 50.5 2,550 160 168 28,224 340 57 3,249 170 224 50,176 350 52.5 2,756
1,192,895
1,192 895 = 33,135 2 36
rms= 33,135 = 182mV/m
While the area of the circle is relatively easy to determine, the irregular DA pattern is another matter. A polar planimeter is an instrument used for determining the area of irregular figures, and it can be used for this operation.
Another method of determining rms values of radiation is to square the inverse field value at intervals of every 10 degrees of the radiation pattern (measured pattern) and extract the square root of their average. In order to maintain accuracy, it is a must that values of inverse field for at least every 10 degrees of the radiation pattern be used.
The formula is
rms =V E102-1-
n
where rms = root mean square value of radiation in mV /m E10, E20, E30, etc. = the inverse field value for each azimuth n = total number of azimuths
When using this formula with inverse field values every 10 degrees, there are 36 values of E2 and n becomes 36. The use of a small electronic calculator greatly aids in this process. A table such as Table 6 -2 is set up to facilitate these calcula- tions. "Column A" shows the azimuth, "column B" the in-
166
www.americanradiohistory.com

verse field value, and "column C" the square of "column B." All of the figures in "column C" are then added; their sum is divided by 36. The square root of this average of all fields squared is the rms. The values of inverse field used in this ex- ample were taken from the plotted antenna pattern shown in Fig. 6-4. Its rms value has been determined to be 182 mV /m.
The consultant will show a theoretical value of rms on the calculated radiation pattern. He has determined this from the
50' 310'
20' 290'
27
100' 260'
HO. eso'
120' 240'
130' 230'
140' 220'
Fig. 6 -4. Determination of rms.
167
www.americanradiohistory.com

tower heights, spacings, current ratios, phases, transmitter power, and assumed losses in the system. The rms value of radiation from a directional antenna system can be higher or lower than that from a single vertical radiator, of the same height.
If the measured rms value of radiation is appreciably lower than the calculated value, there is obviously an ex- cessive power loss in the system. In a new array with an ade- quate ground system, these losses result from misadjustment of one or more of the base coupling or phase -control networks. In an older array, this condition can sometimes be traced to a deteriorated ground system.
In an array where there is a tower with a negative driving - point resistance, the first place to look for a misadjusted network is at the base coupling and phase -control nets used to return power to the common point of the DA system. When dealing with this situation, remember that the radiator "looks like" the source of energy (the transmitter) and the phase - control network "looks like" the load. Power is actually being picked up by the element and being returned to the phasor. In most cases, the arrangement used to return this power to the system ends up being somewhat of a compromise -inefficient to say the least.
Run the transmitter for a few minutes into the antenna system, turn it off, and check each component (coils and capacitors) for any signs of heating. Any heating noted is power not being radiated. The more heat, the more lost power.
If the rms value of radiation is higher than the theoretical value, yóu should carefully check for an error in the de- termination of inverse field or the calculation of either theoretical or measured rms. If the higher value of rms is apt
- to cause a problem, a resistor might have to be inserted in series with the common -point network to absorb the extra radiation. Measured rms in a properly installed and adjusted array should be within 5 percent of the theoretical value.
PREPARATION OF DATA FOR SUBMISSION TO THE FCC
In addition to the information required on the standard FCC license application form, an engineering exhibit contain-
168
www.americanradiohistory.com

ing all of the information gathered in the nondirectional and DA proof -of- performance measurements must be submitted. Section 73.151 of the FCC Rules and Regulations covers the required data in depth.
A tabulation of the DA and nondirectional field intensity measurements made on each radial is required. A tabulation such as that in Table 6-1 "Determining Inverse Field" will be sufficient. Point number, distance, DA and nondirectional measured field, DA/nondirectional ratio, times and dates, and an indication of which point will be used as a monitoring point (if required) must be shown.
Analysis of each DA and nondirectional radial on log -log paper as previously described must be included. The measured radiation pattern for both the nondirectional and DA modes, plotted on polar coordinate graph paper, will be part of the exhibit. A statement of the rms value of radiation as well as a tabulation of the measured DA inverse fields is also necessary.
Antenna resistance and reactance measurements made every 5 kHz out to 30 kHz above and below the operating fre- quency must be tabulated and graphed (Fig. 6-5). This is done for the base resistance and reactance of the tower used for the nondirectional proof and for the common -point input for the DA system.
A tabulation of the phase relationship of each element to the reference element, as indicated on the phase monitor, is required. The relationship of each loop to the reference tower's loop current must be shown. The actual value of base currents and their ratio to the reference element's base cur- rent must be part of the exhibit. Any large discrepancies between loop current ratios and base current ratios must be explained. Also, any base current ratios or phases that deviate substantially from the theoretical values must be fully ex- plained. Section 73.151 repeatedly refers to the standard radiation pattern. This means the theoretical radiation pattern submitted in the application for a construction permit.
All of the topographic maps used in making field intensity measurements will be included. Although not specifically re- quired, the topographic map index showing the actual maps used should be made part of the record. The location of each
169
www.americanradiohistory.com

w U
80 Q H N
70 w
N 60 x
o 50
40
30
20
+20
+10
o
1090 1095 1100 1105 1110 1115 1120 1125 1130 1135 1140 1145 1150
FREQUENCY IN KHz
Fig. 6 -5. Common -point resistance and reactance graphs for sta- tion XYZ, 1120kHz, 1 kW, DA /D.
measuring point should be indicated by a number on the map that corresponds to the numbers on the tabulated data. The topographic quadrangle maps normally used for these measurements are rather large (roughly 2 x 2 ft). The Com- mission will accept duplicates reduced to half -size. Maps showing the measured 25 and 5 mV /m contours must also be included.
A photograph of each monitoring point showing pertinent landmarks must be submitted. The field intensity meter in its measuring position must be in the photograph. A map show- ing the approaches to each monitoring point along with an ac-
170
www.americanradiohistory.com

curate description of the point and how to get there must be supplied.
The accuracy, date of the last calibration, and name of the company or person that last calibrated each field intensity meter and rf bridge must also be submitted.
A notarized statement containing the name and address of the engineers making the measurements is also required and the qualifications of each person participating in these measurements must be contained in the affidavit.
Any other data containing facts pertinent to the measure- ments must also be made part of the official record. The various examples shown here will aid in the preparation of this data.
171
www.americanradiohistory.com

Chapter 7 Directional Antenna
Maintenance Each DA system has its own pecularities. Because no two systems are identical, it is impossible to predict that a certain component will cause a definite trouble.
One becomes competent in maintaining a DA system by having a working knowledge of why it works and then apply- ing this knowledge to locate trouble when it develops. This chapter contains many tried and proven procedures for keep- ing the DA in good operating order.
INTRODUCTION TO DA MAINTENANCE The directional antenna system is probably the most com-
plex part of an AM broadcast station. Many components all fit together in a precise order to produce the current ratios and phases that determine the radiation pattern. In addition to this, the system is also subject to external influences. If any one of the components in the system is "ill," the overall "health" of the antenna system will suffer. It's up to you to diagnose the trouble and tend to its treatment before things get out of hand. Some arrays will operate for years with only a minimal amount of attention. Others utilizing many towers or producing deep nulls require more frequent checkups.
Probably the most important single piece of advice that can be offered is to watch for any signs of change that might indicate approaching disaster. For instance, a slight change in the common -point impedance will usually indicate that a com- ponent somewhere in the system has changed. Day -to -day vigilance in the form of visual inspections and careful record keeping of all operating parameters under various tem- peratures and weather conditions will keep you on top of the overall situation.
When an array is new, or at least while it is operating pro- perly, extensive impedance measurements made on each
172
www.americanradiohistory.com

branch network should be recorded. Likewise, transmission line currents at both ends of the lines might be of value later to isolate problems.
MAINTENANCE EQUIPMENT Proper care of the directional antenna system demands
that certain pieces of equipment be available. It also demands that a thorough working knowledge of this test equipment be acquired. While it may sound ridiculous, there are radio sta- tions that have an rf bridge on the equipment shelf but no one who knows how to use it!
A dummy load capable of dissipating the full transmitter output power is a valuable piece of test equipment. In addi- tion to providing ease of transmitter maintenance, it will serve as a quick and decisive means of separating transmitter trou- ble from antenna trouble. The ideal situation is when the dummy can replace the antenna with the push of a button. The dummy load resistance should be the same as the com- mon -point resistance of the antenna, and its reactance should be zero. With the aid of an rf bridge, the resistance can be de- termined and any reactance present can be canceled with a series coil or capacitor. Under the conditions just described, when the input to the DA system is replaced by the dummy load, transmitter operating parameters should remain cons- tant. An rf ammeter should be part of the installation so that power into the dummy load can be determined.
An if bridge is the most important single piece of test equipment for the station using a DA system. There are two types of these bridges available. The General Radio 916 -AL bridge requires a signal generator and null detector to be used in conjunction with it. The in -line bridge, also called an operating bridge, can use the transmitter as a signal source, and it has a built -in meter to serve as a null detector. One such bridge is manufactured by Delta Electronics. In addition, the in -line bridge can also be used with an external signal generator and null detector if desired.
Exact values of resistance or reactance (capacitive or in- ductive) can be determined with either of these bridges. Both types of instruments have their advantages, and where the budget will permit, both are advantageous to have. The
173
www.americanradiohistory.com

operating type bridge enables you to determine the driving - point impedance at the base of each tower while the array is in operation.
A properly operating field intensity meter is a must. Most licenses issued by the FCC where a directional antenna is
used carry a condition that requires a properly operating field intensity meter to be available at all times. Since the calibra- tion of such an instrument is no simple matter, it is a smart idea to check yours against that of a neighboring station at fre- quent intervals -say, every 6 months or so. Any discrepancy in readings should be promptly investigated.
Two -way radio equipment, while not an absolute necessi- ty, is a valuable accessory to the maintenance of any station. Class D citizens band radio equipment is the most economical solution and will usually provide adequate communications with the monitoring points.
A complete schematic diagram of the entire directional antenna feeder system is essential. The value of all compo- nents should be shown. Knowing the total inductance or capacitance of each component and the actual measured values will save precious time when diagnosing trouble.
While possibly not a maintenance item, an old headphone with a diode and a clip lead for an antenna will serve you well when making base current readings. More accurate readings and ratios will be obtained when the base currents are read under no- modulation conditions (as required by the FCC). When the clip lead is attached to a grounded object close to the LTU, programs will be heard loud and clear.
PREVENTIVE MAINTENANCE
Every engineer or technician that works in the field of broadcasting knows the importance of spotting potential trou- ble and correcting it before it causes "dead air" time. The radio station is a long chain, starting with the microphone and ending with the antenna system. Links in this chain include microphone cords, audio consoles, telephone lines, audio - processing equipment, and the transmitter. A failure of any one of these links will cause complete failure of the entire system, so it is foolish to let a frayed microphone cord remain unrepaired after it has been observed. Failure of this link can
174
www.americanradiohistory.com

cause an outage just as easily as failure of the transmitter. This holds true for the entire DA system as well, since it con- tributes several links to the overall chain.
Preventive maintenance of a DA system starts with ac- curate record keeping Day -to -day and week -to -week varia- tions of operating párameters, including monitoring point readings, provide useful information for spotting trouble. A
current ratio that constantly edges upward is trying to tell you something. If the records show that the current ratio was high only one day when there was a snow drift covering the base insulator, it means little. A notation of weather conditions and temperatures kept along with the normal required data on base -current ratios, loop currents, etc, will enable you to con- firm whether the change indicates an approaching disaster or just an unusual circumstance.
Frequent inspections of the entire system will show up minor faults while they are still minor. Loose hardware on capacitors, meters, etc. will eventually cause an open connec- tion. Burned coil clips or burned spots on roller inductors will sooner or later fail completely. Lightning gaps across tower bases (horn gaps or ball gaps) can cause a short if they become loose. Extremely dirty insulators that support the sampling lines on each tower or insulators that support coils and capacitors in the LTU will cause the chain to break if they arc over. Base insulators under certain climatic conditions become coated with grit and grime from nearby industrial plants. Under these conditions, periodic cleaning is necessary.
Rodents find tuning houses fine places to set up housekeeping. The straw and debris that accompany their vis- its can cause strange things to happen to phases and currents. By all means, make the LTU rodent proof and keep it clean.
Loose conduit connections near tower bases can cause phases to change. A periodic check of these connections, where they are in high rf fields, will save trying to track down unaccounted -for happenings.
Weed control around the base of each tower should be considered preventive maintenance. A large amount of vegetation will cause a change in the base reactance of the tower. A change in reactance will be accompanied by a change
175
www.americanradiohistory.com

in phase. This will be especially true where the towers are considerably higher than 90 degrees. If permanent provisions to control weed growth during the initial installation have not been taken, periodic application of weed killer must be made. Under no circumstances should vegetation be permitted to grow tall enough to touch the tower. To preclude any chance of changes occurring due to weed growth, the vegetation above the entire ground system should be controlled. Weeds 5 ft or more in height are certainly undesirable. Uncontrolled growth of tall trees in the ground field is also undesirable. Summer -winter variations in radiation are apt to occur when an 80 ft tree stands 40 ft from a 150 ft tower!
Periodic inspection of the ground field for broken radials should be made. If both ends of a broken radial can be found, braze (do not soft -solder) a section into the radial and properly bury it. When only one end can be found, cut it off and bury the broken end to prevent its being pulled out completely.
Ground connections to metallic fencing around the towers should be the object of an occasional inspection. A nonexistent ground can make the fence "hot" with rf and cause changes in the operating parameters of the array. Several connections from the ground system to the fence will minimize this possibility.
Static drains on all towers should be periodically checked with an ohmmeter. This is especially true after an electrical storm. If a series string of resistors is used for this function, it is not unusual to have one open up. Open static drains are open invitations to lightning and static discharge damage.
A systematic check of all components for unusual heating should be made at periodic intervals immediately after signoff. Excessive heat buildup in a coil or capacitor indicates trouble.
TRANSMISSION LINES Keeping in mind that the transmission line to each tower
in the DA system contributes a certain amount of phase lag, it becomes obvious that any change in the velocity factor of the line will cause a change in the indicated phase angle. If the lines are pressurized, any drop in pressurization or excessive cycling of the dehydrator unit should be investigated. A hole
176
www.americanradiohistory.com

in the line or a leaking end seal will cause this phenomenon. A solution of soap and water applied with a paint brush is an ef- fective means of locating an air leak. If the transmission line is not pressurized, a check with an ohmmeter between the shield and center conductor (with both ends of the line open) will show if excessive moisture is in the cable.
When the array is new (or at least operating properly), measure the resonant frequency of each transmission line. Make a record of both the open and shorted resonant frequen- cy. The rf bridge will give an accurate reading of resonant fre- quency when the measured reactance is zero. Keep this data, as it can later verify suspected transmission line trouble. Resonance measurements on an open or shorted transmission line and a knowledge of the line's velocity factor can de- termine the approximate distance from the measuring point to the fault.
Make sure of the ground connections to the outer conduc- tor of the lines at both ends. This connection must be made with at least 2 in. copper strap. If either of these connections fails, the transmission line is apt to radiate as much as the an- tenna system. If the lines are installed above ground level, the ground connections that should be part of the system every 20 ft or so should also be periodically checked.
In some older arrays, open -wire transmission line is used. Periodic inspection of the insulators is a must. Any sagging of the individual wires making up the line in a multiwire system should be corrected without delay.
MAINTENANCE AND TROUBLE SHOOTING THE PHASE- SAMPLING SYSTEM
A faulty phase -sampling system can cause more apparent directional antenna trouble than any other single item. The sampling system should be more stable than the DA itself if it is to serve you well. If it is unstable and subject to frequent er- ror, it will become a potent counterforce to proper DA opera- tion.
When the array is new, or at least operating properly, measure the resonant frequency of each sample line and its associated pickup unit with an rf bridge from the input con- nector at the phase monitor. If the lines are of equal length
177
www.americanradiohistory.com

and all of the pickup units are electrically identical, all should be very close in resonant frequency. When the lines are not of equal length, this information (gathered when the array is functioning as it should) will also provide valuable data should trouble develop later. Note the results of these measurements in the file with the phasor and feeder system instruction book, prints, etc.
When suspected trouble does develop in the sampling system, a check with the rf bridge of the resonant frequency of the lines will confirm or deny it. If your suspicion is con- firmed, the rf bridge can be taken out to the pickup units and each of these measured. The results of these two tests will point the finger to either the sample line or the pickup unit.
A similar method, using an extra piece of cable as described in the section "Calibration of the Sampling System," can also be used to good advantage. If the array was built and in operation before you came on the job, make up a length of cable and check each sample line when things are operating correctly. Record this data.
Water in sampling lines and lightning damage to coaxial connectors are the most frequent causes of sampling- system error. Make sure that all exposed connectors are sealed with GE Silicone Seal or a similar product. Water in the line will change its velocity factor, loss, etc. This in turn will change the phase or loop current indication on the phase monitor. Air dielectric lines should be pressurized and properly sealed at each end. Any decrease in pressure should be promptly in- vestigated.
Pickup loops (if used) are subject to exposure to the ele- ments, thus slow deterioration. Lightning can cause the shielded type of sampling loop to become shorted. Coaxial connectors used between the loop and line are also subject to lightning damage.
The loops should be occasionally checked for mechanical stability. A loop free to move in the wind will most certainly cause very strange indications of current and phase on the monitor. Current transformers are less prone to these troubles, primarily because they are independent of the weather. However, they are not completely above suspicion if the sampling system goes bad.
178
www.americanradiohistory.com

The type -accepted phase monitor, called the antenna monitor in FCC terminology, should cause little or no trouble. A periodic calibration check as outlined in its instruction book should be performed. When not actually reading phase, return the meter switch to off. Lightning at or near the towers can cause a tremendous amount of current to be induced into the pickup unit and transferred back to the monitor with dis- astrous results. When the selector switch is off, the relays dis- connect all sample lines from the monitor. While this is not complete protection, it is certainly better than having a direct path into the solid -state circuitry. Switch and relay contacts in the monitor will require occasional cleaning.
MONITOR POINTS The license for a station using a DA system will specify
certain monitoring points, their exact location, the maximum allowable amount of radiation, and the time intervals at which they must be measured. A new license will require them to be measured at least once every 7 days. After the array has been shown to be stable over a period of time, upon proper applica- tion the FCC will permit the monitoring points to be read on a monthly basis. These points will show some variation from day to day and season to season. However, the measured field, under normal circumstances, should not be permitted to ex- ceed that specified in the station license. In some parts of the country, severe icing is experienced during the winter. When the towers, guy lines, and base insulators are covered with ice, some variation in phase and current in the radiators must be expected. When this occurs, it is normal to see the monitoring points change in value. Do not attempt to make any adjust- ments under these conditions -in a few hours, you will be try- ing to put things back where they were! Enter a proper nota- tion as to the cause in both the operating and maintenance logs.
When a monitoring point consistently exceeds the max- imum value of radiation permitted in the station license, steps to determine the cause must be taken. When all currents and phases are correct, the most likely cause is a change in ground conductivity between the DA system and monitoring point. This is especially true if the change is seasonal (summer to
179
www.americanradiohistory.com

winter). A session with your consultant will help solve this problem if it exists. Quite possibly, by submitting additional information to the Commission, a new maximum value of field intensity can be assigned to this point.
When a monitoring -point reading changes abruptly, look around for new construction. The installation of new power or telephone overhead wires can cause this to happen. Likewise, underground pipeline construction has been known to alter the field at monitoring points. The construction of tall struc- tures close by a monitoring point will also cause a change in the measured field. When you suspect that this might be the case, measure a couple of other points used in the original or last complete proof, on the same radial. If the measured field at these alternate points is in substantial agreement with the original measurements, chances are very good that the monitoring point has become unusable.
It is not a bad idea to establish one or more alternate monitoring points on each radial that has a specified point. These alternate points should be read each time the legal monitoring point is measured. Armed with this data, it is an easy task to determine if the trouble is just a monitoring point problem or if the array has drifted out of adjustment.
Printed forms, which will become part of the main- tenance log, should be provided on which to record the monitoring -point data. Besides logging the date, time, and value of measured field, space should be provided to record weather conditions, temperature, and the serial number of the field intensity meter used to make the measurements. The lat- ter information is especially Useful if the station has more than one field intensity meter.
Any unusual condition such as 3 ft of snow on the ground or 6 in. of rain in the last 24 hours should be recorded under "remarks." Each log must also be signed by the engineer mak- ing the measurements.
This data will prove to be a valuable asset in determining the overall long -term stability of the array. If a monitoring - point reading suddenly jumps upward when the ground freezes, a quick check of the record for the years before will indicate if this is a usual occurrence or something to be wor- ried about.
180
www.americanradiohistory.com
A periodic check of a known point in the major lobe, even though not legally required, can show up problems that otherwise might go unnoticed until disaster strikes. Points in the major lobe, out 2 miles or so, should remain fairly cons- tant. This can be used as a rough check on the accuracy of the meter. A serious dropoff in the measured field of such a point could indicate a decrease in the rms value of radiation from the array.
Monitoring -point readings are a check on the end product produced by the DA system. Any variations in phase or cur- rent ratios should be verified by reading the monitoring points before any adjustment is attempted. If there is no change in the value of the measured field, chances are pretty good that the phase or current indication is in error. WHAT TO STOCK AS SPARES FOR THE DA
The obvious and complete solution to the inventory mat- ter is to stock a replacement for every component used in the DA system. From an economic and practical standpoint, it is usually impossible to do this. Some components in the DA system are relatively free from sudden failure. Vacuum capacitors fall in this category. The desirability of tying up a considerable amount of money in spares for these very ex- pensive items is questionable.
Mica capacitors are a different story. A sufficient number of spares that can be used (individually, in series, or in parallel) to make up any value of capacitor in the system should be stocked. Mica capacitors are subject to destruction by lightning and sometimes fail for unknown reasons. By keeping spares on the shelf you will save money due to down time. Be careful of the current ratings when connecting these capacitors in series or parallel.
Coil clips, rollers on variable coils, and the copper con- necting strap are other sources of mechanical trouble. A loose coil clip or roller will eventually burn off. While a good pre- ventive maintenance program should turn up loose nuts and bolts, occasionally one will slip by. Electrical storms are another source of burned clips. These items are relatively in- expensive; keeping one or two of each type used in the system is cheap insurance.
181
www.americanradiohistory.com

Measure the reactance (either at your operating frequen- cy or at 1 MHz) of each new capacitor to be kept as a spare. Mark the measured value on it. As suggested earlier, the reac- tance of each capacitor in the system should also be measured and marked. When a failure occurs, try to replace the capacitor with one as close in reactance as possible. The G -series capacitors are ±5 percent in value. In some applications, this slight difference in value between a new and old capacitor will cause a significant shift in phase or current in a radiator, necessitating adjustmegt of the operating parameters. If this is necessary, the common -point impedance should be rechecked.
Most DA systems use a considerable number of ribbon - wound coils. Complete destruction of these coils is rare, although a direct lightning hit can do the job. One large coil of sufficient current -carrying capability and inductance to sub- stitute for the largest coil in the system will serve as an ade- quate spare for emergencies. It should be equipped with a strap and clip for setting it to needed values.
Where a series string of resistors are used for static drains, some spare resistors of proper value should be stocked.
Spare rf ammeters, one of each full -scale range used in the system, are valuable tools for troubleshooting and will serve you well when a meter in the system opens or goes out of calibration.
If relays are used to switch from nondirectional to DA or day to night operation, the microswitches controlling them can become troublesome. Where the microswitches are tied to the interlocks of the transmitter to prevent application of power during switching (now required where Third -Class operators are used), failure of the switch is just as bad as failure of the relay. While the switch can be temporarily jum- pered, a spare is still a good investment.
WHAT TO DO IF OPERATING PARAMETERS CREEP When the current or phase in a DA system appears to
slowly move, or sometimes jump a degree or two in value, the best advice that can be offered is: Don't adjust anything until you have determined if a discrepancy really exists.
182
www.americanradiohistory.com

A classic example might be a 5- degree phase difference at sign -on from what existed 6 hours earlier. Do not wind up the phase 5 degrees until you have made a few other checks. The change might be attributable to phase- sampling or phase- monitor error. A change in phase will usually be accompanied by a change in the current ratio. Read the base currents. A 5- degree change in phase will show up in monitoring point readings. Check the monitoring points. A 5- degree change in phase on one tower in a multitower array will usually be accompanied by a lesser change in phase on one or more of the other towers.
If the change in indicated phase is determined to be a sampling error, check each sampling pickup unit visually and electrically. Phase monitors have termination resistors on each line at the monitoring input. Make sure that this resistor is not open. A quick check can be made by changing the sampling line to another input on the monitor and reading phase. (Don't forget to adjust the input -level control.) If the resistor is open, the phase indication will be correct on the other input.
If it is determined that a change in phase or current ratio actually did take place, check each capacitor associated with the offending radiator for any signs of heating immediately after signoff. A change in capacitance that will cause only a small change in phase will be hard to determine on the rf bridge, as it will cause only a minute change in reactance.
Sometimes an ailing mica capacitor will read high on the resistance scale of the bridge. Any capacitor in the system that reads upward more than one ohm on the R -scale of the bridge should be suspect. You should locate the drifting component in the system rather than just make an adjustment to compensate for it. Probably, in a few days or weeks it will again change value; possibly a large change will take place, causing the operating parameters of the array to exceed their legal tolerances.
Many times a mica capacitor will change value slowly over a period of hours. This will be manifested by a change in phase of 2 or 3 degrees during the day. This is a warning that the capacitor is getting ready to fail completely. If spares are
183
www.americanradiohistory.com

on hand, replacement of the suspected capacitor can prove effective. Substitute only one capacitor at a time and watch the parameters for a day or so. If the drift stops, you have found the trouble. If not, put the original back into service and go on to try another. A condition of this type is very difficult to pinpoint using an if bridge to measure capacitors in the system. The value of the capacitor changes slowly and only when subjected to the heating caused by leakage through it.
On the bench, it is apt to check out as perfect. New capacitors should be within 5 percent of their
marked value. Under the worst condition, this might mean a 10- percent difference in value (one +5 percent and another -5 percent) of two perfectly good capacitors. When this difference exists and you substitute capacitors, some slight readjustment of the operating parameters might be necessary. This is why it is a good idea to measure the reactive value of all capacitors in the system with an rf bridge and mark each with its exact reactance. Use one frequency as a standard. One megahertz is not a bad choice, unless your operating frequency is close to that (1000 kHz). The idea behind this is
to later check all spares in the same manner. By staying clear of the operating frequency, you will be able to use the rf bridge, and its associated null detector to check spares, etc. in the transmitter building while the transmitter is on the air. The choice of one megahertz has the obvious advantage of facilitating conversion from ohms of reactance to microfarads with the least amount of arithmetic: C(uF) = 0.159/X,. The rf
bridge also requires a correction factor to be applied when measuring reactance. This factor is frequency sensitive and is
most easily handled mentally when using one megahertz. Although mica capacitors quite frequently are the
offending components when creeping parameters are encountered, deteriorating ground connections, loose connections to coils, and faulty lighting chokes (among other things) can cause the same symptoms to appear.
Base current rf ammeters do not last forever. If a base current ratio creeps up or down, the accuracy of the indicating instrument should be checked. This is especially true if the loop current ratio has remained stable. Check the meter against one of known accuracy.
184
www.americanradiohistory.com

If all current ratios in a multielement array seem to move
up or down by the same amount, take a good look at the re-
ference tower's base current meter. This also goes for an in-
dicated shift in phase in all elements by the same amount in
the same direction (i.e. all more negative or all more
positive). Symptoms of this nature point to the possibility of
trouble in the reference tower's current -sampling device or
sampling line. For example, in a 3 -tower array where the phases are
+60, 0 (reference tower), and -60 degrees, trouble in the re-
ference tower's current- sampling device or line might be in-
dicated by phase readings of +65, 0 and -55 degrees. This is
an indication of a possible 5- degree shift, in the negative
direction of the reference tower's input to the phase monitor. A similar shift in loop current ratios by the same amount in all towers would also seem to indicate trouble in the sampl- ing system of the reference tower. This is easily verified by checking the base currents. Any of these indications, after discounting a shift in the actual operating parameters by measuring monitoring points, could also be attributed to ac=
tuai phase- monitor trouble. All of the steps outlined here may seem like a lot of trou-
ble. Some engineers prefer to just forget that any changes in the system ever occurred or to adjust the controls so that all appear normal again. Remember: When something \ hanges, there is a cause. If the cause is determined and rectified, that's the end of it. When it is ignored or covered up by dial winding, it will get worse. This is similar to taking aspirin to deaden the pain of a serious illness. Sooner or later, other problems will occur, and instead of having only one problem to deal with, there may be many complications. Eventually, this can result in having to completely retune and reproof the system at considerable expense.
WHEN DISASTER STRIKES!
Eventually, at 6 a.m. or sign -on (whichever is earlier) the phone will ring and you will be astounded at the currents and phases read to you by the man on duty. Any resemblance between what they should be and what they are will be purely coincidental.
185
www.americanradiohistory.com

When a sudden failure of this nature takes place, you will eventually find that it's due to only one component in the system going bad. When this happens, all currents and phases will be askew due to the mutual coupling which exists between towers and the internal coupling of the feeder system in the power divider. The common -point current will be crazy as well as the loading on the transmitter. Careful scrutiny of the phases and currents in a multielement array will disclose that the current and phase in one element is
farther out than the others. When this is observed, you have isolated the element and
the feeder system in which the trouble lies. A visual check of all components associated with the offending part of the system should be the first order of business. Everything from the simplest shorted spark gap on a tower to a shorted or open transmission line will cause these symptoms to appear.
If the visual inspection fails to turn up anything, the first suspect on the list should be a mica capacitor. A change in the reactance value of a capacitor which upsets the operating parameters of the array to the extent alluded to here will be easily identified when the capacitor is measured on an rf bridge.
When all capacitors have been excluded as the cause, the transmission line should be checked with an ohmmeter for an open or short. Johnny -ball insulators in the guy wires have been known to fail during electrical storms. When this hap- pens, the cause might not be apparent. If the insulator is one next to the tower, the 50 ft or so of guy wire to the next in- sulator becomes part of the radiating system.
This can be identified by measuring the self- impedance of the tower, unless the insulator arcs only when rf power is ap- plied. If an arc of this magnitude occurs, it will be visible in darkness or it will emit an audible sound. Except for signs of arcing, the insulator may appear to be in perfect condition.
If a faulty capacitor has been identified and replaced, measure the rf current to which this component is subjected by inserting an rf ammeter in series with it. Mica transmitting capacitors have current ratings which cannot be exceeded without either a slow change in value or a sudden, catastrophic change (perhaps even total failure). When a failure occurs
186
www.americanradiohistory.com

a drastic change in the operating parameters occurs. If it is de- termined that the current rating of a capacitor is insufficient, it should be replaced by one of the same reactive value with a higher current rating. (See the section on phasor considera- tions for more data.)
A radical change in transmitter loading and common -point current not accompanied by changes in phases or current ratios can be attributed to transmitter problems or the failure of a component in the common -point matching network of the DA system. Note that current ratio was mentioned, not actual currents or loop currents. This problem can be easiest isolated by operating the transmitter into a dummy load or by operat- ing an auxiliary transmitter into the antenna system. If the main transmitter functions properly on the dummy or the aux- iliary acts strange on the antenna, you have common -point matching- network trouble. The failure of a component in this part of the system will cause a change in the impedance that the transmitter sees, thus a change in the actual loading of the transmitter. Phase and current ratio will remain unchanged. This network is common to all of the tower feeds. Actual base and loop currents will, however, be abnormal.
VECTOR ANALYSIS OF MONITORING POINTS There are occasions when all current ratios and phases as-
sociated with a directional antenna system appear to be normal. After eliminating changes in ground conductivity or monitoring -point conditions as the cause, it then becomes necessary to adjust the operating parameters of the system. The objective is to lower the amount of radiation on the monitoring points exceeding the maximum allowed, while at the same time keeping all of the other monitoring points well within tolerance. The actual lowering of radiation at the point in trouble is a relatively easy task -even in a multielement ar- ray. Almost any parameter moved in one direction or the other will lower this point. The fly in the ointment is that all of the other points will probably fluctuate during this procedure.
A vector analysis for each monitoring point enables you to make an intelligent decision on which parameter to adjust to accomplish the desired result. The vector analysis to be considered here is a presentation by means of drawings of the
187
www.americanradiohistory.com

3000 TRUE t
0.38 X440
DIRECTION OF 350 MP
700 © 700
1 0 /00
DIRECTION OF 2800 MP
0.98 -144°
700
120° TRUE 1
0.40/66°
Fig. 7 -1. Simplified illustration of vectors.
the addition of the tower- radiated field vectors at a specific azimuth angle.
Each radiator in the directional antenna system represents a vector quantity, which has a magnitude and a phase angle. The current ratios (or field ratios) are the magnitudes, and the phase of the currents the angle. As you move in a circle around the DA, the exact distance to each radiator changes. When distance changes, the phase lag of the signal radiated from each tower will also change at points on this circle.
As illustrated in Fig. 7 -1, if the observer is at an azimuth of 120 degrees true, tower 4 can be represented in the rela- tionship as 0 degrees; tower 3 is 70 degrees farther away due to its spacing, so it becomes -70 degrees; tower 2 is 140 degrees farther than 4, so it becomes -140 degrees; and tower 1 is 210 degrees farther from the observer than tower 4, so it becomes -210 degrees. Therefore, the radiation leav- ing tower 1 will have to travel 210 degrees farther than the radiation from tower 4 to reach the observer at any distance from the array on a bearing of 120 degrees. If we take the re- lative phase lags introduced by the added distance to the ob- server and add the electrical phase relationship of the respective towers to each, we have determined the phase angle of the radiation from each tower as it arrives at our ob- servation point. When you are on an azimuth where you are in line with the center line of the towers, this phase rela- tionship of one tower to the other is easily recognized. However, when the observation point is moved to another azimuth angle (not in line with the line of towers) the con- cept, although basically the same, is somewhat more difficult to visualize.
To determine this relative phase relationship of one tower to another at any point on the circle, we must de-
188
www.americanradiohistory.com

termine in electrical degrees how much closer we are to one tower than to each of the others in the system. This rela- tionship is called space phasing. It is dependent on the spac- ing between the elements in the system, the true bearing of the point on the circle from which we are observing (measur- ing), and the true bearing of the angle at which each tower lies from a point at the center of the array. This point does not necessarily have to be at the center of the array. For the sake of convenience, the center is usually chosen.
The formula for determination of space phasing is
SP = S cos 10 -0 where
SP = space phasing in degrees S = distance in electrical degrees to the tower from the center of the array
= true bearing of the tower in degrees from the center of the array O = the true bearing in degrees of the point on the cir- cle that we wish to analyze
Figure 7 -1 gives us the necessary data to determine the space phasing of the 4 -tower in -line array illustrated. The line of towers is on a true bearing of 300 degrees, and the spacing between towers is 70 electrical degrees. The two monitoring points which we will analyze are at 35 and 280 degrees true. The center point in this system is midway between towers 2 and 3. As can be seen, towers 1 and 2 lie on an azimuth of 300 degrees from the center point and towers 3
and 4 lie at 120 degrees from the center point. The data for each tower is as follows:
Tower Azimuth From Center Spacing of Tower to Point to Tower (Degrees) Center Point (Degrees)
300 105
300 35
120 35
120 105
189
www.americanradiohistory.com

The space phasing of each element at the 35- degree (tnie) monitoring point can be calculated for each tower.
SP = S cost - Tower 1 SP = 105 cos /300 ° -35°
= 105 cos /265° = 105 (- 0.0872) = -9° Tower 2 SP = 35 cos /1200-35°
= 35 cos /265° = 35 (- 0.0872) = -3° Tower 3 SP = 35 cos /120 ° -35°
= 35 cos /85° = 35 (0.0872) = 3°
Tower 4 SP = 105 cos /120 ° -35° = 105 cos /85° = 105 (0.0872) = + 9°
By adding the electrical phase of each tower (sym- bolized as q) to its value of space phasing, we will have the actual phasing of each element as it appears at the 35 degree monitoring point .The current ratio of each tower becomes the magnitude of the respective vector.
Spacing in Tower Degrees
Magnitude and Phas Electrical-Degrees of Tower Vectors
Phase (iß) at 35 degrees True 1 -9° 144° 0.38 /135°
2 -3° 0° 1.00 /-3°
3 3° -144° .98 -141°
4 90 660 0.40/75°
E2 =1.0/0°
REFERENCE AXIS
Fig. 7 -2. Vector analysis for a 4 -tower array at 35 degrees true.
190
www.americanradiohistory.com

With the aid of a protractor and ruler, each vector is then added by the use of drawings as shown in Fig. 7 -2. Starting with the zero axis, 135 degrees is measured off with the pro- tractor, and vector El, representing tower 1, is drawn using a length of 0.38 unit to represent magnitude. From the tip of vector E1, vector E2 is drawn at an angle of 3 degrees to a length of one unit for magnitude. The same procedure is then used for vectors E3 and E4 (representing towers 3 and 4), remembering that vectors with negative phase angles have moved in a clockwise direction. The unit of length that is used can be any size that is convenient. If it were one inch, then No. 1 magnitude would be 0.38 in. If the unit chosen were 4 in., then No. 1 magnitude (length) would be 0.38x4 =1.52 in.
The distance between the end of vector E4 and the start of vector E1 is the resultant radiation on the 35- degree monitoring point. Any adjustment of phase angle or magnitude that will bring the tip of vector E4 inside the dotted circle will decrease radiation on this point. An in- crease in the phase angle of E4, thus in the No. 4 tower phase, will accomplish this. Likewise, a positive shift in phase on tower 1, a negative shift in phase on tower 3, or an increase in the current ratio of tower 3 would accomplish the same. Tower 2 was not mentioned as, in this system, it is the re- ference tower and is not considered adjustable.
A careful study of the drawing will show that some ad- justments -e.g., a small increase in No. 4 current ratio -will have little effect on this point. Notes on the adjustments that will decrease radiation on the point can be made part of the drawing. To avoid misunderstanding when noting phase changes, it is a good idea to refer to them as more positive or more negative. In this example, an increase in No. 3 phase could be interpreted to mean a shift in the positive direction from 144 toward 140 degrees, or an increase from 144 to 148 degrees. Proper choice of words will eliminate con- fusion.
Let's do the vector analysis for the monitoring point at 280 degrees true.
Tower 1 SP= 105 cos /3000-280° = 105 cos /20° = 105 (0.9397) = 98.5°
Tower 2 SP= 35 cos /300 ° -280° = 35 cos /20° = 35 (0.9397) = 33°
191
www.americanradiohistory.com

Tower 3 SP = 35 cos /1200 -280° = 35 cos / -160° = 35 (- 0.9397) = 33°
Tower 4 SP = 105 cos /120°-280° = 105 cos / 160° = 105 (- 0.9397) = 98.5°
Adding the electrical phase to each space phase value and inserting the appropriate magnitude, we have:
Magnitude and Phase Electrical of Tower Vectors
Tower SP Phase (fir) at 280° True 1 98.5° 144° 0.38/242.5°
2 33.0° 0° 1.00 33°
3 33.0° 144° 0.98 / -177°
4 98.5° 66° 0.40/-32.5°
Figure 7 -3 shows the completed drawing for the monitoring point at 280 degrees true.
Each of the monitoring points associated with the DA system should be presented in this form and studied careful- ly. An accurate determination of which parameter is most logical to adjust can then be made. A vector analysis can be made on any type of array- parallelogram, dogleg, etc. The reference point, chosen in this example as the center of the array, can be placed at any convenient point if the distance and azimuth angle to each tower from this point is known and taken into account in the calculations. The reference
E3 =0.98/-1440
E4 = 0.40 166°
RESULTANT
E1= 0.38/1440
-1770
330 - - - - -
E2= 1.0/00 REFERENCE AXIS
Fig. 7 -3. Vector analysis for a 4 -tower array at 280 degrees true.
192
www.americanradiohistory.com

point can be placed at the same point as one of the towers as might be desirable in the case of a 3 -tower in -line army.
When an array has very deep nulls and uses a unity cur- rent ratio to produce them, vector analysis will show the resul- tant on the nulls to be nonexistent; that is, the tip of the last tower vector will touch the start of the first vector. When phases and current ratios are such that a complete null (zero radiation) is produced along the azimuth under study, it is ob- vious that any change in any operating parameter will move the tip of the last tower vector away from the start of the first, thus increasing radiation on this bearing.
193
www.americanradiohistory.com

Appendix I
Vector Computations
All vectors have a magnitude and angle and all can be
expressed in either polar or rectangular form. The notation 4
+ j3 is a vector expressed in rectangular form. The first figure (4), when plotted on a graph, will represent the value of x. The
second figure (3) indicates the value of y. All values of x to the right of the y -axis (ordinate) are positive. All values of x to the
left of the y -axis are negative. All values of y above the x -axis
(abscissa) are positive. All values of y below the x -axis are
negative. This can be seen in Fig. 1.
On the graph, the value of x is plotted by counting 4
divisions to the right of the y -axis, as it is a positive value. The value of y is plotted by counting 3 divisions up from the x -axis
as it too is a positive value. The vector 4 + j3 can also be noted as 5 /37 °. This is
called polar notation, or polar form. The 5 is the magnitude
Y-AXIS - +Y
4 + 13
``C/ 70 X i I!! I I I I / _I I I/I I I I I x-Axes
+X
-Y
Fig. 1. Polar representation of 4 + j3.
194
www.americanradiohistory.com

and 37° is the phase angle. With the graph drawn to scale, a line drawn from the intersection of the x and y axes to point "x = 4 and y = 3" will measure 5 units, and the angle formed by this line and the x -axis will óe,37 degrees.
POLAR -RECTANGULAR CONVERSIONS
In several directional antenna calculations it is necessary to change vector notations from rectangular to polar form, and vice versa; however, it is not always convenient, or accurate, to graph the values. The transformation is then done by using trigonometry.
To change 4 + j3 to polar form, first determine the vector magnitude.
Magnitude = = V +32 = +9 = 25 = 5
Next, determine phase angle.
= y/x = 3/4 = 0.750 The angle of which 0.750 is the tangent is determined from a table of natural trigonometric functions to be 37 degrees.
Change the polar notation of 5 /37° to rectangular form as follows:
x = magnitude times cosine of the phase angle = 5 cos 37° = 5 x 0.800 = 4.0
The cosine of 37 degrees is found in a table of natural trigonometric functions to be approximately 0.800.
y = magnitude times sine of phase angle = 5 sin 37 ° =5 x 0.600 = 3.0
ARITHMETIC OPERATIONS ON VECTORS To add vectors, it is most convenient to change them to
rectangular form and algebraically add the x and y terms separately.
(4 +j3) +(8 +j6) = 12 +j9 Similarly
(4 + j3) + ( -3 - j7) =1 - j4 To subtract vectors, it is most convenient to change them to rectangular form and algebraicall.i subtract the x and y terms separately.
195
www.americanradiohistory.com

196
/t) POSITIVE ANGLE
Fig. 2. Positive and negative angles.
1
6 NEGATIVE ANGLE
SECOND QUADRANT
SIN +
COS - TAN -
FIRST QUADRANT
ALL FUNCTIONS +
SIN - COS- TAN+
THIRD QUADRANT
SIN- COS+ TAN-
FOURTH QUADRANT
B
Fig. 3. Sign of trigonometric functions in the four quadrants.
www.americanradiohistory.com

(4 +j3)- (8 +j6) = (4 +j3) +( -8 -j6) = -4 -j3
Similarly
(4 +j3)- ( -3 -j7) = (4 +j3) +(3 +j7) = 7 +j10
To multiply vectors, they must he changed to polar form. The magnitudes are then multiplied and the phase angles added algebraically.
5[37° x 4/21° = 20/ 58° Similarly
5/37° x 4/ -21° = 20/16°
To divide vectors, they must be changed to polar form. The magnitudes are then divided and the phase angles algebraically subtracted.
5/37° = 1.25 /37 °1° = 1.25 /16°
Similarly 4/ 21°
5/37° = 1.25 /37 °- ( -21 °) = 1.25/58° 4/ -21°
Vectors with positive phase angles are always measured counterclockwise from the positive x -axis; vectors with negative phase angles are always measured clockwise from the positive x -axis. These principles are illustrated in Figs. 2 and 3.
197
www.americanradiohistory.com

Appendix II Glossary
Adjacent channel In AM broadcasting, a frequency removed by plus or minus 10 kHz.
Antenna monitor FCC terminology for a phase monitor. A device used for measuring the magnitude and phase angle of the cur- rents in the elements of a directional antenna system.
Array A term used for a directional antenna system.
Azimuth A compass direction centered on a DA system; sym- bolized as O in directional antenna work.
Base coupling network Base matching network.
Base current Rf current present at the feedpoint of a vertical radiator.
Base -current meter An rf ammeter in the feed circuit of a vertical radiator.
Base impedance The resistance and reactance present at the base of a vertical radiator.
Base matching network A network of coils and capacitors located at the base of a tower and used to match the self- impedance, or driving - point impedance, of the radiator to the characteristic im- pedance of its associated transmission line.
Beacon Flashing light installed on a tower to reduce its hazard to air navigation.
Characteristic impedance The impedance seen looking into an unterminated transmission line of infinite length.
198
www.americanradiohistory.com

Cochannel The same frequency. A cochannel station is a station on
the same frequency. Common point
The input to a DA system where all feeds are common; the point where power is fed into a DA system.
Construction permit A permit issued by the FCC specifying the terms of and authorizing the construction of a broadcasting facility.
Current ratio The ratio of current in a radiator to the current in the re- ference tower of a DA system. Symbolized as M
Current transformer An inductive pickup device used for sampling rf energy to feed the phase monitor, installed at the base of a
radiator in a DA system. DA proof
Measurements and analysis made on a directional anten- na system for the purpose of determining inverse radia- tion field and ground conductivities at various azimuth angles.
Degree A measure of phase angle; also a measure of wavelength (360 degrees equal one wavelength).
Detune To render a tower or other structure an ineffective radiator of rf energy.
Detuning network An LC network used to disable and make ineffective un- used towers in a DA system; also a network used to make an unwanted parasitic radiator an ineffective radiator at
the station's operating frequency. Dielectric
The insulation between the inner and outer conductors of a coaxial cable.
Dogleg array A 3 -tower directional antenna system in which the center tower is offset from the line of the two end towers.
Driving -point impedance The impedance at the base of a radiator in a DA system.
199
www.americanradiohistory.com

Electrical degrees A measure of electrical length referred to transmission lines, tower height, or tower spacings (one wavelength equals 360]).
Electrical length The length of a feedline or tower (expressed in degrees or a fraction of a wavelength).
Electrical stability The ability of a DA system to maintain its operating parameters without adjustment for an extended time.
End seal The mechanical termination used to seal air dielectric transmission lines.
Far field The radiation field of an antenna at a sufficient distance for it to have fully formed its radiation pattern.
Feeder system The system of power divider, phase control networks, transmission lines, and base coupling networks in the DA system that produces the actual current ratios and phase relationships in the DA system.
Field intensity meter A portable battery- operated instrument used to measure radiated field from an antenna system.
Field ratio The ratio of radiated energy from an element in a DA system to the reference tower energy.
Flasher mechanism A device either electrical or electromechanical used to interrupt the electrical current feeding a flashing beacon.
Geographic coordinates The location of a point on the surface of the earth as identified by longitude and latitude.
Geometric mean The square root of the product of two numbers.
Ground conductivity A value of conductivity over the surface of the earth which the ground wave signal traverses; used in de- termining the attenuation of the ground -wave signal.
200
www.americanradiohistory.com

Ground screen A copper mesh installed about the base of a vertical radiator.
Ground system A system of screen or wire buried about the base of a vertical radiator.
Hazard lights Side lights.
Horizontal radiation pattern The pattern radiated by an antenna system along the sur- face of the earth.
Induction field Near field.
In line array A directional antenna system with all towers laying in a single straight line
Inverse field The theoretical radiated field from an antenna system that decreases inversely as distance is increased (does not take ground attenuation into account).
Johnny -ball insulator The type of insulator used in guy wires.
Lighting choke An inductor used to isolate ac power for tower lights from rf energy acros the base insulator of an AM tower.
Loop The point on a vertical radiator of maximum rf current located 90 electrical degrees from the top.
'Loop current The current at a point 90 electrical degrees from the top of a vertical radiator; the current read on the phase monitor loop current meter.
Magnitude The amplitude of the rf current, in amperes, in a radiator in a DA system.
Major lobe A large amount of radiation concentrated in a beam from the DA system.
Maximum expected operating value A tolerance put on all theoretical radiation patterns; the
201
www.americanradiohistory.com

value of radiation that will not be exceeded in actual operation, represented by a dotted line around the theoretical pattern.
Measured field The value of field intensity measured at a particular point or location.
Millimhos per meter A measure of ground conductivity.
Minima Those azimuths along which minimum but not zero radiation from the DA system occurs. (Plural of minimum.)
Minimum See minima.
Minor lobe A small egg -shaped area of radiation in the pattern of a DA system.
Monitoring point A point selected along a particular azimuth to monitor field strength from a directional array.
Mutual impedance The mutual coupling between radiators in a DA system expressed in magnitude and phase angle; dependent on spacing and height of the radiators.
Near field The radiation from an antenna system in close to where the currents have not added to produce the actual pat- tern.
Negative tower A tower in a DA system having a negative value of driv- ing -point resistance. Power flows in the opposite direc- tion in the feeder system of a negative tower.
Nondirectional proof Measurements and analysis of data made on a nondirec- tional antenna system determine its inverse radiation field and the ground conductivities on paths away from the radiator.
Null In the theoretical radiation pattern, an azimuth which has zero radiation on it. (See also minima.)
202
www.americanradiohistory.com

Null detector An indicating device, sometimes a well shielded radio receiver, used in conjunction with an rf bridge to in- dicate balance of the bridge.
Operating parameters The normal values of current and phase in a properly ad- justed DA system. In a transmitter, the normal values of plate current and plate voltage.
O -ring transformer A transformer resembling two interlaced doughnuts and used for transferring ac lighting power across the base in- sulator of AM broadcast towers without affecting or short- circuiting the rf energy on the tower.
Parallelogram array A directional antenna system of at least four towers ar- ranged in the form of a parallelogram.
Parasitic radiator A radiator not actually driven with rf energy that has rf energy induced into it, which it reradiates.
Partial proof A measurement of at least 10 points at distances between 2 and 10 miles from a DA system on each radial, measured in the last full antenna proof of performance. The measured points must be tabulated, graphed, and analyzed as set forth in the FCC Rules and Regulations.
Phase An angle measured from a reference point in a coun- terclockwise direction; expressed in degrees.
Phase advance A change in phase by a positive value.
Phase delay A change in phase by a negative value.
Phase lag See phase delay.
Phase monitor A device used to monitor the phase and magnitude of current in DA radiators.
Phase retard See phase delay.
203
www.americanradiohistory.com

Phase-sampling loop An inductive pickup device mounted on a tower and used for the pickup of radiated energy to be sampled by the phase monitor.
Phase shift The change in phase angle through a network. Can be either positive or negative.
Photocell A device used to sense light level and thus control automatically the on -off cycle of tower lights.
Planimeter A device used for measuring the area of irregularly shaped two -dimensional drawings.
Point source Radiation coming from a single minute source.
Polar coordinates The location of a point, on a graph, expressed in magnitude and phase angle.
Power di cider Part of the DA feeder system used to distribute rf current to the various radiators in the system.
Quadrangle map See topographic map.
Radial An imaginary line drawn at a particular azimuth angle from the center of the array out to 20 miles or more from the DA system, along which measurements are made to evaluate the performance of the antenna. In a ground system, one of a series of 120 wires extending outward from the base of a vertical radiator.
Radiation pattern The pattern of radiated field strengths produced by the antenna system.
Radiation resistance The measured part of the base resistance of a vertical radiator that represents radiated power.
Radiator A tower.
Rectangular coordinates
204
www.americanradiohistory.com

The location of a point on a graph expressed in values of x and y.
Reference tower The tower in a directional antenna system that phase angle and current ratio are measured against.
Rf bridge A device used in conjunction with an rf signal generator and null detector to determine resistance and reactance at a particular frequency looking into an impedance - matching network, an antenna's input terminals, or a transmission line.
Roller -variable inductor A coil whose inductance is adjustable by means of a mov- able roller.
Root mean square The value of overall radiation from an antenna system; rms expressed in millivolts per meter, a measure of the efficiency of a DA system.
Scatter The phenomenon in which measured field from an an- tenna system does not decrease uniformly with distance but jumps above and below expected values.
Self -impedance The measured impedance at the base of a vertical radiator.
Shunt element The parallel element (network to ground) in a T- orL- network.
Side lights Steadily burning lights installed at various intervals along radio towers.
Simulated load A series combination of resistance and reactance used to simulate the driving -point impedance of a radiator; used during the adjustment of base coupling networks.
Skeleton proof The measurement and tabulation of the measured field intensity by the monitoring point (where applicable) and at least three other successive points on each radial measured in the last full antenna proof of performance.
205
www.americanradiohistory.com

Static drain A shunt resistance or reactance to ground across a tower base insulator or transmission line providing a path for dc while not providing a significant path for rf current; used for lightning and static buildup protection.
Topographic map Large -scale map published by the U.S. Government Geodetic Survey and used in plotting radiation patterns.
Unattenuated field See inverse field.
Uniform cross -section Of a tower, having uniform diagonal measurements on each face from the base to the top.
Vector current The rf current in a DA radiator expressed in magnitude and phase angle.
Vector analysis A graphic presentation of the phase and magnitude of radiation from each element in a DA system as it arrives on points on a specified azimuth.
Velocity factor As a percent or a decimal, the speed of energy flow in a
transmission line vs the speed of energy flow in free space.
Vertical radiation pattern The radiation pattern of an antenna system in the vertical plane, with ground level equal to zero degrees and a point directly above the antenna equal to 90 degrees.
Wavelength The distance in feet or meters (or any other linear measure) that it takes a radio wave to complete one cycle. One wavelength in feet (in free space) equals the fre- quency in megahertz divided by 984. Wavelength is sym- bolized by the Greek letter lambda,
206
www.americanradiohistory.com

Appendix III Tables
Table 1. Symbols Commonly Used in Directional Antenna Work.
E Total field strength in millivolts per meter (usually refers to inverse field at one mile)
F Field strength ratio fo Vertical radiation charac-
teristic G The height of a vertical
radiator expressed in elec- trical degrees
j In electronics, a symbol in- dicating a reactive quantity, +j for inductive reactance and -j for capacitive reac- tance
1 Wavelength O Phase angle
M RL RR
S
Xc: Xi.
z
Current ratio Loss rsistance Radiation resistance Elevation angle above the horizontal Azimuth angles in degrees clockwise from true north Spacing between towers in a DA system, expressed in electrical degrees Capacitive reactance Inductive reactance Electrical phase angle of the current energizing a radiator in a DA system Impedance
Table 2. Abbreviations Used in Directional Antenna Work
ACU Antenna -coupling unit DA Antenna -terminating unit DA -1 Construction permit
Directional antenna An AM directional antenna facility utilizing a single directional radiation pattern for both day and night opera- tion
DA -2 An AM directional antenna facility utilizing two dif- ferent directional radiation patterns; usually one for daytime operation and the otherfor nighttime operation
DA -D An AM directional broadcast facility utilizing a directional antenna system for daytime operation only
DA -N An AM directional broadcast facility utilizing a directional antenna system for nighttime operation
FIM Field intensity meter Hz Hertz kHz Kilohertz LTU Line -terminating unit meow Maximum expected operat-
ingvalue MHz Megahertz
mmhos /m Millimhos per meter MP Monitoringpoint mV /m Millivolts per meter Non -D Nondirectional rf Radio frequency rms Root mean square µV /m Microvolts per meter V/m Volts per meter
207
www.americanradiohistory.com

Index
A p Intensity -field 170, 180
Adjustment, final phase DA -2 74 1Invverses 107
and current 155 DA -N 74 -distance 114 Analysis, vector 187 DA proof 140, 151, 158 -field 11. 53, 90, 110, 160 Anchor, guy 43, 71 Data -field, CP 160 Angle -mutual impedance 28 -proportion law 11 -phase 145, 176, 188, 191 -self-impedance 28 -unattenuated 11 -vertical 13 Deter 82 Inversion of phase 85 Antenna Detuning networks 96, 97, 115 -coupling units 60 Divider, power 57, 132, 138, 148 , -resonant length 9 Dogleg array 154 Array Driving -point -in -line 43, 89, 105, 189, 192 -impedance 26, 33, 46, 60 "Johnny ball' 70 -parallelogram 85, 154 116, 121, 132, 148, 174 -insulators 186
-resistance 41, 117, 119 Dummy load 86, 173
B Base
F Law, Ohm's Lighting
140
-coupling 168 -0-ring 46 coupling network of T 116, 129 Factor, velocity 177, 178 -tower 46, 80 -matching network 129,149 Feedline 57 Lighting choke 46,79 -resistance 39, 98 Feeder systems 31, 126 -tower 60 -tuning network 117,141 Fences 81 Line -tuning unit 46 Base current 147, 169, 174, 183 -chain link 82 Line -ratio 184 Field intensity -phase -sample 144 -meter 35, 60, 80,184 -meter 98, 153, 155, 158. 180 -reference 144 Bridge, rf 98, 119, 125, -nondirectional 169 -sample 76, 79, 145
149, 171, 177, 183 -intensity 170, 180 -sampling 82. 176 -inverse 11,53,90,110,160 -terminating units 57,60,79 Field -transmission 79, 95, 116, C -measured 11, ISI, 160 119.127,173.176 -ratio 38 L- network 117, 121, 123, 133 -unattenuated 21 Load, dummy 86,173
Cable Final phase and Lobe 152 -coaxial 51 current adjustment 155 -major 43. 181 -messenger 76 -minor 152 -sample -line 79 L or T network 139 Capacitors f Loop current 142,147.178 -mica 59, 181, 183 l- -ratios 169 -vacuum 59, 86, 181 Loops, phase -sampling 82 Chain link fence 82 Graphs, intensity 107 L. f 60 Change in phase 183 Ground LTU 97 Choke, lighting 46,79 -conductivity 11.110, Coaxial cable 51 90, 164, 179 Common -point 86, 186 -system 42, 54, 77, 81 u -impedance 60. 141, 150 wave -vs -field 106 M
155, 159, 172, 182 Guy -matching network 57, 139, 187 -anchors 42, 71 Major lobe 43, 181 -network 168 -wires 186 Map -resistance 40 -topographic 99, 169 -ground 11, 19, 110 -index, topographic 94
164, 179 ' Matching Construction permit 151,169 --curve 114 Controls, phase 57. 130 -network 121 Coupling Impedance Measured field 11, 151, 160 -base 168 -common -point 16,50,60 Measuring point 100 - mutual 186 159, 172, 182 MEOV 93 CP -driving -point 26, 46.60, Messenger cable 76 -inverse field 160 116, 121, 132, 148, 174 Meter -monitoring points 104 -mutual 26, 132, 148 -base -current 35, 60. 80, 184 Current -self 26, 46 -field- intensity 97. 150, 180 -loop 142, 147, 178 In -line Mica capacitors 59, 181, 183 -ratio 25, 141, 143 -array 43, 84, 106 Minima, nulls 17
147, 175, 187, 191 154, 189, 193 Minima 44, 151, 153 -ratio, FINIS 168 -reradiation 155 Minimum value 54 -transformers 84 In -phase 16 Minor lobes 152 -vector 28 Installation of towers 69 Monitor Current, base 147, 169, 174, 184 Insulators, Johnny -ball 186 -phase 53. 57. 82 -Ratio 184 Interlock 88, 182 141, 169, 179, 183 Curve matching 114 -system 88 -points 152179
208
www.americanradiohistory.com

Monitoring points
-CP -radial -readings Multiplication Mutual -- coupling -impedance 26, -impedance data
93, 100 154, 179, 187
104 105
175, 181 30
186 28,132,148
28
-shift 53, 117, 126. 135, 140. 182
-shift in 191 -shift network 129 Phasing space 189 Phasor 55, 140, 155, 181 Pick -up -phase- sampling. system 144 -point 84 -.sample 49 -unit 177, 183 Pi network 117
N Plaini meter. RMS Point
165
--common 86, 186 Network base -measuring 100 -coupling 116 -monitor 152, 154, 179 -coupling of 129 -monitoring - 100. 164, 179, 187 -matching 129. 149 Power 57 -tuning 117.141 -divider 57, 132, 138, 148 Network -dividing network 132, 139 -common-control 168 Preparation of site -common -point matching 57. 139, -remaining trees 65
187 -tall trees 65 -detuning 96 Proof -L 117. 1121, 127. 133 -DA 140.151 --Li or 139 -nondirectional 90, 150 -Hatching 121 Proof of performance -P 117 -nondirectional 45 -phase -adjusting 150 -nondirectional and DA 12, 169 -phase- advance 130 Proportion law, inverse 1l -phase -control 57, 127, 132
135, 148, 168 -phase -shift 127 -power -divider 132 Q
-dividing -pwer
139 Q of network 117 -T 117. 124, 129 -T phase control 130
Nondirectional -and DA. proof -of- performance R
12, 169 -field- intensity 169 -proof 90, 150 -proof -of- performance 45 -radialed 151 Null 17. 22, 44, 101, 172 Nulls and minima 17
o Ohm's law Of -phase O -ring lighting -transformer
P
140 16 46
46, 80
Parallelogram 192 - ray 85, 154 -reradiation 155 -radiator 155 Pattern shape 25 Permit, construction 169, 151 Phase 16, 22, 178, 187 -advance network 130 adjusting networks 150 -angles 143, 145, 176, 188 -change 183 - controls 57, 130 -control nets 168 -control networks 57, 127
132,148,168 -inversion 85 -monitor 53, 57, 82
141, 143, 169, 179, 183 -monitor trouble 185 -sample line 144 -sampling system 49. 79, 82.
143, 177, 183 -sampling system, pick -up 144 -sampling loops 82
Radial 42.54.77 -monitoring points 105 Radiated, nondirectional 151 Radiator. parasitic 155 Radio -two -way 146,152,174 -unit. two-way 153 Rating, voltage 59 Ratio -cement 25, 141, 148
175. 183, 185, 187 -field 38 -phase
l
or current 155 --loop-current 169 Reading. monitoring -point 175, 181 Reference -line 144 -tower 46, 95.98
139. 144, 169 Remdiation 18, 160 Resistance -hase 39,98 -common-point 40 -driving -point 41. 117, 119 Resonant length antenna 9 Rf bridge 98, 119, 125
131. 149, 171, 177, 183 RMS 168 -current ratio 168 - -palinimeter 165 -spacings 168 -value 150
5 Sample
ple line 76,82, 145, 177
-pluese 74 -pickup 49 Sampling -phase 49.183 -system 178, 183
Self -impedance -data Self-supporting towers Series -fed. vertical
radiator Shape-pattern Shift in phase Shunt -fed, vertical
radiator Space phasing Spacing -RMS -tower -feeder -ground -interlocking -phase -sampling -sampling
T Tall trees, preparation
of site T -phase -control network -and L -network Theodolite or transit Tower -lighting 4660.80 -installation of 69 -reference 46,95.98
117, 129, 144, 169 -self-supporting 7 -spacing 23 -Topographic -map -map index Transmission -line
26,
7
7 25
182.191
7 189
22 168
23 31. 126
42,54,77,81 89
82,143.177 178, 185
65
130 36 60
122, 129 100
99, 169 94 76
75.95. 116. 127 139, 173. 176. 185
Transit, theodolite 100 Transformers -current 84 -O -ring 46,80 -wring lighting 46 Trouble. phase- monitor 185 Tuning unit line 46 Turnbuckles 71 Two-way radio 146. 152. 174
U Unattenuated -field 21
or inverse field 1l Units -antenna-coupling 80 -line- terminating 57, 60.79 -pick -up 177, 183
V Vacuum capacitors 59, 86, 181 Value, RMS 150 Varias 97 Velociy factor 32. 178 Vector -addition 3) -analysis 187 -currents 28 Vertical -angles 13 -radiator, shunt -fed 7 -radiator, series -fed 7 Voltage rating 59
W Wave -vs- field, ground 106 Wires, guy 186
209
www.americanradiohistory.com