Direction de la Météorologie Nationale, Maroc
36
Direction de la Météorologie Nationale, Maroc Seasonal Forecast in Morocco and NA- RCC Fatima Driouech With thanks to Atika Kasmi MedCof meeting, Belgrade 13-19 Novembre 201
description
Direction de la Météorologie Nationale, Maroc. Seasonal Forecast in Morocco and NA-RCC Fatima Driouech With thanks to Atika Kasmi. MedCof meeting, Belgrade 13-19 Novembre 2013. History of operational seasonal forecast in Morocco. - PowerPoint PPT Presentation
Transcript of Direction de la Météorologie Nationale, Maroc
Direction de la Météorologie Nationale, Maroc
Seasonal Forecast in Morocco and NA-RCC
Fatima Driouech
With thanks to Atika Kasmi
MedCof meeting, Belgrade 13-19 Novembre 2013
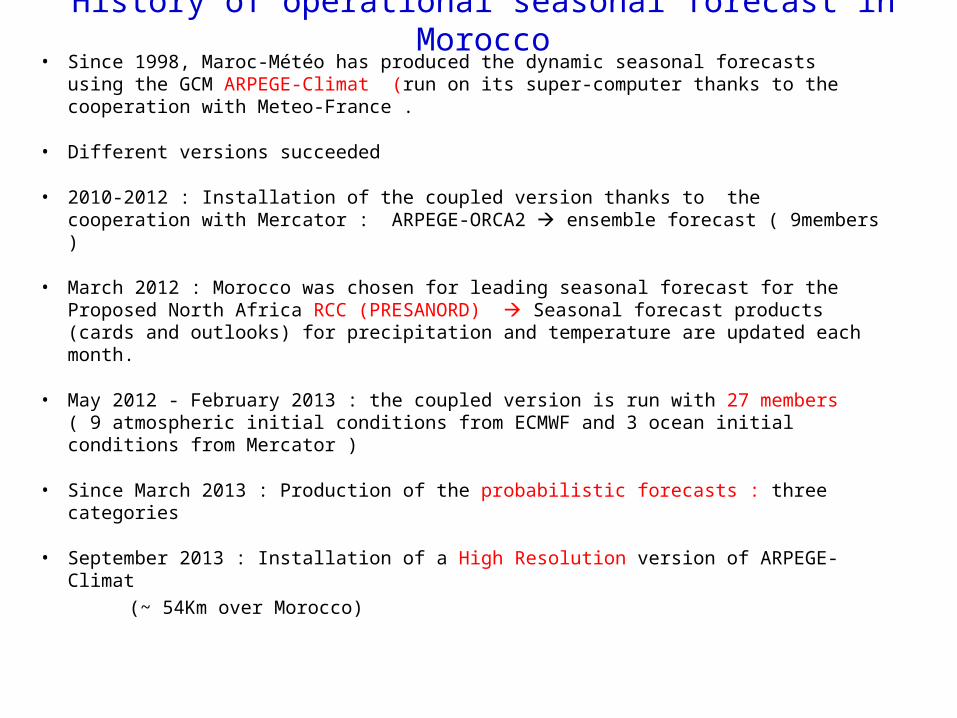
History of operational seasonal forecast in Morocco• Since 1998, Maroc-Météo has produced the dynamic seasonal forecasts using the
GCM ARPEGE-Climat (run on its super-computer thanks to the cooperation with Meteo-France .
• Different versions succeeded
• 2010-2012 : Installation of the coupled version thanks to the cooperation with Mercator : ARPEGE-ORCA2 ensemble forecast ( 9members )
• March 2012 : Morocco was chosen for leading seasonal forecast for the Proposed North Africa RCC (PRESANORD) Seasonal forecast products (cards and outlooks) for precipitation and temperature are updated each month.
• May 2012 - February 2013 : the coupled version is run with 27 members ( 9 atmospheric initial conditions from ECMWF and 3 ocean initial conditions from Mercator )
• Since March 2013 : Production of the probabilistic forecasts : three categories
• September 2013 : Installation of a High Resolution version of ARPEGE-Climat (~ 54Km over Morocco)

OPA/NEMO(3.2) : Ocean global circulation model
ARPEGE-Climat HR
Coupler OASIS
Analyses océanographiques Analyses atmosphériques
ARPEGE-Climat V5: Atmospheric global circulation model
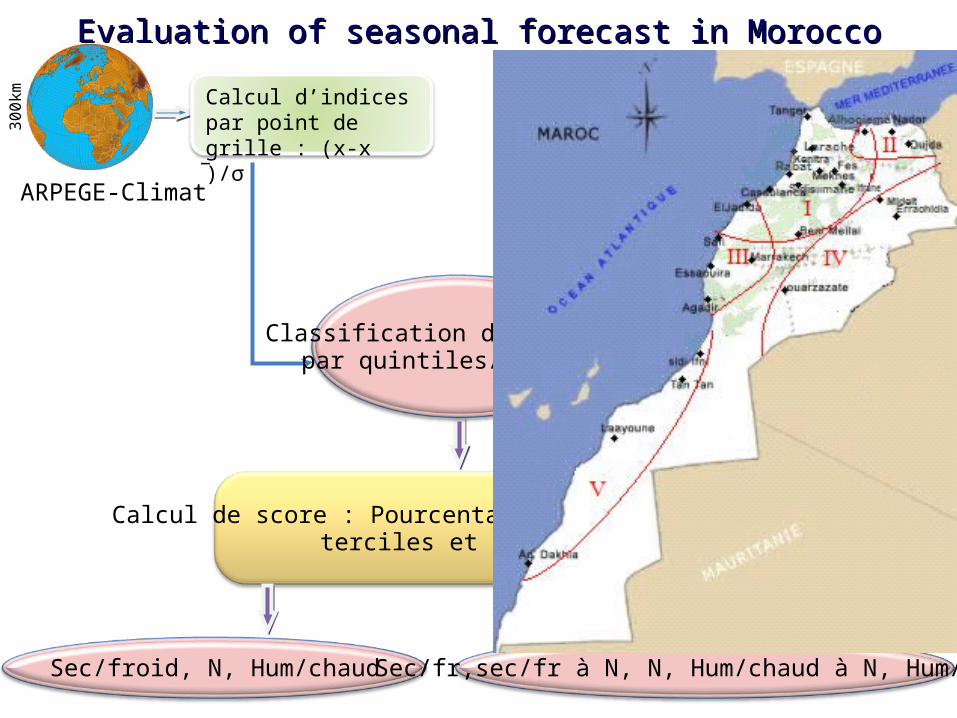
Evaluation of seasonal forecast in MoroccoEvaluation of seasonal forecast in Morocco30
0km
Régionalisation (5reg) d’indice
saisonnier
Calcul d’indices par point de grille : (x-x >)/σ
Calcul d’indices de Précip/Tem par ST
ARPEGE-Climat
Observations
Base DMN
25st
Observations
Base DMN
25st
Classification des indices par quintiles/terciles
Calcul de score : Pourcentage réussit des classes terciles et quintiles
Sec/froid, N, Hum/chaud Sec/fr,sec/fr à N, N, Hum/chaud à N, Hum/chaud

Evaluation of T2m/Precip issued from ARPEGE-Climat vs observations over northern half of Morocco
A. Kasmi, A Abdelaziz, T. Soubai

Anomaly Correlation Coefficient of temperatureAnomaly Correlation Coefficient of temperature
A. Kasmi, A Abdelaziz, T. Soubai

RMSE T2m
A. Kasmi, A Abdelaziz, T. Soubai
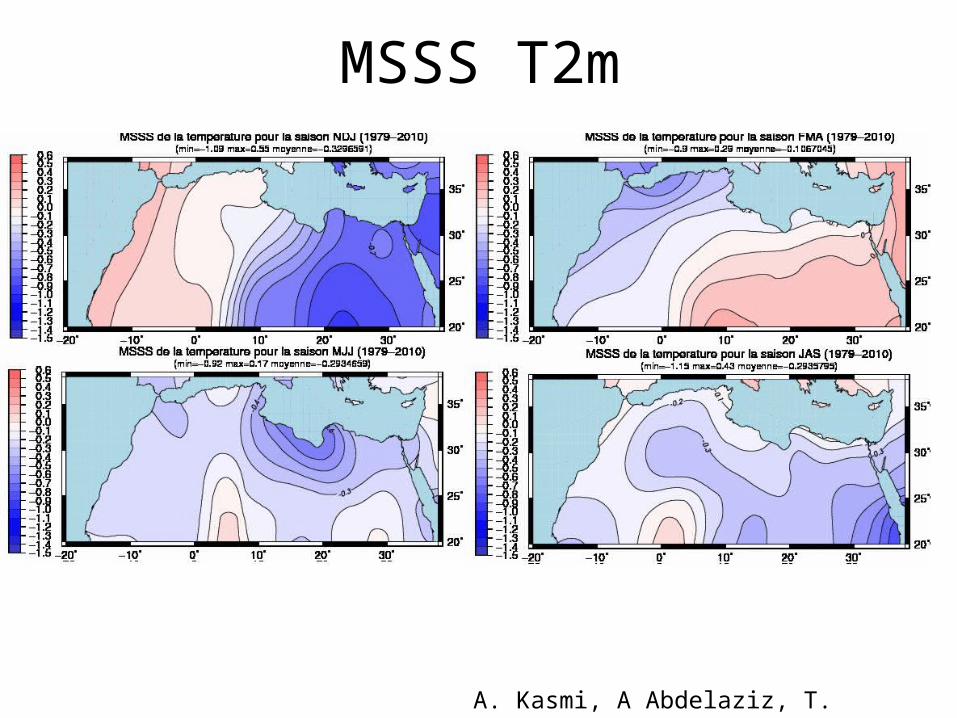
MSSS T2m
A. Kasmi, A Abdelaziz, T. Soubai

Anomaly Correlation Coefficient of PrecipitationsAnomaly Correlation Coefficient of PrecipitationsComparaison with reanalysis: Comparaison with reanalysis:
A. Kasmi, A Abdelaziz, T. Soubai
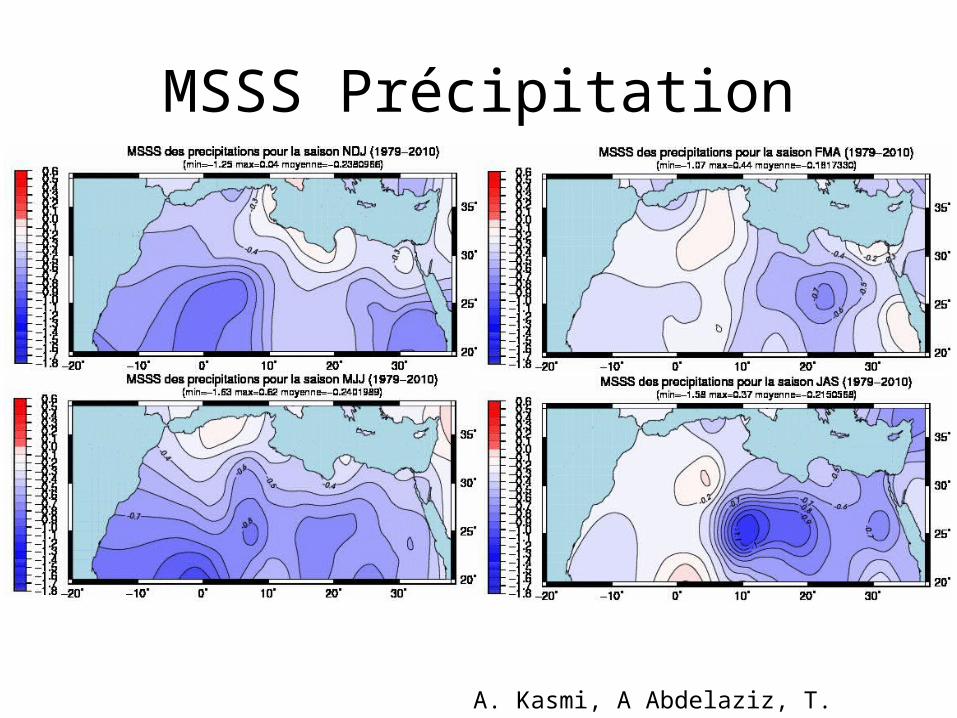
MSSS Précipitation
A. Kasmi, A Abdelaziz, T. Soubai

North African Regional Climate Centre

NA RCC structure and responsibilitiesDistribution of functions for the North African RCC-Network
Mandatory functions Highly recommen-ded functions
LRF Climate Monitoring
Data Services
Training
Lead Morocco Algeria Libya Egypt and Tunisia
Morocco
Co- Lead Egypt Tunisia Morocco Algeria Algeria, Egypt, Libya, Tunisia

NA RCC Home page : Presentationhttp://rccnara1.marocmeteo.ma
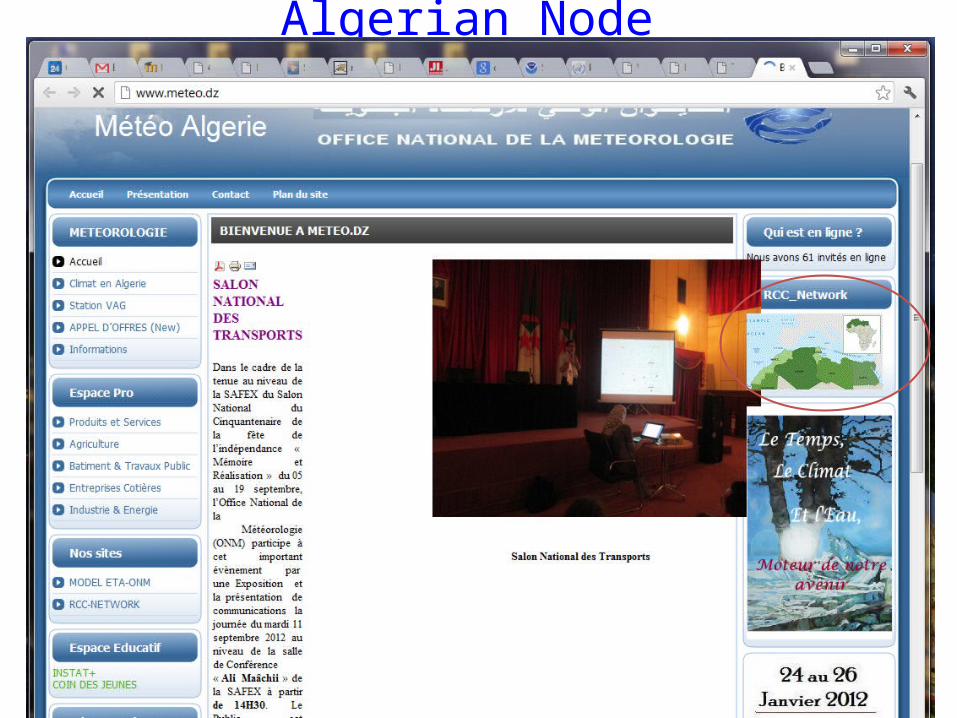
Algerian Node

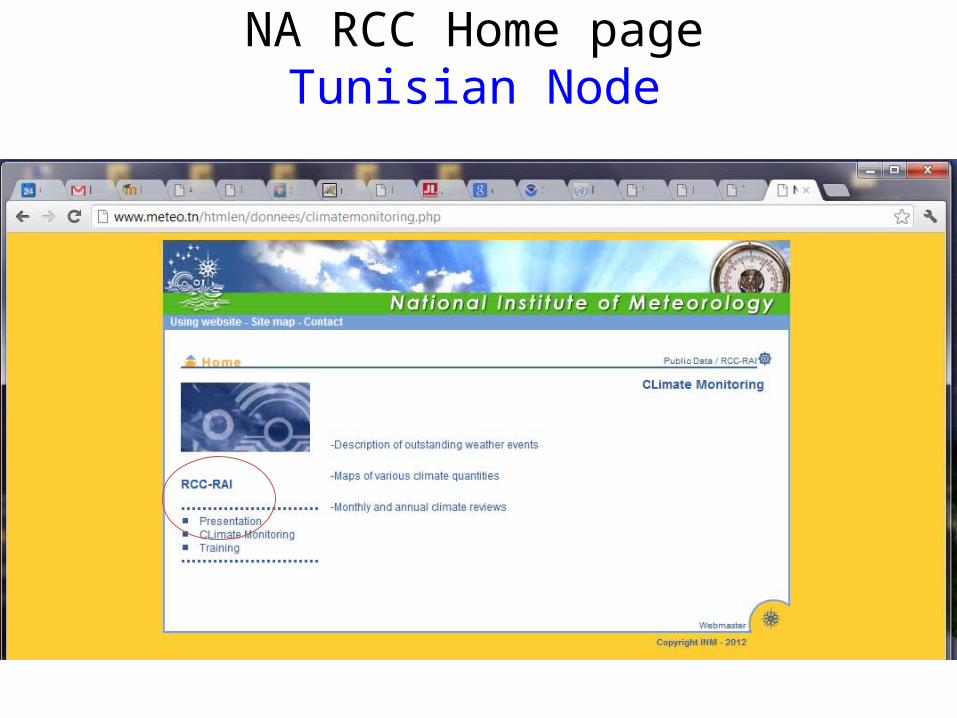
NA RCC Home page Tunisian Node

Egyptian Node

NA RCC Home page Egyptian Node


North African Regional Climate Center
THANK YOU


Evaluation of seasonal forecast over North Africa Evaluation of seasonal forecast over North Africa compared with compared with reanalyses reanalyses
Modèle Réanalyses
Type
ARPEGE-ClimatCouplé Précipitations Température
Modèle atmosphérique
Modèle océanique
GPCP NOAA
ERA-intérim ECMWF
ARPEGE 4.6 OPA8.2
Résolution 2.8°x2.8° 2.5°x2.5° 0.562°x0.562°
Période d’évaluation
1979 - 2010
Domaine d’étude
Afrique du Nord

Skill scores used

JF NAO v Precip
-25-20
-15-10 -5 0 5 10 15 20 25 30
3540
45
LON
15
20
25
30
35
40
45
50
01 0 0
2 1 1 1 1 0 0 0
3 4 4 3 2 0 0 4 5 3 3 2 3 3 1 0 1 06 6 6 4 3 1 0 1 1 3 5 3 2 4 3 3 2 2 0 26 6 6 4 4 4 2 0 2 2 0 0 0 2 1 2 1 1 1 17 6 6 4 5 3 2 2 0 3 1 2 3 3 2 4 3 1 3 46 7 7 4 3 3 4 4 4 5 5 3 4 3 4 5 4 4 5 5
ON NAO v Precip
-25-20
-15-10 -5 0 5 10 15 20 25 30
3540
45
LON
15
20
25
30
35
40
45
50
11 1 1
1 1 1 1 1 1 1 0
0 0 2 2 2 2 0 2 3 1 1 0 0 1 0 0 1 10 2 2 3 2 1 0 0 1 1 2 3 0 1 0 0 2 4 3 21 1 0 3 2 4 1 1 2 2 4 4 1 0 2 1 0 0 1 11 0 0 4 2 1 0 0 3 4 4 3 1 0 1 1 2 1 0 02 1 0 4 5 2 3 2 3 3 0 0 1 0 3 3 3 2 1 0
Jan-Feb NAOVersusJan-Feb precipitation
Correlation (*10), Red = positive, Blue = negative
Oct-Nov NAOVersusOct-Nov precipitation
Taken from Neil Ward presentation done in Rabat, Morocco - November 15th, 2012
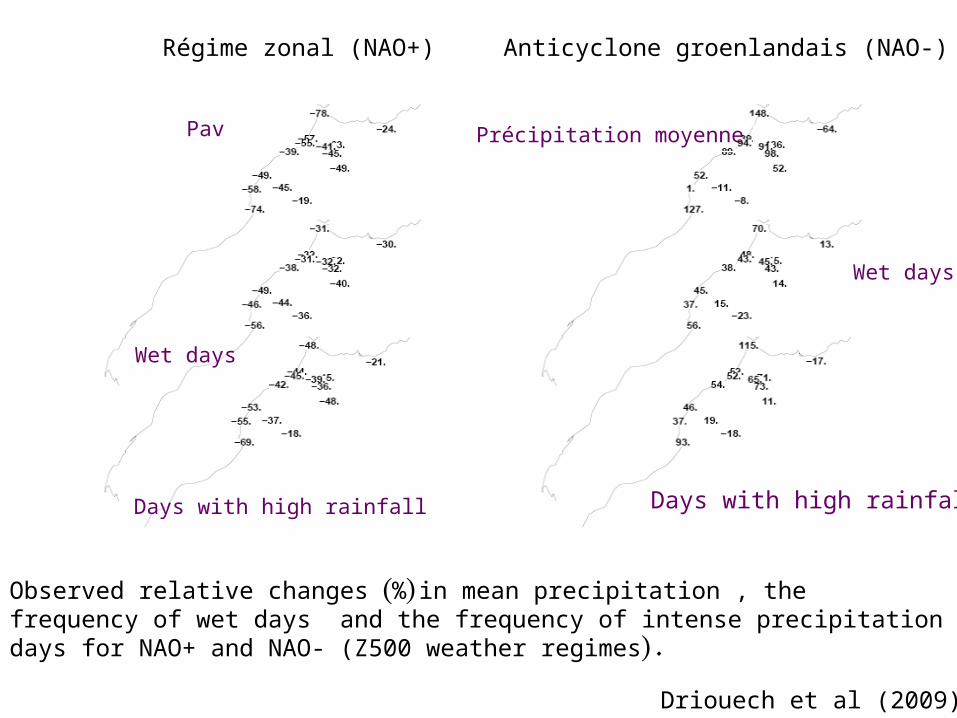
Observed relative changes (%) in mean precipitation , the frequency of wet days and the frequency of intense precipitation days for NAO+ and NAO- (Z500 weather regimes).
Régime zonal (NAO+) Anticyclone groenlandais (NAO-)
Pav
Wet days
Days with high rainfall
Wet days
Précipitation moyenne
Days with high rainfall
Driouech et al (2009)

Donat et al (2013)
NAO seems to have an influence on temperature extremesthat relationships tend to be stronger with warm extremes than cool extremes.

SpecifiedObserved
1978 1982 1986 1990 1994 1998 2002 2006 2010
YEAR
-2
-1
0
1
2
3
Sta
ndar
d D
evia
tions
Regression Prediction of Jan-Feb Region 1 rainfall fromJan-Feb values of NAO index and Scandinavian index
Correlation = 0.81
Rainfall region as given in previous slideNAO and Scandinavian atmospheric mode indices from NOAA/CPC
Taken from Neil Ward presentation done in Rabat, Morocco - November 15th, 2012

Année
-60
-40
-20
0
20
40
60
80
100
120
1961 1966 1971 1976 1981 1986 1991 1996 2001 2006
Nicholson and Kim (1997) and Ward et al. (1999) shows some influence of ENSO on north-west African rainfall: the positive phase leads to fewer precipitation in spring.Knippertz et al. (2003) for 1982-1983 and 1991-1992
The spring of the second year was dry in many Moroccan stations: 1983, 1992, 1998, 2003, 2005 et 2007 (driouech (2010)
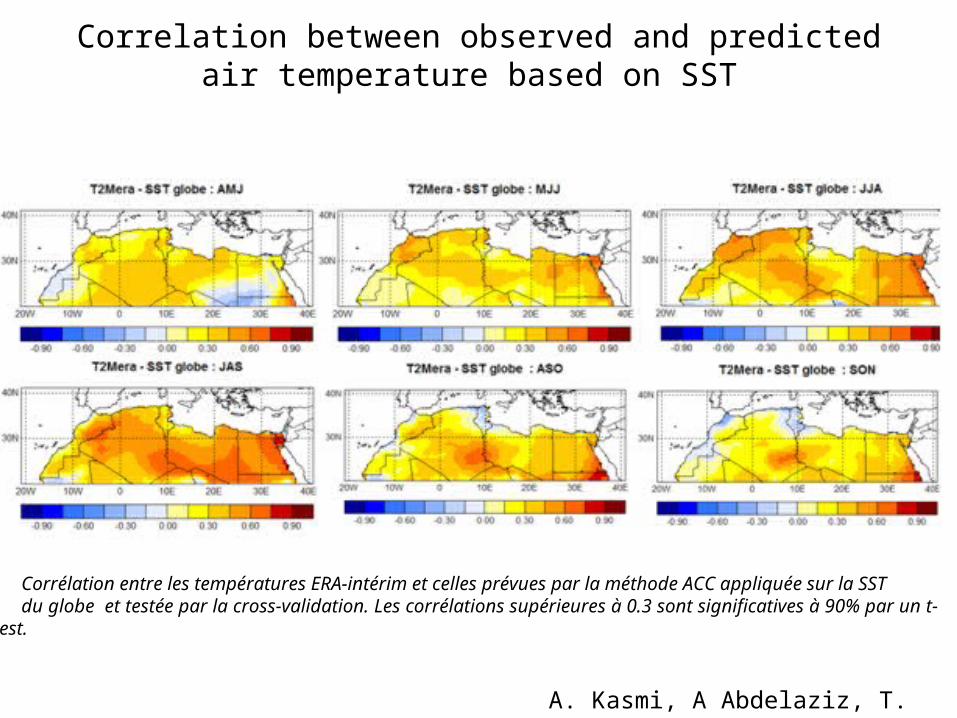
Correlation between observed and predicted air temperature based on SST
Corrélation entre les températures ERA-intérim et celles prévues par la méthode ACC appliquée sur la SST du globe et testée par la cross-validation. Les corrélations supérieures à 0.3 sont significatives à 90% par un t-
test.
A. Kasmi, A Abdelaziz, T. Soubai
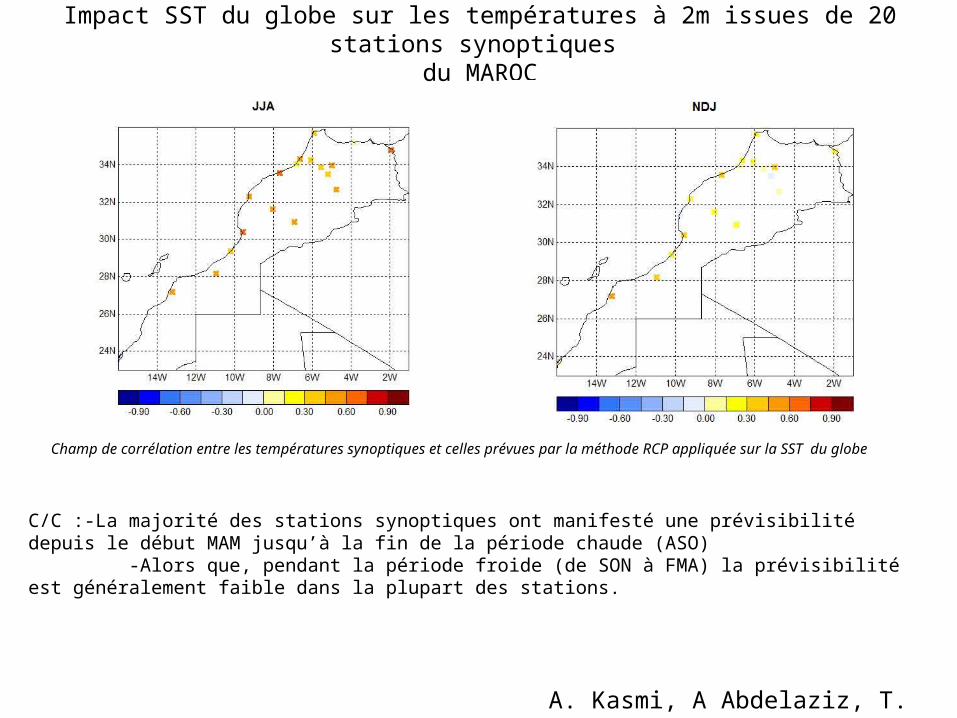
Impact SST du globe sur les températures à 2m issues de 20 stations synoptiques du MAROC
C/C :-La majorité des stations synoptiques ont manifesté une prévisibilité depuis le début MAM jusqu’à la fin de la période chaude (ASO) -Alors que, pendant la période froide (de SON à FMA) la prévisibilité est généralement faible dans la plupart des stations.
Champ de corrélation entre les températures synoptiques et celles prévues par la méthode RCP appliquée sur la SST du globe
A. Kasmi, A Abdelaziz, T. Soubai

Apport de l’adaptation statistique utilisant Z500 issue d’ARPEGE-Climat pour la T2m sur le Maroc
C/C : L’utilisation de l’adaptation statistique a permis d’améliorer la performance de la prévisibilité des températures à2m sur le Maroc pour les saisons JFM, FMA et MAM ( fin d’hiver et printemps)
A. Kasmi, A Abdelaziz, T. Soubai