DIRECT TESTIMONY OF JAMES W. NEELY, P.E. ON BEHALF OF
39
DIRECT TESTIMONY OF JAMES W. NEELY DOCKET NO. 2019-184-E Page 1 of 27 DIRECT TESTIMONY OF JAMES W. NEELY, P.E. ON BEHALF OF DOMINION ENERGY SOUTH CAROLINA, INC. DOCKET NO. 2019-184-E Q. PLEASE STATE YOUR NAME AND BUSINESS ADDRESS. 1 A. My name is James W. Neely and my business address is 220 Operation Way, 2 Cayce, South Carolina. 3 4 Q. BY WHOM ARE YOU EMPLOYED AND IN WHAT CAPACITY? 5 A. I am employed by Dominion Energy South Carolina, Inc. (“DESC” or the 6 “Company”) 1 as a Senior Resource Planning Engineer. 7 8 Q. PLEASE DESCRIBE YOUR DUTIES RELATED TO RESOURCE 9 PLANNING IN YOUR CURRENT POSITION. 10 A. I am responsible for modeling DESC’s electric system for the purpose of 11 calculating avoided costs, determining the least cost resource plan, forecasting fuel 12 costs, and evaluating changes to electric generation. 13 1 South Carolina Electric & Gas Company (“SCE&G”) changed its name to Dominion Energy South Carolina, Inc. in April 2019, as a result of the acquisition of SCANA Corporation by Dominion Energy, Inc. For consistency, I use “DESC” to refer to the Company both before and after this name change. ELECTRONICALLY FILED - 2019 August 23 3:44 PM - SCPSC - Docket # 2019-184-E - Page 1 of 39
Transcript of DIRECT TESTIMONY OF JAMES W. NEELY, P.E. ON BEHALF OF

DIRECT TESTIMONY OF JAMES W. NEELY DOCKET NO. 2019-184-E
Page 1 of 27
DIRECT TESTIMONY OF
JAMES W. NEELY, P.E.
ON BEHALF OF
DOMINION ENERGY SOUTH CAROLINA, INC.
DOCKET NO. 2019-184-E
Q. PLEASE STATE YOUR NAME AND BUSINESS ADDRESS. 1
A. My name is James W. Neely and my business address is 220 Operation Way, 2
Cayce, South Carolina. 3
4
Q. BY WHOM ARE YOU EMPLOYED AND IN WHAT CAPACITY? 5
A. I am employed by Dominion Energy South Carolina, Inc. (“DESC” or the 6
“Company”)1 as a Senior Resource Planning Engineer. 7
8
Q. PLEASE DESCRIBE YOUR DUTIES RELATED TO RESOURCE 9
PLANNING IN YOUR CURRENT POSITION. 10
A. I am responsible for modeling DESC’s electric system for the purpose of 11
calculating avoided costs, determining the least cost resource plan, forecasting fuel 12
costs, and evaluating changes to electric generation. 13
1 South Carolina Electric & Gas Company (“SCE&G”) changed its name to Dominion
Energy South Carolina, Inc. in April 2019, as a result of the acquisition of SCANA Corporation by Dominion Energy, Inc. For consistency, I use “DESC” to refer to the Company both before and after this name change.
ELECTR
ONICALLY
FILED-2019
August233:44
PM-SC
PSC-D
ocket#2019-184-E
-Page1of39

DIRECT TESTIMONY OF JAMES W. NEELY DOCKET NO. 2019-184-E
Page 2 of 27
Q. DESCRIBE YOUR EDUCATIONAL BACKGROUND AND 1
PROFESSIONAL EXPERIENCE. 2
A. In 1984 I graduated from Clemson University with a Bachelor of Science 3
degree in electrical engineering. I received a Master of Science degree in 4
management from Southern Wesleyan University in 2002. I received a Bachelor of 5
Science degree from Mars Hill University in 1979. I was employed by SCE&G as 6
a design engineer at V.C. Summer Station from 1992 to 1997. In 1997 I went to 7
work in the SCE&G Resource Planning department as a Resource Planning 8
Engineer. In 2013 I was promoted to Senior Resource Planning Engineer. 9
10
Q. HAVE YOU PREVIOUSLY TESTIFIED BEFORE THE PUBLIC SERVICE 11
COMMISSION OF SOUTH CAROLINA (“COMMISSION”)? 12
A. Yes. 13
14
Q. WHAT IS THE PURPOSE OF YOUR TESTIMONY? 15
A. The purpose of my testimony is to discuss the resource plan study that 16
describes the various generation planning scenarios analyzed and to present the 17
resource plan on which avoided energy costs calculations are based. 18
I also discuss and present the following: 19
(1) DESC’s avoided costs for power purchases under the Public Utility 20
Regulatory Policies Act of 1978 (“PURPA”); 21
ELECTR
ONICALLY
FILED-2019
August233:44
PM-SC
PSC-D
ocket#2019-184-E
-Page2of39
DIRECT TESTIMONY OF JAMES W. NEELY DOCKET NO. 2019-184-E
Page 3 of 27
(2) the long-run avoided costs for solar qualifying facilities (“QFs”) that have 1
production capacity up to 2 megawatts (“MW”) and are set forth in the 2
Standard Offer Power Purchase Agreement attached to the direct 3
testimony of Company Witness John E. Folsom as Exhibit No. __ (JEF-4
2), 5
(3) the long-run avoided cost for solar QFs with storage that is charged by 6
solar, 7
(4) the short-run avoided costs for QFs that have power production capacity 8
less than or equal to 100 kilowatts (“kW”) and are set forth in Rate 9
Schedule PR-1 attached to Witness Rooks’ testimony as Exhibit No. __ 10
(AWR-2), and 11
(5) the 11 components contained in the net energy metering (“NEM”) 12
methodology approved by the Commission in Order No. 2015-194 issued 13
in Docket No. 2014-246-E. 14
15
RESOURCE PLAN STUDY 16
Q. HAS DESC CONDUCTED A RESOURCE PLANNING STUDY? 17
A. Yes. My department performed a resource study for DESC (“Resource 18
Study”), which is attached as Exhibit No. __ (JWN-1). It shows nineteen resource 19
plans evaluated under four different sets of assumptions, for a total of 76 different 20
scenarios. The Resource Study determined the current resource plan as set forth in 21
ELECTR
ONICALLY
FILED-2019
August233:44
PM-SC
PSC-D
ocket#2019-184-E
-Page3of39
DIRECT TESTIMONY OF JAMES W. NEELY DOCKET NO. 2019-184-E
Page 4 of 27
the Company’s Integrated Resource Plan filed with the Commission on February 8, 1
2019, and in Table 1 of Exhibit No. ___ (JWN-1). 2
3
Q. WHAT SCENARIOS WERE CONSIDERED IN DEVELOPING DESC’S 4
CURRENT RESOURCE PLAN? 5
A. DESC considered nineteen different resource plans when developing the 6
current resource plan. The resource plans are described in Table 1 below and 7
discussed in more detail in Exhibit No. __ (JWN-1). Please note that “CC” is 8
shorthand for Combined Cycle, “ICT” is shorthand for Internal Combustion 9
Turbine, and “PPA” is shorthand for Power Purchase Agreement. Solar Ownership 10
describes a DESC-owned solar resource. 11
12
13
14
15
16
17
18
ELECTR
ONICALLY
FILED-2019
August233:44
PM-SC
PSC-D
ocket#2019-184-E
-Page4of39

DIRECT TESTIMONY OF JAMES W. NEELY DOCKET NO. 2019-184-E
Page 5 of 27
Table 1 1
Scenario Number Resource Plan
Description 1 Battery-1 Ten 100 MW, 400 MWh System Batteries
2 Battery-1 w/ Solar Ownership Ten 100 MW, 400 MWh system batteries + Ten 100 MW solar generators
3 Battery-2 Ten 100 MW, 400 MWh System Batteries
4 Battery-2 w/ Solar Ownership Ten 100 MW, 400 MWh system batteries + Ten 100 MW solar generators)
5 CC 1081 MW One 1-on-1 CC generator
6 CC 540 MW + Retire Coal One 1-on-1 CC generator with the retirement of a 342 MW coal generator
7 CC 540 MW x2 Two 1-on-1 CC generators
8 CC 540 MW w/ Battery-1 Two 1-on-1 CC generators + One 100 MW, 400 MWh System Battery
9 CC 540 MW w/ Battery-2 Two 1-on-1 CC generators + One 100 MW, 400 MWh System Battery
10 CC 540 MW w/ ICT 337 MW One 540 MW 1-on-1 CC gas generator + two 337 MW ICT generators
11 CC 540 MW w/ ICT 93 MW
One 540 MW 1-on-1 CC gas generating plant is added in the winter of 2029. The rest of the expansion plan is filled out with five 93 MW ICT generators
12 ICT 337 MW Three 337 MW ICT generators 13 ICT 93 MW Ten 93 MW ICT generators 14 Solar Ownership w/ ICT 93 MW Ten 100 MW solar generators + ten 93 MW ICTs
15 Solar Ownership w/ ICT 93 MW + Retire Gas
Ten 100 MW solar generators + fourteen 93 MW ICTs + retirement of 345 MW of gas-fired steam plants
16 Solar PPA 200 MW w/ ICT 93 MW ($30)
200 MWs of solar PPAs with an energy prices of $30/MWh in 2018 and growing at 2% per year + ten 93 MW ICTs
17 Solar PPA 400 MW w/ ICT 93 MW ($30)
400 MWs of solar PPAs with an energy prices of $30/MWh in 2018 and growing at 2% per year + ten 93 MW ICTs
18 Solar PPA 400 MW w/ ICT 93 MW ($35)
400 MWs of solar PPAs with an energy prices of $35/MWh in 2018 and growing at 2% per year + ten 93 MW ICTs
19 Solar PPA 400 MW w/ ICT 93 MW ($40)
400 MWs of solar PPAs with an energy prices of $40/MWh in 2018 and growing at 2% per year + ten 93 MW ICTs
2
ELECTR
ONICALLY
FILED-2019
August233:44
PM-SC
PSC-D
ocket#2019-184-E
-Page5of39
DIRECT TESTIMONY OF JAMES W. NEELY DOCKET NO. 2019-184-E
Page 6 of 27
Q. WHAT SENSITIVITIES IN THE ASSUMPTIONS WERE CONSIDERED IN 1
DEVELOPING DESC’S CURRENT RESOURCE PLAN? 2
A. DESC considered four sets of assumptions when developing the current 3
resource plan: 1) Base Gas Prices with Zero CO2 Costs, 2) High Gas Prices with 4
$15/ton CO2 costs, 3) High Gas Prices with Zero CO2 Costs, and 4) Base Gas Prices 5
with $15/ton CO2 Costs. 6
7
Q. HOW WAS THE CURRENT RESOURCE PLAN SELECTED? 8
A. Base gas prices and zero CO2 costs were used to select the current plan. Base 9
gas prices is the most likely gas scenario and CO2 costs are currently zero and future 10
costs are uncertain at this point. 11
12
AVOIDED COSTS UNDER PURPA 13
Q. WHAT DOES PURPA REQUIRE? 14
A. PURPA and its implementing regulations require electric utilities, including 15
DESC, to purchase electric energy from qualifying facilities (“QF”) at the utilities’ 16
avoided costs. However, state public utility commissions, such as the Commission, 17
determine the method for calculating avoided costs, which are updated on a periodic 18
basis. The Commission held proceedings in the early 1980s to establish the 19
respective methodologies for determining the avoided costs of each electric utility. 20
Determining a utility’s avoided costs using an approved methodology is a process 21
that has been ongoing for decades. 22
ELECTR
ONICALLY
FILED-2019
August233:44
PM-SC
PSC-D
ocket#2019-184-E
-Page6of39
DIRECT TESTIMONY OF JAMES W. NEELY DOCKET NO. 2019-184-E
Page 7 of 27
1
Q. WHAT ARE AVOIDED COSTS? 2
A. PURPA regulations define “avoided costs” as “the incremental costs to an 3
electric utility of electric energy or capacity or both which, but for the purchase from 4
the qualifying facility or qualifying facilities, such utility would generate itself or 5
purchase from another source.” 18 C.F.R. § 292.101(b)(6). The Federal Energy 6
Regulatory Commission (“FERC”) further recognizes that avoided costs include 7
two components: “energy” and “capacity.” Specifically, “[e]nergy costs are the 8
variable costs associated with the production of electric energy (kilowatt-hours). 9
They represent the cost of fuel, and some operating and maintenance expenses. 10
Capacity costs are the costs associated with providing the capability to deliver 11
energy; they consist primarily of the capital costs of facilities.” Small Power 12
Production and Cogeneration Facilities; Regulations Implementing Section 210 of 13
the Public Utility Regulatory Policies Act of 1978, Order No. 69, 45 Fed. Reg. 14
12,214, 12,216 (Feb. 25, 1980) (“Order No. 69”). In Order No. 81-214 and 15
subsequent decisions, the Commission has recognized that utilities are entitled to 16
recover their avoided costs under PURPA. 17
18
Q. WHAT APPROACH DOES DESC TAKE TO CALCULATE THE ENERGY 19
AND CAPACITY COMPONENTS OF AVOIDED COSTS? 20
A. As approved by the Commission in Orders No. 2016-297 and 2018-322(A), 21
DESC uses a Difference in Revenue Requirements (“DRR”) methodology to 22
ELECTR
ONICALLY
FILED-2019
August233:44
PM-SC
PSC-D
ocket#2019-184-E
-Page7of39
DIRECT TESTIMONY OF JAMES W. NEELY DOCKET NO. 2019-184-E
Page 8 of 27
calculate both the energy component and the capacity component of its avoided 1
costs. This approach follows directly from PURPA’s definition of avoided costs in 2
that it involves calculating the revenue requirements between a base case and a 3
change case. The base case is defined by DESC’s existing and future fleet of 4
generators and the hourly load profile to be served by these generators, as well as 5
the solar facilities with which DESC has executed a power purchase agreement. The 6
change case is the same as the base case except that a zero-cost purchase transaction 7
modeled after the appropriate 100 MW energy profile is assumed. 8
For the avoided energy cost determination a carefully constructed computer 9
program called PROSYM, which models the commitment and dispatch of 10
generating units to serve load hour-by-hour, makes two runs and estimates the 11
production costs and benefits that result from the purchase transaction. The base and 12
change cases are identical except for the zero-cost purchase transaction. The 13
avoided energy cost is the difference between the base case costs and the change 14
case costs. 15
16
Q. WHAT PERIOD OF TIME DOES THE COMPANY USE TO CALCULATE 17
ITS AVOIDED COSTS? 18
A. There are two time periods used to calculate avoided costs. The short-run 19
avoided energy costs are based on one year and calculated for the period May 2019 20
through April 2020. The long-run avoided energy costs are calculated for calendar 21
ELECTR
ONICALLY
FILED-2019
August233:44
PM-SC
PSC-D
ocket#2019-184-E
-Page8of39
DIRECT TESTIMONY OF JAMES W. NEELY DOCKET NO. 2019-184-E
Page 9 of 27
years 2020 through 2029. These 10 years are divided into two groups of five years 1
each: 2020-2024, and 2025-2029. Avoided capacity costs uses a 10-year period. 2
3
AVOIDED COST RATE FOR THE STANDARD OFFER RATE 4
Q. DO CERTAIN SOLAR PPAs PROVIDE DESC THE OPPORTUNITY TO 5
RECOVER VARIABLE INTEGRATION COSTS? 6
A. Yes. There are approximately 700 MWs of PPAs with a Variable Integration 7
Charge (“VIC”) clause that allows DESC to recover costs associated with the 8
variable nature of solar. These costs were not captured in the avoided cost 9
calculations filed previously with the Commission. 10
11
Q. ARE THERE COSTS TO DESC TO INTEGRATE THE VARIABLE 12
ENERGY SUPPLY FROM SOLAR, AND IS IT POSSIBLE AND 13
APPROPRIATE TO DETERMINE SUCH COSTS FOR THOSE SOLAR 14
GENERATORS OBLIGATED TO PAY THESE COSTS UNDER EXISTING 15
PPAs? 16
A. Yes and Yes. The Company experiences real and measurable costs to 17
integrate the energy supplied by solar generators due to the variable nature of the 18
supply. In this proceeding Company Witness Dr. Matthew Tanner was employed 19
for the purpose of calculating the Variable Integration Charge (“VIC”). For the 20
benefit of rate payers, we plan to recover these costs from solar generators whose 21
ELECTR
ONICALLY
FILED-2019
August233:44
PM-SC
PSC-D
ocket#2019-184-E
-Page9of39

DIRECT TESTIMONY OF JAMES W. NEELY DOCKET NO. 2019-184-E
Page 10 of 27
previously signed PPAs include terms allowing recovery of variable integration 1
costs. 2
3
Q. IN THIS PROCEEDING IS DESC PROPOSING TO APPLY THE VIC 4
CALCULATED BY DR. TANNER TO NEW PPAs? 5
A. No. The most appropriate method of addressing issues created by solar 6
intermittency is to model the system with higher operating reserves. The increase in 7
operating reserves is now part of the model and is reflected in our estimated avoided 8
energy costs. Therefore, there is no additional charge included in the avoided costs 9
for integration, however, the Company reserves the right to present in a future 10
proceeding other integration charges that the Company may identify based upon 11
operating experience, study, or analysis. 12
13
Q. HAVE YOU MADE ANY OBSERVATIONS REGARDING THE AMOUNT 14
OF RESERVES REQUIRED TO COVER THE INTERMITTENCY OF 15
SOLAR GENERATION? 16
Yes. We observed that additional reserves equal to 35% of the installed solar 17
capacity is sufficient to cover most of the one-hour solar intermittency. The avoided 18
cost calculations included in this testimony were modeled with additional reserves 19
equal to 35% of the installed solar capacity, during solar generating hours. As more 20
solar is added to the DESC system, these percentages may change and the new 21
operating reserve requirements will be reflected in future avoided cost calculations. 22
ELECTR
ONICALLY
FILED-2019
August233:44
PM-SC
PSC-D
ocket#2019-184-E
-Page10
of39
DIRECT TESTIMONY OF JAMES W. NEELY DOCKET NO. 2019-184-E
Page 11 of 27
Q. HOW DOES DESC CALCULATE ITS AVOIDED ENERGY COSTS FOR 1
QF FACILITIES TAKING THE COMPANY’S STANDARD OFFER RATE? 2
A. DESC uses PROSYM to estimate the change in production costs that result 3
from serving the loads in the base case and the change case. The change case for 4
non-solar QFs is derived from the base case by subtracting a 100 MW round-the-5
clock power purchase profile. The avoided costs are then accumulated into four 6
time-of-use periods. The change case for solar QFs is derived from the base case by 7
subtracting a 100 MW power purchase modeled after a solar profile. Avoided energy 8
costs are calculated for calendar years 2020 through 2029. These 10 years are 9
divided into two groups of five years each: 2020-2024, and 2025-2029. 10
11
Q. HOW DOES DESC CALCULATE ITS AVOIDED CAPACITY COSTS FOR 12
QF FACILITIES TAKING THE COMPANY’S STANDARD OFFER RATE? 13
A. As previously discussed, DESC takes a similar approach to determining 14
avoided capacity costs as it does with avoided energy costs. Using the DRR 15
methodology approved by the Commission in Order No. 2016-297, DESC 16
calculates the difference in the revenue requirement between the base case and the 17
change case. Using the resource plan in its latest IRP or an updated resource plan if 18
appropriate, DESC calculates the incremental capital investment related revenue 19
required to support the existing resource plan. For the calculation of avoided 20
capacity costs, DESC derives a change case in its resource plan by considering the 21
impact of a QF purchase from a 100 MW facility. The avoided capacity cost is the 22
ELECTR
ONICALLY
FILED-2019
August233:44
PM-SC
PSC-D
ocket#2019-184-E
-Page11
of39
DIRECT TESTIMONY OF JAMES W. NEELY DOCKET NO. 2019-184-E
Page 12 of 27
difference between the incremental capacity costs in the base resource plan and the 1
change plan. 2
3
Q. WHY IS THIS METHOD REASONABLE? 4
A. This method identifies adjustments to the utility's expansion plan that are 5
attributable to purchases from QFs. The cost associated with these adjustments is 6
then quantified and accurately reflects the capacity cost benefits that would result 7
from the QF purchase. 8
9
Q. USING THIS METHODOLOGY, WHAT ARE THE AVOIDED CAPACITY 10
COSTS FOR THE STANDARD OFFER RATE? 11
A. The avoided capacity cost for solar QFs subject to the Standard Offer Rate is 12
zero. Incremental solar QFs do not affect the resource plan and therefore avoid no 13
future resources or their cost. 14
For non-solar QFs that qualify for the Standard Offer Rate, the avoided 15
capacity cost is $73.46/MWh, but this value only applies for a limited period of 16
time. These avoided capacity rates will be paid during the months of December, 17
January and February for energy generated from 6 am to 9 am. In order to qualify 18
for this credit, the Seller's generation should be fully dispatchable during all of the 19
capacity credit hours identified above. 20
21
ELECTR
ONICALLY
FILED-2019
August233:44
PM-SC
PSC-D
ocket#2019-184-E
-Page12
of39
DIRECT TESTIMONY OF JAMES W. NEELY DOCKET NO. 2019-184-E
Page 13 of 27
Q. WHY DOES ADDITIONAL SOLAR CAPACITY NOT AFFECT DESC’S 1
FUTURE CAPACITY NEEDS? 2
A. DESC performed a study that analyzed the impact of solar on its daily peak 3
demands. This study titled “The Capacity Benefit of Solar QFs 2018 Study,” a copy 4
of which is attached to the Direct Testimony of Company Witness Dr. Joseph M. 5
Lynch as Exhibit No. __ (JML-1). 6
DESC’s need for capacity is driven by the winter season. Solar does not help 7
with the capacity need primarily because the winter peak occurs either early in the 8
morning before solar begins to generate energy or in the evening after solar is no 9
longer generating. Because solar does not consistently provide capacity during the 10
winter peak periods, the Company is unable to avoid any of its projected future 11
capacity needs and, therefore, the avoided capacity cost of solar is zero. 12
13
Q. WHY IS DESC USING A 10-YEAR PERIOD IN ITS EVALUATION OF 14
AVOIDED COSTS? 15
A. It is important to recognize that projections of future avoided energy costs 16
are uncertain. Therefore, using projected costs beyond the 10-year period required 17
by Act No. 62 would be speculative and could increase the costs paid by DESC’s 18
customers. 19
20
21
ELECTR
ONICALLY
FILED-2019
August233:44
PM-SC
PSC-D
ocket#2019-184-E
-Page13
of39
DIRECT TESTIMONY OF JAMES W. NEELY DOCKET NO. 2019-184-E
Page 14 of 27
Q. BASED ON THE COMPANY’S APPROVED METHODOLOGY, WHAT 1
ARE DESC’S AVOIDED COSTS FOR THE STANDARD OFFER RATE? 2
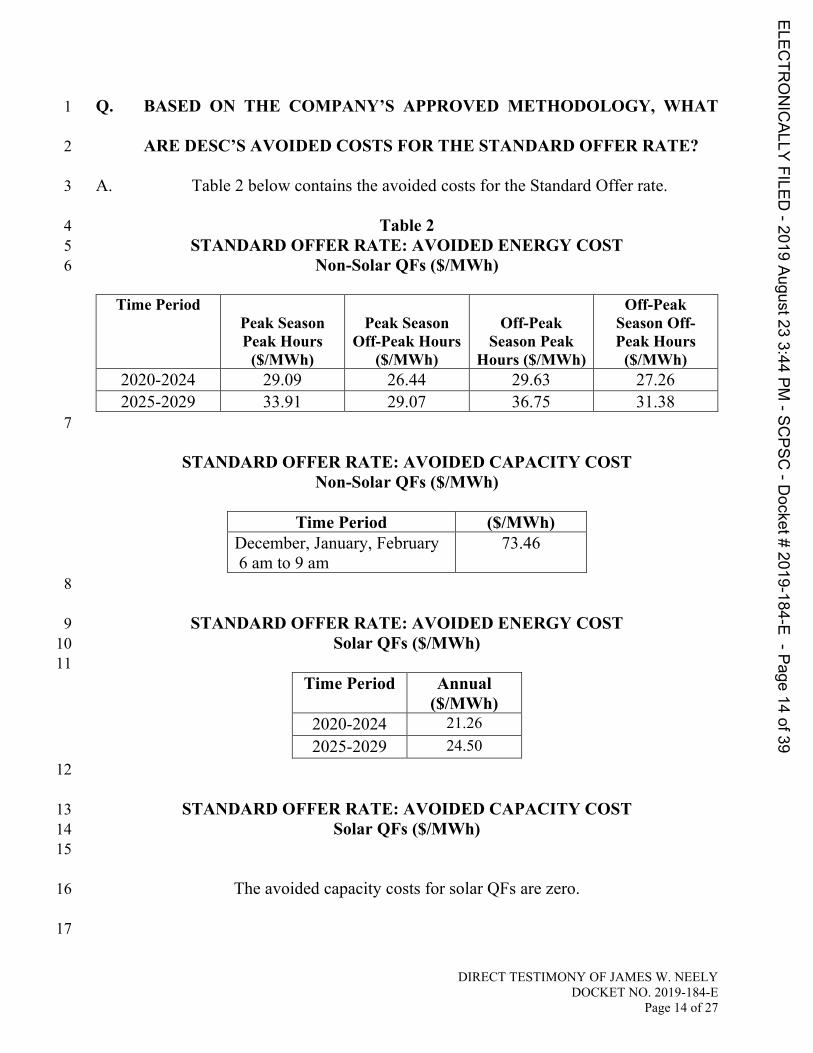
A. Table 2 below contains the avoided costs for the Standard Offer rate. 3
Table 2 4 STANDARD OFFER RATE: AVOIDED ENERGY COST 5
Non-Solar QFs ($/MWh) 6
Time Period Peak Season Peak Hours
($/MWh)
Peak Season Off-Peak Hours
($/MWh)
Off-Peak Season Peak
Hours ($/MWh)
Off-Peak Season Off-Peak Hours
($/MWh) 2020-2024 29.09 26.44 29.63 27.26 2025-2029 33.91 29.07 36.75 31.38
7
STANDARD OFFER RATE: AVOIDED CAPACITY COST Non-Solar QFs ($/MWh)
Time Period ($/MWh)
December, January, February 6 am to 9 am
73.46
8
STANDARD OFFER RATE: AVOIDED ENERGY COST 9 Solar QFs ($/MWh) 10
11 Time Period Annual
($/MWh) 2020-2024 21.26 2025-2029 24.50
12
STANDARD OFFER RATE: AVOIDED CAPACITY COST 13 Solar QFs ($/MWh) 14
15
The avoided capacity costs for solar QFs are zero. 16
17
ELECTR
ONICALLY
FILED-2019
August233:44
PM-SC
PSC-D
ocket#2019-184-E
-Page14
of39

DIRECT TESTIMONY OF JAMES W. NEELY DOCKET NO. 2019-184-E
Page 15 of 27
Q. HOW WILL DESC ADDRESS AVOIDED COSTS FOR QFs OF GREATER 1
THAN TWO (2) MW? 2
A. DESC plans to negotiate contracts with any QF greater than 2 MW for which 3
the PR-1 Rate and Standard Offer Rate is not appropriate. The methodology for 4
calculating the avoided capacity and avoided energy will be consistent with the 5
avoided cost methodology outlined previously. The differences lie in using unit 6
specific data to calculate avoided costs. Other specific requirements are described 7
in the Rate PR – Avoided Cost Methodology attached to Company Witness Rooks’ 8
testimony as Exhibit No. __ (AWR-5). 9
10
AVOIDED COST RATE FOR SOLAR WITH STORAGE 11
Q. IS DESC PROVIDING A TARIFF FOR SOLAR WITH STORAGE? 12
A. No. The following discussion provides indicative avoided costs calculations 13
for solar with storage in accordance with Act No. 62, Section 58-41-20(B)(3). The 14
MW requirements for solar with storage would place it in the category of projects 15
above 2 MW that must be negotiated under the terms of Rate PR - Form PPA 16
attached to Company Witness Rooks’ testimony as Exhibit No. __ (AWR-7). 17
18
Q. HAS DESC CALCULATED AVOIDED COSTS FOR SOLAR WITH 19
STORAGE? 20
A. Yes. 21
22
ELECTR
ONICALLY
FILED-2019
August233:44
PM-SC
PSC-D
ocket#2019-184-E
-Page15
of39

DIRECT TESTIMONY OF JAMES W. NEELY DOCKET NO. 2019-184-E
Page 16 of 27
Q. HOW WAS THE AVOIDED COST CALCULATED? 1
A. In order to calculate the benefit of solar with storage, two benefits were 2
identified. The first benefit is the energy benefit. The energy benefit is determined 3
by finding the difference in avoided energy cost of one system with 100 MW solar 4
and another system with 100 MW solar and 25 MW storage. 5
The second benefit is capacity benefit. To calculate the capacity benefit we 6
assumed 100 MW of capacity is added to the system in 2020 which causes a shift 7
of needed resources and their costs. Next we calculate the 10-year levelized change 8
in revenue requirements. This value becomes the capacity benefit in $/kW. 9
The energy benefit is multiplied times the estimated solar generation to get 10
an annual energy benefit. The levelized capacity benefit is multiplied times the 11
storage capacity kW to get the annual capacity benefit. The sum of these two values 12
divided by 12 months divided by the storage capacity creates the total system benefit 13
for the storage in $/kW per month. 14
15
Q. BASED ON THE COMPANY’S METHODOLOGY, WHAT ARE DESC’S 16
AVOIDED COSTS FOR THE SOLAR WITH STORAGE RATE? 17
A. Table 3 below contains the avoided costs for the solar with storage rate. 18
ELECTR
ONICALLY
FILED-2019
August233:44
PM-SC
PSC-D
ocket#2019-184-E
-Page16
of39

DIRECT TESTIMONY OF JAMES W. NEELY DOCKET NO. 2019-184-E
Page 17 of 27
Table 3 1 2
AVOIDED COST 3 SOLAR WITH STORAGE 4
Time Period Annual ($/MWh)
Annual ($/kWh)
Monthly ($/kW)
2020-2024 21.26 0.02126 3.17 2025-2029 24.50 0.02450 3.17
5
Q. WHAT ARE THE REQUIREMENTS TO PROVIDE SOLAR WITH 6
STORAGE AND RECEIVE THE SOLAR WITH STORAGE AVOIDED 7
COST? 8
A. The storage system must initially have a minimum capacity of 15 MW-AC 9
and have the ability to deliver its maximum capacity for four consecutive hours 10
when fully charged. Degradation of the storage system will be specifically 11
addressed in any final contractual arrangements between the provider and DESC. 12
DESC will control the dispatch of the storage. 13
The fixed monthly payment is intended to compensate the Seller for all 14
aspects of the storage, including, but not limited to, avoided capacity costs and the 15
dispatch rights associated with the discharge of the storage system. 16
17
18
19
20
21
ELECTR
ONICALLY
FILED-2019
August233:44
PM-SC
PSC-D
ocket#2019-184-E
-Page17
of39
DIRECT TESTIMONY OF JAMES W. NEELY DOCKET NO. 2019-184-E
Page 18 of 27
PR-1 RATE 1
Q. HOW DOES DESC COMPUTE THE AVOIDED ENERGY COMPONENT 2
FOR SOLAR QFs SUBJECT TO THE PR-1 RATE? 3
A. DESC uses the same methodology to estimate avoided energy costs for solar 4
QFs on PR-1 as it did for solar QFs in the Standard Offer Rate. The only difference 5
is the time period over which the avoided energy costs are estimated. The short-run 6
avoided energy costs in the PR-1 Rate are calculated for the period May 2019 7
through April 2020 whereas the Standard Offer Rate is a 10-year calculation. Losses 8
for PR-1 are also different. Losses for PR-1 are on calculated at the primary 9
distribution level. 10
11
Q. HOW DOES DESC COMPUTE THE AVOIDED ENERGY COMPONENT 12
FOR NON-SOLAR QFs SUBJECT TO THE PR-1 RATE? 13
A. As discussed previously, DESC uses PROSYM to estimate the change in 14
production costs that result from serving the base case load and the change case. 15
The change case for non-solar QFs is derived from the base case by subtracting a 16
100 MW round-the-clock power purchase profile. The avoided costs are then 17
accumulated into four time-of-use periods set forth in Table 4. A non-solar QF 18
would be paid based on how much energy it produces in each of these four time-of-19
use periods. 20
21
ELECTR
ONICALLY
FILED-2019
August233:44
PM-SC
PSC-D
ocket#2019-184-E
-Page18
of39
DIRECT TESTIMONY OF JAMES W. NEELY DOCKET NO. 2019-184-E
Page 19 of 27
Q. HOW DOES DESC COMPUTE THE AVOIDED CAPACITY COMPONENT 1
FOR SOLAR AND NON-SOLAR QFs SUBJECT TO THE PR-1 RATE? 2
A. DESC takes a similar approach to determining avoided capacity costs as it 3
does with avoided energy costs. Using the DRR methodology approved by the 4
Commission in Order No. 2016-297, DESC calculates the difference in the revenue 5
requirement between the base case and the change case. Using the resource plan in 6
its latest IRP or an updated resource plan if appropriate, DESC calculates the 7
incremental capital investment related revenue required to support the existing 8
resource plan. As with its calculation of avoided energy costs, DESC derives a 9
change case in its resource plan by considering the impact of a QF purchase from a 10
100 MW facility. The avoided capacity cost is the difference between the 11
incremental capacity costs in the base resource plan and the change plan. 12
13
Q. WHAT IS THE AVOIDED CAPACITY COST COMPONENT FOR QFs IN 14
THE PR-1 RATE? 15
A. The avoided capacity cost for solar QFs subject to the PR-1 Rate is zero. 16
Incremental solar QFs do not affect the resource plan and therefore avoid no future 17
resources or their cost. 18
For non-solar QFs that qualify for the PR-1 Rate, the avoided capacity cost 19
is $0.07346/kWh. It will be paid during the months of December, January and 20
February for energy generated from 6 am to 9 am. The capacity payment is available 21
only to generators capable of providing power in all of the identified hours. 22
ELECTR
ONICALLY
FILED-2019
August233:44
PM-SC
PSC-D
ocket#2019-184-E
-Page19
of39

DIRECT TESTIMONY OF JAMES W. NEELY DOCKET NO. 2019-184-E
Page 20 of 27
Q. WHAT ADJUSTMENTS ARE MADE TO THE AVOIDED COSTS IN THE 1
PR-1 RATE? 2
A. The avoided energy cost results for both solar QFs and non-solar QFs are 3
adjusted for line losses, working capital impacts, gross receipts taxes, and 4
generation taxes. 5
6
Q. WHAT IS THE RESULTING PR-1 RATE? 7
A. The avoided costs are shown in Table 4 below. 8
Table 4 9 10
PR-1 RATE: AVOIDED ENERGY COST 11 Non-Solar QFs ($/kWh) 12
Time Period
Peak Season Peak Hours
($/kWh)
Peak Season Off-Peak Hours
($/kWh)
Off-Peak Season Peak Hours
($/kWh)
Off-Peak Season Off-Peak Hours
($/kWh) May 2019-April 2020
0.02843 0.02738 0.03508 0.03364
PR-1 RATE: AVOIDED CAPACITY COST
Non-Solar QFs ($/kWh)
Time Period ($/kWh) December, January, February 6 am to 9 am
0.07346
PR-1 RATE: AVOIDED ENERGY COST 13 Solar QFs ($/kWh) 14
Time Period Year Round
($/kWh) May 2019-April 2020 0.03149
ELECTR
ONICALLY
FILED-2019
August233:44
PM-SC
PSC-D
ocket#2019-184-E
-Page20
of39

DIRECT TESTIMONY OF JAMES W. NEELY DOCKET NO. 2019-184-E
Page 21 of 27
PR-1 RATE: AVOIDED CAPACITY COST 1 Solar QFs ($/kWh) 2
3
The avoided capacity costs for solar QFs are zero. 4
5 COMPONENTS OF VALUE FOR 6
NET ENERGY METERING DISTRIBUTED ENERGY RESOURCES 7 8
Q. WHAT ARE THE COMPONENTS OF VALUE FOR NEM DISTRIBUTED 9
ENERGY RESOURCES? 10
A. By way of its Order No. 2015-194 issued in Docket No. 2014-246-E, the 11
Commission approved the following 11 components of value for NEM Distributed 12
Energy Resources: 13
Net Energy Metering Methodology 14 1. +/- Avoided Energy 15 2. +/- Energy Losses/Line Losses 16 3. +/- Avoided Capacity 17 4. +/- Ancillary Services 18 5. +/- T&D Capacity 19 6. +/- Avoided Criteria Pollutants 20 7. +/- Avoided CO2 Emission Cost 21 8. +/- Fuel Hedge 22 9. +/- Utility Integration & Interconnection Costs 23 10. +/- Utility Administration Costs 24 11. +/- Environmental Costs 25
= Total Value of NEM Distributed Energy Resources 26
27
Q. HAS DESC UPDATED THESE COMPONENTS OF VALUE? 28
A. Yes. Table 5 shows the updated components of value for NEM Distributed 29
Energy Resources. Two columns of numbers are shown: one for the current value 30
and one for the value over the 10 year planning period. The difference between these 31
ELECTR
ONICALLY
FILED-2019
August233:44
PM-SC
PSC-D
ocket#2019-184-E
-Page21
of39
DIRECT TESTIMONY OF JAMES W. NEELY DOCKET NO. 2019-184-E
Page 22 of 27
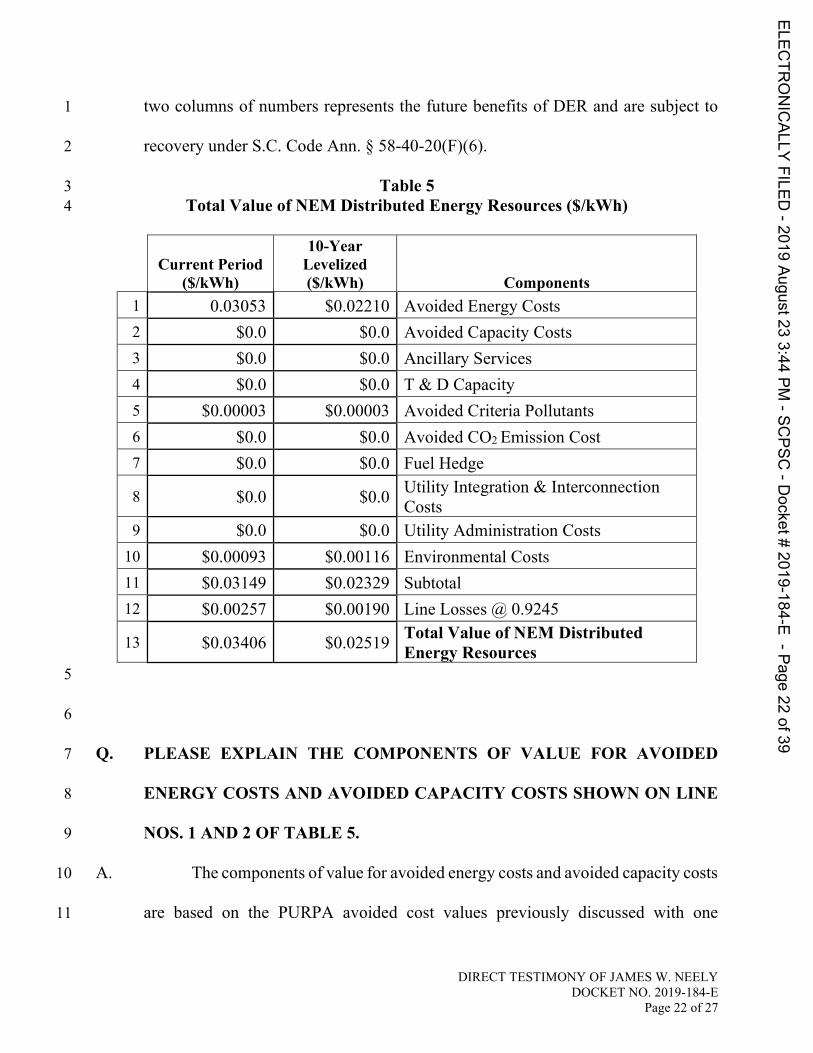
two columns of numbers represents the future benefits of DER and are subject to 1
recovery under S.C. Code Ann. § 58-40-20(F)(6). 2
Table 5 3 Total Value of NEM Distributed Energy Resources ($/kWh) 4
Current Period
($/kWh)
10-Year Levelized ($/kWh) Components
1 0.03053 $0.02210 Avoided Energy Costs 2 $0.0 $0.0 Avoided Capacity Costs 3 $0.0 $0.0 Ancillary Services 4 $0.0 $0.0 T & D Capacity 5 $0.00003 $0.00003 Avoided Criteria Pollutants 6 $0.0 $0.0 Avoided CO2 Emission Cost 7 $0.0 $0.0 Fuel Hedge
8 $0.0 $0.0 Utility Integration & Interconnection Costs
9 $0.0 $0.0 Utility Administration Costs 10 $0.00093 $0.00116 Environmental Costs 11 $0.03149 $0.02329 Subtotal 12 $0.00257 $0.00190 Line Losses @ 0.9245
13 $0.03406 $0.02519 Total Value of NEM Distributed Energy Resources 5
6
Q. PLEASE EXPLAIN THE COMPONENTS OF VALUE FOR AVOIDED 7
ENERGY COSTS AND AVOIDED CAPACITY COSTS SHOWN ON LINE 8
NOS. 1 AND 2 OF TABLE 5. 9
A. The components of value for avoided energy costs and avoided capacity costs 10
are based on the PURPA avoided cost values previously discussed with one 11
ELECTR
ONICALLY
FILED-2019
August233:44
PM-SC
PSC-D
ocket#2019-184-E
-Page22
of39
DIRECT TESTIMONY OF JAMES W. NEELY DOCKET NO. 2019-184-E
Page 23 of 27
adjustment. The avoided energy costs are adjusted to remove the cost of criteria 1
pollutants and environmental costs, which are then reflected in the components 2
shown on Lines 5 and 10, i.e., Avoided Criteria Pollutants and Environmental Costs. 3
Both the avoided energy costs and the avoided capacity costs are based on solar 4
QFs. 5
Q. PLEASE EXPLAIN THE COMPONENT OF VALUE FOR ANCILLARY 6
SERVICES SHOWN ON LINE NO. 3 OF TABLE 5. 7
A. Ancillary services refer to the need to balance the load and generation on the 8
system and include operating reserves, both spinning and non-spinning; frequency 9
regulation; and voltage control. We observed that additional operating reserves 10
equal to 35% of the installed solar capacity covers most of the one-hour solar 11
intermittency. These additional reserves create a net reduction in the avoided energy 12
costs, but because of the difficulty of splitting out the portion of avoided costs due 13
to increased reserves we left it in the avoided energy value. 14
15
Q. PLEASE EXPLAIN THE COMPONENT OF VALUE FOR TRANSMISSION 16
AND DISTRIBUTION CAPACITY SHOWN ON LINE NO. 4 OF TABLE 5. 17
A. DESC’s NEM distributed resources do not avoid transmission or distribution 18
capacity and therefore the value of this component is zero. On DESC’s transmission 19
system, customer-scale NEM resources are distributed across DESC’s transmission 20
system and have too small of an impact on any transmission circuit to result in 21
ELECTR
ONICALLY
FILED-2019
August233:44
PM-SC
PSC-D
ocket#2019-184-E
-Page23
of39

DIRECT TESTIMONY OF JAMES W. NEELY DOCKET NO. 2019-184-E
Page 24 of 27
avoided transmission capacity. For example, the most impacted substation currently 1
on DESC’s system is connected to 1,818 kW of solar capacity owned by 257 2
customers. The impact of a 1,818 kW change in load is much too small to affect the 3
planning of our need for a 115 kV or a 230 kV circuit, which carry loads between 4
237,000 and 948,000 kW. 5
On the distribution system, DESC’s engineers must design a circuit for 6
circumstances that will stress the circuit. In particular, since solar output is 7
intermittent during the day and non-existent at night, they must also plan for when 8
the DER is not supplying power. The distribution line must carry the load both when 9
the DER is generating and when it is not because of weather-related factors or 10
because DER resources are off line. 11
12
Q. PLEASE EXPLAIN THE COMPONENT OF VALUE FOR AVOIDED 13
CRITERIA POLLUTANTS SHOWN ON LINE NO. 5 OF TABLE 5. 14
A. DESC associates a positive avoided cost value to criteria pollutants NOx and 15
SO2. The avoided cost of these pollutants typically is included in the Company’s 16
avoided energy costs but, these costs have been separated out in this proceeding for 17
reporting purposes. 18
19
20
21
ELECTR
ONICALLY
FILED-2019
August233:44
PM-SC
PSC-D
ocket#2019-184-E
-Page24
of39
DIRECT TESTIMONY OF JAMES W. NEELY DOCKET NO. 2019-184-E
Page 25 of 27
Q. PLEASE EXPLAIN THE COMPONENT OF VALUE FOR AVOIDED CO2 1
POLLUTANTS SHOWN ON LINE NO. 6 OF TABLE 5. 2
A. Pursuant to Commission Order No. 2015-194, the component of value for 3
avoided CO2 is set at zero until state or federal laws or regulations result in an 4
avoidable cost on utility systems for these emissions. Currently, there are no state 5
or federal laws or regulations restricting the emission of CO2 pollutants and, 6
therefore, the value for CO2 pollutants is zero. 7
Q. PLEASE EXPLAIN THE COMPONENT OF VALUE FOR FUEL HEDGE 8
SHOWN ON LINE NO. 7 OF TABLE 5. 9
A. DESC does not hedge fuels for electric generation. Therefore, the value for 10
fuel hedging is zero. 11
12
Q. PLEASE EXPLAIN THE COMPONENT OF VALUE FOR UTILITY 13
INTEGRATION & INTERCONNECTION COSTS SHOWN ON LINE NO. 8 14
OF TABLE 5. 15
A. There is no additional charge included on Line No. 8 of Table 5 for utility 16
integration and interconnection costs. Other integration and interconnection costs of 17
NEM Distributed Energy Resources are being collected through a DER rider added 18
to the fuel clause. Therefore, the value of this component is zero. 19
20
ELECTR
ONICALLY
FILED-2019
August233:44
PM-SC
PSC-D
ocket#2019-184-E
-Page25
of39

DIRECT TESTIMONY OF JAMES W. NEELY DOCKET NO. 2019-184-E
Page 26 of 27
Q. PLEASE EXPLAIN THE COMPONENT OF VALUE FOR UTILITY 1
ADMINISTRATION COSTS SHOWN ON LINE NO. 9 OF TABLE 5. 2
A. At present, the administration costs of NEM Distributed Energy Resources 3
are being collected through a DER rider being added to the fuel clause. Therefore, 4
the value of this component is zero. 5
6
Q. PLEASE EXPLAIN THE COMPONENT OF VALUE FOR 7
ENVIRONMENTAL COSTS SHOWN ON LINE NO. 10 OF TABLE 5. 8
A. The component of “Environmental Costs” refers to any appropriate 9
environmentally related costs that were not already included in other net metering 10
methodology components. DESC associates a positive avoided cost value to 11
represent the cost of certain environmental materials used in the generation of 12
energy, such as lime and ammonia. The avoided cost of these materials typically is 13
included in the Company’s avoided energy costs but these costs have been separated 14
out in this proceeding for reporting purposes. 15
16
Q. PLEASE EXPLAIN THE COMPONENT OF VALUE FOR ENERGY 17
LOSSES/LINE LOSSES SHOWN ON LINE NO. 11 OF TABLE 5. 18
A. When a NEM Distributed Energy Resource serves a customer’s load behind 19
their meter or when it puts power onto the distribution system, DESC avoids having 20
to generate that specific amount of energy. The Company also avoids the energy 21
required to bring the power to the customer’s meter or the distribution system, i.e. 22
ELECTR
ONICALLY
FILED-2019
August233:44
PM-SC
PSC-D
ocket#2019-184-E
-Page26
of39

DIRECT TESTIMONY OF JAMES W. NEELY DOCKET NO. 2019-184-E
Page 27 of 27
the line losses associated with delivering power across the system. The loss factor 1
used for these NEM values represents the cumulative marginal line losses at a 2
residential customer’s meter. 3
4
CONCLUSION 5
Q. WHAT IS DESC REQUESTING OF THE COMMISSION IN THIS 6
PROCEEDING? 7
A. DESC respectfully requests that the Commission approve the calculation of 8
the total value of NEM Distributed Energy Resources as set forth in my testimony, 9
the proposed PR-1 avoided costs, Standard Offer avoided costs, and the avoided 10
cost methodology to be used for future updates to the Standard Offer and for 11
calculation of the avoided costs for small power producers which do not qualify for 12
the Standard Offer PPA. 13
14
Q. DOES THIS CONCLUDE YOUR DIRECT TESTIMONY? 15
A. Yes. 16
ELECTR
ONICALLY
FILED-2019
August233:44
PM-SC
PSC-D
ocket#2019-184-E
-Page27
of39
Exhibit No. ___ (JWN-1) Page 1 of 12
Resource Study
ELECTR
ONICALLY
FILED-2019
August233:44
PM-SC
PSC-D
ocket#2019-184-E
-Page28
of39

Exhibit No. ___ (JWN-1) Page 2 of 12
Introduction
The following pages documents a study that was performed to assess the cost of generation
that could meet the resource plan needs of Dominion Energy South Carolina, Inc.’s (“DESC” or
the “Company”) electric system. In each case, generation is added over a thirty-year horizon then
modeled using DESC’s hourly dispatch model. Costs are extrapolated for another ten years then
the scenarios are compared using the scenario’s 40-year levelized net present value. Generation is
added to meet the winter base reserve level.
Reserve Margin
DESC’s reserve margin policy is summarized in the following table. Peaking reserves are
considered the capacity needed during the five highest peak load days in the season while base
reserves are needed for the balance of the season.
DESC’s Reserve Margin Policy Summer Winter
Base Reserves 12% 14% Peaking Reserves 14% 21%
Increment for Peaking 2% 7%
DESC’s generating resources serve both the base capacity need and the peak capacity need.
These results show that the winter season requires more of both base and peak capacity needs than
does the summer season. In fact, with respect to the need for base capacity, the capacity added to
ELECTR
ONICALLY
FILED-2019
August233:44
PM-SC
PSC-D
ocket#2019-184-E
-Page29
of39
~ase MW
Year Summer2019 02020 02021 02022 02023 02024 02025 02026 02027 02028 02029 02030 02031 02032 02033 452034 932035 1412036 1882037 235
Need—Winter
0000000005
5199
147194242287332377425
~eak MW
Summer0000000000000000000
Need—Winter
0003
3077
128182229271274276279281284286288291293

Exhibit No. ___ (JWN-1) Page 3 of 12
meet the winter base capacity need will also serve to meet the summer base capacity need.
Furthermore, there is no need for additional summer peaking resources. The derivation of these
results is shown later in this report or in the appendix.
Meeting the Base Resource Need For base resources, the winter base reserve margin of 14% was used to determine the timing
of adding generation resources. DESC created a list of 8 generating resources to be considered,
which are reflected in the table below. Please note that “CC” is shorthand for Combined Cycle,
“ICT” is shorthand for Internal Combustion Turbine, and “PPA” is shorthand for Power Purchase
Agreement.
Resource Capital Cost 2017$/kW Description Battery #1 $2,126 100 MW with 400 MWH Battery #2 $1,350 100 MW with 400 MWH,
$1.65 MM/year in O&M Solar Farm $1,762 CC 2-on-1 $876 1,081 MW with HR=6,203 CC 1-on-1 $938 540 MW with HR=6,276 ICT#1 $647 337 MW with HR=9,091 ICT#2 $697 93 MW with HR=9,169 Solar PPA N/A $30, $35, $40/MWh in 2018 esc. @2%
These 8 resources were combined in various ways to develop 19 resource plans, some of which
consider the retirement of certain existing generating units. The 19 scenarios are listed in the
following table followed by a description of each scenario.
ELECTR
ONICALLY
FILED-2019
August233:44
PM-SC
PSC-D
ocket#2019-184-E
-Page30
of39
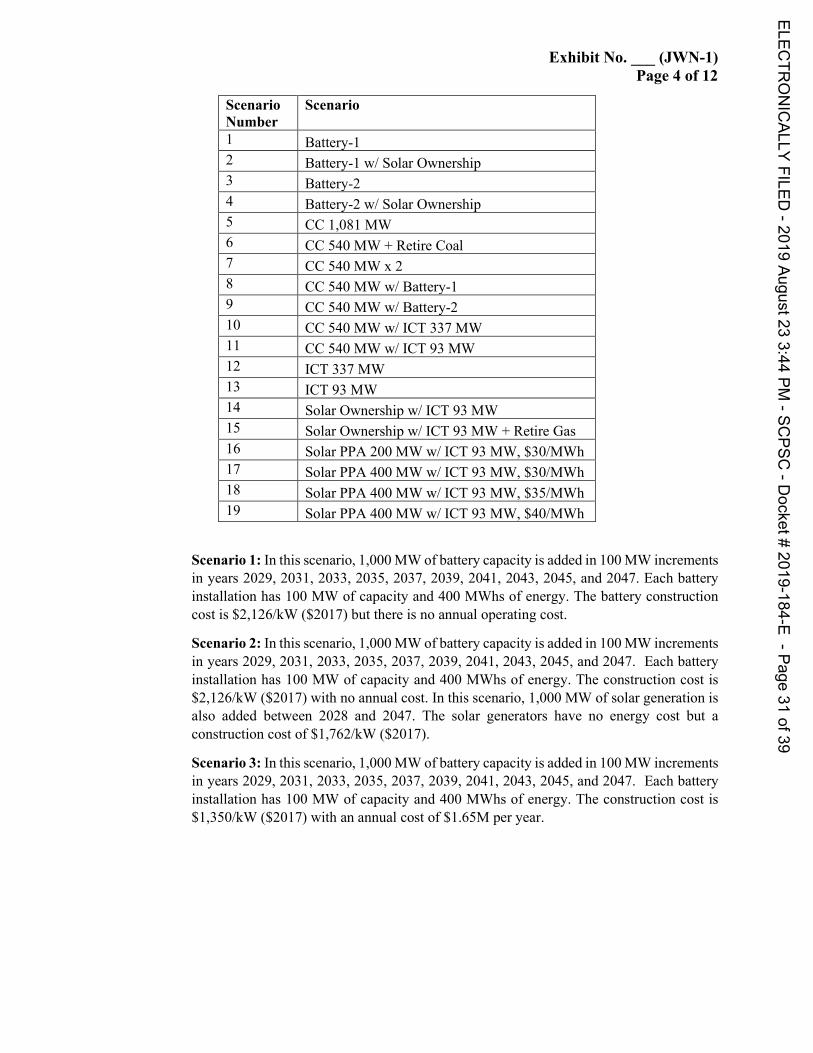
Exhibit No. ___ (JWN-1) Page 4 of 12
Scenario Number
Scenario
1 Battery-1 2 Battery-1 w/ Solar Ownership 3 Battery-2 4 Battery-2 w/ Solar Ownership 5 CC 1,081 MW 6 CC 540 MW + Retire Coal 7 CC 540 MW x 2 8 CC 540 MW w/ Battery-1 9 CC 540 MW w/ Battery-2 10 CC 540 MW w/ ICT 337 MW 11 CC 540 MW w/ ICT 93 MW 12 ICT 337 MW 13 ICT 93 MW 14 Solar Ownership w/ ICT 93 MW 15 Solar Ownership w/ ICT 93 MW + Retire Gas 16 Solar PPA 200 MW w/ ICT 93 MW, $30/MWh 17 Solar PPA 400 MW w/ ICT 93 MW, $30/MWh 18 Solar PPA 400 MW w/ ICT 93 MW, $35/MWh 19 Solar PPA 400 MW w/ ICT 93 MW, $40/MWh
Scenario 1: In this scenario, 1,000 MW of battery capacity is added in 100 MW increments in years 2029, 2031, 2033, 2035, 2037, 2039, 2041, 2043, 2045, and 2047. Each battery installation has 100 MW of capacity and 400 MWhs of energy. The battery construction cost is $2,126/kW ($2017) but there is no annual operating cost.
Scenario 2: In this scenario, 1,000 MW of battery capacity is added in 100 MW increments in years 2029, 2031, 2033, 2035, 2037, 2039, 2041, 2043, 2045, and 2047. Each battery installation has 100 MW of capacity and 400 MWhs of energy. The construction cost is $2,126/kW ($2017) with no annual cost. In this scenario, 1,000 MW of solar generation is also added between 2028 and 2047. The solar generators have no energy cost but a construction cost of $1,762/kW ($2017).
Scenario 3: In this scenario, 1,000 MW of battery capacity is added in 100 MW increments in years 2029, 2031, 2033, 2035, 2037, 2039, 2041, 2043, 2045, and 2047. Each battery installation has 100 MW of capacity and 400 MWhs of energy. The construction cost is $1,350/kW ($2017) with an annual cost of $1.65M per year.
ELECTR
ONICALLY
FILED-2019
August233:44
PM-SC
PSC-D
ocket#2019-184-E
-Page31
of39

Exhibit No. ___ (JWN-1) Page 5 of 12
Scenario 4: In this scenario, 1,000 MW of battery capacity is added in 100 MW increments in years 2029, 2031, 2033, 2035, 2037, 2039, 2041, 2043, 2045, and 2047. Each battery installation has 100 MW of capacity and 400 MWhs of energy. The construction cost is $1,350/kW ($2017) with an annual cost of $1.65M per year. In this scenario, 1,000 MW of solar generation is added in 100 MW increments in years 2029, 2031, 2033, 2035, 2037, 2039, 2041, 2043, 2045, and 2047. The solar generators have no energy cost but a construction cost of $1,762/kW ($2017).
Scenario 5: In this scenario, one 1,081 MW 2-on-1 combined cycle (CC) gas generating plant is added in the winter of 2029. This combined cycle generator has a full load heat rate of 6,203 Btu/kWh and an estimated construction cost of $876/kW ($2017).
Scenario 6: In this scenario, three 540 MW 1-on-1 combined cycle (CC) gas generating plants are added in the winter of 2029, 2033 and 2044. This scenario also includes the retirement of one 342 MW coal plant in the winter of 2029. These combined cycle generators have a full load heat rate of 6,276 Btu/kWh and an estimated construction cost of $938/kW ($2017).
Scenario 7: In this scenario, two 540 MW 1-on-1 combined cycle (CC) gas generating plants are added in the winters of 2029 and the winter of 2040. These combined cycle generators have a full load heat rate of 6,276 Btu/kWh and an estimated construction cost of $938/kW ($2017).
Scenario 8: In this scenario, 100 MW of battery capacity is added in 2029 with two 540 MW 1-on-1 combined cycle (CC) gas generating plants added in the winters of 2031 and the winter of 2042. These combined cycle generators have a full load heat rate of 6,276 Btu/kWh and an estimated construction cost of $938/kW ($2017). The battery construction cost is $2,126/kW ($2017) but there is no annual operating cost.
Scenario 9: In this scenario, 100 MW of battery capacity is added in 2029 with two 540 MW 1-on-1 combined cycle (CC) gas generating plants added in the winters of 2031 and the winter of 2042. These combined cycle generators have a full load heat rate of 6,276 Btu/kWh and an estimated construction cost of $938/kW ($2017). Each battery installation has 100 MW of capacity and 400 MWhs of energy. The construction cost is $1,350/kW with an annual cost of $1.65M per year.
Scenario 10: In this scenario, one 540 MW 1-on-1 CC gas generating plant is added in the winter of 2029. The rest of the expansion plan is filled out with two 337 MW ICT generators added in the winters of 2040 and 2047. The combined cycle generator has a full load heat rate of 6,276 Btu/kWh and an estimated construction cost of $938/kW ($2017). The 337 MW turbines have a full load heat rate of 9,091 Btu/kWh and an estimated construction cost of $647/kW ($2017).
Scenario 11: In this scenario, one 540 MW 1-on-1 CC gas generating plant is added in the winter of 2029. The rest of the expansion plan is filled out with five 93 MW ICT generators added in the winters of 2040, 2042, 2044, 2046 and 2047. The combined cycle generator has a full load heat rate of 6,276 Btu/kWh and an estimated construction cost of $938/kW ($2017). The 93 MW turbines have a full load heat rate of 9,169 Btu/kWh and an estimated construction cost of $697/kW ($2017).
ELECTR
ONICALLY
FILED-2019
August233:44
PM-SC
PSC-D
ocket#2019-184-E
-Page32
of39
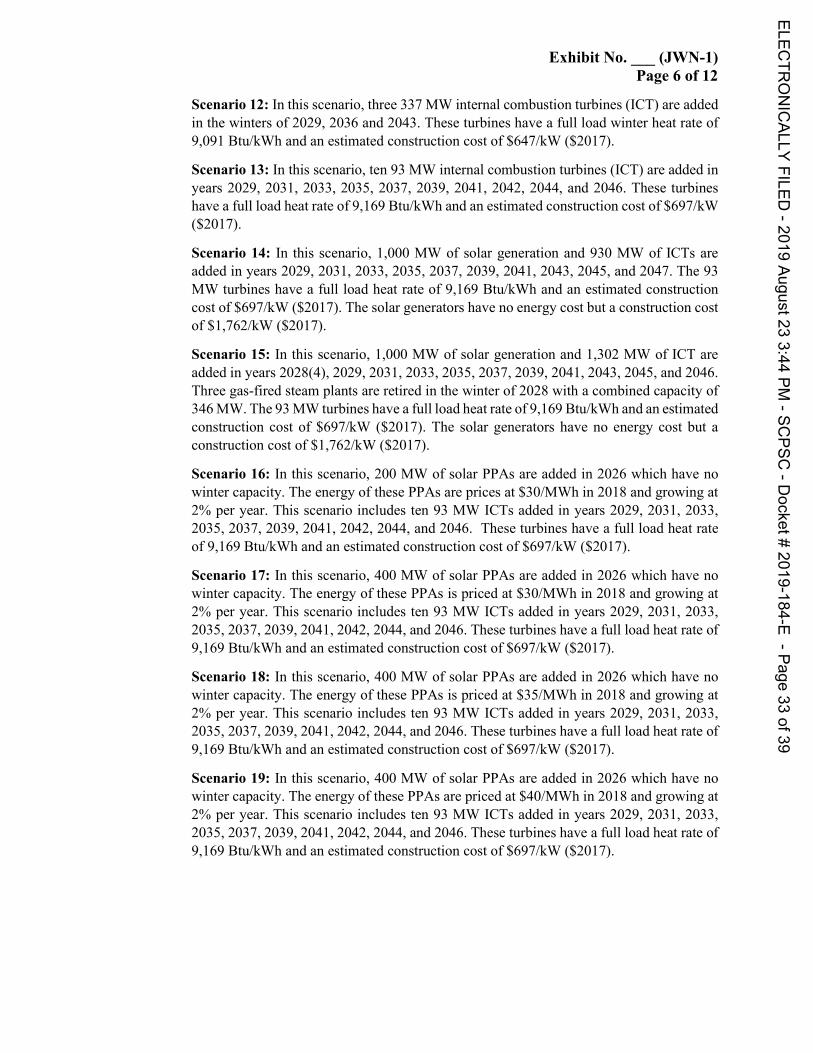
Exhibit No. ___ (JWN-1) Page 6 of 12
Scenario 12: In this scenario, three 337 MW internal combustion turbines (ICT) are added in the winters of 2029, 2036 and 2043. These turbines have a full load winter heat rate of 9,091 Btu/kWh and an estimated construction cost of $647/kW ($2017).
Scenario 13: In this scenario, ten 93 MW internal combustion turbines (ICT) are added in years 2029, 2031, 2033, 2035, 2037, 2039, 2041, 2042, 2044, and 2046. These turbines have a full load heat rate of 9,169 Btu/kWh and an estimated construction cost of $697/kW ($2017).
Scenario 14: In this scenario, 1,000 MW of solar generation and 930 MW of ICTs are added in years 2029, 2031, 2033, 2035, 2037, 2039, 2041, 2043, 2045, and 2047. The 93 MW turbines have a full load heat rate of 9,169 Btu/kWh and an estimated construction cost of $697/kW ($2017). The solar generators have no energy cost but a construction cost of $1,762/kW ($2017).
Scenario 15: In this scenario, 1,000 MW of solar generation and 1,302 MW of ICT are added in years 2028(4), 2029, 2031, 2033, 2035, 2037, 2039, 2041, 2043, 2045, and 2046. Three gas-fired steam plants are retired in the winter of 2028 with a combined capacity of 346 MW. The 93 MW turbines have a full load heat rate of 9,169 Btu/kWh and an estimated construction cost of $697/kW ($2017). The solar generators have no energy cost but a construction cost of $1,762/kW ($2017).
Scenario 16: In this scenario, 200 MW of solar PPAs are added in 2026 which have no winter capacity. The energy of these PPAs are prices at $30/MWh in 2018 and growing at 2% per year. This scenario includes ten 93 MW ICTs added in years 2029, 2031, 2033, 2035, 2037, 2039, 2041, 2042, 2044, and 2046. These turbines have a full load heat rate of 9,169 Btu/kWh and an estimated construction cost of $697/kW ($2017).
Scenario 17: In this scenario, 400 MW of solar PPAs are added in 2026 which have no winter capacity. The energy of these PPAs is priced at $30/MWh in 2018 and growing at 2% per year. This scenario includes ten 93 MW ICTs added in years 2029, 2031, 2033, 2035, 2037, 2039, 2041, 2042, 2044, and 2046. These turbines have a full load heat rate of 9,169 Btu/kWh and an estimated construction cost of $697/kW ($2017).
Scenario 18: In this scenario, 400 MW of solar PPAs are added in 2026 which have no winter capacity. The energy of these PPAs is priced at $35/MWh in 2018 and growing at 2% per year. This scenario includes ten 93 MW ICTs added in years 2029, 2031, 2033, 2035, 2037, 2039, 2041, 2042, 2044, and 2046. These turbines have a full load heat rate of 9,169 Btu/kWh and an estimated construction cost of $697/kW ($2017).
Scenario 19: In this scenario, 400 MW of solar PPAs are added in 2026 which have no winter capacity. The energy of these PPAs are priced at $40/MWh in 2018 and growing at 2% per year. This scenario includes ten 93 MW ICTs added in years 2029, 2031, 2033, 2035, 2037, 2039, 2041, 2042, 2044, and 2046. These turbines have a full load heat rate of 9,169 Btu/kWh and an estimated construction cost of $697/kW ($2017).
ELECTR
ONICALLY
FILED-2019
August233:44
PM-SC
PSC-D
ocket#2019-184-E
-Page33
of39

Exhibit No. ___ (JWN-1) Page 7 of 12
Sensitivities and Results The incremental revenue requirements associated with each of the 19 resource plans was
computed using the PROSYM computer program to estimate production costs and an EXCEL
capital model to calculate the associated capital costs. The EXCEL capital model combined the
capital costs with the production costs to estimate total incremental revenue requirements over a
40-year planning horizon. Four sensitivities were considered: two on natural gas prices and two
on the cost of CO2 emissions. The four assumptions are: 1) $0/ton CO2 and base gas prices, 2)
$15/ton CO2 and high gas prices, 3) $0/ton CO2 and high gas prices, and 4) $15/ton CO2 and base
gas prices. Base gas prices are based on NYMEX Henry Hub prices through 2020 then growing at
4.82% until 2031 then growing at 3.9% thereafter. High gas prices are double the base gas prices.
The following table shows the ranking of each resource plan under each sensitivity. A ranking of
1 is the least-cost option for the given assumptions.
Scenario Ranking
Scenario Number Scenario
$0 CO2 Base gas
$15 CO2 High gas
$0 CO2 High gas
$15 CO2 Base gas
1 Battery-1 16 17 16 17 2 Battery-1 w/ Solar Ownership 19 18 19 19 3 Battery-2 11 13 12 15 4 Battery-2 w/ Solar Ownership 18 16 15 18 5 CC 1081 MW 14 14 14 11 6 CC 540 MW + Retire Coal 12 15 17 4 7 CC 540 MW x2 1 10 10 6 8 CC 540 MW w/ Battery-1 17 19 18 16 9 CC 540 MW w/ Battery-2 13 12 13 13 10 CC 540 MW w/ ICT 337 MW 8 9 8 8 11 CC 540 MW w/ ICT 93 MW 6 7 6 2 12 ICT 337 MW 9 11 9 10 13 ICT 93 MW 2 5 5 7 14 Solar Ownership w/ ICT 93 MW 10 6 7 12
15 Solar Ownership w/ ICT 93 MW + Retire Gas 15 8 11 14
16 Solar PPA 200 MW w/ ICT 93 MW ($30) 3 4 3 3 17 Solar PPA 400 MW w/ ICT 93 MW ($30) 4 1 1 1 18 Solar PPA 400 MW w/ ICT 93 MW ($35) 5 2 2 5 19 Solar PPA 400 MW w/ ICT 93 MW ($40) 7 3 4 9
ELECTR
ONICALLY
FILED-2019
August233:44
PM-SC
PSC-D
ocket#2019-184-E
-Page34
of39
Exhibit No. ___ (JWN-1) Page 8 of 12
Resource scenario #7 is the lowest-cost resource plan under the assumption of $0 per ton of CO2
emission and base gas costs. Scenario #17 is the lowest-cost resource plan under the other three
sensitivities. Because base gas prices is the most likely gas scenario and CO2 costs are uncertain
at this point, resource scenario #7 is the resource plan used in developing avoided costs and
forecasting fuel costs.
Some Observations The results above do not reflect a decision on the Company’s part but only represent a
snapshot at the present time and offer possible expansion plans under different sensitivities. More
work on this issue will be done and based on additional peak demand forecasts as they are updated.
However, it is helpful to make some observations about these results to extract as much useful
information as possible from the study. For example, under the $0 per ton CO2 cost and base gas
price scenario, resource plan #7 was the most economical. Cheaper energy provided by a new,
highly efficient combined cycle plant when gas prices are relatively low without CO2 emission
costs offers enough economic benefit to overcome the extra capital costs.
Resource plan #13 is more economical than #12 under all four sensitivities, suggesting that
using the smaller ICT of 93 MW is better than using the larger ICT even though there is a higher
capital cost and heat rate cost. The same conclusion can be drawn when comparing resource plan
#11 to #10. Another possibility to consider in future studies involves the early retirement of coal
units. Resource plan #6 falls fourth in the ranking when there is a $15 CO2 emissions cost coupled
with low gas prices. If gas prices were a little lower with respect to coal prices and the cost of CO2
emissions a little larger, the retirement of coal units might prove to be an economical option.
Adding 100 MW batteries is consistently more expensive than adding 93 MW peaking
facilities, which can be seen by comparing scenario #11 with #9 and scenario #14 with #4.
Resource scenario #17 was the most economical in three of the four sensitivities
considered, i.e., whenever the gas price was high or there was a CO2 emissions cost, the clean
energy provided by more solar proved valuable to the system. However, this option presents two
significant questions: 1) can solar energy be purchased at $30 per MWh escalating at 2% and 2)
can the system dispatch address the increase in operating issues caused by adding another 400 MW
of solar to a system already dealing with over 1,000 MW of solar? As the system cost increases
ELECTR
ONICALLY
FILED-2019
August233:44
PM-SC
PSC-D
ocket#2019-184-E
-Page35
of39

Exhibit No. ___ (JWN-1) Page 9 of 12
for solar PPA this scenario moves out of the least cost position, as seen in scenarios 18 and 19.
DESC will continue to evaluate these and other scenarios in the future.
Meeting the Peak Resource Need
For peak resources, the winter incremental peak reserve margin of 7% was used. The
Company does not require any more summer peak capacity in large part because of all the solar
energy currently on the system or under contract. Peak capacity is capacity needed to supplement
base capacity on the five highest load days in the season. As was just discussed, the Company does
not need additional base capacity until 2029 so until then there is extra base capacity to support
the peak needs. With approximately 100 MW of demand response for peaking needs, significant
additional peak capacity is not required until 2023 or 2024. At present the Company is conducting
a DSM Potential Study which will include demand response options for winter. When this study
is complete, the Company will be able to identify the best way to meet its winter peaking needs.
ELECTR
ONICALLY
FILED-2019
August233:44
PM-SC
PSC-D
ocket#2019-184-E
-Page36
of39
Exhibit No. ___ (JWN-1) Page 10 of 12
APPENDIX
ELECTR
ONICALLY
FILED-2019
August233:44
PM-SC
PSC-D
ocket#2019-184-E
-Page37
of39

Exhibit No. ___ (JWN-1) Page 11 of 12
Table 1. Resource Scenario #7
YEARS W S W S W S W S W S W S W S W S W S W S W S W S W S W S W
Load Forecast1 Baseline Trend 4911 4999 4965 5069 5028 5129 5087 5187 5144 5243 5200 5301 5255 5360 5315 5420 5372 5482 5433 5544 5492 5602 5551 5663 5609 5724 5669 5783 5726 58452 EE/Renewables Impact -28 -35 -32 -61 -49 -90 -68 -109 -86 -143 -116 -161 -131 -177 -145 -192 -159 -214 -176 -236 -195 -254 -211 -272 -227 -290 -243 -308 -259 -3273 Gross Territorial Peak 4883 4964 4933 5008 4979 5039 5019 5078 5058 5100 5084 5140 5124 5183 5170 5228 5213 5268 5257 5308 5297 5348 5340 5391 5382 5434 5426 5475 5467 5518
System Capacity4 Existing 5780 5948 5780 5923 5755 5923 5755 5923 5755 5923 5755 5923 5755 5923 5755 5923 5755 5923 5755 5923 5755 5923 6295 6463 6295 6463 6295 6463 6295 64635 Existing Solar 121.1 0 193 0 379.8 0 482 0 482 0 482 0 482 0 482 0 482 0 482 0 482 0 482 0 482 0 482 0 482 06 Demand Response 244 215 245 216 246 217 247 218 248 218 249 219 250 220 251 221 252 222 254 223 255 224 256 225 257 226 258 227 259 228
Additions:7 Solar Plant 71.93 0 186.8 0 102.1 08 Peaking/Intermediate 5409 Baseload
10 Retirements -85 -25
11 Total System Capacity 6132 6163 6380 6139 6483 6140 6484 6141 6485 6141 6486 6142 6487 6143 6488 6144 6489 6145 6491 6146 6492 6687 7033 6688 7034 6689 7035 6690 7036 669112 Winter Deficit 0 0 0 3 30 77 128 182 229 277 0 0 0 0 013 Total Production Capability 6132 6163 6380 6139 6483 6140 6484 6144 6485 6171 6486 6219 6487 6271 6488 6326 6489 6374 6491 6423 6492 6687 7033 6688 7034 6689 7035 6690 7036 6691
Reserves14 Margin (L13-L3) 1249 1199 1447 1131 1504 1101 1465 1066 1427 1071 1402 1079 1363 1088 1318 1098 1276 1106 1234 1115 1195 1339 1693 1297 1652 1255 1609 1215 1569 117315 % Reserve Margin (L14/L3) 25.6% 24.2% 29.3% 22.6% 30.2% 21.8% 29.2% 21.0% 28.2% 21.0% 27.6% 21.0% 26.6% 21.0% 25.5% 21.0% 24.5% 21.0% 23.5% 21.0% 22.6% 25.0% 31.7% 24.1% 30.7% 23.1% 29.7% 22.2% 28.7% 21.3%
2029 2030 2031 2032
SCE&G Forecast of Summer and Winter Loads and Resources - 2019 IRP Update(MW)
2019 2020 2021 2022 2023 2024 2025 2026 20332027 2028
ELECTR
ONICALLY
FILED-2019
August233:44
PM-SC
PSC-D
ocket#2019-184-E
-Page38
of39

Exhibit No. ___ (JWN-1) Page 12 of 12
Table 2. Resource Scenario #17
YEARS W S W S W S W S W S W S W S W S W S W S W S W S W S W S W
Load Forecast1 Baseline Trend 4911 4999 4965 5069 5028 5129 5087 5187 5144 5243 5200 5301 5255 5360 5315 5420 5372 5482 5433 5544 5492 5602 5551 5663 5609 5724 5669 5783 5726 58452 EE/Renewables Impact -28 -35 -32 -61 -49 -90 -68 -109 -86 -143 -116 -161 -131 -177 -145 -192 -159 -214 -176 -236 -195 -254 -211 -272 -227 -290 -243 -308 -259 -3273 Gross Territorial Peak 4883 4964 4933 5008 4979 5039 5019 5078 5058 5100 5084 5140 5124 5183 5170 5228 5213 5268 5257 5308 5297 5348 5340 5391 5382 5434 5426 5475 5467 5518
System Capacity4 Existing 5780 5948 5780 5923 5755 5923 5755 5923 5755 5923 5755 5923 5755 5923 5755 5923 5755 5923 5755 5923 5755 5923 5848 6016 5848 6016 5941 6109 5941 61095 Existing Solar 121.1 0 193 0 379.8 0 482 0 482 0 482 0 482 0 482 0 482 184 482 184 482 184 482 184 482 184 482 184 482 1846 Demand Response 244 215 245 216 246 217 247 218 248 218 249 219 250 220 251 221 252 222 254 223 255 224 256 225 257 226 258 227 259 228
Additions:7 Solar Plant 71.93 0 186.8 0 102.1 0 1848 Peaking/Intermediate 93 93 939 Baseload
10 Retirements -85 -25
11 Total System Capacity 6132 6163 6380 6139 6483 6140 6484 6141 6485 6141 6486 6142 6487 6143 6488 6328 6489 6329 6491 6330 6492 6424 6586 6425 6587 6519 6681 6520 6682 661412 Winter Deficit 0 0 0 3 30 77 128 0 45 93 47 98 56 105 6313 Total Production Capability 6132 6163 6380 6139 6483 6140 6484 6144 6485 6171 6486 6219 6487 6271 6488 6328 6489 6374 6491 6423 6492 6471 6586 6523 6587 6575 6681 6625 6682 6677
Reserves14 Margin (L13-L3) 1249 1199 1447 1131 1504 1101 1465 1066 1427 1071 1402 1079 1363 1088 1318 1100 1276 1106 1234 1115 1195 1123 1246 1132 1205 1141 1255 1150 1215 115915 % Reserve Margin (L14/L3) 25.6% 24.2% 29.3% 22.6% 30.2% 21.8% 29.2% 21.0% 28.2% 21.0% 27.6% 21.0% 26.6% 21.0% 25.5% 21.0% 24.5% 21.0% 23.5% 21.0% 22.6% 21.0% 23.3% 21.0% 22.4% 21.0% 23.1% 21.0% 22.2% 21.0%
2030 2031 2032
SCE&G Forecast of Summer and Winter Loads and Resources - 2019 IRP Update(MW)
2019 2020 2021 2022 2023 2024 2025 2026 20332027 2028 2029
ELECTR
ONICALLY
FILED-2019
August233:44
PM-SC
PSC-D
ocket#2019-184-E
-Page39
of39