Direct control of eye movements - Bournemouth...
58
Evidence for direct control of eye movements during reading Michael Dambacher 1,3 , Timothy J. Slattery 2 , Jinmian Yang 4 , Reinhold Kliegl 1 , & Keith Rayner 4 1 Department of Psychology, Universität Potsdam, Germany 2 Department of Psychology, University of South Alabama, USA 3 Zukunftskolleg & Department of Psychology, Universität Konstanz, Germany 4 Department of Psychology, University of California, San Diego, USA Running title: Direct control of eye movements Corresponding author: Michael Dambacher Cognitive Psychology Box D29 University of Konstanz 78457 Konstanz, Germany Email: [email protected] Fon: +49-(0)-7531 88-4376 Fax: +49-(0)-7531 88-3017 Pages: 58 Tables: 5 Figures: 6
-
Upload
trinhkhanh -
Category
Documents
-
view
215 -
download
3
Transcript of Direct control of eye movements - Bournemouth...

Evidence for direct control of eye movements during reading
Michael Dambacher1,3, Timothy J. Slattery2, Jinmian Yang4,
Reinhold Kliegl1, & Keith Rayner4
1 Department of Psychology, Universität Potsdam, Germany
2 Department of Psychology, University of South Alabama, USA
3 Zukunftskolleg & Department of Psychology, Universität Konstanz, Germany
4 Department of Psychology, University of California, San Diego, USA
Running title: Direct control of eye movements
Corresponding author:
Michael Dambacher
Cognitive Psychology
Box D29
University of Konstanz
78457 Konstanz, Germany
Email: [email protected]
Fon: +49-(0)-7531 88-4376
Fax: +49-(0)-7531 88-3017
Pages: 58
Tables: 5
Figures: 6

Direct control of eye movements 2
Abstract
It is well established that fixation durations during reading vary with processing difficulty,
but there are different views on how oculomotor control, visual perception, shifts of attention,
and lexical (and higher cognitive) processing are coordinated. Evidence for a one-to-one
translation of input delay into saccadic latency would provide a much needed constraint for
current theoretical proposals. Here, we tested predictions of such a direct-control perspective
using the stimulus-onset delay (SOD) paradigm. Words in sentences were initially masked and,
upon fixation, were individually unmasked with a delay (0-ms, 33-ms, 66-ms, 99-ms SODs). In
Experiment 1, SODs were constant for all words in a sentence; in Experiment 2, SODs were
manipulated on target words, while non-targets were unmasked without delay. In accordance
with predictions of direct control, non-zero SODs entailed equivalent increases in fixation
durations in both experiments. Yet, a population of short fixations pointed to rapid saccades as
a consequence of low-level information at non-optimal viewing positions rather than of lexical
processing. Implications of these results for theoretical accounts of oculomotor control are
discussed.
(173 words)
Keywords
stimulus-onset delay (SOD); oculomotor control; fixation durations; sentence reading

Direct control of eye movements 3
Introduction
Efficient reading requires the coordination of oculomotor control and word recognition.
On the one hand, fixation durations must be long enough to accumulate sufficient information
about the meaning of the words readers look at. On the other hand, unnecessarily long dwell
times of the eyes would make the reading process inefficient. Time constraints associated with
saccade programming and word recognition during normal reading leave little doubt that
saccades are programmed in parallel to lexical processing (see Rayner & Pollatsek, 1989, Figure
5.2). Visual (e.g., amount of contrast, font size), lexical (e.g., frequency) and contextual (e.g.,
predictability) properties of words yield a graded effect on fixation durations (e.g., as word
frequency decreases, fixation durations increase; see Rayner, Pollatsek, Ashby, & Clifton, 2012,
for a review), but the termination of a fixation is a discrete event triggered by the execution of a
saccade program that was initiated around 135 ms earlier (Becker & Jürgens, 1979) (Footnote
1). There are several, mutually non-exclusive proposals that account for the initiation of a new
saccade program. For instance, principles of high-level cognitive control (e.g., lexical access,
syntactic processing, Reichle, Warren, & McConnell, 2009) or autonomous, possibly random,
generation of saccades (e.g., Engbert, Nuthmann, Richter, & Kliegl, 2005) have strongly shaped
our understanding of eye movement control in reading. Other important mechanisms may
involve oculomotor error (e.g., re-afference, Nuthmann, Engbert, & Kliegl, 2005) or low-level
sensory information (e.g., saccadic inhibition, Reingold & Stampe, 2004; word boundaries, Vitu,
Lancelin, & Marrier d’Unienville, 2007). The different options of saccade control can be largely
classified into mechanisms of direct and indirect control, which can rely on both lexical and non-
lexical levels of word processing (Reingold, Reichle, Glaholt, & Sheridan, 2012). However, how
exactly they are orchestrated to efficiently extract relevant information from a text during
Direct control of eye movements 4
reading is not clear. The present experiments were designed to shed new light on this question
and provide empirical constraints for theoretical proposals.
A useful tool to test assumptions about the link between mind and eye is the stimulus
onset delay (SOD) paradigm. Here, a critical stimulus – for instance text (Morrison, 1984; Rayner
& Pollatsek, 1981) or scenes (Henderson & Pierce, 2008; Nuthmann, Smith, Engbert, &
Henderson, 2010) – is visually masked during the execution of a saccade. At the end of the
saccade (i.e., after fixation onset) the stimulus reappears after a certain delay. The rationale
behind this procedure is that stimulus processing can only start after its visual features have
become available. Thus, from the perspective of a direct eye-mind link the initiation of a new
saccade is delayed due to stimulus inaccessibility at the beginning of a fixation, resulting in an
increase of fixation durations. Indeed, the strictest direct-control assumption predicts that the
increase of fixation durations is equal to the onset delay if no other information is used to
initiate a saccade (i.e., a slope of 1 for the regression of fixation duration on SOD). At the other
extreme, saccade latencies would be completely independent of the level of stimulus processing
(i.e., a slope of 0) if saccade programs are triggered at random (parameterized according to
some distributional assumptions). Of course, intermediate slopes are also a plausible outcome.
They could result from a mixture of the two extreme options. For example, a proportion of
autonomously triggered saccade programs may “escape” inhibitory influences on saccade
initiation due to local processing difficulties. Or some cognitive processing may be carried out in
parallel to the delay reducing the amount of total processing required after stimulus onset,
leading to partial savings of fixation times.
Results of the pioneering SOD reading studies provided evidence for significant slopes,
but smaller than one, roughly in agreement with the “mixed” account. For instance, in the initial

Direct control of eye movements 5
series of SOD experiments, Rayner and Pollatsek (1981) utilized differently sized masks to cover
parts of a sentence during each saccade. Upon fixation, the mask was removed after a delay (0,
25, 50, 100, 200, or 300 ms) such that the entire sentence was available. Rayner and Pollatsek
found that fixation durations generally increased with onset delay. While this was taken as
evidence that some fixations are under direct control other fixation durations were actually
shorter than the long onset delays of 200 and 300 ms. In fact, with these long SODs the
distributions of fixation durations were bimodal as they showed a considerable proportion of
anticipatory saccades that must have been programmed during the masking period or even
during the previous fixation. Further, the increase of fixation durations was smaller than the
onset delay. With delays of 0, 25, 50, 75, and 100 ms (see their Experiment 3) fixation durations
increased with a slope of 0.61 when onset delay was fixed for all words in a sentence, and with a
slope of 0.51 when onset delay varied randomly between words.
In a similar study essentially replicating these findings, Morrison (1984) also found a
large proportion of anticipatory saccades terminating fixations before the mask was removed.
Further, the onset delay did not equally translate into the increase in fixation durations; the
slopes across SODs (25, 50, 200, 350 ms) ranged between 0.77 and 0.88 for different conditions
after anticipatory saccades had been removed. To account for these findings Morrison proposed
that once the foveal word is sufficiently processed, attention shifts to the subsequent word
before a saccade terminates the current fixation. This covert attention shift permits pre-
processing of the parafoveal word while a saccade is programmed in parallel. As a consequence,
a high level of parafoveal pre-processing substantially reduces the required inspection time on
the subsequent word, resulting in relatively short fixation durations or in saccades that may be
executed even before the mask is removed. This proposal strongly influenced later

Direct control of eye movements 6
computational models of eye-movement control during reading. For instance, the E-Z Reader
model (Reichle, Pollatsek, Fisher, & Rayner, 1998; Reichle, Pollatsek, & Rayner, 2006),
implements the principle of parafoveal pre-processing to account for short fixations on or
skipping of subsequent words.
More recently Inhoff, Eiter, and Radach (2005) and Hohenstein, Laubrock, and Kliegl
(2010) manipulated SOD of the parafoveal word n+1 relative to the start of fixations on word n.
In Inhoff et al.’s experiment, gaze durations increased with a slope of .57 across SODs of 70, 140,
and 210 ms; they did not find an effect for the increase between 0 ms (control condition) and 70
ms SOD. In Hohenstein et al., gaze durations on target word n+1 increased roughly linearly with
slopes ranging between 0.47 and 0.61 for SODs from 20 ms to 125 ms (across four experiments).
SOD effects on fixation durations have also been examined in scene viewing. A visual
mask replaced an image during the saccade preceding a critical fixation and was removed after
a delay. In several experiments, bimodal distributions consistently revealed two populations of
fixation durations: One that increased with SODs and one that was largely unaffected by SODs.
Importantly, modal values of the former distributions increased with a slope of approximately
one (Henderson & Pierce, 2008; Henderson & Smith, 2009). Notably, Nuthmann and Henderson
(2012; see also Luke, Nuthmann, & Henderson, in press) recently reported comparable results in
a reading experiment on multi-line passages. Here, the entire text was masked for a certain
delay during the saccade prior to every sixth fixation. Thus, there is evidence that eye
movements in both scene viewing and reading are characterized by mixed control: some
fixations directly depend on useful visual information, whereas other saccades are triggered
independently from stimulus processing.

Direct control of eye movements 7
Yet, current knowledge of the mixed control perspective is based on experiments
permitting both foveal and parafoveal viewing. None of the previous SOD studies implemented
a design where saccade timing depends completely on foveal lexical information: Rayner and
Pollatsek (1981), Morrison (1984), as well as Nuthmann and Henderson (2012) did not prevent
parafoveal pre-processing of target words, and Inhoff et al. (2005) and Hohenstein et al. (2010)
manipulated SOD for the parafoveal word. As mentioned before, however, parafoveal
processing can critically affect fixation durations, and may therefore distort conclusions about
the nature of oculomotor control. In order to provide a strong test of the assumption that eye
movements are directly controlled by lexical processing of the foveal word, we employed a
version of the SOD paradigm that ruled out any pre-processing due to parafoveal vision and that
used target words with minimal predictability from prior sentence context to eliminate another
potential source of preprocessing. Unlike previous SOD studies, we implemented word-based
instead of character-based masks in sentences. That is, we used a one-word moving window
technique (McConkie & Rayner, 1975) in which only a single word at a time was visually
processed: when the eyes landed on a word, the mask was removed only for this particular
word while the rest of the sentence remained masked.
Experiment 1
In Experiment 1, SODs were constant for all words in a sentence. Upon fixation, each
word was unmasked with one of four delays (i.e., 0, 33, 66, or 99 ms) and was re-masked
immediately after the eyes moved on to the next word. According to predictions from a direct
control perspective we expected that onset delays would be fully reflected in inspection times.
Thus, fixation durations should increase as a function of SOD with a slope of one.

Direct control of eye movements 8
Methods
Subjects
Twenty-two students at the University of California, San Diego received course credit for
participation. All were native speakers of English, had normal or corrected-to-normal vision, and
were naïve concerning the purpose of the experiment.
Stimuli and Design
A total of 120 English sentences formed the stimulus materials. Sentences were 8 to 15
words long. Each sentence contained a low predictable target noun between the third and
twelfth word position (mean position = 7.68, SD: 1.68). The sentences were adapted from prior
studies with the constraint that the target word was never identified in a modified cloze task
more than 3% of the time. Targets were four to seven letters long (mean length: 5.38, SD: .69;
number of four- to seven-letter targets: 6, 72, 34, and 8, respectively) and their frequencies
varied from 0.38 to 550.40 occurrences per million (mean frequency: 50; SD: 82); frequency
norms were assessed from the Corpus of Contemporary American English (COCA) comprising
more than 400 million tokens (Davies, 2008). The correlation of target word length and
logarithmic frequency was not significant [r = -.070; t(118) = -.767, p = .444].
A one-word moving window paradigm with delayed stimulus onset was used for
sentence presentation (McConkie & Rayner, 1975; Rayner & Bertera, 1979). Every word in a
sentence was initially masked by an x-string of corresponding length; this mask maintained low-
level information of stimulus size and word boundaries but prevented any kind of lexical
processing. A word was unmasked after a delay of 0, 33, 66, or 99 ms relative to the time the
eyes crossed an invisible boundary between adjacent words, and was immediately re-masked

Direct control of eye movements 9
after the word was left (i.e., a variant of the boundary paradigm, Rayner, 1975). Therefore,
stimulus onset was not delayed for any refixation within a word. The display changes associated
with stimulus unmasking took about 7 ms to execute following the delay period. Onset delays
were constant for all words in a sentence. To reduce the probability of fixations very close to a
boundary, potentially resulting in unintended display changes, words were separated by two
spaces, and the boundary placed between them. For every subject, 30 sentences were
presented in each of the four SODs in randomized order; SOD conditions attributed to each
sentence were counterbalanced across participants.
Procedure
Participants were instructed to read the sentences for comprehension. They were
informed that words would be masked unless they were fixated and that words would be re-
masked after the eyes moved on. However, subjects were naïve with respect to the SOD. Eight
practice trials before the main experiment familiarized them with the task. Every trial started
with a gaze box (25 x 25 pixels, 0.8° of visual angle) vertically centered on the left side of the
monitor. When the eye tracker detected a valid fixation in the gaze box, a masked sentence was
presented on the center line with the left edge of the first character situated at the left edge of
the gaze box. After reading a sentence, subjects pressed a button on a controller, which
initiated either the next trial (67%) or a two-alternative multiple-choice question to test
sentence comprehension (33%, accuracy of responses: 92%). The experiment took
approximately 45 minutes.

Direct control of eye movements 10
Eye movement recording
Eye movements were recorded using an EyeLink1000 eye tracker that sampled the
position of the right eye at 1000 Hz. Subjects were seated 60 cm from the monitor with their
head positioned on a chin rest. Stimuli were presented in Courier New (font size: 14; black font
on a white background) on an Iiyama 454 vision master pro CRT monitor (19 inch; refresh rate:
150 Hz; resolution: 1024 x 768). Letters subtended 0.29° of visual angle. Calibration was
performed on a standard three-point grid.
Data processing and analyses
After deleting trial-initial and final fixations as well as fixations on sentence-initial and
final words, reading data yielded a total of 31,729 fixations. Of these fixations, 3,999 were on
target words. These fixations were initially filtered for first-pass reading yielding 3,409 data
points. Next, all fixations on target words with at least one fixation duration less than 50 ms (15
words) or greater than 750 ms (9 words) were excluded. Fixations on target words were also
excluded from analysis if they contained a first-pass blink or if there was a blink during an
immediately preceding fixation (fixations on 14 words). Further, target fixations were eliminated
if there were problems with display changes. For non-zero SODs, we excluded display changes
with temporal inaccuracies that exceeded + 17 ms (i.e., 50 % of SOD steps in either direction)
relative to the start of the post-change fixation; the majority of these errors were due to display
changes that completed earlier than intended. For the 0-ms SOD, we included only targets with
display change times between -30 and 0 ms relative to fixation onset; this filter made sure that
display changes in the 0-ms SOD condition were executed during saccades such that their
visibility was minimized (cf., Matin, 1974; Slattery, Angele, & Rayner, 2011). Latencies of

Direct control of eye movements 11
effective display change initiation relative to the onset of the first fixation on the target word
are listed in Table 1. Temporal errors leading to data exclusion occurred on 10 % and 14 % of
target display changes in the non-zero SODs and the 0-ms SOD, respectively. We also discarded
sentences with display change problems on any word prior to the target (14%). Finally, we
excluded fixations that were preceded or followed by saccades larger than 25 characters as well
as those that were followed by a regression. This screening resulted in 2,238 fixations on target
words (Footnote 2). The number of fixations was similar across conditions (i.e., 607, 572, 545,
514 fixations for SODs of 0, 33, 66, and 99 ms, respectively).
--- Table 1 about here ---
From these data, first-fixation durations (FFD, the first fixation on a word independent of
how many other fixations were made), and gaze durations (GD, the sum of all fixations on a
word before moving to another word) were determined for target words. Linear mixed models
(LMMs) implemented in the lme4 package (Bates & Maechler, 2010) were used for statistical
analyses of logarithmic fixation durations. These models provided estimates of SOD effects,
simultaneously taking into account fixed effects of initial landing position (Footnote 3) on the
target (linear and quadratic trends) as well as of printed word frequency and length; subjects
and words were specified as random effects (Footnote 4). For LMMs, effects of onset delay
were parameterized with three contrasts between “neighboring” SODs (i.e., the difference
between 0-ms and 33-ms SODs; analogously between 33-ms and 66-ms SODs, and between 66-
ms and 99-ms SODs). Further, considering the low number of 4- and 7-character targets, word
length was specified as a two-level factor (short: 4-5 letters, long: 6-7 letters) and also

Direct control of eye movements 12
parameterized as a contrast (i.e., the difference between short and long words). t-values larger
than 2 are interpreted as significant because given the number of subjects and the number of
observations per subject in our experiment the t-distribution effectively approximates the
normal distribution. All fixed effects reported as significant were also significant according to
MCMC-based 95% HPD intervals, using the mcmcsamp with n=10,000 samples and HPDinterval
functions of the lme4 package; corresponding p-values are provided in the LMM tables (Tables 3
and 5). Data were visualized using the ggplot2 package (Wickham, 2009). Both packages run in
the R system for statistical computing (R Development Core Team, 2010).
Results and Discussion
Distributions and mean fixation times
Density plots of fixation times (Figure 1) indicated that non-zero delay distributions
largely lined up with SODs: A longer SOD resulted in a right-shift of the distributions.
Accordingly, mean fixation times (Table 2) increased with SOD step-ups from 33 to 99 ms.
Specifically, the increase of 33 ms was rather precisely reflected for GD in the non-zero SOD
conditions, while it was somewhat smaller for FFD, especially in the 99-ms vs. the 66-ms SOD.
Unexpectedly, though, fixation times were longer in the 0-ms than in the 33-ms SOD. The 0-ms
SOD distribution peaked somewhat later than the 33-ms SOD distribution and essentially lay
between the distributions of the 33-ms and 66-ms SODs (Figure 1A). Potential reasons for this
surprising and novel pattern are discussed below (see General Discussion). Yet, the relatively
longer fixation times in the 0-ms SOD resulted in an underestimation of the linear slopes
(Footnote 5) for fixation times as a function of SOD; they were estimated considerably smaller

Direct control of eye movements 13
than one (FFD: 0.40; GD: 0.56). Slopes across the non-zero delays only were clearly steeper and
were close to one for GD (FFD: 0.70; GD: 0.98).
--- Figure 1 about here ---
LMM results
Results of LMMs including SOD, initial landing position, word frequency, and length as
predictors are listed in Table 3. In line with distributions (Figure 1) and mean fixation times
(Table 2), FFD and GD were significantly longer in the 0-ms compared to the 33-ms SOD. For all
other contrasts between non-zero SODs, FFD and GD increased significantly with SODs.
--- Table 2 about here ---
Apart from these delay-induced effects, fixation durations were reliably modulated by
the initial landing position in the target word. Specifically, the quadratic trend for GD indicated
that fixation durations were longest when words were fixated at their beginnings, and
decreased as the eyes landed towards the word center. At positions close to word endings, GD
tended to increase again (Figure 2A, right panel) (Footnote 6).
--- Table 3 about here ---
Compared to the GD results, FFD showed the inverse pattern. Fixations were shortest at
the beginning of words and increased with letter position (Figure 2A, left panel). The quadratic

Direct control of eye movements 14
trend indicated that this increase diminished towards word center. This pattern is compatible
with the inverted optimal viewing position (IOVP) effect (Vitu, McConkie, Kerr, & O’Regan,
2001), i.e., the phenomenon that reading fixations are shorter at word edges than at word
center. One explanation for the IOVP effect is that corrective saccades are executed very quickly
when the eyes land away from the intended optimal position for lexical processing, i.e., slightly
left from the word center (Nuthmann et al., 2005; Nuthmann, Engbert, & Kliegl, 2007). It has
also been suggested that reading fixations are generally shorter at locations which are expected
to be less optimal for letter extraction (Vitu et al., 2001, 2007) (Footnote 7). Accordingly, rapid
saccades (or short fixations) at word-initial positions are largely triggered by low-level visual
information. For FFD, the interaction of quadratic landing position x contrast between 0-ms and
33-ms SOD points to a sizeable (inverse) delay effect at more central landing positions, whereas
fixation durations for the two conditions were similar towards the beginning of words.
--- Figure 2 about here ---
Fixation durations (i.e., FFD and GD) were also shorter for high than for low frequency
words, an effect that is in line with numerous earlier reports (e.g., Inhoff & Rayner, 1986; Kliegl,
Grabner, Rolfs, & Engbert, 2004; Kliegl, Nuthmann, & Engbert, 2006; Rayner & Duffy, 1986; see
Rayner, 1998, 2009 for further summaries). The result is also in accordance with a direct control
perspective as it shows that fixation durations are modulated by lexical information after mask
offset. In addition, an interaction of frequency x contrast between 99-ms and 66-ms SOD
indicated a stronger frequency effect for GD in the 99-ms than in the 66-ms SOD (Figure 3B).
Thus, the data provide some evidence that with long onset delays processing related to lexical

Direct control of eye movements 15
information (e.g., predictions based on prior sentence context and visual mask length) may have
started and affected fixation duration. This suggests that top-down processes can contribute to
eye movement control which is associated with processing lexical information.
Further, and opposite to previous findings (e.g., Kliegl et al., 2004, 2006), an effect of
word length revealed longer FFD for short than for long targets; none of the interactions of
length x SOD was significant. Yet, Figure 3A illustrates that this effect was numerically strongest
in the 0-ms SOD, whereas non-zero SODs show only small length-related differences.
Accordingly, neither the main effect of length nor any interaction with SOD survived, when the
0-ms SOD was excluded in the LMM (|t|’s <1.23). This pattern suggests that the unexpected
pattern of longer fixation durations in the 0-ms compared to the 33-ms SOD was especially
driven by short target words (i.e., 4-5 letters).
--- Figure 3 about here ---
Landing sites and short fixations
As another prominent characteristic of the data, the distributions of (first) fixation
durations, especially for the 99-ms SOD revealed a population of long fixations, but also a
sizeable proportion of fixations shorter than 100 ms relative to the display change (FFD: 0.0%,
0.9%, 2.8%, 8.8% and GD: 0.0%, 0.0%, 0.7%, 2.1% of fixations in the 0-, 33-, 66-, 99-ms SODs,
respectively) (Figure 1A). This observation becomes even more apparent when onset delays are
subtracted from fixation durations; that is, when fixation times are computed relative to the
onset of the target word (Figure 1B). Given that the signal of a word reaches the visual cortex
only about 50 ms after unmasking (e.g., Martinez, Anllo-Vento, Sereno, Frank, Buxton,

Direct control of eye movements 16
Dubowitz, et al., 1999) and that it takes around 135 ms to program a new saccade (e.g., Becker
& Jürgens, 1979), these short fixation durations are unlikely to be modulated by lexical
processes. Instead, considering the IOVP effect, a plausible source for the rapid saccades is their
initial landing position. That is, the population of short fixations may mainly originate at non-
optimal positions, i.e., at the word beginning. To test this idea we divided FFD distributions into
two quantile-based landing zones (word beginning: 0%-25% of word length; word center-to-
end: 25%-100% of word length). As expected and shown in Figure 2B, short fixation durations
were predominantly triggered when the eyes had landed at the beginning of a word. There
were only very few short fixations when the word-central region was initially fixated. Thus, a
considerable proportion of rapid saccades were launched from non-optimal viewing positions, a
result lending support to the notion of corrective saccades (Nuthmann et al., 2005); indeed, 78%
of the short FFD were followed by a re-fixation on the target word. Similarly, the perceptual
economy hypothesis poses that fixation durations are short when low-level visual information
(e.g., the proximity of inter-word spaces) indicates that little lexical information can be
expected; accordingly, saccades are rapidly initiated from landing positions close to word edges
(Vitu et al., 2001, 2007). After all, the population of short fixations may reflect a mixture of
these accounts and our data do not disclose the exact underpinnings of the rapid saccades and
the associated IOVP effect. However, with respect to our main goal, namely to examine the role
of direct control in reading, it can be concluded that these short fixations were largely detached
from lexical processing.
Short fixations have also been considered as the result of pre-programmed saccades. For
instance, Morrison (1984) proposed that advanced parafoveal pre-processing of a word to the
right of the fixation initiates a saccade program to the second-next word, resulting in a short

Direct control of eye movements 17
subsequent fixation or skipping. This explanation, however, cannot be true here because lexical
information was parafoveally unavailable. It is possible, though, that saccades were pre-
programmed independently from parafoveal vision. For example, fixations on the target can be
short when a random timer has initiated a saccade program during the pre-target fixation (cf.,
Nuthmann & Henderson, 2012; Schad & Engbert, 2012; see also General Discussion). However,
this does not explain the interdependence of short fixations and non-optimal viewing position;
we therefore suspect that rapid saccades were at least partly triggered by low-level visual
information.
Interestingly, the populations of shorter and longer fixation durations appear to be
separated by a trough (Figure 1). A likely reason for this bimodality is saccadic inhibition, i.e., the
transient inhibition of saccade generation starting around 60-100 ms after the onset of a very
noticeable visual stimulus (e.g., a white flash covering the top and bottom third of a monitor;
Reingold & Stampe, 1999, 2000, 2004). In fact, Figure 2B (left panel) shows a drop in saccade
rates at approximately 150 ms and 190 ms, for 66-ms, and 99-ms SODs respectively. That is, 100
ms after the display change turned a masked stimulus into a word, a considerable proportion of
saccade programs had been cancelled (Footnote 8).
Evidence for direct control?
Are the results of Experiment 1 compatible with predictions from direct eye movement
control? As stated above, the 33 and 31 ms differences in mean GD reflect quite accurately the
differences between the non-zero SODs, but they were shorter than predicted for FFD at the
longest delay of 99 ms (see Table 2). This was also expressed in a slope smaller than 1 for the

Direct control of eye movements 18
regression of FFD on SOD even after exclusion of the 0-ms SOD condition (i.e., FFD: 0.70; GD:
0.98).
Yet, the above analyses identified a population of rapid saccades that appeared to be
driven by low-level information from suboptimal landing positions (Nuthmann et al., 2005,
2007; Vitu et al., 2001, 2007). Especially in the 99-ms SOD, a sizable proportion of first fixations
landing in the first quarter of targets were terminated within 100 ms after stimulus onset.
Evidently, these rapid saccades affected the estimation of delay effects on fixation durations
associated with lexical processing. Excluding fixations durations smaller than 100 ms relative to
the display change improved the correspondence of non-zero SODs and the increase in FFD
(slope = .91; 33-ms SOD: 272 ms; 66-ms SOD: 302 ms; 99-ms SOD: 334 ms) and led to a slope
even slightly greater than one in GD (slope = 1.07; 33-ms SOD: 322 ms; 66-ms SOD: 356 ms; 99-
ms SOD: 394 ms). This is also apparent in Figure 4A (data for Experiment 1) that displays
observed mean fixation times (cf., Table 2) together with LMM-based estimates. After partialing
out influences of landing position, frequency, and word length, as well as random effects due to
subjects and words, the data clearly reveal a linear course with a slope of approximately one
across non-zero SODs.
Notably, Figure 4B illustrates that SOD effects were not restricted to target words. In
accordance with the constant delays per sentence, the effect of non-zero SODs is nicely
reflected in FFD as well as in GD on non-target words. Likewise, the pattern of longer fixation
durations in the 0-ms compared to the 33-ms SOD translates to pre- and post-target words. The
observation that inspection times are somewhat longer at target compared to non-target words
in all SOD conditions is presumably a consequence of the constraint that targets were always

Direct control of eye movements 19
content words of low predictability whereas word class and predictability were not controlled
on other positions.
In summary, the results suggest that eye movements in Experiment 1 were driven by two
sources. One was low-level visual information triggering rapid saccades after fixations landed at
suboptimal viewing positions. The other source was related to lexical processing (i.e. word
frequency) and depended on when this information became available; for this case, unit slopes
from regressions of fixation durations on SODs are in line with predictions of direct lexical
control.
--- Figure 4 about here ---
Experiment 2
In Experiment 1, SODs were identical for all words in a sentence. Disregarding short
inspection times at non-optimal viewing positions, the delays translated one-to-one in increases
in fixation durations. Yet, target words occurred on average only after the seventh position in
sentences. It is therefore possible that saccade timing generally adjusted to the constant delays
across the course of target-preceding words, even if oculomotor control was partly independent
from lexical processing. In other words, the constant SODs for all words in a sentence might
have translated into a corresponding global increase of fixation durations; locally eye
movements may not have been under direct control (Trukenbrod & Engbert, submitted).
We addressed this issue in Experiment 2, where again all words were masked unless they
were fixated. Different from Experiment 1, though, onsets were delayed only on target words
(0-, 33-, 66-, or 99-ms SODs). All other words were always immediately unmasked when the

Direct control of eye movements 20
eyes crossed the boundary (i.e., 0-ms SOD). Because subjects were unaware of the existence of
target words (and their position), and because SODs varied randomly between sentences, it was
impossible to prepare for the infrequently augmented SODs (cf., Henderson & Pierce, 2008).
Yet, according to direct control assumptions, fixation durations should still capture the target-
specific onset delays. Another purpose of Experiment 2 was to replicate the unexpected finding
of longer fixation durations in the 0-ms than in the 33-ms SOD condition.
Methods
Subjects
Thirty-two students at the University of California San Diego received course credit for
participating. They were native speakers of English and had normal or corrected-to-normal
vision. None of them had participated in Experiment 1.
Stimuli, recording, and procedure
Stimuli, data recording, and procedure were adopted from Experiment 1. As before,
sentences were presented with a one-word moving window procedure, such that every word
was masked unless it was fixated. However, different from Experiment 1, stimulus onset was
delayed for 0 ms for all words in a sentence except for the targets, which were delayed for
either 0, 33, 66, or 99 ms. Subjects read sentences for comprehension and responded to
multiple choice questions in one third of the trials (accuracy was 91%). Subjects were informed
about the masking of stimuli but were unaware of varying onset delays on target words. The
experimental session took around 45 minutes.

Direct control of eye movements 21
Data processing and analyses
Data were processed and analyzed analogously to Experiment 1. From a total of 58,012
data points (without sentence-initial and final words and fixations), screening resulted in 2,357
valid fixations on target words (cf., Methods of Experiment 1 and Footnote 2). FFD and GD were
statistically analyzed in linear mixed models (LMMs) including contrasts of neighboring SODs,
initial landing position (Footnote 9) (linear and quadratic trends) as well as word frequency and
length (short: 4-5 letters, long: 6-7 letters) as predictors. In contrast to Experiment 1, however,
the specification of words as a random factor did not improve the model. In other words, there
was no reliable variance associated with differences in mean durations on words (likelihood
ratio tests yielded chi-square values < 1 for one degree of freedom). Hence, only subjects were
included as a random factor. The amount of data entering analyses was similar across conditions
(i.e., 580, 586, 584, 607 fixations for the 0-ms, 33-ms, 66-ms, and 99-ms SODs, respectively).
Results and Discussion
Distributions and mean fixation times
Density plots of FFD and GD (Figure 5) revealed a pattern comparable to Experiment 1:
The distributions of the 66- and 99-ms SODs were systematically shifted to the right relative to
the adjacent lower SOD, and the increase of mean fixation durations was close to the SOD time
steps (Table 4). Similar to Experiment 1, fixation durations in the 0-ms SOD were longer than
expected. On average, FFD were 2 ms longer at the 0-ms compared to the 33-ms SOD; for GD,
the difference (10 ms) was even larger. Accordingly, the 0-ms SOD distribution largely
overlapped with the 33-ms SOD condition and revealed shorter fixation durations only in a small
range of the fastest saccades (Figure 5A). Thus, the result of prolonged inspection times after

Direct control of eye movements 22
non-delayed vs. delayed stimulus onsets was also present in Experiment 2. Although
explanations remain tentative (see General Discussion) the replication across two experiments
enhances the likelihood that this pattern is reliable. As in Experiment 1, the 0-ms SOD condition
caused an underestimation of the slopes for fixation times across onset delays (FFD: 0.61; GD:
0.53). With the 0-ms SOD excluded, the slopes in the non-zero SODs were much steeper (FFD:
0.92; GD: 0.94).
--- Figure 5 about here ---
LMM results
We scrutinized fixation durations including SOD, initial landing position, log frequency,
and word length as LMM predictors (Table 5). Increases of fixation durations for the 66-ms vs.
the 33-ms and for the 99-ms vs. the 66-ms SODs were significant. In contrast, the comparison of
the 33-ms and 0-ms SODs indicated longer FFD and GD for the 0-ms SOD. This result is surprising
given an observed FFD difference of only -2 ms (see Table 4), but it reflects an estimated
difference of -14 ms (backtransformed from log scale) after statistical control of the other
covariates in the LMM (i.e., a suppressor effect). This is also apparent in Figure 4A that reveals
substantially longer FFD in the 0-ms SOD of Experiment 2 after correcting for influences of other
predictors.
--- Table 4 about here ---

Direct control of eye movements 23
In addition to SOD effects, inspection times were again affected by initial landing
position. Figure 6A (right panel) shows that GD were longer at the beginning than in the middle
or at the end of words (quadratic trend).
In contrast, FFD increased with fixated letter position (Figure 6A, left panel). As indicated
by the quadratic trend, the increase was stronger at target-initial than at central or final
positions. That is, fixation durations were shorter near the beginning than near the center or the
end of the words, a pattern that is again in line with the IOVP effect (Nuthmann et al., 2005,
2007; Vitu et al., 2001; cf., Experiment 1) (Footnote 10). The interaction with the contrast
between 33-ms and 0-ms SOD revealed shorter FFD for 0-ms compared to 33-ms SOD at word-
initial and final positions, whereas the pattern was reversed for more central landing sites.
Moreover, an interaction with the contrast between 33-ms and 66-ms SOD (FFD) as well as with
the contrast between 66-ms and 99-ms SOD (FFD, trend for GD) indicated that the delay effect
was less pronounced at word-initial positions.
--- Table 5 about here ---
As in Experiment 1, a main effect of frequency yielded shorter fixation durations for high
than for low frequency words (cf., Figure 3C-D); none of the interactions of frequency with SOD
was significant. Thus, we failed to replicate the stronger frequency effect for the 99-ms SOD
observed under the conditions of Experiment 1. Hence, we have no evidence that SOD
modulated the processing of lexical information in Experiment 2. At this point, it is not possible
to decide whether the effect was spurious in the first experiment or whether the change to a
uniform 0-ms SOD for non-target words is responsible for its absence in the second experiment.

Direct control of eye movements 24
Word length did not significantly affect fixation durations, neither as a main effect nor in
interaction with SOD. Figure 3C suggests, though, that FFD in the 0-ms SOD condition were
numerically longer for short (i.e., 4-5 letters) than for long (i.e., 6-7 letters) words. Thus,
consistent with the pattern observed in Experiment 1, word length appears as a candidate to
mediate fixation durations when stimuli are unmasked without delay (i.e., 0-ms SOD).
Landing sites and short fixations
Similar to observations in Experiment 1, density plots of the 99-ms and 66-ms SODs
suggested a population of short FFDs that appeared to be separated from longer inspection
times (Figure 5A). Subtracting onset delays from corresponding fixation durations (Figure 5B)
makes clear that the majority of saccades were executed in a range of 150 to 400 ms after
stimulus onset, but that some fixation durations were shorter than 100 ms post-onset (FFD:
0.5%, 2.1%, 5.5%, 7.0% and GD: 0.0%, 1.6%, 0.7%, 2.0% of fixations in the 0-, 33-, 66-, 99-ms
SODs, respectively). Analogously to Experiment 1, we tested whether these short fixations
originated from viewing positions at word beginnings and divided FFD distributions into
quantile-based landing zones. Indeed, Figure 6B shows that short fixation durations were
predominantly observed at landing sites near the beginning of targets. Thus, consistent with
Experiment 1, it seems that low-level information related to non-optimal viewing positions
rapidly triggered saccades (cf., Nuthmann et al., 2005, 2007; Vitu et al., 2001, 2007); from these
short fixations, 71% resulted in a refixation on the target word. Further, the drop of saccade
rates at around 100 ms after the display change points to an interruption of saccade execution,
presumably as a consequence of saccadic inhibition (Reingold & Stampe, 1999, 2000, 2004) (see
also Footnote 8).

Direct control of eye movements 25
--- Figure 6 about here ---
Evidence for direct control?
Experiment 2 tested whether onset delays fully translate into increases of fixation
durations in the absence of prior temporal preparation. SODs larger than 0 ms were therefore
implemented only for target words, while all other words in sentences were immediately
(Footnote 11) unmasked upon fixation.
Mean fixation durations indicate that non-zero target SODs were reflected quite
accurately in FFD and GD (Table 4). Yet, given the presence of short fixations, slopes are
somewhat smaller than one (FFD: 0.92; GD: 0.94). When durations of less than 100 ms after
stimulus onset are excluded, the slope for FFD increases even slightly above one (slope = 1.05;
33-ms SOD: 278 ms; 66-ms SOD: 310 ms; 99-ms SOD: 346 ms) while there is only little change
for GD (slope = .95; 33-ms SOD: 334 ms; 66-ms SOD: 364 ms; 99-ms SOD: 397 ms). Accordingly,
Figure 4A (data from Experiment 2) illustrates that LMM-based estimates of fixation durations
linearly increase with approximately unit slope across non-zero SODs.
As in Experiment 1, fixation durations mirrored the experimental manipulation also on
non-target words (Figure 4B). That is, the 0-ms SOD at pre- and post-target (Footnote 12) words
yielded comparable FFD and GD, whereas the prolongation due to non-zero SODs clearly
showed up on targets. This pattern demonstrates the success of our SOD implementation and
supports the validity of our conclusions.
Overall, the results line up with those of Experiment 1. The data suggest that rapid
saccades can be triggered by low-level information, independent from lexical processing. The
majority of saccades, however, appeared to be determined by the time required for processing

Direct control of eye movements 26
the fixated word (i.e., word frequency). This is in agreement with a one-to-one translation of
stimulus delay into prolongation of fixation duration and consistent with direct lexical control of
eye movements during reading.
General Discussion
In two experiments we tested whether stimulus onset delay (SOD) during reading
translates into an equivalent extension of fixation durations; that is, whether we can
demonstrate direct lexical control for eye movements in a boundary paradigm precluding non-
foveal lexical information. The main results can be summarized as follows: First, we observed
the expected increase of fixation durations as a one-to-one translation of SODs when we
excluded 0-ms SOD and short fixations that were executed within 100 ms after word onset; for
the 0-ms SODs, fixation durations were longer than in the 33-ms SOD. Second, analyses of
fixation time distributions indicated that the population of rapid saccades was linked to starting
locations at the beginning of words. Third, robust frequency effects across all conditions
demonstrated that fixation durations depend on word difficulty in addition to the delay of
lexical information. In the following we first discuss findings concerning effects of non-zero
SODs on fixation times. Then, we turn to the unexpected result relating to the 0-ms SOD.
SOD effects and evidence for direct control
Previous studies using SODs in reading generally reported longer fixation durations for
increasing delays, but the increase of fixation durations was often smaller than the delay itself
(e.g., Rayner & Pollatsek, 1981; Morrison, 1984). We suspected that these experimental designs
did not sufficiently rule out the modulation of fixation duration by parafoveal processing of

Direct control of eye movements 27
target words. In addition, a number of rapid saccades, presumably due to low-level visual
information or pre-programming, may also have veiled a one-to-one translation of SOD to
fixation durations (cf., Luke et al., in press; Nuthmann & Henderson, 2012). Here, we tested this
hypothesis (1) by precluding parafoveal preview and (2) by manipulating the delay with which
words were displayed once the eye landed on them (i.e., SODs ranging from 0 to 99 ms). We
reasoned that these delays should be fully reflected in fixation times if no parafoveal
information is granted.
In Experiment 1, onset delays were constant for all words in a sentence. In line with
previous reports, this resulted in an increase of fixation times. Specifically, later availability of
lexical information in the non-zero SODs was quite accurately captured by increases of GD,
whereas FFD were shorter than predicted especially with an SOD of 99 ms. A likely reason for
the latter finding is that there was a considerable proportion of rapid saccades in the 99-ms
SOD, which deflated fixation time means -- and particularly those of FFD. In fact, excluding
fixation durations shorter than 100 ms relative to word onset led to slopes close to one for FFD
and even slightly greater than one for GD. Thus, the results were largely compatible with direct
control wherein saccade programs are initiated contingent on the presence of the target word.
In other words, in the absence of parafoveal processing, delayed starts of lexical processing due
to delayed stimulus onsets were compensated by an equivalent increase in fixation durations.
Theoretical proposals about saccade control distinguish between global and local control
of fixation durations (for a review see e.g., Trukenbrod & Engbert, submitted). In Experiment 1,
all words in a sentence were delayed for the same period. Since the eyes passed on average
seven words before they reached the critical target, saccadic control could have adapted to
sentence-specific conditions. Hence, the increase in fixation times could also have been due to

Direct control of eye movements 28
an adjustment to global temporal settings rather than to local lexical processes. We tested this
possibility in Experiment 2, where all words except for the targets were unmasked with a delay
of 0 ms. Thus, non-zero SODs occurred only occasionally and at unpredictable positions (i.e., on
target words) so that global temporal preparation to specific delays was impossible (cf.,
Henderson & Pierce, 2008). Critically, target fixation durations still reflected the onset delays
very precisely, that is, slopes of FFD and GD across non-zero delays were approximately one
after excluding rapid saccades that started less than 100 ms after word onset. The results are
therefore comparable to those of constant onset delays (Experiment 1), and, again, in the
absence of parafoveal processing, they are in line with a one-to-one translation of word onset
into fixation duration.
The pattern of delay-induced prolongations of fixation durations is summarized in Figure
4B, illustrating the course of FFD and GD over five successive words. The plot shows that
constant SODs in Experiment 1 yielded increasing fixation times on all words. In contrast, non-
zero delays in Experiment 2 triggered sudden increases of fixation durations only on targets,
while they were very similar across all conditions on target-preceding words (i.e., 0-ms SOD).
Fixation durations therefore largely line up with delay manipulations and reveal a remarkable
correspondence between the experiments.
Obviously, our results are limited in generalizability, because display changes may trigger
other processes that affect fixation durations. One likely candidate, for example, is saccadic
inhibition, that is, the cancellation of current saccadic programs due to visual onsets which has
been shown to cause systematic shifts in fixation durations (Reingold & Stampe, 1999, 2000,
2004). In fact, the distributions of fixation durations revealed a drop of saccade rates at around
100 ms after word onset in the current experiments.

Direct control of eye movements 29
Especially at long SODs, this translated into a bimodality of the distributions, which
showed that a considerable proportion of fixations were terminated within the first 100 ms
after the stimulus was unmasked (see also Footnote 8). Such rapid saccades are most likely too
fast to be initiated by lexical processing (cf., Becker & Jürgens, 1979; Martinez et al., 1999). In
fact, closer examination of the short inspection times showed that they predominantly resulted
from fixations at non-optimal viewing positions at word beginnings. This is compatible with the
proposal that fixations landing at unintended viewing positions due to oculomotor error (i.e.,
away from the intended word center) can trigger corrective saccades (Nuthmann et al., 2005,
2007; see also Engbert et al., 2005; Reichle et al., 2009). Such corrective saccades can be
essentially initiated without delay under the assumption of continuous saccade monitoring,
wherein an efference copy of the motor command to the eye muscles informs about
discrepancies between the intended and the actually executed saccade program (cf., Carpenter,
2000). As another contributor, the perceptual economy hypothesis suggests that fixation
durations are shorter at locations that are expected to provide little lexical information, such as
at word edges. Estimates of processing efficiency can be rapidly made on the basis of low-level
visual information, e.g., the distance of inter-word spaces from the fixation position (Vitu et al.,
2001, 2007); in fact, visual masks did not cover inter-word spaces, they preserved information
about word boundaries. Finally, it is possible that rapid saccades were pre-programmed prior to
target fixation. This pre-programming cannot be the result of parafoveal lexical pre-processing
(Morrison, 1984), but is in accordance with mechanisms of autonomous saccade timing (see
below, e.g., Engbert & Kliegl, 2001; Nuthmann & Henderson, 2012; Trukenbrod & Engbert,
submitted). Yet, this account does not explain the relation of rapid saccades and fixation
position and therefore may only partly contribute to the observed pattern.

Direct control of eye movements 30
In sum, our results indicate that during reading with gaze-contingent display changes, a
number of saccades are detached from lexical processing; those are triggered either directly on
the basis of low-level visual information, or indirectly by an autonomous saccade timer. On the
other hand, the data provide convincing evidence that the majority of fixations feature a one-to-
one mapping of word onset and lexical information (i.e., frequency, see below) into fixation
duration, supporting a perspective of direct lexical control (Reingold et al., 2012).
Implications for models of oculomotor control
Notably, similar results have been reported in recent SOD experiments on scene viewing
and paragraph reading which also revealed bi-modal distributions of inspection times
(Henderson & Pierce, 2008; Henderson & Smith, 2009; Luke et al., in press; Nuthmann &
Henderson, 2012). Modal values of fixation durations longer than the masking interval increased
with SODs with a slope of one, whereas fixation times shorter than the SOD were unaffected by
the delay. The data were simulated with CRISP, a model for fixation durations in scene viewing,
which basically combines autonomous saccade timing with direct oculomotor control
(Nuthmann et al., 2010). Specifically, CRISP assumes that (1) programming of a new saccade is
initiated when a discrete-stage random walk reaches a threshold, and (2) saccade programming
consists of a labile and a non-labile stage. Visual-cognitive processing difficulties can directly
prolong a fixation as they can inhibit the random walk and may cancel a labile saccade program.
However, depending on the saccade programming stage, visual-cognitive influences may
sometimes come in too late, especially when the current fixation is short because the saccade
program has already started during the previous fixation. With these principles, the model was

Direct control of eye movements 31
able to account for fixation time distributions and captured SOD-related effects in paragraph
reading (Nuthmann & Henderson, 2012; see also Luke et al., in press).
Clearly, the generalizability of these results to our data cannot be taken for granted,
since the paragraph reading studies implemented full-screen masks that occurred only
occasionally and did not preclude parafoveal preview. In contrast, our one-word moving
window on single-line sentences restricted bottom-up lexical processing to the foveal word and
featured comparably subtle display changes. Given the similarity of the results, though, the
CRISP simulations inform about possible implications of our data for current models of
oculomotor control in reading.
For instance the SWIFT model (which shares core principles with CRISP) assumes that
saccades are initiated by an autonomous random timer that draws durations from a gamma
distribution (SWIFT 2, Engbert et al., 2005). In a more recent version, the timer has also been
implemented as a discrete random walk, together with a dynamic attentional span that is
modulated by foveal load (SWIFT 3, Schad & Engbert, 2012; see also Trukenbrod & Engbert,
submitted). Critically, random timing in SWIFT models can be directly inhibited by foveal
processing difficulties, causing a prolongation of fixation durations. In addition, and in line with
the principle of re-afference, saccades from unintended viewing positions can be rapidly
initiated to correct for oculomotor errors. Thus, SWIFT incorporates principles of both indirect
(e.g., random timer) and direct control (e.g., foveal inhibition).
Another class of models has a stricter focus on direct control. For instance, the E-Z
Reader model (Reichle et al., 1998, 2006, 2009) assumes that fixation durations are under
immediate control of current lexical processing. After an early familiarity check of the fixated
word (stage L1), a saccade program to the next word is initiated, while the current word is

Direct control of eye movements 32
further fixated and processed up to a level of lexical completion (stage L2). Most often, L2
finishes earlier than the saccade program, resulting in a covert attention shift to the next word,
which is then pre-processed (if parafoveally available). The critical point is that lexical processing
is a prerequisite for saccade initiation. Yet, the model also incorporates the assumption that
refixations can be rapidly triggered when the eyes landed away from intended viewing positions
(i.e., re-afference).
Apparently, both architectures implement mechanisms of direct lexical control that can
account for a one-to-one mapping of SODs into fixation durations. Further, they feature
principles that permit the execution of rapid saccades from non-optimal viewing positions (i.e.,
non-lexical direct control; see also Reingold et al., 2012). Qualitatively, it therefore seems that
both classes of models are compatible with our data. Future comparisons of the different
implementations of direct and indirect control may show whether one of them is able to
capture the data more reliably on a quantitative level.
Word frequency and lexical processing
We also obtained a robust effect of word frequency with shorter fixation durations for
high than for low frequency words in both FFD and GD. This is in line with other studies
providing evidence for direct lexical control in reading. For instance, Staub, White, Drieghe
Hollway, and Rayner (2010) fitted ex-Gaussian distributions to FFD and GD. All distributions
were shifted to the right for low compared to high frequency words, suggesting that lexical
processing directly affects early (FFD) and later (GD) measures of eye movements.
Robust frequency effects have also been shown in the disappearing text paradigm in
which words were removed or masked 60 ms after fixation onset (Liversedge, Rayner, White,

Direct control of eye movements 33
Vergilino-Perez, Findlay, Kentridge, 2004; Rayner, Inhoff, Morrison, Slowiaczek, & Bertera, 1981;
Rayner, Liversedge, White, Vergilino-Perez, 2003). This indicates that lexical information
extracted from the first 60 ms of foveal vision has a strong effect on oculomotor control.
Notably, reading is relatively unimpaired when only the fixated word disappears, but the
simultaneous removal of the word to the right of the fixation substantially distorts reading
(Rayner, Liversedge, & White, 2006).
Similarly, Reingold et al. (2012) recently showed that direct lexical control of eye
movements critically depends on parafoveal pre-processing. Specifically, ex-Gaussian and
survival analyses revealed word frequency effects in FFD distributions from 145 ms onwards,
when target words were visible during the fixation on the previous word. In contrast, when
targets were masked prior to fixation, the frequency effect was reduced in mean fixation
durations and emerged only after 256 ms, i.e., when 60 % of FFDs were already terminated.
Frequency effects in our data, though, were relatively robust although parafoveal
preview was always precluded. A likely reason is that our setting generally slowed down
reading, granting more time for frequency to affect fixation durations. In fact, fixation durations
in the 0-ms SOD were around 50 ms longer than in unconstrained reading (or in Reingold et al.’s
data where preview was prevented only on the target word). This slowing of reading speed
roughly corresponds to the size of the preview benefit effect, i.e. the temporal advantage of
fixation durations after correct compared to incorrect parafoveal preview (Rayner, 2009). As a
related issue, it may also point to a modified reading strategy relying exclusively on foveal and
ignoring parafoveal information.
Interestingly, the frequency effect in GD of Experiment 1was modulated by SOD:, the
frequency effect was significantly stronger for the 99-ms than the 66-ms SOD (which did not

Direct control of eye movements 34
differ from the shorter SODs). Possibly, the interaction indicates that processing of high
frequency words benefits from long waiting periods. A potential reason is that long SODs
afforded processing of the present and the next word length, which could be retrieved from
mask size. Hence, while we have effectively eliminated bottom-up lexical processing until after
the delay, visual information from the mask may have biased readers to predict the upcoming
word from the prior context (Footnote 13). Although predictability of our target words was
generally low, the natural correlation of predictability and frequency (e.g., Dambacher & Kliegl,
2007) may have caused a larger benefit of such predictions for high than for low frequency
words. Such predictive inferences are likely enhanced for the long SODs in Experiment 1, where
constant delays granted additional time prior to obtaining useful bottom-up lexical information
on every word. In Experiment 2, in contrast, a top-down based strategy may have been less
useful because non-zero delays occurred only occasionally on target words. Consequently, the
interaction of frequency and SOD was not significant. In the end, the exact reasons for the
different patterns between the experiments remain unknown at this stage. It is also possible
that the interaction did not replicate because it was a spurious result in Experiment 1 or
because, for example, the difference in unmasking times between target and non-target words
in Experiment 2 caused disruptions, which eliminated this effect.
Zero vs. non-zero SODs?
Finally, we address a puzzling issue: the 0-ms SOD yielded longer fixation durations than
the 33-ms SOD. This result is roughly in agreement with Inhoff et al. (2005) who did not find a
significant increase between 0 and 70 ms SOD. Hohenstein et al. (2010) discussed this result as
an inconsistency with the increase they observed between 33 and 66 ms SOD. The present set

Direct control of eye movements 35
of results reconciles this difference: apparently, there is another process contributing during 0-
ms SODs.
One potentially contributing factor is that display changes due to the unmasking of
words are visible in non-zero SODs, but occur during a saccade at a 0-ms SOD and, therefore,
are mostly not perceived. According to current evidence, saccadic inhibition predominantly
depends on the visibility of display changes (see above; Reingold & Stampe, 2004). In a series of
experiments designed to assess the detection of display changes during reading, Slattery et al.
(2011) found evidence of saccadic inhibition only in conditions in which the display change was
delayed. Such a difference between immediate and delayed display changes may cause a
qualitative difference between the non-zero and 0-ms SODs. Thus, the 33-ms SOD may indeed
serve as a more appropriate reference condition for onset delays in the present experiments.
Further influences may arise from saccadic suppression, i.e., the phenomenon that
uptake of visual information is strongly reduced during a saccade. Even after offset of reading
saccades, it takes around 30 ms until the sensitivity is fully recovered (Ishida & Ikeda, 1989;
Matin, 1974). Accordingly, visual processing in the 0-ms and 33-ms SODs may start in a similar
time range, which would explain comparable fixation durations.
Indeed, Vaughan (1982; see also Vaughan & Graefe 1977) obtained essentially equal
fixation durations in a 0-ms SOD compared to a 30-ms or a 60-ms SOD condition in a visual
search task. They suggested that foreperiods, during which stimuli are masked, can serve as a
warning signal that facilitates the response to an upcoming stimulus and may even accelerate
oculomotor latencies. In fact, visual warning signals substantially reduce saccadic response
times (Ross & Ross, 1981). Accordingly, the pattern of “too long” fixation durations in our 0-ms
Direct control of eye movements 36
SOD condition (no foveal mask) may actually reflect “too short” fixation durations in the non-
zero delay conditions, where brief visual masks served as warning signals.
Notably, Figure 3 (A and C) indicated that the pattern of long FFD in the 0-ms SOD was
particularly pronounced for short words in both experiments. Indeed, the inverse main effect of
length in Experiment 1 was no longer reliable when the 0-ms SOD was excluded. This suggests
that stimulus size affected fixation durations especially when words were unmasked without
delay. We can currently only speculate about the reasons, but the pattern may be important for
follow-up research addressing the replicability and causes of this effect.
Conclusions
In conclusion, the main message of the present experiments is that (with the exception
of early-triggered saccades from non-optimal landing positions), autonomous saccade
generation can be completely disabled with non-zero stimulus onset delays. Previous research
had suggested a mixture of autonomous and direct control but none of these studies had
eliminated parafoveal lexical processing to the same degree as the present experiments. Thus,
we can engineer a one-to-one translation of SOD into fixation duration when parafoveal
information processing is entirely prevented. This will offer new windows of experimental
control on an understanding of time lines of saccade initiation and how it interfaces with lexical
processing during natural reading.
Direct control of eye movements 37
References
Bates, D., & Maechler, M. (2010). lme4: Linear mixed-effects models using S4 classes. R
package version 0.999375-35. 2010. URL http://CRAN. R-project. org/package= lme4.
Becker, W., & Jürgens, R. (1979). An analysis of the saccadic system by means of double step
stimuli. Vision Research, 19(9), 967-983.
Carpenter, R. H. S. (2000). The neural control of looking. Current Biology, 10, R291–R293.
Dambacher, M., & Kliegl, R. (2007). Synchronizing timelines: Relations between fixation
durations and N400 amplitudes during sentence reading. Brain Research, 1155, 147–
162.
Davies, M. (2008). The Corpus of Contemporary American English (COCA): 410+ million
words, 1990-present. URL http://www.americancorpus.org.
Engbert, R., & Kliegl, R. (2001). Mathematical models of eye movements in reading: A
possible role for autonomous saccades. Biological Cybernetics, 85, 77-87.
Engbert, R., Nuthmann, A., Richter, E. M., & Kliegl, R. (2005). SWIFT: A dynamical model of
saccade generation during reading. Psychological Review, 112, 777-813.
Henderson, J. M., & Pierce, G. L. (2008). Eye movements during scene viewing: Evidence for
mixed control of fixation durations. Psychonomic Bulletin & Review, 15(3), 566-573.
Henderson, J. M., & Smith, T. J. (2009). How are eye fixation durations controlled during
scene viewing? Further evidence from a scene onset delay paradigm. Visual
Cognition, 17, 1055-1082.
Hohenstein, S., Laubrock, J., & Kliegl, R. (2010). Semantic preview benefit in eye movements
during reading: A parafoveal fast-priming study. Journal of Experimental Psychology:
Learning, Memory, and Cognition, 36(5), 1150-1170.

Direct control of eye movements 38
Inhoff, A. W., Eiter, B. M., & Radach, R. (2005). Time course of linguistic information
extraction from consecutive words during eye fixations in reading. Journal of
Experimental Psychology: Human Perception and Performance, 31(5), 979-995.
Inhoff, A. W., & Rayner, K. (1986). Parafoveal word processing during eye fixations in
reading: Effects of word frequency. Perception & Psychophysics, 40(6), 431-439.
Ishida, T., & Ikeda, M. (1989). Temporal properties of information extraction in reading
studied by a text-mask replacement technique. Journal of the Optical Society A:
Optics Image and Science, 6(10), 1624-1632.
Kliegl, R., Grabner, E., Rolfs, M., & Engbert, R. (2004). Length, frequency, and predictability
effects of words on eye movements in reading. European Journal of Cognitive
Psychology, 16(1-2), 262-284.
Kliegl, R., Nuthmann, A., & Engbert, R. (2006). Tracking the mind during reading: The
influence of past, present, and future words on fixation durations. Journal of
Experimental Psychology: General, 135(1), 12-35.
Liversedge, S. P., Rayner, K., White, S. J., Vergilino-Perez, D., Findlay, J. M., & Kentridge, R.
W. (2004). Eye movements when reading disappearing text: Is there a gap effect in
reading? Vision Research, 44, 1013–1024.
Luke, S. G., Nuthmann, A., & Henderson, J. M. (in press). Eye movement control in scene
viewing and reading: Evidence from the stimulus onset delay paradigm. Journal of
Experimental Psychology: Human Perception and Performance.
Martinez, A., Anllo-Vento, L., Sereno, M. I., Frank, L. R., Buxton, R. B., Dubowitz, D. J., , et al.
(1999). Involvement of striate and extrastriate visual cortical areas in spatial
attention. Nature Neuroscience, 2(4), 364-369.

Direct control of eye movements 39
Matin, E. (1974). Saccadic suppression: A review and an analysis. Psychological Bulletin,
81(12), 899-917.
McConkie, G. W., & Rayner, K. (1975). The span of the effective stimulus during a fixation in
reading. Perception & Psychophysics, 17(6), 578-586.
Morrison, R. E. (1984). Manipulation of stimulus onset delay in reading: Evidence for parallel
programming of saccades. Journal of Experimental Psychology: Human Perception
and Performance, 10(5), 667-682.
Nuthmann, A., Engbert, R., & Kliegl, R. (2005). Mislocated fixations during reading and the
inverted optimal viewing position effect. Vision Research, 45(17), 2201-2217.
Nuthmann, A., Engbert, R., & Kliegl, R. (2007). The IOVP effect in mindless reading:
Experiment and modeling. Vision Research, 47(7), 990-1002.
Nuthmann, A., & Henderson, J. M. (2012). Using CRISP to model global characteristics of
fixation durations in scene viewing and reading with a common mechanism. Visual
Cognition: Special Issue on Computational Approaches to Scene Perception and
Reading, 20, 457-494.
Nuthmann, A., Smith, T. J., Engbert, R., & Henderson, J. M. (2010). CRISP: A computational
model of fixation durations in scene viewing. Psychological Review, 117(2), 382-405.
R Development Core Team. (2011). R: A language and environment for statistical computing.
(3-900051-07-0). from R Foundation for Statistical Computing http://www.R-
project.org
Rayner, K. (1975). The perceptual span and peripheral cues in reading. Cognitive Psychology,
7(1), 65-81.

Direct control of eye movements 40
Rayner, K. (1979). Eye guidance in reading: Fixation locations within words. Perception, 8(1),
21-30.
Rayner, K. (1998). Eye movements in reading and information processing: 20 years of
research. Psychological Bulletin, 124(3), 372-422.
Rayner, K. (2009). The Thirty Fifth Sir Frederick Bartlett Lecture: Eye movements and
attention in reading, scene perception, and visual search. Quarterly Journal of
Experimental Psychology, 62(8), 1457-1506.
Rayner, K., & Bertera, J. H. (1979). Reading without a fovea. Science, 206(4417), 468-469.
Rayner, K., & Duffy, S. A. (1986). Lexical complexity and fixation times in reading: Effects of
word frequency, verb complexity, and lexical ambiguity. Memory & Cognition, 14(3),
191-201.
Rayner, K., Inhoff, A. W., Morrison, R. E., Slowiaczek, M. L., & Bertera, J. H. (1981). Masking
of foveal and parafoveal vision during eye fixations in reading. Journal of
Experimental Psychology: Human Perception and Performance, 7, 167-179.
Rayner, K., Liversedge, S. P., & White, S. J. (2006). Eye movements when reading
disappearing text: The importance of the word to the right of fixation. Vision
Research, 46, 310–323.
Rayner, K., Liversedge, S. P., White, S. J., & Vergilino-Perez, D. (2003). Reading disappearing
text: Cognitive control of eye movements. Psychological Science, 14, 385–389.
Rayner, K., & Pollatsek, A. (1981). Eye movement control during reading: Evidence for direct
control. Quarterly Journal of Experimental Psychology, 33(A), 351-373.
Rayner, K., & Pollatsek, A. (1989). The psychology of reading. Englewood Cliffs, NJ: Prentice-
Hall.
Direct control of eye movements 41
Rayner, K., Pollatsek, A., Ashby, J., & Clifton, C. (2012). The psychology of reading. New York:
Psychology Press.
Rayner, K., Slowiaczek, M. L., Clifton, C., & Bertera, J. H. (1983). Latency of sequential eye
movements: Implications for reading. Journal of Experimental Psychology: Human
Perception and Performance, 9(6), 912-922.
Reichle, E. D., Pollatsek, A., Fisher, D. L., & Rayner, K. (1998). Toward a model of eye
movement control in reading. Psychological Review, 105(1), 125-157.
Reichle, E. D., Pollatsek, A., & Rayner, K. (2006). E-Z Reader: A cognitive-control, serial-
attention model of eye-movement behavior during reading. Cognitive Systems
Research, 7, 4-22.
Reichle, E. D., Warren, T., & McConnell, K. (2009). Using E-Z Reader to model the effects of
higher level language processing on eye movements during reading. Psychonomic
Bulletin & Review, 16, 1-21.
Reingold, E. M., Reichle, E. D., Glaholt, M., & Sheridan, H. (2012). Direct lexical control of eye
movements in reading: Evidence from a survival analysis of fixation durations.
Cognitive Psychology, 65(2), 177-206.
Reingold, E. M., & Stampe, D. M. (1999). Saccadic inhibition in complex visual tasks. In W.
Becker, H. Deubel & T. Mergner (Eds.), Current oculomotor research: Physiological
and psychological aspects (pp. 249-255). London: Plenum.
Reingold, E. M., & Stampe, D. M. (2000). Saccadic inhibition and gaze contingent research
paradigms. In A. Kennedy, R. Radach, D. Heller & J. Pynte (Eds.), Reading as
perceptual process (pp. 119-145). Amsterdam: Elsevier.

Direct control of eye movements 42
Reingold, E. M., & Stampe, D. M. (2004). Saccadic inhibition in reading. Journal of
Experimental Psychology: Human Perception and Performance, 30(1), 194-211.
Ross, S. M. & Ross, L. E. (1981). Saccade latency and warning signals: Effects of auditory and
visual stimulus onset and offset. Perception & Psychophysics, 29, 429-437
Schad, D., & Engbert, R. (2012). The zoom lens of attention: Simulating shuffled versus
normal text reading using the SWIFT model. Visual Cognition, 20, 391-421.
Schall, J. D., & Thompson, K. G. (1999). Neural selection and control of visually guided eye
movements. Annual Review of Neuroscience, 22(1), 241-259.
Slattery, T. J., Angele, B., & Rayner, K. (2011). Eye movements and display change detection
during reading. Journal of Experimental Psychology: Human Perception and
Performance, 37(6), 1924-1938.
Staub, A., White, S. J., Drieghe, D., Hollway, E. C., & Rayner, K. (2010). Distributional effects
of word frequency on eye fixation durations. Journal of Experimental Psychology:
Human Perception and Performance, 36, 1280–1293.
Trukenbrod, H. A., & Engbert, R. (submitted manuscript). ICAT: A computational model for
the adaptive control of fixation durations.
Vaughan, J. (1982). Control of fixation duration in visual search and memory search: Another
look. Journal of Experimental Psychology: Human Perception and Performance, 8(5),
709-723.
Vaughan, J. & Graefe, T. M. (1977). Delay of stimulus presentation after the saccade in visual
search. Perception & Psychophysics, 22(2), 201-205.

Direct control of eye movements 43
Vitu, F., Lancelin, D., & Marrier d’Unienville, V. (2007). A perceptual-economy account for
the inverted-optimal viewing position effect. Journal of Experimental Psychology:
Human Perception and Performance, 33, 1220–1249.
Vitu, F., McConkie, G. W., Kerr, P., & O'Regan, J. K. (2001). Fixation location effects on
fixation durations during reading: An inverted optimal viewing position effect. Vision
Research, 41(25-26), 3513-3533.
Wickham, H. (2009). ggplot2: Elegant graphics for data analysis. New York: Springer.

Direct control of eye movements 44
Author Notes
This research was made possible by a Humboldt Research Award from the Alexander von
Humboldt Association that enabled K. Rayner to be a Visiting Professor at the University of
Potsdam, as well as by DFG grant FOR868/1 that enabled M. Dambacher to be a visiting
researcher at the University of California, San Diego (where the research was conducted).
Further support was provided by Grant HD26765 from the US National Institute of Health. We
thank John Henderson, Eyal Reingold, Hans Trukenbrod, and Françoise Vitu for their valuable
comments on a prior draft. Data and R scripts are available at the Potsdam Mind Research
Repository (http://read.psych.uni-potsdam.de/pmr2).
Correspondence should be addressed to Michael Dambacher, Box D29, Universität
Konstanz, 78457 Konstanz, Germany, e-mail: [email protected]

Direct control of eye movements 45
Footnotes
Footnote 1. Estimates vary from 100 – 150 ms (e.g., double-step pradigms; see Schall &
Thompson, 1999) to 150 – 175 ms (reading-like tasks; see Rayner, Slowiaczek,
Clifton, & Bertera, 1983).
Footnote 2. The reason for the relatively large proportion of dropped data is the rather
conservative exclusion criterion concerning display change timing. Note,
however, that the basic pattern of results in Experiment 1 and 2 also holds for
more liberal screening criteria.
Footnote 3. Landing position was calculated as the initially fixated letter position divided by
the total number of letters. Hence, after centering, landing position ranged from
-0.5 to 0.5 with zero denoting word center. On average, the eyes initially landed
left from word center, near the preferred viewing location (Rayner, 1979), in all
conditions (0-ms SOD: mean = -0.10; SE = 0.013; 33-ms SOD: mean = -0.11; SE =
0.009; 66-ms SOD: mean = -0.12; SE = 0.015; 99-ms SOD: mean = -0.13; SE =
0.011). Landing positions did not differ between SODs [F(3,63) = 1.50, p = .22].
Footnote 4. LMMs did not include random slopes of fixed effects. Random slopes of SOD
conditions did not improve model fits in Exp. 1 [FFD: Pr(>Chisq) = .50; GD:
Pr(>Chisq) = .09] or in Exp. 2 [FFD: Pr(>Chisq) = .35; GD: Pr(>Chisq) = .59].
Including the other predictors as random slopes led to false convergence of the
LMMs.
Footnote 5. Slopes were computed on the basis of unaggregated fixation durations using an
LMM with SODs as fixed and participants (Exp. 1 and 2) as well as words (Exp. 1
only) as random effects.

Direct control of eye movements 46
Footnote 6. Effects of landing position are illustrated as quantiles of the overall landing site
distribution; note, however, that LMM results are based on continuous values of
landing position.
Footnote 7. While the IOVP effect is often characterized by an inverted u-shaped function
(e.g., Nuthmann et al., 2005, 2007; Vitu et al., 2001), we didn’t observe much of
a decrease for FFD on positions towards word endings, presumably because
word-final positions in our data were fixated in only very few cases. Specifically,
less than 25% of all first fixations landed in the second half of words, such that
there were essentially no data points at the very end of words.
Footnote 8. Saccadic inhibition can also account for other characteristics of the distributions.
Specifically, Figure 1A illustrates that FFD distributions of the 0-ms and 99-ms
SOD largely overlap for the shortest fixation durations: saccadic inhibition did not
play a role in the 0-ms SOD (i.e., no visible display change) and had an effect only
on later fixation durations in the 99-ms SOD (i.e., around 150 to 200 ms after
fixation onset). In contrast, the leftmost flanks of the FFD distributions in the 66-
ms and 33-ms SOD are much flatter, because saccadic inhibition due to display
changes affected the earliest fixation durations. As a consequence, the
population of short fixations (i.e., smaller than 100 ms after word onset) among
the non-zero delays is largest in the 99-ms SOD condition.
Footnote 9. As in Experiment 1, the eyes initially landed left from word center (0-ms SOD:
mean = -0.15; SE = 0.016; 33-ms SOD: mean = -0.15; SE = 0.010; 66-ms SOD: mean
= -0.16; SE = 0.013; 99-ms SOD: mean = -0.15; SE = 0.013). Landing positions did
not differ between SODs (F < 1).

Direct control of eye movements 47
Footnote 10. As in Experiment 1, the visual impression of an inverted u-shaped function of the
IOVP effect (i.e., decreasing FFD at word-final positions) was rather weak. A likely
reason is again that word-final positions were rarely fixated in Experiment 2. That
is, only 18% of first fixations landed in the second half of words.
Footnote 11. Note that stimulus unmasking took on average 7 ms after display change
initiation.
Footnote 12. The visual impression of SOD-specific differences on the post-target word in
Experiment 2 (Fig. 4B) was not significant in LMMs on FFD (|t|’s < 0.96; p’s > .10)
or GD (|t|’s < 1.66; p’s ≥ .10).
Footnote 13. We thank an anonymous reviewer for pointing this out.

Direct control of eye movements 48
Tables
Table 1. Mean times (in ms) of effective display change initiation relative to first fixation onset
on the target word across SOD conditions and word length in Experiment 1 and 2
(standard errors of means were smaller than 1.2 ms in all cases).
SOD in Experiment 1 SOD in Experiment 2
Length 0-ms 33-ms 66-ms 99-ms 0-ms 33-ms 66-ms 99-ms
4 -11 28 60 93 -10 28 62 95
5 -11 28 61 94 -10 28 61 94
6 -12 27 62 94 -11 28 62 94
7 -12 28 63 95 -11 29 62 95

Direct control of eye movements 49
Table 2. Mean fixation durations and standard errors (SE) on target words together with
difference scores (∆) between SODs and number of target fixations in
Experiment 1.
First Fixation Duration Gaze Duration N fixations
SOD Mean SE ∆ Mean SE ∆ Mean SE
0 282 7 336 8 1.27 0.04
33 271 6 -11 322 7 -14 1.27 0.04
66 297 6 26 355 9 33 1.30 0.03
99 316 7 19 386 7 31 1.38 0.04

Direct control of eye movements 50
Table 3. LMM effects of SOD, landing position (linear and quadratic trend), logarithmic
frequency, and word length in Experiment 1. Subjects and words are specified
as random factors.
First Fixation Duration Gaze Duration
Estimate SE t p
Estimate SE t p
(Intercept) 5.73 0.02 282.70 0.000
5.77 0.02 292.32 0.000
SOD(33-0) -0.05 0.02 -2.57 0.011
-0.04 0.02 -2.25 0.022
SOD(66-33) 0.10 0.02 5.46 0.000
0.11 0.02 5.76 0.000
SOD(99-66) 0.08 0.02 4.32 0.000
0.12 0.02 5.80 0.000
LandPos 0.32 0.04 9.04 0.000
0.08 0.04 2.02 0.042
LandPos2 -1.07 0.10 -10.36 0.000
1.11 0.11 10.08 0.000
logFrequency -0.01 0.00 -3.14 0.001
-0.03 0.01 -4.81 0.000
Length(short-long) 0.03 0.01 2.58 0.009
-0.01 0.01 -0.53 0.563
SOD(33-0) x LandPos 0.06 0.09 0.71 0.493
0.01 0.10 0.14 0.895
SOD(66-33) x LandPos -0.12 0.10 -1.23 0.213
0.04 0.11 0.38 0.696
SOD(99-66) x LandPos 0.11 0.10 1.06 0.289
0.14 0.11 1.32 0.191
SOD(33-0) x LandPos2 0.83 0.28 3.00 0.003
0.25 0.30 0.85 0.390
SOD(66-33) x LandPos2 -0.20 0.28 -0.72 0.478
-0.20 0.30 -0.66 0.510
SOD(99-66) x LandPos2 -0.23 0.29 -0.82 0.387
-0.34 0.31 -1.08 0.277
SOD(33-0) x logFrequency -0.02 0.01 -1.48 0.130
0.00 0.01 -0.23 0.792
SOD(66-33) x logFrequency -0.01 0.01 -0.64 0.542
0.01 0.01 1.04 0.286
SOD(99-66) x logFrequency 0.00 0.01 0.01 0.996
-0.03 0.01 -2.24 0.028
SOD(33-0) x Length(short-long) -0.05 0.03 -1.63 0.107
-0.02 0.03 -0.66 0.498
SOD(66-33) x Length(short-long) -0.01 0.03 -0.29 0.761
-0.03 0.03 -1.06 0.298
SOD(99-66) x Length(short-long) -0.01 0.03 -0.23 0.835 0.03 0.03 0.77 0.437
Random Effects Std. Dev HPD95lower HPD95upper
Std. Dev HPD95lower HPD95upper
Words 0.029 0.000 0.035
0.045 0.021 0.055
Subjects 0.089 0.061 0.114
0.084 0.058 0.110
Residual 0.207 0.201 0.215 0.221 0.215 0.230

Direct control of eye movements 51
Table 4. Mean fixation durations and standard errors (SE) on target words together with
difference scores (∆) between SODs and number of target fixations in
Experiment 2.
First Fixation Duration Gaze Duration N fixations
SOD Mean SE ∆ Mean SE ∆ Mean SE
0 275 5 339 8 1.37 0.04
33 273 6 -2 329 7 -10 1.36 0.04
66 300 6 27 362 6 33 1.41 0.04
99 333 7 33 391 6 29 1.40 0.04

Direct control of eye movements 52
Table 5. LMM effects of SOD, landing position (linear and quadratic trend), logarithmic
frequency, and word length in Experiment 2. Only subjects are specified as
random factor.
First Fixation Duration Gaze Duration
Fixed Effects Estimate SE t p
Estimate SE t p
(Intercept) 5.73 0.02 266.69 0.000
5.79 0.02 312.54 0.000
SOD(33-0) -0.05 0.02 -2.16 0.034
-0.05 0.02 -2.35 0.020
SOD(66-33) 0.12 0.02 5.58 0.000
0.13 0.02 6.61 0.000
SOD(99-66) 0.10 0.02 4.65 0.000
0.10 0.02 4.89 0.000
LandPos -0.01 0.05 -0.32 0.737
0.05 0.04 1.09 0.291
LandPos2 -1.34 0.12 -10.87 0.000
0.92 0.12 7.88 0.000
logFrequency -0.01 0.00 -2.66 0.005
-0.01 0.00 -3.51 0.000
Length(short-long) 0.02 0.01 1.43 0.147
-0.01 0.01 -1.24 0.215
SOD(33-0) x LandPos 0.07 0.12 0.54 0.575
-0.03 0.12 -0.29 0.797
SOD(66-33) x LandPos -0.26 0.13 -2.01 0.041
-0.04 0.12 -0.37 0.707
SOD(99-66) x LandPos -0.20 0.13 -1.57 0.117
-0.05 0.12 -0.43 0.670
SOD(33-0) x LandPos2 0.96 0.33 2.87 0.005
-0.02 0.32 -0.05 0.966
SOD(66-33) x LandPos2 -0.92 0.34 -2.68 0.008
-0.31 0.32 -0.95 0.334
SOD(99-66) x LandPos2 -0.75 0.35 -2.13 0.031
-0.64 0.33 -1.92 0.057
SOD(33-0) x logFrequency 0.01 0.01 1.03 0.305
-0.01 0.01 -0.74 0.448
SOD(66-33) x logFrequency -0.01 0.01 -1.00 0.310
0.01 0.01 0.45 0.647
SOD(99-66) x logFrequency -0.01 0.01 -1.02 0.305
0.00 0.01 -0.10 0.920
SOD(33-0) x Length(short-long) -0.05 0.03 -1.64 0.110
0.00 0.03 0.11 0.908
SOD(66-33) x Length(short-long) -0.03 0.03 -0.92 0.355
-0.03 0.03 -0.81 0.416
SOD(99-66) x Length(short-long) 0.04 0.03 1.22 0.217 0.01 0.03 0.47 0.646
Random Effects Std. Dev HPD95lower HPD95upper
Std. Dev HPD95lower HPD95upper
Subjects 0.113 0.077 0.126
0.096 0.066 0.113
Residual 0.224 0.217 0.232 0.212 0.206 0.220

Direct control of eye movements 53
Figures
Figure 1. Distributions of first fixation and gaze durations on target words in Experiment
1. (A) Density plots across four SOD conditions. (B) Density plots of fixation
durations relative to target word onset.

Direct control of eye movements 54
Figure 2. Effects of initial landing position on target words in Experiment 1. (A) First
fixation and gaze durations across initial landing positions and SODs. Data
points reflect quantiles of the overall landing site distribution. Error bars reflect
standard errors. (B) Density plots of first fixation durations landing close to the
word beginning (1st quarter) or center-to-end region (2nd-4th quarter).

Direct control of eye movements 55
Figure 3. Fixation durations on target words across SOD conditions for two levels of
target word frequency and target word length; error bars reflect standard
errors. Plots of word frequency: data points reflect LMM-based estimates after
partialing out effects of landing position (linear and quadratic trend) and word
length as well as random effects of subjects (Exp. 1 and Exp. 2) and words (only
Exp. 1). Plots of word length: data points reflect LMM-based estimates after
partialing out effects of landing position (linear and quadratic trend), word
frequency, and random effects of subjects (Exp. 1 and Exp. 2) and words (only
Exp. 1). The panels show (A) first fixation durations of Exp. 1, (B) gaze durations
of Exp. 1, (C) first fixation durations of Exp. 2, and (D) gaze durations of Exp. 2.

Direct control of eye movements 56
Figure 4. (A) Mean fixation durations on target words across SOD conditions. Means
show observed data together with LMM-based estimates after partialing out
effects of landing position (linear and quadratic trend), frequency, and word
length as well as random effects of subjects (Exp. 1 and Exp. 2) and words (only
Exp. 1). Error bars reflect standard errors. (B) Observed mean fixation durations
across five successive words in Experiment 1 and 2. Word position 0 denotes
the target word. Error bars reflect standard errors.
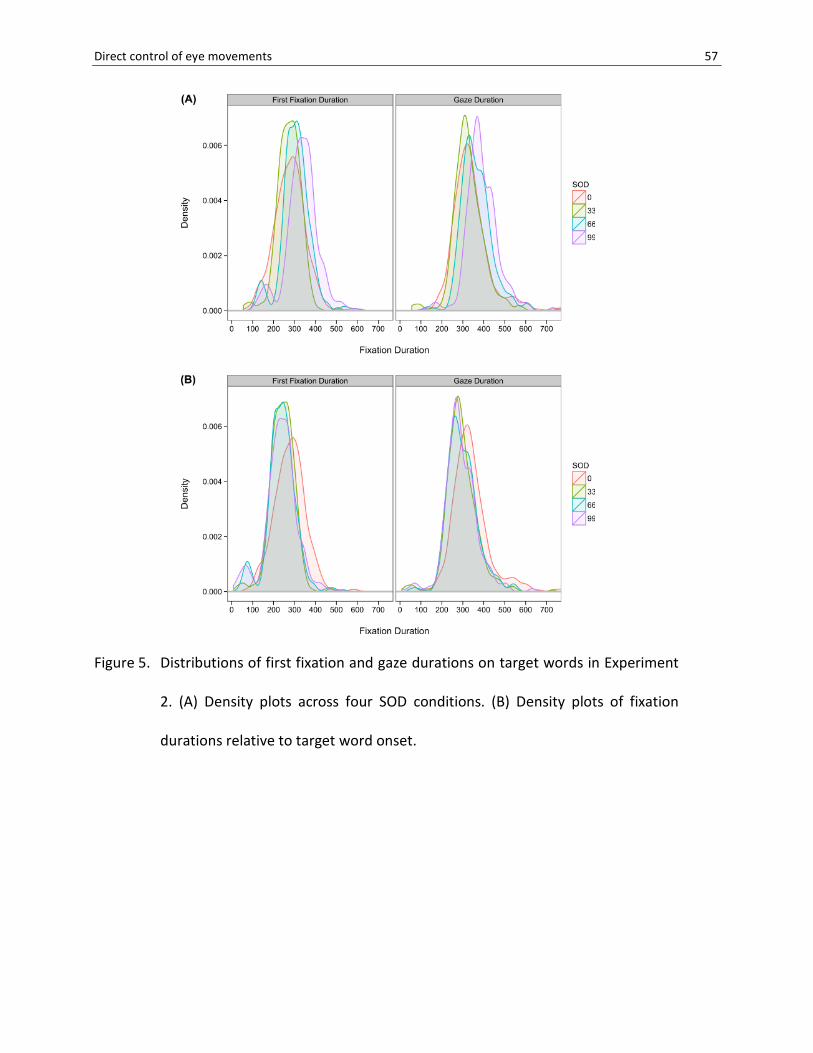
Direct control of eye movements 57
Figure 5. Distributions of first fixation and gaze durations on target words in Experiment
2. (A) Density plots across four SOD conditions. (B) Density plots of fixation
durations relative to target word onset.

Direct control of eye movements 58
Figure 6. Effects of initial landing position on target words in Experiment 2. (A) First
fixation and gaze durations across initial landing positions and SODs. Data
points reflect quantiles of the overall landing site distribution. Error bars reflect
standard errors. (B) Density plots of first fixation durations landing close to the
word beginning (1st quarter) or center-to-end region (2nd-4th quarter).