Direct contribution of nitrogen deposition to nitrous oxide .... Eickenscheidt et al.: Direct...
15
Biogeosciences, 8, 621–635, 2011 www.biogeosciences.net/8/621/2011/ doi:10.5194/bg-8-621-2011 © Author(s) 2011. CC Attribution 3.0 License. Biogeosciences Direct contribution of nitrogen deposition to nitrous oxide emissions in a temperate beech and spruce forest – a 15 N tracer study N. Eickenscheidt, R. Brumme, and E. Veldkamp Soil Science of Tropical and Subtropical Ecosystems, Buesgen Institute, University of Goettingen, Buesgenweg 2, 37077 Goettingen, Germany Received: 29 September 2010 – Published in Biogeosciences Discuss.: 12 November 2010 Revised: 9 February 2011 – Accepted: 10 February 2011 – Published: 8 March 2011 Abstract. The impact of atmospheric nitrogen (N) depo- sition on nitrous oxide (N 2 O) emissions in forest ecosys- tems is still unclear. Our study assessed the direct con- tribution of N deposition to N 2 O emissions in temperate forests exposed to chronic high N depositions using a 15 N labelling technique. In a Norway spruce stand (Picea abies) and in a beech stand (Fagus sylvatica) at the Solling, Ger- many, we used a low concentrated 15 N-labelled ammonium- nitrate solution to simulate N deposition. Nitrous oxide fluxes and 15 N isotope abundances in N 2 O were measured using the closed chamber method combined with 15 N iso- tope analyses. Emissions of N 2 O were higher in the beech stand (2.6 ± 0.6 kg N ha -1 yr -1 ) than in the spruce stand (0.3 ± 0.1 kg N ha -1 yr -1 ). We observed a direct effect of N input on 15 N-N 2 O emissions, which lasted for less than three weeks and was mainly caused by denitrification. No further increase in 15 N enrichment of N 2 O occurred during a one-year experiment, which was probably due to immobil- isation of deposited N. The annual emission factor for N 2 O from deposited N was 0.1% for the spruce stand and 0.6% for the beech stand. Standard methods used in the literature applied to the same stands grossly overestimated emission factors with values of up to 25%. Only 6–13% of the to- tal N 2 O emissions were derived from direct N depositions. Whether the remaining emissions resulted from accumulated anthropogenic N depositions or native soil N, could not be distinguished with the applied methods. The 15 N tracer tech- nique is a useful tool, which may improve estimates of the current contribution of N deposition to N 2 O emissions. Correspondence to: N. Eickenscheidt ([email protected]) 1 Introduction In Europe and in many other parts of the world, emissions of reactive nitrogen (N) have rapidly increased in the last decades mainly due to agricultural and industrial activities (e.g. Galloway et al., 2008; Vitousek et al., 1997). As a con- sequence, European forests have been exposed to high depo- sition rates of acidity and reactive N compounds (Berge et al., 1999). Pre-industrial European forests were supposed to be N-limited, however widespread N deposition has caused a shift in the forest’s N status which under chronic N depo- sition may even lead to N-saturated conditions (Aber et al., 1998). Using N input-output balances, Brumme and Khanna (2008, 2009b) classified German forests into four groups with different N status that cover the complete N enrichment continuum. According to them “steady state type forests” with mull type humus (STFa: forests where deposited N is accumulating in trees only and not in the soil) were proba- bly widespread in Europe in pre-industrial times. They as- sumed that soil acidification caused these forests to lose or- ganic matter and mineral N from the soil changing them into “degradation type forests” (DTF: forests where the mineral soil has become a source of N and C). With further acid and N depositions, these forests would change into “accu- mulation type forests” (ATF: forests where deposited N and carbon is accumulating in the surface organic soil). At the end of the N enrichment continuum, forests could become another “steady state type forests” with moder type humus (STFb: forests where deposited N is accumulating in trees and not in soil). Fluxes of nitrous oxide (N 2 O), which is an important greenhouse gas (IPCC, 2007) and contributes to the chemical destruction of the stratospheric ozone layer (Crutzen, 1979), may increase if the soil becomes a source of N (transition from STFa → DTF) and deposited N ex- ceeds the storage capacity of the ecosystem (transition from Published by Copernicus Publications on behalf of the European Geosciences Union.
-
Upload
nguyenthuan -
Category
Documents
-
view
221 -
download
0
Transcript of Direct contribution of nitrogen deposition to nitrous oxide .... Eickenscheidt et al.: Direct...

Biogeosciences, 8, 621–635, 2011www.biogeosciences.net/8/621/2011/doi:10.5194/bg-8-621-2011© Author(s) 2011. CC Attribution 3.0 License.
Biogeosciences
Direct contribution of nitrogen deposition to nitrous oxide emissionsin a temperate beech and spruce forest – a15N tracer study
N. Eickenscheidt, R. Brumme, and E. Veldkamp
Soil Science of Tropical and Subtropical Ecosystems, Buesgen Institute, University of Goettingen, Buesgenweg 2,37077 Goettingen, Germany
Received: 29 September 2010 – Published in Biogeosciences Discuss.: 12 November 2010Revised: 9 February 2011 – Accepted: 10 February 2011 – Published: 8 March 2011
Abstract. The impact of atmospheric nitrogen (N) depo-sition on nitrous oxide (N2O) emissions in forest ecosys-tems is still unclear. Our study assessed the direct con-tribution of N deposition to N2O emissions in temperateforests exposed to chronic high N depositions using a15Nlabelling technique. In a Norway spruce stand (Picea abies)and in a beech stand (Fagus sylvatica) at the Solling, Ger-many, we used a low concentrated15N-labelled ammonium-nitrate solution to simulate N deposition. Nitrous oxidefluxes and15N isotope abundances in N2O were measuredusing the closed chamber method combined with15N iso-tope analyses. Emissions of N2O were higher in the beechstand (2.6± 0.6 kg N ha−1 yr−1) than in the spruce stand(0.3± 0.1 kg N ha−1 yr−1). We observed a direct effect ofN input on 15N-N2O emissions, which lasted for less thanthree weeks and was mainly caused by denitrification. Nofurther increase in15N enrichment of N2O occurred duringa one-year experiment, which was probably due to immobil-isation of deposited N. The annual emission factor for N2Ofrom deposited N was 0.1% for the spruce stand and 0.6%for the beech stand. Standard methods used in the literatureapplied to the same stands grossly overestimated emissionfactors with values of up to 25%. Only 6–13% of the to-tal N2O emissions were derived from direct N depositions.Whether the remaining emissions resulted from accumulatedanthropogenic N depositions or native soil N, could not bedistinguished with the applied methods. The15N tracer tech-nique is a useful tool, which may improve estimates of thecurrent contribution of N deposition to N2O emissions.
Correspondence to:N. Eickenscheidt([email protected])
1 Introduction
In Europe and in many other parts of the world, emissionsof reactive nitrogen (N) have rapidly increased in the lastdecades mainly due to agricultural and industrial activities(e.g. Galloway et al., 2008; Vitousek et al., 1997). As a con-sequence, European forests have been exposed to high depo-sition rates of acidity and reactive N compounds (Berge etal., 1999). Pre-industrial European forests were supposed tobe N-limited, however widespread N deposition has causeda shift in the forest’s N status which under chronic N depo-sition may even lead to N-saturated conditions (Aber et al.,1998). Using N input-output balances, Brumme and Khanna(2008, 2009b) classified German forests into four groupswith different N status that cover the complete N enrichmentcontinuum. According to them “steady state type forests”with mull type humus (STFa: forests where deposited N isaccumulating in trees only and not in the soil) were proba-bly widespread in Europe in pre-industrial times. They as-sumed that soil acidification caused these forests to lose or-ganic matter and mineral N from the soil changing them into“degradation type forests” (DTF: forests where the mineralsoil has become a source of N and C). With further acidand N depositions, these forests would change into “accu-mulation type forests” (ATF: forests where deposited N andcarbon is accumulating in the surface organic soil). At theend of the N enrichment continuum, forests could becomeanother “steady state type forests” with moder type humus(STFb: forests where deposited N is accumulating in treesand not in soil). Fluxes of nitrous oxide (N2O), which isan important greenhouse gas (IPCC, 2007) and contributesto the chemical destruction of the stratospheric ozone layer(Crutzen, 1979), may increase if the soil becomes a sourceof N (transition from STFa→ DTF) and deposited N ex-ceeds the storage capacity of the ecosystem (transition from
Published by Copernicus Publications on behalf of the European Geosciences Union.
622 N. Eickenscheidt et al.: Direct contribution of nitrogen deposition to nitrous oxide emissions
ATF→STFb). Consequently, European forests with chronicacid and N deposition frequently act as considerable sourcefor N2O (e.g. Brumme and Beese, 1992; Butterbach-Bahlet al., 1998; Papen and Butterbach-Bahl, 1999; Skiba et al.,1999).
Temperate forest soils are estimated to add between 0.1and 2.0 Tg N2O-N yr−1 to the atmosphere, which is between0.6 and 11% of the total global N2O emissions (Brumme etal., 2005; IPCC, 2001; Kroeze et al., 1999) indicating thehigh degree of uncertainty in the estimations. The role of at-mospheric N depositions on N2O emissions is highly unclearand is one of the reasons for this uncertainty (Pilegaard et al.,2006). The IPCC (2006) uses a default emission factor forN2O of 0.01, which means that 1% of the N deposited in tem-perate forests contributes to N2O emissions. The uncertaintyof this emission factor is huge ranging from 0.002 to 0.05where the higher fraction comes from deciduous forests andthe lower fraction from coniferous forests (Brumme et al.,1999; Denier van der Gon and Bleeker, 2005). Tree speciesrelated differences in litter quality, litter structure, and soilmoisture may play a role in the reported variation of emis-sion factors, but still much uncertainty remains (Brumme etal., 1999; Pilegaard, 2006).
Three different approaches have been used to examine theimpact of N depositions on N2O fluxes: (1) regression anal-ysis between N depositions and N2O fluxes (e.g. Butterbach-Bahl et al., 1998), (2) comparison of similar forest ecosys-tems receiving different N loads (e.g. Skiba et al., 1999),and (3) N fertilisation experiments (e.g. Brumme and Beese,1992). These approaches have the following limitations:(1) regression analysis between N depositions and N2Ofluxes requires a strong correlation, which can only occurif direct N2O emission of deposited N is significant. More-over, N deposition is usually correlated with similar factors(e.g. precipitation) that also control N2O fluxes (Butterbach-Bahl et al., 1998; Kitzler et al., 2006a). (2) Comparing sitesreceiving different N loads has the limitation that sites areusually not completely comparable in climate and soil prop-erties. Finally, (3) studies have shown that the application ofmineral N to simulate N deposition does not commonly re-flect the mode of chronic N depositions (Sitaula et al., 1995;Skiba and Smith, 2000).
The use of15N isotopes as a tracer is potentially a usefultechnique to investigate the impact of N deposition on N2Ofluxes in forests. The15N technique can be applied even iflow direct N2O emissions occur, it is independent of precip-itation amount and does not cause artificially high mineralN concentrations in the soil. At present we are not awareof any study where the emission factor for N2O from for-est soils was estimated using15N tracer techniques. In for-est ecosystems the15N tracing technique has only been usedto distinguish between various sources of N2O production(e.g. Ambus et al., 2006; Wolf and Brumme, 2002).
Our objectives were (i) to examine the direct contributionsof ammonium (NH+4 ) and nitrate (NO−3 ) depositions to N2O
emissions and (ii) to follow the effect for one year includingthe remineralisation of deposited and subsequently immo-bilised N. We hypothesise that (1) N depositions contributeconsiderably to direct N2O emissions which is caused by theavailability of mineral N independent of mineralisation andnitrification rates and (2) N depositions contribute to signif-icant amounts of N2O emissions over one-year because ofremineralisation of deposited N. To test our hypotheses, weconducted (i) a short-term as well as (ii) a one-year long last-ing in situ15N tracer experiment in a coniferous and in a de-ciduous forest stand which both have been exposed to highatmospheric N depositions for decades.
2 Materials and methods
2.1 Study area
The study was carried out at the Solling plateau in CentralGermany (51◦46′ N, 9◦34′ E; 500 m a.s.l.; mean annual tem-perature: 6.9◦C; annual precipitation: 1193 mm). The soiltype is an acidic Dystric Cambisol (silt loam), which has de-veloped in a loess solifluction layer overlying Triassic sand-stone bedrock. The humus type is a typical moder. A de-tailed site description is given by Bredemeier et al. (1995,1998) and by Brumme and Khanna (2009a). Experimentstook place in a 74-yr-old Norway spruce stand (Picea abies(L.) Karst.) and in an adjacent 160-yr-old beech stand (Fagussylvatica). Soil characteristics for both sites are presented inTable 1.
Both stands have been exposed to high N depositions fordecades. In 2007 and 2008, stand deposition amounted to33 kg N ha−1 yr−1 in the spruce stand with NH+4 -N:NO−
3 -N:Norg in the ratios of 49:44:7 and to 20 kg N ha−1 yr−1
in the beech stand with a NH+4 -N:NO−
3 -N:Norg ratio of47:38:16. Stand N deposition was usually measured inmonthly intervals in both stands and represents the sum ofthroughfall deposition and stemflow. Stemflow was negli-gible in the spruce stand. In the beech stand, data collec-tion and chemical analyses were conducted by the NorthwestGerman Forest Research Station (Meesenburg et al., 2009).
2.2 Experimental design
We conducted the short-term experiment in August andSeptember 2009 in order to examine the direct contributionof NH+
4 and NO−
3 depositions to N2O emissions. Ten cham-ber bases were randomly installed in each stand, four ofwhich were labelled once with15NH4NO3 solution (namedNH+
4 -labelled) whereas the other four were labelled oncewith NH15
4 NO3 solution (named NO−3 -labelled; both con-tained 98 atom%15N). Two chambers served as controls. Wereduced the number of control chambers in favour of treatedchambers because the temporal as well as spatial variabilityof emitted natural15N in our previous studies in the beech
Biogeosciences, 8, 621–635, 2011 www.biogeosciences.net/8/621/2011/

N. Eickenscheidt et al.: Direct contribution of nitrogen deposition to nitrous oxide emissions 623
Table 1. Soil characteristics of the spruce and beech stands at the Solling site.
Soil depth n pH(H2O) n Total organic carbon Total nitrogen C/N ratio n Bulk density Humus massand forest site [mg C g−1] [mg N g−1] [g cm−3] [Mg ha−1]
Organic layer
Spruce 3 3.6 (0.1)a 13 447 (13) 16.5 (0.4)a 27.2 (0.6)a 6 67.1 (4.4)a
Beech 3 4.0 (0.0)b 13 443 (12) 18.6 (0.7)b 24.1 (0.7)b 6 35.6 (1.9)b
0–5 cm
Spruce 6 3.3 (0.0) 14 112 (7) 4.6 (0.3) 24.3 (0.8)a 4 0.76 (0.03)Beech 6 3.4 (0.0) 14 98 (11) 4.4 (0.3) 21.7 (1.4)b 6 0.89 (0.02)
5–10 cm
Spruce 5 3.5 (0.0) 13 39 (2)a 1.7 (0.1) 22.9 (0.8)a 5 1.00 (0.02)Beech 6 3.6 (0.0) 13 32 (2)b 1.7 (0.1) 19.8 (1.1)b 6 1.08 (0.04)
At each layer, means (± SE) followed by different letters indicated differences among the spruce and beech stands (independent t-test or Mann-Whitney U-test atP ≤ 0.05).
stand indicated low values (see Supplement). We added 0.7 Llabelling solution per chamber base. The N concentration ofthe solution was 1.65 mg L−1, which was within the rangeof the N concentrations measured in the throughfall. The la-belled N was distributed down to 10 cm mineral soil depthwithin few hours after the application. In addition to thefluxes of N2O and15N-N2O, we determined air and soil tem-perature, soil moisture, and extractable mineral N (Nmin =NH+
4 -N + NO−
3 -N) content. Soil samples were taken at ran-domly chosen locations between the chamber bases. Mea-surements were conducted 3.5 h (spruce) and 5 h (beech),24 h, 48 h, 7 days, and 21 days after the application of la-belled N.
The one-year experiment was performed to examine theimpact of NH+
4 and NO−
3 deposition on N2O emissionsincluding the remineralisation of the deposited N withinone year. At both stands we randomly installed 17 cham-ber bases for gas flux measurements and soil sampling.Seven of the chamber bases received a15NH4NO3 solution(named NH+4 -labelled; 98 atom %15N) and another sevenreceived a15NH15
4 NO3 solution (named NH4NO3-labelled;95 atom %15N). Of the seven chamber bases, five were usedfor gas flux measurements whereas soil samples were takenin two chamber bases. Three chamber bases served as con-trols for N2O and 15N-N2O fluxes. All measurements asdescribed above in the short-term experiment were also car-ried out in this experiment which was conducted from May2007 to June 2008. Measurements were done every sec-ond week in the summer months and monthly in the wintermonths. Uncertainties that arise from the frequency of mea-surements are probably low. A published study done in ourbeech stand (Brumme and Beese, 1992) revealed that duringthe season with high emissions weekly measurements over-estimated N2O fluxes by 3% to 11% compared to measure-ments with an automatic chamber (five measurements per
day). Overestimation will presumable be lower when cov-ering the whole year. The15N solution was always appliedone week before the gas flux measurements (18 applicationsover the year). For one N application in the one-year exper-iment, the amount of N and water added were equal to theamount added with one application in the short-term experi-ment. To each chamber receiving N we added the equivalentof 0.78 kg N ha−1 yr−1, which was 2.4% of the annual depo-sition in the spruce stand and 3.8% in the beech stand. Theamount of water added was equivalent to 47 mm rain, whichwas approx. 4.8% of the annual precipitation.
2.3 N2O and 15N-N2O measurements
Fluxes of N2O were measured using the closed cham-ber method (static, vented chambers made of PVC; area:0.2665 m2; vol.: 18.9–29.3 L (beech), 27.5–34.7 L (spruce)).Gas samples of 100 mL were removed at three (May 2007to January 2008) or four (February to June 2008 and 2009)regular time intervals following chamber closure (42 min atmost) using a portable gas sampler equipped with a pres-sure sensor (Loftfield et al., 1997). The pressure sensor wasused to check the leak tightness of the evacuated glass bottlesprior to sampling and to ensure that bottles were completelyfilled with “chamber air”. Analysis of N2O was carried outwith a gas chromatograph equipped with an EC detector(GC 14A, Shimadzu, Duisburg, Germany). Fluxes of N2Owere calculated from the linear change of N2O concentra-tions in the chamber versus time, after fluxes were adjustedfor air temperature and atmospheric pressure. We tested aquadratic model for some data, but no clear advantage of thenon-linear model emerged from the statistical indicators forthe goodness of fit. Additionally, N2O fluxes calculated us-ing the quadratic model were not significantly different fromfluxes calculated using the linear model. We further think
www.biogeosciences.net/8/621/2011/ Biogeosciences, 8, 621–635, 2011

624 N. Eickenscheidt et al.: Direct contribution of nitrogen deposition to nitrous oxide emissions
that scattering of N2O concentrations due to random errorsduring sampling and measurement were much larger than theeffect of the chamber on the gas exchange and possible bi-ases due to linear regression. The cumulative mean annualflux was calculated using the trapezoid rule. Samples for15N-N2O analysis were collected in glass bottles (100 mL)closed with a butyl-hallow stopper at time point zero and af-ter 24 to 28 min. Analysis of15N in N2O was done usingan isotope ratio mass spectrometer coupled with a precon-centration unit (PreCon-GC-IRMS, Thermo Finnigan MAT,Bremen, Germany).
2.4 Chemical analyses
Mineral N was extracted after shaking 25 to 30 g fresh min-eral soil with 100 mL 0.5 M K2SO4 solution or 15 g of theorganic layer with 50 mL K2SO4 solution, using pre-washedfilter papers. Extracts of K2SO4 were frozen until analysis.Mineral N analysis was carried out using continuous flow in-jection colorimetry (Cenco/Skalar Instruments, Breda, TheNetherlands). The water content was determined gravimet-rically. Soil bulk density was determined using undisturbedsoil samples that were oven-dried at 105◦C and sieved to2 mm to remove stones and living roots. The mass of theorganic layer was measured using a metal ring (594 cm2).Organic layer samples were oven-dried at 60◦C and livingroots were removed. Total carbon and nitrogen measure-ments were done using a CNS Elemental Analyzer (HeraeusElementar Vario EL, Hanau, Germany) and15N concentra-tions using a Delta C plus isotope ratio mass spectrometer(Finnigan MAT, Bremen, Germany). The pH was determinedin distilled water (1:2.5 (v/v)) using 10 mL sieved soil orshredded organic material.
2.5 Calculation of15N abundance
Isotope abundances were expressed in absolute proportion[atom %]:
15N [atom %] =
15N15N+14N
·100 (1)
The 15N-N2O abundance of N2O emitted from the soil wascalculated using the Keeling plot approach (Pataki et al.,2003; Tilsner et al., 2003):
15Nemitted=
15Nchamber air·c(N2O)chamber air−15Nambient air·c(N2O)ambient air
c(N2O)chamber air−c(N2O)ambient air(2)
wherec(N2O) is the concentration of N2O and15N is theabundance of15N in N2O calculated as described in Eq. (1).The15Nemittedexcess value was calculated by subtracting the15Nemitted value of the control chambers. The15Nemitted ex-cess value was used to obtain the15N-N2O excess flux. Incase of negative N2O fluxes the15Nemittedcalculation was notapplicable since15N-N2O emissions occurred from labelled
soil but could not be quantified because we only measurednet N2O fluxes. Hence negative N2O fluxes were omitted for15N-N2O flux calculations, which included 35% of all fluxvalues in the spruce stand and 17% of those in the beechstand.
2.6 Recovery of15N in N2O and Nt
The recovery of15N from the tracers in emitted N2O (emis-sion factor) and in soil Nt was calculated using atom % valuesfor 15N mass calculations:
15N recovery[%] =m15Nrec
m15NTracer·100 (3)
wherem15Nrec could bem15NN2O or m15NNt , respectively:m15NN2O is mass of emitted15N-N2O excess in mg15N m−2
per time interval considered;m15NNt is mass of15N-Nt ex-cess in mg15N m−2 after 19 tracer applications. Further-more, m15NTracer is mass of15N excess in the tracer inmg15N m−2 applied since the start of the corresponding ex-periment.
We used two approaches to estimate the mass of emitted15N-N2O between two consecutive15N-N2O flux measure-ments. In the first approach, we used the trapezoid rule. Asindicated by the short-term experiment, this approach doesnot account for the peak emissions during the first week dueto the fact that the emissions were measured one week af-ter the application leading potentially to an underestimationof 15N-N2O fluxes whereas fluxes in the time interval be-tween the measurement and the next tracer application werepossibly overestimated. We therefore tested a second ap-proach where we assumed that the15N-N2O fluxes displayedthe same temporal trend as observed in the short-term ex-periment. In this approach, the relative proportion of thetracer emission of one measuring day on the emissions ofthe time interval between consecutive tracer applications wasestimated using the short-term experiment data (Eq. 4).
relative proportion of Ms on Is[-] =mean15N-N2OMs
mean15N-N2OIs(4)
where Ms is a measuring day of the short-term experiment(fluxes for days on which no measurement took place wereinterpolated from available measured data) and Is is thetime interval between two consecutive tracer applications inwhich the measuring day lies. The mean15N-N2OMs flux(ng15N m−2 d−1) represents the mean excess15N-N2O fluxof all replicates of one labelling treatment of the measuringday of the short-term experiment. The mean15N-N2OIs flux(ng15N m−2 interval−1) represents the cumulative mean ex-cess15N-N2O flux of all replicates of one labelling treatmentof the time interval between two consecutive tracer applica-tions of the short-term experiment. The tracer emission of ameasuring day from the one-year experiment was then trans-formed into the tracer emission of the period between two
Biogeosciences, 8, 621–635, 2011 www.biogeosciences.net/8/621/2011/

N. Eickenscheidt et al.: Direct contribution of nitrogen deposition to nitrous oxide emissions 625
consecutive measurements by dividing it by its relative pro-portion (Eq. 5).
cumulative15N-N2OIL [ng m−2 interval−1] (5)
=
15N-N2OML
relative proportion of Ms on Is
where cumulative15N-N2OIL represents the cumulative ex-cess15N-N2O flux of a time interval between two consecu-tive tracer applications of the one-year experiment and15N-N2OML (ng15N m−2 d−1) is the excess15N-N2O flux of themeasuring day in this interval. The relative proportion couldonly be estimated from the short-term experiment for theNH+
4 -labelled and NO−3 -labelled treatments. Thus, for theNH4NO3-labelled treatment the mean of both proportionswas used. Finally, the annual cumulative excess15N-N2Oflux was calculated by adding up the emissions of all mea-surement intervals.
Emission factors calculated by the two methods did notshow any significant differences for a particular treatmentand stand, indicating that the higher values of emissions dur-ing the first week of application were balanced by the loweremissions of the following week(s). Therefore, we only re-port results from the first approach.
Nitrous oxide derived from N deposition (N2O-NDFD)was assessed by using the following equation:
N2O-NDFD [kg ha−1yr−1] =mNdep·
EF
100(6)
wheremNdep is the mass of inorganic N of the stand deposi-tion in kg ha−1 yr−1; EF is the emission factor (units in %).
2.7 Statistical analyses
Prior to analysis the assumptions of normality of residuals(Shapiro-Wilk or Cramer-von Mises test) and homogeneityof variances (Levene test) were tested. If necessary, we trans-formed (log and arcsine) data prior to analyses. Two inde-pendent sample means were tested for significant differencesusing the independent Student’s t-test, the Welch-test, or thenon parametric Mann-Whitney U-test. We used analysis ofvariance (ANOVA) for comparison of more than two sam-ple means. The weighted harmonic mean was utilised forproportion data with different bases. These proportions wereweighted prior to statistical analyses. Temporal pseudorepli-cation occurred with time series data (N2O, 15N-N2O) be-cause measurements were repeatedly done using the samechamber bases. Therefore, we applied linear mixed effectsmodels (Crawley, 2007; Gueorguieva and Krystal, 2004). Weset up a basic model including the forest type (beech andspruce) or the different15N labelling (NH+
4 -labelled, NO−
3 -labelled, NH4NO3-labelled) as fixed effects and the spatialreplication (individual chamber) nested in time as randomeffects. The model was extended by a variance function andby a first-order temporal autoregressive function if the ex-tension increased the goodness of the fit of the model. The
Akaike Information Criterion was used to assess the rela-tive goodness of the fit. Simple and multiple regressionswere performed using ordinary linear regression models or,if residuals were autocorrelated, generalized least squares ex-tended by an autoregressive moving average function. Au-tocorrelation was checked with the Durbin-Watson test andby plotting the autocorrelation function. A non-linear least-squares model was used to estimate parameters of the non-linear multiple regression. Effects were considered signifi-cant ifP ≤ 0.05. In the text results are reported as means± 1standard errors. Statistical analyses were carried out using R2.10.1 (R Development Core Team, 2009).
3 Results
3.1 Annual N2O fluxes
Fluxes of N2O were significantly lower in the spruce standthan in the beech stand (P < 0.0001; Fig. 1a, b). CumulativeN2O emissions were 0.3± 0.1 kg N ha−1 yr−1 in the sprucestand and 2.6± 0.6 kg N ha−1 yr−1 in the beech stand. Thebeech stand displayed a distinct seasonality of N2O fluxeswith high emissions during the summer months and lowemissions during the winter months. Labelling did not in-crease N2O fluxes since we observed no significant differ-ences in N2O fluxes between the NH+4 -labelled, NH4NO3-labelled, and the control chambers (data not shown).
3.2 Short-term 15N tracer experiment
In the spruce stand, the application of the NH154 NO3 tracer
caused an immediate and significant increase in15N-N2Ofluxes (Fig. 2a). Subsequently,15N-N2O emissions de-creased again and no significant differences in15N-N2Ofluxes were found three weeks after the NH15
4 NO3 tracer ap-plication compared to the reference value (pre-measurementat zero hours). Application of the15NH4NO3 tracer alsocaused a significant increase in15N-N2O fluxes 3.5 h afterthe addition, but the increase was smaller than in the NO−
3 -labelled plots (Fig. 2a). After one week no significant differ-ences in15N-N2O fluxes occurred in the NH+4 -labelled plotsof the spruce stand compared to the reference.
In the beech stand, a similar temporal pattern as in thespruce stand was found after tracer application. In the NO−
3 -labelled plots, we observed an immediate strong and signif-icant increase in15N-N2O fluxes (Fig. 2b). After one week,15N-N2O fluxes had decreased and no differences comparedto the reference measurement were observed. The applica-tion of the15NH4NO3 tracer only slightly but significantlyincreased15N-N2O fluxes and again one week after the traceraddition no significant differences existed when comparedto the reference value (Fig. 2b). In both spruce and beechstands, the NO−3 -labelled plots displayed three times higherEFs during the first week compared to the NH+
4 -labelledplots (Table 2). For the first three weeks, the EFs calculated
www.biogeosciences.net/8/621/2011/ Biogeosciences, 8, 621–635, 2011

626 N. Eickenscheidt et al.: Direct contribution of nitrogen deposition to nitrous oxide emissions
34
717
718
719
720
721
722
723
724
725
726
727
728
729
730
731
732
Figure 1. Mean (± SE, n = 13) N2O fluxes (a, b) and mean (± SE, n = 5) 15N-N2O excess 733
fluxes of the NH4+-labelled treatments (c, d) and NH4NO3 (double)-labelled treatments (e, f) 734
of the spruce stand (a, c, e) and beech stand (b, d, f). Please note the different scales. 735
736
0
2
4
6
8
10
12
14
N2O
flux
[µg
N m−
2 h−
1 ]
Spruce
0
30
60
90
120
150
180
210
N2O
flux
[µg
N m−
2 h−
1 ]
Beech
0
1
2
3
4
5
6
15 N
-N2O
ex. fl
ux [n
g 15 N
m−2
h−
1 ]
0
20
40
60
80
100
120
15 N
-N2O
ex. fl
ux [n
g 15 N
m−
2 h−1
]
a b
c d
0
10
20
30
40
50
60
70
May Jun Jul AugSep OctNovDec Jan FebMar AprMayJun
15 N
-N2O
ex. fl
ux [n
g 15 N
m−
2 h−1
]
0
50
100
150
200
250
300
350
May Jun Jul AugSep Oct NovDec Jan FebMarAprMayJun
15 N
-N2O
ex. fl
ux [n
g 15 N
m−
2 h−1
]
e f
2007 2008 2007 2008
Fig. 1. Mean (± SE,n = 13) N2O fluxes(a, b) and mean (± SE,n = 5) 15N-N2O excess fluxes of the NH+4 -labelled treatments(c, d) andNH4NO3 (double)-labelled treatments(e, f) of the spruce stand(a, c, e)and beech stand(b, d, f). Please note the different scales.
35
737
738
739
740
741
742
Figure 2. Mean (± SE, n = 4) 15N-N2O excess fluxes in the spruce stand (a) and beech stand 743
(b) during the short-term experiment. Fluxes are given for the NO3−-labelled and NH4
+-744
labelled treatments before (zero hours) and after the tracer application. Means followed by the 745
same letter indicated no significant differences in 15N-N2O excess fluxes of one labelling 746
treatment (NO3−- or NH4
+-labelled) between zero hours and the time points after the tracer 747
application (mixed effects models with linear contrasts at P ≤ 0.05). Please note the different 748
scales. 749
750
751
-303
69
1215
1821
0 3.5 22 48 168 504
Time after tracer application [h]
15 N
-N2O
ex. fl
ux [n
g 15 N
m−
2 h−
1 ]
nitrate-labelled
ammonium-labelled
a) Spruce
Bb
a A
b A
b B
a A
b A
0
50
100
150
200
250
300
350
0 5 22 48 168 504
Time after tracer application [h]
15 N
-N2O
ex. fl
ux [n
g 15 N
m−
2 h−
1 ]b) Beechb B
b B
b B
a A
a A a A
Fig. 2. Mean (± SE,n = 4) 15N-N2O excess fluxes in the spruce stand(a) and beech stand(b) during the short-term experiment. Fluxes aregiven for the NO−3 -labelled and NH+4 -labelled treatments before (zero hours) and after the tracer application. Means followed by the same
letter indicated no significant differences in15N-N2O excess fluxes of one labelling treatment (NO−
3 - or NH+
4 -labelled) between zero hoursand the time points after the tracer application (mixed effects models with linear contrasts atP ≤ 0.05). Please note the different scales.
for the NO−
3 -labelled plots were approx. three times higherthan the EFs calculated for the NH+
4 -labelled plots as well(Table 2). But in the beech stand, the difference between theEFs of the NO−3 -labelled and NH+4 -labelled plots decreasedand the EF values of the NH+4 -labelled plots were 70% of theEF values of the NO−3 -labelled plots (Table 2).
However, for each stand differences in15N-N2O emissionsbetween NH+4 -labelled chambers and NO−3 -labelled cham-bers were not significant. Moreover, differences in15N-N2O emissions of the NO−3 -labelled chambers between bothstands were not significant, but15N-N2O fluxes of the NH+4 -labelled chambers were significantly higher in the beechstand than in the spruce stand (P = 0.029).
Biogeosciences, 8, 621–635, 2011 www.biogeosciences.net/8/621/2011/

N. Eickenscheidt et al.: Direct contribution of nitrogen deposition to nitrous oxide emissions 627
Table 2. Emission factors (EFs) of N2O during the first week and the first three weeks following tracer application in the spruce and beechstands. The emission factors were derived from the NH+
4 -labelled and NO−3 -labelled treatments of the short-term experiment (n = 4).
EF (1 week) [%] EF (3 weeks) [%]Tracer NH+
4 NO−
3 NH4NO∗3 NH+
4 NO−
3 NH4NO∗3
Spruce 0.01 (0.00) 0.03 (0.01) 0.02 (0.01)0.02 (0.01) 0.05 (0.02) 0.04 (0.01)Beech 0.12 (0.09) 0.31 (0.18) 0.22 (0.10)0.43 (0.33) 0.62 (0.33) 0.54 (0.22)
Means (± SE); no significant differences were detected among stands, labellings, and EFs.∗ The EF for the NH4NO3-labelled treatment was obtained by calculating the mean of the NH+
4 -labelled and NO−3 -labelled treatments of the short-term experiment (n = 8).
Table 3. Cumulative N2O and15N-N2O emissions, one-year emission factor (EF), N2O derived from deposition (N2O-NDFD), ratio ofN2O-NDFD to total N2O emissions, and recovery of15N tracer in Nt of the organic layer and the upper 10 cm of mineral soil. Results arederived from the NH+4 -labelled and NH4NO3-labelled treatments of the one-year experiment.
Labelling N2O 15N-N2O EF N2O-NDFD N2O-NDFD/ Recovery in Nt[kg N ha−1 yr−1] [g 15N ha−1 yr−1] [%] [g N ha−1 yr−1] N2O-N∗[%] [%]
Spruce NH+4 0.26 (0.06)aA 0.12 (0.04)aA 0.03 (0.01)aA 9.4 ( 3.0)aA 3.6 (1.1)aA 59.2 (11.6)aA
NH4NO3 0.30 (0.13)aA 0.91 (0.47)aB 0.12 (0.06)aA 37.9 (19.3)aA 12.5 (6.4)aA 36.6 (6.6)aA
Beech NH+4 3.15 (1.26)bA 1.79 (1.10)bA 0.46 (0.29)aA 79.6 (49.0)aA 2.5 (1.6)aA 41.7 (7.2)aA
NH4NO3 1.75 (1.90)bA 4.28 (2.18)bA 0.58 (0.29)aA 99.3 (50.5)aA 5.7 (2.9)aA 20.7 (3.1)aB
Means (± SE;n = 5 for N2O, 15N-N2O, EF, N2O-NDFD, and N2O-NDFD/N2O-N andn = 4 for recovery in Nt) followed by the same lower-case letters indicated no significantdifferences among both stands and the same labelling treatments. Means followed by the same capital letters indicated no significant differences among different labelling treatmentswithin one stand (independent t-test atP ≤ 0.05).∗ The ratio N2O-NDFD/N2O-N represented the weighted harmonic mean with corresponding SE.
Within one stand, fluxes of total N2O were notsignificantly different in time during the short-termexperiment and were 10-times higher in the beechstand (22.8± 3.6 µg N m−2 h−1) than in the spruce stand(2.2± 0.5 µg N m−2 h−1; P = 0.009). Since no changes wereobserved in fluxes we assumed that total N2O fluxes were notchanged by the tracer application. The same was true for thecontents of NH+4 , NO−
3 and soil moisture, which remainedunchanged during the period of the short-term experiment.
3.3 One-year15N tracer experiment
In the spruce stand, fluxes of15N-N2O were significantlyhigher in the NH4NO3-labelled treatment than in the NH+
4 -labelled treatment (P = 0.0014), though N2O fluxes werenot significantly different between the two labelled treat-ments (Fig. 1a, c, e, Table 3). Fluxes of15N-N2O andN2O were positively correlated for both labellings individ-ually (P ≤ 0.05). Emissions of15N-N2O of the NH4NO3-labelled treatment displayed high variability especially dur-ing the winter months when nitrate availability was low andany addition of nitrate with the NH4NO3 treatment may havecontributed significantly to the15N-N2O fluxes in the sprucestand (Fig. 1e). We did not observe continuous enrichment of15N in N2O during the one-year experiment. The mean an-nual fraction of15N-N2O on total N2O-N was 0.04% (0.00–
0.22%) for the NH+4 -labelled treatment and 0.21% (0.01–0.71%) for the NH4NO3-labelled treatment. In the beechstand, we observed no significant differences in15N-N2Ofluxes between both treatments and beginning in July (1.5months after the first labelling event), they followed a sim-ilar seasonal trend as the total N2O flux in both treatments(Fig. 1b, d, f, Table 3). Fluxes of15N-N2O and N2O dis-played strong correlations for both treatments (P ≤ 0.0001).The fraction of15N-N2O on N2O-N averages 0.06% (0.00–0.22%) for the NH+4 -labelled treatment and 0.19% (0.04–0.49%) for the NH4NO3-labelled treatment. In both treat-ments15N-N2O emissions were significantly higher in thedeciduous stand than in the coniferous stand (P ≤ 0.05; Ta-ble 3).
Using the EF values approx. 0.12% (spruce) to 0.58%(beech) of the inorganic throughfall N deposition was lost asN2O within one year, which corresponded to 12.5% (spruce)and 5.7% (beech) of the total annual N2O emissions (N2O-NDFD/N2O-N, Table 3). For the spruce stand, the EFs of thefirst week and first three weeks were significantly lower thanthe EF of one year (P = 0.03) but no significant differencesamong EFs were found for the beech stand (Tables 2, 3).
We recovered a large fraction of 59% (spruce) and 42%(beech) of the applied NH+4 in Nt of the organic layer andthe surface 10 cm of the mineral soil (Table 3). In contrast,the recovery of NO−3 tracer in Nt of the NH4NO3-treatment
www.biogeosciences.net/8/621/2011/ Biogeosciences, 8, 621–635, 2011

628 N. Eickenscheidt et al.: Direct contribution of nitrogen deposition to nitrous oxide emissions
36
0.0
0.1
0.2
0.3
0.4
0.5
0.6
0.7
0.8
0.0 0.5 1.0 1.5 2.0 2.5 3.0
Throughfall N deposition [kg N ha−1 interval−1]
N2O
flu
x [k
g N
ha−
1 inte
rval
−1 ]
752
Figure 3. Relationship between N2O fluxes (y) and total throughfall N depositions (x) in the 753
beech stand from May 2007 to June 2008 (y = x · 0.25 (± 0.06) − 0.14 (± 0.09), r2 = 0.53, 754
P = 0.001, df = 14). 755
756
Fig. 3. Relationship between N2O fluxes (y) and total throughfall Ndepositions (x) in the beech stand from May 2007 to June 2008 (y =
x ·0.25 (± 0.06)−0.14 (± 0.09);r2= 0.53,P = 0.001,df = 14).
(obtained by subtracting the recovery in the NH+
4 treatment)was negligible in the beech stand and less than 10% in thespruce stand.
3.4 Relationship of N2O flux rates to throughfall Ndepositions
In the beech stand, N2O fluxes were positively correlatedwith total throughfall N depositions (P = 0.001; Fig. 3, Ta-ble 4) and with NH+4 -N depositions (P = 0.001; Table 4).The slope of the regression equation, which described themodelled relationship between measured N2O fluxes andmeasured N depositions, indicated the fraction of throughfallN deposition emitted as N2O. The fraction was 25%. How-ever, both N2O fluxes (P < 0.0001; Fig. 4) and throughfall Ndeposition were also positively related with soil temperature(N deposition = temperature· 0.09 (± 0.03) + 0.70 (± 0.27),r2
= 0.37, P = 0.01, df = 14). When soil temperaturewas included in the regression equation the calculated EFwas reduced from 25% to 8.6% (Fig. 4). Throughfall de-position was further positively correlated with precipitation(P = 0.004; not shown). For the spruce stand, we did notobserve significant correlations between N2O fluxes with Ndepositions. However N2O fluxes were positively correlatedwith precipitation (Table 4).
We also calculated EFs according to the fraction method,where EFs are calculated by relating measured total N2Oemissions to measured N depositions (for the calculation seenotes of Table 5). The EFs obtained from this approach were0.9% for the spruce stand and 13% for the beech stand.
37
757
Figure 4. Relationship of N2O fluxes (y) to throughfall N depositions (x1) and soil 758
temperatures in 5 cm depth (x2) (y = 0.086 (± 0.063) · x1 + 0.001 (± 0.000) · exp(0.468 (± 759
0.242) · x2) − 0.042 (± 0.073); r2 = 0.78, P < 0.0001, df = 13). The measured data are 760
indicated as points, where black points are located above the surface area and white points are 761
located below the surface area. The solid lines indicate the deviations of measured data from 762
the model. 763
764
765
Fig. 4. Relationship of N2O fluxes (y) to throughfall N deposi-tions (x1) and soil temperatures in 5 cm soil depth (x2) (y = 0.086(± 0.063)·x1+0.001 (± 0.000)· exp(0.468 (± 0.242)·x2) −0.042(± 0.073);r2
= 0.78,P < 0.0001,df = 13). The measured data areindicated as points, where black points are located above the surfacearea and white points are located below the surface area. The solidlines indicate the deviations of measured data from the model.
4 Discussion
4.1 Annual N2O fluxes
The relatively low N2O fluxes from the spruce stand andthe higher N2O fluxes from the beech stand were within therange of N2O emissions reported for other temperate conif-erous and deciduous forests (Butterbach-Bahl et al., 2001;Macdonald et al., 1997; Oura et al., 2001; Zechmeister-Boltenstern, 2002; see also Table 5). The compiled val-ues from literature (Table 5) further support the observationthat deciduous forests generally tend to be a higher sourcefor N2O (>20 µg N2O-N m−2 h−1) than coniferous forests(<10 µg N2O-N m−2 h−1). We attributed the differences inN2O fluxes between the investigated forest types to the dif-ferences in the structure and quality of the litter (e.g. pH,C/N ratio; see Table 1). The laminar structure of the beechlitter on the surface of the moder type humus may have re-duced gas diffusivity, whereas the needle litter of spruce mayhave created a well-aerated organic layer as was reportedby Ball et al. (1997) for the Solling sites. As a result, thehigh N2O emissions during the summer months were pos-sibly produced by denitrification in anaerobic micro-sites inthe soil due to high oxygen consumption by microorganismsand plants during high summer temperatures (Brumme et al.,1999). Wolf and Brumme (2002) identified denitrification asmain process for N2O production in the same beech standwhich was investigated in the present study.
Net uptake of N2O, as we observed in single chambers,may be ascribed to consumption of N2O during denitrifica-tion to N2 (Kroeze et al., 2007). The review by Kroeze etal. (2007) revealed that uptake of N2O may occur at low
Biogeosciences, 8, 621–635, 2011 www.biogeosciences.net/8/621/2011/

N. Eickenscheidt et al.: Direct contribution of nitrogen deposition to nitrous oxide emissions 629
Table 4. Results of the regression analyses of N2O-N fluxes and throughfall N depositions (total N, NH+
4 -N, NO−
3 -N, and organic Ndepositions) and precipitation.
Ntotal NH+
4 -N NO−
3 -N Norg Precipitationr2 P df r2 P df r2 P df r2 P df r2 P df
Spruce − ns − − ns − − ns − − ns − 0.30 0.042 12Beech 0.53 0.001 14 0.53 0.001 14 − ns − − ns − − ns −
ns is not significant.
oxygen and NO−3 availability, even at fertilised sites, andthat sites with small N2O fluxes may change from sources tosinks depending on the soil conditions. At the beech stand,negative N2O fluxes were almost exclusively measured dur-ing the winter months where soil moisture was high and soilNO−
3 concentrations were close to zero.
4.2 Temporal dynamics of N2O emissions derived fromN deposition
The immediate increase in15N-N2O fluxes that occurredwithin 3.5–5 h in the short-term experiment after NH15
4 NO3
and15NH4NO3 tracer application indicates that deposited Ncontributed promptly to N2O production. However, the con-tribution of N deposition to N2O fluxes decreased within thefollowing three weeks. In the spruce stand release of N2O de-rived from the15N label occurred over a longer period thanin the beech stand, where loss of deposited N as N2O oc-curred entirely during the first three weeks. This short-livedincrease in15N-N2O emissions, which lasted approx. threeweeks, was probably related to biotic and abiotic immobilisa-tion of added N and to dilution processes. In contrast to ourhypotheses, the repeated application of15N labelled N didnot lead to any further increase in15N enrichment of N2Oemitted during the one-year experiment. This indicates thatthe main effect of N deposition on N2O fluxes occurs whenthe mineral N enters the soil system (“short-lived effects”).The absence of “medium-term” effect (up to one year) maybe explained by continual immobilisation of N during the re-lated additions and by the lack of any remobilisation of theimmobilised N. Our recovery of NH4NO3 tracer in soil Ntalso showed that a great proportion of N deposition was re-tained in the soil. Our finding was supported by output anal-ysis by Brumme and Khanna (2009b) and Feng et al. (2008),which indicated that in both systems (spruce and beech) thedeposited N was predominantly retained despite the amountof N deposition was in excess of that required for plant in-crement.
4.3 Processes of N2O emissions derived from Ndeposition
The greater increase in15N-N2O fluxes after NO−3 tracer ap-plication than after NH+4 tracer application suggests that den-
itrification was the dominant process for the input-derivedemissions at both sites. Water addition probably created ad-ditional anaerobic micro-sites resulting in favourable condi-tions for denitrification, which mimics conditions when nat-ural wet N deposition occurs. Denitrification was also foundto be the dominant process at our beech stand at the Sollingsite by Wolf and Brumme (2002). The smaller15N-N2Oflux increase after15NH4NO3 tracer application was proba-bly caused by low activity of nitrifiers in these acid soils andthe weak competition of nitrifiers for available NH+
4 (Correand Lamersdorf, 2004 (study conducted at Solling); Rennen-berg et al., 1998). Fertilisation with (NH4)2SO4 also delayedan increase in N2O emissions by 14 days at our beech stand(Brumme and Beese, 1992), indicating low activity of nitri-fiers and thus a delay of denitrification. In contrast, rapidincreases in N2O fluxes have been reported after fertilisa-tion with NO−
3 -containing fertilisers of coniferous forests(Klemedtsson et al., 1997; Macdonald et al., 1997; Sitaulaet al., 1995).
For both stands, the fraction of15N-N2O on N2O-N of0.05% for the NH+4 -labelled treatment and of 0.20% for theNH4NO3-labelled treatment of the one-year experiment sug-gests that the contribution of NH+4 to N2O emissions was25% and of NO−3 75%. Similar results were presented byAmbus et al. (2006) who showed that 62% of N2O emis-sions in 11 European forests were derived from NO−
3 and34% were derived from NH+4 .
4.4 Contribution of N deposition to N2O emissions
The compilation of published studies on this subject showeda huge range of results for the impact of N input on N2Ofluxes in temperate forests similar as we found in our study(Table 5). Our study indicated that the emission factor (EF)depended on the method used for its calculation. The EFRvalue of 25% for our beech stand, which was calculated byusing the regression method, was higher than the EFF values,which were obtained by the fraction method and ranged from0.9% (spruce) to 13% (beech). The EFR and EFF were againboth higher than the EF15N values derived from our15N tracerstudy (0.1% for spruce and 0.6% for beech stands). Further,a EFFB value (obtained from N fertilisation experiments; forcalculations see notes of Table 5) of 1.6% was calculated for
www.biogeosciences.net/8/621/2011/ Biogeosciences, 8, 621–635, 2011

630 N. Eickenscheidt et al.: Direct contribution of nitrogen deposition to nitrous oxide emissions
Table 5. Compilation of published studies that investigated the impact of N input on N2O fluxes from deciduous and coniferous temperateforest soils. Studies are divided into fertilisation, deposition, and15N tracer experiments. The emission factor (EF) for N2O is given for oneyear if not differently indicated.
Forest type Type of N input N2O Emission Method Treatment Reference[µ g N m−2 h−1] factor [%] used
Deciduous Fertilisation 0.68 0.03e EFFB NH4NO3-fertilised (120 (1. yr) and 150(2. yr) kg N ha−1 yr−1; chronic N additionexp.; measurement in the 2. yr; USA)
Bowden et al. (1991)
0.57 0.06e EFFB NH4NO3-fertilised (37 (1. yr) and 50(2. yr) kg N ha−1 yr−1; chronic N addition exp.;measurement in the 2. yr; USA)
0.23 Unfertilised (USA)89 1.6 EFFB (NH4)2SO4-fertilised (140 kg N ha−1 yr−1;
chronic N addition exp.;measurement in the 6. and 7. yr; Germany)
Brumme and Beese (1992)
64 16e EFF Unfertilised (35 kg N ha−1 yr−1 deposition;Germany)
< 10 < 0.3 EFF NH4NO3-fertilised (150 kg N ha−1 yr−1;chronic N addition exp.; measurement in the13. yr; USA)
Venterea et al. (2003)
< 10 < 0.3 EFF NH4NO3-fertilised (50 kg N ha−1 yr−1; chronicN addition exp.; measurement in the 13. yr;USA)
< 10 < 0.3 EFF Unfertilised (8 kg N ha−1 yr−1 wet + drydeposition; USA)
Deposition 5.7 2e EFF 25.6 kg N ha−1 yr−1 throughfall + stemflow dep.(Denmark)
Beier et al. (2001)
83.3 22e EFF 33 kg N ha−1 yr−1 wet deposition (Germany) Brumme et al. (1999)9.1 2.4e EFF 33 kg N ha−1 yr−1 wet deposition (Germany)1.9 0.6e EFF 28 kg N ha−1 yr−1 throughfall deposition
(Germany)7.2 2.4e EFF 26 kg N ha−1 yr−1 throughfall deposition
(Germany)4.7 1.9e EFF 21 kg N ha−1 yr−1 throughfall deposition
(Germany)7.3–9.0 ∼ 3.5e EFF 20.2 kg N ha−1 yr−1 wet deposition (Austria) Kitzler et al. (2006a)a
5.9–7.4 ∼ 4.6e EFF 12.6 kg N ha−1 yr−1 wet deposition (Austria)2.3 1.27 EFF 15.7 kg N ha−1 yr−1 throughfall deposition
(Japan)Oura et al. (2001)
58.4 10 EFR 20 kg N ha−1 yr−1 wet deposition (Germany) Papen and Butterbach-Bahl (1999)29.7 25; 13 EFR, EFF 20 kg N ha−1 yr−1 throughfall + stemflow dep.
(Germany)This study
15N tracer 29.7 0.6 EF15N 20 kg N ha−1 yr−1 throughfall + stemflow dep.(Germany)
This study
a long-term fertilisation experiment at our beech stand where140 kg N ha−1 yr−1 were applied over a 5–6 yr period (Ta-ble 5; Brumme and Beese, 1992).
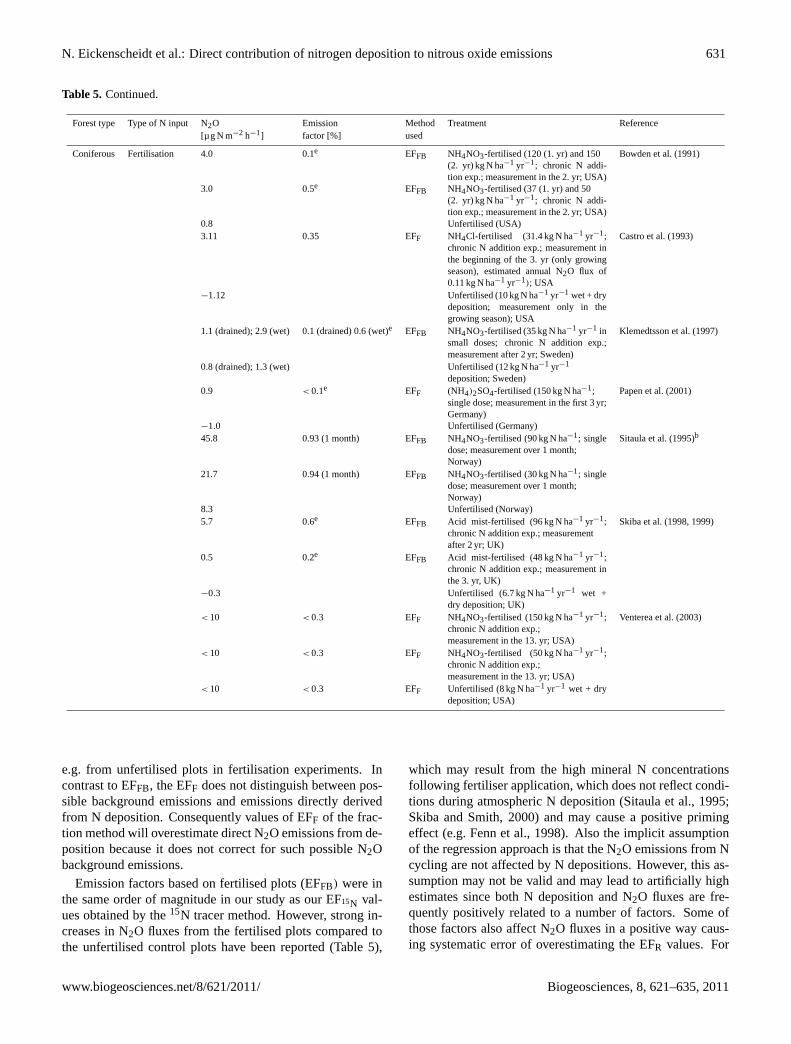
In literature EFR values were among the highest reported.For example, a study in southern Germany reported an EFRof 10% for a beech stand (5.1 kg N2O-N ha−1 yr−1) and 0.5%for a spruce stand (1.4 kg N2O-N ha−1 yr−1) using the re-gression approach (Papen and Butterbach-Bahl, 1999; Table5). Denier van der Gon and Bleeker (2005) combined re-sults from several studies conducted in temperate forests andfound an EFR value of 6.3% for deciduous forests and of1.4% for coniferous forests. A positive correlation of N2O +NO fluxes with N deposition was also reported for 15 Euro-pean forests exposed to different rates of N deposition wherebetween 2% and 32% of total N deposition were emitted asN2O + NO (Pilegaard et al., 2006). Emission factors EFF
show a wide range from<0.1% to 22% for both forest types(Table 5). Using the fraction method, Denier van der Gonand Bleeker (2005) found an average EFF of 2.4% for conif-erous forests and of 6.5% for deciduous forests. The EFFBbased on fertilised plots ranged from 0.1% to 0.9% for theconiferous forests and from 0.03% to 1.6% for the decidu-ous forests (Table 5). The results of EF estimations can besummarised as follows:
EF15N ≈ EFFB � EFF ≈ EFR (7)
What factors cause the large differences in EFs when cal-culated employing different methods? The fraction of N2Oderived from inorganic N deposition was relatively small(13% on spruce and 6% on beech stands) indicating thatsources other than direct N deposition were involved in N2Oemissions. The EFFB considers such background emissions
Biogeosciences, 8, 621–635, 2011 www.biogeosciences.net/8/621/2011/
N. Eickenscheidt et al.: Direct contribution of nitrogen deposition to nitrous oxide emissions 631
Table 5. Continued.
Forest type Type of N input N2O Emission Method Treatment Reference[µ g N m−2 h−1] factor [%] used
Coniferous Fertilisation 4.0 0.1e EFFB NH4NO3-fertilised (120 (1. yr) and 150(2. yr) kg N ha−1 yr−1; chronic N addi-tion exp.; measurement in the 2. yr; USA)
Bowden et al. (1991)
3.0 0.5e EFFB NH4NO3-fertilised (37 (1. yr) and 50(2. yr) kg N ha−1 yr−1; chronic N addi-tion exp.; measurement in the 2. yr; USA)
0.8 Unfertilised (USA)3.11 0.35 EFF NH4Cl-fertilised (31.4 kg N ha−1 yr−1;
chronic N addition exp.; measurement inthe beginning of the 3. yr (only growingseason), estimated annual N2O flux of0.11 kg N ha−1 yr−1); USA
Castro et al. (1993)
−1.12 Unfertilised (10 kg N ha−1 yr−1 wet + drydeposition; measurement only in thegrowing season); USA
1.1 (drained); 2.9 (wet) 0.1 (drained) 0.6 (wet)e EFFB NH4NO3-fertilised (35 kg N ha−1 yr−1 insmall doses; chronic N addition exp.;measurement after 2 yr; Sweden)
Klemedtsson et al. (1997)
0.8 (drained); 1.3 (wet) Unfertilised (12 kg N ha−1 yr−1
deposition; Sweden)0.9 < 0.1e EFF (NH4)2SO4-fertilised (150 kg N ha−1;
single dose; measurement in the first 3 yr;Germany)
Papen et al. (2001)
−1.0 Unfertilised (Germany)45.8 0.93 (1 month) EFFB NH4NO3-fertilised (90 kg N ha−1; single
dose; measurement over 1 month;Norway)
Sitaula et al. (1995)b
21.7 0.94 (1 month) EFFB NH4NO3-fertilised (30 kg N ha−1; singledose; measurement over 1 month;Norway)
8.3 Unfertilised (Norway)5.7 0.6e EFFB Acid mist-fertilised (96 kg N ha−1 yr−1;
chronic N addition exp.; measurementafter 2 yr; UK)
Skiba et al. (1998, 1999)
0.5 0.2e EFFB Acid mist-fertilised (48 kg N ha−1 yr−1;chronic N addition exp.; measurement inthe 3. yr, UK)
−0.3 Unfertilised (6.7 kg N ha−1 yr−1 wet +dry deposition; UK)
< 10 < 0.3 EFF NH4NO3-fertilised (150 kg N ha−1 yr−1;chronic N addition exp.;measurement in the 13. yr; USA)
Venterea et al. (2003)
< 10 < 0.3 EFF NH4NO3-fertilised (50 kg N ha−1 yr−1;chronic N addition exp.;measurement in the 13. yr; USA)
< 10 < 0.3 EFF Unfertilised (8 kg N ha−1 yr−1 wet + drydeposition; USA)
e.g. from unfertilised plots in fertilisation experiments. Incontrast to EFFB, the EFF does not distinguish between pos-sible background emissions and emissions directly derivedfrom N deposition. Consequently values of EFF of the frac-tion method will overestimate direct N2O emissions from de-position because it does not correct for such possible N2Obackground emissions.
Emission factors based on fertilised plots (EFFB) were inthe same order of magnitude in our study as our EF15N val-ues obtained by the15N tracer method. However, strong in-creases in N2O fluxes from the fertilised plots compared tothe unfertilised control plots have been reported (Table 5),
which may result from the high mineral N concentrationsfollowing fertiliser application, which does not reflect condi-tions during atmospheric N deposition (Sitaula et al., 1995;Skiba and Smith, 2000) and may cause a positive primingeffect (e.g. Fenn et al., 1998). Also the implicit assumptionof the regression approach is that the N2O emissions from Ncycling are not affected by N depositions. However, this as-sumption may not be valid and may lead to artificially highestimates since both N deposition and N2O fluxes are fre-quently positively related to a number of factors. Some ofthose factors also affect N2O fluxes in a positive way caus-ing systematic error of overestimating the EFR values. For
www.biogeosciences.net/8/621/2011/ Biogeosciences, 8, 621–635, 2011
632 N. Eickenscheidt et al.: Direct contribution of nitrogen deposition to nitrous oxide emissions
Table 5. Continued.
Forest type Type of N input N2O Emission Method Treatment Reference[µ g N m−2 h−1] factor [%] used
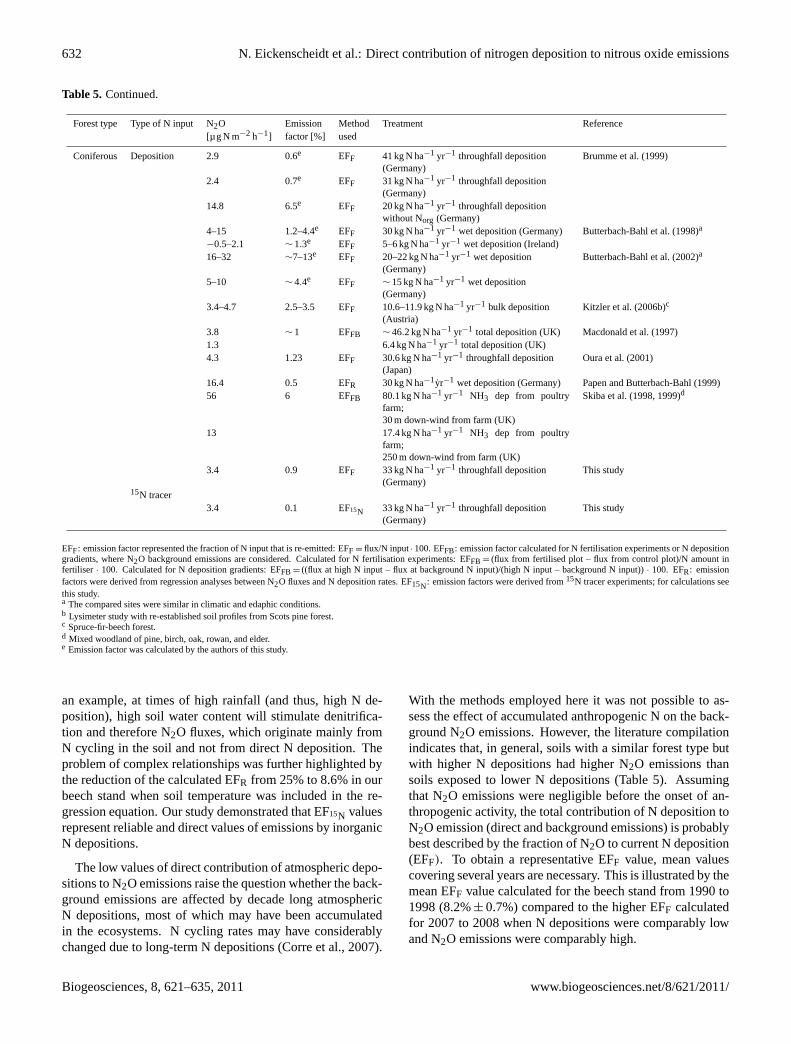
Coniferous Deposition 2.9 0.6e EFF 41 kg N ha−1 yr−1 throughfall deposition(Germany)
Brumme et al. (1999)
2.4 0.7e EFF 31 kg N ha−1 yr−1 throughfall deposition(Germany)
14.8 6.5e EFF 20 kg N ha−1 yr−1 throughfall depositionwithout Norg (Germany)
4–15 1.2–4.4e EFF 30 kg N ha−1 yr−1 wet deposition (Germany) Butterbach-Bahl et al. (1998)a
−0.5–2.1 ∼ 1.3e EFF 5–6 kg N ha−1 yr−1 wet deposition (Ireland)16–32 ∼7–13e EFF 20–22 kg N ha−1 yr−1 wet deposition
(Germany)Butterbach-Bahl et al. (2002)a
5–10 ∼ 4.4e EFF ∼ 15 kg N ha−1 yr−1 wet deposition(Germany)
3.4–4.7 2.5–3.5 EFF 10.6–11.9 kg N ha−1 yr−1 bulk deposition(Austria)
Kitzler et al. (2006b)c
3.8 ∼ 1 EFFB ∼ 46.2 kg N ha−1 yr−1 total deposition (UK) Macdonald et al. (1997)1.3 6.4 kg N ha−1 yr−1 total deposition (UK)4.3 1.23 EFF 30.6 kg N ha−1 yr−1 throughfall deposition
(Japan)Oura et al. (2001)
16.4 0.5 EFR 30 kg N ha−1yr−1 wet deposition (Germany) Papen and Butterbach-Bahl (1999)56 6 EFFB 80.1 kg N ha−1 yr−1 NH3 dep from poultry
farm;30 m down-wind from farm (UK)
Skiba et al. (1998, 1999)d
13 17.4 kg N ha−1 yr−1 NH3 dep from poultryfarm;250 m down-wind from farm (UK)
3.4 0.9 EFF 33 kg N ha−1 yr−1 throughfall deposition(Germany)
This study
15N tracer3.4 0.1 EF15N 33 kg N ha−1 yr−1 throughfall deposition
(Germany)This study
EFF: emission factor represented the fraction of N input that is re-emitted: EFF = flux/N input· 100. EFFB: emission factor calculated for N fertilisation experiments or N depositiongradients, where N2O background emissions are considered. Calculated for N fertilisation experiments: EFFB = (flux from fertilised plot – flux from control plot)/N amount infertiliser · 100. Calculated for N deposition gradients: EFFB = ((flux at high N input – flux at background N input)/(high N input – background N input))· 100. EFR: emissionfactors were derived from regression analyses between N2O fluxes and N deposition rates. EF15N: emission factors were derived from15N tracer experiments; for calculations seethis study.a The compared sites were similar in climatic and edaphic conditions.b Lysimeter study with re-established soil profiles from Scots pine forest.c Spruce-fir-beech forest.d Mixed woodland of pine, birch, oak, rowan, and elder.e Emission factor was calculated by the authors of this study.
an example, at times of high rainfall (and thus, high N de-position), high soil water content will stimulate denitrifica-tion and therefore N2O fluxes, which originate mainly fromN cycling in the soil and not from direct N deposition. Theproblem of complex relationships was further highlighted bythe reduction of the calculated EFR from 25% to 8.6% in ourbeech stand when soil temperature was included in the re-gression equation. Our study demonstrated that EF15N valuesrepresent reliable and direct values of emissions by inorganicN depositions.
The low values of direct contribution of atmospheric depo-sitions to N2O emissions raise the question whether the back-ground emissions are affected by decade long atmosphericN depositions, most of which may have been accumulatedin the ecosystems. N cycling rates may have considerablychanged due to long-term N depositions (Corre et al., 2007).
With the methods employed here it was not possible to as-sess the effect of accumulated anthropogenic N on the back-ground N2O emissions. However, the literature compilationindicates that, in general, soils with a similar forest type butwith higher N depositions had higher N2O emissions thansoils exposed to lower N depositions (Table 5). Assumingthat N2O emissions were negligible before the onset of an-thropogenic activity, the total contribution of N deposition toN2O emission (direct and background emissions) is probablybest described by the fraction of N2O to current N deposition(EFF). To obtain a representative EFF value, mean valuescovering several years are necessary. This is illustrated by themean EFF value calculated for the beech stand from 1990 to1998 (8.2%± 0.7%) compared to the higher EFF calculatedfor 2007 to 2008 when N depositions were comparably lowand N2O emissions were comparably high.
Biogeosciences, 8, 621–635, 2011 www.biogeosciences.net/8/621/2011/

N. Eickenscheidt et al.: Direct contribution of nitrogen deposition to nitrous oxide emissions 633
5 Conclusions
The 15N tracer method proved to be a precise approach forquantifying the direct contribution of atmospheric N deposi-tion to the emission of N2O. The technique allows the sim-ulation of atmospheric throughfall N deposition without ar-tificial fertilisation. The method provides the possibility toinvestigate the impact of N deposition on N2O emissions inforests also when direct emissions are low. In contrast to theregression approach, this method does not include artefactswhich may result from controlling rainfall or temperatureconditions, as both would influence N2O fluxes and N de-positions. There are no uncertainties resulting from the com-parison of different sites (as when regarding deposition gra-dients), which are usually not completely comparable in cli-mate and soil conditions. Furthermore, EFs when calculatedfrom fertilised plots may result in artificially high N2O emis-sions because the pulse in mineral N concentrations does notreflect the true atmospheric N depositions and may also causepositive priming effects on the N cycling in soils. Whereasmost of the other methods overestimate the direct emissions,the15N tracer method is a useful tool to measure direct emis-sions or background emissions.
Supplementary material related to thisarticle is available online at:http://www.biogeosciences.net/8/621/2011/bg-8-621-2011-supplement.pdf.
Acknowledgements.The authors thank Henning Meesenburg andNorbert Lamersdorf for providing the precipitation and depositiondata. This work was financially supported by the German ResearchFoundation (BR 1524/6-1).
Edited by: C. Spirig
References
Aber, J., McDowell, W., Nadelhoffer, K., Magill, A., Berntson, G.,Kamakea, M., McNulty, S., Currie, W., Rustad, L., and Fernan-dez, I. J.: Nitrogen saturation in temperate forest ecosystems,Bioscience, 48(11), 921–934, 1998.
Ambus, P., Zechmeister-Boltenstern, S., and Butterbach-Bahl, K.:Sources of nitrous oxide emitted from European forest soils, Bio-geosciences, 3, 135–145,doi:10.5194/bg-3-135-2006, 2006.
Ball, B.C., Smith, K. A., Klemedtsson, L., Brumme, R., Sitaula,B. K., Hansen, S., Prieme, A., MacDonald, J., and Horgan, G.W.: The influence of soil gas transport properties on methaneoxidation in a selection of northern European soils, J. Geophys.Res., 102(D19), 23309–23317, 1997.
Beier, C., Rasmussen, L., Pilegaard, K., Ambus, P., Mikkelsen,T., Jensen, N. O., Kjoller, A., Prieme, A., and Ladekarl, U. L.:Fluxes of NO−
3 , NH+
4 , NO, NO2, and N2O in an old Danishbeech forest, Water. Air Soil Poll., 1(1), 187–195, 2001.
Berge, E., Bartnicki, J., Olendrzynski, K., and Tsyro, S. G.: Long-term trends in emissions and transboundary transport of acidify-ing air pollution in Europe, J. Environ. Manag., 57(1), 31–50,1999.
Bowden, R. D., Melillo, J. M., Steudler, P. A., and Aber, J. D.: Ef-fects of nitrogen additions on annual nitrous oxide fluxes fromtemperate forest soils in the northeastern United States, J. Geo-phys. Res., 96(D5), 9321–9328, 1991.
Bredemeier, M., Blanck, K., Lamersdorf, N., and Wiedey, G. A.:Response of soil water chemistry to experimental “clean rain”in the NITREX roof experiment at Solling, Germany, For. Ecol.Manag., 71, 31–44, 1995.
Bredemeier, M., Blanck, K., Dohrenbusch, A., Lamersdorf, N.,Meyer, A. C., Murach, D., Parth, A., and Xu, Y.-J.: The Sollingroof project – site characteristics, experiments and results, For.Ecol. Manag., 101, 281–293, 1998.
Brumme, R. and Beese, F.: Effects of liming and nitrogen fertiliza-tion on emissions of CO2 and N2O from a temperate forest, J.Geophys. Res., 97(D12), 12851–12858, 1992.
Brumme, R. and Khanna, P. K.: Ecological and site historical as-pects of N dynamics and current N status in temperate forests,Glob. Change Biol., 14(1), 125–141, 2008.
Brumme, R. and Khanna, P. K.: Functioning and management ofEuropean beech ecosystems, Ecol Stud, 208, Springer-Verlag,Berlin Heidelberg, 490 pp., 2009a.
Brumme, R. and Khanna, P. K.: Chapter 23: Stand, soil and nu-trient factors determining the functioning and management ofbeech forest ecosystems: A Synopsis, in: Functioning and man-agement of European beech ecosystems, edited by: Brumme, R.and Khanna, P. K., Springer-Verlag, Berlin Heidelberg, 459–490,2009b.
Brumme, R., Borken, W., and Finke, S.: Hierarchical control on ni-trous oxide emission in forest ecosystems, Global Biogeochem.Cy., 13(4), 1137–1148, 1999.
Brumme, R., Verchot, L. V., Martikainen, P. J., and Potter, C. S.:Contribution of trace gases nitrous oxide (N2O) and methane(CH4) to the atmospheric warming balance of forest biomes, in:The carbon balance of forest biomes, edited by: Griffiths, H.and Jarvis, P. G., Thomson Publishing Services, Hampshire, UK,293–317, 2005.
Butterbach-Bahl, K., Gasche, R., Huber, C., Kreutzer, K., and Pa-pen, H.: Impact of N-input by wet deposition on N-trace gasfluxes and CH4-oxidation in spruce forest ecosystems of the tem-perate zone in Europe, Atmos. Environ., 32(3), 559–564, 1998.
Butterbach-Bahl, K., Stange, F., Papen, H., and Li, C. S.: Re-gional inventory of nitric oxide and nitrous oxide emissionsfor forest soils of southeast Germany using the biogeochemi-cal model PnET-N-DNDC, J. Geophys. Res., 106(D24), 34155–34166, 2001.
Butterbach-Bahl, K., Breuer, L., Gasche, R., Willibald, G., and Pa-pen, H.: Exchange of trace gases between soils and the atmo-sphere in Scots pine forest ecosystems of the northeastern Ger-man lowlands 1. Fluxes of N2O, NO/NO2 and CH4 at forest siteswith different N-deposition, For. Ecol. Manag., 167(1–3), 123–134, 2002.
Castro, M., Steudler, P., Melillo, J., Aber, J., and Millham, S.: Ex-change of N2O and CH4 between the atmosphere and soils inspruce-fir forests in the northeastern United States, Biogeochem-istry, 18(3), 119–135, 1993.
www.biogeosciences.net/8/621/2011/ Biogeosciences, 8, 621–635, 2011

634 N. Eickenscheidt et al.: Direct contribution of nitrogen deposition to nitrous oxide emissions
Corre, M. D. and Lamersdorf, N. P.: Reversal of nitrogen saturationafter long-term deposition reduction: impact on soil nitrogen cy-cling, Ecology, 85(11), 3090–3104, 2004.
Corre, M. D., Brumme, R., Veldkamp, E., and Beese, F. O.:Changes in nitrogen cycling and retention processes in soils un-der spruce forests along a nitrogen enrichment gradient in Ger-many, Glob. Change Biol., 13(7), 1509–1527, 2007.
Crawley, M. J.: The R Book, John Wiley & Sons Ltd, Chichester,942 pp., 2007.
Crutzen, P. J.: The Role of NO and NO2 in the chemistry of thetroposphere and stratosphere, Annu. Rev. Earth Planet. Sci., 7(1),443–472, 1979.
Denier van der Gon, H. and Bleeker, A.: Indirect N2O emission dueto atmospheric N deposition for the Netherlands, Atmos. Envi-ron., 39(32), 5827–5838, 2005.
Feng, Z., Brumme, R., Xu, Y.-J., and Lamersdorf, N.: Tracing thefate of mineral N compounds under high ambient N deposition ina Norway spruce forest at Solling/Germany, For. Ecol. Manag.,255, 2061–2073, 2008.
Fenn, M. E., Poth, M. A., Aber, J. D., Baron, J. S., Bormann, B.T., Johnson, D. W., Lemly, A. D., McNulty, S. G., Ryan, D. F.,and Stottlemyer, R.: Nitrogen excess in North American ecosys-tems: Predisposing factors, ecosystem response, and manage-ment Strategies, Ecol. Appl., 8(3), 706–733, 1998.
Galloway, J. N., Townsend, A. R., Erisman, J. W., Bekunda, M.,Cai, Z. C., Freney, J. R., Martinelli, L. A., Seitzinger, S. P., andSutton, M. A.: Transformation of the nitrogen cycle: Recenttrends, questions, and potential solutions, Science, 320(5878),889–892, 2008.
Gueorguieva, R. and Krystal, J. H.: Move over ANOVA, progressin analyzing repeated-measures data and its reflection in paperspublished in the archives of general psychiatry, Arch. Gen. Psy-chiatry, 61, 310–317, 2004.
IPCC: Chapter 4: Atmospheric chemistry and greenhouse gases, in:Climate Change 2001: Working Group I: The scientific basis.Contribution of Working Group I to the Third Assessment Re-port of the Intergovernmental Panel on Climate Change., editedby: Houghton, J. T., Ding, Y., Griggs, D. J., Noguer, M., van derLinden, P. J., Dai, X., Maskell, K., and Johnson, C. A., Cam-bridge University Press, Cambridge, UK and New York, USA,2001.
IPCC: Chapter 11: N2O Emissions from managed soils, and CO2emissions from lime and urea application, in: IPCC guidelinesfor national greenhouse gas inventories, edited by: Eggleston,H. S., Buendia, L., Miwa, K., Ngara, T., and Tanabe, K., IGES,Hayama, Japan, 2006.
IPCC: Changes in atmospheric constituents and in radiative forc-ing, in: Climate Change 2007: The physical science basis. Con-tribution of Working Group I to the Fourth Assessment Reportof the Intergovernmental Panel on Climate Change, edited by:Solomon, S., Qin, D., Manning, M., Chen, Z., Marquis, M., Av-eryt, K. B., Tignor, M., and Miller, H. L., Cambridge UniversityPress, Cambridge, UK and New York, USA, 2007.
Kitzler, B., Zechmeister-Boltenstern, S., Holtermann, C., Skiba,U., and Butterbach-Bahl, K.: Nitrogen oxides emission fromtwo beech forests subjected to different nitrogen loads, Biogeo-sciences, 3, 293–310,doi:10.5194/bg-3-293-2006, 2006a.
Kitzler, B., Zechmeister-Boltenstern, S., Holtermann, C., Skiba, U.,and Butterbach-Bahl, K.: Controls over N2O, NOx and CO2
fluxes in a calcareous mountain forest soil, Biogeosciences, 3,383–395,doi:10.5194/bg-3-383-2006, 2006b.
Klemedtsson, L., Klemedtsson, A. K., Moldan, F., and Weslien, P.:Nitrous oxide emission from Swedish forest soils in relation toliming and simulated increased N-deposition, Biol. Fertil. Soils,25(3), 290–295, 1997.
Kroeze, C., Mosier, A., and Bouwman, L.: Closing the globalN2O budget: A retrospective analysis 1500-1994, Global Bio-geochem. Cy., 13(1), 1–8, 1999.
Kroeze, C., Bouwman, L., and Slomp, C. P.: Sinks for Nitrous Ox-ide at the Earth’s Surface, in: Greenhouse Gas Sinks, edited by:Reay, D., Hewitt, C. N., Smith, K., and Grace, J., CAB Interna-tional, Oxfordshire, UK, 227–242, 2007.
Loftfield, N., Flessa, H., Augustin, J., and Beese, F.: Automated gaschromatographic system for rapid analysis of atmospheric tracegases methane, carbon dioxide, and nitrous oxide, J. Environ.Qual., 26, 560–564, 1997.
Macdonald, J. A., Skiba, U., Sheppard, L. J., Ball, B., Roberts, J.D., Smith, K. A., and Fowler, D.: The effect of nitrogen depo-sition and seasonal variability on methane oxidation and nitrousoxide emission rates in an upland spruce plantation and moor-land, Atmos. Environ., 31(22), 3693–3706, 1997.
Meesenburg, H., Eichhorn, J., and Meiwes, K. J.: Chapter 15:Atmospheric deposition and canopy interactions, in: Function-ing and management of European beech ecosystems, edited by:Brumme, R. and Khanna, P. K., Springer-Verlag, Berlin Heidel-berg, 265–302, 2009.
Oura, N., Shindo, J., Fumoto, T., Toda, H., and Kawashima, H.:Effects of nitrogen deposition on nitrous oxide emissions fromforest floor, Water Air Soil Pollut., 130, 673–678, 2001.
Papen, H. and Butterbach-Bahl, K.: A 3-year continuous recordof nitrogen trace gas fluxes from untreated and limed soil of aN-saturated spruce and beech forest ecosystem in Germany –1. N2O emissions, J. Geophys. Res., 104(D15), 18487–18503,1999.
Papen, H., Daum, M., Steinkamp, R., and Butterbach-Bahl, K.:N2O and CH4-fluxes from soils of a N-limited and N-fertilizedspruce forest ecosystem of the temperate zone, J. Appl. Bot.,75(3–4), 159–163, 2001.
Pataki, D. E., Ehleringer, J. R., Flanagan, L. B., Yakir, D., Bowling,D. R., Still, C. J., Buchmann, N., Kaplan, J. O., and Berry, J. A.:The application and interpretation of Keeling plots in terrestrialcarbon cycle research, Global Biogeochem. Cy., 17(1), 1022–1029, 2003.
Pilegaard, K., Skiba, U., Ambus, P., Beier, C., Brggemann, N.,Butterbach-Bahl, K., Dick, J., Dorsey, J., Duyzer, J., Gallagher,M., Gasche, R., Horvath, L., Kitzler, B., Leip, A., Pihlatie, M.K., Rosenkranz, P., Seufert, G., Vesala, T., Westrate, H., andZechmeister-Boltenstern, S.: Factors controlling regional differ-ences in forest soil emission of nitrogen oxides (NO and N2O),Biogeosciences, 3, 651–661,doi:10.5194/bg-3-651-2006, 2006.
R Development Core Team: R: A language and environment forstatistical computing, R Foundation for Statistical Computing,Vienna, Austria, ISBN 3-900051-07-0, available at:http://www.R-project.org, 2009.
Rennenberg, H., Kreutzer, K., Papen, H., and Weber, P.: Con-sequences of high loads of nitrogen for spruce (Picea abies)and beech (Fagus sylvatica) forests, New Phytol, 139(1), 71–86,1998.
Biogeosciences, 8, 621–635, 2011 www.biogeosciences.net/8/621/2011/
N. Eickenscheidt et al.: Direct contribution of nitrogen deposition to nitrous oxide emissions 635
Sitaula, B. K., Bakken, L. R., and Abrahamsen, G.: N-Fertilizationand Soil Acidification Effects on N2O and CO2 Emission fromTemperate Pine Forest Soil, Soil. Biol. Biochem., 27(11), 1401–1408, 1995.
Skiba, U. and Smith, K. A.: The control of nitrous oxide emissionsfrom agricultural and natural soils, Chemosphere, 2, 379–386,2000.
Skiba, U., Sheppard, L., Pitcairn, C. E. R., Leith, I., Crossley, A.,van Dijk, S., Kennedy, V. H., and Fowler, D.: Soil nitrous oxideand nitric oxide emissions as indicators of elevated atmosphericN deposition rates in seminatural ecosystems, Environ. Pollut.,102, 457–461, 1998.
Skiba, U., Sheppard, L. J., Pitcairn, C. E. R., van Dijk, S., andRossall, M.: The effect of N deposition on nitrous oxide andnitric oxide emissions from temperate forest soils, Water Air SoilPollut., 116, 89–98, 1999.
Tilsner, J., Wrage, N., Lauf, J., and Gebauer, G.: Emission ofgaseous nitrogen oxides from an extensively managed grasslandin NE Bavaria, Germany II. Stable isotope natural abundance ofN2O, Biogeochemistry, 63(3), 249–267, 2003.
Venterea, R. T., Groffman, P. M., Verchot, L. V., Magill, A. H.,Aber, J. D., and Steudler, P. A.: Nitrogen oxide gas emissionsfrom temperate forest soils receiving long-term nitrogen inputs,Glob. Change Biol., 9(3), 346–357, 2003.
Vitousek, P. M., Aber, J. D., Howarth, R. W., Likens, G. E., Mat-son, P. A., Schindler, D. W., Schlesinger, W. H., and Tilman, D.G.: Human alteration of the global nitrogen cycle: sources andconsequences, Ecol. Appl., 7(3), 737–750, 1997.
Wolf, I. and Brumme, R.: Contribution of nitrification and denitrifi-cation sources for seasonal N2O emissions in acid German forestsoil, Soil Biol. Biochem., 34, 741–744, 2002.
Zechmeister-Boltenstern, S., Hahn, M., Meger, S., and Jandl, R.:Nitrous oxide emissions and nitrate leaching in relation to micro-bial biomass dynamics in a beech forest soil, Soil Biol. Biochem.,34(6), 823–832, 2002.
www.biogeosciences.net/8/621/2011/ Biogeosciences, 8, 621–635, 2011