Direct Certification in the National School Lunch Program ... · State Implementation Progress, ......
100
Nutrition Assistance Program Report Series The Office of Policy Support Special Nutrition Programs Report No. CN-14-DC Direct Certification in the National School Lunch Program: State Implementation Progress, School Year 2013–2014 Report to Congress May 2015
Transcript of Direct Certification in the National School Lunch Program ... · State Implementation Progress, ......
Nutrition Assistance Program Report Series The Office of Policy Support Special Nutrition Programs Report No. CN-14-DC
Direct Certification in the National School Lunch Program:
State Implementation Progress, School Year 2013–2014
Report to Congress
May 2015

USDA is an Equal Opportunity Provider.
May 2015 Special Nutrition Programs Report Number: CN-14-DC
Direct Certification in the National School Lunch Program: State Implementation Progress, School Year 2013–2014
Report to Congress
Authors: Quinn Moore Kevin Conway Brandon Kyler Andrew Gothro Submitted by: Submitted to: Mathematica Policy Research Office of Policy Support P.O. Box 2393 USDA Food and Nutrition Service Princeton, NJ 08543-2393 3101 Park Center Dr., Room 1014 Telephone: (609) 799-3535 Alexandria, VA 22302-1500 Facsimile: (609) 799-0005 Project Director: Project Officer: Kevin Conway Dennis Ranalli Deputy Project Director: Quinn Moore This study was conducted under GSA Contract AG-3198-B-10-0013, task order AG-3198-K-14-0012 with the Food and Nutrition Service. This report is available on the Food and Nutrition Service website: http://www.fns.usda.gov/research-and-analysis Suggested Citation: U.S. Department of Agriculture, Food and Nutrition Service, Office of Policy Support, Direct Certification in the National Lunch Program: State Implementation Progress, School Year 2013–2014 by Quinn Moore, Kevin Conway, Brandon Kyler, and Andrew Gothro. Project Officer Dennis Ranalli. Report CN-13-DC. Alexandria, VA: May 2015.


MATHEMATICA POLICY RESEARCH
ABSTRACT
This report responds to the legislative requirement of the Food, Conservation, and Energy Act of 2008 (P.L.110-234) to assess the effectiveness of State and local efforts to directly certify children for free school meals under the National School Lunch Program (NSLP). Direct certification is a process conducted by the States and by local education agencies (LEAs) to certify certain children for free school meals without the need for household applications. The Child Nutrition and WIC Reauthorization Act of 2004 required all LEAs to establish, by school year (SY) 2008–2009, a system of direct certification of children from households that receive Supplemental Nutrition Assistance Program (SNAP) benefits. The Healthy, Hunger-Free Kids Act of 2010 (HHFKA) requires that States meet certain direct certification performance targets. For SY 2013–2014, States that fail to achieve a direct certification rate of at least 95 percent are required to develop and implement continuous improvement plans. The performance target will remain at 95 percent in future years.
Ninety-three percent of LEAs that participate in the NSLP directly certified some SNAP participants and other categorically eligible students in SY 2013–2014. These LEAs enroll 99 percent of all students in schools that participate in the NSLP. This is an increase from SY 2004–2005, when 56 percent of LEAs, enrolling 77 percent of all students in NSLP schools, directly certified some categorically eligible students.
The number of school-age SNAP participants directly certified for free school meals was 12.4 million for SY 2013–2014, an increase of 1 percent from SY 2012–2013. This year the methodology for calculating the direct certification performance rate was refined in order to make use of new data elements collected in the revised Verification Collection Report (FNS-742) and the new Direct Certification Rate Data Element Report (FNS-834). Therefore, direct certification performance rates presented in this report are not directly comparable to those in reports from prior years.
The results of the analysis in this report indicate that 87 percent of children in SNAP households were directly certified for free school meals. Twelve States achieved the HHFKA-mandated performance target of 95 percent, and no States had a direct certification rate lower than 60 percent.1
1 Although Hawaii’s performance rate exceeded 95 percent, the State was not able to distinguish students directly certified based on SNAP benefit receipt from those based on other program participation. For this reason, Hawaii is not considered to have met the HHFKA-mandated performance target.
v


MATHEMATICA POLICY RESEARCH
CONTENTS
ABSTRACT ................................................................................................................................................... v
GLOSSARY OF ACRONYMS AND ABBREVIATIONS ................................................................................ ix
EXECUTIVE SUMMARY .............................................................................................................................. xi
DIRECT CERTIFICATION IN THE NATIONAL SCHOOL LUNCH PROGRAM: STATE IMPLEMENTATION PROGRESS, SCHOOL YEAR 2013–2014 .................................................... 1
I. Introduction ................................................................................................................................ 1
A. Eligibility determination through application ........................................................................ 1
B. Eligibility determination through direct certification ............................................................. 2
C. Purpose of this report .......................................................................................................... 2
II. History of direct certification ...................................................................................................... 3
III. Current status of direct certification systems ............................................................................. 4
A. Characteristics of LEAs that did not directly certify any SNAP children ............................. 9
IV. Direct certification performance ................................................................................................. 9
A. Data limitations and special circumstances affecting direct certification performance measurement ............................................................................................... 10
B. Calculations of State direct certification performance ....................................................... 12
C. Comparison with SY 2012-2013 direct certification performance ..................................... 15
V. Direct certification best practices ............................................................................................. 21
A. Description of State practices ........................................................................................... 21
B. Recent and planned strategies for improving direct certification ...................................... 32
C. Best practices in implementation of direct certification systems ....................................... 34
D. Challenges in meeting performance rate targets .............................................................. 36
VI. Conclusion ............................................................................................................................... 39
VII. References .............................................................................................................................. 41
APPENDIX A: ADDITIONAL TABLES AND FIGURES
APPENDIX B: SCHOOL FOOD AUTHORITY VERIFICATION COLLECTION REPORT (FORM FNS-742) AND STATE AGENCY (NSLP/SNAP) DIRECT CERTIFICATION RATE DATA ELEMENT REPORT (FORM FNS-834)
APPENDIX C: DESCRIPTION AND LIMITATIONS OF DATA SOURCES USED FOR DIRECT CERTIFICATION PERFORMANCE MEASURE CALCULATIONS
APPENDIX D: DATA UPDATES FOR SCHOOL YEAR 2012–2013
vii
MATHEMATICA POLICY RESEARCH
TABLES
1 Number and percent of LEAs that directly certified categorically eligible students, SY 2011–2012 through SY 2013–2014 ................................................................................................. 6
2 SNAP participation, direct certifications, and SNAP-participant students in special provision schools in a non-base-year, SY 2013–2014 (thousands) .............................................. 11
3 Students eligible for direct or categorical certification: Number directly certified and number approved by application, SY 2013–2014 (thousands) ...................................................... 19
4 Characteristics of the direct certification matching process for public LEAs in selected States, SY 2013–2014 ................................................................................................................... 23
5 Primary matching criteria for States that use central matching systems ....................................... 25
6 Approach for children with potential matches and for children not matched in the primary process ........................................................................................................................................... 30
7 Direct certification methods for private and charter schools .......................................................... 31
8 Recent and planned strategies for improving direct certification ................................................... 33
9 Suggestions for improving direct certification rates ....................................................................... 35
10 Challenges identified by States in meeting direct certification rate target ..................................... 37
FIGURES
1 Percent of LEAs that directly certified categorically eligible students and percent of students in LEAs that directly certified categorically eligible students, SY 2004–2005 through SY 2013–2014 .................................................................................................................... 5
2 Percent of LEAs that directly certified categorically eligible students and percent of students in LEAs that directly certified categorically eligible students by enrollment category, SY 2013–2014.................................................................................................................. 8
3 Percent of LEAs and students, by enrollment category, SY 2013–2014 ......................................... 8
4 Percent of school-age SNAP-participant children directly certified for free school meals, SY 2013–2014 ............................................................................................................................... 13
5 Number of States meeting direct certification performance target set by the Healthy, Hunger-Free Kids Act, SY 2013–2014 ........................................................................................... 14
6 Number of States with direct certification performance rates above or below the mandated performance targets, by region, SY 2013–2014 ........................................................... 15
7 Percent of SNAP-participant children directly certified for free school meals, by State ................ 16
8 Percent of categorically eligible children certified for free school meals, SY 2013–2014 ............. 20
viii

MATHEMATICA POLICY RESEARCH
GLOSSARY OF ACRONYMS AND ABBREVIATIONS
ACS American Community Survey (U.S. Census Bureau) ARC Arkansas Research Center BBCE broad-based categorical eligibility CE categorical eligibility CEP Community Eligibility Provision CIP continuous improvement plan CN child nutrition DER Direct Certification Rate Data Element Report (FNS Form 834) DHHS U.S. Department of Health and Human Services DOB date of birth FCEA Food, Conservation, and Energy Act of 2008 FDPIR Food Distribution Program on Indian Reservations FNS Food and Nutrition Service FY fiscal year HHFKA Healthy, Hunger-Free Kids Act of 2010 ID identification IT information technology LEA local education agency MDE Minnesota Department of Education MDHS Minnesota Department of Human Services NCDOE North Carolina Department of Education NHDOE New Hampshire Department of Education NSLA Richard B. Russell National School Lunch Act NSLP National School Lunch Program P.L. Public Law SBP School Breakfast Program SDE State Department of Education (Idaho) SIPP Survey of Income and Program Participation SFA school food authority SNAP Supplemental Nutrition Assistance Program SSIS statewide student information system SSN Social Security number SY school year TANF Temporary Assistance for Needy Families USDA U.S. Department of Agriculture VCR Verification Collection Report (FNS Form 742) WIC Special Supplemental Nutrition Program for Women, Infants, and Children
ix

MATHEMATICA POLICY RESEARCH
EXECUTIVE SUMMARY
This report responds to a legislative requirement of the Food, Conservation, and Energy Act of 2008 (FCEA) (Public Law [P.L.] 110-234, also known as the 2008 Farm Bill) to assess the effectiveness of State and local efforts to directly certify children for free school meals under the National School Lunch Program (NSLP). The 2008 Farm Bill requires annual Reports to Congress. This is the seventh report in the series, covering school year (SY) 2013–2014. The Food and Nutrition Service (FNS) will use results from this report in determining performance awards and identifying those States that must develop and implement direct certification improvement plans (CIPs), as required by Section 101 of the Healthy, Hunger-Free Kids Act (HHFKA) of 2010 (P.L. 111-296). For this report, the methodology for calculating direct certification performance was refined from the methodology used in previous reports in order to make use of new data elements collected in the revised Verification Collection Report (FNS-742) and the new Direct Certification Rate Data Element Report (FNS-834).
The NSLP reimburses local education agencies (LEAs) for the cost of providing nutritious meals to children in public and private schools and residential child care institutions. Average daily participation across NSLP schools and institutions totaled approximately 31 million children in fiscal year (FY) 2013.
Participating schools and institutions receive cash reimbursements and foods donated by the U.S. Department of Agriculture (USDA) for each meal served. In exchange for Federal assistance, schools must serve meals that meet USDA nutrition and food safety standards. In addition, participating schools must serve meals at no cost or at reduced price to income-eligible children.
Eligibility for program benefits
Children from households with incomes at or below 130 percent of the Federal poverty level are eligible for free school meals. Children from households with incomes no greater than 185 percent of the Federal poverty level are eligible for reduced-price meals. All NSLP meals are subsidized by USDA, including those served to children with household incomes above 185 percent of the Federal poverty level. The subsidies provided for free and reduced-price meals are substantially larger than the subsidies provided for full-price meals.
Children from households that receive benefits under certain other Federal assistance programs are deemed categorically eligible for free meals under the NSLP. Participation in the Supplemental Nutrition Assistance Program (SNAP), Temporary Assistance for Needy Families (TANF), or the Food Distribution Program on Indian Reservations (FDPIR) confers categorical eligibility for free meals. Effective with the start of SY 2009–2010, if one child in a household participating in one of these assistance programs is directly certified (see the next section) or is determined categorically eligible for free school meals by application, then all children in that household are categorically eligible for free meals.
In addition, certain children who are migrants, runaways, or homeless; who are in foster care; or who are enrolled in Head Start or Even Start are categorically eligible for free school meals. However, their eligibility does not extend to other children in their household.
xi
MATHEMATICA POLICY RESEARCH
Direct certification
Students’ eligibility for free meals is determined by application or by direct certification. The Child Nutrition and WIC Reauthorization Act of 2004 (the 2004 Reauthorization Act) required all States to establish a system of direct certification of school-age SNAP participants by SY 2008–2009. The requirement applies only to children participating in SNAP; however, States and LEAs may also directly certify children from TANF and FDPIR households.
Although direct certification systems vary by State and LEA, all such systems substantially reduce the need for household applications. Many States and LEAs certify categorically eligible students through computer matching of program records against student enrollment lists. Those systems require no action by the children’s parents or guardians. States and LEAs commonly incorporate participation data from programs other than SNAP, such as TANF, FDPIR, or foster care. In some States, SNAP, TANF or FDPIR agencies send letters to program participants indicating that any school-age children in the household are eligible for free school meals. Household members can forward these letters to LEA staff in order to be certified without an application. In the past, States and LEAs could consider these children directly certified. However, effective with SY 2012–2013, States may no longer use the letter method as a means of direct certification for SNAP, although they are required to continue to accept such letters in lieu of applications as documentation of categorical eligibility.
HHFKA requires that States meet certain direct certification performance targets. For SY 2013–2014, States that fail to achieve a direct certification rate of at least 95 percent are required to develop and implement CIPs. The performance target will remain at 95 percent in future years.
State performance measures
This report presents information on direct certification performance for SY 2013–2014. As noted above, the methodology for calculating the performance measure was refined for this report to make use of new data elements from the revised Verification Collection Report (FNS-742) and the new Direct Certification Rate Data Element Report (FNS-834). In order to calculate the performance rate, Mathematica Policy Research used State-reported counts of the number of school-age SNAP participants, the number of children directly certified for free school meals based on SNAP participation, and the number of SNAP children in special provision schools operating in non-base years. The refined formula provides a measure of the success of State and local systems to directly certify SNAP-participant children.
Mathematica also calculated the percentage of school-age SNAP, TANF, and FDPIR participants certified for free school meals by direct certification, application, or letter method. This measure provides a more comprehensive assessment of State efforts to ensure that all categorically eligible children are properly certified for free school meals.
Key findings
At the start of SY 2013–2014, States and LEAs directly certified 11.2 million children based on participation in SNAP and 1.2 million children based on participation in programs other than SNAP, for a total of 12.4 million children. This total represents an increase of 1 percent from the previous year. The calculated percentage of SNAP-participant children directly certified for free school meals was 87 percent in SY 2013–2014. The direct certification performance rate in SY 2012–2013 was estimated at 89 percent; however, this estimate was based on different data xii

MATHEMATICA POLICY RESEARCH
sources and overstated the percentage of SNAP-participant children directly certified for free school meals because it included students directly certified based on programs other than SNAP.2
For 38 States in SY 2013–2014, the number of students certified using direct certification, application based on categorical eligibility, or letter method was at least 95 percent of the estimated number of school-age children categorically eligible for free school meals based on participation in SNAP, TANF or FDPIR. However, this measure may overstate the effectiveness of State efforts to ensure that all categorically eligible children receiving SNAP, TANF, or FDPIR benefits are properly certified for free school meals for several reasons. Most importantly, many States and districts have improved their certification processes to directly or categorically certify categorically eligible children from programs other than SNAP, TANF, or FDPIR, such as those receiving foster care or those directly certified based on Medicaid data in States participating in the Direct Certification-Medicaid demonstration. While these represent important improvements to direct certification systems, they may also have the effect of overstating the percentage of SNAP, TANF, or FDPIR recipients who were certified because it includes children certified through other programs that allow for direct certification or confer categorical eligibility.
The number of LEAs directly certifying categorically eligible children continues to increase. In SY 2004–2005, before the congressional mandate for direct certification, 56 percent of LEAs directly certified categorically eligible children on a discretionary basis. By SY 2013–2014, 93 percent of LEAs directly certified some categorically eligible children; those LEAs enrolled 99 percent of students in NSLP-participating schools.
State best practices
States and LEAs continue to find success with different direct certification models, and they are making investments in their direct certification systems that promise improved performance in the coming years.
Representatives from six states with successful or improved direct certification systems were interviewed for this report. Four of these States have revised their direct certification matching systems with the help of grant money made available by USDA. Recent direct certification changes that States link to performance improvements include improving data system capability—such as increasing use of automated processes—and increasing match frequency. Many of these changes were made with an eye toward meeting the performance benchmarks set forth in HHFKA (95 percent in SY 2013–2014 and in future years). In discussions surrounding challenges to meeting these benchmarks in future years, States frequently cited difficulties inherent in matching data from different sources, such as divergent file layout and data entry protocols across data sources. States also cited the inability of direct certification improvement measures to account for children who receive SNAP benefits but who are not enrolled in schools
2 An estimate that more closely approximates the estimates used in previous reports can by calculated by including the counts of both SNAP and non-SNAP direct certifications from the revised FNS-742. Instead of a national direct certification rate of 87 percent found using the primary method, this alternate method generates a 95 percent national rate—6 percentage points higher than the rate in last year’s report. While it is important to not misinterpret this figure, it helps to confirm that States continue to improve their direct certification performance. xiii

MATHEMATICA POLICY RESEARCH
and thus not eligible for direct certification. These students include home-schooled children, school dropouts, and some homeless and migrant children.
Conclusion
States and LEAs have made significant progress in complying with the 2004 Reauthorization Act. An estimated 93 percent of LEAs, enrolling 99 percent of all children in NSLP-participating schools, directly certified SNAP participants in SY 2013–2014. Eighty-seven percent of children from SNAP-participant households were directly certified for free school meals in SY 2013–2014. Twelve States achieved direct certification rates of at least 95 percent, the direct certification performance target set by HHFKA for SY 2013–2014. No States had a direct certification rate lower than 60 percent.
xiv

MATHEMATICA POLICY RESEARCH
DIRECT CERTIFICATION IN THE NATIONAL SCHOOL LUNCH PROGRAM: STATE IMPLEMENTATION PROGRESS, SCHOOL YEAR 2013–2014
I. Introduction
The National School Lunch Program (NSLP) reimburses local education agencies (LEAs) for the cost of providing nutritious low-cost or free meals to children in public and private schools and residential child care institutions. Participating schools and institutions receive cash reimbursements and foods donated by the U.S. Department of Agriculture (USDA) for each meal served. About 100,000 schools and institutions participate in the program. Average daily student participation totaled about 31 million in fiscal year (FY) 2013.3
In exchange for Federal assistance, participating schools and institutions serve meals that satisfy Federal nutrition and food safety standards. In addition, they must offer school meals at no cost, or at reduced price, to eligible children. Children from households with incomes at or below 130 percent of the Federal poverty level ($30,615 for a family of four during school year (SY) 2013–2014)4 are eligible for free meals. Those from households with incomes from 130 to 185 percent of the Federal poverty level ($43,568 for a family of four during SY 2013–2014) are eligible for reduced-price meals. Students are determined eligible for free meals through application or direct certification (described next); reduced-price eligibility is determined by application alone.
A. Eligibility determination through application Most LEAs accept applications from households to establish the eligibility of the children
who reside in them for free or reduced-price school meals.5 Most applicants submit self-declared income and household size information, which is compared with the income thresholds for free and reduced-price benefits. Other applicants provide case numbers that demonstrate household participation in one of several other means-tested Federal assistance programs. Children in households that receive benefits under the Supplemental Nutrition Assistance Program (SNAP), Temporary Assistance for Needy Families (TANF), or Food Distribution Program on Indian Reservations (FDPIR) are categorically eligible for free school meals. Categorical eligibility through these assistance programs, whether determined by application or by direct certification (described next), extends to all children in the same household. Foster children; certain children enrolled in Federally funded Head Start or Even Start programs; and certain homeless, runaway, and migrant children are also categorically eligible for free school meals. Their eligibility is on an individual basis and does not extend to other children in the household.
3 See http://www.fns.usda.gov/sites/default/files/NSLPFactSheet.pdf. 4 The income eligibility thresholds given here apply to households from the 48 contiguous States, the District of Columbia, Guam, and the other U.S. territories. The income thresholds are higher in Alaska and Hawaii. A table of income eligibility thresholds can be found at http://www.fns.usda.gov/sites/default/files/RPieg.pdf. 5 Some schools receiving reimbursements under special provisions do not collect applications. These include schools using Provisions 2 or 3 and operating in a non-base year, as well as schools using the new Community Eligibility Provision.
1
MATHEMATICA POLICY RESEARCH
B. Eligibility determination through direct certification Direct certification confirms a child’s categorical eligibility for free school meals without
the need for a household application. Direct certification typically involves matching SNAP, TANF, and FDPIR records against student enrollment lists, at either the State or the LEA level.6 Parents or guardians of children identified through these matching systems are notified of their children’s eligibility for free school meals.7 They need not take action for their children to be certified.8
The 2004 Reauthorization Act requires that each State education agency enter into an agreement with the State agency responsible for determining SNAP eligibility. The agreement must establish procedures to directly certify children from SNAP households for free school meals.9 States may also directly certify children from TANF and FDPIR households; foster children; participants in Federally funded Head Start or Even Start programs; and certain homeless, runaway, and migrant children, but are not required to do so.
C. Purpose of this report This report responds to Section 4301 of the Food, Conservation, and Energy Act of 2008
(FCEA),10 which calls for an assessment of the “effectiveness of each State in enrolling school-age children in households receiving … [SNAP] benefits” for free school meals.11 Specifically, the law requires the following:
1. State-level estimates of the number of school-age children who received SNAP benefits at any time in July, August, or September (just before or at the start of the current SY).
2. Estimates of the number of SNAP-participant children who were directly certified for free school meals as of October 1.
3. Estimates of the number of SNAP-participant students who were not candidates for direct certification because they attended special provision schools operating in years in which applications were not collected.
The Food and Nutrition Service (FNS) will use these estimates in determining performance awards and identifying those States that must develop and implement direct certification
6 Federal law requires direct certification of SNAP-participant children. However, most State direct certification systems also extend to children in TANF households. 7 Households must be given the opportunity to decline free school meal benefits. 8 In the past, States and LEAs could opt to send letters to SNAP, TANF, and FDPIR households with school-age children. The letters served as proof of categorical eligibility for free meals and were forwarded by the households to their children’s schools. By SY 2012–2013, States were required to phase out the use of the letter method and it could no longer be used to directly certify children receiving SNAP benefits. 9 The Child Nutrition and WIC Reauthorization Act’s direct certification provision was phased in over a three-year period beginning with SY 2006–2007. 10 Also known as the 2008 Farm Bill. 11 This report includes analysis of the contiguous United States, Alaska, Hawaii, and Guam.
2
MATHEMATICA POLICY RESEARCH
continuous improvement plans (CIPs), as required by Section 101 of the Healthy, Hunger-Free Kids Act of 2010 (HHFKA) (P.L. 111-296). Specifically, for SY 2013–2014 and beyond, States that fail to achieve a direct certification rate of at least 95 percent are required to develop and implement CIPs. This year, we used a revised methodology to calculate State direct certification performance that makes use of data elements from the Verification Collection Report (VCR), a revised version of FNS Form 742 that replaced the Verification Summary Report in SY 2013–2014, and the new Direct Certification Rate Data Element Report (DER, FNS Form 834). As a result of the revised methodology, the performance measure now reflects State-reports of key components of the measure and no longer overstates the percentage of SNAP participants who were directly certified by including children directly certified based on participation in other programs.
In addition to presenting direct certification performance measures, Section 4301 of the FCEA also calls for a discussion of best practices in States with successful direct certification systems.
II. History of direct certification
In the mid-1980s, program managers and policymakers recognized a duplication of effort in certifying school children for free meals under the NSLP and the School Breakfast Program (SBP),12 and certifying families for what are now the SNAP and TANF programs (formerly the Food Stamp Program and Aid to Families with Dependent Children, respectively). All these programs have similar income-eligibility limits, and many school children participated in more than one. Further, the application processes for SNAP and TANF were, and remain, more detailed and rigorous than the certification process for free meals under the NSLP. Use of eligibility determinations for SNAP and TANF could improve the accuracy of certifications for NSLP.
Legislation taking a first step to link these programs was enacted in 1986. The Richard B. Russell National School Lunch Act (NSLA) was amended to make children who are members of a household receiving assistance under SNAP and TANF automatically eligible for free school meals. This action paved the way for more simplified application and certification procedures for these children. Initially, families could put their case number from these programs on the application in lieu of providing income information.13 Then, in 1989, P.L. 101-147 (Child Nutrition and WIC Reauthorization Act of 1989) allowed school food authorities (SFAs) to certify children, without further application, by directly communicating with the appropriate State or local agency to obtain documentation that the children were members of a household receiving either SNAP or TANF benefits. This first statutory authorization of direct certification was made optional for SFAs.
12 Children certified for free or reduced-price meals under the NSLP are eligible for free or reduced-price breakfasts under the SBP. The two programs share a single application process. Throughout this report, certification for free or reduced-price benefits under the NSLP should be understood to mean certification for the SBP as well. 13 The option to provide a case number on the application has been retained to enable the LEAs to more easily process children who were not directly certified.
3

MATHEMATICA POLICY RESEARCH
The 2004 Reauthorization Act amended the NSLA to mandate direct certification with SNAP for all LEAs. Before 2004, the NSLA referred only to SFAs when describing local administration of the NSLP. With the 2004 Reauthorization Act, the NSLA recognized LEAs, rather than SFAs, as the entities responsible for NSLP application and certification processes.14 The 2004 act retained discretionary authority for TANF direct certification. Mandatory direct certification with SNAP was phased in over three years, beginning in SY 2006–2007. All LEAs, including private schools, were required to have direct certification systems in place for SY 2008–2009.
Because State agencies administering the NSLP and SBP recognized that direct certification would increase participation, ease the burden on families and LEAs, and result in more accurate targeting of free school meal benefits, many States chose to phase in the use of direct certification in advance of the mandate. State education agencies worked in partnership with the agencies in their States that administered SNAP and TANF. At the outset, various methods were used, refined, and expanded. By the time direct certification with SNAP became mandatory, many State agencies had systems in place and were familiar with the process.
In the years since the statutory mandate, additional implementation requirements have been introduced with the intention of increasing the reach and effectiveness of direct certification. In August 2009, FNS issued guidance requiring that free meal eligibility apply to all children in a household if at least one child is certified for free meals based on receipt of SNAP, TANF, or FDPIR benefits. HHFKA required that State agencies no longer use the letter method as a means of direct certification with SNAP. This act also includes a provision that expands direct certification to include Medicaid in some districts via a demonstration project. In addition, starting in SY 2011–2012, FNS required that direct certification matching with SNAP records occurs at least three times per school year.
Even though all LEAs are now subject to the statutory direct certification mandate, there continues to be a need for household applications. Some households with incomes at or below 130 percent of the Federal poverty level do not participate in SNAP. Children from those households remain income-eligible for free school meals, but will not be identified through direct certification. In addition, because children from households with incomes from 130 to 185 percent of the Federal poverty level are not eligible for SNAP, direct certification cannot be used to certify children eligible for reduced-price school meals.
III. Current status of direct certification systems
The 2004 Reauthorization Act required that all LEAs begin directly certifying children from SNAP-participant families by SY 2008–2009. The direct certification mandate was phased in over three years. LEAs with total enrollments of 25,000 or more students were required to establish direct certification systems no later than SY 2006–2007. LEAs with enrollments of 10,000 or more followed in SY 2007–2008. Phase-in was complete in SY 2008–2009, when all LEAs were subject to the statutory mandate.
14 This report focuses on the role LEAs play in certifying students for free school meals. We use the terms LEA and district interchangeably.
4
MATHEMATICA POLICY RESEARCH
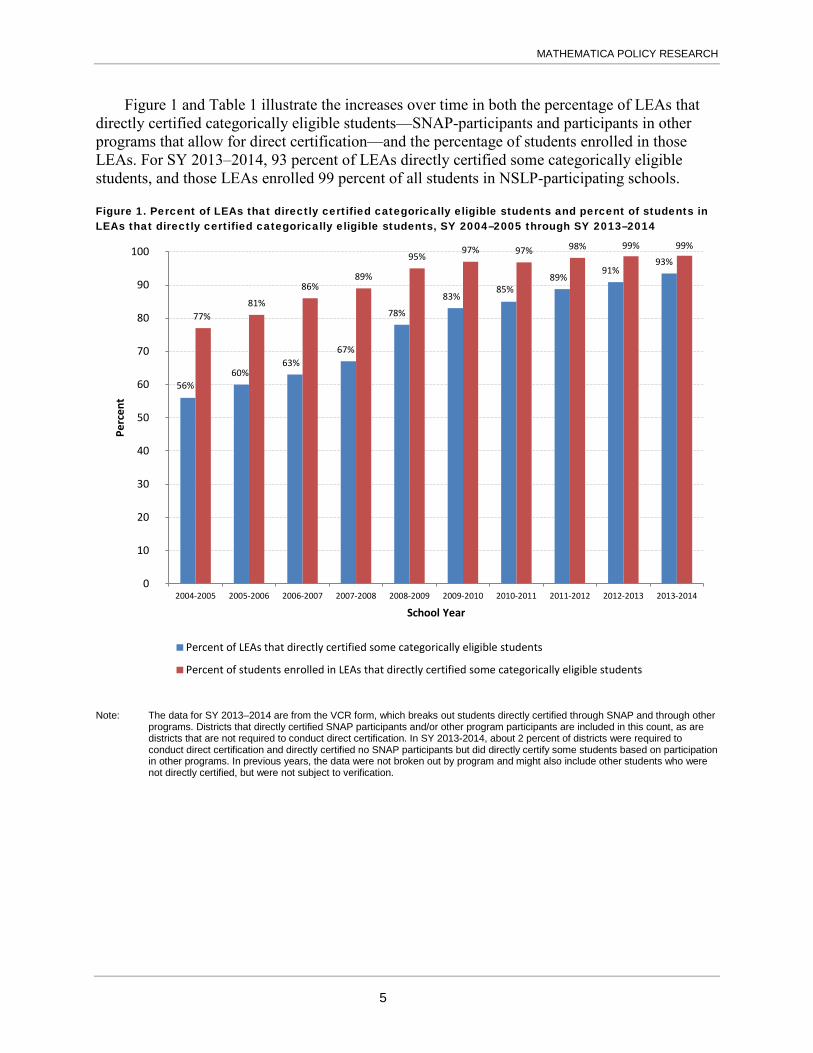
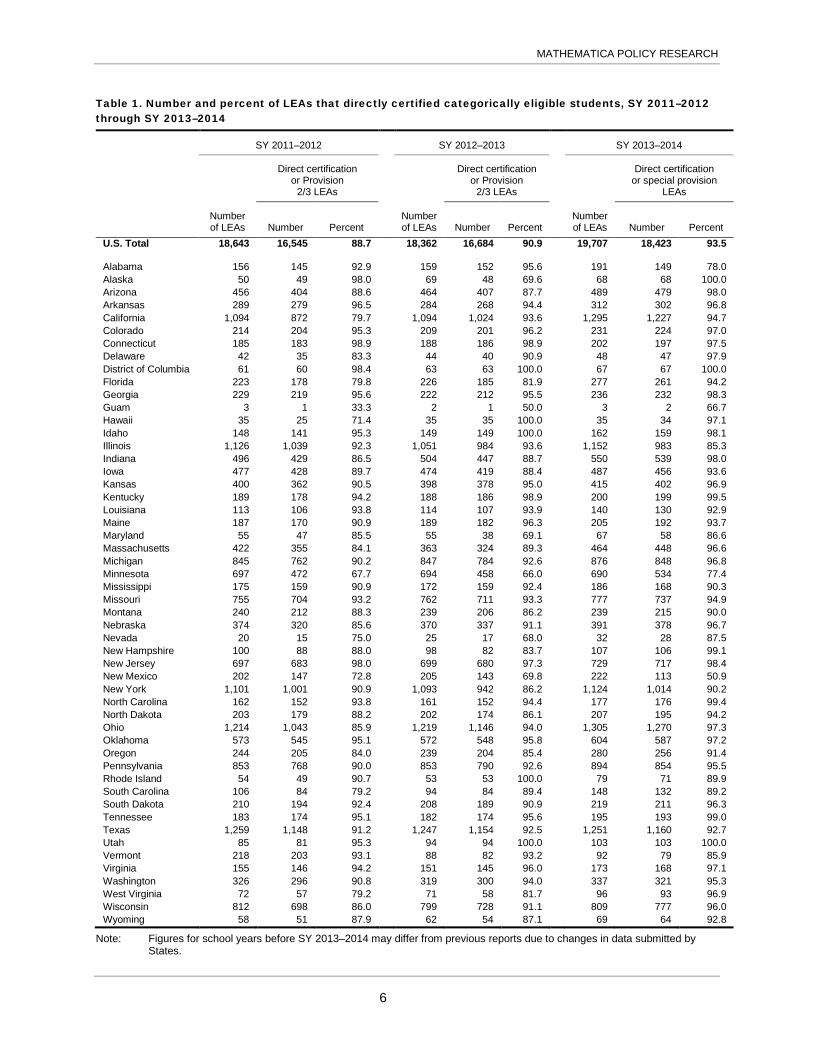
Figure 1 and Table 1 illustrate the increases over time in both the percentage of LEAs that directly certified categorically eligible students—SNAP-participants and participants in other programs that allow for direct certification—and the percentage of students enrolled in those LEAs. For SY 2013–2014, 93 percent of LEAs directly certified some categorically eligible students, and those LEAs enrolled 99 percent of all students in NSLP-participating schools.
Figure 1. Percent of LEAs that directly certified categorically eligible students and percent of students in LEAs that directly certified categorically eligible students, SY 2004–2005 through SY 2013–2014
Note: The data for SY 2013–2014 are from the VCR form, which breaks out students directly certified through SNAP and through other programs. Districts that directly certified SNAP participants and/or other program participants are included in this count, as are districts that are not required to conduct direct certification. In SY 2013-2014, about 2 percent of districts were required to conduct direct certification and directly certified no SNAP participants but did directly certify some students based on participation in other programs. In previous years, the data were not broken out by program and might also include other students who were not directly certified, but were not subject to verification.
56%60%
63%67%
78%
83%85%
89%91%
93%
77%81%
86%89%
95%97% 97% 98% 99% 99%
0%
10%
20%
30%
40%
50%
60%
70%
80%
90%
100%
2004-2005 2005-2006 2006-2007 2007-2008 2008-2009 2009-2010 2010-2011 2011-2012 2012-2013 2013-2014
Perc
ent
School Year
Percent of LEAs that directly certified some categorically eligible students
Percent of students enrolled in LEAs that directly certified some categorically eligible students
5
MATHEMATICA POLICY RESEARCH
Table 1. Number and percent of LEAs that directly certified categorically eligible students, SY 2011–2012 through SY 2013–2014
SY 2011–2012 SY 2012–2013 SY 2013–2014
Direct certification or Provision
2/3 LEAs
Direct certification or Provision
2/3 LEAs
Direct certification or special provision
LEAs
Number of LEAs Number Percent
Number of LEAs Number Percent
Number of LEAs Number Percent
U.S. Total 18,643 16,545 88.7 18,362 16,684 90.9 19,707 18,423 93.5 Alabama 156 145 92.9 159 152 95.6 191 149 78.0 Alaska 50 49 98.0 69 48 69.6 68 68 100.0 Arizona 456 404 88.6 464 407 87.7 489 479 98.0 Arkansas 289 279 96.5 284 268 94.4 312 302 96.8 California 1,094 872 79.7 1,094 1,024 93.6 1,295 1,227 94.7 Colorado 214 204 95.3 209 201 96.2 231 224 97.0 Connecticut 185 183 98.9 188 186 98.9 202 197 97.5 Delaware 42 35 83.3 44 40 90.9 48 47 97.9 District of Columbia 61 60 98.4 63 63 100.0 67 67 100.0 Florida 223 178 79.8 226 185 81.9 277 261 94.2 Georgia 229 219 95.6 222 212 95.5 236 232 98.3 Guam 3 1 33.3 2 1 50.0 3 2 66.7 Hawaii 35 25 71.4 35 35 100.0 35 34 97.1 Idaho 148 141 95.3 149 149 100.0 162 159 98.1 Illinois 1,126 1,039 92.3 1,051 984 93.6 1,152 983 85.3 Indiana 496 429 86.5 504 447 88.7 550 539 98.0 Iowa 477 428 89.7 474 419 88.4 487 456 93.6 Kansas 400 362 90.5 398 378 95.0 415 402 96.9 Kentucky 189 178 94.2 188 186 98.9 200 199 99.5 Louisiana 113 106 93.8 114 107 93.9 140 130 92.9 Maine 187 170 90.9 189 182 96.3 205 192 93.7 Maryland 55 47 85.5 55 38 69.1 67 58 86.6 Massachusetts 422 355 84.1 363 324 89.3 464 448 96.6 Michigan 845 762 90.2 847 784 92.6 876 848 96.8 Minnesota 697 472 67.7 694 458 66.0 690 534 77.4 Mississippi 175 159 90.9 172 159 92.4 186 168 90.3 Missouri 755 704 93.2 762 711 93.3 777 737 94.9 Montana 240 212 88.3 239 206 86.2 239 215 90.0 Nebraska 374 320 85.6 370 337 91.1 391 378 96.7 Nevada 20 15 75.0 25 17 68.0 32 28 87.5 New Hampshire 100 88 88.0 98 82 83.7 107 106 99.1 New Jersey 697 683 98.0 699 680 97.3 729 717 98.4 New Mexico 202 147 72.8 205 143 69.8 222 113 50.9 New York 1,101 1,001 90.9 1,093 942 86.2 1,124 1,014 90.2 North Carolina 162 152 93.8 161 152 94.4 177 176 99.4 North Dakota 203 179 88.2 202 174 86.1 207 195 94.2 Ohio 1,214 1,043 85.9 1,219 1,146 94.0 1,305 1,270 97.3 Oklahoma 573 545 95.1 572 548 95.8 604 587 97.2 Oregon 244 205 84.0 239 204 85.4 280 256 91.4 Pennsylvania 853 768 90.0 853 790 92.6 894 854 95.5 Rhode Island 54 49 90.7 53 53 100.0 79 71 89.9 South Carolina 106 84 79.2 94 84 89.4 148 132 89.2 South Dakota 210 194 92.4 208 189 90.9 219 211 96.3 Tennessee 183 174 95.1 182 174 95.6 195 193 99.0 Texas 1,259 1,148 91.2 1,247 1,154 92.5 1,251 1,160 92.7 Utah 85 81 95.3 94 94 100.0 103 103 100.0 Vermont 218 203 93.1 88 82 93.2 92 79 85.9 Virginia 155 146 94.2 151 145 96.0 173 168 97.1 Washington 326 296 90.8 319 300 94.0 337 321 95.3 West Virginia 72 57 79.2 71 58 81.7 96 93 96.9 Wisconsin 812 698 86.0 799 728 91.1 809 777 96.0 Wyoming 58 51 87.9 62 54 87.1 69 64 92.8
Note: Figures for school years before SY 2013–2014 may differ from previous reports due to changes in data submitted by States.
6
MATHEMATICA POLICY RESEARCH
About two-thirds of the LEAs that did not directly certify categorically eligible students in SY 2013–2014 are private, and three-quarters are single-school LEAs. These schools might be less likely to enroll categorically eligible children or could face greater barriers to implementing direct certification. The information-sharing relationship between private school LEAs and the States’ education agencies often differs from the relationship between public LEAs and the States. For this reason, private LEAs are sometimes excluded from State-level direct certification matching systems. Although small, single-school, and private LEAs might face special challenges in setting up direct certification systems, all are subject to the statutory mandate.
The 2004 Reauthorization Act’s phased implementation of mandatory direct certification recognized that the fixed costs of establishing such a system would pose the greatest challenge to small LEAs. Although SY 2013–2014 is the sixth year that the smallest LEAs were subject to the statutory mandate, these LEAs continue to lag behind larger LEAs somewhat in adopting direct certification, and it remains useful to track the progress of that group separately.
Figure 2 shows estimates by LEA enrollment category of the percentage of LEAs that directly certified categorically eligible students and the percentage of students enrolled in LEAs that directly certified categorically eligible students in SY 2013–2014. Use of direct certification is nearly universal for larger LEAs; 99 percent of LEAs with enrollments of 5,000 or more students, 98 percent of those with enrollments of 1,000 to 4,999, and 97 percent of those with enrollments of 500 to 999 directly certified some categorically eligible students in SY 2013–2014. Although LEAs with enrollments of at least 500 make up about 52 percent of all LEAs, they enroll about 96 percent of students nationwide (Figure 3).
Direct certification is somewhat less prevalent among small LEAs; about 89 percent of LEAs with fewer than 500 students directly certified categorically eligible students in SY 2013–2014. Some of the LEAs might not have categorically eligible children among their enrollments, though it is also possible that technical or administrative challenges are among the reasons that these LEAs did not directly certify any categorically eligible students. The direct certification numbers for these small LEAs are a 5-percentage point improvement over the previous year. Therefore, the gap between the largest LEAs and those with fewer students is narrowing.
About 48 percent of all LEAs enroll fewer than 500 students; these LEAs account for only 3 percent of all enrolled students nationwide (Figure 3). Of the 1.7 million students enrolled in these LEAs, a large majority (91 percent) are enrolled in LEAs that directly certified at least some SNAP-eligible children.
7

MATHEMATICA POLICY RESEARCH
Figure 2. Percent of LEAs that directly certified categorically eligible students and percent of students in LEAs that directly certified categorically eligible students by enrollment category, SY 2013–2014
Note: The percentages in this figure are rounded. For example, 99.7 percent of LEAs with 10,000 or more students directly
certified some categorically eligible students in SY 2013–2014, which is rounded to 100 percent.
Figure 3. Percent of LEAs and students, by enrollment category, SY 2013–2014
89%96% 98% 99% 99%
91%97% 99% 99% 100%
0%
10%
20%
30%
40%
50%
60%
70%
80%
90%
100%
Fewer than 500students
500 to 999 students 1,000 to 4,999students
5,000 to 9,999students
10,000 or morestudents
Perc
ent
Enrollment Category
Percent of LEAs that directly certified some categorically eligible students
Percent of students enrolled in LEAs that directly certified some categorically eligible students
48%
4%
15%
4%
27%25%
5%
14%
5%
53%
0%
10%
20%
30%
40%
50%
60%
70%
80%
90%
100%
Percent of all LEAs Percent of all students
Perc
ent
Fewer than 500 students
500 to 999 students
1,000 to 4,999 students
5,000 to 9,999 students
10,000 or more students
8

MATHEMATICA POLICY RESEARCH
A. Characteristics of LEAs that did not directly certify any SNAP children Overall, 1,284 LEAs, about 7.0 percent of the total, did not directly certify SNAP-
participant children in SY 2013–2014 (a decrease from 1,678 LEAs in SY 2012–2013). Although the NSLA does not exempt small or single-school districts from the direct certification requirement, both groups are overrepresented among LEAs with no directly certified students. Because they tend to be small, the 7.0 percent of LEAs that did not directly certify any SNAP children enroll only 1.4 percent of students in NSLP-participating schools.
Some additional details on LEAs that did not directly certify SNAP-participant students include the following:
• About 83 percent enrolled fewer than 500 students; only 45 percent of LEAs that did directly certify SNAP participants enrolled fewer than 500 students.
• About 74 percent are single-school LEAs; only 37 percent of LEAs that did directly certify SNAP participants are single-school LEAs.
• An estimated 63 percent are private LEAs; only 20 percent of LEAs that did directly certify SNAP participants are private.
• About 24 percent certified no students at all for free meals, either by direct certification or by application. FNS has no reason to believe that this small group of about 303 LEAs is not in full compliance with the direct certification requirement; these LEAs might enroll very few or no children from SNAP-participant households.
• About 38 percent certified some but no more than 5 percent of their enrolled students for free meals; only 11 percent of LEAs that did directly certify SNAP participants reported having such a low concentration of students from low-income households. These LEAs have an unusually low concentration of students certified for free meals, and some might also be in compliance with the direct certification requirement, though their systems failed to identify any SNAP participants.
IV. Direct certification performance
For each State, Mathematica calculates a direct certification performance measure reflecting the percentage of school-age children in SNAP-participant households who were directly certified for free school meals. For this Report to Congress, the data sources of the components of this measure have changed in important ways from those used in previous Reports to Congress:
1. The number of SNAP participants directly certified by the State’s LEAs for free school meals. This value is based on LEA reports on the VCR. For SY 2013–2014, the VCR was revised such that LEAs report direct certifications from SNAP separately from direct certifications based on other programs.
2. The number of SNAP participants in the State’s non-base year special provision schools. This value is based on State reports on the DER. In previous Reports to Congress, this value was estimated based on secondary data sources.
3. The number of school-age children in the State’s SNAP-participant households. This value is based on State reports on the DER. In previous Reports to Congress, this value was estimated based on secondary data sources.
9

MATHEMATICA POLICY RESEARCH
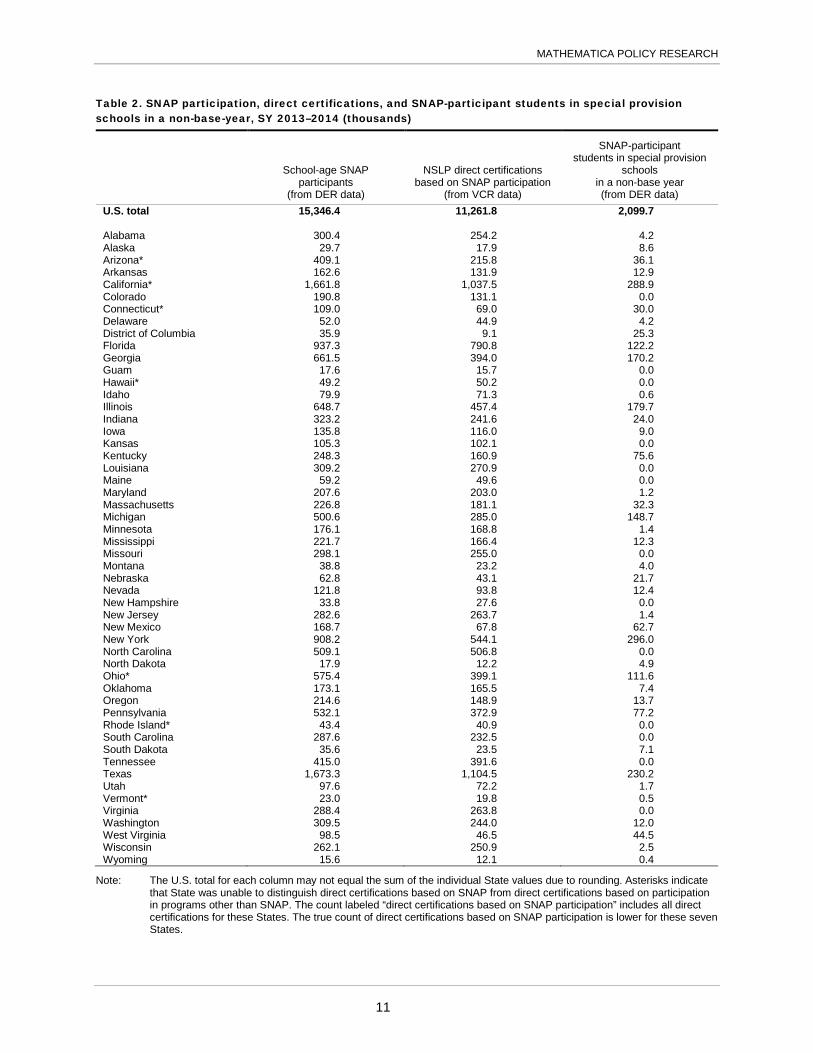
Table 2 provides the values of these components for each State. To take advantage of the new data sources and data reported directly from States, this report’s primary measure of State direct certification effectiveness is computed as follows:
Percent of SNAP children directly certified for free
school meals =
Students directly certified for free school meals based
on SNAP participation +
SNAP children in special provision schools operating in
non-base years School-age children in SNAP households
Although the revised methodology is more straightforward than the one used in previous reports and addresses many of the limitations of the previous methodology, some limitations to measuring direct certification performance remain. These limitations are discussed in the next section.
A. Data limitations and special circumstances affecting direct certification performance measurement The reliability of the performance measure depends on the accuracy of the underlying data.
One source of potential inaccuracy is reporting error. For example, if some districts provide inaccurate counts of students who are directly certified based on SNAP participation, then State calculations of students directly certified based on SNAP participation are incorrect—specifically this inaccuracy will affect the numerator of the performance rate equation. Reporting error can also occur if State agencies provide inaccurate counts of the number of school-age children in SNAP households or SNAP participants in special provision schools operating in non-base years. Reporting error in these counts may be particularly relevant for SY 2013-2014 counts because this is the first year that agencies have used the DER. It is likely that reporting error will decline in future years as agencies become more familiar with the steps needed to complete the form.
To identify potential data limitations, FNS asked States to indicate special circumstances in the data they submitted that would affect their performance rates.15 Fourteen States cited such circumstances. FNS discussed these circumstances in detail with staff from the States, obtaining useful information about the challenges States face when collecting the data elements FNS requires. Special circumstances fell into two categories. The first stemmed from data system limitations. Specifically, seven States reported that their data systems prevented them from distinguishing direct certifications based on SNAP from direct certifications based on participation in programs other than SNAP.16 The resulting performance rates calculated for these States, therefore, overstate their actual performance.
The second type of special circumstance States cited dealt with children in households receiving SNAP benefits who do not attend schools participating in the NSLP. These children
15 States used the DER form to report these special circumstances, and many of those circumstances pertained to limitations of the VCR data. See Appendix C for more details. 16 Arizona, California, Connecticut, Hawaii, Ohio, Rhode Island, and Vermont could not distinguish direct certifications based on SNAP participation from direct certifications based on participation in programs other than SNAP.
10
MATHEMATICA POLICY RESEARCH
Table 2. SNAP participation, direct certifications, and SNAP-participant students in special provision schools in a non-base-year, SY 2013–2014 (thousands)
School-age SNAP participants
(from DER data)
NSLP direct certifications based on SNAP participation
(from VCR data)
SNAP-participant students in special provision
schools in a non-base year (from DER data)
U.S. total 15,346.4 11,261.8 2,099.7 Alabama 300.4 254.2 4.2 Alaska 29.7 17.9 8.6 Arizona* 409.1 215.8 36.1 Arkansas 162.6 131.9 12.9 California* 1,661.8 1,037.5 288.9 Colorado 190.8 131.1 0.0 Connecticut* 109.0 69.0 30.0 Delaware 52.0 44.9 4.2 District of Columbia 35.9 9.1 25.3 Florida 937.3 790.8 122.2 Georgia 661.5 394.0 170.2 Guam 17.6 15.7 0.0 Hawaii* 49.2 50.2 0.0 Idaho 79.9 71.3 0.6 Illinois 648.7 457.4 179.7 Indiana 323.2 241.6 24.0 Iowa 135.8 116.0 9.0 Kansas 105.3 102.1 0.0 Kentucky 248.3 160.9 75.6 Louisiana 309.2 270.9 0.0 Maine 59.2 49.6 0.0 Maryland 207.6 203.0 1.2 Massachusetts 226.8 181.1 32.3 Michigan 500.6 285.0 148.7 Minnesota 176.1 168.8 1.4 Mississippi 221.7 166.4 12.3 Missouri 298.1 255.0 0.0 Montana 38.8 23.2 4.0 Nebraska 62.8 43.1 21.7 Nevada 121.8 93.8 12.4 New Hampshire 33.8 27.6 0.0 New Jersey 282.6 263.7 1.4 New Mexico 168.7 67.8 62.7 New York 908.2 544.1 296.0 North Carolina 509.1 506.8 0.0 North Dakota 17.9 12.2 4.9 Ohio* 575.4 399.1 111.6 Oklahoma 173.1 165.5 7.4 Oregon 214.6 148.9 13.7 Pennsylvania 532.1 372.9 77.2 Rhode Island* 43.4 40.9 0.0 South Carolina 287.6 232.5 0.0 South Dakota 35.6 23.5 7.1 Tennessee 415.0 391.6 0.0 Texas 1,673.3 1,104.5 230.2 Utah 97.6 72.2 1.7 Vermont* 23.0 19.8 0.5 Virginia 288.4 263.8 0.0 Washington 309.5 244.0 12.0 West Virginia 98.5 46.5 44.5 Wisconsin 262.1 250.9 2.5 Wyoming 15.6 12.1 0.4
Note: The U.S. total for each column may not equal the sum of the individual State values due to rounding. Asterisks indicate that State was unable to distinguish direct certifications based on SNAP from direct certifications based on participation in programs other than SNAP. The count labeled “direct certifications based on SNAP participation” includes all direct certifications for these States. The true count of direct certifications based on SNAP participation is lower for these seven States.
11

MATHEMATICA POLICY RESEARCH
appear in the denominator of the direct certification performance rate calculation because the children reside in SNAP households. However, they do not appear in the numerator, because the children do not attend school districts that submit VCR forms. The result decreases State performance rates. States cited children in the following categories:
• Home-schooled students
• Virtual students (who attend classes online)
• Students attending schools that do not participate in the NSLP
• School-age children who do not attend school, including
- School drop-outs
- Students who graduated early
- Children at least five years old but younger than the mandatory school-start age for their State
- Some homeless and migrant children
Although these types of students were cited as a special circumstance to measurement of direct certification performance by a relatively small number of States, this circumstance is likely relevant to all States. It is difficult to gauge the scope of this problem because many States do not collect individual-level data on children in these circumstances. A limited number of States that identified this as an issue offered estimated numbers for some of these populations. This provided a useful first step in determining how these challenges affect State performance. However, no firm, comprehensive counts exist for the number of school-age SNAP participants who do not attend school. FNS continues to study the issue with the goal of developing procedures that would allow for adjustments to the statistics used in the direct certification performance measure in future years. Other limitations of the data and methodology used to calculate State performance rates are discussed in Appendix C.
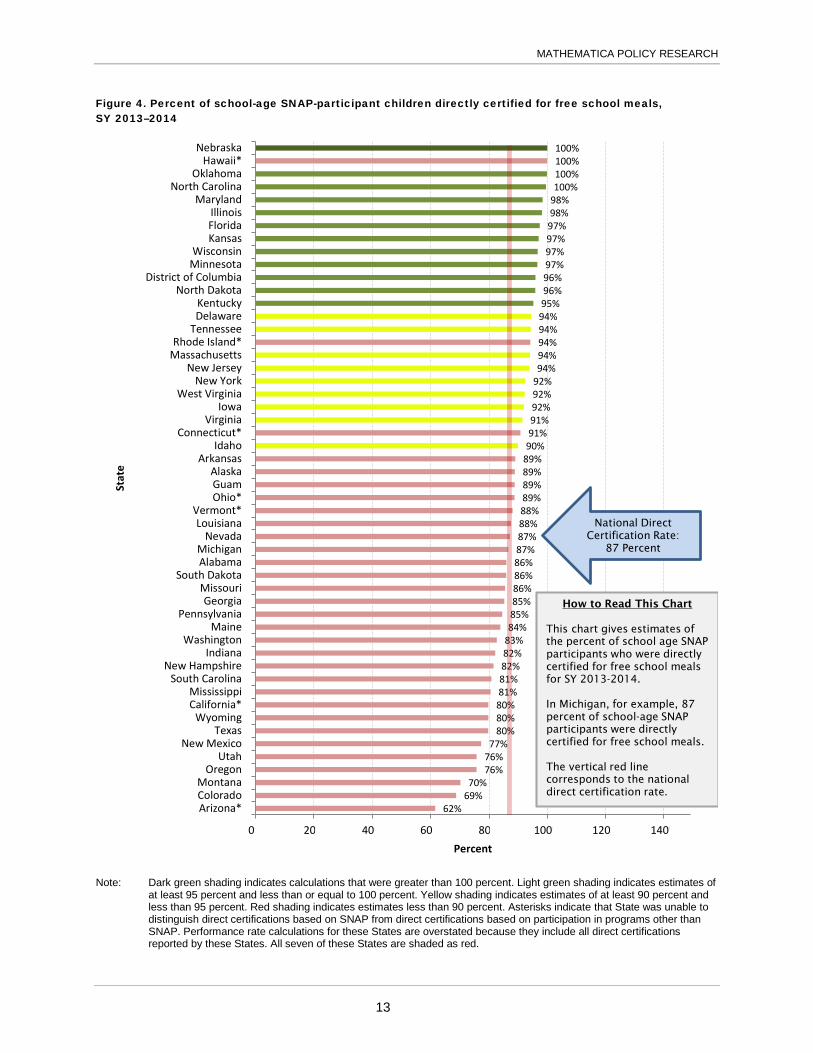
B. Calculations of State direct certification performance Figure 4 ranks the States according to this performance measure.17 When examining the
percentage values associated with the States, readers should keep in mind that special circumstances might affect the measurement of direct certification performance and each of the component statistics of the measure might be subject to reporting error. For this reason, this report focuses primarily on the States’ relative positions in the chart. States near the top of the chart are among the most successful at directly certifying SNAP-participant children for free school meals; relatively few SNAP households in those States are burdened with paper applications. Children from SNAP-participant households in those States are also among the least likely to be misclassified as ineligible for free school meals.
17 Seven States were unable to distinguish direct certifications based on SNAP from direct certifications based on participation in programs other than SNAP. The direct certification performance rate calculations for these States includes all direct certifications for these States, rather than only those that are based on SNAP. For each of the seven States, then, their rate will overstate their actual performance. The national direct certification rate is not strongly sensitive to the treatment of direct certifications in these States. If we assume that for these States the percentage of direct certifications that were based on SNAP is the same as the median State, the national direct certification performance rate is 86 percent rather than 87 percent. 12
MATHEMATICA POLICY RESEARCH
Figure 4. Percent of school-age SNAP-participant children directly certified for free school meals, SY 2013–2014
Note: Dark green shading indicates calculations that were greater than 100 percent. Light green shading indicates estimates of
at least 95 percent and less than or equal to 100 percent. Yellow shading indicates estimates of at least 90 percent and less than 95 percent. Red shading indicates estimates less than 90 percent. Asterisks indicate that State was unable to distinguish direct certifications based on SNAP from direct certifications based on participation in programs other than SNAP. Performance rate calculations for these States are overstated because they include all direct certifications reported by these States. All seven of these States are shaded as red.
62%69%70%
76%76%77%
80%80%80%81%81%82%82%83%84%85%85%86%86%86%87%87%88%88%89%89%89%89%90%91%91%92%92%92%94%94%94%94%94%95%96%96%97%97%97%97%98%98%100%100%100%100%
0% 20% 40% 60% 80% 100% 120% 140%
Arizona*ColoradoMontana
OregonUtah
New MexicoTexas
WyomingCalifornia*Mississippi
South CarolinaNew Hampshire
IndianaWashington
MainePennsylvania
GeorgiaMissouri
South DakotaAlabamaMichigan
NevadaLouisiana
Vermont*Ohio*GuamAlaska
ArkansasIdaho
Connecticut*Virginia
IowaWest Virginia
New YorkNew Jersey
MassachusettsRhode Island*
TennesseeDelawareKentucky
North DakotaDistrict of Columbia
MinnesotaWisconsin
KansasFloridaIllinois
MarylandNorth Carolina
OklahomaHawaii*
Nebraska
Percent
Stat
e
National DirectCertification Rate:
87 Percent
How to Read This Chart
This chart gives estimates of the percent of school age SNAP participants who were directly certified for free school meals for SY 2013-2014.
In Michigan, for example, 87 percent of school-age SNAP participants were directly certified for free school meals.
The vertical red line corresponds to the national direct certification rate.
13

MATHEMATICA POLICY RESEARCH
The States that fall near the bottom of the chart directly certify relatively few SNAP-participant children. However, by this measure alone, it is not possible to conclude that SNAP-participant children in these States are at particular risk of being denied free meal benefits. LEAs in these States could operate effective school meal application systems. What can be concluded is that SNAP households and LEAs or school administrators in these States are burdened with more administrative paperwork than their counterparts in other States.
The potential for errors in measurement and State reporting minimize the significance of small differences in the percentage point scores of States that fall near one another in Figure 4, but the wide gap between States near the bottom of the chart and those near the top makes clear that some States’ direct certification systems are simply less effective than other States’ systems. Among States and LEAs that rely on computer matching for direct certification, variation in direct certification effectiveness might be explained in part by differences in matching algorithms, use of probabilistic matching, the nature and quality of data used as input into the matching process, procedures for handling nonmatches, access to a supplemental student-level look-up system, or other system characteristics.
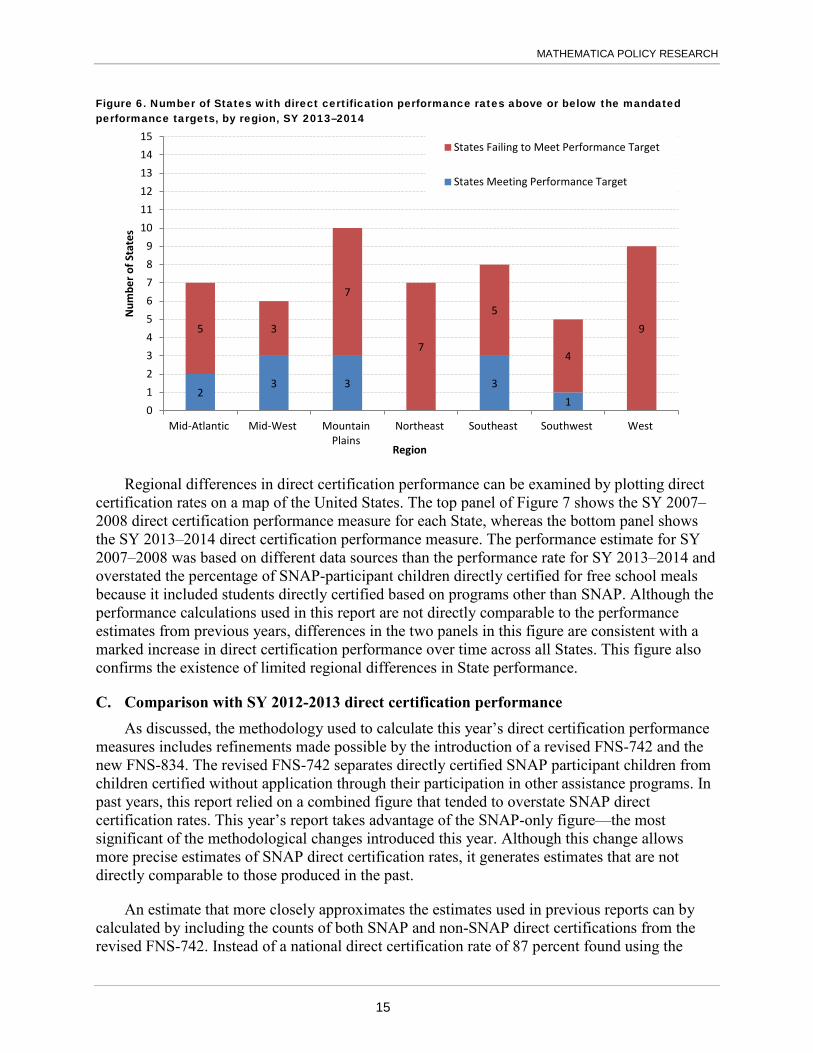
Figure 5 shows the number of States that met or exceeded the direct certification performance target established by HHFKA—95 percent for SY 2013–2014. Nationally, 12 States were at or above this benchmark.18 Regionally, there are differences in direct certification effectiveness (Figure 6). The seven regions shown in Figure 6 are those defined for FNS administrative purposes. The Mid-West, Mountain Plains and Southeast regions have the most States at or above the direct certification performance target in SY 2013–2014 with three each. No States in the Northeast region met the target.
Figure 5. Number of States meeting direct certification performance target set by the Healthy, Hunger-Free Kids Act, SY 2013–2014
18 Although Hawaii’s performance rate exceeded 95 percent, the State was not able to distinguish students directly certified based on SNAP benefit receipt from those based on other program participation. For this reason, Hawaii is not considered to have met the HHFKA-mandated performance target.
12
40
States Meeting Performance Target
States Failing to Meet PerformanceTarget
14
MATHEMATICA POLICY RESEARCH
Figure 6. Number of States with direct certification performance rates above or below the mandated performance targets, by region, SY 2013–2014
Regional differences in direct certification performance can be examined by plotting direct certification rates on a map of the United States. The top panel of Figure 7 shows the SY 2007–2008 direct certification performance measure for each State, whereas the bottom panel shows the SY 2013–2014 direct certification performance measure. The performance estimate for SY 2007–2008 was based on different data sources than the performance rate for SY 2013–2014 and overstated the percentage of SNAP-participant children directly certified for free school meals because it included students directly certified based on programs other than SNAP. Although the performance calculations used in this report are not directly comparable to the performance estimates from previous years, differences in the two panels in this figure are consistent with a marked increase in direct certification performance over time across all States. This figure also confirms the existence of limited regional differences in State performance.
C. Comparison with SY 2012-2013 direct certification performance As discussed, the methodology used to calculate this year’s direct certification performance
measures includes refinements made possible by the introduction of a revised FNS-742 and the new FNS-834. The revised FNS-742 separates directly certified SNAP participant children from children certified without application through their participation in other assistance programs. In past years, this report relied on a combined figure that tended to overstate SNAP direct certification rates. This year’s report takes advantage of the SNAP-only figure—the most significant of the methodological changes introduced this year. Although this change allows more precise estimates of SNAP direct certification rates, it generates estimates that are not directly comparable to those produced in the past.
An estimate that more closely approximates the estimates used in previous reports can by calculated by including the counts of both SNAP and non-SNAP direct certifications from the revised FNS-742. Instead of a national direct certification rate of 87 percent found using the
23 3 3
1
5 3
7
7
5
4
9
0123456789
101112131415
Mid-Atlantic Mid-West MountainPlains
Northeast Southeast Southwest West
Num
ber o
f Sta
tes
Region
States Failing to Meet Performance Target
States Meeting Performance Target
15

MATHEMATICA POLICY RESEARCH
Figure 7. Percent of SNAP-participant children directly certified for free school meals, by State
SY 2007–2008
SY 2013–2014
Note: In SY 2013-2014, Arizona, California, Connecticut, Hawaii, Ohio, Rhode Island, and Vermont could not distinguish direct certifications based on SNAP participation from direct certifications based on participation in programs other than SNAP. The resulting performance rates calculated for these States, therefore, overstate their actual performance.
Percent Directly Certified
0 - 59 (13)60 - 69 (15)
70 - 79 (12)80 - 89 (6)
90 - 94 (3)95 + (2)
Percent Directly Certified
0 - 59 (0)60 - 69 (2)
70 - 79 (4)80 - 89 (22)
90 - 94 (11)95 + (13)
16

MATHEMATICA POLICY RESEARCH
primary method, this alternate method generates a 95 percent national rate—6 percentage points higher than the rate in last year’s report. While it is important to not misinterpret this figure, it helps to confirm that States continue to improve their direct certification performance.
A more comprehensive measure of the States’ success in certifying all categorically eligible children for free school meals is developed next. This measure does not attempt to assess the effectiveness of the States’ direct certification systems. Instead, it measures the States’ success at certifying children, directly or by application, based on their participation in or association with any of the programs or institutions that confer categorical eligibility for free school meals.
The measure starts with the number of students who are directly certified based on SNAP participation. This is the same measure of directly certified SNAP participants used in the direct certification performance measure. Added to this are students directly certified based on participation in a program other than SNAP, students whose approval for free school meals is based on the household’s submission of a SNAP, TANF, or FDPIR case number on an NSLP application, students certified for free school meals based on the letter method, and SNAP children in special provision schools that are operating in non-base years.
This count of children identified as categorically eligible for free meals is divided by an estimate of the combined SNAP, TANF, and FDPIR populations. The SNAP population count used here is the same one used in the performance measure developed earlier. The number of children in households that receive TANF but not SNAP benefits is estimated from data found in the U.S. Census Bureau’s American Community Survey. The number of children who receive FDPIR benefits is estimated from FNS program and survey data.
Details of this computation are summarized in the following equation:
Percent of SNAP,
TANF, and FDPIR
participants certified
(directly or by
application) for free school meals
=
Children directly
certified for free school meals based
on SNAP
+
Children directly
certified for free school
meals based on programs other
than SNAP
+
Children certified for free
school meals based on
categorical eligibility by application
+
Children certified for free school meals
through the letter method
+
SNAP children in special provision schools
operating in non-base years
School-age children in
SNAP households
+
School-age children in
TANF households that
do not participate in
SNAP
+
School-age children in
FDPIR households
It is important to note that this measure may overstate the effectiveness of State efforts to ensure that all categorically eligible children are properly certified for free school meals for several reasons. Most importantly, many States and districts have improved their certification processes to directly or categorically certify children participating in programs other than SNAP, TANF, or FDPIR, such as those receiving foster care or those directly certified based on Medicaid data in States participating in the Direct Certification-Medicaid demonstration. While these are important improvements to direct certification systems, they will result in the measure overstating the percentage of SNAP, TANF, or FDPIR recipients who were certified because the measure includes children certified through other programs that allow for direct certification or
17
MATHEMATICA POLICY RESEARCH
confer categorical eligibility. In addition, the components of this measure are subject to reporting and estimation error. Please see Appendix C for further discussion of these limitations.
The components of the numerator and the sum of the values in the denominator are given for each State in Table 3. Figure 8 displays the same data graphically. For the 38 States at the top of Figure 8, the number of students certified using direct certification, application based on categorical eligibility, or letter method was at least 95 percent of the estimated number of school-age children categorically eligible for free school meals based on participation in SNAP, TANF or FDPIR. States at the bottom of Figure 8 are less successful at identifying and certifying these children.
18

MATHEMATICA POLICY RESEARCH
Table 3. Students eligible for direct or categorical certification: Number directly certified and number approved by application, SY 2013–2014 (thousands)
Number of children identified as categorically
eligible Directly certified based on SNAP
Directly certified based on other
programs
Categorically eligible, approved by application or
letter method
SNAP-participant students in
special provision schools
in a non-base year
U.S. total 16,153.3 11,246.1 1,187.0 1,699.2 2,099.7 Alabama 308.5 254.2 25.2 23.9 4.2 Alaska 36.6 17.9 8.9 1.0 8.6 Arizona 428.1 215.8 0.0 68.1 36.1 Arkansas 167.0 131.9 8.0 8.4 12.9 California 1870.4 1037.5 0.0 323.3 288.9 Colorado 205.6 131.1 16.1 24.8 0.0 Connecticut 117.5 69.0 0.0 15.8 30.0 Delaware 54.3 44.9 3.1 2.0 4.2 District of Columbia 37.6 9.1 0.9 1.2 25.3 Florida 975.8 790.8 177.1 92.8 122.2 Georgia 678.6 394.0 34.9 36.8 170.2 Hawaii 52.8 50.2 0.0 3.9 0.0 Idaho 84.6 71.3 3.5 2.6 0.6 Illinois 683.7 457.4 142.6 35.7 179.7 Indiana 336.1 241.6 16.6 38.4 24.0 Iowa 142.1 116.0 7.3 13.3 9.0 Kansas 110.7 102.1 12.4 3.4 0.0 Kentucky 256.3 160.9 51.4 14.0 75.6 Louisiana 314.7 270.9 11.1 38.0 0.0 Maine 62.2 49.6 3.1 6.1 0.0 Maryland 220.6 203.0 13.6 17.1 1.2 Massachusetts 240.3 181.1 21.4 38.8 32.3 Michigan 521.3 285.0 37.1 51.5 148.7 Minnesota 191.2 168.8 8.4 31.4 1.4 Mississippi 227.2 166.4 8.8 22.6 12.3 Missouri 308.7 255.0 13.6 30.0 0.0 Montana 41.2 23.2 0.8 6.3 4.0 Nebraska 67.0 43.1 5.9 3.9 21.7 Nevada 130.4 93.8 4.9 11.3 12.4 New Hampshire 37.3 27.6 1.8 5.7 0.0 New Jersey 309.2 263.7 14.3 47.4 1.4 New Mexico 175.5 67.8 7.8 19.3 62.7 New York 949.5 544.1 105.3 70.7 296.0 North Carolina 525.6 506.8 23.6 30.5 0.0 North Dakota 19.9 12.2 1.7 1.4 4.9 Ohio 598.9 399.1 0.0 69.7 111.6 Oklahoma 189.5 165.5 13.4 36.3 7.4 Oregon 222.5 148.9 20.8 27.4 13.7 Pennsylvania 567.4 372.9 90.8 35.3 77.2 Rhode Island 45.5 40.9 0.0 6.8 0.0 South Carolina 294.7 232.5 7.8 34.8 0.0 South Dakota 40.2 23.5 1.5 2.7 7.1 Tennessee 427.0 391.6 15.0 12.0 0.0 Texas 1725.1 1104.5 157.4 239.4 230.2 Utah 105.4 72.2 14.0 14.6 1.7 Vermont 24.6 19.8 0.0 3.5 0.5 Virginia 303.5 263.8 14.4 17.9 0.0 Washington 327.1 244.0 41.4 36.3 12.0 West Virginia 101.6 46.5 11.7 1.6 44.5 Wisconsin 275.3 250.9 7.2 18.7 2.5 Wyoming 17.1 12.1 0.6 0.7 0.4
Note: The U.S. total for each column may not equal the sum of the individual State values due to rounding. Counts of students directly certified based on other programs includes those directly certified based on administrative data available through Medicaid in States participating in the Direct Certification-Medicaid demonstration. These students may not be categorically eligible for free school meals.
19

MATHEMATICA POLICY RESEARCH
Figure 8. Percent of categorically eligible children certified for free school meals, SY 2013–2014
Note: Bars shaded dark blue represent estimates greater than 100 percent. See Appendix C for a discussion of data sources
and data limitations. Counts of students directly certified based on other programs includes those directly certified based on administrative data available through Medicaid in States participating in the Direct Certification-Medicaid demonstration. These students may not be categorically eligible for free school meals.
75%80%
83%84%
87%88%90%
92%92%93%94%94%94%95%95%95%96%97%97%97%97%97%98%98%98%99%100%100%100%100%100%100%100%100%100%100%100%100%100%100%100%100%100%100%100%100%100%100%100%100%100%
0% 20% 40% 60% 80% 100% 120% 140% 160% 180% 200%
ArizonaWyomingMontanaColorado
South DakotaCalifornia
New MexicoIdaho
MississippiSouth Carolina
GeorgiaNevada
New HampshireMaine
OregonIndiana
ArkansasMissouriVermont
OhioDistrict of Columbia
UtahVirginia
ConnecticutTennessee
AlaskaAlabama
DelawareMichigan
TexasNorth Dakota
WisconsinPennsylvania
LouisianaWashington
HawaiiIowa
West VirginiaRhode Island
New JerseyMaryland
KansasNorth Carolina
New YorkMinnesota
NebraskaMassachusetts
OklahomaKentucky
IllinoisFlorida
Percent
Stat
e
SNAP Direct Certifications
Other Direct Certifications
Categorical Certifications, Approvedby Application or Letter Method
Special Provision Certifications
National Certification Rate of Categorically
Eligible Children:100 Percent
How to Read This Chart
This chart gives estimates of the percent of categorically eligible children who were certified for free school meals by providing a SNAP, TANF, or FDPIR case number on a paper application and the percent who were directly certified.
For example, Oregon certified 95 percent of their categorically eligible students. 67 percent were certified by SNAP direct certification, 9 percent were certified by other direct certification, 12 percent were certified by application or the letter method, and 6 percent were special provision certifications.
The vertical red line corresponds to the national certification rate of categorically eligible children.
20

MATHEMATICA POLICY RESEARCH
V. Direct certification best practices
The FCEA requires a discussion of best practices with States that have successful direct certification programs. To fulfill this requirement, FNS contracted with Mathematica Policy Research to conduct interviews with child nutrition (CN) administrators from six States with successful direct certification programs and two direct certification experts. Mathematica also hosted a roundtable discussion among FNS, Mathematica, and CN officials from eight States.
States were selected to participate primarily on the basis of direct certification performance during SY 2013–2014 or because they showed noteworthy improvement in their direct certification performance rates from SY 2012–2013 to SY 2013–2014. In addition, the selection reflected the diverse perspectives of States in different parts of the country and included States that had not been highlighted in the report for the past few years.
We interviewed representatives from six States for this review: Arkansas, Idaho, Minnesota, New Hampshire, New Jersey, and North Carolina. Representatives from all six States, plus Florida and Virginia, also participated in the roundtable discussion. In addition, one expert, whom FNS contracted to provide training and direct certification technical assistance to States, was consulted. This expert was able to provide insight into current methods, best practices, and emerging trends in direct certification efforts across the country. Another expert, the assistant director for the Division of Family Development in New Jersey, provided perspective on the provision of monthly SNAP data for direct certification, as well as processes used to meet the new data collection requirements of the DER.
The rest of this chapter includes a description of State practices (Section A), recent and planned strategies for improving direct certification (Section B), best practices and suggested improvements in implementing direct certification systems (Section C), and challenges States face in meeting the direct certification rate target required by the HHFKA and complying with new data collection requirements also required by the HHFKA (Section D).
A. Description of State practices The primary goal of direct certification is to identify students who are categorically eligible
for free school meals and certify them as such without a household application. States can use information on children from households enrolled in qualifying programs, such as SNAP, TANF19 and FDPIR to determine categorical eligibility. A child’s status as a foster child; enrollee in a Head Start program; or certain homeless, migratory, or runaway children may also qualify them as categorically eligible for free school meals. In SY 2013–2014, six States were authorized to evaluate the use of Medicaid data for direct certification as part of a pilot demonstration.
19 TANF information can be used for direct certification of children for free school meals only in States with TANF income eligibility criteria comparable to or more restrictive than those in effect on June 1, 1995 (P.L. 104-193), when the Personal Responsibility and Work Opportunity Reconciliation Act of 1996 replaced Aid to Families with Dependent Children with TANF.
21

MATHEMATICA POLICY RESEARCH
Methods for conducting direct certification have evolved. Currently, there are two main methods for conducting direct certification:
1. Central matching system. A State agency uses computer matching to link administrative data from SNAP and other programs conferring categorical eligibility with student enrollment records and distributes match results to LEAs.20 In some States, LEAs initiate the match or access match results from the State-level central matching system. Methods vary, but LEAs typically access match results by downloading them from a State-level secure Web portal.
2. Local matching system. State agencies distribute administrative data from SNAP and other programs conferring categorical eligibility to LEAs, and LEAs match these data with their student enrollment lists.
Within these two primary matching methods, actual processes and procedures for direct certification vary considerably, even among States with the same general method of matching. Our review of State systems is similar to the reviews conducted in previous years, focusing on four key questions about direct certification:
1. Which administrative entity is responsible for matching SNAP/TANF records with student records (that is, does the State use central or local matching)?
2. How is a match made? What data elements and matching algorithms are used to form the match?
3. Is any attempt made to directly certify SNAP/TANF children initially unmatched or partially matched against school enrollment records?
4. When and how often are records matched?
Beginning with last year’s report, we also asked States about (1) the effectiveness of performance targets, awards, and CIPs as incentives for improving direct certification efforts; and (2) thoughts about revisions to the SFA VCR, the new DER, and the direct certification performance rate formula.
Table 4 summarizes State approaches for directly certifying students enrolled in public LEAs.
20 Central matching is sometimes referred to as State-level matching.
22
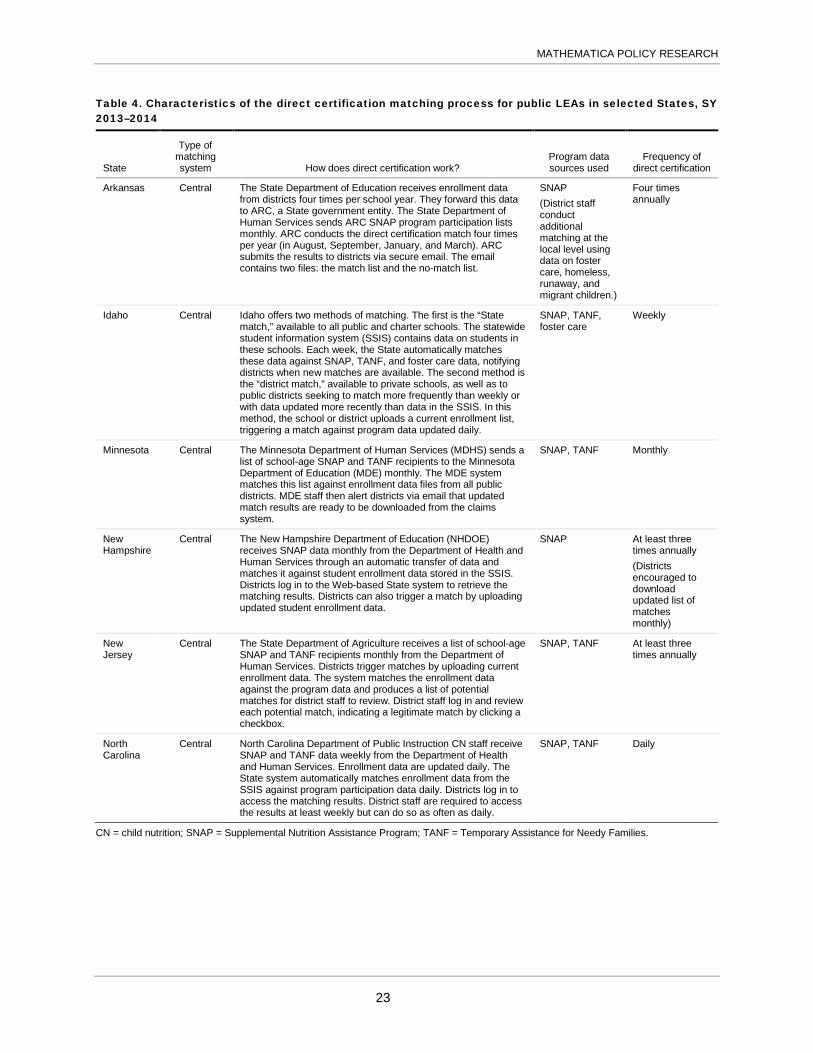
MATHEMATICA POLICY RESEARCH
Table 4. Characteristics of the direct certification matching process for public LEAs in selected States, SY 2013–2014
State
Type of matching system How does direct certification work?
Program data sources used
Frequency of direct certification
Arkansas Central The State Department of Education receives enrollment data from districts four times per school year. They forward this data to ARC, a State government entity. The State Department of Human Services sends ARC SNAP program participation lists monthly. ARC conducts the direct certification match four times per year (in August, September, January, and March). ARC submits the results to districts via secure email. The email contains two files: the match list and the no-match list.
SNAP (District staff conduct additional matching at the local level using data on foster care, homeless, runaway, and migrant children.)
Four times annually
Idaho Central Idaho offers two methods of matching. The first is the “State match,” available to all public and charter schools. The statewide student information system (SSIS) contains data on students in these schools. Each week, the State automatically matches these data against SNAP, TANF, and foster care data, notifying districts when new matches are available. The second method is the “district match,” available to private schools, as well as to public districts seeking to match more frequently than weekly or with data updated more recently than data in the SSIS. In this method, the school or district uploads a current enrollment list, triggering a match against program data updated daily.
SNAP, TANF, foster care
Weekly
Minnesota Central The Minnesota Department of Human Services (MDHS) sends a list of school-age SNAP and TANF recipients to the Minnesota Department of Education (MDE) monthly. The MDE system matches this list against enrollment data files from all public districts. MDE staff then alert districts via email that updated match results are ready to be downloaded from the claims system.
SNAP, TANF Monthly
New Hampshire
Central The New Hampshire Department of Education (NHDOE) receives SNAP data monthly from the Department of Health and Human Services through an automatic transfer of data and matches it against student enrollment data stored in the SSIS. Districts log in to the Web-based State system to retrieve the matching results. Districts can also trigger a match by uploading updated student enrollment data.
SNAP At least three times annually (Districts encouraged to download updated list of matches monthly)
New Jersey
Central The State Department of Agriculture receives a list of school-age SNAP and TANF recipients monthly from the Department of Human Services. Districts trigger matches by uploading current enrollment data. The system matches the enrollment data against the program data and produces a list of potential matches for district staff to review. District staff log in and review each potential match, indicating a legitimate match by clicking a checkbox.
SNAP, TANF At least three times annually
North Carolina
Central North Carolina Department of Public Instruction CN staff receive SNAP and TANF data weekly from the Department of Health and Human Services. Enrollment data are updated daily. The State system automatically matches enrollment data from the SSIS against program participation data daily. Districts log in to access the matching results. District staff are required to access the results at least weekly but can do so as often as daily.
SNAP, TANF Daily
CN = child nutrition; SNAP = Supplemental Nutrition Assistance Program; TANF = Temporary Assistance for Needy Families.
23

MATHEMATICA POLICY RESEARCH
Central or local matching All six States use central matching systems;21 about one-quarter of States around the country
use local matching for direct certification. The key distinctions between central and local matching are as follows:
• Central matching system. In central matching, a State agency (usually the CN agency) is responsible for a system that matches a list of children attending schools participating in the NSLP with a list of children in SNAP households. This system can be set up in several ways. For example:
- A State agency matches State enrollment information with a State list of children in SNAP households. A list of students directly certified on the basis of this match is forwarded to districts, which then notify the households.
- A State agency conducts an initial match and sends a list of matched students to districts, which then verify the matches, obtain further information on students who are potential matches, or conduct other types of secondary matching.
- Districts upload enrollment information into a State-maintained computer or Web-based system and then initiate a match against a list of children in SNAP households. Students are directly certified on the basis of this match.
• Local matching system. With local matching, districts have primary responsibility for matching, using at least one common identifier. District staff match a list of children enrolled in their schools with a list of children in SNAP households. Some States using local matching provide districts with a list limited to children in SNAP households in the district’s geographic area; others provide a full statewide list. Districts can use manual methods or their own computer systems to conduct matching.
The six States have sophisticated central matching systems with processes that have evolved to meet performance benchmarks. Most of the States feature multi-tiered matching rules and are planning technology and process improvements to extend the reach of direct certification in their States. Many States have utilized FNS direct certification grants to fund these improvements. Districts in each of these States play vital roles in initiating matching, confirming potential matches, extending categorical eligibility to other children in the household, and reporting on the VCR.
Overview of the matching process in six States For SY 2013–2014, all six States use central matching systems—the matching occurs on
State-maintained data systems. Many differences emerged among the systems, however, including the program data sources used, the source of the school enrollment data, and the specific algorithms used in matching. In five of the six States, the State Department of Education oversees direct certification. In one of these States (Arkansas), a separate State government entity conducts the actual matching. In New Jersey, the State Department of Agriculture runs the
21 The two additional States that participated in the roundtable discussion, Florida and Virginia, provided a perspective on local matching systems. In SY 2013–2014, Virginia used a local matching system. Florida used its direct certification grant to move from a local matching system to a central matching system.
24

MATHEMATICA POLICY RESEARCH
direct certification program. Four of the six States in this review use both SNAP and TANF data for direct certification. The exceptions are Arkansas and New Hampshire, which use only SNAP data in the State matching process. In Arkansas, although the primary matching method is at the State level, districts conduct additional matching at the local level using data on foster care, homeless, runaway, and migrant children.
All States studied for this report incorporated student name and date of birth (DOB) into the matching algorithm (Table 5). In New Hampshire, these were the only data elements used in the primary matching process (although districts can add additional data elements when triggering additional matches). Other States incorporated additional elements in their primary matching processes. For example, Idaho and New Jersey used parent name; Idaho, Minnesota, and North Carolina used gender. Two of the six States reported using Social Security numbers (SSNs) when available. Idaho was the only State using probabilistic and phonetic matching processes in SY 2013–2014, although other States plan to incorporate them in the future. In addition, most States incorporated multistage matching processes in which matching rules are applied in stepwise fashion, introducing additional data elements and/or lessening the stringency in the match rules. In the rest of this section, we describe the matching process, identifiers, and program data used to form direct certification matches.
Table 5. Primary matching criteria for States that use central matching systems
Arkansas Idaho Minnesota
New Hampshire New Jersey
North Carolina
First Name ● ○ ○ ● ○ ○
Last Name ● ○ ○ ● ○ ○
Middle Name/Initial ●
Date of Birth ● ○ ● ● ● ●
Social Security Number ● ●
Gender ○ ● ●
Address ○ ●
Zip Code/Location Code ○
Parents’ Names ○ ●
Eligibility System Personal ID Number ●
Eligibility System Family ID Number ●
Telephone Number ○ ●
Key: ○ Data elements can be exact or inexact matches to be used for direct certification. ● Data elements must be exact matches to be used for direct certification. No symbol indicates that the criterion is not used or not available.
Arkansas. The Arkansas Department of Education oversees the direct certification process but does not conduct the actual matching. In SY 2013–2014, the Arkansas Research Center
25
MATHEMATICA POLICY RESEARCH
(ARC)22 conducted the matching. ARC receives a list of SNAP participants ages 3 to 22 each month from the Department of Human Services. Public school districts and charter schools upload current enrollment data files in August, September, January, and March. After ARC staff receive updated enrollment data, they match the enrollment files against the most recent statewide SNAP file, matching on student first name, middle name, last name, SSN, and DOB, as well as parent first, middle, and last name. ARC staff divide each district enrollment file into a match list and a no-match list and send them to districts via secure email. District staff certify the students on the match list and check the no-match list for any students they believe should have been directly certified. Private schools participate in direct certification through a separate process, working directly with ARC staff.
In addition to the State-level matching process, districts in Arkansas conduct matching using data on foster care, homeless, runaway, and migrant children. Districts report students matched with these data sources as directly certified on the VCR form.
Idaho. The State Department of Education (SDE) oversees Idaho’s NSLP direct certification system. The Department of Health and Welfare provides SDE with updated SNAP, TANF, and foster care data daily through an automated process. The SSIS contains student information from public school districts and charter schools. These data are automatically updated monthly and contain first name, last name, DOB, gender, and zip code. Idaho operates two types of direct certification: (1) State matching, and (2) district matching.23
The State matching option occurs weekly and is fully automated. Each weekend, the State data system matches the most recent program participation data against the most recent enrollment data for each district. The system automatically generates emails to districts each week if new matches are available. District staff then log in to a secure Web site to download the results.
In the district matching option, schools or districts upload a current enrollment file and trigger a match against the most recent program participation data. School or district staff then download the matching results. Schools or districts use the district matching option for any of three reasons: (1) they want to obtain matching results using data updated more recently than the monthly SSIS data updates, (2) they want to obtain matching results using data elements not available in the SSIS, or (3) the SSIS did not contain data on their students (this is the case for private schools and other entities such as child care organizations). Public and charter schools participate in the State match option regardless of whether they also choose to use the district match method.
In both matching methods, the State system uses probabilistic matching to categorize students in the enrollment data into three categories: (1) definite matches, (2) possible matches, and (3) non-matches. State staff manually review possible matches to see if they can correct obvious data errors that would elevate them to definite matches. After the matching process is
22 ARC is a cross-agency team established in 2008 to link data for educational research. 23 In this report, both are considered central matching approaches because the State data system conducts the matching in both cases.
26

MATHEMATICA POLICY RESEARCH
complete, districts log in to the secure Web portal to access the results. District staff have several options when accessing the results:
1. They can choose to pull all the matches for the year or just the new matches made since the last time the district downloaded the results.
2. They can download just the absolute matches or both the definite and probable matches.
3. They can add additional student information to the records of the probable matches and resubmit them to see if they match.
4. They can look up the eligibility of individual students on the State system.
Minnesota. The MDE oversees the State’s central matching system. Districts upload student enrollment data in October and again in February. The MDHS sends updated data on SNAP and TANF participants to MDE each month. MDE staff manually initiate a computer matching process each month that compares the MDHS data against student enrollment data housed in the SSIS. Exact matches are made on first name, last name, DOB, and gender. Matches can also be made on the first four letters of the first name, first three letters of the last name, and exact on gender and DOB. Districts log in to a secure Web site to download the matching results. The results from the initial match for the school year (in July) contain all students who were matched. Results from subsequent months include only new matches.
Private schools do not participate in the SSIS but can participate in direct certification by sending enrollment files to MDE staff. MDE staff then manually match these data against the statewide SNAP participation data. Both the sending of the private school enrollment file and the receipt of the results are done via the Cyber-Linked Interactive Child Nutrition System secure Web portal.
New Hampshire. The New Hampshire Department of Health and Human Services uses an automated monthly process to submit updated SNAP participation data to NHDOE. Each month, NHDOE matches these data against student enrollment data housed in the SSIS and flags students who match exactly on name and DOB as direct certifications. Student enrollment data in the SSIS are updated twice annually—in October and again at the end of the school year. Districts log in to a secure Web portal to download the results. Most districts download updated results monthly, but all are required to do so at least three times annually. District staff can trigger additional matches by uploading updated enrollment data at any time during the year. They also can look up the eligibility of individual students using the State data portal. Private and charter schools are included in the SSIS and use the same processes for direct certification as do public schools.
New Jersey. The New Jersey Department of Agriculture operates the CN programs and oversees New Jersey’s direct certification system. The New Jersey Department of Human Services provides SNAP and TANF participation data at the beginning of every month. Districts trigger matches with these data by uploading enrollment data files to the State data system: the School Nutrition Electronic Application and Reimbursement System. Districts can trigger
27

MATHEMATICA POLICY RESEARCH
matches as often as they choose but must do so at least three times annually.24 The system identifies definite matches as those with exact matches on first name, last name, and DOB or the first three letters of the first name, the first four letters of the last name, and exact matches on DOB, parent name, address, and telephone number. The matching results provide a list of those students who match on a subset of data elements that district staff must review and then determine which are legitimate matches. District staff also may use the State system to look up the eligibility of individual students. Private and charter schools use the same process as public schools for direct certification.
North Carolina. North Carolina Department of Education (NCDOE) matches SNAP and TANF data against school enrollment data daily. School enrollment data are automatically updated in the SSIS in real time. The Department of Health and Human Services uses an automated weekly process to provide SNAP and TANF to NCDOE. NCDOE uses a hierarchical set of matching rules to obtain a definite match: (1) exact match on SSN; (2) exact matches on first name, last name, DOB, and gender; (3) matches on the first three letters of first name and exact matches last name, DOB, gender; and (4) matches on the first three letters of first name and last name and full matches on DOB and gender. Districts log in as often as daily to download the matching results. Matching results contain exact matches and partial matches. District staff can add additional data elements to the enrollment data for partially matched or unmatched students to attempt to obtain more matches. NCDOE monitors data used in direct certification carefully, correcting inconsistencies or data errors as they become apparent.
Private schools are not included in the SSIS. To participate in direct certification, they manually upload enrollment data to the State system. Their students are then included in the daily matching process.
Frequency of match The frequency of data matching is an important feature of direct certification systems.
Students transfer between schools throughout the school year, and families cycle on and off SNAP and other programs that confer categorical eligibility. Therefore, States must match repeatedly throughout each school year to maximize the number of matches among categorically eligible children. As described previously, federal regulations require States to match a minimum of three times per school year. Most States in this review match more frequently, and each State performs its first direct certification match before the beginning of the school year.
Matching frequency among the six States ranged from daily to the minimum requirement of three times annually. Three States conduct matching statewide on a predetermined schedule, with Arkansas matching four times per school year, Minnesota monthly, and North Carolina daily. New Jersey has no set State matching schedule; districts trigger matching by uploading enrollment data at least three times per school year.25 Idaho and New Hampshire combine these
24 Code of Federal Regulations, Application, eligibility and certification of children for free and reduced price meals and free milk, title 7, sec. 245.6(b)(3) requires that direct certification matching occur at least three times annually at specified times: near the beginning of the school year and again at 3 months and 6 months after the first match. 25 New Jersey encourages districts to trigger or download matches monthly but requires only three matches per school year in accordance with Code of Federal Regulations, title 7, sec. 245.6(b)(3).
28
MATHEMATICA POLICY RESEARCH
approaches, offering a set State matching schedule (weekly for Idaho and monthly for New Hampshire), and allowing districts to trigger additional matches more frequently at their discretion.
States cannot identify additional matches by matching more frequently than the underlying data are updated. For example, a State will not benefit from weekly matching unless at least one of the underlying data sources is updated at least weekly. The direct certification matching frequency that each of the six States uses coincides with the frequency with which it receives (or merges with) program data from its partner agencies. For most of these States, program participation data are updated more frequently than school enrollment data. Idaho receives program data updates daily, North Carolina receives updated data weekly, and the other four States receive updated program participation data monthly.
School enrollment data updates vary more widely. Three States have set schedules for enrollment data updates: Arkansas receives updates four times annually, Idaho receives monthly updates, and North Carolina receives daily updates. In the other three States, districts can decide when to submit enrollment data updates, within State requirements. In New Jersey, districts upload their enrollment data at least three times per year to the State data matching system. In Minnesota and New Hampshire, official, edited school enrollment data are uploaded twice a year (although both States are planning to use more frequently updated files in their SSIS for more up-to-date enrollment data in the future). Idaho also allowed districts to upload enrollment data if they wished to obtain match results using more recent data than the scheduled monthly updates.
Methods to directly certify unmatched SNAP children Most of the States researched for this report have processes for districts to identify and
resolve children enrolled in SNAP or TANF who are not matched to student enrollment records through the initial match procedure (Table 6). Idaho attempts to resolve partial matches at the State level by using probabilistic matching to identify potential matches. State staff then review these potential matches to determine whether they should be certified. North Carolina uses a similar method, except that district staff (rather than State staff) review partial matches. In New Jersey, district staff review all prospective matches—students cannot be directly certified until district staff approve the match. North Carolina allows districts to include additional data elements to enrollment records of unmatched students and resubmit them for matching. In the third approach, Idaho, New Jersey, and North Carolina offer district staff the ability to look up the eligibility of individual students by logging into the State system. None of the six States provides SNAP or other program participation data, such as a statewide no-match list, to districts for secondary matching. However, North Carolina plans to begin doing so in SY 2014–2015.
29
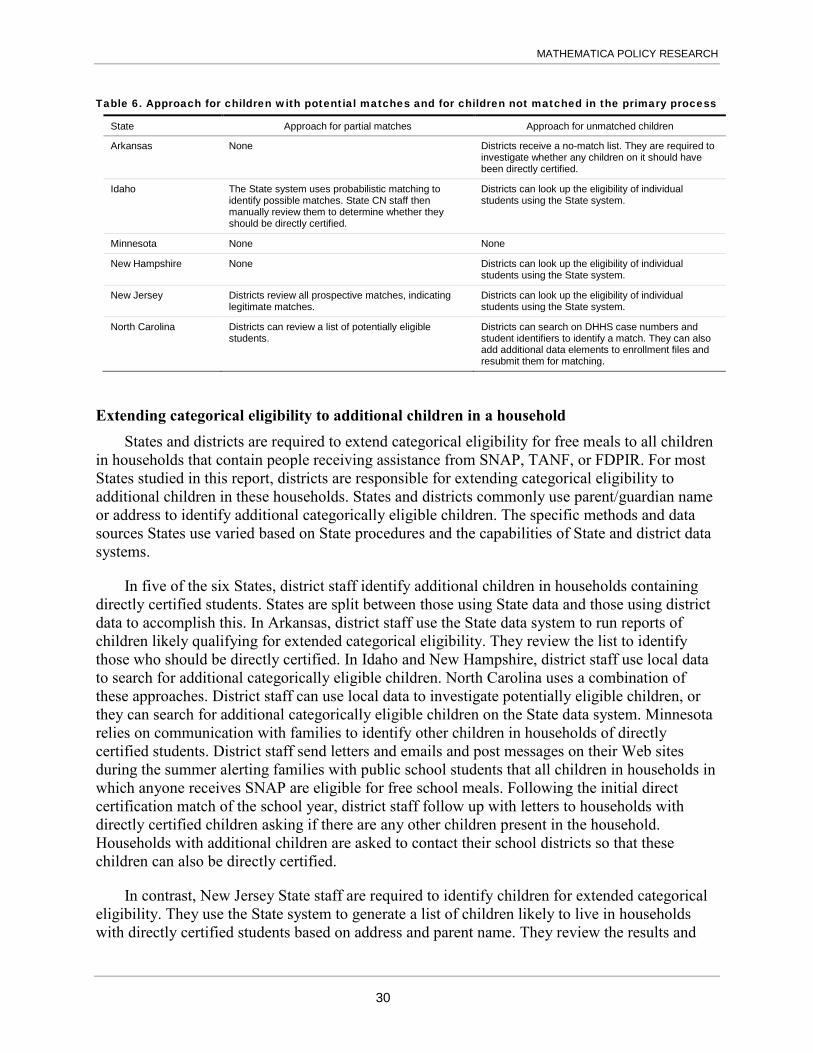
MATHEMATICA POLICY RESEARCH
Table 6. Approach for children with potential matches and for children not matched in the primary process
State Approach for partial matches Approach for unmatched children
Arkansas None Districts receive a no-match list. They are required to investigate whether any children on it should have been directly certified.
Idaho The State system uses probabilistic matching to identify possible matches. State CN staff then manually review them to determine whether they should be directly certified.
Districts can look up the eligibility of individual students using the State system.
Minnesota None None
New Hampshire None Districts can look up the eligibility of individual students using the State system.
New Jersey Districts review all prospective matches, indicating legitimate matches.
Districts can look up the eligibility of individual students using the State system.
North Carolina Districts can review a list of potentially eligible students.
Districts can search on DHHS case numbers and student identifiers to identify a match. They can also add additional data elements to enrollment files and resubmit them for matching.
Extending categorical eligibility to additional children in a household States and districts are required to extend categorical eligibility for free meals to all children
in households that contain people receiving assistance from SNAP, TANF, or FDPIR. For most States studied in this report, districts are responsible for extending categorical eligibility to additional children in these households. States and districts commonly use parent/guardian name or address to identify additional categorically eligible children. The specific methods and data sources States use varied based on State procedures and the capabilities of State and district data systems.
In five of the six States, district staff identify additional children in households containing directly certified students. States are split between those using State data and those using district data to accomplish this. In Arkansas, district staff use the State data system to run reports of children likely qualifying for extended categorical eligibility. They review the list to identify those who should be directly certified. In Idaho and New Hampshire, district staff use local data to search for additional categorically eligible children. North Carolina uses a combination of these approaches. District staff can use local data to investigate potentially eligible children, or they can search for additional categorically eligible children on the State data system. Minnesota relies on communication with families to identify other children in households of directly certified students. District staff send letters and emails and post messages on their Web sites during the summer alerting families with public school students that all children in households in which anyone receives SNAP are eligible for free school meals. Following the initial direct certification match of the school year, district staff follow up with letters to households with directly certified children asking if there are any other children present in the household. Households with additional children are asked to contact their school districts so that these children can also be directly certified.
In contrast, New Jersey State staff are required to identify children for extended categorical eligibility. They use the State system to generate a list of children likely to live in households with directly certified students based on address and parent name. They review the results and
30

MATHEMATICA POLICY RESEARCH
identify which students should be directly certified. They provide the results to district staff for final review and certification.
Direct certification process for nonpublic and charter schools Nonpublic and charter schools present special challenges for the direct certification process.
Both are schools of choice, often without defined enrollment areas for prospective students. In general, they also are smaller entities than public school districts. Charter schools may participate in direct certification by establishing themselves as independent reporting agencies or affiliating with an LEA, which acts as an authorizing agency for reporting purposes. States may find it difficult to incorporate private schools into their direct certification systems because, as nonpublic entities, they are not governed by the same regulations and reporting requirements as public schools.
For States studied for this report, the process for directly certifying students in participating charter schools was typically the same as the process for certifying public school students (Table 7). In Arkansas, charter schools submit enrollment data to the State four times per year and download results when the matching is complete. In Idaho, charter schools rely on either the State match or district match options. In North Carolina, charter school data are included in the daily match, enabling charter school staff to access updated results on a daily basis.
Table 7. Direct certification methods for private and charter schools
State Direct certification process for private and charter schools
Arkansas Charter schools participating in the NSLP participate in direct certification using the same system as other public schools. Private schools conduct direct certification directly with the Department of Human Services and do not interact with the Department of Education.
Idaho Charter schools participate using the same method as other public schools. Private schools, which do not use the SSIS, cannot use automatic State matching. Instead, they upload enrollment lists to trigger matches against program data. They can do this as often as they wish and are required to do so at least three times per year.
Minnesota State CN staff help private schools conduct direct certification. Because private school students are not in the SSIS and do not have statewide student identification numbers, schools upload enrollment files to the State system. State staff then conduct the matching manually.
New Hampshire Charter schools and private schools that receive Federal funding participate in direct certification using the same method as regular public schools. The SSIS contains their enrollment data.
New Jersey Private and charter schools use the same process as public school districts. All schools/school districts participating in direct certification log into a Web interface, upload enrollment data, and review prospective matches.
North Carolina Charter schools participating in the NSLP conduct direct certification using the same methods as other public schools. Private schools participate in direct certification by uploading enrollment data in Excel format to the State system. They do this at least three times per school year.
For two States—New Hampshire and New Jersey—charter and private schools use the same direct certification system as public school districts. In New Hampshire, charter and private schools are included in the State’s SSIS. Staff in these schools can download results monthly or trigger additional matches by uploading more current enrollment data. In New Jersey, charter and private schools upload enrollment data to trigger State matches just as public districts do.
31
MATHEMATICA POLICY RESEARCH
For the other four States, private schools cannot use the same methods as public districts because the matching methods rely on State data systems that exclude private schools. In Idaho, private schools cannot use the State match option, which relies on enrollment data in the State data system. Instead, they use the district match option (also available to public districts), in which private school staff upload enrollment data to trigger a match against program data. Private schools in North Carolina use a similar process. In Minnesota, private schools upload enrollment data, and State CN staff conduct direct certification manually. In Arkansas, private schools do not interact with the State CN office for direct certification. They work directly with the State Department of Human Services to conduct the matching.
B. Recent and planned strategies for improving direct certification Continuous improvement is a strong theme in direct certification programs. States strive to
improve their data systems and procedures within the constraints of financial and staff resources. All six States made recent changes to their direct certification programs and are planning additional improvements (Table 8). The most common type of change—reported by five of the six States—was improving direct certification data system capabilities. Idaho rolled out its State match option in SY 2012–2013. The same year, New Hampshire enhanced its SSIS to enable better tracking of students transferring between schools. For SY 2013–2014, Arkansas, New Jersey, and North Carolina all made improvements to their systems. Arkansas implemented an automated method of cleaning district enrollment data. New Jersey developed a feature in the State’s Web portal that allows State staff to generate lists of children likely to qualify for extended categorical eligibility. North Carolina added a feature on its portal that allows district staff to add enrollment data elements to students’ files to try to increase the number of matches.
Within the past two school years, two of the States increased their matching frequency. Minnesota adopted monthly matching in SY 2011–2012. The following year, Arkansas increased its matching frequency from annually to four times per year.
In SY 2013–2014, New Hampshire revised procedures that had impeded effective matching. Before that year, the State SNAP agency had given SNAP participants the option of opting out of direct certification, which resulted in an estimated 10 to 15 percent of school-age SNAP participants being left off the program participation data used in matching. State staff worked with FNS to resolve this problem. Beginning in SY 2013–2014, all school-age SNAP participants are included in the file used in matching, and families may opt out of meal benefits after being directly certified for them.
All six States also had additional improvements planned for future years, ranging from further system upgrades to procedural changes. One of the most common planned changes is incorporating additional data sources into direct certification. New Jersey plans to incorporate foster care data in SY 2014–2015. Minnesota reported exploring this possibility as well, though with no firm plans. New Hampshire plans to incorporate data on homeless and migrant children in SY 2014–2015.
32

MATHEMATICA POLICY RESEARCH
Table 8. Recent and planned strategies for improving direct certification
State Recent changes Planned changes
Arkansas Before SY 2013–2014, the State matched only once per year. Before SY 2013–2014, the Department of Education had to clean district enrollment data manually. It now has an automated process for this.
Arkansas will make the following changes in SY 2014–2015: The State will launch a Web portal where districts will be able to retrieve the matched and no-match lists. They will also be able to trigger matches against current SNAP data and conduct individual lookups of students’ eligibility. Arkansas State Department of Information Systems, rather than ARC, will conduct the matching. The State SNAP list will contain people ages 0–22 rather than 3–22. The State will use enrollment data updated weekly.
Idaho Idaho initiated the automatic State match option in SY 2012–2013. Idaho recently enhanced its probabilistic algorithm to incorporate phonetic matching.
Idaho plans to incorporate group matching, improved name matching, and other enhancements to probabilistic algorithm. The CN office hopes to work with the SNAP office to inform new SNAP recipients of their children’s eligibility for free school meals.
Minnesota Minnesota adopted monthly matching in SY 2011–2012. Beginning in SY 2014–2015, Minnesota will use all student data available on the SSIS for direct certification matching. In SY 2013–2014, the State only uses data files that districts have certified as final. This change will allow the matching process to use more recently updated enrollment data. State staff are exploring receiving program data more frequently than monthly and incorporating foster care data into direct certification.
New Hampshire The State Department of Health and Human Services previously allowed newly certified SNAP participants to opt out of being included in the program data file delivered to the Department of Education for direct certification matching. This removed 10 to 15 percent of school-age SNAP participants from the direct certification process. Beginning in SY 2013–2014, the opt-out option occurs upon certification for school meal benefits. In 2012, the State upgraded its SSIS to better track intrastate transfers.
The State plans to incorporate data on homeless and migrant children into the direct certification process when rolling out the Community Eligibility Provision (CEP) beginning in SY 2014–2015. (This will likely not improve New Hampshire’s direct certification performance rate but may improve program access.)
New Jersey In SY 2013–2014, New Jersey added a feature to the Web portal allowing State staff to generate a list of students sharing addresses or parent names with directly certified students. It provides these lists to district staff so they can extend categorical eligibility.
In SY 2014–2015, New Jersey plans to incorporate foster care data into its direct certification system. New Jersey plans to incorporate probabilistic matching, as well as Soundex and name variation functionality, in SY 2014–2015.
North Carolina In SY 2013–2014, North Carolina added an option in the Web portal for district staff to add additional data elements to their enrollment data to try to identify additional matches beyond those captured in the primary match.
In SY 2014–2015, districts will have access to elements of the SNAP and TANF data for children in their county and will be able to review possible matches. In SY 2014–2015, the State system will use an enhanced matching algorithm. The system will incorporate Soundex and inexact matching. It also will suggest candidates for extended categorical eligibility based on address and parent/guardian name. Beginning in SY 2014–2015, the State will no longer be able to use SSN for direct certification matching, due to State statute.
Most States also reported planning changes to their direct certification procedures (Table 8). In SY 2014–2015, North Carolina plans to give district staff access to SNAP and TANF data elements for children in their counties to conduct secondary matching. Idaho SDE staff plans to work with staff in the State SNAP office to inform all new SNAP recipients of their children’s
33
MATHEMATICA POLICY RESEARCH
eligibility for free school meals. Arkansas and Minnesota both plan changes to how they use existing data sources. Beginning in SY 2014–2015, Arkansas plans to expand the age range of the SNAP data used for direct certification from 3–22 to 0–22. Minnesota plans to begin using the most recently updated student enrollment data available on the SSIS for matching. In SY 2013–2014 and in earlier years, the State only used SSIS data for matching after districts had completed the data review process. The review process improved data quality, but it delayed the availability of data for matching.
Three States in this review reported planning enhancements to their matching algorithms. Idaho plans to incorporate more complex matching algorithms and improved name matching. New Jersey plans to introduce probabilistic matching, as well as Soundex and name variation functionality. North Carolina also plans to add Soundex matching, as well as probabilistic matching.
Two States reported planning additional data system enhancements. In SY 2014–2015, Arkansas plans to roll out a Web portal where district staff can retrieve the matching results, rather than waiting to receive the results via secure email. The portal also will contain an individual lookup option for districts. In the same year, North Carolina plans an upgrade to the State data system that will allow staff to generate a list of students who likely qualify for extended categorical eligibility.
Finally, Arkansas has planned an administrative change to its direct certification system. Beginning in SY 2014–2015, the State Department of Information Systems will assume responsibility for conducting direct certification matching, rather than ARC, which conducted it in SY 2013–2014.
C. Best practices in implementation of direct certification systems Advice for low-performing States in meeting performance targets
Section 101(b) of the HHFKA requires that States develop CIPs if they do not meet the direct certification performance rate benchmarks. The CIPs must include a step-by-step plan for implementing changes that will improve direct certification rates. In the best practice interviews, State SNAP staff were asked what suggestions they would offer to staff in a low-performing State in developing a CIP. Experts in direct certification were also consulted on this topic. Five of the six States provided suggestions, which can be grouped into three categories: (1) administrative practices, (2) direct certification procedures, and (3) system capabilities (Table 9).
Staff in three States commented on administrative practices in their advice to States seeking to improve their direct certification performance. Staff in New Jersey and North Carolina stressed the importance of strong interagency relationships. New Jersey staff advised initiating direct certification reforms by holding a meeting with agency partners so that all stakeholders understand the direct certification system and their specific roles. Staff in North Carolina had similar advice, noting that State SNAP staff may play essential roles in direct certification even if it is not a core mission of their agency. Strong relationships can help them keep in mind the importance of their role in direct certification. New Jersey staff stressed the importance of realistic goal setting, noting that enacting changes in interagency activities can take years. States including plans to reform administrative aspects of direct certification systems in their CIPs
34
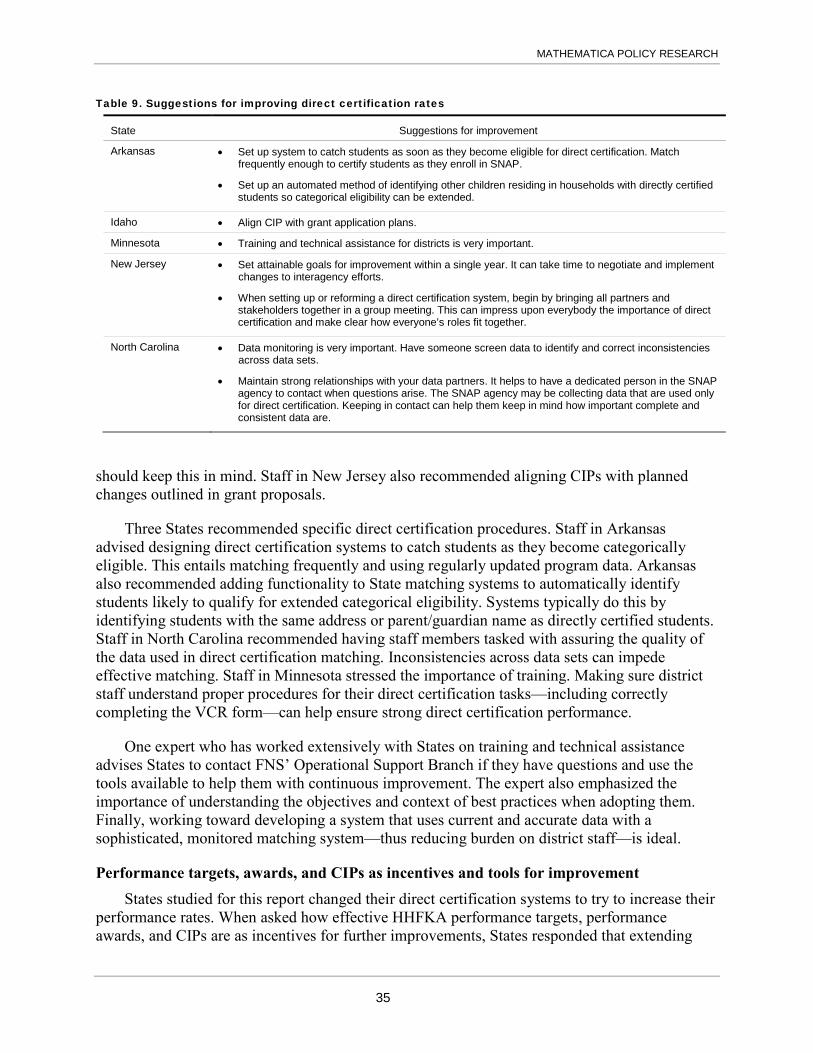
MATHEMATICA POLICY RESEARCH
Table 9. Suggestions for improving direct certification rates
State Suggestions for improvement
Arkansas • Set up system to catch students as soon as they become eligible for direct certification. Match frequently enough to certify students as they enroll in SNAP.
• Set up an automated method of identifying other children residing in households with directly certified students so categorical eligibility can be extended.
Idaho • Align CIP with grant application plans.
Minnesota • Training and technical assistance for districts is very important.
New Jersey • Set attainable goals for improvement within a single year. It can take time to negotiate and implement changes to interagency efforts.
• When setting up or reforming a direct certification system, begin by bringing all partners and stakeholders together in a group meeting. This can impress upon everybody the importance of direct certification and make clear how everyone’s roles fit together.
North Carolina • Data monitoring is very important. Have someone screen data to identify and correct inconsistencies across data sets.
• Maintain strong relationships with your data partners. It helps to have a dedicated person in the SNAP agency to contact when questions arise. The SNAP agency may be collecting data that are used only for direct certification. Keeping in contact can help them keep in mind how important complete and consistent data are.
should keep this in mind. Staff in New Jersey also recommended aligning CIPs with planned changes outlined in grant proposals.
Three States recommended specific direct certification procedures. Staff in Arkansas advised designing direct certification systems to catch students as they become categorically eligible. This entails matching frequently and using regularly updated program data. Arkansas also recommended adding functionality to State matching systems to automatically identify students likely to qualify for extended categorical eligibility. Systems typically do this by identifying students with the same address or parent/guardian name as directly certified students. Staff in North Carolina recommended having staff members tasked with assuring the quality of the data used in direct certification matching. Inconsistencies across data sets can impede effective matching. Staff in Minnesota stressed the importance of training. Making sure district staff understand proper procedures for their direct certification tasks—including correctly completing the VCR form—can help ensure strong direct certification performance.
One expert who has worked extensively with States on training and technical assistance advises States to contact FNS’ Operational Support Branch if they have questions and use the tools available to help them with continuous improvement. The expert also emphasized the importance of understanding the objectives and context of best practices when adopting them. Finally, working toward developing a system that uses current and accurate data with a sophisticated, monitored matching system—thus reducing burden on district staff—is ideal.
Performance targets, awards, and CIPs as incentives and tools for improvement States studied for this report changed their direct certification systems to try to increase their
performance rates. When asked how effective HHFKA performance targets, performance awards, and CIPs are as incentives for further improvements, States responded that extending
35

MATHEMATICA POLICY RESEARCH
meal benefits to children who need them was their primary incentive. State staff appreciate recognition for strong performance—and the related performance awards as an incentive—but the real commitment to direct certification comes from staff recognition of the importance of the program. Staff in several States said the Federal mandates helped them demonstrate the importance of direct certification to colleagues in other State agencies. Respondents in Minnesota reported that the Federal requirements elevated direct certification as a priority within the State. Staff in New Jersey said it made it easier to secure cooperation from agency partners.
However, staff in several States expressed frustration with the Federal mandate, citing factors beyond their control that constrain performance. In particular, some staff did not believe five percent was a sufficient cushion to account for the share of school-age SNAP participants who did not attend NSLP-participating schools. Staff in one State suggested that being found noncompliant with program rules due to factors program staff could not change was problematic.
In December 2012, FNS issued the “CIP Development Guide” to help States design and implement a CIP that would help them achieve the desired performance improvements. The first step in the guide is for the State agency to perform a self-assessment using a tool that lists components and features of strong direct certification systems. In the interviews, the State staff were asked whether they were familiar with the tool and whether they had used it to plan changes to their direct certification system. Staff in all six States were familiar with the tool, and most found it helpful, particularly for prompting them to think about areas for improvement they may not have previously focused on. One staff member described it as a useful comprehensive framework for thinking about improvements to direct certification systems.
Staff in a few States highlighted some uncertainties regarding the CIP tool. Staff in one State found useful ideas in the tool, but were unclear on the specific expectations FNS had for CIPs. Although the CIP was designed to encompass improvement efforts spanning multiple years, staff in one State were unsure whether this was the case and reported challenges in aligning their long-term reform plans with the CIP.
D. Challenges in meeting performance rate targets HHFKA mandated that States meet direct certification performance targets that have
increased annually since SY 2011-2012. For SY 2013–2014 and future years, the direct certification performance target rate is 95 percent. This means that 95 percent of children in households receiving SNAP benefits must be directly certified for free school meals (95 percent of program records must be matched to student enrollment records). During interviews with State staff, we asked about the challenges they have experienced, or believe they might experience, in meeting this performance rate target. Direct certification operations comprise complex processes, which States across the country continue to refine. As States encounter technological and administrative challenges to effective and efficient operations, they enact new procedures and invest in upgraded IT tools and systems. As Table 10 shows, all States identified at least one challenge they were working to overcome in meeting the performance target. Challenges States cited fell into three distinct categories: (1) data sharing and governance, (2) school-age SNAP recipients not attending NSLP schools, and (3) transfer students.
The most commonly cited type of challenge pertained to data sharing and other interagency operations. In many States, the office conducting the match and responsible for the performance 36

MATHEMATICA POLICY RESEARCH
Table 10. Challenges identified by States in meeting direct certification rate target
Arkansas Idaho Minnesota New
Hampshire New Jersey North Carolina
Incorporating data from divergent sources
Private schools participating in NSLP but not integrated into State data systems
SNAP agency overhauled data system
Name variations
Large homeschooled population
Many charter schools do not participate in NSLP
Virtual students
Frequent student transfers
rate does not control the underlying data. Staff in one State described being at the “mercy” of the entities controlling the data. Although all States in this review described their relationships with other agencies partners as productive and collaborative, staff in several States pointed out that those agencies had their own priorities. North Carolina staff described how the State SNAP agency’s overhaul of its data system led to delays in processing SNAP applications, impeding effective direct certification for more than six months. New Jersey staff stated that data security concerns can make agency and district partners reluctant to share certain data elements.
The second most common type of challenge States reported was school-age SNAP recipients who did not attend NSLP-participating schools. These children appear in the denominator of the performance rate calculation but are not reported on the VCR form. Arkansas, Idaho, and North Carolina cited large homeschooled populations as a barrier to meeting the performance rate target. North Carolina staff reported that many charter schools do not participate in the NSLP; therefore, children from SNAP households attending these schools cannot be directly certified. Idaho has a large population of virtual students, who attend classes online. The State is able to identify these students and could potentially match them against the SNAP list. However, because they are not associated with LEAs, they are not reported on the VCR and are therefore not included in the performance rate calculation.
The last type of challenge States cited was intrastate transfers. New Hampshire staff reported that a significant portion of students transfer between schools throughout the year. They observed that children likely to be eligible for free meals may be more likely to transfer. The
37

MATHEMATICA POLICY RESEARCH
State has made system enhancements to improve its ability to track transfer students, but it remains a challenge.
Challenges in meeting new data collection requirements This year, the key data elements used to determine the effectiveness of State direct
certification efforts were collected and reported in a different way. Specifically, the revised VCR form now collects the count of children from SNAP households directly certified for free school meals (cell 3-2B). The new DER form collects two data elements separately: State SNAP agencies report the number of school-age children in SNAP households (Data Element #2); State NSLP agencies report the number of SNAP children in special provision schools operating in a non-base year and CEP schools (Data Element #3). States reported some challenges adopting the new VCR and DER data collection forms. Difficulties primarily pertained to the transition rather than to intrinsic difficulties with the forms themselves. The most common challenge was conducting the training necessary to ensure district staff completed the VCR form correctly. Staff in Minnesota conducted statewide webinars and worked with schools individually to ensure accurate data reports. New Jersey reported particular challenges getting district staff to enter the correct count of students for the CEP and Special Provision 2/3 fields of the VCR. North Carolina staff said the timing of transition left them very little time to reprogram their data systems to support the new forms.
Two States also reported challenges with the DER form. The SNAP agency in Minnesota had difficulty providing the count of school-age children in households receiving SNAP benefits resulting from confusion over exactly what number was required. MDE worked closely with the SNAP agency to understand the requirement and to correct the information on the forms. Other States reported no difficulty obtaining this number. New Jersey SNAP staff reported that they identified the data needed for Data Element #2 by deduplicating the SNAP file they provided earlier to the Department of Agriculture for direct certification. New Jersey did report confusion in identifying the count of children in households receiving SNAP benefits attending CEP, Provision 2, or Provision 3 schools during nonbase years, however. North Carolina anticipated similar challenges in SY 2014–2015 when that State will adopt CEP in some districts. North Carolina expects that with more training and new software catching up to the changes that any initial difficulties with the new forms will be eased in subsequent years. Despite the challenges associated with adopting the new data collection forms, staff in North Carolina commented that the new direct certification performance rate calculation would be easier to interpret. The new forms allow States to understand more clearly which data elements are used in the calculation compared to the formula used in previous years.
Other direct certification challenges Some States reported challenges in obtaining participation data from programs other than
SNAP. Although this challenge would not likely affect their performance rates, it nonetheless impedes effective direct certification of categorically eligible students. North Carolina has had difficulty securing a data-sharing agreement that would allow it to incorporate foster care data into direct certification. New Jersey has been unable to incorporate data from FDPIR into direct certification for similar reasons.
38
MATHEMATICA POLICY RESEARCH
VI. Conclusion
The number of students with access to free school meals continues to grow with the expanded use of direct certification and the improved performance of direct certification systems. As of SY 2013–2014, 99 percent of students nationwide are enrolled in districts that conduct direct certification.
For this report, the methodology for calculating direct certification performance was refined from the methodology used in previous reports in order to make use of new data elements collected in the revised VCR (FNS-742) and the new DER (FNS-834). Based on the calculations, States and LEAs directly certified 87 percent of school-age children from SNAP-participant households in SY 2013–2014. Twelve States achieved direct certification rates of at least 95 percent, the direct certification target set by HHFKA for SY 2013–2014. No States had a direct certification rate lower than 60 percent. The direct certification performance rate in SY 2012–2013 was estimated at 89 percent; however, this estimate was based on different data sources and overstated the percentage of SNAP-participant children directly certified for free school meals because it included students directly certified based on programs other than SNAP.
States and LEAs continue to find success with different direct certification models. States and LEAs are making investments in their direct certification systems that promise improved performance in the coming years. Among the six states, recent direct certification changes that States link to performance improvements most commonly involved improving data system capabilities. Examples of such improvements include increasing automation, adding additional matching options for districts, and implementing better procedures for identifying children likely to qualify for extended categorical eligibility. Two States also recently increased matching frequency. States made many of these changes to help meet the performance benchmark set forth in HHFKA, which will remain at 95 percent in future years. In discussions surrounding challenges to meeting these benchmarks in future years, States frequently cited difficulties inherent in matching data from different sources. File layout and data entry protocols can vary between program participation and school enrollment data, impeding effective matching. Additionally, the agency responsible for matching typically does not control the matching data. States also cited the inability of direct certification improvement measures to account for children who receive SNAP benefits but who are not enrolled in schools and thus not eligible for direct certification. These students include home-schooled children, school dropouts, and some homeless and migrant children. Changes that States and LEAs make to their direct certification systems as they continue to seek new ways to address these challenges likely will affect direct certification rates in coming years.
39

MATHEMATICA POLICY RESEARCH
VII. References
Bartlett, Susan, and Nancy Burstein. “Food Stamp Program Access Study: Eligible Nonparticipants.” Washington, DC: Abt Associates, Inc., 2004. Available at [http://webarchives.cdlib.org/sw1m04028n/http://www.ers.usda.gov/publications/efan03013/efan03013-2].
Eslami, Esa, and Karen Cunnyngham. “Supplemental Nutrition Assistance Program Participation Rates: Fiscal Years 2010 and 2011.” Report submitted to the U.S. Department of Agriculture, Food and Nutrition Service. Washington, DC: Mathematica Policy Research, 2014. Available at [http://www.fns.usda.gov/sites/default/files/trends2010-2011.pdf].
Eslami, Esa. “Trends in Supplemental Nutrition Assistance Program Participation Rates: Fiscal Years 2010 to 2012.” Report submitted to the U.S. Department of Agriculture, Food and Nutrition Service. Washington, DC: Mathematica Policy Research, 2014. Available at [http://www.fns.usda.gov/sites/default/files/ops/Trends2010-2012.pdf].
Mabli, James, Stephen Tordella, Laura Castner, Thomas Godfrey, and Priscilla Foran. “Dynamics of Food Stamp Program Participation in the Mid-2000s.” Report submitted to the U.S. Department of Agriculture, Food and Nutrition Service. Washington, DC: Mathematica Policy Research, 2011. Available at [http://www.fns.usda.gov/sites/default/files/DynamicsMid2000.pdf].
Trippe, Carole, and Bruce Schechter. “Assets of Low-Income Households by SNAP Eligibility and Participation in 2010.” Report submitted to the U.S. Department of Agriculture, Food and Nutrition Service. Washington, DC: Mathematica Policy Research, 2010. Available at [http://www.mathematica-mpr.com/~/media/publications/pdfs/nutrition/low-income_households2010.pdf].
Trippe, Carole, and Jessica Gillooly. “Noncash Categorical Eligibility for SNAP: State Policies and the Number and Characteristics of SNAP Households Categorically Eligible Through Those Policies: Final Memo.” Report submitted to the U.S. Department of Agriculture, Food and Nutrition Service. Washington, DC: Mathematica Policy Research, 2010. Available at [http://www.mathematica-mpr.com/~/media/publications/pdfs/nutrition/non-cash_snap.pdf].
U.S. Census Bureau. “American Community Survey, Puerto Rico Community Survey, 2011 Subject Definitions.” Washington, DC: U.S. Census Bureau, 2012. Available at [http://www.census.gov/acs/www/Downloads/data_documentation/SubjectDefinitions/2012_ACSSubjectDefinitions.pdf].
U.S. Department of Agriculture, Food and Nutrition Service. FNS Handbook 310: Supplemental Nutrition Assistance Program Quality Control Review Handbook. Washington, DC: USDA, FNS, 2012. Available at [http://www.fns.usda.gov/sites/default/files/ FNS_310_Handbook.pdf].
41

MATHEMATICA POLICY RESEARCH
U.S. Department of Education, National Center for Education Statistics, Institute of Education Sciences. “Issue Brief: 1.5 Million Homeschooled Students in the United States in 2007.” Washington, DC: ED, NCES, IES, 2008. Available at [http://nces.ed.gov/pubs2009/2009030.pdf].
Usher, Charles L., David S. Shanklin, and Judith B. Wildfire. “Evaluation of the Food Distribution Program on Indian Reservations.” Washington, DC: U.S. Department of Agriculture, Food and Nutrition Service, 1990. Available at [http://www.fns.usda.gov/evaluation-food-distribution-program-indian-reservations-volume-i-final-report].
42
APPENDIX A
ADDITIONAL TABLES AND FIGURES


MATHEMATICA POLICY RESEARCH
Table A.1.a. Number and percent of LEAs that directly certified categorically eligible students, SY 2004–2005 through SY 2006–2007
SY 2004–2005 SY 2005–2006 SY 2006–2007
Direct certification or Provision 2/3
LEAs
Direct certification or Provision 2/3
LEAs
Direct certification or Provision 2/3
LEAs
Number of LEAs Number Percent
Number of LEAs Number Percent
Number of LEAs Number Percent
U.S. Total 16,612 9,239 55.6 17,397 10,467 60.2 17,748 11,113 62.6 Alabama 163 62 38.0 148 87 58.8 145 93 64.1 Alaska 54 43 79.6 35 34 97.1 47 43 91.5 Arizona 302 251 83.1 333 243 73.0 334 256 76.6 Arkansas 251 247 98.4 258 12 4.6 281 256 91.1 California 1,004 399 39.7 1,033 469 45.4 1,024 518 50.6 Colorado 178 44 24.7 168 68 40.5 205 78 38.0 Connecticut 185 146 78.9 187 148 79.1 193 161 83.4 Delaware 27 22 81.5 34 28 82.4 32 28 87.5 District of Columbia
47 1 2.1
51 4 7.8
52 2 3.8
Florida 145 74 51.0 96 62 64.6 145 88 60.7 Georgia 171 155 90.6 175 158 90.3 183 166 90.7 Guam NA NA NA NA NA NA NA NA NA Hawaii NA NA NA 32 18 56.2 38 20 52.6 Idaho 125 97 77.6 266 218 82.0 133 106 79.7 Illinois 1,036 749 72.3 1,113 835 75.0 1,075 839 78.0 Indiana 407 73 17.9 468 106 22.6 478 143 29.9 Iowa 496 339 68.4 508 372 73.2 507 383 75.5 Kansas 403 314 77.9 404 333 82.4 403 335 83.1 Kentucky 197 128 65.0 192 145 75.5 189 154 81.5 Louisiana 98 57 58.2 36 34 94.4 107 92 86.0 Maine 245 199 81.2 228 194 85.1 233 201 86.3 Maryland 47 29 61.7 47 29 61.7 46 31 67.4 Massachusetts NA NA NA 357 216 60.5 370 232 62.7 Michigan 741 331 44.7 698 349 50.0 803 449 55.9 Minnesota 610 392 64.3 620 387 62.4 630 413 65.6 Mississippi 183 93 50.8 72 47 65.3 184 134 72.8 Missouri 762 453 59.4 711 476 67.0 749 490 65.4 Montana 236 130 55.1 233 159 68.2 234 177 75.6 Nebraska 407 241 59.2 433 313 72.3 381 290 76.1 Nevada 40 35 87.5 39 34 87.2 19 15 79.0 New Hampshire 82 57 69.5 88 65 73.9 89 60 67.4 New Jersey 661 159 24.0 661 185 28.0 663 206 31.1 New Mexico 142 98 69.0 150 118 78.7 167 119 71.3 New York 1,096 797 72.7 1,054 889 84.4 1,042 857 82.2 North Carolina NA NA NA 172 117 68.0 178 133 74.7 North Dakota 160 126 78.8 216 170 78.7 193 142 73.6 Ohio 1,093 178 16.3 1,196 302 25.2 1,129 223 19.8 Oklahoma 533 248 46.5 613 322 52.5 573 333 58.1 Oregon 205 166 81.0 227 178 78.4 232 185 79.7 Pennsylvania 724 368 50.8 776 458 59.0 826 501 60.6 Rhode Island NA NA NA 55 47 85.4 55 50 90.9 South Carolina 86 85 98.8 85 83 97.6 88 84 95.4 South Dakota 223 119 53.4 227 127 56.0 221 127 57.5 Tennessee 169 132 78.1 175 154 88.0 171 144 84.2 Texas 1,202 741 61.6 1,026 797 77.7 1,189 839 70.6 Utah 51 45 88.2 53 50 94.3 49 45 91.8 Vermont 204 186 91.2 217 200 92.2 215 201 93.5 Virginia 160 136 85.0 141 138 97.9 152 139 91.4 Washington 292 215 73.6 345 260 75.4 330 260 78.8 West Virginia 73 54 74.0 68 54 79.4 73 55 75.3 Wisconsin 842 177 21.0 823 138 16.8 840 180 21.4 Wyoming 54 48 88.9 54 37 68.5 53 37 69.8
Note: Figures for school years before SY 2013–2014 may differ from previous reports due to changes in data submitted by States.
A.3

MATHEMATICA POLICY RESEARCH
Table A.1.b. Number and percent of LEAs that directly certified categorically eligible students, SY 2007–2008 through SY 2009–2010
SY 2007–2008 SY 2008–2009 SY 2009–2010
Direct certification or Provision 2/3
LEAs
Direct certification or Provision 2/3
LEAs
Direct certification or Provision 2/3
LEAs
Number of LEAs Number Percent
Number of LEAs Number Percent
Number of LEAs Number Percent
U.S. Total 18,141 12,097 66.7 18,253 14,301 78.3 18,461 15,258 82.6 Alabama 147 110 74.8 150 134 89.3 151 137 90.7 Alaska 50 46 92.0 48 47 97.9 49 48 98.0 Arizona 372 307 82.5 388 327 84.3 428 357 83.4 Arkansas 286 252 88.1 295 280 94.9 300 265 88.3 California 1,028 555 54.0 1,029 676 65.7 1,057 839 79.4 Colorado 175 81 46.3 205 181 88.3 218 202 92.7 Connecticut 192 161 83.8 191 169 88.5 188 174 92.6 Delaware 29 27 93.1 35 30 85.7 34 31 91.2 District of Columbia
58 2 3.4
61 2 3.3
62 61 98.4
Florida 159 98 61.6 164 107 65.2 170 122 71.8 Georgia 216 187 86.6 215 190 88.4 221 199 90.0 Guam NA NA NA NA NA NA NA NA NA Hawaii 36 22 61.1 40 26 65.0 37 26 70.3 Idaho 121 106 87.6 139 121 87.0 142 103 72.5 Illinois 1,115 904 81.1 1,114 928 83.3 1,123 880 78.4 Indiana 482 184 38.2 487 341 70.0 498 405 81.3 Iowa 499 393 78.8 494 424 85.8 495 421 85.0 Kansas 403 327 81.1 407 348 85.5 405 345 85.2 Kentucky 193 171 88.6 190 170 89.5 197 176 89.3 Louisiana 112 95 84.8 117 105 89.7 109 95 87.2 Maine 246 223 90.6 235 213 90.6 194 177 91.2 Maryland 48 40 83.3 47 39 83.0 49 42 85.7 Massachusetts 357 245 68.6 423 305 72.1 431 303 70.3 Michigan 836 570 68.2 846 693 81.9 855 717 83.9 Minnesota 650 433 66.6 663 448 67.6 662 457 69.0 Mississippi 179 144 80.4 179 151 84.4 177 157 88.7 Missouri 756 510 67.5 744 615 82.7 765 678 88.6 Montana 244 188 77.0 241 182 75.5 239 190 79.5 Nebraska 381 297 78.0 382 285 74.6 383 304 79.4 Nevada 20 16 80.0 19 16 84.2 18 17 94.4 New Hampshire 92 65 70.6 95 64 67.4 94 75 79.8 New Jersey 660 247 37.4 662 551 83.2 677 619 91.4 New Mexico 189 135 71.4 171 166 97.1 176 132 75.0 New York 1,083 951 87.8 1,072 935 87.2 1,113 989 88.9 North Carolina 170 141 82.9 169 144 85.2 165 151 91.5 North Dakota 223 170 76.2 217 158 72.8 202 171 84.6 Ohio 1,166 258 22.1 1,172 745 63.6 1,188 816 68.7 Oklahoma 568 373 65.7 565 429 75.9 566 458 80.9 Oregon 235 183 77.9 237 188 79.3 245 196 80.0 Pennsylvania 837 523 62.5 855 623 72.9 851 730 85.8 Rhode Island 53 50 94.3 32 31 96.9 55 53 96.4 South Carolina 87 84 96.6 96 85 88.5 93 85 91.4 South Dakota 222 128 57.7 215 145 67.4 216 196 90.7 Tennessee 168 142 84.5 167 153 91.6 165 149 90.3 Texas 1,264 989 78.2 1,264 1,110 87.8 1,263 1,119 88.6 Utah 55 51 92.7 64 56 87.5 75 72 96.0 Vermont 219 194 88.6 214 189 88.3 225 205 91.1 Virginia 151 139 92.0 150 138 92.0 153 141 92.2 Washington 325 266 81.8 314 272 86.6 329 286 86.9 West Virginia 75 55 73.3 74 55 74.3 73 55 75.3 Wisconsin 853 218 25.6 847 474 56.0 822 584 71.0 Wyoming 56 41 73.2 53 37 69.8 58 48 82.8
Note: Figures for school years before SY 2013–2014 may differ from previous reports due to changes in data submitted by States.
A.4
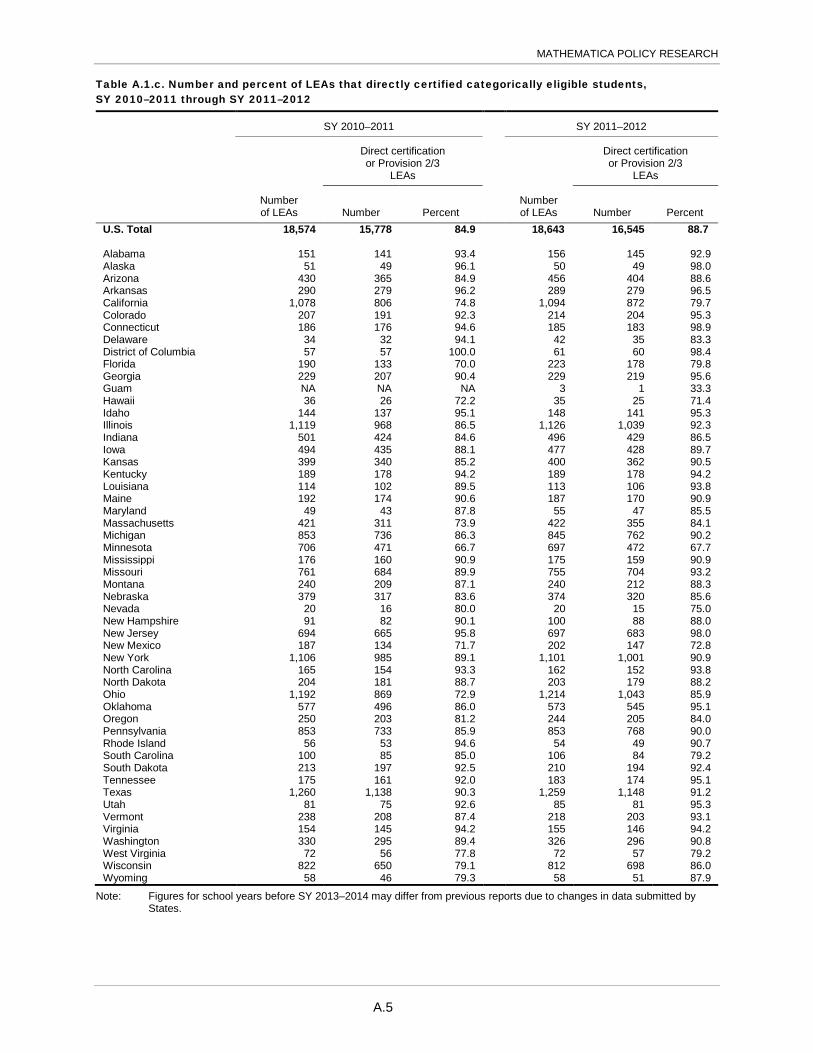
MATHEMATICA POLICY RESEARCH
Table A.1.c. Number and percent of LEAs that directly certified categorically eligible students, SY 2010–2011 through SY 2011–2012
SY 2010–2011 SY 2011–2012
Direct certification or Provision 2/3
LEAs
Direct certification or Provision 2/3
LEAs
Number of LEAs Number Percent
Number of LEAs Number Percent
U.S. Total 18,574 15,778 84.9 18,643 16,545 88.7 Alabama 151 141 93.4 156 145 92.9 Alaska 51 49 96.1 50 49 98.0 Arizona 430 365 84.9 456 404 88.6 Arkansas 290 279 96.2 289 279 96.5 California 1,078 806 74.8 1,094 872 79.7 Colorado 207 191 92.3 214 204 95.3 Connecticut 186 176 94.6 185 183 98.9 Delaware 34 32 94.1 42 35 83.3 District of Columbia 57 57 100.0 61 60 98.4 Florida 190 133 70.0 223 178 79.8 Georgia 229 207 90.4 229 219 95.6 Guam NA NA NA 3 1 33.3 Hawaii 36 26 72.2 35 25 71.4 Idaho 144 137 95.1 148 141 95.3 Illinois 1,119 968 86.5 1,126 1,039 92.3 Indiana 501 424 84.6 496 429 86.5 Iowa 494 435 88.1 477 428 89.7 Kansas 399 340 85.2 400 362 90.5 Kentucky 189 178 94.2 189 178 94.2 Louisiana 114 102 89.5 113 106 93.8 Maine 192 174 90.6 187 170 90.9 Maryland 49 43 87.8 55 47 85.5 Massachusetts 421 311 73.9 422 355 84.1 Michigan 853 736 86.3 845 762 90.2 Minnesota 706 471 66.7 697 472 67.7 Mississippi 176 160 90.9 175 159 90.9 Missouri 761 684 89.9 755 704 93.2 Montana 240 209 87.1 240 212 88.3 Nebraska 379 317 83.6 374 320 85.6 Nevada 20 16 80.0 20 15 75.0 New Hampshire 91 82 90.1 100 88 88.0 New Jersey 694 665 95.8 697 683 98.0 New Mexico 187 134 71.7 202 147 72.8 New York 1,106 985 89.1 1,101 1,001 90.9 North Carolina 165 154 93.3 162 152 93.8 North Dakota 204 181 88.7 203 179 88.2 Ohio 1,192 869 72.9 1,214 1,043 85.9 Oklahoma 577 496 86.0 573 545 95.1 Oregon 250 203 81.2 244 205 84.0 Pennsylvania 853 733 85.9 853 768 90.0 Rhode Island 56 53 94.6 54 49 90.7 South Carolina 100 85 85.0 106 84 79.2 South Dakota 213 197 92.5 210 194 92.4 Tennessee 175 161 92.0 183 174 95.1 Texas 1,260 1,138 90.3 1,259 1,148 91.2 Utah 81 75 92.6 85 81 95.3 Vermont 238 208 87.4 218 203 93.1 Virginia 154 145 94.2 155 146 94.2 Washington 330 295 89.4 326 296 90.8 West Virginia 72 56 77.8 72 57 79.2 Wisconsin 822 650 79.1 812 698 86.0 Wyoming 58 46 79.3 58 51 87.9
Note: Figures for school years before SY 2013–2014 may differ from previous reports due to changes in data submitted by States.
A.5
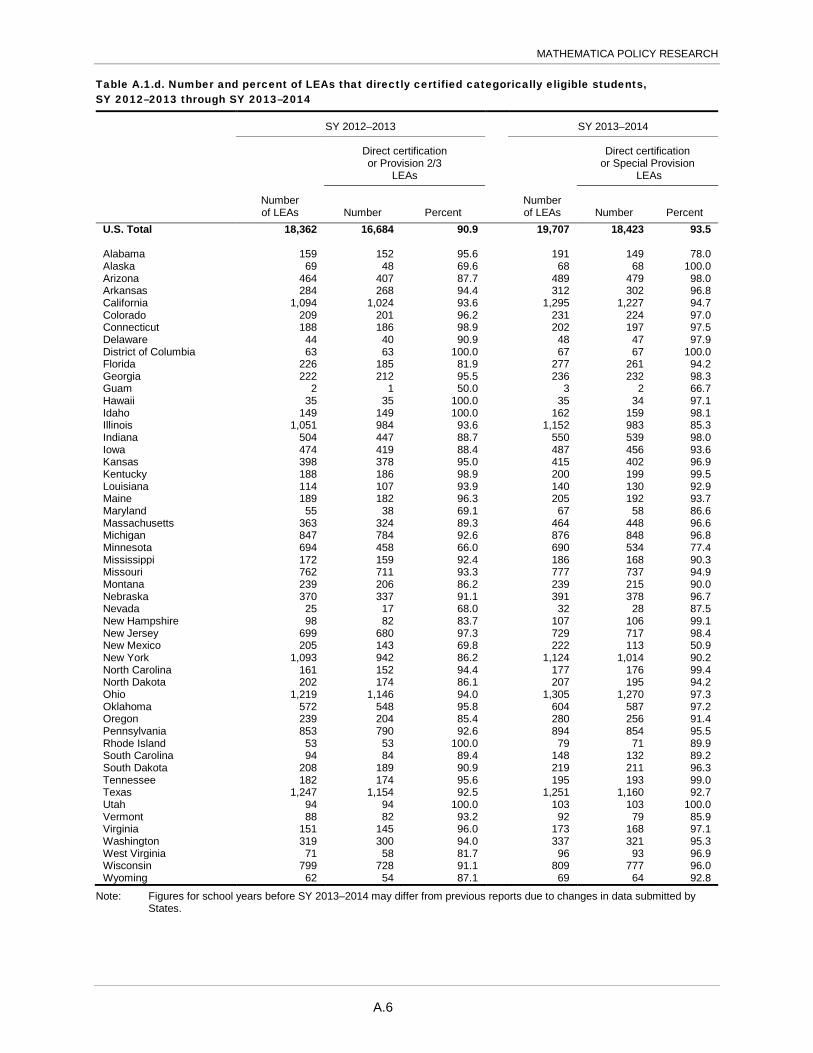
MATHEMATICA POLICY RESEARCH
Table A.1.d. Number and percent of LEAs that directly certified categorically eligible students, SY 2012–2013 through SY 2013–2014
SY 2012–2013 SY 2013–2014
Direct certification or Provision 2/3
LEAs
Direct certification or Special Provision
LEAs
Number of LEAs Number Percent
Number of LEAs Number Percent
U.S. Total 18,362 16,684 90.9 19,707 18,423 93.5 Alabama 159 152 95.6 191 149 78.0 Alaska 69 48 69.6 68 68 100.0 Arizona 464 407 87.7 489 479 98.0 Arkansas 284 268 94.4 312 302 96.8 California 1,094 1,024 93.6 1,295 1,227 94.7 Colorado 209 201 96.2 231 224 97.0 Connecticut 188 186 98.9 202 197 97.5 Delaware 44 40 90.9 48 47 97.9 District of Columbia 63 63 100.0 67 67 100.0 Florida 226 185 81.9 277 261 94.2 Georgia 222 212 95.5 236 232 98.3 Guam 2 1 50.0 3 2 66.7 Hawaii 35 35 100.0 35 34 97.1 Idaho 149 149 100.0 162 159 98.1 Illinois 1,051 984 93.6 1,152 983 85.3 Indiana 504 447 88.7 550 539 98.0 Iowa 474 419 88.4 487 456 93.6 Kansas 398 378 95.0 415 402 96.9 Kentucky 188 186 98.9 200 199 99.5 Louisiana 114 107 93.9 140 130 92.9 Maine 189 182 96.3 205 192 93.7 Maryland 55 38 69.1 67 58 86.6 Massachusetts 363 324 89.3 464 448 96.6 Michigan 847 784 92.6 876 848 96.8 Minnesota 694 458 66.0 690 534 77.4 Mississippi 172 159 92.4 186 168 90.3 Missouri 762 711 93.3 777 737 94.9 Montana 239 206 86.2 239 215 90.0 Nebraska 370 337 91.1 391 378 96.7 Nevada 25 17 68.0 32 28 87.5 New Hampshire 98 82 83.7 107 106 99.1 New Jersey 699 680 97.3 729 717 98.4 New Mexico 205 143 69.8 222 113 50.9 New York 1,093 942 86.2 1,124 1,014 90.2 North Carolina 161 152 94.4 177 176 99.4 North Dakota 202 174 86.1 207 195 94.2 Ohio 1,219 1,146 94.0 1,305 1,270 97.3 Oklahoma 572 548 95.8 604 587 97.2 Oregon 239 204 85.4 280 256 91.4 Pennsylvania 853 790 92.6 894 854 95.5 Rhode Island 53 53 100.0 79 71 89.9 South Carolina 94 84 89.4 148 132 89.2 South Dakota 208 189 90.9 219 211 96.3 Tennessee 182 174 95.6 195 193 99.0 Texas 1,247 1,154 92.5 1,251 1,160 92.7 Utah 94 94 100.0 103 103 100.0 Vermont 88 82 93.2 92 79 85.9 Virginia 151 145 96.0 173 168 97.1 Washington 319 300 94.0 337 321 95.3 West Virginia 71 58 81.7 96 93 96.9 Wisconsin 799 728 91.1 809 777 96.0 Wyoming 62 54 87.1 69 64 92.8
Note: Figures for school years before SY 2013–2014 may differ from previous reports due to changes in data submitted by States.
A.6

MATHEMATICA POLICY RESEARCH
Table A.2.a. Number and percent of LEAs that directly certified categorically eligible students, excluding Special Provision LEAs, SY 2004–2005 through SY 2006–2007
SY 2004–2005 SY 2005–2006 SY 2006–2007
Direct certification LEAs
Direct certification LEAs
Direct certification LEAs
Number of non-
Provision 2/3 LEAs Number Percent
Number of non-
Provision 2/3 LEAs Number Percent
Number of non-
Provision 2/3 LEAs Number Percent
U.S. Total 16,389 9,016 55.0 17,048 10,118 59.4 17,382 10,747 61.8 Alabama 163 62 38.0 148 87 58.8 145 93 64.1 Alaska 44 33 75.0 35 34 97.1 44 40 90.9 Arizona 302 251 83.1 333 243 73.0 334 256 76.7 Arkansas 242 238 98.4 247 1 0.4 270 245 90.7 California 991 386 39.0 1,005 441 43.9 976 470 48.2 Colorado 173 39 22.5 168 68 40.5 205 78 38.1 Connecticut 185 146 78.9 187 148 79.1 193 161 83.4 Delaware 27 22 81.5 34 28 82.4 32 28 87.5 District of Columbia
47 1 2.1
51 4 7.8
52 2 3.9
Florida 145 74 51.0 96 62 64.6 145 88 60.7 Georgia 170 154 90.6 174 157 90.2 181 164 90.6 Guam NA NA NA 32 18 56.3 38 20 52.6 Hawaii 495 338 68.3 507 371 73.2 506 382 75.5 Idaho 1,035 748 72.3 1,112 834 75.0 1,074 838 78.0 Illinois 407 73 17.9 467 105 22.5 478 143 29.9 Indiana 403 314 77.9 404 333 82.4 403 335 83.1 Iowa 125 97 77.6 266 218 82.0 133 106 79.7 Kansas 194 125 64.4 188 141 75.0 183 148 80.9 Kentucky 97 56 57.7 36 34 94.4 107 92 86.0 Louisiana NA NA NA 357 216 60.5 370 232 62.7 Maine 741 331 44.7 698 349 50.0 803 449 55.9 Maryland 239 193 80.8 228 194 85.1 233 201 86.3 Massachusetts 47 29 61.7 47 29 61.7 45 30 66.7 Michigan 610 392 64.3 620 387 62.4 630 413 65.6 Minnesota 759 450 59.3 711 476 67.0 749 490 65.4 Mississippi 236 130 55.1 233 159 68.2 234 177 75.6 Missouri 163 73 44.8 60 35 58.3 168 118 70.2 Montana NA NA NA 172 117 68.0 178 133 74.7 Nebraska 82 57 69.5 88 65 73.9 89 60 67.4 Nevada 1,090 791 72.6 945 780 82.5 937 752 80.3 New Hampshire 653 151 23.1 654 178 27.2 656 199 30.3 New Jersey 93 49 52.7 88 56 63.6 104 56 53.9 New Mexico 39 34 87.2 39 34 87.2 19 15 79.0 New York 1,090 175 16.1 1,189 295 24.8 1,125 219 19.5 North Carolina 160 126 78.8 199 153 76.9 193 142 73.6 North Dakota 405 239 59.0 433 313 72.3 381 290 76.1 Ohio 499 214 42.9 579 288 49.7 539 299 55.5 Oklahoma 203 164 80.8 217 168 77.4 222 175 78.8 Oregon 723 367 50.8 773 455 58.9 823 498 60.5 Pennsylvania NA NA NA 55 47 85.5 55 50 90.9 Rhode Island 86 85 98.8 85 83 97.7 88 84 95.5 South Carolina 194 90 46.4 188 88 46.8 187 93 49.7 South Dakota 169 132 78.1 175 154 88.0 171 144 84.2 Tennessee 1,198 737 61.5 1,026 797 77.7 1,189 839 70.6 Texas 50 44 88.0 51 48 94.1 49 45 91.8 Utah 160 136 85.0 141 138 97.9 151 138 91.4 Vermont 291 214 73.5 345 260 75.4 322 252 78.3 Virginia 204 186 91.2 217 200 92.2 215 201 93.5 Washington 833 168 20.2 823 138 16.8 832 172 20.7 West Virginia 54 48 88.9 54 37 68.5 53 37 69.8 Wisconsin 73 54 74.0 68 54 79.4 73 55 75.3 Wyoming 0 0 0.0 0 0 0.0 0 0 0.0
Note: Figures for school years before SY 2013–2014 may differ from previous reports due to changes in data submitted by States.
A.7

MATHEMATICA POLICY RESEARCH
Table A.2.b. Number and percent of LEAs that directly certified categorically eligible students, excluding Special Provision LEAs, SY 2007–2008 through SY 2009–2010
SY 2007–2008 SY 2008–2009 SY 2009–2010
Direct certification LEAs
Direct certification LEAs
Direct certification LEAs
Number of non-
Provision 2/3 LEAs Number Percent
Number of non-
Provision 2/3 LEAs Number Percent
Number of non-
Provision 2/3 LEAs Number Percent
U.S. Total 17,560 11,516 65.6 17,644 13,692 77.6 17,886 14,667 82.0 Alabama 142 105 73.9 145 129 89.0 148 134 90.5 Alaska 43 39 90.7 38 37 97.4 41 40 97.6 Arizona 338 273 80.8 359 298 83.0 406 335 82.5 Arkansas 271 237 87.5 279 264 94.6 284 249 87.7 California 980 507 51.7 982 629 64.1 1,004 786 78.3 Colorado 175 81 46.3 204 180 88.2 208 192 92.3 Connecticut 192 161 83.9 191 169 88.5 188 174 92.6 Delaware 29 27 93.1 35 30 85.7 33 30 90.9 District of Columbia
58 2 3.5
61 2 3.3
62 61 98.4
Florida 159 98 61.6 164 107 65.2 170 122 71.8 Georgia 189 160 84.7 191 166 86.9 200 178 89.0 Guam 36 22 61.1 40 26 65.0 37 26 70.3 Hawaii 499 393 78.8 493 423 85.8 495 421 85.1 Idaho 1,114 903 81.1 1,112 926 83.3 1,121 878 78.3 Illinois 482 184 38.2 487 341 70.0 498 405 81.3 Indiana 403 327 81.1 407 348 85.5 405 345 85.2 Iowa 120 105 87.5 135 117 86.7 138 99 71.7 Kansas 190 168 88.4 186 166 89.3 194 173 89.2 Kentucky 111 94 84.7 117 105 89.7 109 95 87.2 Louisiana 356 244 68.5 423 305 72.1 431 303 70.3 Maine 836 570 68.2 846 693 81.9 855 717 83.9 Maryland 239 216 90.4 229 207 90.4 188 172 91.5 Massachusetts 47 39 83.0 47 39 83.0 49 42 85.7 Michigan 642 425 66.2 653 438 67.1 656 451 68.8 Minnesota 756 510 67.5 744 615 82.7 765 678 88.6 Mississippi 227 171 75.3 223 164 73.5 220 171 77.7 Missouri 167 132 79.0 167 139 83.2 164 144 87.8 Montana 170 141 82.9 169 144 85.2 165 151 91.5 Nebraska 92 65 70.7 95 64 67.4 94 75 79.8 Nevada 963 831 86.3 950 813 85.6 987 863 87.4 New Hampshire 658 245 37.2 661 550 83.2 677 619 91.4 New Jersey 106 52 49.1 67 62 92.5 104 60 57.7 New Mexico 20 16 80.0 19 16 84.2 18 17 94.4 New York 1,161 253 21.8 1,166 739 63.4 1,181 809 68.5 North Carolina 202 149 73.8 196 137 69.9 196 150 76.5 North Dakota 381 297 78.0 382 285 74.6 381 302 79.3 Ohio 540 345 63.9 530 394 74.3 538 430 79.9 Oklahoma 232 180 77.6 229 180 78.6 238 189 79.4 Oregon 834 520 62.4 852 620 72.8 850 729 85.8 Pennsylvania 53 50 94.3 32 31 96.9 54 52 96.3 Rhode Island 87 84 96.6 96 85 88.5 93 85 91.4 South Carolina 184 90 48.9 179 109 60.9 173 153 88.4 South Dakota 168 142 84.5 167 153 91.6 165 149 90.3 Tennessee 1,184 909 76.8 1,194 1,040 87.1 1,187 1,043 87.9 Texas 55 51 92.7 64 56 87.5 75 72 96.0 Utah 151 139 92.1 150 138 92.0 153 141 92.2 Vermont 323 264 81.7 309 267 86.4 323 280 86.7 Virginia 219 194 88.6 214 189 88.3 227 206 90.8 Washington 845 210 24.9 838 465 55.5 809 571 70.6 West Virginia 56 41 73.2 53 37 69.8 56 45 80.4 Wisconsin 75 55 73.3 74 55 74.3 73 55 75.3 Wyoming 0 0 0.0 0 0 0.0 0 0 0.0
Note: Figures for school years before SY 2013–2014 may differ from previous reports due to changes in data submitted by States.
A.8

MATHEMATICA POLICY RESEARCH
Table A.2.c. Number and percent of LEAs that directly certified categorically eligible students, excluding Special Provision LEAs, SY 2010–2011 through SY 2011–2012
SY 2010–2011 SY 2011–2012
Number of non-
Provision 2/3 LEAs
Direct certification LEAs
Number of non-
Provision 2/3 LEAs
Direct certification LEAs
Number Percent Number Percent U.S. Total 17,964 15,168 84.4 18,037 15,939 88.4 Alabama 147 137 93.2 151 140 92.7 Alaska 41 39 95.1 44 43 97.7 Arizona 400 335 83.8 419 367 87.6 Arkansas 273 262 96.0 273 263 96.3 California 1,025 753 73.5 1,027 805 78.4 Colorado 205 189 92.2 205 195 95.1 Connecticut 186 176 94.6 184 182 98.9 Delaware 34 32 94.1 42 35 83.3 District of Columbia 57 57 100.0 61 60 98.4 Florida 190 133 70.0 223 178 79.8 Georgia 209 187 89.5 208 198 95.2 Guam NA NA NA 3 1 33.3 Hawaii 36 26 72.2 35 25 71.4 Idaho 141 134 95.0 145 138 95.2 Illinois 1,115 964 86.5 1,124 1,037 92.3 Indiana 501 424 84.6 496 429 86.5 Iowa 494 435 88.1 477 428 89.7 Kansas 399 340 85.2 400 362 90.5 Kentucky 188 177 94.1 189 178 94.2 Louisiana 114 102 89.5 113 106 93.8 Maine 186 168 90.3 181 164 90.6 Maryland 48 42 87.5 54 46 85.2 Massachusetts 420 310 73.8 419 352 84.0 Michigan 853 736 86.3 845 762 90.2 Minnesota 697 462 66.3 686 461 67.2 Mississippi 162 146 90.1 160 144 90.0 Missouri 758 681 89.8 753 702 93.2 Montana 221 190 86.0 219 191 87.2 Nebraska 377 315 83.6 372 318 85.5 Nevada 20 16 80.0 20 15 75.0 New Hampshire 91 82 90.1 100 88 88.0 New Jersey 694 665 95.8 697 683 98.0 New Mexico 115 62 53.9 135 80 59.3 New York 992 871 87.8 1,003 903 90.0 North Carolina 165 154 93.3 162 152 93.8 North Dakota 183 160 87.4 181 157 86.7 Ohio 1,182 859 72.7 1,199 1,028 85.7 Oklahoma 546 465 85.2 544 516 94.9 Oregon 246 199 80.9 236 197 83.5 Pennsylvania 850 730 85.9 850 765 90.0 Rhode Island 55 52 94.5 54 49 90.7 South Carolina 100 85 85.0 106 84 79.2 South Dakota 169 153 90.5 186 170 91.4 Tennessee 175 161 92.0 183 174 95.1 Texas 1,178 1,056 89.6 1,175 1,064 90.6 Utah 81 75 92.6 85 81 95.3 Vermont 237 207 87.3 217 202 93.1 Virginia 154 145 94.2 155 146 94.2 Washington 316 281 88.9 309 279 90.3 West Virginia 72 56 77.8 72 57 79.2 Wisconsin 811 639 78.8 806 692 85.9 Wyoming 55 43 78.2 54 47 87.0
Note: Figures for school years before SY 2013–2014 may differ from previous reports due to changes in data submitted by States.
A.9

MATHEMATICA POLICY RESEARCH
Table A.2.d. Number and percent of LEAs that directly certified categorically eligible students, excluding Special Provision LEAs, SY 2012–2013 through SY 2013–2014
SY 2012–2013 SY 2013–2014
Number of non-
Provision 2/3 LEAs
Direct certification LEAs
Number of non-Special
Provision LEAs
Direct certification LEAs
Number Percent Number Percent U.S. Total 17,744 16,066 90.5 17,220 15,936 92.5 Alabama 157 150 95.5 191 149 78.0 Alaska 63 42 66.7 41 41 100.0 Arizona 427 370 86.7 375 365 97.3 Arkansas 270 254 94.1 268 258 96.3 California 1,038 968 93.3 1,053 985 93.5 Colorado 196 188 95.9 205 198 96.6 Connecticut 188 186 98.9 181 176 97.2 Delaware 41 37 90.2 39 38 97.4 District of Columbia 63 63 100.0 41 41 100.0 Florida 225 184 81.8 215 199 92.6 Georgia 199 189 95.0 167 163 97.6 Guam 2 1 50.0 2 1 50.0 Hawaii 33 33 100.0 28 27 96.4 Idaho 144 144 100.0 139 136 97.8 Illinois 1,051 984 93.6 1,152 983 85.3 Indiana 504 447 88.7 469 458 97.7 Iowa 474 419 88.4 425 394 92.7 Kansas 398 378 95.0 398 385 96.7 Kentucky 188 186 98.9 185 184 99.5 Louisiana 114 107 93.9 121 111 91.7 Maine 186 179 96.2 200 187 93.5 Maryland 54 37 68.5 51 42 82.4 Massachusetts 358 319 89.1 399 383 96.0 Michigan 847 784 92.6 719 691 96.1 Minnesota 681 445 65.3 652 496 76.1 Mississippi 157 144 91.7 159 141 88.7 Missouri 760 709 93.3 746 706 94.6 Montana 216 183 84.7 216 192 88.9 Nebraska 370 337 91.1 360 347 96.4 Nevada 25 17 68.0 21 17 81.0 New Hampshire 98 82 83.7 92 91 98.9 New Jersey 698 679 97.3 700 688 98.3 New Mexico 129 67 51.9 177 68 38.4 New York 1,002 851 84.9 915 805 88.0 North Carolina 161 152 94.4 163 162 99.4 North Dakota 179 151 84.4 174 162 93.1 Ohio 1,200 1,127 93.9 1,026 991 96.6 Oklahoma 543 519 95.6 549 532 96.9 Oregon 232 197 84.9 225 201 89.3 Pennsylvania 848 785 92.6 826 786 95.2 Rhode Island 53 53 100.0 58 50 86.2 South Carolina 94 84 89.4 114 98 86.0 South Dakota 179 160 89.4 173 165 95.4 Tennessee 182 174 95.6 179 177 98.9 Texas 1,157 1,064 92.0 1,097 1,006 91.7 Utah 93 93 100.0 94 94 100.0 Vermont 88 82 93.2 91 78 85.7 Virginia 151 145 96.0 156 151 96.8 Washington 303 284 93.7 297 281 94.6 West Virginia 71 58 81.7 70 67 95.7 Wisconsin 793 722 91.0 766 734 95.8 Wyoming 61 53 86.9 60 55 91.7
Note: Figures for school years before SY 2013–2014 may differ from previous reports due to changes in data submitted by States.
A.10

MATHEMATICA POLICY RESEARCH
Table A.3. Enrollment of NSLP-participating LEAs, SY 2013–2014 (millions of students)
LEAs that directly certified SNAP participants or in which all schools are special provision in
a non-base year All other
LEAs All NSLP-participating
LEAs
All LEAs 49.8 0.6 50.4 Number of students in LEA
10,000 or more 26.6 0.1 26.7
5,000 to 9,999 7.2 0.1 7.3
1,000 to 4,999 12.3 0.2 12.4
500 to 999 2.1 0.1 2.1
Fewer than 500 1.7 0.2 1.8
Note: Because of rounding, values in the All NSLP-participating LEAs column might not equal the sum of values in the other two columns.
LEA = local education agency; SNAP = Supplemental Nutrition Assistance Program; SY = school year.
A.11

MATHEMATICA POLICY RESEARCH
Table A.4. States by FNS administrative region
FNS region State FNS region State
Mid-Atlantic District of Columbia Northeast Connecticut Delaware Maine Maryland Massachusetts New Jersey New Hampshire Pennsylvania New York Virginia Rhode Island West Virginia Vermont Mid-West Illinois Southeast Alabama Indiana Florida Michigan Georgia Minnesota Kentucky Ohio Mississippi Wisconsin North Carolina South Carolina Tennessee Mountain-Plains Colorado Southwest Arkansas Iowa Louisiana Kansas New Mexico Missouri Oklahoma Montana Texas Nebraska West Alaska North Dakota Arizona South Dakota California Utah Guam Wyoming Hawaii Idaho Nevada Oregon Washington
A.12

MATHEMATICA POLICY RESEARCH
Figure A.1. Percent of LEAs that directly certified categorically eligible students and percent of students in LEAs that directly certified categorically eligible students, by enrollment category size: special provision LEAs excluded from direct certification counts, SY 2013–2014
85%
96% 98% 99% 99%90%
97% 98% 99% 100%
0%
10%
20%
30%
40%
50%
60%
70%
80%
90%
100%
Fewer than 500students
500 to 999 students 1,000 to 4,999students
5,000 to 9,999students
10,000 or morestudents
Perc
ent
Enrollment Category
Percent of LEAs that directly certified some categorically eligible students
Percent of students enrolled in LEAs that directly certified some categorically eligible students
A.13

MATHEMATICA POLICY RESEARCH
Figure A.2. Percent of SNAP-participant children directly certified for free school meals, SY 2007–2008
Percent Directly Certified
0 - 59 (13)60 - 69 (15)
70 - 79 (12)80 - 89 (6)
90 - 94 (3)95 + (2)
A.14
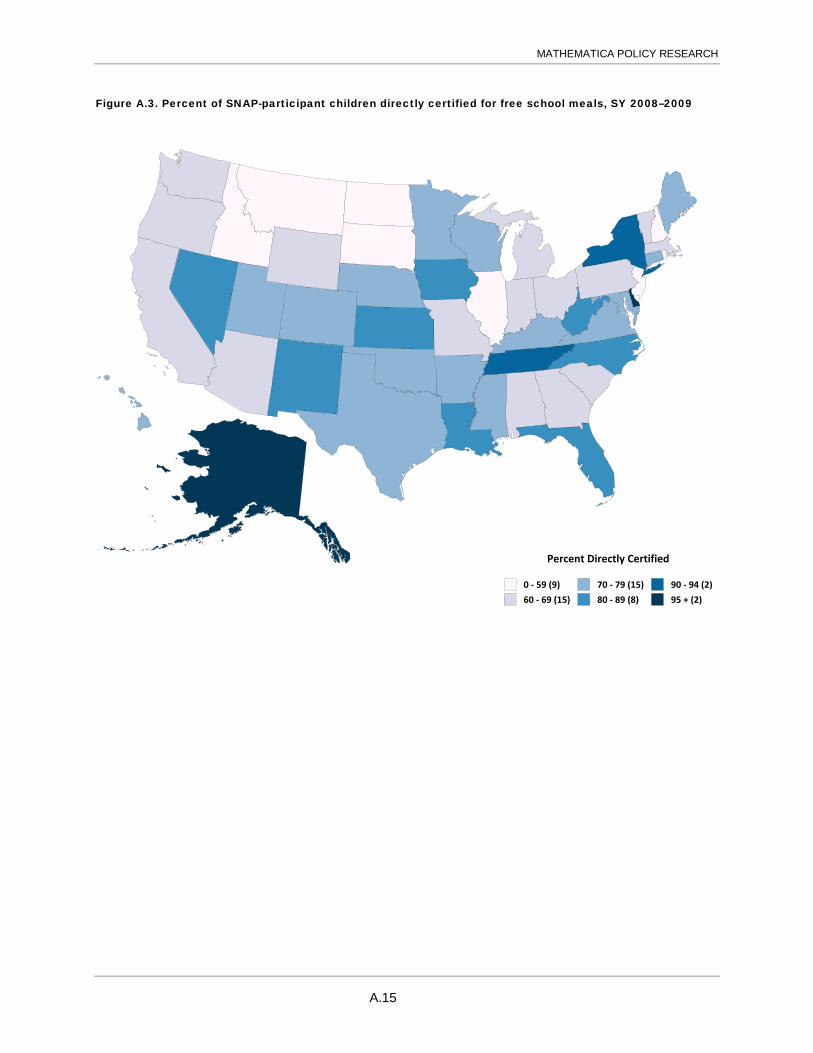
MATHEMATICA POLICY RESEARCH
Figure A.3. Percent of SNAP-participant children directly certified for free school meals, SY 2008–2009
Percent Directly Certified
0 - 59 (9)60 - 69 (15)
70 - 79 (15)80 - 89 (8)
90 - 94 (2)95 + (2)
A.15
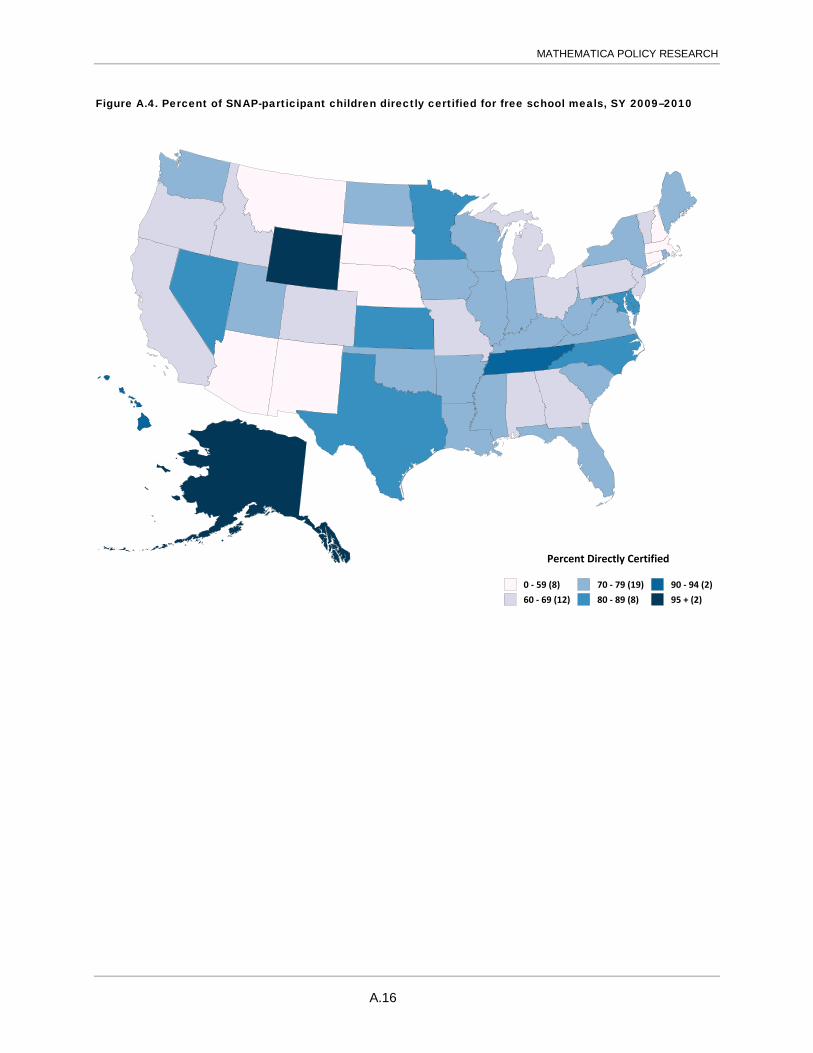
MATHEMATICA POLICY RESEARCH
Figure A.4. Percent of SNAP-participant children directly certified for free school meals, SY 2009–2010
Percent Directly Certified
0 - 59 (8)60 - 69 (12)
70 - 79 (19)80 - 89 (8)
90 - 94 (2)95 + (2)
A.16
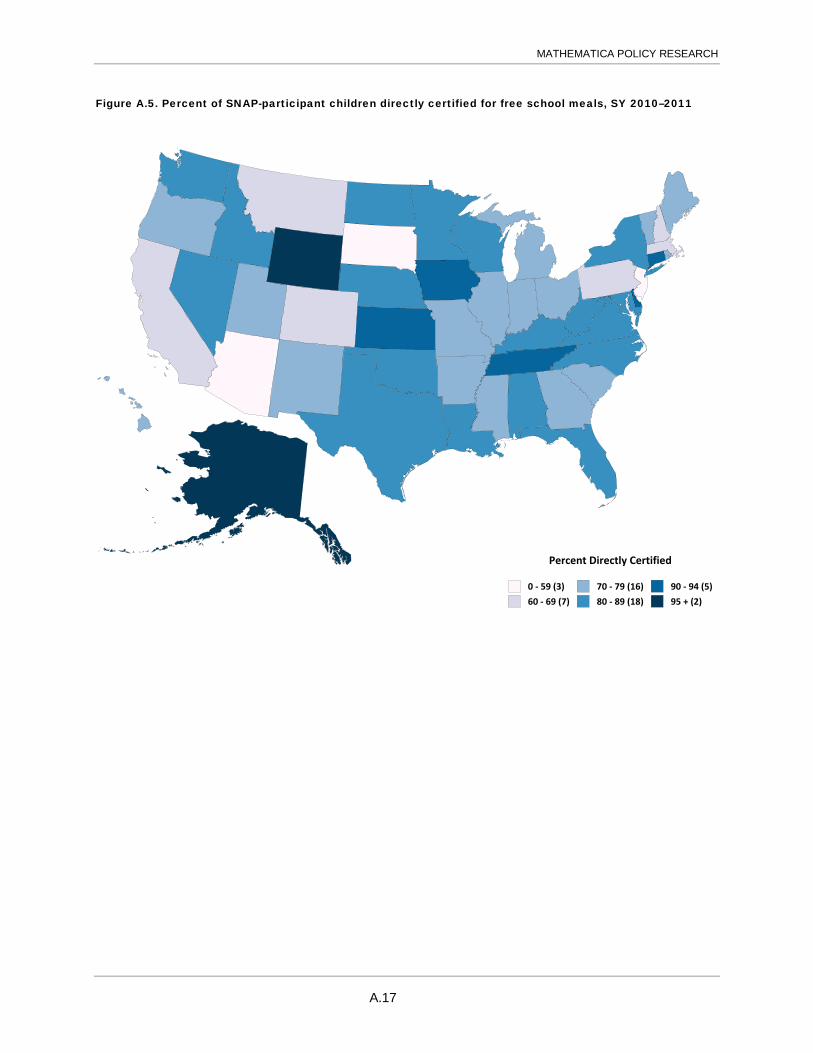
MATHEMATICA POLICY RESEARCH
Figure A.5. Percent of SNAP-participant children directly certified for free school meals, SY 2010–2011
Percent Directly Certified
0 - 59 (3)60 - 69 (7)
70 - 79 (16)80 - 89 (18)
90 - 94 (5)95 + (2)
A.17
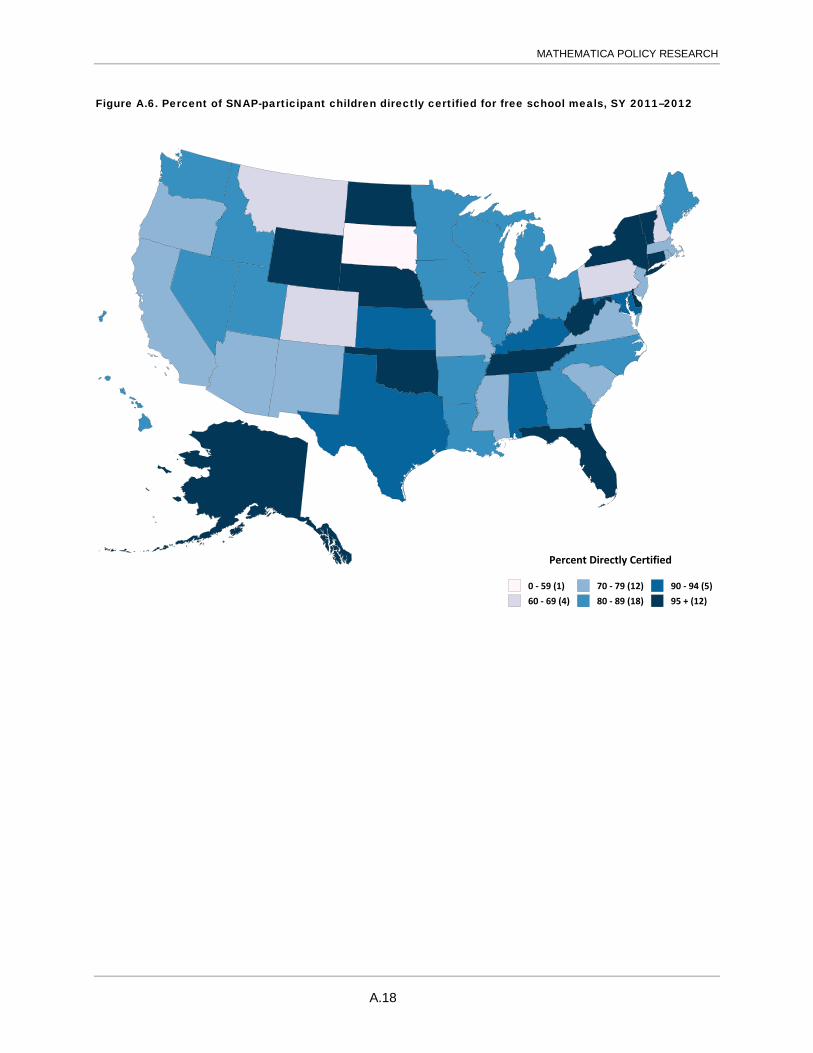
MATHEMATICA POLICY RESEARCH
Figure A.6. Percent of SNAP-participant children directly certified for free school meals, SY 2011–2012
Percent Directly Certified
0 - 59 (1)60 - 69 (4)
70 - 79 (12)80 - 89 (18)
90 - 94 (5)95 + (12)
A.18
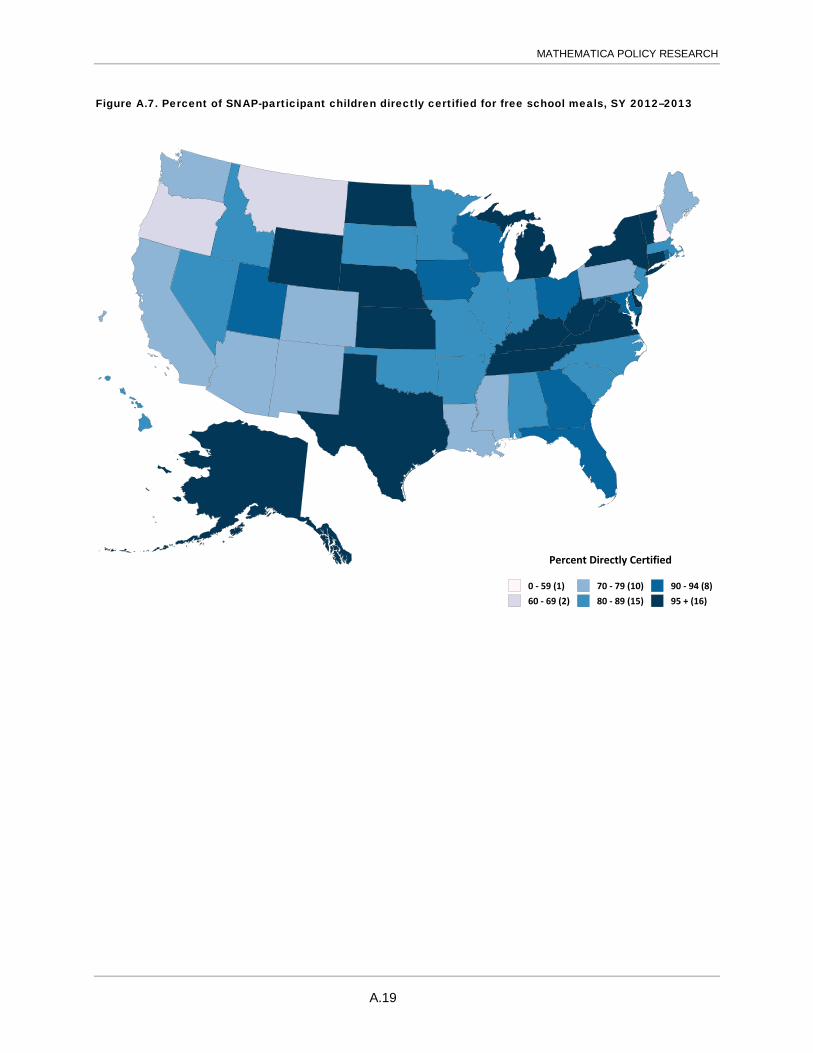
MATHEMATICA POLICY RESEARCH
Figure A.7. Percent of SNAP-participant children directly certified for free school meals, SY 2012–2013
Percent Directly Certified
0 - 59 (1)60 - 69 (2)
70 - 79 (10)80 - 89 (15)
90 - 94 (8)95 + (16)
A.19

MATHEMATICA POLICY RESEARCH
Figure A.8. Percent of SNAP-participant children directly certified for free school meals, SY 2013–2014
Note: In SY 2013-2014, Arizona, California, Connecticut, Hawaii, Ohio, Rhode Island, and Vermont could not distinguish direct
certifications based on SNAP participation from direct certifications based on participation in programs other than SNAP. The resulting performance rates calculated for these States, therefore, overstate their actual performance.
Percent Directly Certified
0 - 59 (0)60 - 69 (2)
70 - 79 (4)80 - 89 (22)
90 - 94 (11)95 + (13)
A.20

MATHEMATICA POLICY RESEARCH
Figure A.9. Percent of categorically eligible children certified for free school meals, SY 2007–2008
Percent of Categorically Eligibile Certified
0 - 59 (0)60 - 69 (10)
70 - 79 (11)80 - 89 (15)
90 - 94 (6)95 + (9)
A.21
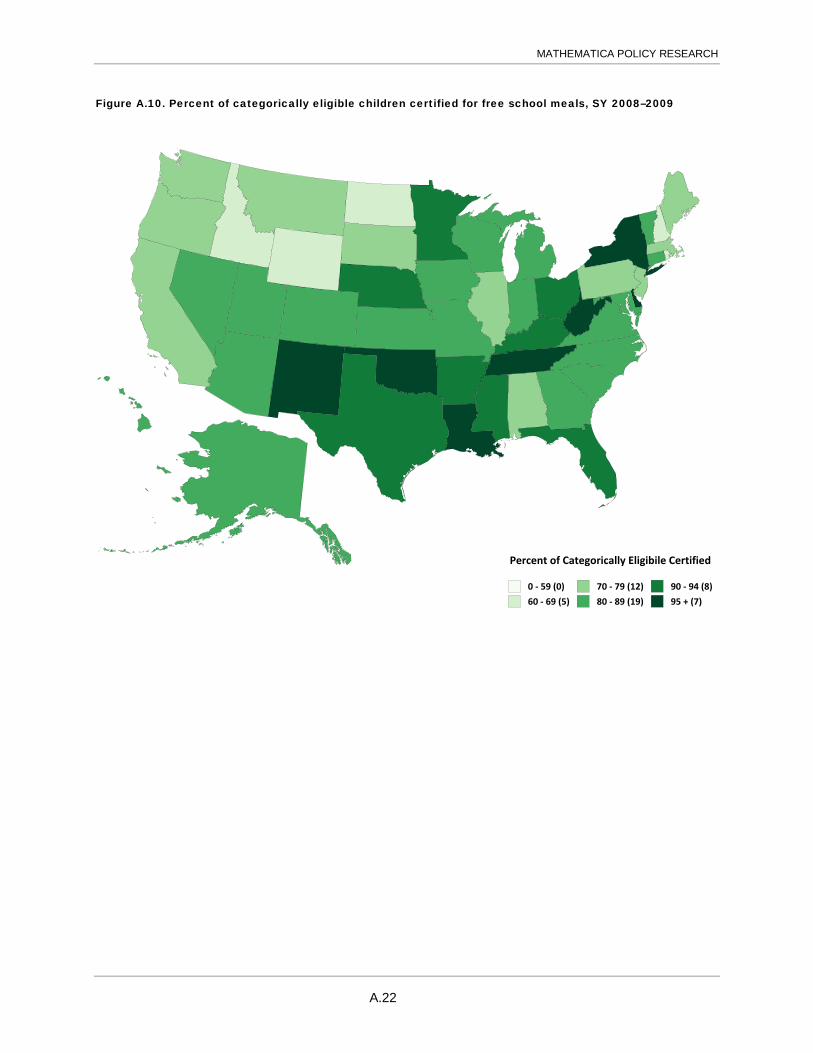
MATHEMATICA POLICY RESEARCH
Figure A.10. Percent of categorically eligible children certified for free school meals, SY 2008–2009
Percent of Categorically Eligibile Certified
0 - 59 (0)60 - 69 (5)
70 - 79 (12)80 - 89 (19)
90 - 94 (8)95 + (7)
A.22

MATHEMATICA POLICY RESEARCH
Figure A.11. Percent of categorically eligible children certified for free school meals, SY 2009–2010
Percent of Categorically Eligibile Certified
0 - 59 (0)60 - 69 (6)
70 - 79 (15)80 - 89 (20)
90 - 94 (7)95 + (3)
A.23

MATHEMATICA POLICY RESEARCH
Figure A.12. Percent of categorically eligible children certified for free school meals, SY 2010–2011
Percent of Categorically Eligibile Certified
0 - 59 (0)60 - 69 (3)
70 - 79 (12)80 - 89 (20)
90 - 94 (10)95 + (6)
A.24
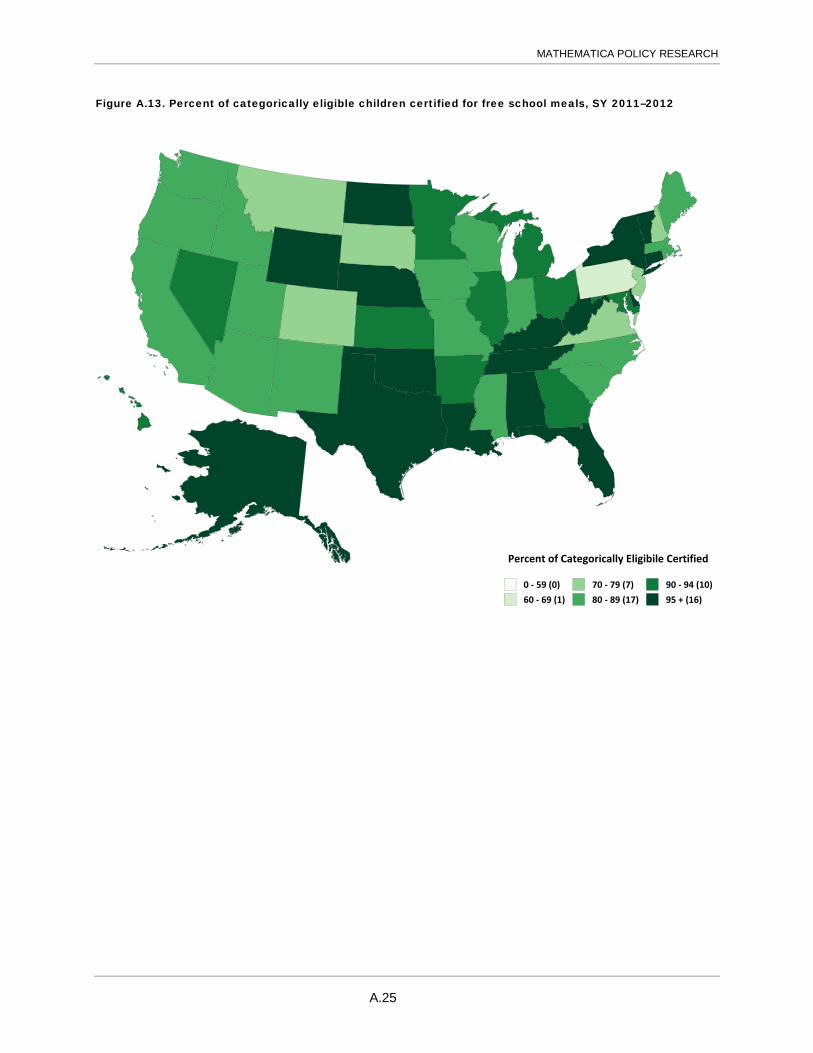
MATHEMATICA POLICY RESEARCH
Figure A.13. Percent of categorically eligible children certified for free school meals, SY 2011–2012
Percent of Categorically Eligibile Certified
0 - 59 (0)60 - 69 (1)
70 - 79 (7)80 - 89 (17)
90 - 94 (10)95 + (16)
A.25
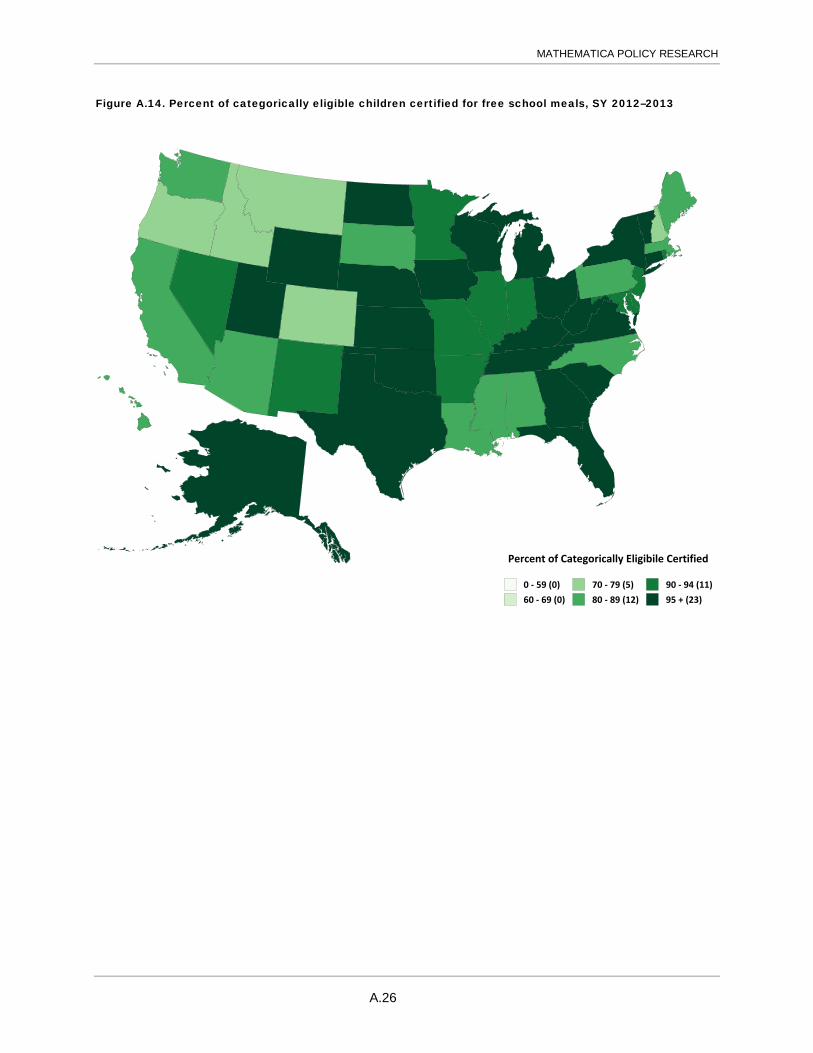
MATHEMATICA POLICY RESEARCH
Figure A.14. Percent of categorically eligible children certified for free school meals, SY 2012–2013
Percent of Categorically Eligibile Certified
0 - 59 (0)60 - 69 (0)
70 - 79 (5)80 - 89 (12)
90 - 94 (11)95 + (23)
A.26
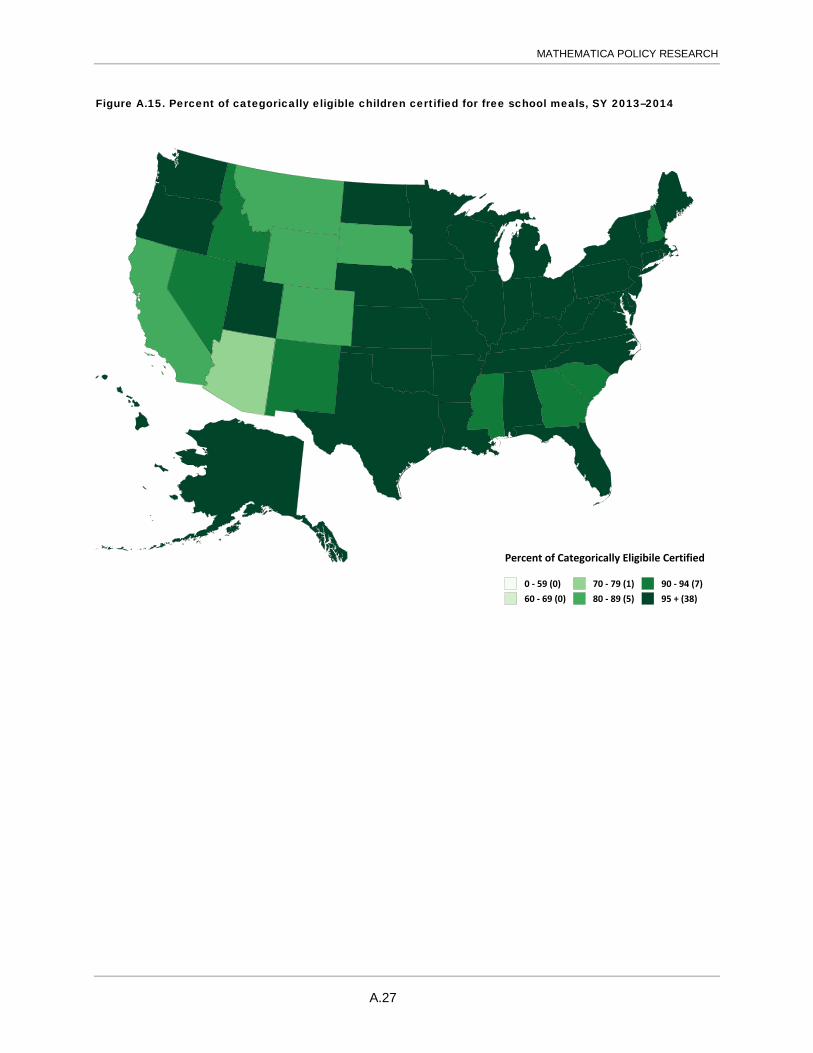
MATHEMATICA POLICY RESEARCH
Figure A.15. Percent of categorically eligible children certified for free school meals, SY 2013–2014
Percent of Categorically Eligibile Certified
0 - 59 (0)60 - 69 (0)
70 - 79 (1)80 - 89 (5)
90 - 94 (7)95 + (38)
A.27

APPENDIX B
SCHOOL FOOD AUTHORITY VERIFICATION COLLECTION REPORT (FORM FNS-742)
AND
STATE AGENCY (NSLP/SNAP) DIRECT CERTIFICATION RATE DATA ELEMENT
REPORT (FORM FNS-834)

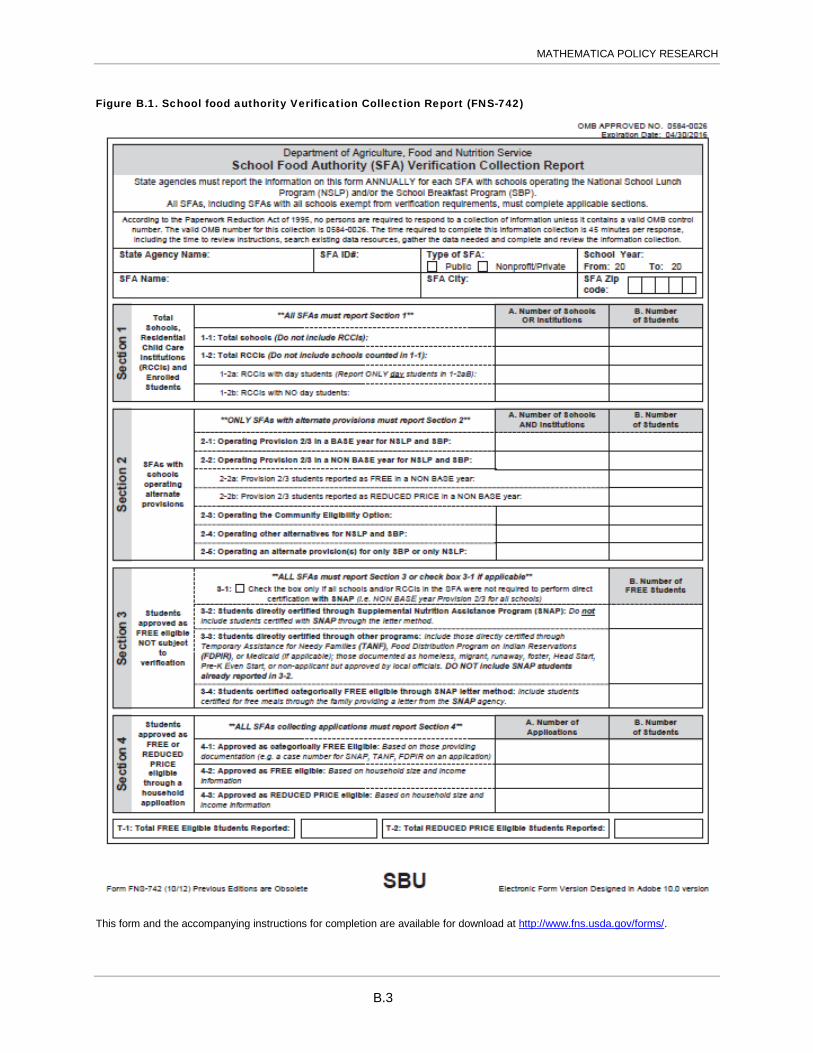
MATHEMATICA POLICY RESEARCH
Figure B.1. School food authority Verification Collection Report (FNS-742)
This form and the accompanying instructions for completion are available for download at http://www.fns.usda.gov/forms/.
B.3
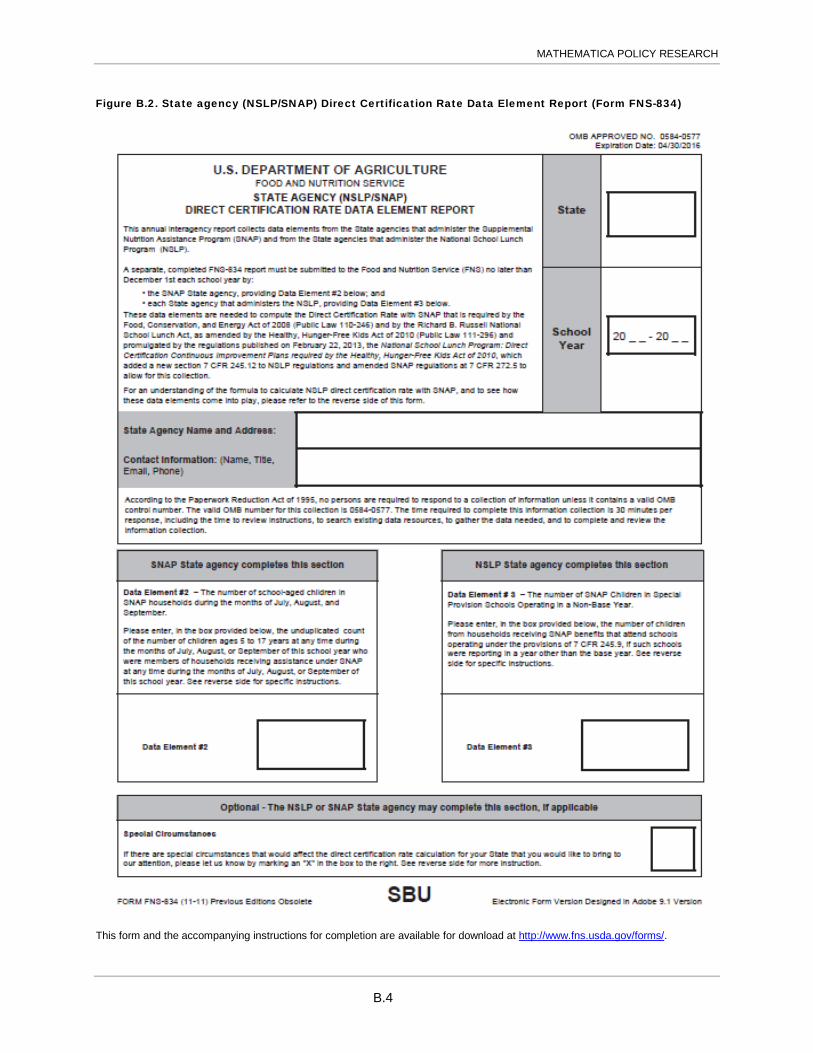
MATHEMATICA POLICY RESEARCH
Figure B.2. State agency (NSLP/SNAP) Direct Certification Rate Data Element Report (Form FNS-834)
This form and the accompanying instructions for completion are available for download at http://www.fns.usda.gov/forms/.
B.4

APPENDIX C
DESCRIPTION AND LIMITATIONS OF DATA SOURCES USED FOR DIRECT CERTIFICATION PERFORMANCE MEASURE CALCULATIONS


MATHEMATICA POLICY RESEARCH
This report presents two measures of State success in certifying categorically eligible children for free school meals:
1. The direct certification performance rate measures the percentage of school-age Supplemental Nutrition Assistance Program (SNAP) participants each State directly certifies for free school meals.
2. The broader measure of certification estimates the percentage of all categorically eligible students each State certifies directly, by application, or by letter method, based on their participation in or association with any of the programs or institutions that confer categorical eligibility (CE) for free school meals.
Both measures use State-reported counts for component statistics where possible, using the FNS data collection forms newly available in school year (SY) 2013–2014. The broader measure supplements these State-reported numbers with data from the U.S. Census Bureau’s American Community Survey (ACS), a survey of Food Distribution Program on Indian Reservations (FDPIR) participants, and FDPIR administrative data. This appendix contains descriptions of these data sources and their limitations.
A. Direct certification performance rate
The main direct certification performance rate described in this report is calculated using State counts of three data elements from two FNS data forms: the Verification Collection Report (VCR, FNS Form 742) and the Direct Certification Rate Data Element Report (DER, FNS Form 834).
1. Verification Collection Report The VCR is a revised version of the Verification Summary Report (VSR) used in previous
years. The primary purpose of this form is to enable States to report statistics pertaining to school meal certification verification. FNS has used VSR data to calculate direct certification performance rates since SY 2007–2008. However, the original VSR form was not designed for this purpose and did not contain a field for the number of SNAP participants who were directly certified, the primary data element used to calculate State performance. This statistic, therefore, had to be approximated based on other fields. The revisions that led to the new VCR form retain the fields necessary for program verification while offering the specific data elements needed to calculate direct certification performance.
The data reported on the VCR suffer from two limitations. The first is the inability of seven States—Arizona, California, Connecticut, Hawaii, Ohio, Rhode Island, and Vermont—to distinguish students directly certified based on SNAP participation from those directly certified based on participation in other programs in SY 2013–2014. The performance rate calculation for these States includes all directly certified students, not just those who were directly certified
C.3

MATHEMATICA POLICY RESEARCH
based on SNAP.26 The performance rate, therefore, overstates the percentage of school-age SNAP recipients who were directly certified in those States, as well as for the nation.
The second limitation of the VCR data is that they do not capture school-age SNAP participants who do not attend NSLP-participating schools. Table C.1 presents the types of children in these circumstances whom States reported to FNS, including the number of States that provided estimates of the number of children in each category based on valid individual-level data.
Table C.1. State-reported special circumstances affecting direct certification performance rate calculations
Circumstance
Number of States
citing it
Number of States
attempting to quantify it Comments
School drop-outs 3 1 This circumstance likely applies to all States.
Five-year-olds below mandatory school age
6 0 The extent of this circumstance depends on State- specific school enrollment policies. This circumstance includes students old enough to be eligible, but not required, to enroll in school. In some States it also includes students too young to enroll in school.a
Home-schooled students 5 2 This circumstance likely applies to all States. An estimated 1.5 million students were home-schooled nationwide in 2007.b
Virtual students 2 1 The extent of this circumstance likely varies by State.
Students attending schools not participating in the NSLP
7 2 The extent of this circumstance likely varies by State.
aState SNAP lists used for direct certification include children residing in households receiving SNAP benefits who turn five years old in September. In some States, children must be at least five years old on September 1 to enroll in school. Children in these States who turn five during the month of September appear on the State SNAP list but not in the school enrollment data.
bU.S. Department of Education 2008.
Other types of children that appear in State SNAP data but might not attend schools participating in the NSLP include school-age children who graduate early as well as some homeless or migrant children. Children who appear on State lists of school-age SNAP participants but do not attend schools participating in the NSLP are included in the denominator of the direct certification performance rate calculation but not the numerator. This reduces State performance rates and might limit some States’ ability to meet the performance rate target. However, the performance rate target of 95 percent accounts for this by allowing States to meet the standard while leaving up to 5 percent of the school-age SNAP population uncertified. The estimate some States provided for the number of children in these categories provides a useful first step in gauging the scope of this problem. However, firm, consistent numbers do not currently exist and the size of these groups likely varies considerably across States.
26 This is similar to the count of directly certified students used in the direct certification performance rates presented in previous years.
C.4

MATHEMATICA POLICY RESEARCH
2. Direct Certification Rate Data Element Report FNS introduced the DER in SY 2013–2014 in order to simplify and improve two data
elements used in the direct certification performance rate calculation. States use the DER to submit counts of the number of school-age children in SNAP households during July, August, or September and the number of SNAP children in special provision schools operating in non-base years.27
Direct State reports of counts of SNAP children and SNAP children in non-base-year special provision schools likely improve performance rate accuracy compared with methods used in previous years. Nonetheless, some States might have difficulty providing accurate counts for one or both of these data elements—responses State staff provided in the best practices interviews confirmed that some States found this challenging. Comparisons between State-reported and estimated counts revealed large differences in some States and it is not always clear which count might be more accurate. These differences underscore the importance of refraining from comparing State performance across years using performance rates calculated using different methodologies.
B. Broader certification rate
The broader direct certification rate estimates the percentage of all categorically eligible students who are directly certified for free school meals. This measure uses the same data sources as the performance rate and adds data for other categorically eligible students, such as Temporary Assistance for Needy Families (TANF) or FDPIR participants. Variables for these data components remain the same as in previous years and do not rely on direct State reports of counts of students. Instead, they use national survey and Federal administrative program data, as described below.
1. American Community Survey The ACS offers estimates of households that receive SNAP benefits and households that
receive both SNAP benefits and public assistance, which ACS documentation defines as “general assistance and Temporary Assistance to Needy Families.”28 For this report, we use the ACS count of households that receive public assistance as a proxy for households that receive TANF benefits. This proxy will overstate the TANF population by an unknown amount that varies according to the size of the States’ general assistance programs.
A second problem with the ACS data is the tendency of households to underreport receipt of public assistance benefits—SNAP benefits in particular. In this report, FNS uses ACS estimates of households that receive either public assistance or SNAP benefits and households that receive SNAP benefits. These two data elements are used here to estimate the ratio of TANF-only households to all SNAP households. Underreporting of either benefit, especially differences in underreporting, reduces the reliability of the ratio constructed from the two ACS variables.
27 Before SY 2013–2014, the performance rate relied on estimates derived from SNAP program operations data, SNAP quality control data, and the U.S. Census Bureau’s SIPP, as discussed later in this appendix. 28 See U.S. Census Bureau 2012, p.80.
C.5

MATHEMATICA POLICY RESEARCH
Finally, ACS data are not available for Guam. Therefore, Guam is not included in the analysis of the more comprehensive CE certification measure.
2. Survey of FDPIR participants The estimated count of school-age FDPIR participants used to develop the broader
certification measure presented in Figure 10 is based in part on a survey conducted for a 1990 study (Usher et al. 1990). The study found that 37 percent of FDPIR participants were younger than 18. FNS multiplied this figure by a factor of 13/18 (the expected number of children ages 5 to 17 among those ages 0 to 17) and applied it to the average monthly FDPIR caseload,29 by State, for fiscal year (FY) 2008. The primary weakness of this estimate is clear: the share of children in households that currently receive FDPIR benefits likely has changed, significantly in some States, since 1990.
29 FNS FDPIR program data.
C.6

APPENDIX D
DATA UPDATES FOR SCHOOL YEAR 2012–2013

MATHEMATICA POLICY RESEARCH
For this year’s direct certification report, we have updated last year’s table showing the percentage of directly certified school-age Supplemental Nutrition Assistance Program (SNAP) participants.
Updates to the estimate inputs since the previous report include the following:
1. Updated school year (SY) 2012–2013 SNAP school-age participation rate from a new report (as discussed in Appendix C, the participation rate was revised upward from 0.929 to 0.932)
2. Updated SY 2012–2013 asset adjustment (as discussed in Appendix C, the asset adjustment was revised upward from 0.829 to 0.836)
The updated estimates are reflected in the amended version of Figure 4 from the October 2013 Report to Congress. The national direct certification rate increased by 0.03 percentage points, from 89.27 to 89.30 percent. When rounded to the nearest percentage point, 48 States, including the District of Columbia and Guam, have the same direct certification rate under both the previously published and the updated data. One of the four States that shows a change to its direct certification rate remained above 100 percent—Alaska. Of the remaining three States, each had changes of 1 percentage point—California, Texas, and South Dakota.
In SY 2012–2013, the direct certification performance target established by the Healthy, Hunger-Free Kids Act of 2010 was 90 percent. Every State has the same performance target status using either the original or the revised estimates.
The revised participation rate drives all notable changes to the direct certification estimate. The change in the asset adjustment had a negligible impact—it increased the count of children from non-base year Provision 2 or 3 schools by just 362 children nationally, which led to no change in the national direct certification rate.30
The increase in the SNAP participation rate increases the estimated count of SNAP participants attending non-base year Provision 2 or 3 schools. Increasing the estimate of SNAP participants in non-base year Provision 2 or 3 schools increases the direct certification rate estimate because it leads to a smaller denominator for the direct certification rate. Nationally, the participation rate change (alone) increased the number of SNAP participants in Provision 2 or 3 schools by 3,835, with three States—California, Texas, and New York—accounting for 70 percent of that increase.
30 An increase in the asset factor serves to increase the count of children from non-base year Provision 2 and 3 schools that are determined to be income eligible for free meals. However, the change can affect only the 10 non-BBCE States: Alaska, Arkansas, Indiana, Kansas, Missouri, South Dakota, Tennessee, Utah, Virginia, and Wyoming. In addition, the slight increase of .007 had a negligible impact for these States—only Alaska, Arkansas, Indiana, and South Dakota had an increase of more than 50 children from Provision 2 and 3 schools.
D.3

MATHEMATICA POLICY RESEARCH
Amended Figure 4. Revised percentage of school-age SNAP-participant children directly certified for free school meals, SY 2012–2013
Note: This figure has been revised to account for revisions to the methodology for calculating the SNAP participation rate and the asset
factor. Revised values are indicated with red shading. Direct certification estimates are capped at 100 percent and shaded in dark blue (except for Alaska, which had a change in its estimate).
58%66%
69%72%73%
75%75%76%77%77%77%78%79%80%80%81%81%
84%84%85%85%86%87%88%88%89%89%89%90%91%91%92%93%94%94%94%95%95%96%97%98%98%
100%100%100%100%100%100%100%100%100%100%
0 20 40 60 80 100 120 140
New HampshireMontana
OregonColorado
ArizonaLouisiana
MaineGuam
CaliforniaPennsylvania
MississippiNew MexicoWashington
MissouriIdaho
ArkansasNorth CarolinaMassachusetts
IndianaAlabama
IllinoisSouth Carolina
MinnesotaSouth Dakota
HawaiiNew Jersey
NevadaOklahoma
Rhode IslandMaryland
OhioWisconsin
FloridaUtahIowa
GeorgiaTennessee
VermontDelaware
VirginiaTexas
ConnecticutMichiganWyoming
District of ColumbiaKansas
West VirginiaNebraskaKentuckyNew York
North DakotaAlaska
Percent Directly Certified
Stat
e
National DirectCertification Rate:
89 Percent
How to Read This Chart
This chart gives estimates of the percentage of school-age SNAP participants who were directly certified for free school meals for SY 2012–2013.
In Oklahoma, for example,89 percent of school-age SNAP participants were directly certified for free school meals.
The vertical red line corresponds to the national direct certification rate.
D.4

Improving public well-being by conducting high-quality, objective research and surveys
Princeton, NJ ■ Ann Arbor, MI ■ Cambridge, MA ■ Chicago, IL ■ Oakland, CA ■ Washington, DC
Mathematica® is a registered trademark of Mathematica Policy Research
www.mathematica-mpr.com