DIPLOMARBEIT - univie.ac.atothes.univie.ac.at/16111/1/2011-09-16_0325745.pdf · wurde von unseren...
113
DIPLOMARBEIT Titel der Diplomarbeit „Natural products and insulin signalling; Aspects of the metabolic syndrome; Testing in in vitro and cell based assays“ Verfasser San-Po Pan angestrebter akademischer Grad Magister der Pharmazie (Mag. pharm.) Wien, 2011 Studienkennzahl lt. Studienblatt: A 449 Studienrichtung lt. Studienblatt: Diplomstudium Pharmazie Betreuerin / Betreuer: Univ.-Prof. Dr. Verena Dirsch
Transcript of DIPLOMARBEIT - univie.ac.atothes.univie.ac.at/16111/1/2011-09-16_0325745.pdf · wurde von unseren...
DIPLOMARBEIT
Titel der Diplomarbeit
„Natural products and insulin signalling;
Aspects of the metabolic syndrome;
Testing in in vitro and cell based assays“
Verfasser
San-Po Pan
angestrebter akademischer Grad
Magister der Pharmazie (Mag. pharm.)
Wien, 2011
Studienkennzahl lt. Studienblatt: A 449
Studienrichtung lt. Studienblatt: Diplomstudium Pharmazie
Betreuerin / Betreuer: Univ.-Prof. Dr. Verena Dirsch

1
2
Abstract
PTP1B (protein tyrosine phosphatase 1B), an intracellular phosphatase, has been identified as a major negative regulator of insulin and leptin signalling. Since several studies demonstrated that PTP1B knock-out mice showed increased insulin sensitivity and gained protection from obesity, PTP1B has become the focus of interest in finding novel therapeutics in treating metabolic syndrome and type 2 diabetes.
In cooperation with the Department of Food Chemistry and Toxicology of the University of Vienna and in particular the Departments of Pharmacognosy in Innsbruck and Vienna, five different plants (Averrhoa bilimbi, Agrimonia pilosa, Arisaema amurense, Phellodendron amurense and Leonorus sibiricus) and one apple juice were chosen for extraction and testing for their PTP1B inhibitory potential in an enzyme-based in vitro assay. The selection was mainly based on the traditional use or reported activities of these plants in the context of metabolic disorders. In case of an active extract, bioassay-guided fractionation was performed together with the cooperation partners in order to find promising PTP1B inhibitors from natural origin, and/or the observed in vitro activity was confirmed in a cell-based model (enhanced insulin receptor phosphorylation in a hepatocellular carcinoma cell line).
All plant extracts except from Leonorus sibiricus displayed promising PTP1B inhibition giving new starting material for further bioassay-guided fractionation. Like this, oleic acid was isolated from Phellodendron sp demonstrating strong PTP1B inhibition (IC50 = 4.88 µM) and indicating that other fatty acids might as well inhibit PTP1B. We could indeed show that palmitic acid (IC50 = 13.40 µM) as well as linoleic acid (IC50 = 18.34 µM) were strong PTP1B inhibitors whereas stearic acid was the least active of the tested fatty acids. Furthermore, procyanidines, a class of compounds in apple have been identified as potent PTP1B inhibitors with an IC50 = 79.08 µg/ml. Moreover, several fractions of the Averrhoa bilimbi extract exhibited PTP1B inhibition in vitro and in a cell-based model.
Overall, in the course of this work the PTP1B inhibitory effect of several plant extracts could be revealed for the first time which may help to understand their observed beneficial impact in metabolic disorders on the molecular level and possibly to find novel leads for efficient PTP1B inhibitor development.

3
4
Zusammenfassung
PTP1B (Protein-Tyrosin-Phosphatase-1B) ist eine intrazelluläre Phosphatase, die als negativer Regulator des Insulin- und des Leptin-Signalweges identifiziert wurde. Studien belegen, dass PTP1B-knock-out Mäuse eine erhöhte Insulin-Sensitivität aufweisen und zusätzlich über einen Schutz vor Fettleibigkeit verfügen. Aufgrund dieser Eigenschaften wurde PTP1B ein „molecular target“ in der Entwicklung neuer Therapeutika zur Behandlung des metabolischen Syndroms und Typ 2 Diabetes.
In Kooperation mit dem Institut für Lebensmittelchemie und Toxikologie der Universität Wien und insbesondere mit den Instituten für Pharmakognosie in Innsbruck und in Wien, wurden fünf verschiedene Pflanzen (Averrhoa bilimbi, Agrimonia pilosa, Arisaema amurense, Phellodendron amurensae und Leonorus sibiricus) und ein Apfelsaft für Extraktionen ausgewählt. Diese Pflanzen wurden aufgrund ihrer traditionellen Anwendungen, die im Zusammenhang mit der Therapie des metabolischen Syndroms stehen, ausgewählt. Die Extrakte wurden in vitro auf ihr PTP1B-inhibierendes Potential mittels Enzym-Assay getestet. Im Falle einer von uns nachgewiesenen Wirksamkeit, wurde von unseren Kooperationspartnern eine `bioassay-guided‘-Fraktionierung der Substanz durchgeführt mit dem Ziel eventuelle PTP1B-Inhibitoren natürlichen Ursprungs zu finden. Weiterführend wurden wirksame Substanzen an einem Zellkulturmodel getestet, um die Wirkung zu bestätigen (verstärkte Insulin-Rezeptor-Phosphorylierung in einer Leber-Karzinom-Zelllinie).
Alle Pflanzenextrakte außer Leonorus sibiricus zeigten eine vielversprechende PTP1B- Inhibierung. Dieses Resultat war Ausgangspunkt für weitere „bioassay-guided“-Fraktionierungen. Die aus Phellodendron sp extrahierte Ölsäure zeigte eine starke PTP1B-Inhibierung (IC50 = 4.88 µM). Diese Wirkung wies darauf hin, dass möglicherweise andere Fettsäuren ebenfalls das Enzym PTP1B hemmen könnten. Wir konnten in der Tat zeigen, dass Palmitinsäure (IC50 = 13.40 µM) ebenso wie Linolsäure (IC50 = 18.34 µM) starke PTP1B-Inhibition aufwiesen, wohingegen für Stearinsäure die schwächste Wirksamkeit in der Gruppe der getesteten Fettsäuren nachgewiesen wurde. Weiters konnten wir Procyanidine, eine Gruppe von chemischen Verbindungen in Äpfeln, als potente PTP1B-Inhibitoren (IC50 = 79.08 µg/ml) identifizieren. Darüber hinaus bewirkten mehrere Fraktionen aus Averrhoa bilimbi eine in vitro Inhibierung von PTP1B.
Allgemein konnten wir im Verlauf dieser Arbeit eine PTP1B-inhibierende Wirksamkeit verschiedener Pflanzenextrakte nachweisen. Diese Erkenntnisse ermöglichen einerseits ein Verständnis für die Anwendung von Phytopharmaka in der Therapie metabolischer Funktionsstörungen und liefern andererseits neue Anhaltspunkte für die Entwicklung effizienter PTP1B-Inhibitoren.

5

6
A. Table of content

7
8
A. Table of content
B. Introduction ................................................................................................................................................. 12
1. Aim ................................................................................................................................ 14
2. Background .................................................................................................................... 14
2.1 Insulin physiology and signal transduction ............................................................ 14
2.2 Insulin resistance ................................................................................................... 17
2.3 PTP1B ..................................................................................................................... 19
2.4 PTP1B as drug target in the metabolic syndrome ................................................. 23
2.5 Natural products as source of PTP1B inhibitors .................................................... 28
C. Materials and Methods ................................................................................................................. 34
1. Enzyme assay ................................................................................................................. 36
1.1 Enzyme ................................................................................................................... 36
1.2 Buffers .................................................................................................................... 36
1.3 Test compounds and controls ................................................................................ 37
1.4 Colorimetric enzyme assay .................................................................................... 39
2. Cell culture .................................................................................................................... 41
2.1 Cells ........................................................................................................................ 41
2.2 Medium and buffers .............................................................................................. 41
2.3 Cultivation of cells .................................................................................................. 42
3. Western blotting ........................................................................................................... 42
3.1 Buffers and solutions ............................................................................................. 42
3.2 Antibodies .............................................................................................................. 43
3.3 Stimulation of the cells .......................................................................................... 44
3.4 Preparation of protein extracts ............................................................................. 45
3.5 Bradford ................................................................................................................. 45
3.6 Electrophoresis and blotting .................................................................................. 46
3.7 Incubation with antibodies and detection ............................................................. 48
4. Technical equipment and software............................................................................... 49
9
D. Results and Discussion ................................................................................................................. 52
1. In vitro screening for potential PTP1B-inhibitors - Overview ...................................... 54
2. Extracts of Averroha bilimbi .......................................................................................... 61
2.1 In vitro enzyme assay................................................................................................ 61
2.2 Cell-based testing ...................................................................................................... 62
3. Extracts and fractions of Agrimoniae pilosa ................................................................. 64
4. Extracts of Arisaema amurense .................................................................................... 67
4.1 Crude extracts ............................................................................................................ 67
4.2 Dichloromethane subfractions (858-869) of Arisaema amurense ............................ 69
4.3 Methanol subfractions (M1-M15) of Arisaema amurense ........................................ 70
4.4 Glucocerebroside ....................................................................................................... 71
5. Phellodendron amurense .............................................................................................. 73
6. Fatty acids...................................................................................................................... 75
7. Chlorogenic acid and apple juice .................................................................................. 79
8. Caffeic acid, epicatechin, procyanidines, quercitrin, hyperosid, isoquercitrin, rutin . 83
9. Leonorus sibiricus .......................................................................................................... 86
E. Summary and Outcomes ............................................................................................................. 90
F. References ....................................................................................................................................................... 94
G. Appendix.......................................................................................................................................................... 104
Abbreviations .................................................................................................................... 106
List of figures ..................................................................................................................... 109
Curriculum vitae ............................................................................................................... 111
Acknowledgements .......................................................................................................... 112

10

11

12
B. Introduction

13
14
B. Introduction
1. Aim
According to the International Diabetes Foundation, approximately 20-25 % of the world´s adult population suffers from the metabolic syndrome (MetS) and the number is increasing tremendously each year. These people have an increased risk of developing type 2 diabetes (T2D) and of dying from heart attack or stroke [1]. Therefore an intervention is highly needed. Protein tyrosine phosphatase 1B (PTP1B), a negative regulator of the insulin signalling and the leptin signalling has been regarded as a novel promising drug target for treating T2D and MetS. Using an in vitro enzyme assay with human recombinant PTP1B and a cell-based model (insulin receptor phosphorylation in a hepato carcinoma cell line (HCC-1.2)), extracts of different plants deriving from the ethnic medicine and selected for their known use in MetS and T2D were to be tested for possible PTP1B inhibition, in order to possibly gain (i) information on the molecular mechanism underlying their traditional use and (ii) new leads by further bioassay-guided fractionation.
2. Background
2.1 Insulin physiology and signal transduction
Insulin is a hormone produced by the beta islet cells of the pancreas and is an essential growth promoting and anabolic hormone. It coordinates multiple physiological processes, especially the whole body energy metabolism is under the control of this vital endocrine substance. With its counterpart glucagon, it regulates the whole body utilization and storage of glucose and maintains the plasma glucose concentration at fasting time at 70 – 80 mg/dl (3.9 – 4.4 mol/l) and above 140 mg/dl (7.8 mol/l) after a meal. Under hyperglycemic conditions, insulin is secreted from the pancreatic beta cells and transported via the blood stream through the portal vein to the periphery in order to reach the main insulin sensitive tissues and cells (hepatocytes, myocytes, adipocytes). By docking on the IR (insulin receptor), insulin initiates several downstream signal cascades involved in metabolism but also mitogenesis. Like this, insulin promotes glucose disposal in adipose and muscle tissues whereas in the liver glucose production is prevented by inhibition of glycogenolysis and gluconeogenesis. In the liver and muscle cells, the glucose is stored as glycogen upon insulin stimulation. The net effect of these insulin actions is reduction of the blood glucose level and replenishment of cellular glucose stores. In addition to glucose uptake and storage, insulin is as well engaged in the process of lipid metabolism. In the liver, insulin enhances lipogenesis by using the
15
flux of glucose for the synthesis of free fatty acids (FFAs) and its esterification to triglyceride. The triglycerides are assembled to VLDL (very low density lipoproteins) and are then transported in the blood stream to supply muscle and fat cells. This process is mediated by insulin via SREBP1c (sterol response element binding protein) which activates the expression of several genes responsive for synthesis of fatty acids, cholesterol, triglycerides and phospholipids. In adipocytes, insulin mediates the stimulation of LPL (lipoprotein lipase) which hydrolyses the lipoproteins and releases the FFAs so that the adipocytes are able to absorb the released FFAs. The released FFAs are then stored again as triglyceride in adipocytes. Insulin also promotes the inhibition of hormone sensitive lipase (HSL) which hydrolyses the stored triglyceride in adipose tissue and so the lipid/energy storage of these cells is replenished. Other functions of insulin are its influences on protein synthesis, cell growth, proliferation and differentiation and hemodynamic homeostasis [2-4].
The actions of insulin are, as mentioned before, triggered by its receptor which is ubiquitously expressed but in high levels on insulin sensitive cells (muscle, adipose, liver cells). The insulin signalling pathway is shown in Figure 1. The IR is a heterodimeric PTK (Phosphotyrosine kinase) transmembrane receptor and consists of two extracellular α-units, which function as hormone binding site, and two transmembrane intracellular β- units. Upon insulin binding at the extracellular domain, the receptor undergoes autophosphorylation at its cytoplasmic β Tyr residues (Tyr-1158, Tyr-1162, Tyr-1163) [5] and its kinase activity is fully displayed. Thereby downstream signalling events/cascades are triggered by phosphorylation of several substrate proteins at its tyrosine residues. One of those is the IRS (insulin receptor substrate) whose phosphorylated tyrosine residues offer docking sites for several downstream effector molecules that finally activate three main signalling cascades: the phophatidylinositol 3-kinase (PI3K)–AKT pathway which mainly regulates glucose metabolism, the CAP-Cbl-Tc10 pathway which controls the translocation of the GLUT-4 receptor to the cell membrane in muscle and fat cells and thereby enhance glucose uptake in these cells and the Ras-mitogen-activated protein kinase (MAPK) pathway which regulates cell growth and differentiation [6, 7].
In more detail: The phosphorylated Tyr residues of the IR are recognized by phosphotyrosine binding domains of the IRS which is recruited to the cell membrane and phosphorylated by the IR at its multiple Tyr sites. These phosphorylated residues are in turn bound by the src homology 2 (SH2) of the subunit p85 of PI3K. Like this, PI3K is shuttled to the membrane and its catalytic domain p110 is able to phosphorylate phophatidylinositol-4,5-bisphosphate (PIP2) to phophatidylinositol-3,4,5-triphosphate (PIP3) which then further activates phophatidylinositol dependent kinases (PDK). PDK1 phosphorylates Akt (also called PKB) at Thr308 whereby Akt is only activated partially. A second phosphorylation at Ser473 mediated by PDK2 (in some cases mTOR) unfolds its full activity. Once Akt is fully activated, it is able to dissociate from the membrane and phosphorylate multiple substrates in the cytoplasm and the nucleus in order to regulate glucose metabolism. One of the proteins that is phosphorylated by Akt is glycogen
16
synthase kinase 3 (GSK3). Phosphorylation of GSK3 decreases its activity and leads to reduced glycogen synthase (GS) phosphorylation. Hence GS remains more active and is capable to store glucose as glycogen and to lower serum glucose level. Furthermore, phosphorylated Akt is able to inactivate FOXO-1 (by cytosolic retention) and inhibit expression of key enzymes for gluconeogenesis which are phosphoenolpyruvate carboxy-kinase (PEPCK) and glucose 6 phosphatase [7]. Another effect mediated by the activated IR affects the translocation of the GLUT-4, which is normally stored in vesicles in the cytoplasma, to the cell membrane. Hereby the protein Cbl which is in a complex with CAP is phosphorylated. This recruits the Cbl-CAP complex to an area in the lipid membrane called the lipid raft and activates the CAP/Cbl/Tc10 pathway and thus mediates enhanced glucose transport via GLUT-4 into muscle cells and adipocytes. The translocation of GLUT-4 to the plasma membrane is also mediated by Akt via AS160 (Akt substrate 160). The net effect of the insulin mediated activation of the IR is the decrement of serum glucose level by enhancing glucose import, storage of glucose as glycogen and by inhibition of gluconeogenesis [3, 8].
Another pathway activated by insulin is the MAPK pathway. Phosphorylated IRS can also recruit GRB2 to the membrane and therefore offer a docking site for the guanyl nucleotide exchange factor SOS. SOS is now able to activate the G protein Ras by exchanging GDP to GTP. This triggers several phophorylation and activation of kinases like RAF-1, MEK and MAPK whereas MAPK can translocate into the nucleus and so affect transcription factors in order to influence cell growth, differentiation and protein synthesis [3, 9].
Figure 1: Simplified overview over the insulin signal pathway and the site of action of PTP1B (see also chapter 2.4.1); scheme adapted from Leclercq [7]
17
2.2 Insulin resistance
Individuals in whom normal levels of insulin cannot elicit an adequate insulin effect in insulin responsive cells (fat, muscle and liver cells), are referred to as insulin resistant [2]. The lack of sensitivity for insulin can be due to multiple factors including sedentary life style, hyper-caloric nutrition, smoking and ageing, but also genetic predisposition is possible. One consequence of insulin resistance is a hyperglycemic state. In the early stages of the insulin resistance, a hypersecretion of insulin (hyperinsulinemia) by the beta cells of the pancreas is the physiologic response trying to counteract hyperglycemia. At first, this prevents the development of frank hyperglycemia but the hyperinsulinemic state more and more results in the downregulation of the IR and desensitization of insulin sensitive tissues. The increased secretion and production of insulin imposes a high burden and stress on the pancreas and sooner or later it is not able to keep up with the upregulated production of insulin and loses its ability to produce insulin. Consequently an impaired insulin action and later a total loss of insulin secretion followed by the elevation of serum glucose level are the final outcomes. Chronic systemic hyperglycemia impairs multiple cell functions. Glucose, in its open chain form, is able to glycosylate proteins and phospholipids at their NH2 functional group, forming advanced glycosylation endproducts (AGEs). AGEs not only interfere with multiple vessel functions but also trigger the generation of reactive oxygen species (ROS) which results in oxidative stress and in the formation of inflammatory cytokines which further damage vessel functions as well alter insulin signalling [13]. Additionally, insulin resistance results in an enhanced production of FFA by the liver and release of FFA by the adipose tissue and in deposition of fat in liver and muscle altering their cellular function (lipotoxicity). Moreover, an elevated plasma FFA level contributes to oxidative stress and inflammation which further impairs insulin signalling [10].
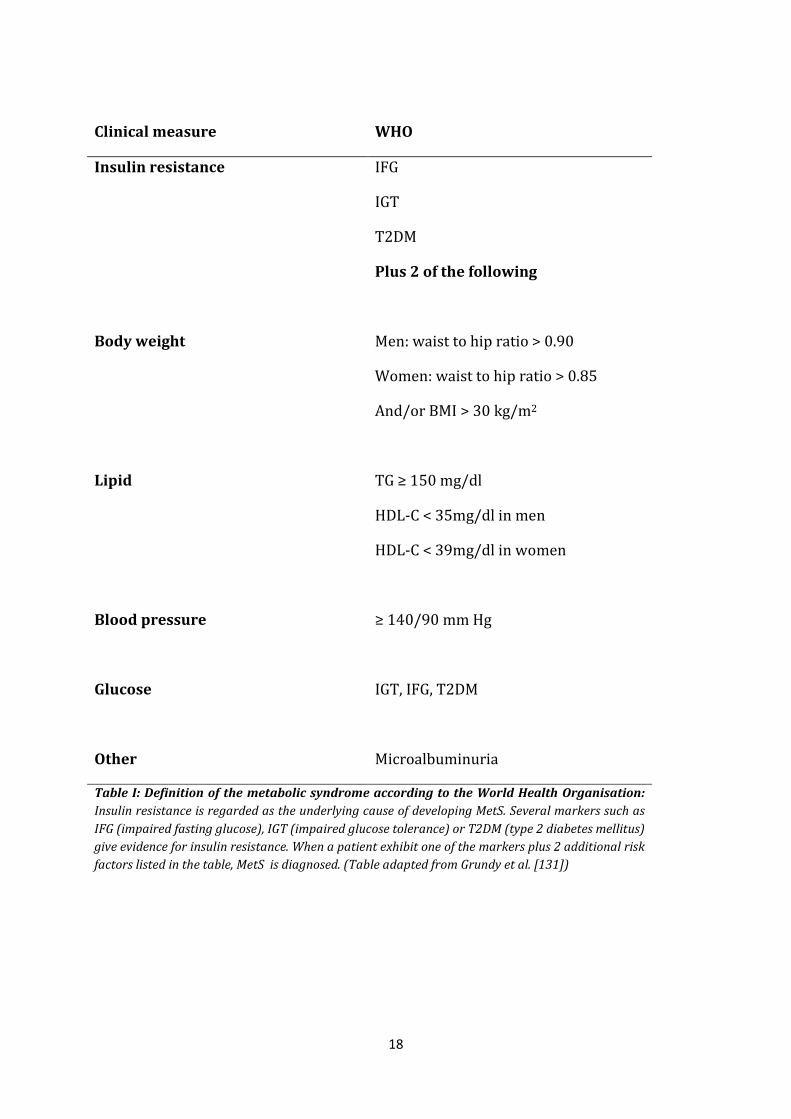
Taken together, insulin resistance induces various abnormalities such as hyperglycemia, hyperinsulinemia, dyslipidemia, and chronic inflammatory state which are common features of type 2 diabetes (T2D) and the metabolic syndrome (MetS) [2]. Therefore, counteracting insulin resistance and metabolic dysfunction can prevent or retard severe diseases like microvascular and macrovascular diseases and at the very end blindness, renal failure, cardiovascular diseases, stroke and finally death. Table 1 shows the metabolic risk factors defined by the WHO as the MetS.
18
Clinical measure WHO
Insulin resistance IFG
IGT
T2DM
Plus 2 of the following
Body weight Men: waist to hip ratio > 0.90
Women: waist to hip ratio > 0.85
And/or BMI > 30 kg/m2
Lipid TG ≥ 150 mg/dl
HDL-C < 35mg/dl in men
HDL-C < 39mg/dl in women
Blood pressure ≥ 140/90 mm Hg
Glucose IGT, IFG, T2DM
Other Microalbuminuria
Table I: Definition of the metabolic syndrome according to the World Health Organisation: Insulin resistance is regarded as the underlying cause of developing MetS. Several markers such as IFG (impaired fasting glucose), IGT (impaired glucose tolerance) or T2DM (type 2 diabetes mellitus) give evidence for insulin resistance. When a patient exhibit one of the markers plus 2 additional risk factors listed in the table, MetS is diagnosed. (Table adapted from Grundy et al. [131])
19
2.3 PTP1B
2.3.1 General
Tyrosine phosphorylation plays an important role in cellular signal transduction. It is reversible and is under strict regulation by PTPs and PTKs (Protein tyrosine phosphatses and kinases). PTKs are responsible for tyrosine phosphorylation which offers docking sites for various adaptor proteins which contain src homology 2 (SH2) or phosphotyrosine binding domains and thereby activate multiple downstream signalling pathways regulating cell growth, differentiation, metabolism, cell cycle, cell–cell communication, cell migration, gene transcription, ion channel activity, immune response and survival. The activity of the PTKs is triggered by extracellular effectors such as growth factors or hormones like insulin. On the contrary, PTPs are able to dephosphorylate the phosphorylated tyrosine residues and thus control the rate and duration while PTKs control the amplitude of the signal response. The act of dephosphorylation can either counteract or potentiate the activity of PTKs. Hence an imbalance of the activity of the PTKs and PTPs would lead to excessive or impaired tyrosine phosphorylation and the development of various human diseases like cancer or diabetes [6, 14-18].
The PTPs can be divided into three major subfamilies: the classical phosphotyrosine specific phosphatases, the dual specificity phosphatases and the pseudophosphatase PTPs. They all, except the pseudophosphatase PTPs, are characterized by the 11 amino acids PTP signature motif (H/V)C(X)5R(S/T) in the highly conserved catalytic domain, which comprises approximately 280 residues, where cysteine (C) and arginine (R) residues are invariant and essential for the catalytic acitivity [6, 19, 20]. The classical phophotyrosine (pTyr) specific phosphatases strictly dephosphorylate phosphorylated tyrosine residues while dual specificity phosphatases have multiple targets like phosphoserine (pSer), phosphothreonine (pThr) as well as phosphotyrosine (pTyr) residues. Pseudophosphatase PTPs contain the core of the PTP signature motif but lack of catalytic essential amino acids and thus are unable to dephosphorylate protein targets. The classical pTyr specific phophatases can be further divided into two subfamilies, namely: the receptor phophotyrosine phosphatases (RPTPs) and the non-transmembrane, cytoplasmic PTPs. The composition of the RPTPs usually consists of an extracellular ligand binding segment and a tandem arrangement of two intracellular PTP domains (catalytic domain) whilst the domain proximal to the membrane (D1) functions as catalytic active domain and the domain distal to the membrane (D2) regulates its catalytic activity or controls the intracellular localization. The cytoplasmic PTPs are characterized by its regulatory sequences. These are domains like hydrophobic segments targeting the intracellular localization and domains which control the catalytic activity [6, 17, 19].
20
2.3.2 Structure and substrate recognition
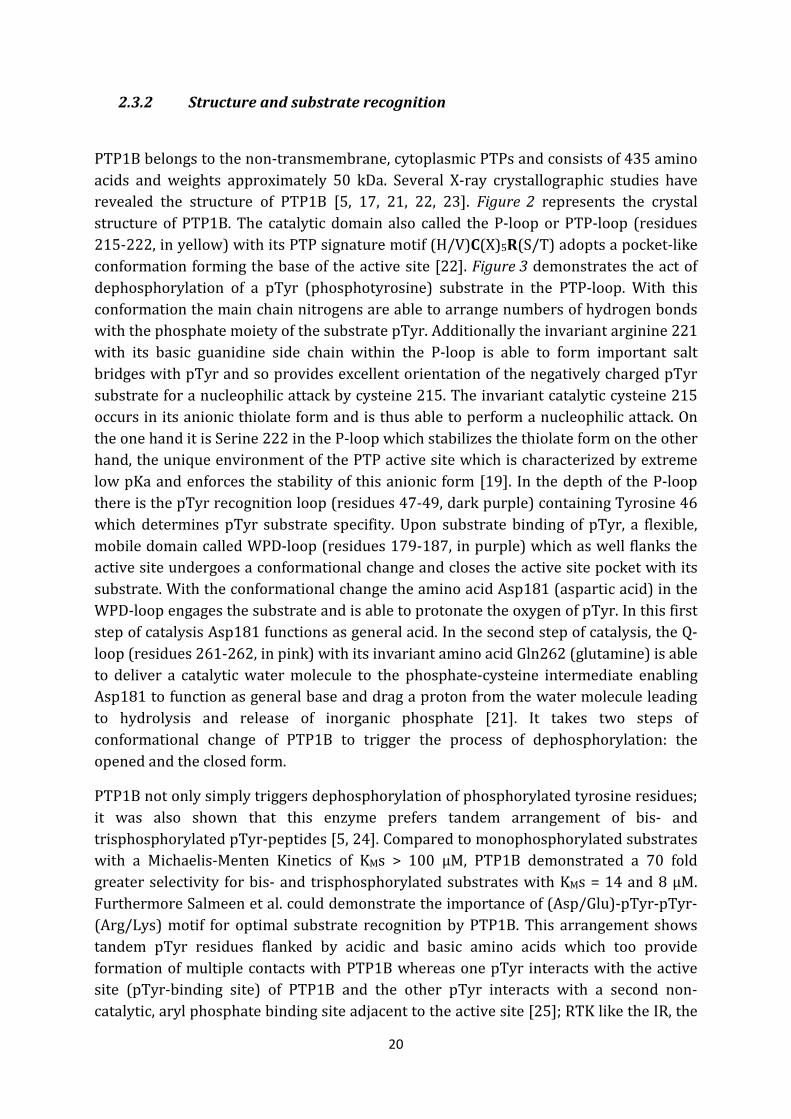
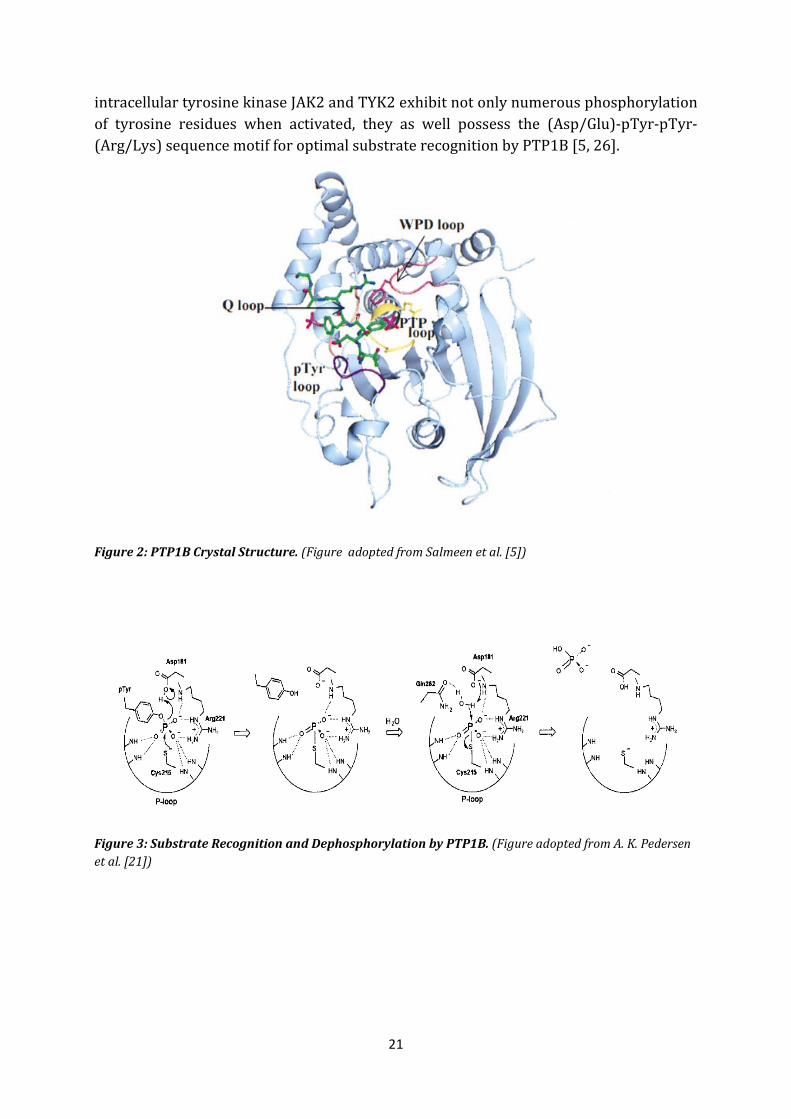
PTP1B belongs to the non-transmembrane, cytoplasmic PTPs and consists of 435 amino acids and weights approximately 50 kDa. Several X-ray crystallographic studies have revealed the structure of PTP1B [5, 17, 21, 22, 23]. Figure 2 represents the crystal structure of PTP1B. The catalytic domain also called the P-loop or PTP-loop (residues 215-222, in yellow) with its PTP signature motif (H/V)C(X)5R(S/T) adopts a pocket-like conformation forming the base of the active site [22]. Figure 3 demonstrates the act of dephosphorylation of a pTyr (phosphotyrosine) substrate in the PTP-loop. With this conformation the main chain nitrogens are able to arrange numbers of hydrogen bonds with the phosphate moiety of the substrate pTyr. Additionally the invariant arginine 221 with its basic guanidine side chain within the P-loop is able to form important salt bridges with pTyr and so provides excellent orientation of the negatively charged pTyr substrate for a nucleophilic attack by cysteine 215. The invariant catalytic cysteine 215 occurs in its anionic thiolate form and is thus able to perform a nucleophilic attack. On the one hand it is Serine 222 in the P-loop which stabilizes the thiolate form on the other hand, the unique environment of the PTP active site which is characterized by extreme low pKa and enforces the stability of this anionic form [19]. In the depth of the P-loop there is the pTyr recognition loop (residues 47-49, dark purple) containing Tyrosine 46 which determines pTyr substrate specifity. Upon substrate binding of pTyr, a flexible, mobile domain called WPD-loop (residues 179-187, in purple) which as well flanks the active site undergoes a conformational change and closes the active site pocket with its substrate. With the conformational change the amino acid Asp181 (aspartic acid) in the WPD-loop engages the substrate and is able to protonate the oxygen of pTyr. In this first step of catalysis Asp181 functions as general acid. In the second step of catalysis, the Q-loop (residues 261-262, in pink) with its invariant amino acid Gln262 (glutamine) is able to deliver a catalytic water molecule to the phosphate-cysteine intermediate enabling Asp181 to function as general base and drag a proton from the water molecule leading to hydrolysis and release of inorganic phosphate [21]. It takes two steps of conformational change of PTP1B to trigger the process of dephosphorylation: the opened and the closed form.
PTP1B not only simply triggers dephosphorylation of phosphorylated tyrosine residues; it was also shown that this enzyme prefers tandem arrangement of bis- and trisphosphorylated pTyr-peptides [5, 24]. Compared to monophosphorylated substrates with a Michaelis-Menten Kinetics of KMs > 100 µM, PTP1B demonstrated a 70 fold greater selectivity for bis- and trisphosphorylated substrates with KMs = 14 and 8 µM. Furthermore Salmeen et al. could demonstrate the importance of (Asp/Glu)-pTyr-pTyr-(Arg/Lys) motif for optimal substrate recognition by PTP1B. This arrangement shows tandem pTyr residues flanked by acidic and basic amino acids which too provide formation of multiple contacts with PTP1B whereas one pTyr interacts with the active site (pTyr-binding site) of PTP1B and the other pTyr interacts with a second non-catalytic, aryl phosphate binding site adjacent to the active site [25]; RTK like the IR, the
21
intracellular tyrosine kinase JAK2 and TYK2 exhibit not only numerous phosphorylation of tyrosine residues when activated, they as well possess the (Asp/Glu)-pTyr-pTyr-(Arg/Lys) sequence motif for optimal substrate recognition by PTP1B [5, 26].
Figure 2: PTP1B Crystal Structure. (Figure adopted from Salmeen et al. [5])
Figure 3: Substrate Recognition and Dephosphorylation by PTP1B. (Figure adopted from A. K. Pedersen et al. [21])
22
2.3.3 Localization and interaction
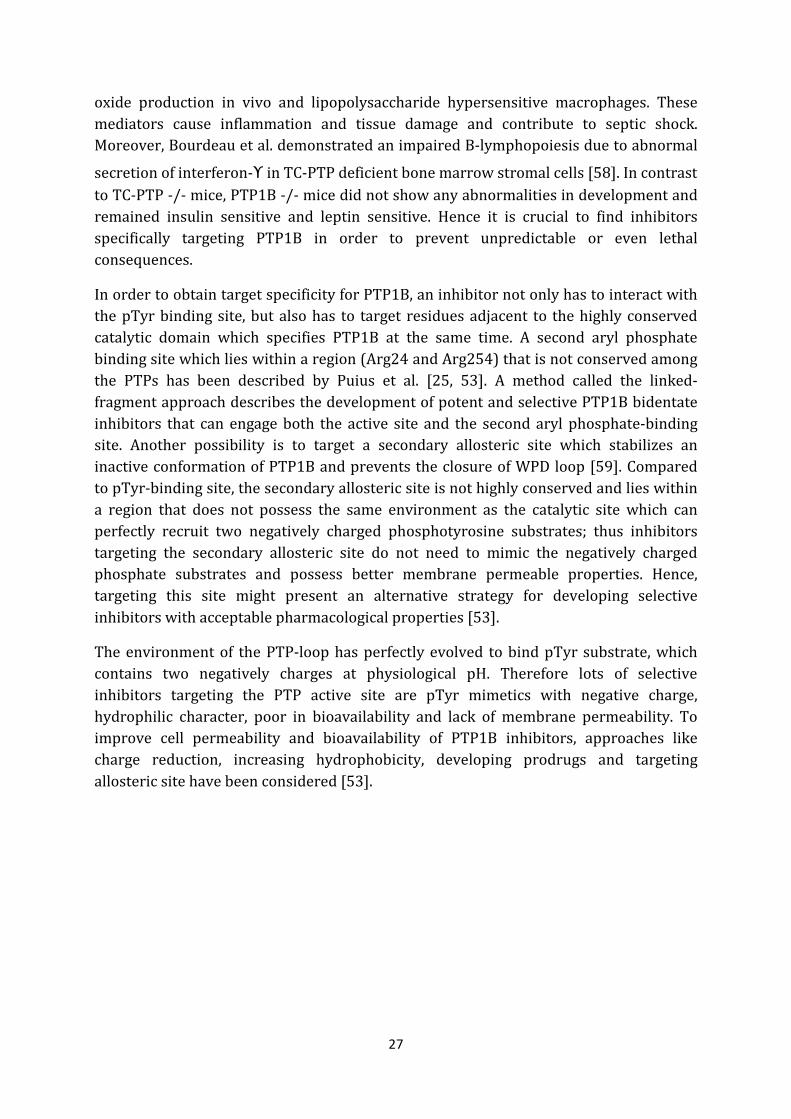
PTP1B is located on the ER (Endoplasmic Reticulum) through a hydrophobic single stretch transmembrane domain on its C-terminus in such a way that the N-terminal catalytic domain of PTP1B is oriented towards the cytoplasmic face of the ER [24, 27, 28]. In between, there are two prolin rich motifs. The function of the two prolin rich motifs is the recognition of proteins containing src homology 3 domain (SH3) like Grb2, Crk and p130 Cas but the entire function of this domain is still not fully understood [29] (Figure 6).
Since many substrates of PTP1B are membrane associated RTKs, it was questioned how the ER localized PTP1B can act on and dephosphorylate its substrates. Four different hypothesis describe the interaction: (i) PTP1B can either directly interact with the plasma membrane localized RTK because the dynamic ER membrane is in constant contact with the plasma membrane [30], (ii) PTP1B is able to translocate to the cell membrane via proteolytic mediated cleavage of its C-terminal anchor [31], (iii) PTP1B dephosphorylates the activated RTK after internalization in a perinuclear endosome compartment [32] or (iv) PTP1B interacts with the biosynthesis of the RTK in the ER even before ligand dependent activation [32, 33].
2.3.4 Regulation
The highly conserved catalytic domain with cysteine 215, the essential core for the enzymatic activity of PTP1B, is highly sensitive for oxidation and inhibition. This oxidation process is reversible and increasing evidence suggests that cellular redox state is involved in regulating tyrosine phosphatase activity [19, 22, 34]. The side chain of cysteine with the thiol group (-SH) can be oxidized to three stages: either sulphenic acid (-SOH), sulphinic acid (-SO2H) or sulphonic acid (-SO3H). Depending on the extent of oxidation this process is reversible and can function as an “on-off” switch. Oxidation of the nucleophilic cysteine 215 of PTP1B to sulphenic acid (reversible process) is followed by the immediate formation of a five atom ring cyclic sulphenamide which is assisted by the environment of the catalytic site. This step is supported by the adjacent histidine on the position 214 which forms a hydrogen bond with the carboxyl oxygen of the catalytic cysteine 215 and thereby polarizes the amide bond between Cys215 and Ser216 promoting a nucleophilic attack by the amide nitrogen of serine 216 on the sulphur atom of the oxidized Cys215 (sulphenic acid) [19]. Forming the cyclic sulphenamide induces a conformational change disrupting the substrate binding properties of PTP1B and exposing the oxidized cysteine to the environment of the cell. This process protects Cys215 from irreversible oxidation to higher oxidized forms and facilitates the reactivation and reduction of PTP1B by reducing agents like DDT (dithiothreithole) or
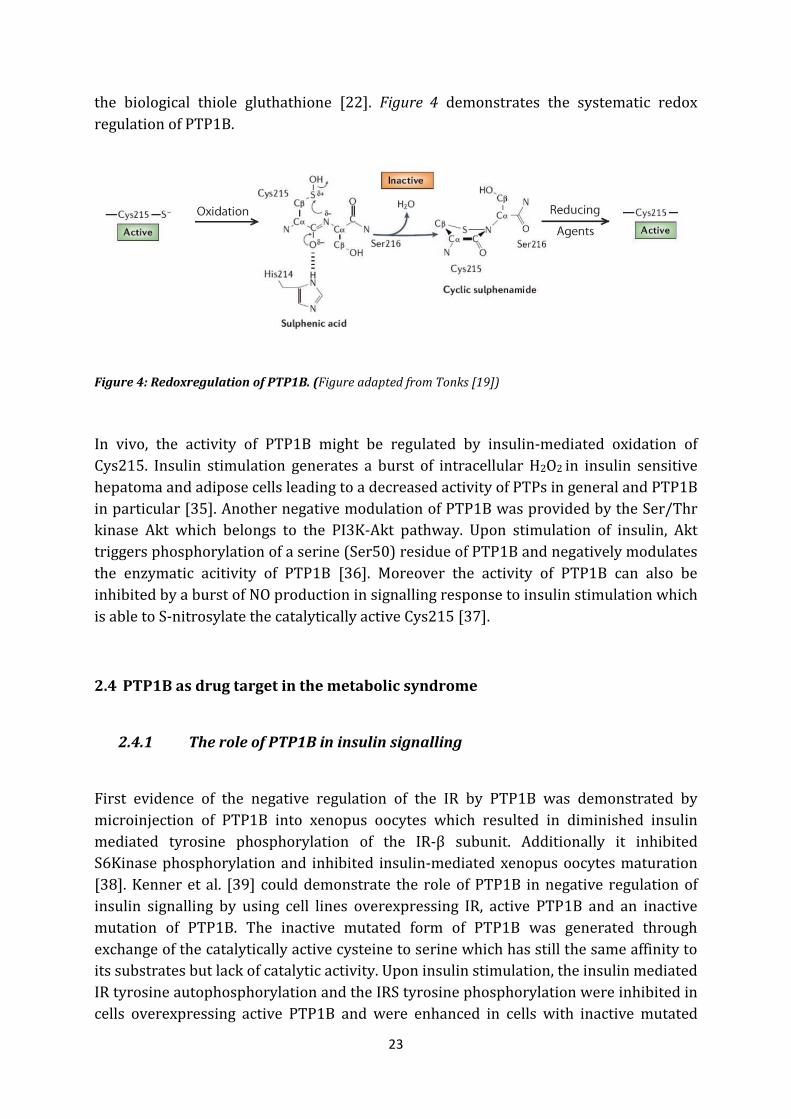
23
the biological thiole gluthathione [22]. Figure 4 demonstrates the systematic redox regulation of PTP1B.
Figure 4: Redoxregulation of PTP1B. (Figure adapted from Tonks [19])
In vivo, the activity of PTP1B might be regulated by insulin-mediated oxidation of Cys215. Insulin stimulation generates a burst of intracellular H2O2 in insulin sensitive hepatoma and adipose cells leading to a decreased activity of PTPs in general and PTP1B in particular [35]. Another negative modulation of PTP1B was provided by the Ser/Thr kinase Akt which belongs to the PI3K-Akt pathway. Upon stimulation of insulin, Akt triggers phosphorylation of a serine (Ser50) residue of PTP1B and negatively modulates the enzymatic acitivity of PTP1B [36]. Moreover the activity of PTP1B can also be inhibited by a burst of NO production in signalling response to insulin stimulation which is able to S-nitrosylate the catalytically active Cys215 [37].
2.4 PTP1B as drug target in the metabolic syndrome
2.4.1 The role of PTP1B in insulin signalling
First evidence of the negative regulation of the IR by PTP1B was demonstrated by microinjection of PTP1B into xenopus oocytes which resulted in diminished insulin mediated tyrosine phosphorylation of the IR-β subunit. Additionally it inhibited S6Kinase phosphorylation and inhibited insulin-mediated xenopus oocytes maturation [38]. Kenner et al. [39] could demonstrate the role of PTP1B in negative regulation of insulin signalling by using cell lines overexpressing IR, active PTP1B and an inactive mutation of PTP1B. The inactive mutated form of PTP1B was generated through exchange of the catalytically active cysteine to serine which has still the same affinity to its substrates but lack of catalytic activity. Upon insulin stimulation, the insulin mediated IR tyrosine autophosphorylation and the IRS tyrosine phosphorylation were inhibited in cells overexpressing active PTP1B and were enhanced in cells with inactive mutated
24
PTP1B. The same result could also be demonstrated by Byon et al. [40]. Goldstein et al. demonstrated a stronger phosphorylation of IRS and also an enhanced complex formation between IRS and the adaptor protein GRB2 in cells with catalytically inactive PTP1B whereas the cells with active PTP1B lose binding of GRB2 [41] suggesting that PTP1B triggers dephosphorylation of IR and IRS. It also seems that PTP1B only interacts with IR when IR undergoes autophosphorylation on its tyrosine residues [42]. Osmotic loading of KRC-7 hepatoma cells with neutralizing antibodies which immunoprecipitate and inactivate PTP1B, enhanced insulin mediated DNA synthesis and PI3K activity due to increased IR autophosphorylation and IRS tyrosine phosphorylation [43]. Furthermore, treatment of insulin sensitive cells with small molecule inhibitors of PTP1B elicited potentiated insulin action [44]. Studies with PTP1B knock-out mice supported these theories. PTP1B knock-out mice displayed enhanced insulin sensitivity and lack of weight gain when submitted to high-fat diet. These mice presented no abnormalities in their up-growth although many scientists feared unpredictable abnormalities in growth and development [45, 46]. These findings demonstrate that PTP1B acts as negative regulator of insulin signalling by dephosphorylating IR and IRS. Additionally PTP1B regulates and controls weight gain and energy homeostasis via leptin signal pathway which will be described in the next chapter [24]. The regulation of insulin signalling by PTP1B is represented in Figure 1.
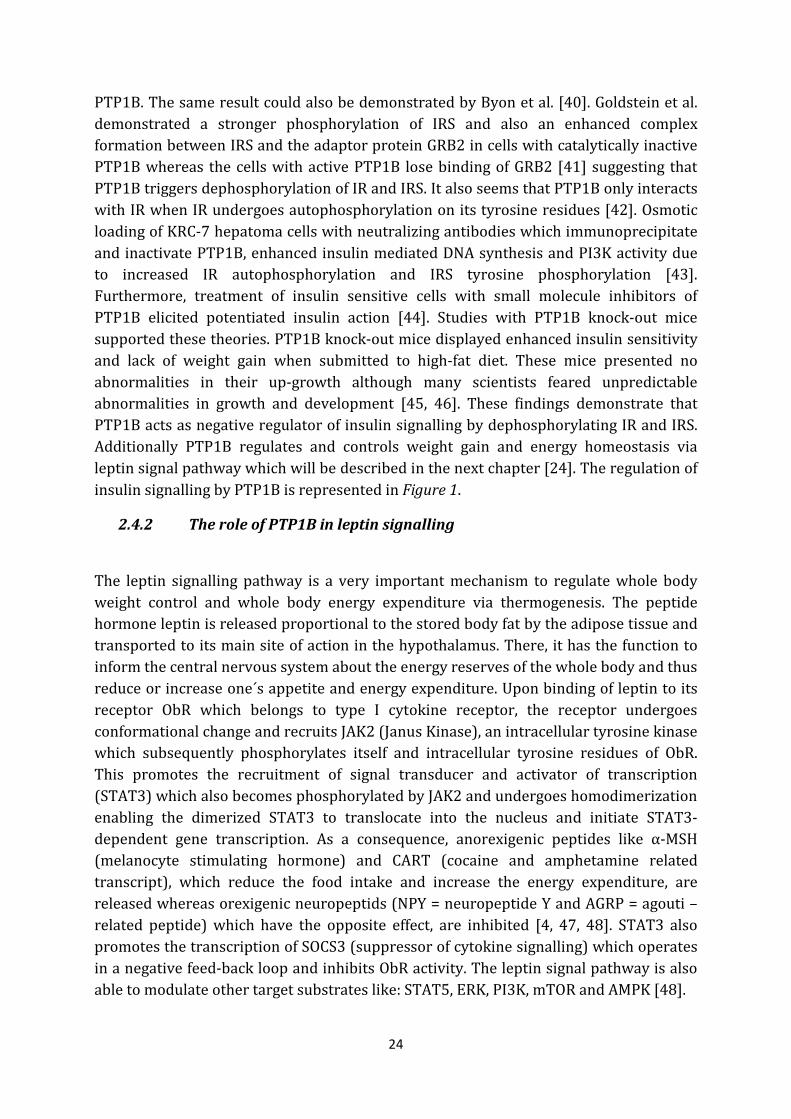
2.4.2 The role of PTP1B in leptin signalling
The leptin signalling pathway is a very important mechanism to regulate whole body weight control and whole body energy expenditure via thermogenesis. The peptide hormone leptin is released proportional to the stored body fat by the adipose tissue and transported to its main site of action in the hypothalamus. There, it has the function to inform the central nervous system about the energy reserves of the whole body and thus reduce or increase one´s appetite and energy expenditure. Upon binding of leptin to its receptor ObR which belongs to type I cytokine receptor, the receptor undergoes conformational change and recruits JAK2 (Janus Kinase), an intracellular tyrosine kinase which subsequently phosphorylates itself and intracellular tyrosine residues of ObR. This promotes the recruitment of signal transducer and activator of transcription (STAT3) which also becomes phosphorylated by JAK2 and undergoes homodimerization enabling the dimerized STAT3 to translocate into the nucleus and initiate STAT3-dependent gene transcription. As a consequence, anorexigenic peptides like α-MSH (melanocyte stimulating hormone) and CART (cocaine and amphetamine related transcript), which reduce the food intake and increase the energy expenditure, are released whereas orexigenic neuropeptids (NPY = neuropeptide Y and AGRP = agouti – related peptide) which have the opposite effect, are inhibited [4, 47, 48]. STAT3 also promotes the transcription of SOCS3 (suppressor of cytokine signalling) which operates in a negative feed-back loop and inhibits ObR activity. The leptin signal pathway is also able to modulate other target substrates like: STAT5, ERK, PI3K, mTOR and AMPK [48].
25
In obese subjects, serum leptin concentration is usually elevated due to hypertrophy of adipose tissue. As mentioned above, leptin is secreted propotional to the size of the adipose tissue. The high level of leptin due to obesity can result in a reduced responsiveness of the leptin receptor leading to a state called leptin resistance, similar to insulin resistance. As a consequence, an impaired leptin signalling leads to excessive food intake and decreased energy expenditure and finally to obesity and impaired insulin signalling [49]. Additionally, morbid adipose cell growth is accompanied by elevation of pro-inflammatory cytokines such as TNF-α, interleukin-1, and interleukin-6 in adipose tissue and serum leading to an inflammatory state. Zabolotny et al. demonstrated an increased PTP1B expression induced by elevated TNF-α concentration in adipose tissue, liver, skeletal muscle as well as in hypothalamic arcuate nucleus, the main site of action of leptin [50].
However, mice lacking PTP1B have been shown to be hypersensitive to insulin and resistant to obesity [45, 46] suggesting PTP1B could also have a crucial role in leptin signalling pathway. Indeed, mice lacking PTP1B have decreased leptin/body fat ratios, remain leptin sensitive and showed enhanced STAT3 phosphorylation [50]. Additionally, Cheng et al. demonstrated an attenuated weight gain, a decreased mass of adipose tissue, a suppression of feeding and an increase in resting metabolic rate in leptin deficient, PTP1B lacking mice [49]. Evidence has shown an age-related increase in PTP1B in association with the leptin resistance [51]. JAK2 has been shown to be a substrate of PTP1B which triggers dephosphorylation of JAK2 and leads to an impaired leptin signalling [26, 49, 50, 52]. As mentioned before, PTP1B favourably recognizes the sequence motif (Asp/Glu)-pTyr-pTyr-(Arg/Lys) of its substrates [5]. This motif displays two adjacent phosphotyrosine residues flanked by acidic (Glutamic acid/Aspartic acid) and basic amino acids (Arginine/Lysine) which could be found on JAK2 within the sequence motif E-Y-Y-R and other substrate mediators of cytokine signalling like TYK2 [26] suggesting that PTP1B is able to regulate food intake and energy expenditure by triggering dephosphorylation of JAK2. Thus inhibiting PTP1B may not only enhance insulin signalling but also provide JAK2 mediated enhancement of leptin signalling. The influence of PTP1B in leptin signalling is presented in Figure 5.
26
Figure 5: Snapshot on PTP1B in leptin signalling; scheme adapted from Zhang [53]
2.4.3 Inhibition of PTP1B
Specifically targeting PTP1B poses several problems and has been and still is a challenge since many phosphatases possess certain sequence similarity especially in their catalytic domain which is characterized by the PTP signature motif (H/V)C(X)5R(S/T). Among all PTPs, one intracellular PTP termed T-cell PTP (TC-PTP) shares 74 % sequence identity in its catalytic domain with PTP1B but has clearly distinct biological functions [24, 53, 55, 56]. In fact, active site directed PTP1B inhibitors also bind to TC-PTP with equal potency [55]. While PTP1B is considered to be the major regulator of insulin and leptin signalling events, TC-PTP also interacts with the IR [54] but is predominantly involved in the process of cytokine signalling recognizing JAK and STAT as its substrates [24]. Moreover, TC-PTP influences the hematopoietic development independent from STAT and JAK. There are two forms of TC-PTP due to alternative splicing events: TC48 (48 kDa) and TC45 (45 kDa). TC48 and TC45 can be found in human tissues whereas in mice there is only TC45. They are ubiquitously expressed but predominantly in hematopoietic tissue. TC-PTP contains a N-terminal catalytic domain which is linked with a C-terminal nuclear localization signal (NLS) indicating that TC-PTP can be found mainly in the nucleus [24, 56] (Figure 6). However, TC-PTP -/- mice displayed immune defects and die within 5 weeks of birth by developing systemic inflammatory diseases [57]
characterized by enhanced serum level of interferon-ϒ, TNF-α, interleukin-12, and nitric
27
oxide production in vivo and lipopolysaccharide hypersensitive macrophages. These mediators cause inflammation and tissue damage and contribute to septic shock. Moreover, Bourdeau et al. demonstrated an impaired B-lymphopoiesis due to abnormal
secretion of interferon-ϒ in TC-PTP deficient bone marrow stromal cells [58]. In contrast to TC-PTP -/- mice, PTP1B -/- mice did not show any abnormalities in development and remained insulin sensitive and leptin sensitive. Hence it is crucial to find inhibitors specifically targeting PTP1B in order to prevent unpredictable or even lethal consequences.
In order to obtain target specificity for PTP1B, an inhibitor not only has to interact with the pTyr binding site, but also has to target residues adjacent to the highly conserved catalytic domain which specifies PTP1B at the same time. A second aryl phosphate binding site which lies within a region (Arg24 and Arg254) that is not conserved among the PTPs has been described by Puius et al. [25, 53]. A method called the linked-fragment approach describes the development of potent and selective PTP1B bidentate inhibitors that can engage both the active site and the second aryl phosphate-binding site. Another possibility is to target a secondary allosteric site which stabilizes an inactive conformation of PTP1B and prevents the closure of WPD loop [59]. Compared to pTyr-binding site, the secondary allosteric site is not highly conserved and lies within a region that does not possess the same environment as the catalytic site which can perfectly recruit two negatively charged phosphotyrosine substrates; thus inhibitors targeting the secondary allosteric site do not need to mimic the negatively charged phosphate substrates and possess better membrane permeable properties. Hence, targeting this site might present an alternative strategy for developing selective inhibitors with acceptable pharmacological properties [53].
The environment of the PTP-loop has perfectly evolved to bind pTyr substrate, which contains two negatively charges at physiological pH. Therefore lots of selective inhibitors targeting the PTP active site are pTyr mimetics with negative charge, hydrophilic character, poor in bioavailability and lack of membrane permeability. To improve cell permeability and bioavailability of PTP1B inhibitors, approaches like charge reduction, increasing hydrophobicity, developing prodrugs and targeting allosteric site have been considered [53].
28
Figure 6: Schematic overview over the domains of PTP1B and TC-PTP. (Figure adopted from N. Dubé [24])
2.5 Natural products as source of PTP1B inhibitors
Since many traditional remedies originating from natural sources are known and successfully used for the treatment of the MetS, many scientists attempted to isolate and purify bioactive components from natural sources hoping to understand the effect of for example herbal drugs on the molecular level and to possibly find novel leads for the therapy against the MetS. In this line, several herbal drugs have already been investigated to discover novel PTP1B inhibitors. Baumgartner et al. isolated 1,2,3,4,6-penta-O-galloyl-D-glucopyranose from the roots of Paeonia lactiflora which has a promising PTP1B inhibitory effect [60]. Ursolic acid, a natural pentacyclic triterpenoid, which frequently occurs in traditional Chinese medicinal herbs such as Symplocos paniculata [61] and Campsis grandiflora was found to inhibit PTP1B, to prolong IR autophosphorylation in CHO/IR (Chinese-hamster ovary cells expressing human IR), and stimulate glucose uptake in L6 myotubes [62] and 3T3-L1 adipocytes [63]. Oleanolic acid, a compound found in various plants, also inhibited PTP1B and enhanced IR autophosphorylation in HepG2 cells. Additionally, it up-regulated GLUT4 expression in 3T3-L1 adipocytes [64, 65].
Using an ethnopharmacological approach, our cooperation partners at the Institutes of Pharmacognosy in Vienna and Innsbruck selected and extracted various plants traditionally prescribed against metabolic disorders in different cultures. These plants included Averroha bilimbi, Agrimoniae pilosa, Arisaema amurense, Phellodendron amurense, and Leonorus sibiricus and will be briefly introduced in the following chapters. In cooperation with the Department of Food Chemistry and Toxicology in Vienna we included apple juice in our testing. Mostly, reports of these plants are limited to mainly phenotypic observations with incomplete or no information concerning active principles and mode of action.
29
2.5.1 Averrhoa bilimbi – Oxalidaceae
Averrhoa bilimbi, a fruit tree about 3–10 meters high, belongs to the family of Oxalidaceae. It is widely spread in South and South-eastern Asia and nowadays it is cultivated in many tropical areas since the tree prefers warm and moist conditions for optimal growth. Its origin goes back to Indonesia and Malaysia. Parts of Averrhoa bilimbi (fruits and leaves) are known for the use in traditional medicine against itching, pimples, mumps, rheumatism, skin eruptions (paste of the leaves); venereal diseases (fresh or fermented leaves), cough (leaf infusion), rectal inflammation (leaf decoction), hemmorrhoids, fever, beri-beri, biliousness, diabetes and hypertension [66]. Its antibacterial, antiscorbutic and astringent abilities are also part of the diversity of this plant.
2.5.2 Agrimoniae pilosa – Rosaceae
The genus Agrimonia which belongs to the Rosaceae is distributed in the temperature regions of the Northern Hemisphere. Various species have been in traditional use; for example Agrimoniae eupatoria are known in Europe for its astringent, cholagogue, diuretic and antidiabetic effects while Agrimoniae japonica has been used as antidiarrhoeica and hemostatica [67].
Agrimoniae pilosa is listed officially in the Chinese Pharmacopoeia. Depending on the illness, different parts of the plants are used. Roots are basically used for the treatment of cancer and the aerial parts as an astringent haemostatic for various bleedings, anti- malarial, anti-dysenteric, antitumor, and antioxidative agent.
2.5.3 Arisaema amurense – Araceae
Arisaema amurense belongs to the family of Araceae and it is widely spread in the region of Eastern Asia. It has been known for its toxicity in folklore. Nevertheless the frequent usage as anticonvulsants [68], expectorans and the usage against respiratory ailments and skin lesions [70] of this genus has been found in the TCM. Additionally, it has been reported to have an anti-microbial and an antitumor effect [69]. The anticonvulsive effect may be due to its inhibitory effect on MAO-B (monoaminoxidase-B) [71]. Effects on platelet aggregation and an antihepatotoxic effect [68] have also been reported. Our cooperation partner at Vienna (E. Rozema and B. Kopp, Department of Pharmacognosy) indicated a possible use in the therapy for T2D and the MetS, since screening of an apolar extract of Arisaema sp (rhizome extract) showed strong agonistic activity towards PPARα and PPARβ which are implicated in metabolic disorders.
30
2.5.4 Phellodendron amurense – Rutaceae
Phellodendron amurense is native in Eastern Asia, especially in China, Japan and Korea [70]. It belongs to the family Rutaceae and its cortex has been used widely in the TCM as an anti-inflammatory, antibacterial, antiphlogistic, immunostimulative and antitumor agent [72, 73]. The major chemical constituents of Phellodendron are alkaloids of the protoberberine type such as berberine, palmitine, phellodendrine and jatrorrhizine [73]. One of the major compounds found in Phellodendron amurense is the alkaloid berberine which is responsible for the major effects of Phellodendron amurense. Addditionally antimicrobial, antihypertensive, anticholinergic, antiarrythmic and anticancer effects have been reported [72]. Other alkaloids like palmatine, jatrorrhizine and magnoflorine, flavones, glycosides, phytosterols and triterpenes have as well been isolated from Phellodendron [74].
2.5.5 Leonorus sibiricus – Lamiaceae
Leonorus sibiricus (LS) is a popular medicinal plant in Southern Asia and is commonly known as “motherwort” in these countries. This plant is used traditionally for various ailments, such as menstrual irregularities, high blood pressure, blood stasis, heart disorders, and dysentery. In Mexico the usage of Leonorus under the name “marihuanilla” has been found. In Mexico, dried leaves are smoked and mildy narcotic or cannabis like effects have been described. Several alkaloids, flavonoids, iridoids, phenylpropanoids, and labdane diterpenoids have been found so far [75]. Personal communication of Prof. Glasl (Department of Pharmacognosy, Vienna) with collaboration partners in Mongolia indicated a hypoglycemic effect of a LS leaf extract in an animal model of diabetes.
2.5.6 Malus species – Rosaceae
Apple is a pomaceous fruit deriving from different Malus species, the apple tree. Malus sp belongs to the family Rosaceae and more than 50 different species are known for yielding the fruit apple. It is cultivated across the world and is counted among the most important fruit supplier nowadays [76]. Depending on the cultivar, harvest, storage, and processing of the apples, their phythochemicals and concentration might be variable. However, apples possess a great antioxidative capacity due to high concentration of polyphenols like flavonoids (quercetin, catechin, epicatechin, procyanidine) and other antioxidative compounds like coumaric acid, gallic acid, phloretin and chlorogenic acid [77]. Other components of the apple are potassium, ferrum, folic acid, vitamin C, pectin, cellulose [78], biotin, and fructose [79]. Traditional uses of apple include treatment of

31
cancer, diabetes, fever, heart ailments, scurvy, and warts. The large pectin content makes the fruit valuable for both constipation and diarrhea [80].

32

33
34
C. Materials and Methods

35
36
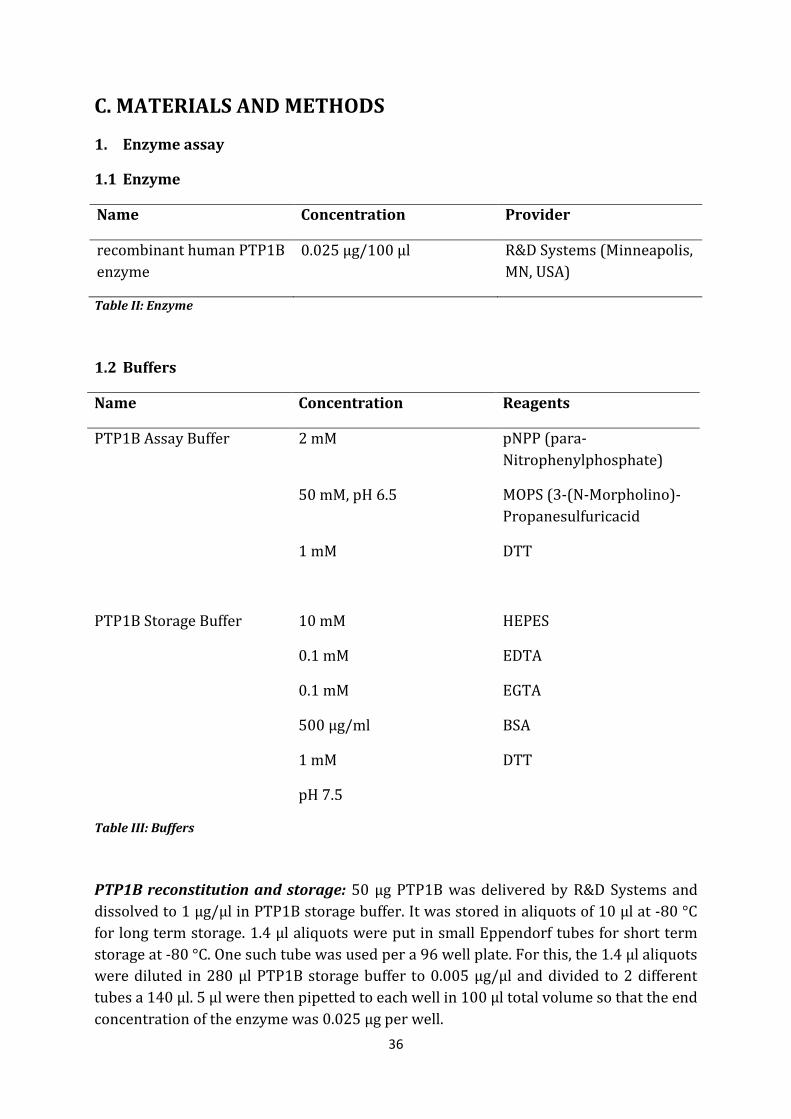
C. MATERIALS AND METHODS
1. Enzyme assay
1.1 Enzyme
Name Concentration Provider
recombinant human PTP1B enzyme
0.025 µg/100 µl R&D Systems (Minneapolis, MN, USA)
Table II: Enzyme
1.2 Buffers
Name Concentration Reagents
PTP1B Assay Buffer 2 mM pNPP (para-Nitrophenylphosphate)
50 mM, pH 6.5 MOPS (3-(N-Morpholino)-Propanesulfuricacid
1 mM DTT
PTP1B Storage Buffer 10 mM HEPES
0.1 mM EDTA
0.1 mM EGTA
500 µg/ml BSA
1 mM DTT
pH 7.5
Table III: Buffers
PTP1B reconstitution and storage: 50 µg PTP1B was delivered by R&D Systems and dissolved to 1 µg/µl in PTP1B storage buffer. It was stored in aliquots of 10 µl at -80 °C for long term storage. 1.4 µl aliquots were put in small Eppendorf tubes for short term storage at -80 °C. One such tube was used per a 96 well plate. For this, the 1.4 µl aliquots were diluted in 280 µl PTP1B storage buffer to 0.005 µg/µl and divided to 2 different tubes a 140 µl. 5 µl were then pipetted to each well in 100 µl total volume so that the end concentration of the enzyme was 0.025 µg per well.
37
1.3 Test compounds and controls
Name Concentration
Provider
Phosphatase Inhibitors
Ursolic Acid (UA) 30 µM Sigma (St. Louis, MO, USA)
Sodium orthovanadate (SOV) 5 – 10 µM Sigma (St. Louis, MO, USA)
Test compounds/extracts
Extracts/subfractions of Averroha bilimbi (leaves)
10 µg/ml S. Schwaiger, H. Stuppner (University of Innsbruck, Innsbruck, A)
Extracts/subfractions of Agrimoniae herba
10 µg/ml D. Steinmann, H. Stuppner (University of Innsbruck, Innsbruck, A)
Extracts and subfractions Arisaema species (rhizomes)
10 µg/ml E. Rozema, B. Kopp (University of Vienna, Vienna, A)
Glucocerebrosid – ref1 (992) 10 µM E. Rozema, B. Kopp (University of Vienna, Vienna, A)
Palmitic acid (PA) 50 µM E. Rozema, B. Kopp (University of Vienna, Vienna, A)
Stearic acid (SA) 50 µM E. Rozema, B. Kopp(University of Vienna, Vienna, A)
Oleic acid (OA) 50 µM E. Rozema, B. Kopp (University of Vienna, Vienna, A)
Linoleic acid (LA) 50 µM E. Rozema, B. Kopp (University of Vienna, Vienna, A)
Extracts/fractions of Phellodendron sp.(cortex)
10 µg/ml D. Steinmann, H. Stuppner (University of Innsbruck, Innsbruck, A)
Extracts of Leonorus sibiricus leaves (LS)
10 µg/ml S. Glasl, A. Sigmund (University of Vienna)
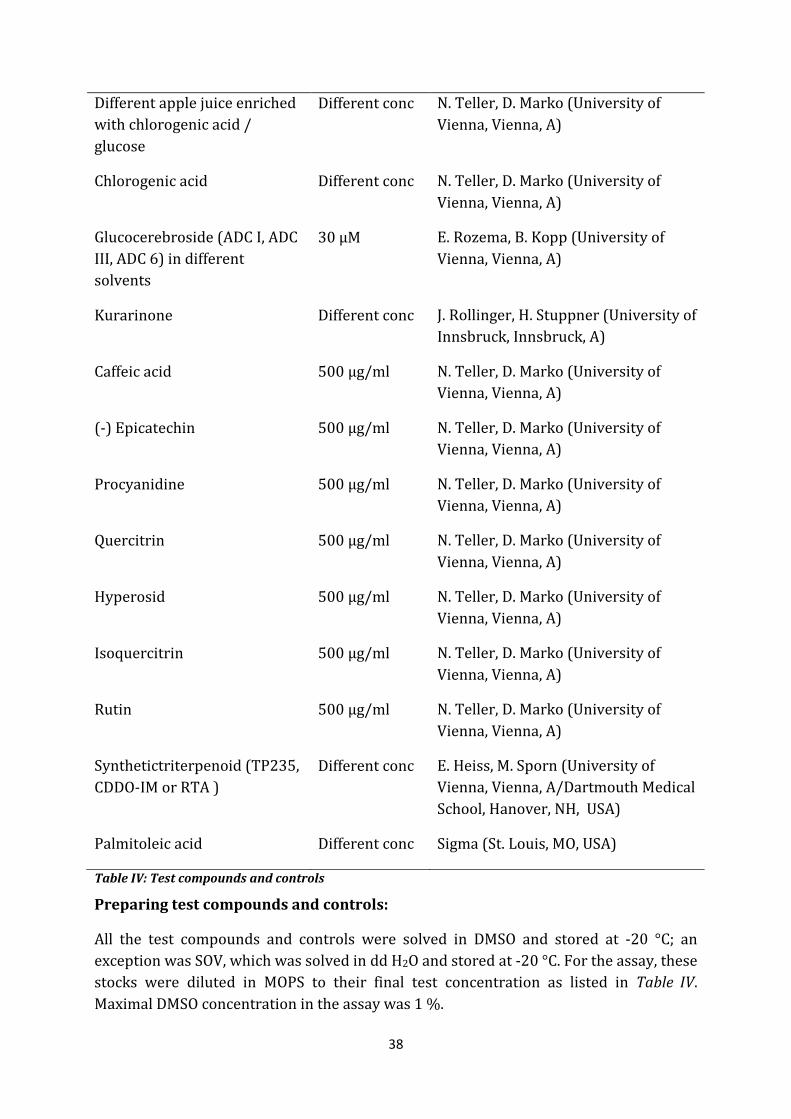
38
Different apple juice enriched with chlorogenic acid / glucose
Different conc N. Teller, D. Marko (University of Vienna, Vienna, A)
Chlorogenic acid Different conc N. Teller, D. Marko (University of Vienna, Vienna, A)
Glucocerebroside (ADC I, ADC III, ADC 6) in different solvents
30 µM E. Rozema, B. Kopp (University of Vienna, Vienna, A)
Kurarinone Different conc J. Rollinger, H. Stuppner (University of Innsbruck, Innsbruck, A)
Caffeic acid 500 µg/ml N. Teller, D. Marko (University of Vienna, Vienna, A)
(-) Epicatechin 500 µg/ml N. Teller, D. Marko (University of Vienna, Vienna, A)
Procyanidine 500 µg/ml N. Teller, D. Marko (University of Vienna, Vienna, A)
Quercitrin 500 µg/ml N. Teller, D. Marko (University of Vienna, Vienna, A)
Hyperosid 500 µg/ml N. Teller, D. Marko (University of Vienna, Vienna, A)
Isoquercitrin 500 µg/ml N. Teller, D. Marko (University of Vienna, Vienna, A)
Rutin 500 µg/ml N. Teller, D. Marko (University of Vienna, Vienna, A)
Synthetictriterpenoid (TP235, CDDO-IM or RTA )
Different conc E. Heiss, M. Sporn (University of Vienna, Vienna, A/Dartmouth Medical School, Hanover, NH, USA)
Palmitoleic acid Different conc Sigma (St. Louis, MO, USA)
Table IV: Test compounds and controls
Preparing test compounds and controls:
All the test compounds and controls were solved in DMSO and stored at -20 °C; an exception was SOV, which was solved in dd H2O and stored at -20 °C. For the assay, these stocks were diluted in MOPS to their final test concentration as listed in Table IV. Maximal DMSO concentration in the assay was 1 %.
39
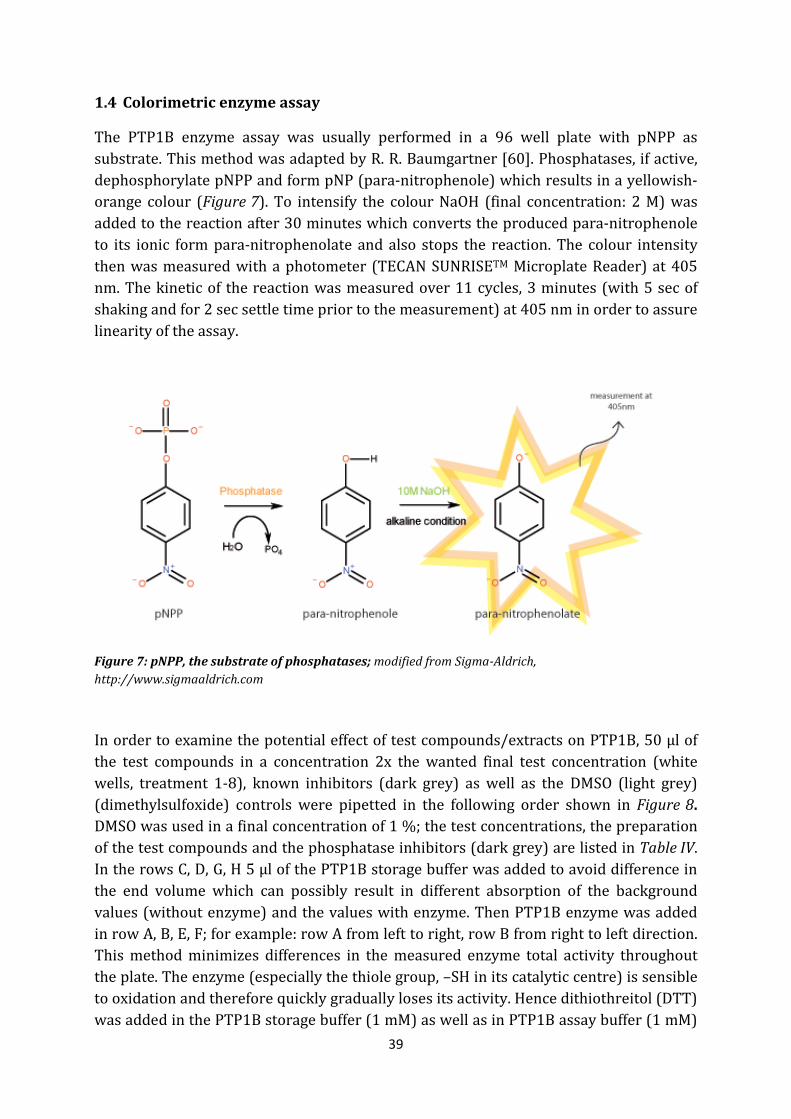
1.4 Colorimetric enzyme assay
The PTP1B enzyme assay was usually performed in a 96 well plate with pNPP as substrate. This method was adapted by R. R. Baumgartner [60]. Phosphatases, if active, dephosphorylate pNPP and form pNP (para-nitrophenole) which results in a yellowish-orange colour (Figure 7). To intensify the colour NaOH (final concentration: 2 M) was added to the reaction after 30 minutes which converts the produced para-nitrophenole to its ionic form para-nitrophenolate and also stops the reaction. The colour intensity then was measured with a photometer (TECAN SUNRISETM Microplate Reader) at 405 nm. The kinetic of the reaction was measured over 11 cycles, 3 minutes (with 5 sec of shaking and for 2 sec settle time prior to the measurement) at 405 nm in order to assure linearity of the assay.
Figure 7: pNPP, the substrate of phosphatases; modified from Sigma-Aldrich, http://www.sigmaaldrich.com
In order to examine the potential effect of test compounds/extracts on PTP1B, 50 µl of the test compounds in a concentration 2x the wanted final test concentration (white wells, treatment 1-8), known inhibitors (dark grey) as well as the DMSO (light grey) (dimethylsulfoxide) controls were pipetted in the following order shown in Figure 8. DMSO was used in a final concentration of 1 %; the test concentrations, the preparation of the test compounds and the phosphatase inhibitors (dark grey) are listed in Table IV. In the rows C, D, G, H 5 µl of the PTP1B storage buffer was added to avoid difference in the end volume which can possibly result in different absorption of the background values (without enzyme) and the values with enzyme. Then PTP1B enzyme was added in row A, B, E, F; for example: row A from left to right, row B from right to left direction. This method minimizes differences in the measured enzyme total activity throughout the plate. The enzyme (especially the thiole group, –SH in its catalytic centre) is sensible to oxidation and therefore quickly gradually loses its activity. Hence dithiothreitol (DTT) was added in the PTP1B storage buffer (1 mM) as well as in PTP1B assay buffer (1 mM)
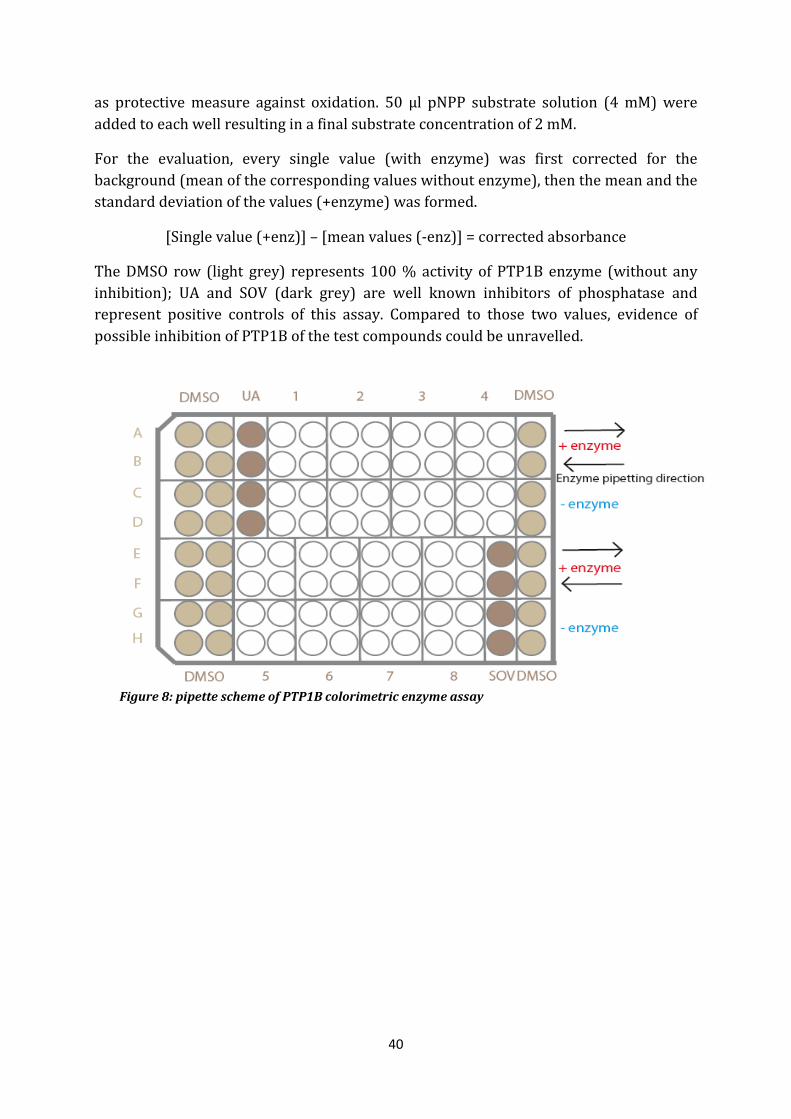
40
as protective measure against oxidation. 50 µl pNPP substrate solution (4 mM) were added to each well resulting in a final substrate concentration of 2 mM.
For the evaluation, every single value (with enzyme) was first corrected for the background (mean of the corresponding values without enzyme), then the mean and the standard deviation of the values (+enzyme) was formed.
[Single value (+enz)] – [mean values (-enz)] = corrected absorbance
The DMSO row (light grey) represents 100 % activity of PTP1B enzyme (without any inhibition); UA and SOV (dark grey) are well known inhibitors of phosphatase and represent positive controls of this assay. Compared to those two values, evidence of possible inhibition of PTP1B of the test compounds could be unravelled.
Figure 8: pipette scheme of PTP1B colorimetric enzyme assay
41
2. Cell culture
2.1 Cells
Human hepatoma cells HCC-1.2 were kindly provided by M. Eisenbauer from the Vienna Institute of Cancer Research. They were used for our experiments since liver cells are one of the major insulin sensitive cell types.
2.2 Medium and buffers
Name Concentration/Volume Reagents
Growth medium (HCC-1.2) 500 ml RPMI 1640
RPMI/10 % FCS 10 % FCS
2 mM L-Glutamine
Starving medium (HCC-1.2) 500 ml RPMI 1640
RPMI/1 % BSA 1 % BSA
2 mM L-Glutamine
PBS pH = 7.4 (autoclaved) 8.0 g NaCl
0.2 g KCl
1.15 g Na2HPO4
0.5 g KH2PO4
0.25 g MgCl2 x 6H2O
0.25 g CaCl2 x 2H2O
ad 1000 ml dd H2O
Trypsin/Na-EDTA 0.05 % Trypsin
0.02 % Na2-EDTA
Table V: Medium and buffers
Medium and buffers were stored at 4 °C.
42
2.3 Cultivation of cells
Human hepatoma cells (HCC-1.2) were cultured in a T-175 flask near confluency. They were stored in an incubator with permanent 5 % CO2 at 37 °C in 30 ml growth medium (RPMI/10 % FCS/2 mM L-Glutamine). A change of colour of the medium indicated a pH change, therefore the medium was discarded preterm and new 30 ml nutrition medium was added. This was done every second/third day to assure an optimal growth of the cells.
For the experiment HCC were passaged. The nutrition medium was removed from T-175 flask following by adding 4-5 ml PBS as washing solution. After removing the washing solution the cells were incubated with 7 ml trypsin at 37 °C for 3-4 minutes. With 13 ml nutrition medium (RPMI/10 % FCS) the cells were resuspended and also trypsin was inactivated. This mixture was put in a centrifuge to spin down the cells (200 x g, 3 min). A separation of cell pellets and a liquid layer was obtained. While the liquid layer was discarded, the cell pellets were resuspended in 10 ml growth medium (RPMI/10 % FCS).
One part of the resuspended cells were passaged in a T-175 flask (split ratio 1:10) for further cultivation.
3. Western blotting
3.1 Buffers and solutions
Name Concentration/volume Reagents
RIPA buffer 150 mM NaCl
Stock solution 50 mM Tris-HCl pH = 7.4
1 % Nonidet P 40
0.25 % Deoxycholat
0.1 % SDS
ad 50 ml H2O
Prior to use: 1880 µl RIPA buffer stock solution
80 µl Complete
20 µl PMSF (50 mM)
43
10 µl NaF (1 M)
10 µl SOV (100 mM)
SDS sample buffer (3x buffer)
Stock solution TRIS-HCL pH 6.8, 0.5 M 37.5 ml
SDS 6.0 g
Glycerol 30.0 ml
Bromophenol blue 15.0 mg
aqua dest. Ad 100.0 ml
Prior to use: Stock solution 85 %
2-Mercaptoethanol 15 %
Table VI: Buffers and solutions
3.2 Antibodies
Name Origin Dilution Provider
Primary antibodies
IR-β subunit Rabbit, mc 1:1000 New England Biolabs (Beverly; MA USA)
Phospho IR Rabbit, mc 1:1000 Sigma (St. Louis, MO, USA)
Y-1158, 1162, 1163
Alpha-Tubulin Mouse, mc 1:1000 Santa Cruz ( Santa Cruz, CA, USA)
44
Secondary antibodies
Rabbit IgG goat 1:1000 New England Biolabs (Beverly; MA USA)
Mouse IgG goat 1:1000 Upstate (Bellerica; MA; USA)
Table VII: Antibodies
Preparing the antibodies
The antibodies were all diluted in 1x TBS-T. All antibodies were stored at -20 °C.
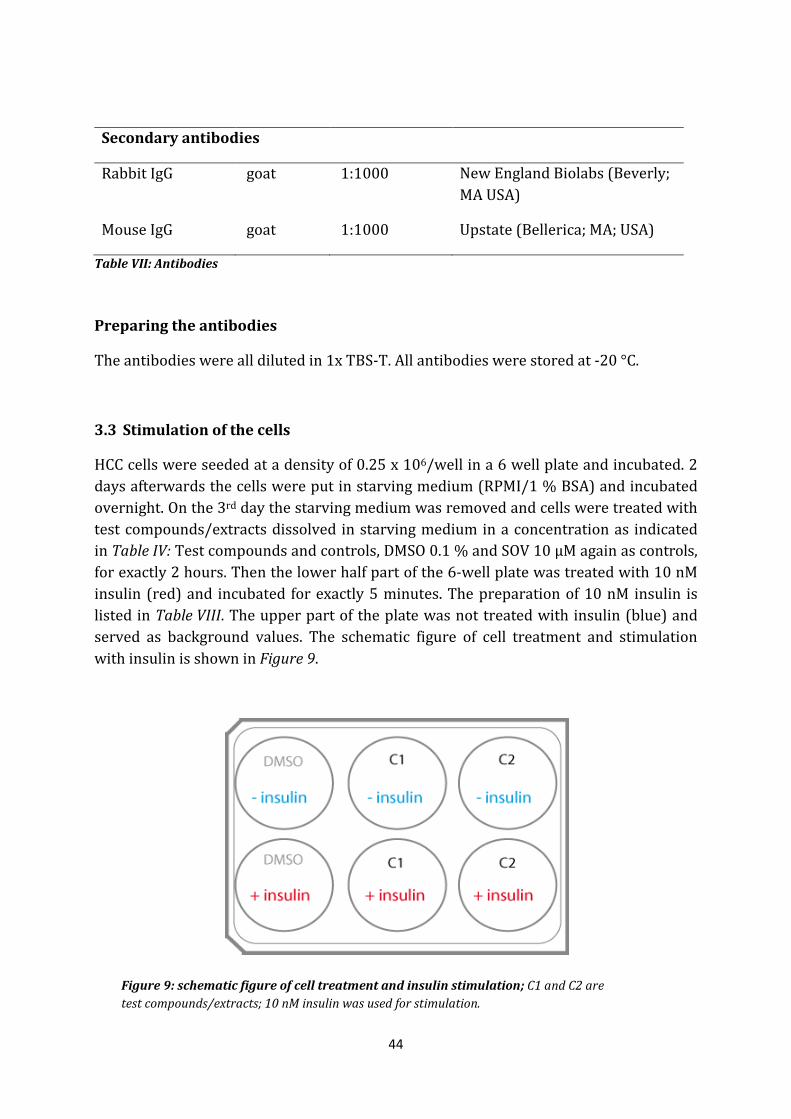
3.3 Stimulation of the cells
HCC cells were seeded at a density of 0.25 x 10⁶/well in a 6 well plate and incubated. 2 days afterwards the cells were put in starving medium (RPMI/1 % BSA) and incubated overnight. On the 3rd day the starving medium was removed and cells were treated with test compounds/extracts dissolved in starving medium in a concentration as indicated in Table IV: Test compounds and controls, DMSO 0.1 % and SOV 10 µM again as controls, for exactly 2 hours. Then the lower half part of the 6-well plate was treated with 10 nM insulin (red) and incubated for exactly 5 minutes. The preparation of 10 nM insulin is listed in Table VIII. The upper part of the plate was not treated with insulin (blue) and served as background values. The schematic figure of cell treatment and stimulation with insulin is shown in Figure 9.
Figure 9: schematic figure of cell treatment and insulin stimulation; C1 and C2 are test compounds/extracts; 10 nM insulin was used for stimulation.
45
Table VIII: Insulin
1 µl insulin stock solution (1.7 mM) was diluted in 849 µl RPMI/1 % BSA resulting in a concentration of 2 µM. 10 µl of 2 µM insulin was pipetted per well in 2 ml total volume resulting in a final concentration of 10 nM insulin. The 1.7 mM insulin stock was stored at 4 °C.
3.4 Preparation of protein extracts
After treatment the plate was put on ice, the medium was discarded and cells were washed 2 times with 2 ml of cold PBS. The cells were lysed by addition of 80 µl/well RIPA lysis buffer and the cells were scratched from the surface and transferred in 1.5 ml Eppendorfs. Sonification 3 times for 10 sec per sample was then initiated to shear the cell membrane in order to allow detection of the IR, which is a transmembrane protein, by western blot. Afterwards the lysates were centrifuged and stored at -20 °C.
3.5 Bradford
The protein quantification was performed by the Bradford Assay in a 96 well plate according to M. M. Bradford [81]. 1 µl of the lysates was diluted in 10 µl ddH2O and 190 µl Bradford reagent which binds to protein and once bound shifts its maximal absorption from 365 to 595 nm. Preparation of Bradford reagent is listed in Table IX. Accordingly, the plate was read at a wavelength of 595 nm in a TECAN SUNRISETM
Microplate Reader. With BSA in concentrations ranging from 0–500 µg/ml a standard curve was created, which allowed a quantification of the protein content of the lysates. All lysates and BSA standards were tested in triplicate.
Table IX: Bradford reagent
Name Test concentration Provider
Insulin (1.7 mM) 10 nM Sigma (St. Louis, MO, USA)
Stock solution
Protein quantification solution
Bradford reagent 20 % Rotiquant TM
80 % H2O
46
3.6 Electrophoresis and blotting
The separation of the proteins was performed by reducing SDS PAGE (Sodium dodecyl sulphate polyacrylamide gel electrophoresis) according to Laemmli [82]. With regard to the size of the insulin receptor (~ 90 kDa) 7.5 % gels were prepared. 20 µg protein was applied to each pocket of the gels. Before that, 3x SDS sample buffer was added to each protein sample (i.e. ½ volume SDS sample buffer to 1 volume protein sample) and heated at 95 °C for 5 minutes for denaturation. The electrophoresis was performed with a Biorad Minitrans-Blot® cell with constant voltage of 100 V in 1x Electrophoresis buffer.
The SDS polyacrylamide gel with the separated proteins were put in an assembled blotting device and transferred on a PVDF membrane with 100 V for 100 minutes. In the process 1x blotting buffer was used.
SDS PAGE
10 % SDS 5.0 g SDS
Ad 50.0 ml Aqua dest.
Tris-HCl (1.5 M, pH 8.8) 18.17 g Tris-Base
Ad 100 ml Aqua dest.
Adjust pH to 8.8 HCl
Tris-HCl (1.25 M, pH 6.8) 15.14 g Tris-Base
Ad 100 ml Aqua dest.
Adjust pH to 6.8 HCl
APS (10 %) 1.0 g APS
Ad 10.0 ml Aqua dest.
Stacking gel 1.28 ml PAA
5.25 ml Aqua bidest.
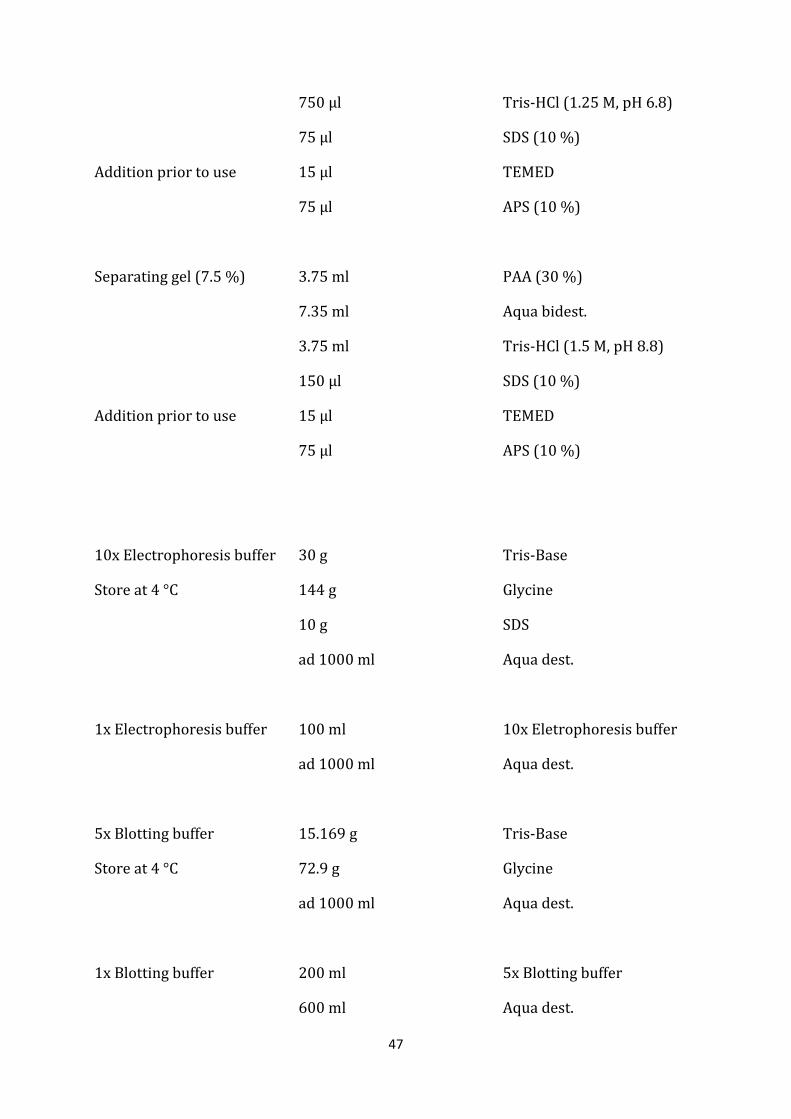
47
750 µl Tris-HCl (1.25 M, pH 6.8)
75 µl SDS (10 %)
Addition prior to use 15 µl TEMED
75 µl APS (10 %)
Separating gel (7.5 %) 3.75 ml PAA (30 %)
7.35 ml Aqua bidest.
3.75 ml Tris-HCl (1.5 M, pH 8.8)
150 µl SDS (10 %)
Addition prior to use 15 µl TEMED
75 µl APS (10 %)
10x Electrophoresis buffer 30 g Tris-Base
Store at 4 °C 144 g Glycine
10 g SDS
ad 1000 ml Aqua dest.
1x Electrophoresis buffer 100 ml 10x Eletrophoresis buffer
ad 1000 ml Aqua dest.
5x Blotting buffer 15.169 g Tris-Base
Store at 4 °C 72.9 g Glycine
ad 1000 ml Aqua dest.
1x Blotting buffer 200 ml 5x Blotting buffer
600 ml Aqua dest.
48
Table X: SDS Page
3.7 Incubation with antibodies and detection
For the detection of the protein of interest, the PVDF membrane was first incubated in a solution of 5 % BSA in 1x TBS-T for 2 hours in order to block all unspecific binding sites of the membrane. After this process, it was washed 3 times with 1x TBS-T (duration of washing: 10 min/wash) and was incubated with the primary antibody overnight at 4 °C.
On the next day the membrane was washed 3 times with 1x TBS-T, and according to the source of primary antibody a secondary anti-mouse or anti-rabbit antibody labelled with HRP (horseradish peroxidise) was applied for 2 hours. (Primary and secondary antibodies are shown in Table VII under section 3.2). Afterwards the membrane was washed 3x with TBS-T and incubated with an ECL solution (containing Luminol, p-coumaric acid and H2O2), which the HRP uses to create a luminescent signal that in turn can be detected using LAS-3000TM FUJIFILM Luminescent Image Analyser. With AIDATM software the bands were quantified densitometrically.
The antibodies were stripped from the membrane with 0.5 N NaOH for 20 minutes, and the membrane was then used for incubation with another antibody.
solutions
10x TBS-T pH 8.0 3.0 g Tris-Base
11.1 g NaCl
1 ml Tween 20
Ad 1000 ml Aqua dest.
1 x TBS-T 100 ml 10x TBS-T
Ad 1000 ml Aqua dest.
5 % BSA in TBS-T 5 g BSA
Ad 100 g dd H2O
200 ml MeOH
49
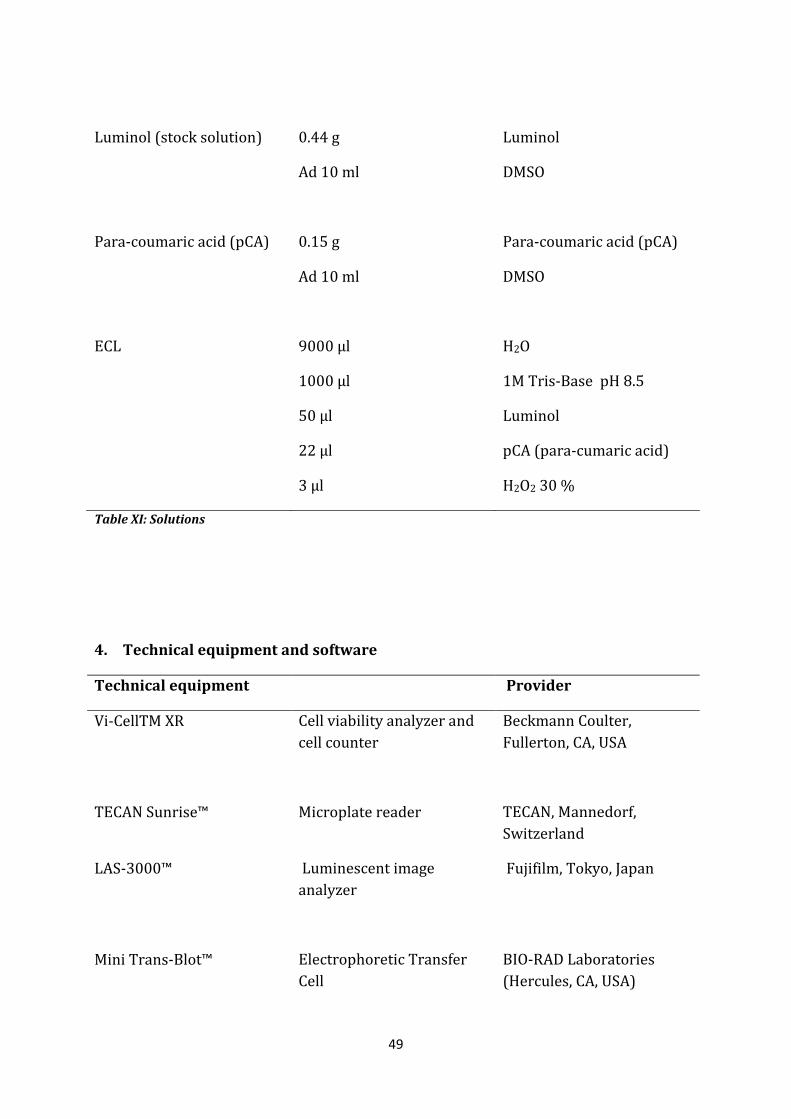
Luminol (stock solution) 0.44 g Luminol
Ad 10 ml DMSO
Para-coumaric acid (pCA) 0.15 g Para-coumaric acid (pCA)
Ad 10 ml DMSO
ECL 9000 µl H2O
1000 µl 1M Tris-Base pH 8.5
50 µl Luminol
22 µl pCA (para-cumaric acid)
3 µl H2O2 30 %
Table XI: Solutions
4. Technical equipment and software
Technical equipment Provider
Vi-CellTM XR Cell viability analyzer and cell counter
Beckmann Coulter, Fullerton, CA, USA
TECAN Sunrise™ Microplate reader TECAN, Mannedorf, Switzerland
LAS-3000™ Luminescent image analyzer
Fujifilm, Tokyo, Japan
Mini Trans-Blot™
Electrophoretic Transfer Cell
BIO-RAD Laboratories (Hercules, CA, USA)
50
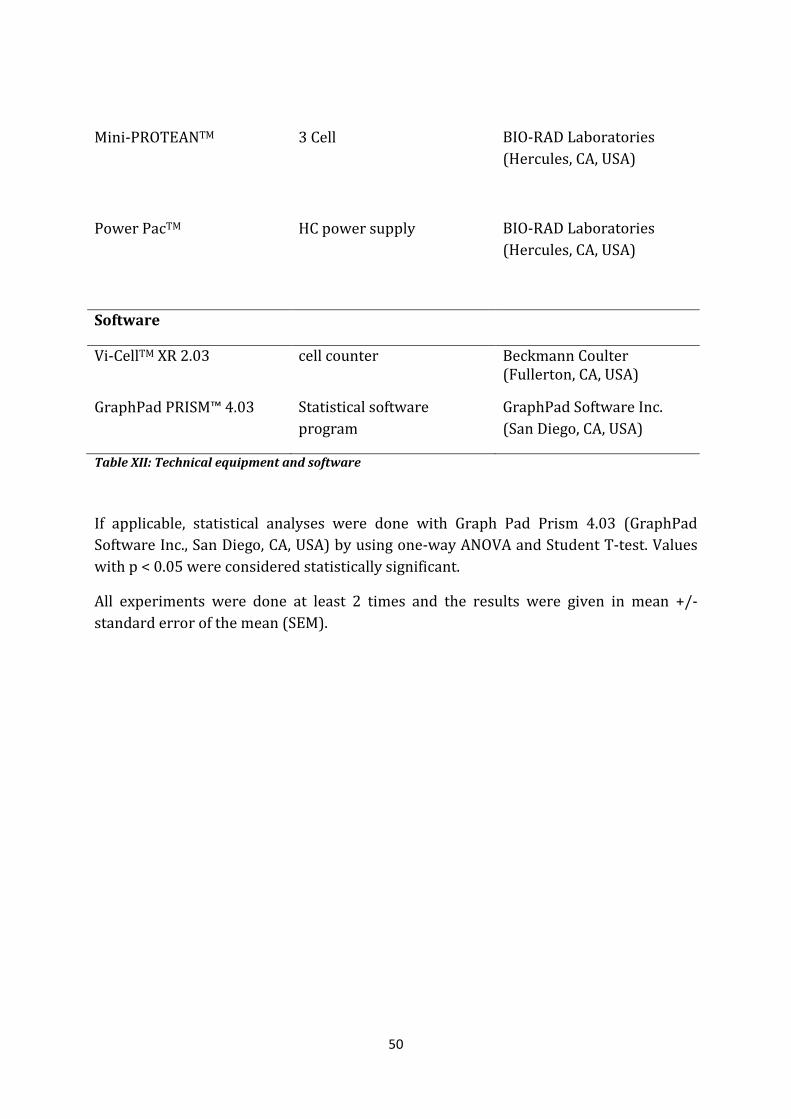
Mini-PROTEANTM
3 Cell BIO-RAD Laboratories (Hercules, CA, USA)
Power PacTM HC power supply BIO-RAD Laboratories (Hercules, CA, USA)
Software
Vi-CellTM XR 2.03
cell counter Beckmann Coulter (Fullerton, CA, USA)
GraphPad PRISM™ 4.03 Statistical software program
GraphPad Software Inc. (San Diego, CA, USA)
Table XII: Technical equipment and software
If applicable, statistical analyses were done with Graph Pad Prism 4.03 (GraphPad Software Inc., San Diego, CA, USA) by using one-way ANOVA and Student T-test. Values with p < 0.05 were considered statistically significant.
All experiments were done at least 2 times and the results were given in mean +/- standard error of the mean (SEM).

51
52
D. Results and Discussion

53
54
D. Results and Discussion
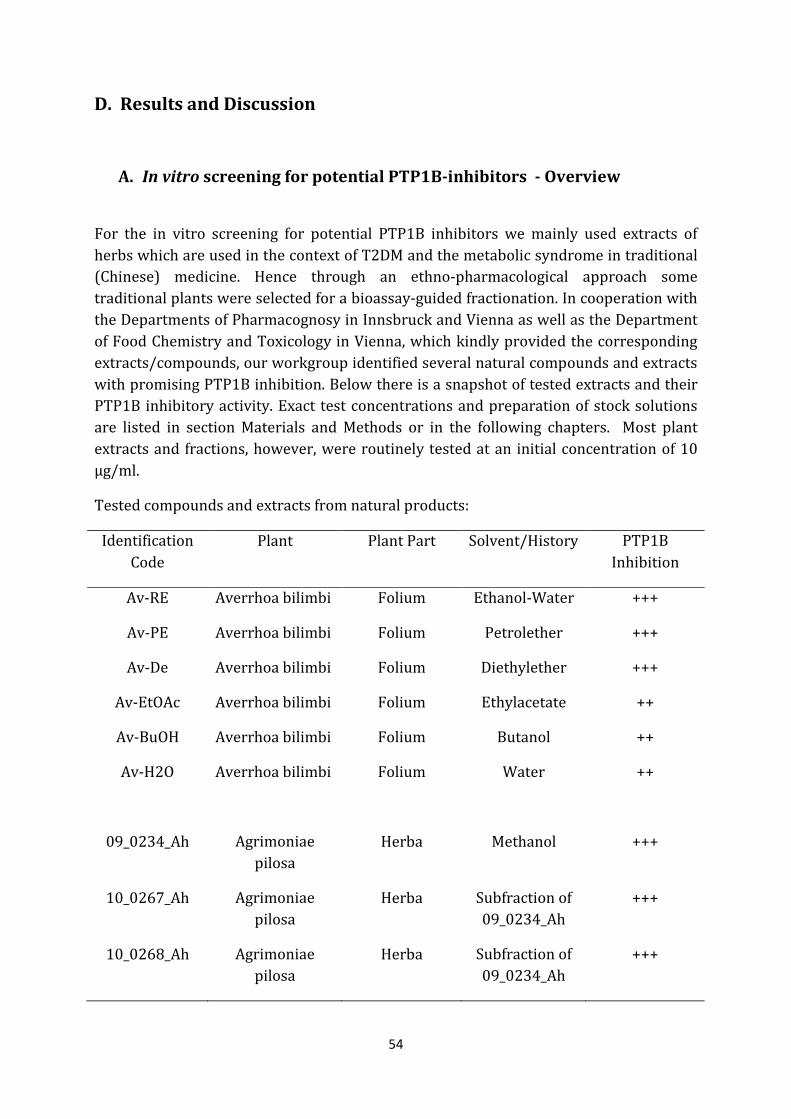
A. In vitro screening for potential PTP1B-inhibitors - Overview
For the in vitro screening for potential PTP1B inhibitors we mainly used extracts of herbs which are used in the context of T2DM and the metabolic syndrome in traditional (Chinese) medicine. Hence through an ethno-pharmacological approach some traditional plants were selected for a bioassay-guided fractionation. In cooperation with the Departments of Pharmacognosy in Innsbruck and Vienna as well as the Department of Food Chemistry and Toxicology in Vienna, which kindly provided the corresponding extracts/compounds, our workgroup identified several natural compounds and extracts with promising PTP1B inhibition. Below there is a snapshot of tested extracts and their PTP1B inhibitory activity. Exact test concentrations and preparation of stock solutions are listed in section Materials and Methods or in the following chapters. Most plant extracts and fractions, however, were routinely tested at an initial concentration of 10 µg/ml.
Tested compounds and extracts from natural products:
Identification Code
Plant Plant Part Solvent/History PTP1B Inhibition
Av-RE Averrhoa bilimbi Folium Ethanol-Water +++
Av-PE Averrhoa bilimbi Folium Petrolether +++
Av-De Averrhoa bilimbi Folium Diethylether +++
Av-EtOAc Averrhoa bilimbi Folium Ethylacetate ++
Av-BuOH Averrhoa bilimbi Folium Butanol ++
Av-H2O Averrhoa bilimbi Folium Water ++
09_0234_Ah Agrimoniae pilosa
Herba Methanol +++
10_0267_Ah Agrimoniae pilosa
Herba Subfraction of 09_0234_Ah
+++
10_0268_Ah Agrimoniae pilosa
Herba Subfraction of 09_0234_Ah
+++
55
10_0269_Ah Agrimoniae pilosa
Herba Subfraction of 09_0234_Ah
+++
10_0270_Ah Agrimoniae pilosa
Herba Subfraction of 09_0234_Ah
+++
10_0271_Ah Agrimoniae pilosa
Herba Subfraction of 09_0234_Ah
+++
10_0272_Ah Agrimoniae pilosa
Herba Subfraction of 09_0234_Ah
+++
10_0273_Ah Agrimoniae pilosa
Herba Subfraction of 09_0234_Ah
+++
10_0280_Ah Agrimoniae pilosa
Herba Subfraction of 10_0267_Ah
-
10_0281_Ah Agrimoniae pilosa
Herba Subfraction of 10_0267_Ah
++
10_0282_Ah Agrimoniae pilosa
Herba Subfraction of 10_0267_Ah
+++
10_0283_Ah Agrimoniae pilosa
Herba Subfraction of 10_0267_Ah
+++
10_0284_Ah Agrimoniae pilosa
Herba Subfraction of 10_0267_Ah
+++
10_0285_Ah Agrimoniae pilosa
Herba Subfraction of 10_0267_Ah
+++
10_0286_Ah Agrimoniae pilosa
Herba Subfraction of 10_0267_Ah
+++
10_0287_Ah Agrimoniae pilosa
Herba Subfraction of 10_0267_Ah
+++
10_0288_Ah Agrimoniae pilosa
Herba Subfraction of 10_0267_Ah
+++
10_0289_Ah Agrimoniae pilosa
Herba Subfraction of 10_0267_Ah
+++
56
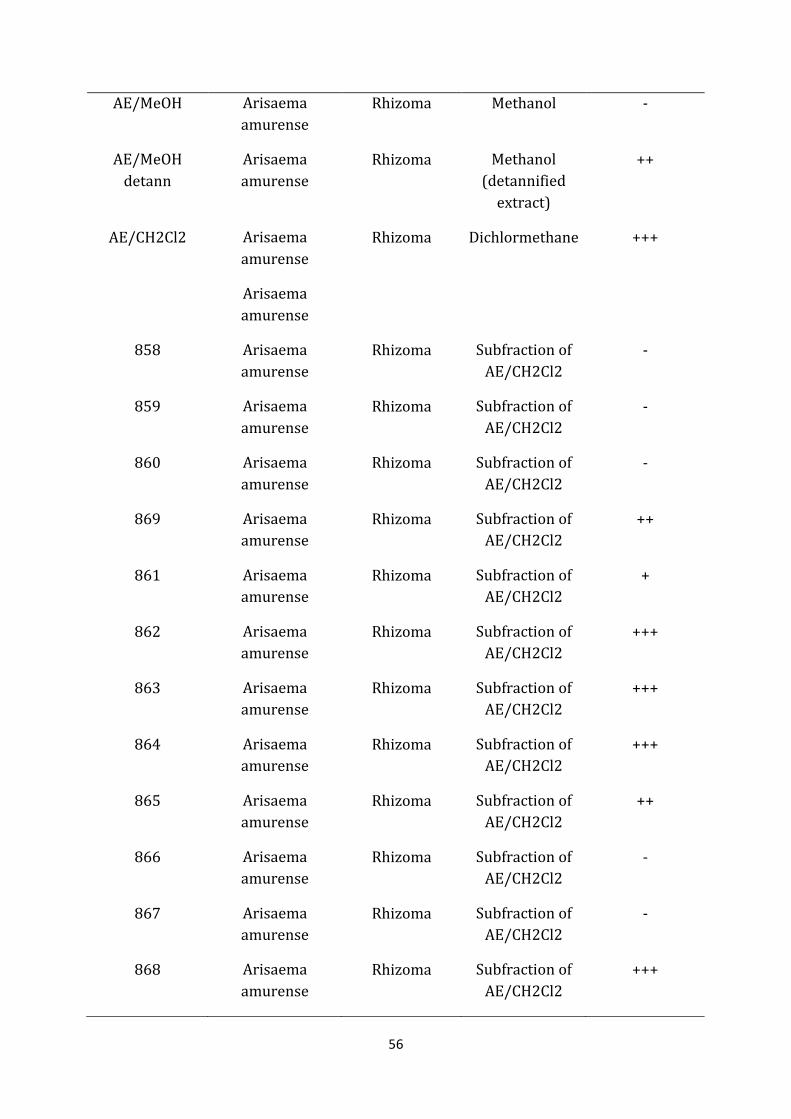
AE/MeOH Arisaema amurense
Rhizoma Methanol -
AE/MeOH detann
Arisaema amurense
Rhizoma Methanol (detannified
extract)
++
AE/CH2Cl2 Arisaema amurense
Rhizoma Dichlormethane +++
Arisaema amurense
858 Arisaema amurense
Rhizoma Subfraction of AE/CH2Cl2
-
859 Arisaema amurense
Rhizoma Subfraction of AE/CH2Cl2
-
860 Arisaema amurense
Rhizoma Subfraction of AE/CH2Cl2
-
869 Arisaema amurense
Rhizoma Subfraction of AE/CH2Cl2
++
861 Arisaema amurense
Rhizoma Subfraction of AE/CH2Cl2
+
862 Arisaema amurense
Rhizoma Subfraction of AE/CH2Cl2
+++
863 Arisaema amurense
Rhizoma Subfraction of AE/CH2Cl2
+++
864 Arisaema amurense
Rhizoma Subfraction of AE/CH2Cl2
+++
865 Arisaema amurense
Rhizoma Subfraction of AE/CH2Cl2
++
866 Arisaema amurense
Rhizoma Subfraction of AE/CH2Cl2
-
867 Arisaema amurense
Rhizoma Subfraction of AE/CH2Cl2
-
868 Arisaema amurense
Rhizoma Subfraction of AE/CH2Cl2
+++
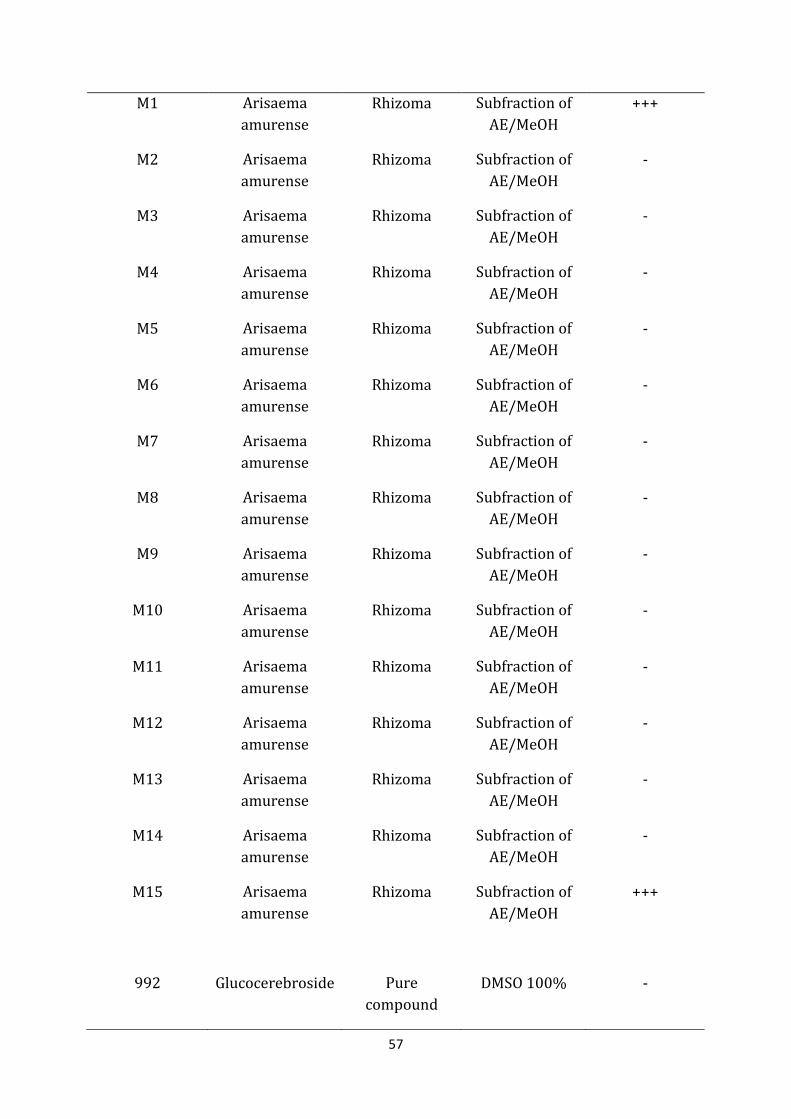
57
M1 Arisaema amurense
Rhizoma Subfraction of AE/MeOH
+++
M2 Arisaema amurense
Rhizoma Subfraction of AE/MeOH
-
M3 Arisaema amurense
Rhizoma Subfraction of AE/MeOH
-
M4 Arisaema amurense
Rhizoma Subfraction of AE/MeOH
-
M5 Arisaema amurense
Rhizoma Subfraction of AE/MeOH
-
M6 Arisaema amurense
Rhizoma Subfraction of AE/MeOH
-
M7 Arisaema amurense
Rhizoma Subfraction of AE/MeOH
-
M8 Arisaema amurense
Rhizoma Subfraction of AE/MeOH
-
M9 Arisaema amurense
Rhizoma Subfraction of AE/MeOH
-
M10 Arisaema amurense
Rhizoma Subfraction of AE/MeOH
-
M11 Arisaema amurense
Rhizoma Subfraction of AE/MeOH
-
M12 Arisaema amurense
Rhizoma Subfraction of AE/MeOH
-
M13 Arisaema amurense
Rhizoma Subfraction of AE/MeOH
-
M14 Arisaema amurense
Rhizoma Subfraction of AE/MeOH
-
M15 Arisaema amurense
Rhizoma Subfraction of AE/MeOH
+++
992 Glucocerebroside Pure compound
DMSO 100% -
58
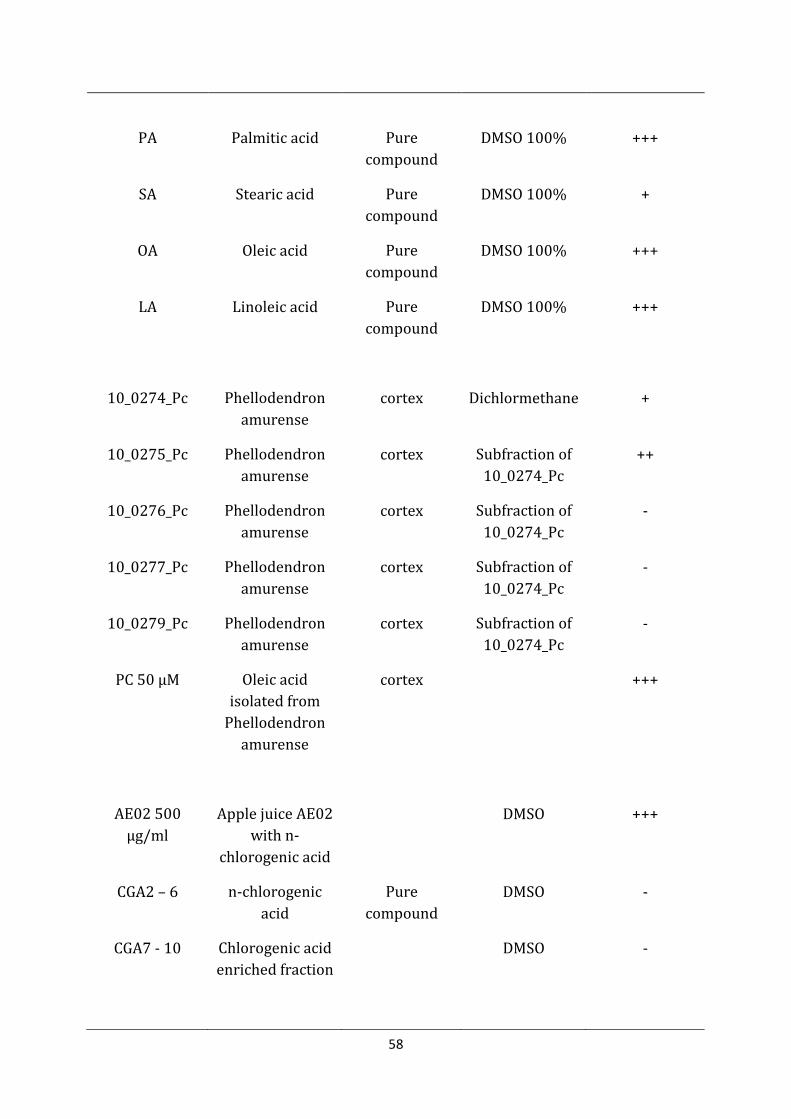
PA Palmitic acid Pure compound
DMSO 100% +++
SA Stearic acid Pure compound
DMSO 100% +
OA Oleic acid Pure compound
DMSO 100% +++
LA Linoleic acid Pure compound
DMSO 100% +++
10_0274_Pc Phellodendron amurense
cortex Dichlormethane +
10_0275_Pc Phellodendron amurense
cortex Subfraction of 10_0274_Pc
++
10_0276_Pc Phellodendron amurense
cortex Subfraction of 10_0274_Pc
-
10_0277_Pc Phellodendron amurense
cortex Subfraction of 10_0274_Pc
-
10_0279_Pc Phellodendron amurense
cortex Subfraction of 10_0274_Pc
-
PC 50 µM Oleic acid isolated from
Phellodendron amurense
cortex +++
AE02 500 µg/ml
Apple juice AE02 with n-
chlorogenic acid
DMSO +++
CGA2 – 6 n-chlorogenic acid
Pure compound
DMSO -
CGA7 - 10 Chlorogenic acid enriched fraction
DMSO -
59
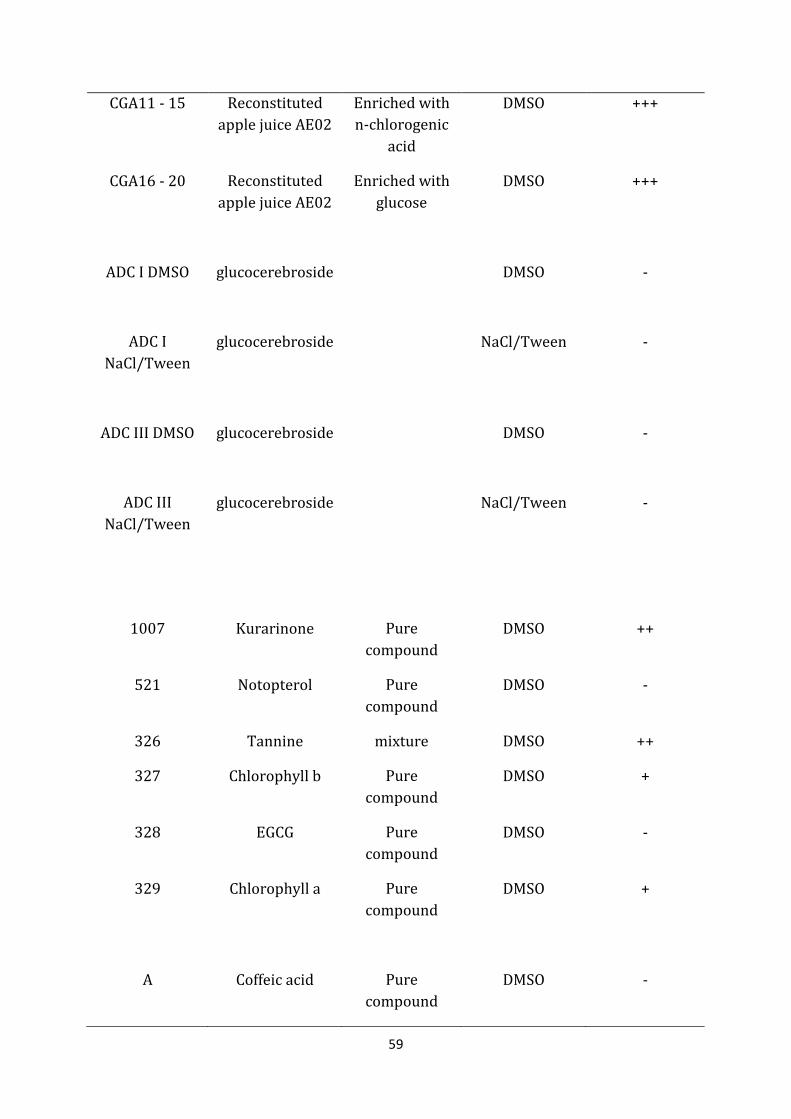
CGA11 - 15 Reconstituted apple juice AE02
Enriched with n-chlorogenic
acid
DMSO +++
CGA16 - 20 Reconstituted apple juice AE02
Enriched with glucose
DMSO +++
ADC I DMSO glucocerebroside DMSO -
ADC I NaCl/Tween
glucocerebroside NaCl/Tween -
ADC III DMSO glucocerebroside DMSO -
ADC III NaCl/Tween
glucocerebroside NaCl/Tween -
1007 Kurarinone Pure compound
DMSO ++
521 Notopterol Pure compound
DMSO -
326 Tannine mixture DMSO ++
327 Chlorophyll b Pure compound
DMSO +
328 EGCG Pure compound
DMSO -
329 Chlorophyll a Pure compound
DMSO +
A Coffeic acid Pure compound
DMSO -
60
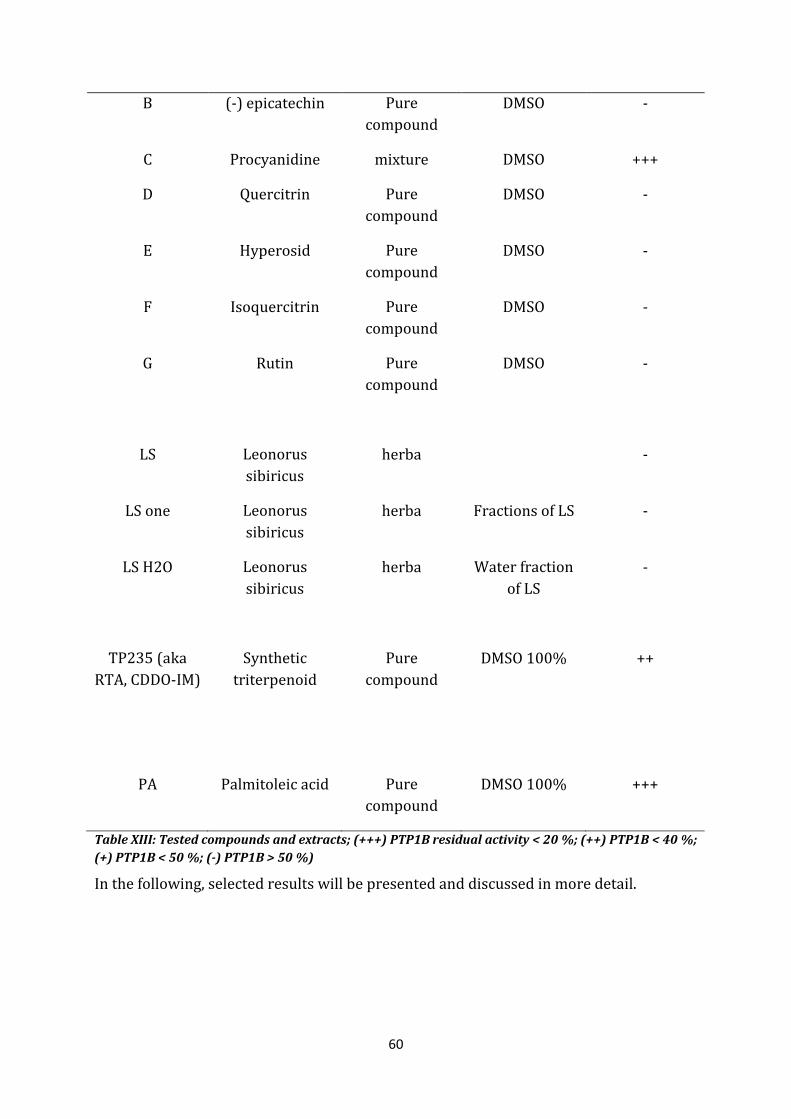
B (-) epicatechin Pure compound
DMSO -
C Procyanidine mixture DMSO +++
D Quercitrin Pure compound
DMSO -
E Hyperosid Pure compound
DMSO -
F Isoquercitrin Pure compound
DMSO -
G Rutin Pure compound
DMSO -
LS Leonorus sibiricus
herba -
LS one Leonorus sibiricus
herba Fractions of LS -
LS H2O Leonorus sibiricus
herba Water fraction of LS
-
TP235 (aka RTA, CDDO-IM)
Synthetic triterpenoid
Pure compound
DMSO 100% ++
PA Palmitoleic acid Pure compound
DMSO 100% +++
Table XIII: Tested compounds and extracts; (+++) PTP1B residual activity < 20 %; (++) PTP1B < 40 %; (+) PTP1B < 50 %; (-) PTP1B > 50 %)
In the following, selected results will be presented and discussed in more detail.
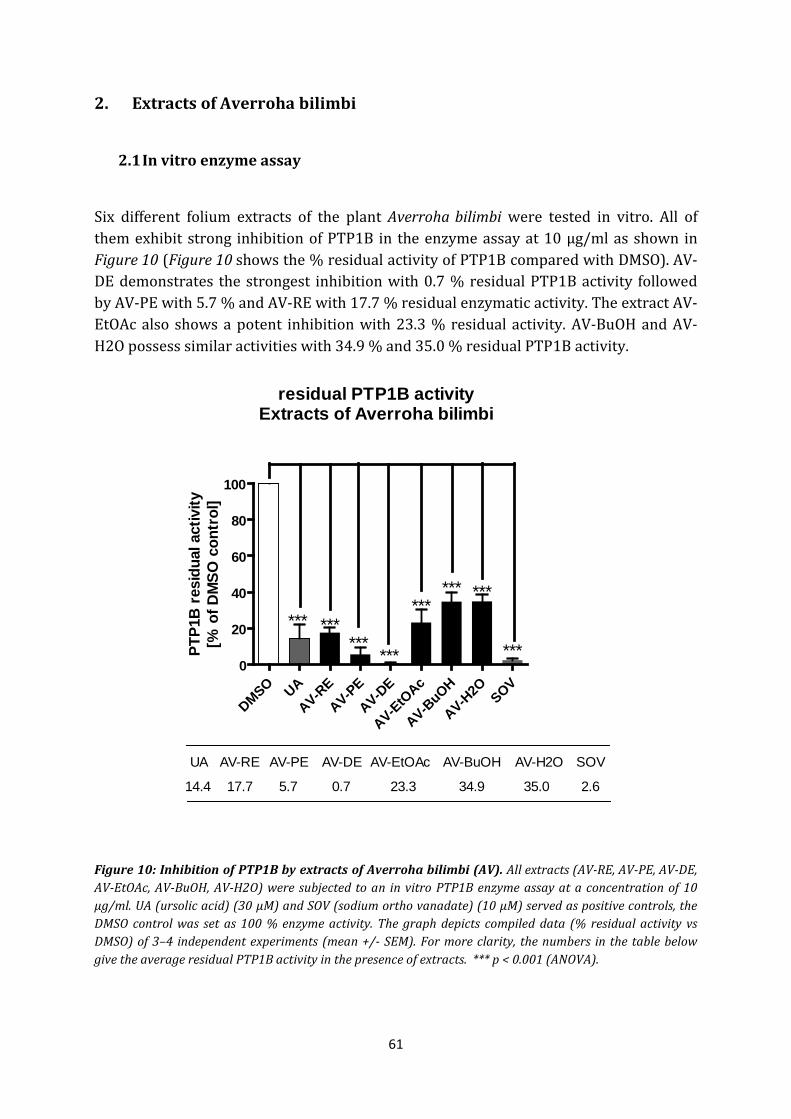
61
2. Extracts of Averroha bilimbi
2.1 In vitro enzyme assay
Six different folium extracts of the plant Averroha bilimbi were tested in vitro. All of them exhibit strong inhibition of PTP1B in the enzyme assay at 10 µg/ml as shown in Figure 10 (Figure 10 shows the % residual activity of PTP1B compared with DMSO). AV-DE demonstrates the strongest inhibition with 0.7 % residual PTP1B activity followed by AV-PE with 5.7 % and AV-RE with 17.7 % residual enzymatic activity. The extract AV-EtOAc also shows a potent inhibition with 23.3 % residual activity. AV-BuOH and AV-H2O possess similar activities with 34.9 % and 35.0 % residual PTP1B activity.
residual PTP1B activityExtracts of Averroha bilimbi
DMSO UAAV-R
EAV-P
EAV-D
E
AV-EtO
Ac
AV-BuOH
AV-H2O SOV
0
20
40
60
80
100
*** ******
***
****** ***
***
UA AV-RE AV-PE AV-DE AV-EtOAc AV-BuOH AV-H2O SOV
14.4 17.7 5.7 0.7 23.3 34.9 35.0 2.6
PTP1
B r
esid
ual a
ctiv
ity[%
of D
MSO
con
trol
]
Figure 10: Inhibition of PTP1B by extracts of Averroha bilimbi (AV). All extracts (AV-RE, AV-PE, AV-DE, AV-EtOAc, AV-BuOH, AV-H2O) were subjected to an in vitro PTP1B enzyme assay at a concentration of 10 µg/ml. UA (ursolic acid) (30 µM) and SOV (sodium ortho vanadate) (10 µM) served as positive controls, the DMSO control was set as 100 % enzyme activity. The graph depicts compiled data (% residual activity vs DMSO) of 3–4 independent experiments (mean +/- SEM). For more clarity, the numbers in the table below give the average residual PTP1B activity in the presence of extracts. *** p < 0.001 (ANOVA).
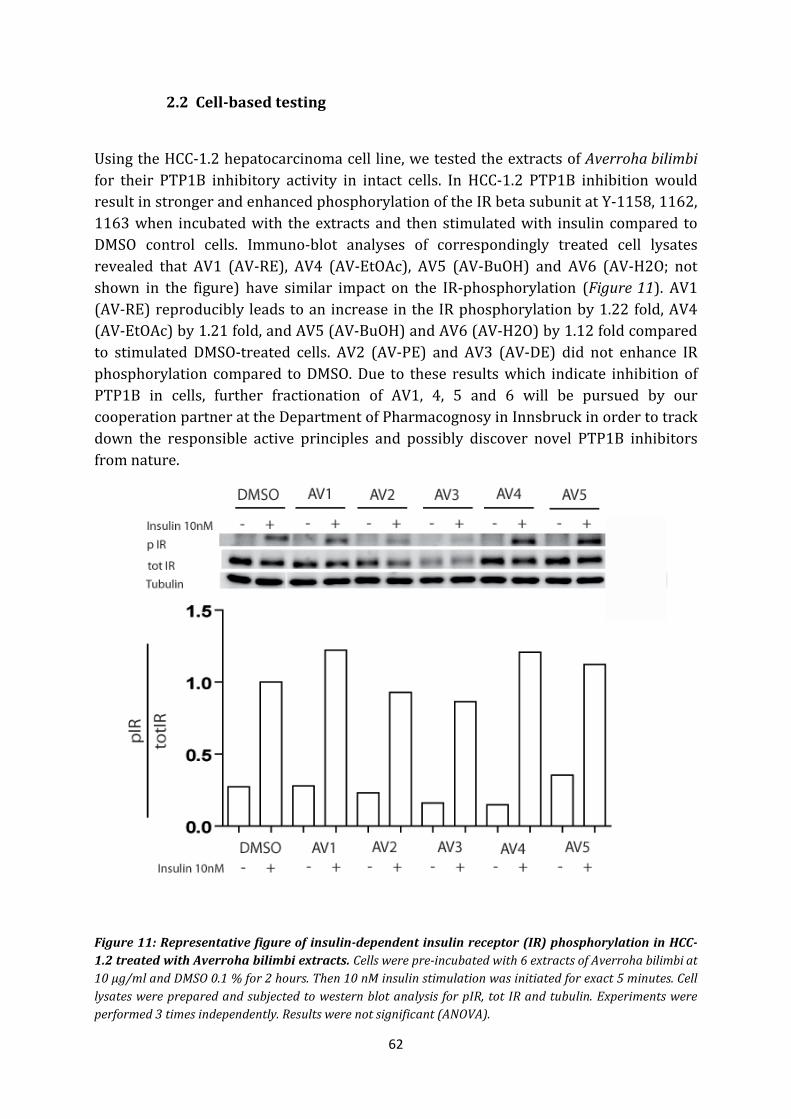
62
2.2 Cell-based testing
Using the HCC-1.2 hepatocarcinoma cell line, we tested the extracts of Averroha bilimbi for their PTP1B inhibitory activity in intact cells. In HCC-1.2 PTP1B inhibition would result in stronger and enhanced phosphorylation of the IR beta subunit at Y-1158, 1162, 1163 when incubated with the extracts and then stimulated with insulin compared to DMSO control cells. Immuno-blot analyses of correspondingly treated cell lysates revealed that AV1 (AV-RE), AV4 (AV-EtOAc), AV5 (AV-BuOH) and AV6 (AV-H2O; not shown in the figure) have similar impact on the IR-phosphorylation (Figure 11). AV1 (AV-RE) reproducibly leads to an increase in the IR phosphorylation by 1.22 fold, AV4 (AV-EtOAc) by 1.21 fold, and AV5 (AV-BuOH) and AV6 (AV-H2O) by 1.12 fold compared to stimulated DMSO-treated cells. AV2 (AV-PE) and AV3 (AV-DE) did not enhance IR phosphorylation compared to DMSO. Due to these results which indicate inhibition of PTP1B in cells, further fractionation of AV1, 4, 5 and 6 will be pursued by our cooperation partner at the Department of Pharmacognosy in Innsbruck in order to track down the responsible active principles and possibly discover novel PTP1B inhibitors from nature.
Figure 11: Representative figure of insulin-dependent insulin receptor (IR) phosphorylation in HCC-1.2 treated with Averroha bilimbi extracts. Cells were pre-incubated with 6 extracts of Averroha bilimbi at 10 µg/ml and DMSO 0.1 % for 2 hours. Then 10 nM insulin stimulation was initiated for exact 5 minutes. Cell lysates were prepared and subjected to western blot analysis for pIR, tot IR and tubulin. Experiments were performed 3 times independently. Results were not significant (ANOVA).
63
Little is known about Averrhoa bilimbi and its use against diabetes. Pushparaj et al. and Tan et al. demonstrated hypoglycemic and hypotriglyceridemic activities of an ethanol extract of Averrhoa leaves [83, 84]. They suggested that the hypoglycemic property could be due to a reduction of glucose-6-phosphatase (G-6-P) activity in the liver which is pivotal for gluconeogenesis and leads to overproduction of glucose during diabetes (G-6-P is overexpressed during diabetes and streptozocin-induced diabetes) or it could be the result of an elevation in serum insulin. The latter could be due to insulinotropic substances present in Averrhoa fractions, which induce the intact β-cells to produce insulin, or protect the functional β-cells from damage and dysfunction [85]. They also demonstrated a change in food and water intake which was reduced significantly whereas the body weight surprisingly increased in Averrhoa-treated streptozocin induced rats. In addition, anti-atherogenic and anti-lipid peroxidative effects as well as reduced serum triglyceride and non-esterified fatty acid levels have also been demonstrated. These all indicate that the still insufficiently studied Averrhoa bilimbi could be a potent medication in the field of metabolic syndrome and diabetes.
According to the findings of this study here, the potential of Averrhoa bilimbi ethanolic leaf extract to lower serum glucose level (reported by Pushparaj et al. and Tan et al.) could be explained by PTP1B inhibition. PTP1B, a negative regulator of IR and IRS phosphorylation was markedly inhibited in vitro when incubated with six different leaf extracts of different polarity. The lipophilic extracts (AV-PE, AV-DE) exhibited a more potent inhibition compared to the hydrophilic extracts in vitro (AV-RE, AV-EtOAc, AV-BuOH, AV-H2O). In cell culture, the HCC-1.2 showed prolonged IR phosphorylation when incubated with the hydrophilic extracts suggesting that compounds of Averrhoa bilimbi with hydrophilic character have a potential PTP1B inhibitory effect in intact cells. The observed reduced food and water intake in animals exposed to Averrhoa extracts by Pushparaj et al. [85] might as well be explained by PTP1B inhibition. This would result in an enhanced leptin signalling thus activating transcription of anorexigenic neuropeptides and inhibition of transcription of orexigenic neuropeptides, whilst the weight gain [85] cannot be explained through the impaired PTP1B pathway. A reduction of serum triglyceride and FFA demonstrated by Tan et al. might likely be also a consequence of PTP1B inhibition since enhanced insulin signalling would favour esterification of FFA and storage in adipose tissue.
The chemical compounds that have so far been identified in Averrhoa bilimbi are: amino acids, citric acid, cyanidin-3-O-β-D-glucoside, phenolics, potassium ion, sugar and vitamin A. Among them, vitamin A was shown to have PTP1B regulatory effects in rats when administrated to diet-fed-obese rats [86]. These rats had reduced body weight, reduced visceral adiposity and improved insulin sensitivity as evidenced by decreased fasting plasma insulin and unaltered glucose levels. Together with these findings, there might be more potential components in the hydrophilic extracts of Averrhoa bilimbi which inhibit PTP1B and could be of benefit for the therapy in the MetS and T2D. The identification of these constituents deserves further investigation in the future.
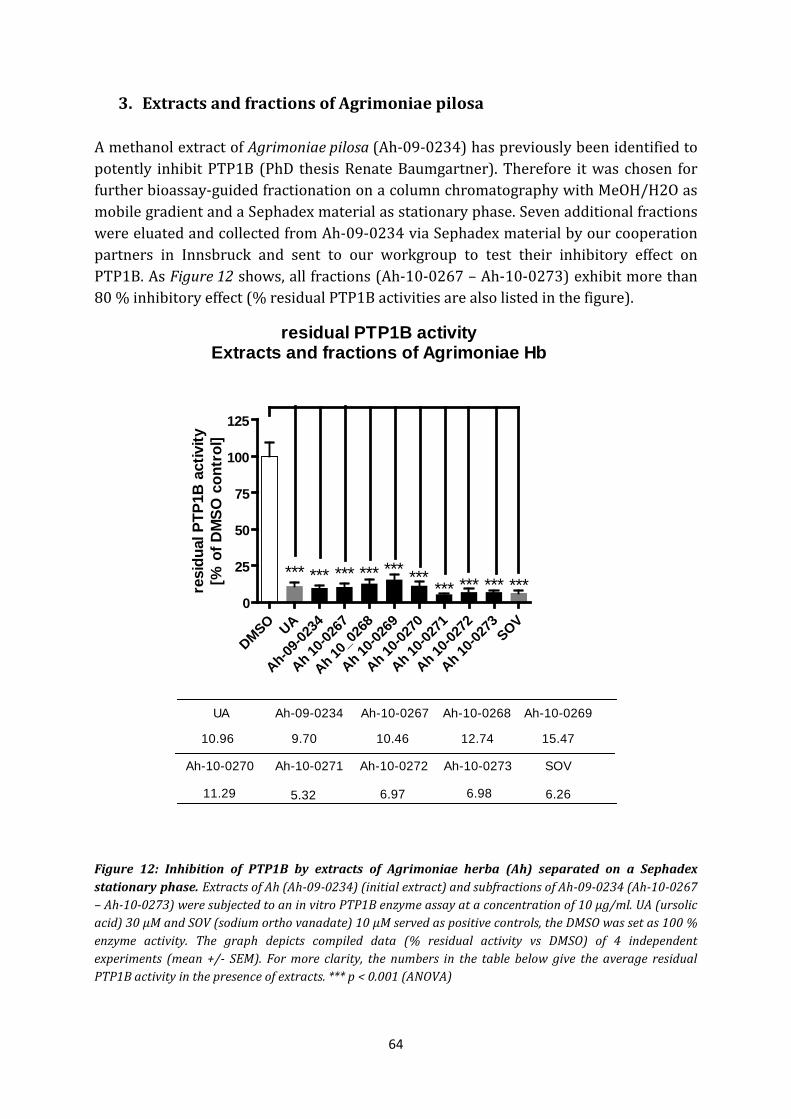
64
3. Extracts and fractions of Agrimoniae pilosa
A methanol extract of Agrimoniae pilosa (Ah-09-0234) has previously been identified to potently inhibit PTP1B (PhD thesis Renate Baumgartner). Therefore it was chosen for further bioassay-guided fractionation on a column chromatography with MeOH/H2O as mobile gradient and a Sephadex material as stationary phase. Seven additional fractions were eluated and collected from Ah-09-0234 via Sephadex material by our cooperation partners in Innsbruck and sent to our workgroup to test their inhibitory effect on PTP1B. As Figure 12 shows, all fractions (Ah-10-0267 – Ah-10-0273) exhibit more than 80 % inhibitory effect (% residual PTP1B activities are also listed in the figure).
residual PTP1B activityExtracts and fractions of Agrimoniae Hb
DMSO UA
Ah-09-02
34
Ah 10-02
67
Ah 10_0
268
Ah 10-02
69
Ah 10-02
70
Ah 10-02
71
Ah 10-02
72
Ah 10-02
73SOV
0
25
50
75
100
125
*** *** *** *** ********* ****** ***
Ah-09-0234 Ah-10-0267 Ah-10-0268 Ah-10-0269
Ah-10-0270
UA
Ah-10-0271 Ah-10-0272 Ah-10-0273 SOV
10.96 9.70 10.46 12.74 15.47
11.29 5.32 6.97 6.98 6.26
resi
dual
PTP
1B a
ctiv
ity[%
of D
MSO
con
trol
]
Figure 12: Inhibition of PTP1B by extracts of Agrimoniae herba (Ah) separated on a Sephadex stationary phase. Extracts of Ah (Ah-09-0234) (initial extract) and subfractions of Ah-09-0234 (Ah-10-0267 – Ah-10-0273) were subjected to an in vitro PTP1B enzyme assay at a concentration of 10 µg/ml. UA (ursolic acid) 30 µM and SOV (sodium ortho vanadate) 10 µM served as positive controls, the DMSO was set as 100 % enzyme activity. The graph depicts compiled data (% residual activity vs DMSO) of 4 independent experiments (mean +/- SEM). For more clarity, the numbers in the table below give the average residual PTP1B activity in the presence of extracts. *** p < 0.001 (ANOVA)
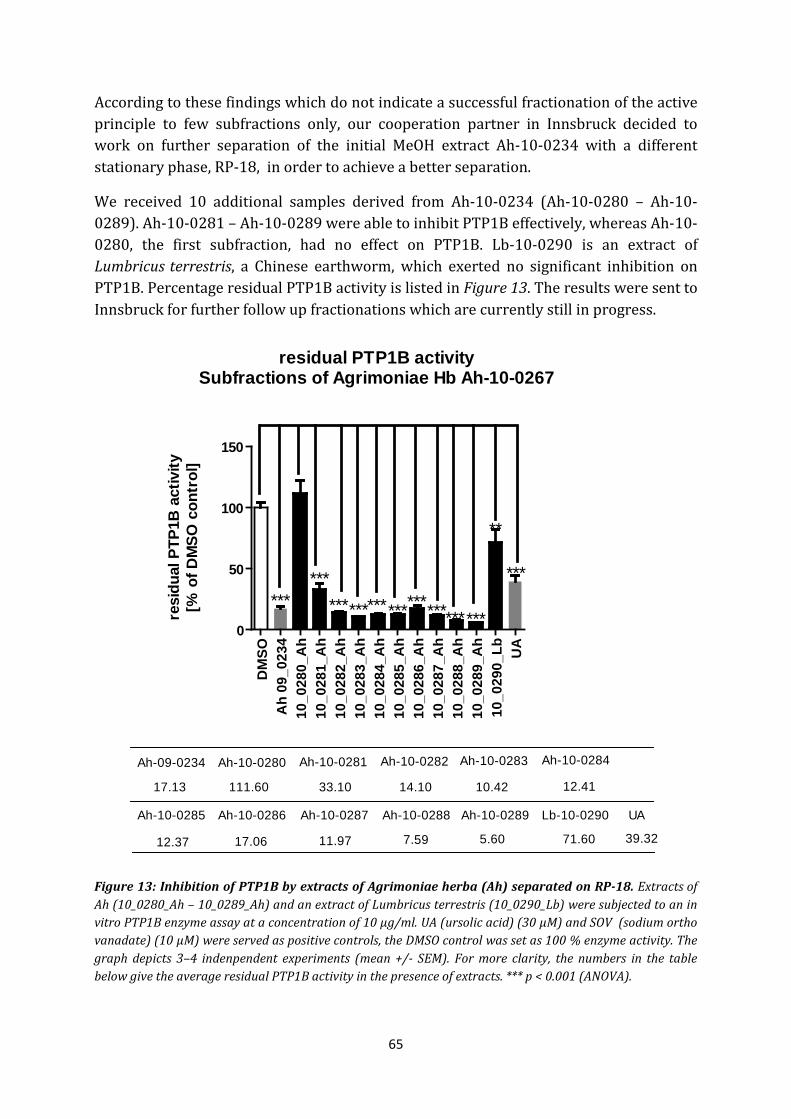
65
According to these findings which do not indicate a successful fractionation of the active principle to few subfractions only, our cooperation partner in Innsbruck decided to work on further separation of the initial MeOH extract Ah-10-0234 with a different stationary phase, RP-18, in order to achieve a better separation.
We received 10 additional samples derived from Ah-10-0234 (Ah-10-0280 – Ah-10-0289). Ah-10-0281 – Ah-10-0289 were able to inhibit PTP1B effectively, whereas Ah-10-0280, the first subfraction, had no effect on PTP1B. Lb-10-0290 is an extract of Lumbricus terrestris, a Chinese earthworm, which exerted no significant inhibition on PTP1B. Percentage residual PTP1B activity is listed in Figure 13. The results were sent to Innsbruck for further follow up fractionations which are currently still in progress.
residual PTP1B activitySubfractions of Agrimoniae Hb Ah-10-0267
DM
SOA
h 09
_023
410
_028
0_A
h10
_028
1_A
h10
_028
2_A
h10
_028
3_A
h10
_028
4_A
h10
_028
5_A
h10
_028
6_A
h10
_028
7_A
h10
_028
8_A
h10
_028
9_A
h10
_029
0_Lb UA
0
50
100
150
******
************************
***
Ah-09-0234 Ah-10-0280 Ah-10-0281 Ah-10-0282 Ah-10-0283 Ah-10-0284
Ah-10-0285 Ah-10-0286 Ah-10-0287 Ah-10-0288 Ah-10-0289 Lb-10-0290 UA
17.13 111.60 33.10 14.10 10.42 12.41
12.37 17.06 11.97 7.59 5.60 71.60 39.32
**
resi
dual
PTP
1B a
ctiv
ity[%
of D
MSO
con
trol
]
Figure 13: Inhibition of PTP1B by extracts of Agrimoniae herba (Ah) separated on RP-18. Extracts of Ah (10_0280_Ah – 10_0289_Ah) and an extract of Lumbricus terrestris (10_0290_Lb) were subjected to an in vitro PTP1B enzyme assay at a concentration of 10 µg/ml. UA (ursolic acid) (30 µM) and SOV (sodium ortho vanadate) (10 µM) were served as positive controls, the DMSO control was set as 100 % enzyme activity. The graph depicts 3–4 indenpendent experiments (mean +/- SEM). For more clarity, the numbers in the table below give the average residual PTP1B activity in the presence of extracts. *** p < 0.001 (ANOVA).
66
Agrimonia pilosa is known to be rich in ellagitannins such as: agrimoniin, potentillin, peduculagin, and their metabolite ellagic acid. Other phenolic compounds like the agrimonols A-E and flavonoides including luteolin-7-glucoside, apigenin-7-glucoside, quercetin, caffeic acid and gallic acid belong as well to the secondary metabolites of this plant [67, 73, 87]. It has been reported that the dimeric ellagtannin, agrimoniin [88] and the content of ellagic acid [73] account for the reported antitumor effect. The content of phenolic compounds solved in the aqueous fractions contribute to the antioxidative effect [89] and might as well suppress lipopolysaccharide-induced nitric oxide production and cytokine production and thus be of benefit for inflammatory diseases [87]. The antioxidative effect was as well demonstrated in studies in which mice were treated with ellagic acid [73, 90]. An acetylcholinesterase inhibitory and α-glucosidase inhibitory activity have also been described [67]. Information on Agrimonia pilosa in treating diabetes and the metabolic syndrome is rare. Nevertheless a reduction of hyperglycemia, weight loss, and polydipsia were shown in streptoztocin-induced diabetic rats when treated with a subspecies of Agrimonia (Agrimonia eupatoria) indicating that Agrimonia pilosa might as well have antidiabetic effects. Additionally, an enhanced insulin secretion from the BRIN-BD11 pancreatic B-cell line was observed when these were treated with Agrimonia eupatoria. This effect seemed to be dependent on the use of heat during extract preparation [91, 92].
With this work, some of the reported observations could be explained by PTP1B inhibition. 9 of 10 subfractions of the MeOH extract of Agrimonia pilosa exhibited strong PTP1B inhibition. Several studies have elucidated the PTP1B inhibitory potency of flavonoids isolated from natural products [93-96] suggesting that the flavonoids of Agrimonia pilosa could contribute to the PTP1B inhibitory effect. Muthusamy et al. described the PTP1B inhibitory effect by caffeoyl derivatives isolated from Cichorium intybus (salad leaves) [97] which could highlight caffeic acid in Agrimonia pilosa as one of the active principle. Taken together, further investigation on the inhibitory effect of PTP1B by the MeOH extract of Agrimonia pilosa is needed to declare whether the effect comes from flavonoids, caffeic acid or even other compounds.
67
4. Extracts of Arisaema amurense
4.1. Crude extracts
Dichlormethane and methanol extracts were prepared from dried pulverized roots of Arisaema amurense via Accelerated Solvent Extractor and a Solvent Controller by the Institute of Pharmacognosy in Vienna (E. Rozema/B. Kopp). The dried extracts were chromatographed over a silica column and eluted by CHCl3:MeOH:H2O (98:2:1to 60:38:8.5) to obtain fractions 858-869 for the dichloromethane and eluted by CHCl3:MeOH:H2O (70:22:3.5 to 60:40:10) for the methanol extract to obtain fractions M1-15. The initial provided extracts were a dichlormethane (AE/CH2Cl2), a methanol (AE/MeOH) and a detannified methanol extract (AE/MeOH detann) that we tested regarding their effect on PTP1B. AE/CH2Cl2 had at a concentration of 10 µg/ml a similar potent inhibition on PTP1B as 30 µM UA (ursolic acid; known phosphatase inhibitor) with 18.16 % residual PTP1B activity. The methanol extract AE/MeOH did not show any effect on the enzyme. However, when the extract was detannified it had an effect with 45.04 % residual PTP1B activity. The increase in activity is most likely due to a concentration of the active principle(s) upon removal of tannins. Figure 14 shows the effect of the 3 different extracts of Arisaema amurense.
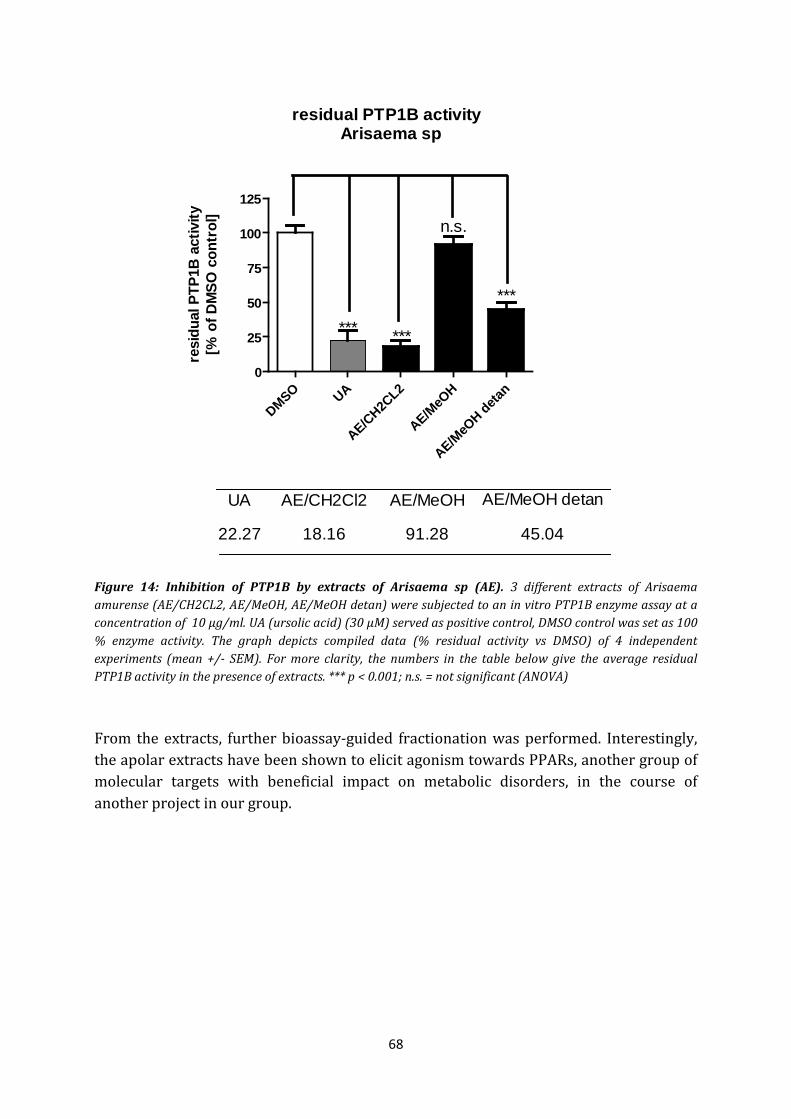
68
residual PTP1B activity Arisaema sp
DMSO UA
AE/CH2C
L2
AE/MeO
H
AE/MeO
H detan
0
25
50
75
100
125
*** ***
***
n.s.
UA AE/CH2Cl2 AE/MeOH AE/MeOH detan
22.27 18.16 91.28 45.04
resi
dual
PTP
1B a
ctiv
ity[%
of D
MSO
con
trol
]
Figure 14: Inhibition of PTP1B by extracts of Arisaema sp (AE). 3 different extracts of Arisaema amurense (AE/CH2CL2, AE/MeOH, AE/MeOH detan) were subjected to an in vitro PTP1B enzyme assay at a concentration of 10 µg/ml. UA (ursolic acid) (30 µM) served as positive control, DMSO control was set as 100 % enzyme activity. The graph depicts compiled data (% residual activity vs DMSO) of 4 independent experiments (mean +/- SEM). For more clarity, the numbers in the table below give the average residual PTP1B activity in the presence of extracts. *** p < 0.001; n.s. = not significant (ANOVA)
From the extracts, further bioassay-guided fractionation was performed. Interestingly, the apolar extracts have been shown to elicit agonism towards PPARs, another group of molecular targets with beneficial impact on metabolic disorders, in the course of another project in our group.
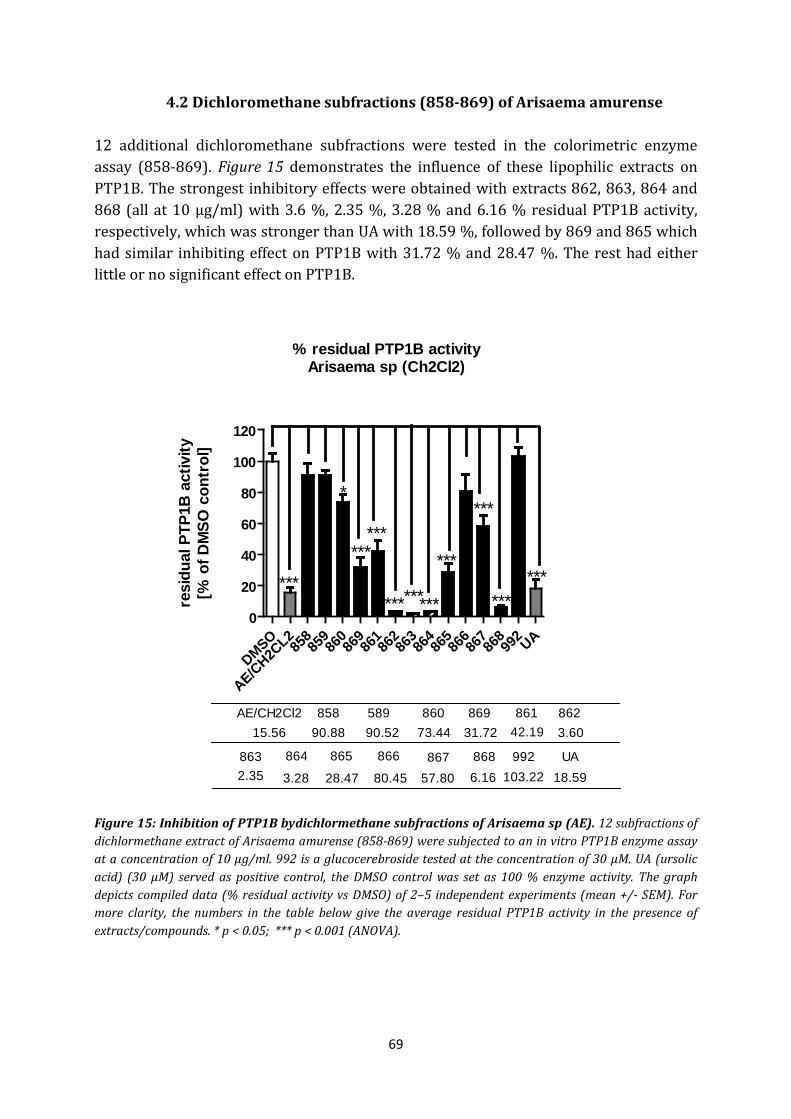
69
4.2 Dichloromethane subfractions (858-869) of Arisaema amurense
12 additional dichloromethane subfractions were tested in the colorimetric enzyme assay (858-869). Figure 15 demonstrates the influence of these lipophilic extracts on PTP1B. The strongest inhibitory effects were obtained with extracts 862, 863, 864 and 868 (all at 10 µg/ml) with 3.6 %, 2.35 %, 3.28 % and 6.16 % residual PTP1B activity, respectively, which was stronger than UA with 18.59 %, followed by 869 and 865 which had similar inhibiting effect on PTP1B with 31.72 % and 28.47 %. The rest had either little or no significant effect on PTP1B.
% residual PTP1B activityArisaema sp (Ch2Cl2)
DMSO
AE/CH2C
L285
885
986
086
986
186
286
386
486
586
686
786
899
2 UA0
20
40
60
80
100
120
AE/CH2Cl2 858 589 860 869 861 862
863 865 866 867 868 992 UA
15.56 90.88 90.52 73.44 31.72 42.19 3.60
2.35864
3.28 28.47 80.45 57.80 6.16 103.22 18.59
***
***
*********
***
******
*
******
resi
dual
PTP
1B a
ctiv
ity[%
of D
MSO
con
trol
]
Figure 15: Inhibition of PTP1B bydichlormethane subfractions of Arisaema sp (AE). 12 subfractions of dichlormethane extract of Arisaema amurense (858-869) were subjected to an in vitro PTP1B enzyme assay at a concentration of 10 µg/ml. 992 is a glucocerebroside tested at the concentration of 30 µM. UA (ursolic acid) (30 µM) served as positive control, the DMSO control was set as 100 % enzyme activity. The graph depicts compiled data (% residual activity vs DMSO) of 2–5 independent experiments (mean +/- SEM). For more clarity, the numbers in the table below give the average residual PTP1B activity in the presence of extracts/compounds. * p < 0.05; *** p < 0.001 (ANOVA).
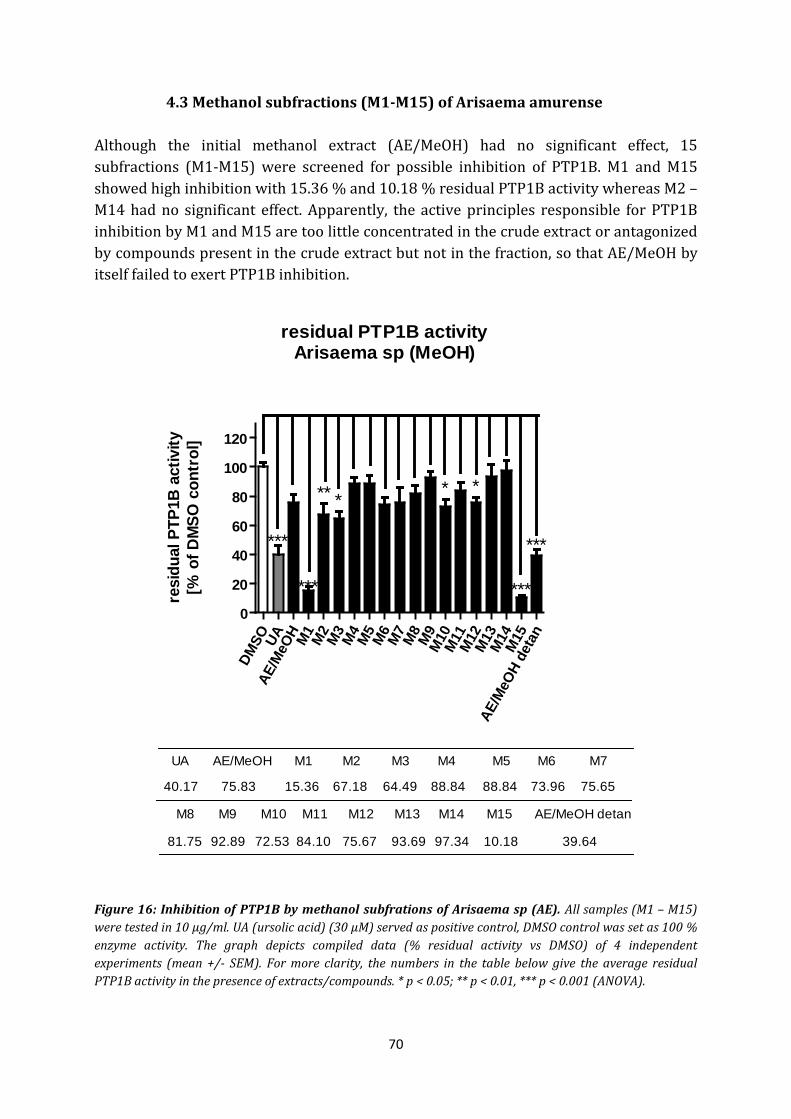
70
4.3 Methanol subfractions (M1-M15) of Arisaema amurense
Although the initial methanol extract (AE/MeOH) had no significant effect, 15 subfractions (M1-M15) were screened for possible inhibition of PTP1B. M1 and M15 showed high inhibition with 15.36 % and 10.18 % residual PTP1B activity whereas M2 – M14 had no significant effect. Apparently, the active principles responsible for PTP1B inhibition by M1 and M15 are too little concentrated in the crude extract or antagonized by compounds present in the crude extract but not in the fraction, so that AE/MeOH by itself failed to exert PTP1B inhibition.
residual PTP1B activityArisaema sp (MeOH)
DMSO UA
AE/M
eOH M1
M2
M3
M4
M5
M6
M7
M8
M9
M10
M11
M12
M13
M14
M15
AE/M
eOH
deta
n
0
20
40
60
80
100
120
***
***
** ** *
***
***
UA AE/MeOH M1 M2 M3 M4 M5 M6 M7
M8 M9 M10 M11 M12 M13 M14 M15 AE/MeOH detan
40.17 75.83 15.36 67.18 64.49 88.84 88.84 73.96 75.65
81.75 92.89 72.53 84.10 75.67 93.69 97.34 10.18 39.64
resi
dual
PTP
1B a
ctiv
ity[%
of D
MSO
con
trol
]
Figure 16: Inhibition of PTP1B by methanol subfrations of Arisaema sp (AE). All samples (M1 – M15) were tested in 10 µg/ml. UA (ursolic acid) (30 µM) served as positive control, DMSO control was set as 100 % enzyme activity. The graph depicts compiled data (% residual activity vs DMSO) of 4 independent experiments (mean +/- SEM). For more clarity, the numbers in the table below give the average residual PTP1B activity in the presence of extracts/compounds. * p < 0.05; ** p < 0.01, *** p < 0.001 (ANOVA).
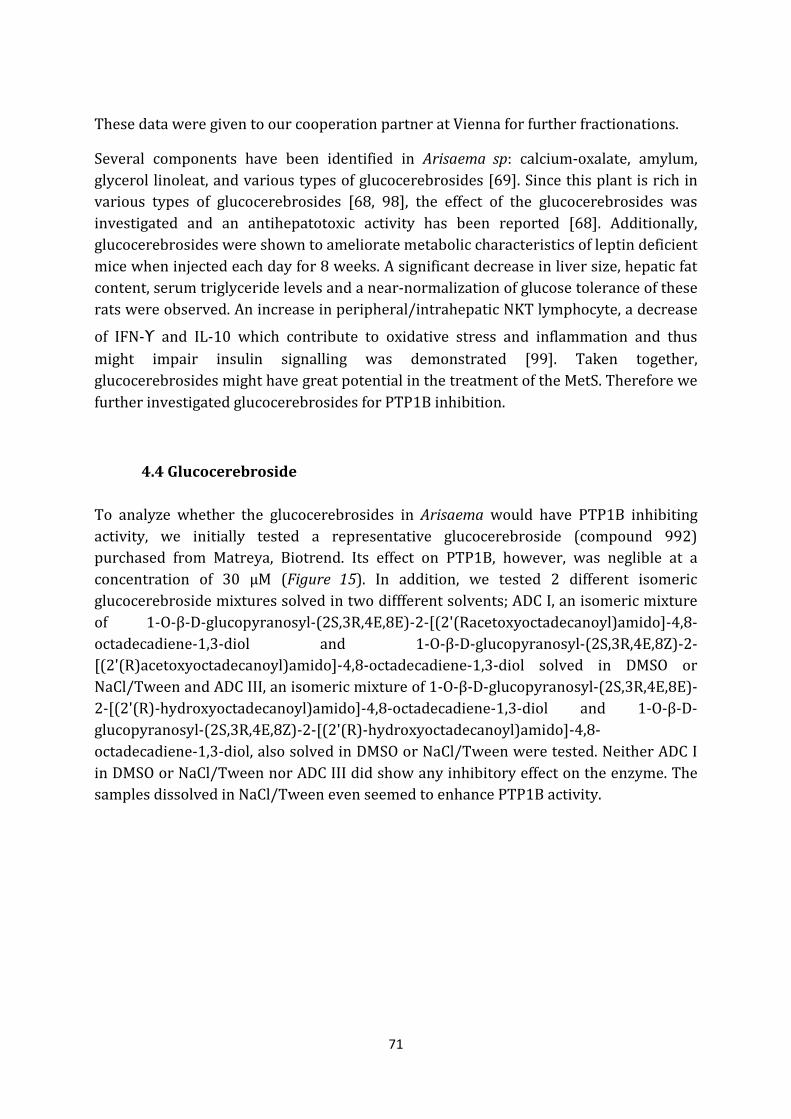
71
These data were given to our cooperation partner at Vienna for further fractionations.
Several components have been identified in Arisaema sp: calcium-oxalate, amylum, glycerol linoleat, and various types of glucocerebrosides [69]. Since this plant is rich in various types of glucocerebrosides [68, 98], the effect of the glucocerebrosides was investigated and an antihepatotoxic activity has been reported [68]. Additionally, glucocerebrosides were shown to ameliorate metabolic characteristics of leptin deficient mice when injected each day for 8 weeks. A significant decrease in liver size, hepatic fat content, serum triglyceride levels and a near-normalization of glucose tolerance of these rats were observed. An increase in peripheral/intrahepatic NKT lymphocyte, a decrease
of IFN-ϒ and IL-10 which contribute to oxidative stress and inflammation and thus might impair insulin signalling was demonstrated [99]. Taken together, glucocerebrosides might have great potential in the treatment of the MetS. Therefore we further investigated glucocerebrosides for PTP1B inhibition.
4.4 Glucocerebroside
To analyze whether the glucocerebrosides in Arisaema would have PTP1B inhibiting activity, we initially tested a representative glucocerebroside (compound 992) purchased from Matreya, Biotrend. Its effect on PTP1B, however, was neglible at a concentration of 30 µM (Figure 15). In addition, we tested 2 different isomeric glucocerebroside mixtures solved in two diffferent solvents; ADC I, an isomeric mixture of 1-O-β-D-glucopyranosyl-(2S,3R,4E,8E)-2-[(2'(Racetoxyoctadecanoyl)amido]-4,8-octadecadiene-1,3-diol and 1-O-β-D-glucopyranosyl-(2S,3R,4E,8Z)-2-[(2'(R)acetoxyoctadecanoyl)amido]-4,8-octadecadiene-1,3-diol solved in DMSO or NaCl/Tween and ADC III, an isomeric mixture of 1-O-β-D-glucopyranosyl-(2S,3R,4E,8E)-2-[(2'(R)-hydroxyoctadecanoyl)amido]-4,8-octadecadiene-1,3-diol and 1-O-β-D- glucopyranosyl-(2S,3R,4E,8Z)-2-[(2'(R)-hydroxyoctadecanoyl)amido]-4,8-octadecadiene-1,3-diol, also solved in DMSO or NaCl/Tween were tested. Neither ADC I in DMSO or NaCl/Tween nor ADC III did show any inhibitory effect on the enzyme. The samples dissolved in NaCl/Tween even seemed to enhance PTP1B activity.
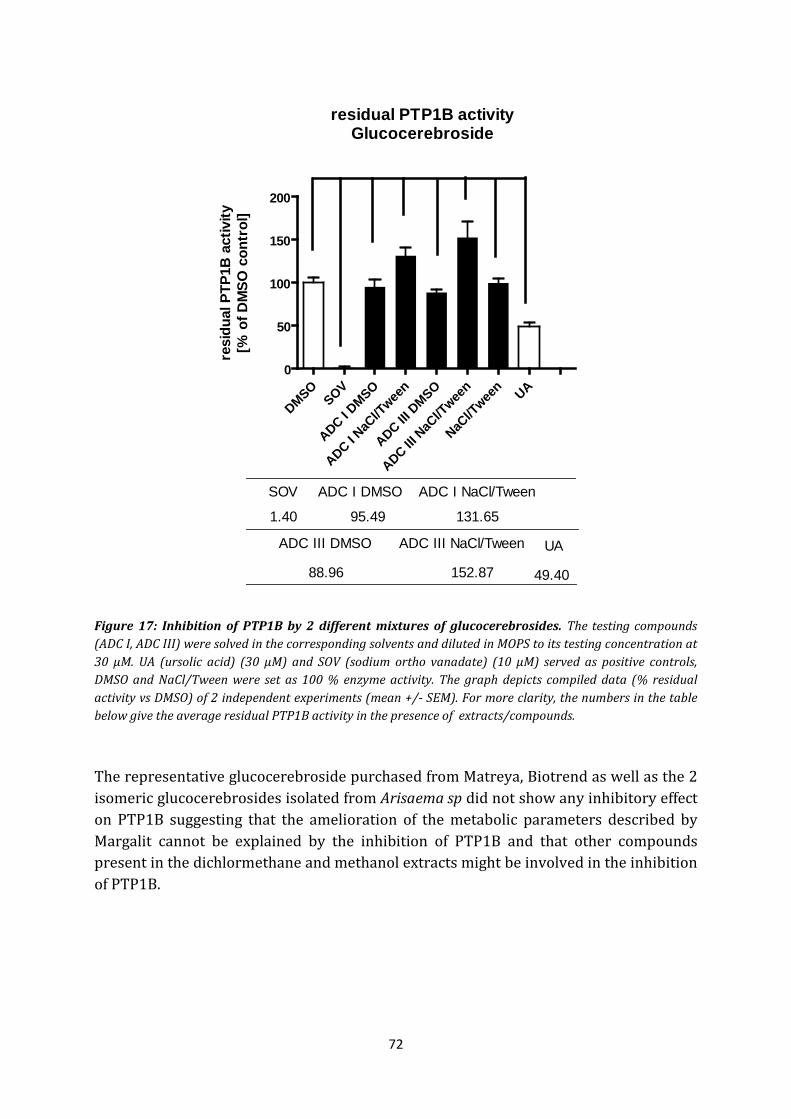
72
residual PTP1B activityGlucocerebroside
DMSOSOV
ADC I DMSO
ADC I NaC
l/Twee
n
ADC III D
MSO
ADC III N
aCl/T
ween
NaCl/T
ween UA
0
50
100
150
200
SOV ADC I DMSO ADC I NaCl/Tween
ADC III DMSO ADC III NaCl/Tween UA
1.40 95.49 131.65
88.96 152.87 49.40
resi
dual
PTP
1B a
ctiv
ity[%
of D
MSO
con
trol
]
Figure 17: Inhibition of PTP1B by 2 different mixtures of glucocerebrosides. The testing compounds (ADC I, ADC III) were solved in the corresponding solvents and diluted in MOPS to its testing concentration at 30 µM. UA (ursolic acid) (30 µM) and SOV (sodium ortho vanadate) (10 µM) served as positive controls, DMSO and NaCl/Tween were set as 100 % enzyme activity. The graph depicts compiled data (% residual activity vs DMSO) of 2 independent experiments (mean +/- SEM). For more clarity, the numbers in the table below give the average residual PTP1B activity in the presence of extracts/compounds.
The representative glucocerebroside purchased from Matreya, Biotrend as well as the 2 isomeric glucocerebrosides isolated from Arisaema sp did not show any inhibitory effect on PTP1B suggesting that the amelioration of the metabolic parameters described by Margalit cannot be explained by the inhibition of PTP1B and that other compounds present in the dichlormethane and methanol extracts might be involved in the inhibition of PTP1B.
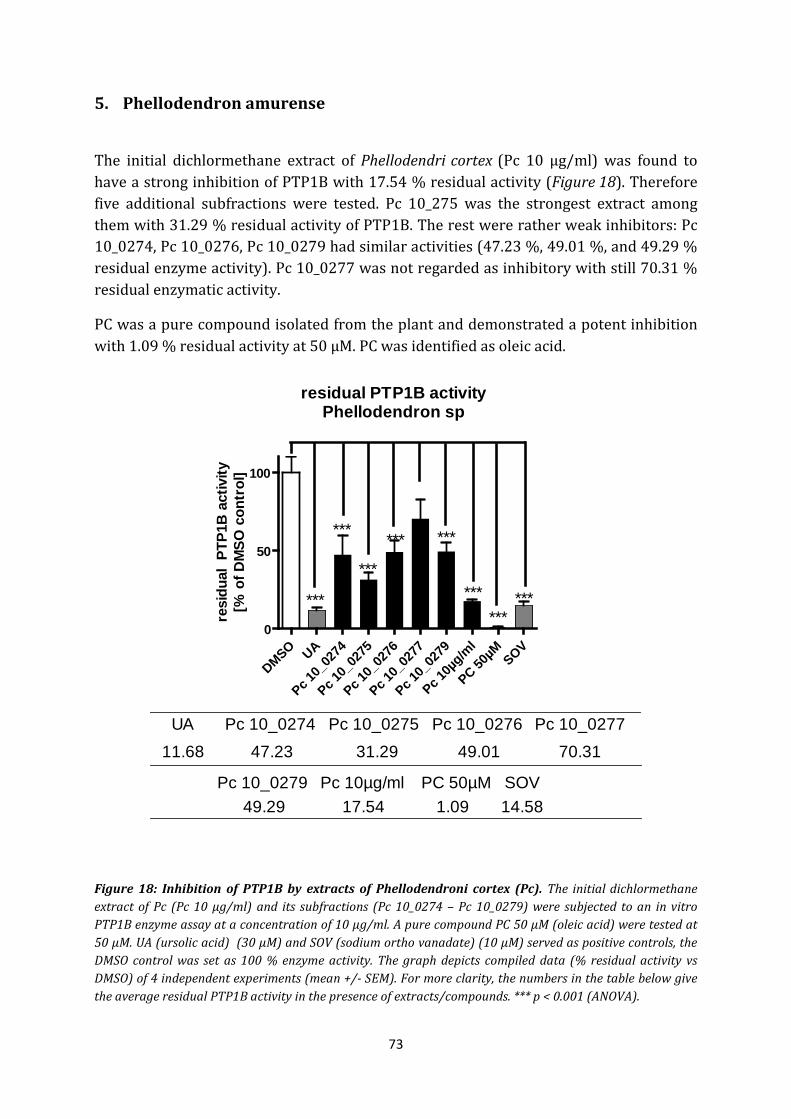
73
5. Phellodendron amurense
The initial dichlormethane extract of Phellodendri cortex (Pc 10 µg/ml) was found to have a strong inhibition of PTP1B with 17.54 % residual activity (Figure 18). Therefore five additional subfractions were tested. Pc 10_275 was the strongest extract among them with 31.29 % residual activity of PTP1B. The rest were rather weak inhibitors: Pc 10_0274, Pc 10_0276, Pc 10_0279 had similar activities (47.23 %, 49.01 %, and 49.29 % residual enzyme activity). Pc 10_0277 was not regarded as inhibitory with still 70.31 % residual enzymatic activity.
PC was a pure compound isolated from the plant and demonstrated a potent inhibition with 1.09 % residual activity at 50 µM. PC was identified as oleic acid.
residual PTP1B activityPhellodendron sp
DMSO UA
Pc 10_
0274
Pc 10_
0275
Pc 10_
0276
Pc 10_
0277
Pc 10_
0279
Pc 10µ
g/ml
PC 50µM SOV
0
50
100
UA Pc 10_0274 Pc 10_0275 Pc 10_0276 Pc 10_0277
Pc 10_0279 Pc 10µg/ml SOV
11.68 47.23 31.29 49.01 70.31
49.29 17.54 14.58PC 50µM
1.09
***
***
***
*** ***
******
***
resi
dual
PTP
1B a
ctiv
ity[%
of D
MSO
con
trol
]
Figure 18: Inhibition of PTP1B by extracts of Phellodendroni cortex (Pc). The initial dichlormethane extract of Pc (Pc 10 µg/ml) and its subfractions (Pc 10_0274 – Pc 10_0279) were subjected to an in vitro PTP1B enzyme assay at a concentration of 10 µg/ml. A pure compound PC 50 µM (oleic acid) were tested at 50 µM. UA (ursolic acid) (30 µM) and SOV (sodium ortho vanadate) (10 µM) served as positive controls, the DMSO control was set as 100 % enzyme activity. The graph depicts compiled data (% residual activity vs DMSO) of 4 independent experiments (mean +/- SEM). For more clarity, the numbers in the table below give the average residual PTP1B activity in the presence of extracts/compounds. *** p < 0.001 (ANOVA).
74
Phellodendron sp are as mentioned before rich in alkaloids such as berberine, palmitine, phellodendrine and jatrorrhizine [73]. Several experiments of oral administration of the alkaloid berberine in high-fat diet rats and mice showed raised insulin sensitivity [100, 101]. Cok et al. demonstrated an activation of GLUT1 in L929 fibroblast cells which express only GLUT1 when treated with berberine [102]. Additionally, in streptozotocin-induced diabetic rat models, oral administration of the extract of Phellodendron species significantly improved the symptoms of diabetes which are: decrease in hyperglycemic values, decrease in polyuria and polyphagia and relative weight of kidneys and heart, improvement of food efficiency ratio and marked decrease of weight loss, suggesting that Phellodendron sp provides antidiabetic properties [103, 104]. Therefore it was hypothesized that the hypoglycemic property could be due to the molecular inhibition of PTP1B by one of the alkaloids especially berberine. In the PhD thesis of Baumgartner, the effect of berberine as well as of palmitine was tested on PTP1B but no inhibition of PTP1B could be observed in the in vitro assay [132].
Instead, we observed strong PTP1B inhibition by the initial dichlormethane extract (PC 10 µg/ml) as well as by one of five subfractions (Pc 10_0275) of the dichlormethane extract suggesting that other compounds than berberine have potential PTP1B inhibiting properties.
By bioassay-guided fractionation of the Phellodendron sp extract, a pure PTP1B inhibiting compound could be isolated and identified as oleic acid (OA). In our in vitro assay we could confirm the strong inhibition of PTP1B by OA (PC 50µM) (Figure 18). Interested in whether PTP1B inhibition is restricted to oleic acid or a general feature of fatty acids, we decided to investigate the effect of several other fatty acids on PTP1B.
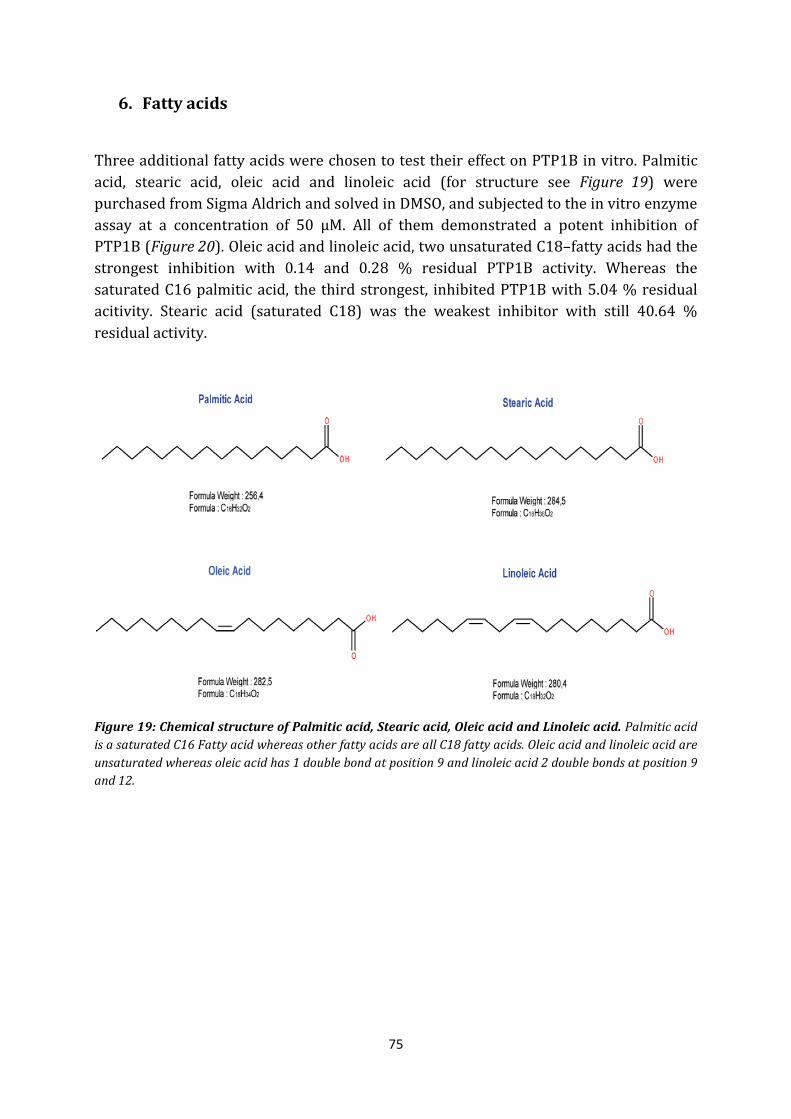
75
6. Fatty acids
Three additional fatty acids were chosen to test their effect on PTP1B in vitro. Palmitic acid, stearic acid, oleic acid and linoleic acid (for structure see Figure 19) were purchased from Sigma Aldrich and solved in DMSO, and subjected to the in vitro enzyme assay at a concentration of 50 µM. All of them demonstrated a potent inhibition of PTP1B (Figure 20). Oleic acid and linoleic acid, two unsaturated C18–fatty acids had the strongest inhibition with 0.14 and 0.28 % residual PTP1B activity. Whereas the saturated C16 palmitic acid, the third strongest, inhibited PTP1B with 5.04 % residual acitivity. Stearic acid (saturated C18) was the weakest inhibitor with still 40.64 % residual activity.
Figure 19: Chemical structure of Palmitic acid, Stearic acid, Oleic acid and Linoleic acid. Palmitic acid is a saturated C16 Fatty acid whereas other fatty acids are all C18 fatty acids. Oleic acid and linoleic acid are unsaturated whereas oleic acid has 1 double bond at position 9 and linoleic acid 2 double bonds at position 9 and 12.
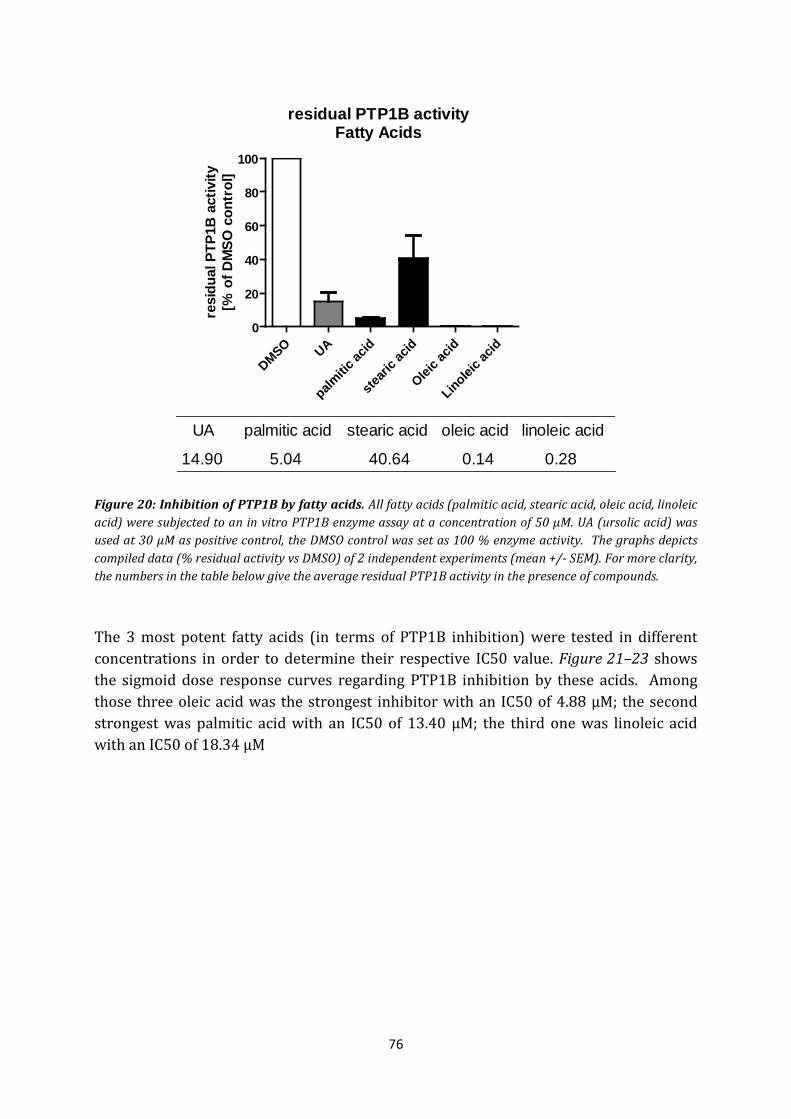
76
residual PTP1B activityFatty Acids
DMSO UA
palmitic
acid
steari
c acid
Oleic a
cid
Linoleic a
cid0
20
40
60
80
100
UA palmitic acid stearic acid oleic acid linoleic acid
14.90 5.04 40.64 0.14 0.28
resi
dual
PTP
1B a
ctiv
ity[%
of D
MSO
con
trol
]
Figure 20: Inhibition of PTP1B by fatty acids. All fatty acids (palmitic acid, stearic acid, oleic acid, linoleic acid) were subjected to an in vitro PTP1B enzyme assay at a concentration of 50 µM. UA (ursolic acid) was used at 30 µM as positive control, the DMSO control was set as 100 % enzyme activity. The graphs depicts compiled data (% residual activity vs DMSO) of 2 independent experiments (mean +/- SEM). For more clarity, the numbers in the table below give the average residual PTP1B activity in the presence of compounds.
The 3 most potent fatty acids (in terms of PTP1B inhibition) were tested in different concentrations in order to determine their respective IC50 value. Figure 21–23 shows the sigmoid dose response curves regarding PTP1B inhibition by these acids. Among those three oleic acid was the strongest inhibitor with an IC50 of 4.88 µM; the second strongest was palmitic acid with an IC50 of 13.40 µM; the third one was linoleic acid with an IC50 of 18.34 µM
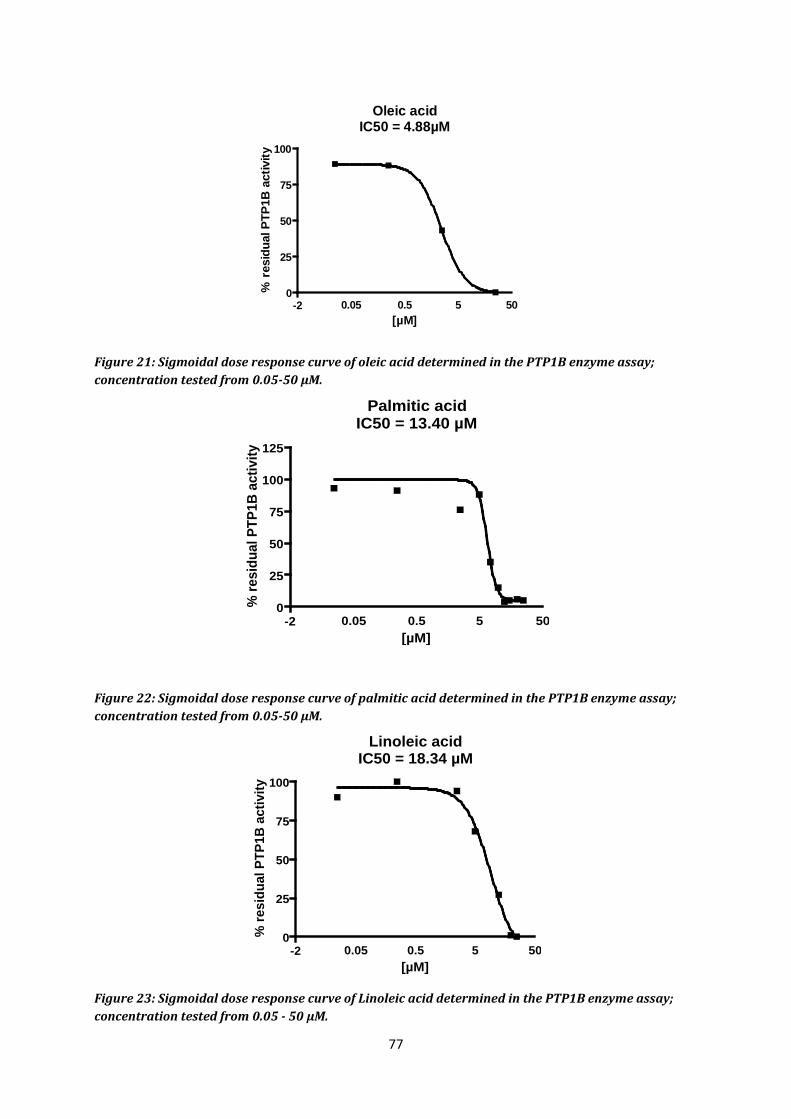
77
Oleic acidIC50 = 4.88µM
-20
25
50
75
100
0.05 0.5 5 50[µM]
% r
esid
ual P
TP1B
act
ivity
Figure 21: Sigmoidal dose response curve of oleic acid determined in the PTP1B enzyme assay; concentration tested from 0.05-50 µM.
Palmitic acidIC50 = 13.40 µM
-20
25
50
75
100
125
0.05 0.5 5 50[µM]
% re
sidu
al P
TP1B
act
ivity
Figure 22: Sigmoidal dose response curve of palmitic acid determined in the PTP1B enzyme assay; concentration tested from 0.05-50 µM.
Linoleic acidIC50 = 18.34 µM
-20
25
50
75
100
0.05 0.5 5 50[µM]
% re
sidu
al P
TP1B
act
ivity
Figure 23: Sigmoidal dose response curve of Linoleic acid determined in the PTP1B enzyme assay; concentration tested from 0.05 - 50 µM.
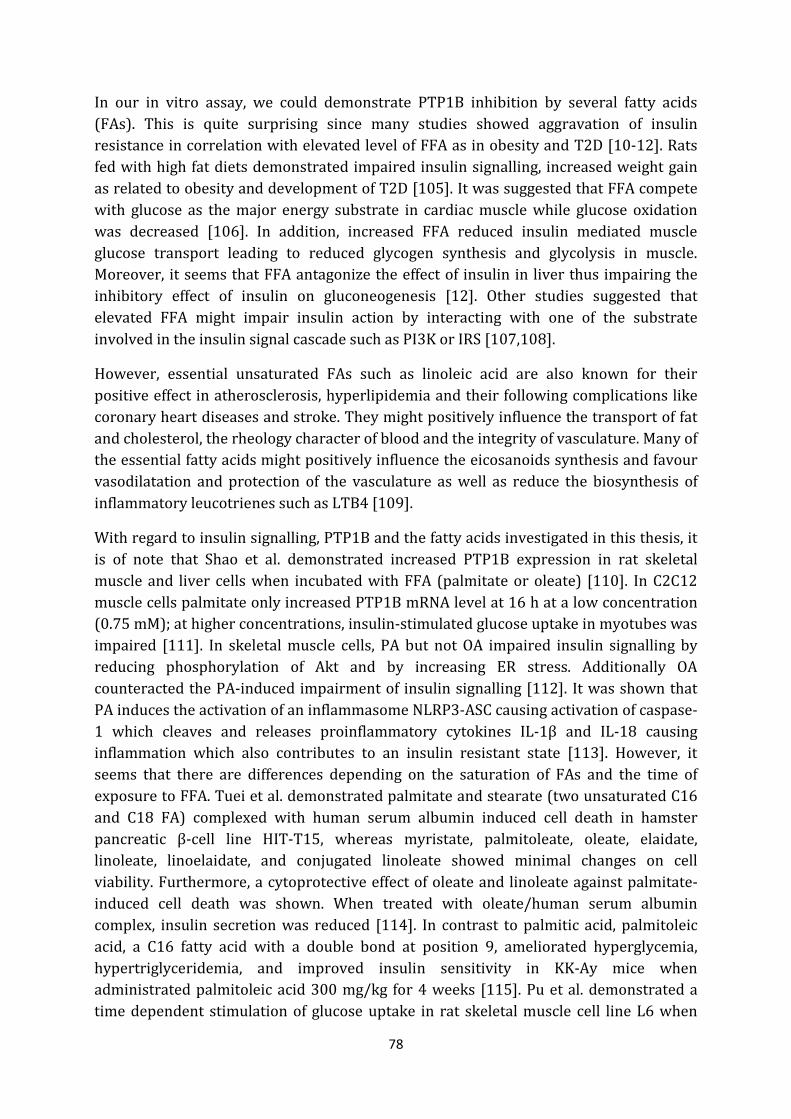
78
In our in vitro assay, we could demonstrate PTP1B inhibition by several fatty acids (FAs). This is quite surprising since many studies showed aggravation of insulin resistance in correlation with elevated level of FFA as in obesity and T2D [10-12]. Rats fed with high fat diets demonstrated impaired insulin signalling, increased weight gain as related to obesity and development of T2D [105]. It was suggested that FFA compete with glucose as the major energy substrate in cardiac muscle while glucose oxidation was decreased [106]. In addition, increased FFA reduced insulin mediated muscle glucose transport leading to reduced glycogen synthesis and glycolysis in muscle. Moreover, it seems that FFA antagonize the effect of insulin in liver thus impairing the inhibitory effect of insulin on gluconeogenesis [12]. Other studies suggested that elevated FFA might impair insulin action by interacting with one of the substrate involved in the insulin signal cascade such as PI3K or IRS [107,108].
However, essential unsaturated FAs such as linoleic acid are also known for their positive effect in atherosclerosis, hyperlipidemia and their following complications like coronary heart diseases and stroke. They might positively influence the transport of fat and cholesterol, the rheology character of blood and the integrity of vasculature. Many of the essential fatty acids might positively influence the eicosanoids synthesis and favour vasodilatation and protection of the vasculature as well as reduce the biosynthesis of inflammatory leucotrienes such as LTB4 [109].
With regard to insulin signalling, PTP1B and the fatty acids investigated in this thesis, it is of note that Shao et al. demonstrated increased PTP1B expression in rat skeletal muscle and liver cells when incubated with FFA (palmitate or oleate) [110]. In C2C12 muscle cells palmitate only increased PTP1B mRNA level at 16 h at a low concentration (0.75 mM); at higher concentrations, insulin-stimulated glucose uptake in myotubes was impaired [111]. In skeletal muscle cells, PA but not OA impaired insulin signalling by reducing phosphorylation of Akt and by increasing ER stress. Additionally OA counteracted the PA-induced impairment of insulin signalling [112]. It was shown that PA induces the activation of an inflammasome NLRP3-ASC causing activation of caspase-1 which cleaves and releases proinflammatory cytokines IL-1β and IL-18 causing inflammation which also contributes to an insulin resistant state [113]. However, it seems that there are differences depending on the saturation of FAs and the time of exposure to FFA. Tuei et al. demonstrated palmitate and stearate (two unsaturated C16 and C18 FA) complexed with human serum albumin induced cell death in hamster pancreatic β-cell line HIT-T15, whereas myristate, palmitoleate, oleate, elaidate, linoleate, linoelaidate, and conjugated linoleate showed minimal changes on cell viability. Furthermore, a cytoprotective effect of oleate and linoleate against palmitate-induced cell death was shown. When treated with oleate/human serum albumin complex, insulin secretion was reduced [114]. In contrast to palmitic acid, palmitoleic acid, a C16 fatty acid with a double bond at position 9, ameliorated hyperglycemia, hypertriglyceridemia, and improved insulin sensitivity in KK-Ay mice when administrated palmitoleic acid 300 mg/kg for 4 weeks [115]. Pu et al. demonstrated a time dependent stimulation of glucose uptake in rat skeletal muscle cell line L6 when
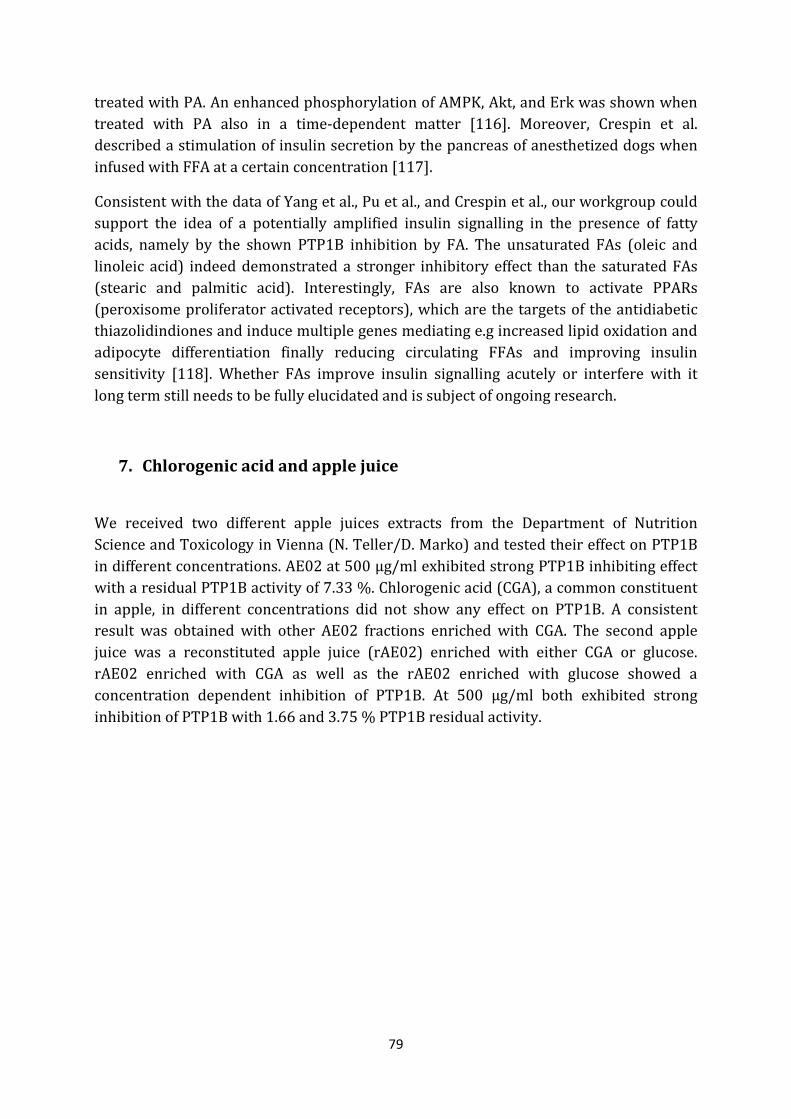
79
treated with PA. An enhanced phosphorylation of AMPK, Akt, and Erk was shown when treated with PA also in a time-dependent matter [116]. Moreover, Crespin et al. described a stimulation of insulin secretion by the pancreas of anesthetized dogs when infused with FFA at a certain concentration [117].
Consistent with the data of Yang et al., Pu et al., and Crespin et al., our workgroup could support the idea of a potentially amplified insulin signalling in the presence of fatty acids, namely by the shown PTP1B inhibition by FA. The unsaturated FAs (oleic and linoleic acid) indeed demonstrated a stronger inhibitory effect than the saturated FAs (stearic and palmitic acid). Interestingly, FAs are also known to activate PPARs (peroxisome proliferator activated receptors), which are the targets of the antidiabetic thiazolidindiones and induce multiple genes mediating e.g increased lipid oxidation and adipocyte differentiation finally reducing circulating FFAs and improving insulin sensitivity [118]. Whether FAs improve insulin signalling acutely or interfere with it long term still needs to be fully elucidated and is subject of ongoing research.
7. Chlorogenic acid and apple juice
We received two different apple juices extracts from the Department of Nutrition Science and Toxicology in Vienna (N. Teller/D. Marko) and tested their effect on PTP1B in different concentrations. AE02 at 500 µg/ml exhibited strong PTP1B inhibiting effect with a residual PTP1B activity of 7.33 %. Chlorogenic acid (CGA), a common constituent in apple, in different concentrations did not show any effect on PTP1B. A consistent result was obtained with other AE02 fractions enriched with CGA. The second apple juice was a reconstituted apple juice (rAE02) enriched with either CGA or glucose. rAE02 enriched with CGA as well as the rAE02 enriched with glucose showed a concentration dependent inhibition of PTP1B. At 500 µg/ml both exhibited strong inhibition of PTP1B with 1.66 and 3.75 % PTP1B residual activity.
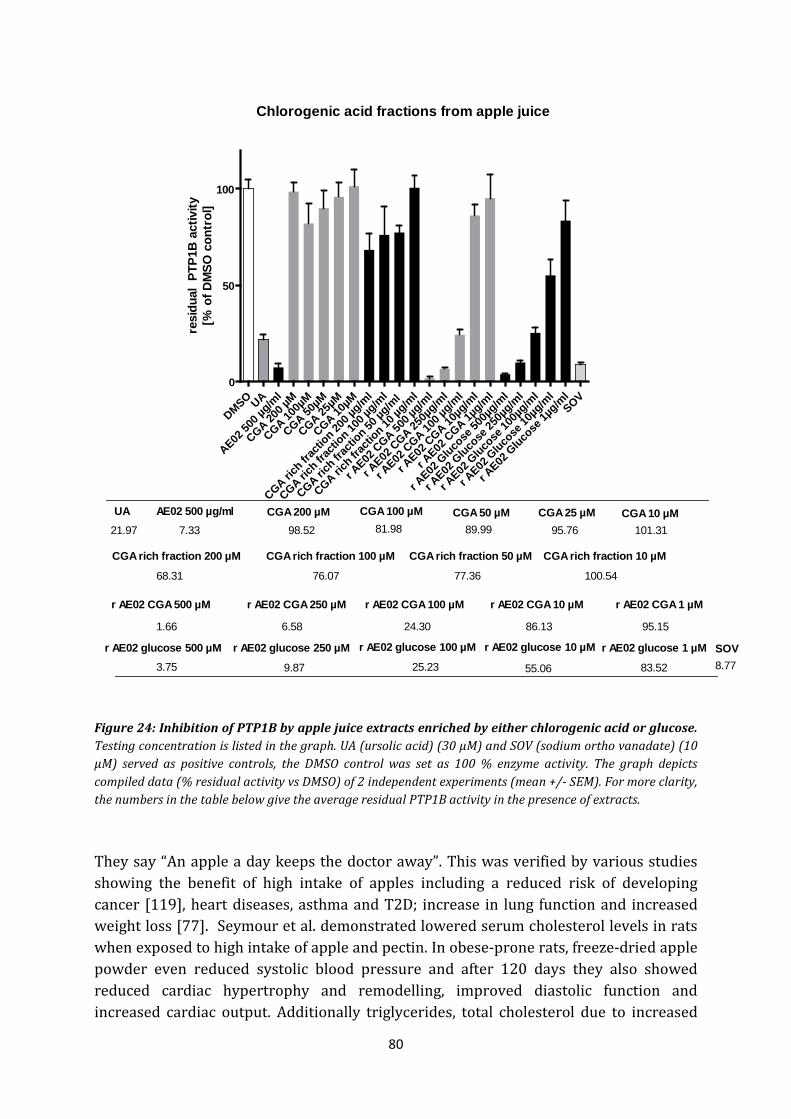
80
Chlorogenic acid fractions from apple juice
DMSO UA
AE02 50
0 µg/m
l
CGA 200 µ
M
CGA 100µ
M
CGA 50µM
CGA 25µM
CGA 10µM
CGA rich fr
actio
n 200 µ
g/ml
CGA rich fr
actio
n 100 µ
g/ml
CGA rich fr
actio
n 50 µg
/ml
CGA rich fr
actio
n 10 µg
/ml
r AE02
CGA 50
0 µg/m
l
r AE02
CGA 25
0µg/m
l
r AE02
CGA 10
0 µg/m
l
r AE02
CGA 10
µg/m
l
r AE02
CGA 1µ
g/ml
r AE02
Gluco
se 50
0µg/m
l
r AE02
Gluco
se 25
0µg/m
l
r AE02
Gluco
se 10
0µg/m
l
r AE02
Gluco
se 10
µg/m
l
r AE02
Gluco
se 1µ
g/mlSOV
0
50
100
UA AE02 500 µg/ml CGA 200 µM CGA 100 µM CGA 50 µM CGA 25 µM CGA 10 µM
CGA rich fraction 200 µM CGA rich fraction 100 µM CGA rich fraction 50 µM CGA rich fraction 10 µM
r AE02 CGA 500 µM r AE02 CGA 250 µM r AE02 CGA 100 µM r AE02 CGA 10 µM r AE02 CGA 1 µM
r AE02 glucose 500 µM r AE02 glucose 250 µM r AE02 glucose 100 µM r AE02 glucose 10 µM r AE02 glucose 1 µM SOV
21.97 7.33 98.52 81.98 89.99 95.76 101.31
68.31 76.07 77.36 100.54
1.66 6.58 24.30 86.13 95.15
3.75 9.87 25.23 55.06 83.52 8.77
resi
dual
PTP
1B a
ctiv
ity[%
of D
MSO
con
trol
]
Figure 24: Inhibition of PTP1B by apple juice extracts enriched by either chlorogenic acid or glucose. Testing concentration is listed in the graph. UA (ursolic acid) (30 µM) and SOV (sodium ortho vanadate) (10 µM) served as positive controls, the DMSO control was set as 100 % enzyme activity. The graph depicts compiled data (% residual activity vs DMSO) of 2 independent experiments (mean +/- SEM). For more clarity, the numbers in the table below give the average residual PTP1B activity in the presence of extracts.
They say “An apple a day keeps the doctor away”. This was verified by various studies showing the benefit of high intake of apples including a reduced risk of developing cancer [119], heart diseases, asthma and T2D; increase in lung function and increased weight loss [77]. Seymour et al. demonstrated lowered serum cholesterol levels in rats when exposed to high intake of apple and pectin. In obese-prone rats, freeze-dried apple powder even reduced systolic blood pressure and after 120 days they also showed reduced cardiac hypertrophy and remodelling, improved diastolic function and increased cardiac output. Additionally triglycerides, total cholesterol due to increased
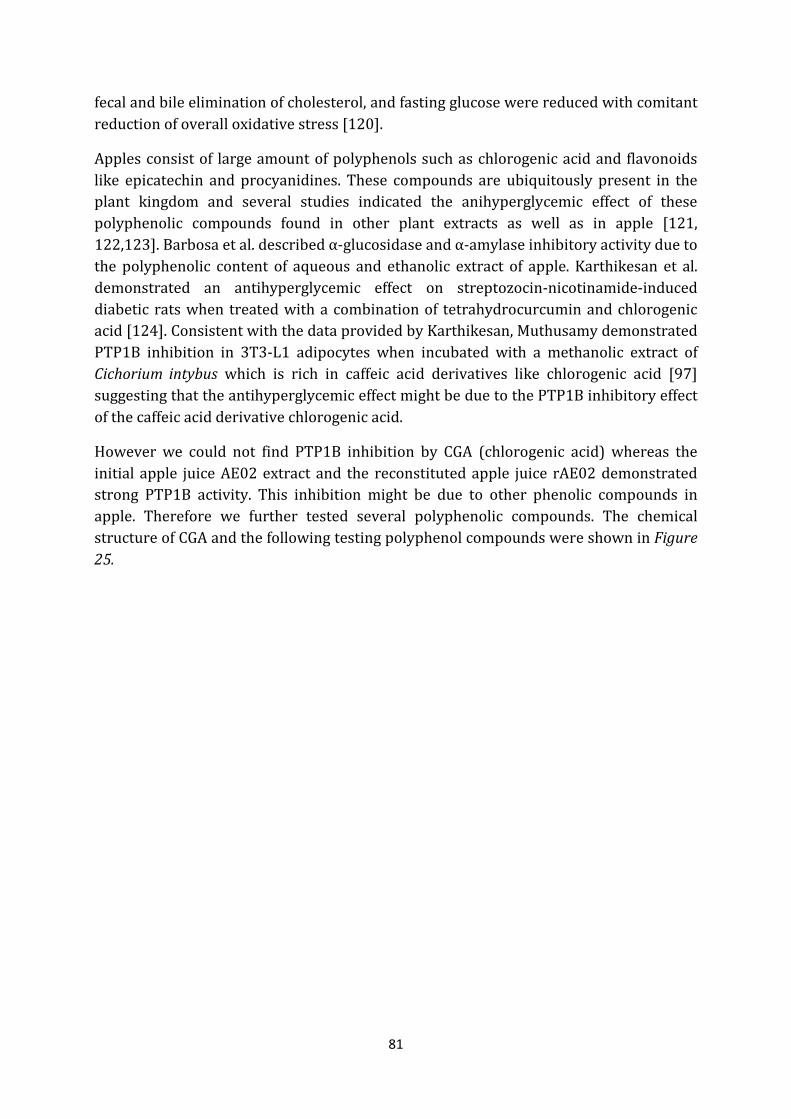
81
fecal and bile elimination of cholesterol, and fasting glucose were reduced with comitant reduction of overall oxidative stress [120].
Apples consist of large amount of polyphenols such as chlorogenic acid and flavonoids like epicatechin and procyanidines. These compounds are ubiquitously present in the plant kingdom and several studies indicated the anihyperglycemic effect of these polyphenolic compounds found in other plant extracts as well as in apple [121, 122,123]. Barbosa et al. described α-glucosidase and α-amylase inhibitory activity due to the polyphenolic content of aqueous and ethanolic extract of apple. Karthikesan et al. demonstrated an antihyperglycemic effect on streptozocin-nicotinamide-induced diabetic rats when treated with a combination of tetrahydrocurcumin and chlorogenic acid [124]. Consistent with the data provided by Karthikesan, Muthusamy demonstrated PTP1B inhibition in 3T3-L1 adipocytes when incubated with a methanolic extract of Cichorium intybus which is rich in caffeic acid derivatives like chlorogenic acid [97] suggesting that the antihyperglycemic effect might be due to the PTP1B inhibitory effect of the caffeic acid derivative chlorogenic acid.
However we could not find PTP1B inhibition by CGA (chlorogenic acid) whereas the initial apple juice AE02 extract and the reconstituted apple juice rAE02 demonstrated strong PTP1B activity. This inhibition might be due to other phenolic compounds in apple. Therefore we further tested several polyphenolic compounds. The chemical structure of CGA and the following testing polyphenol compounds were shown in Figure 25.
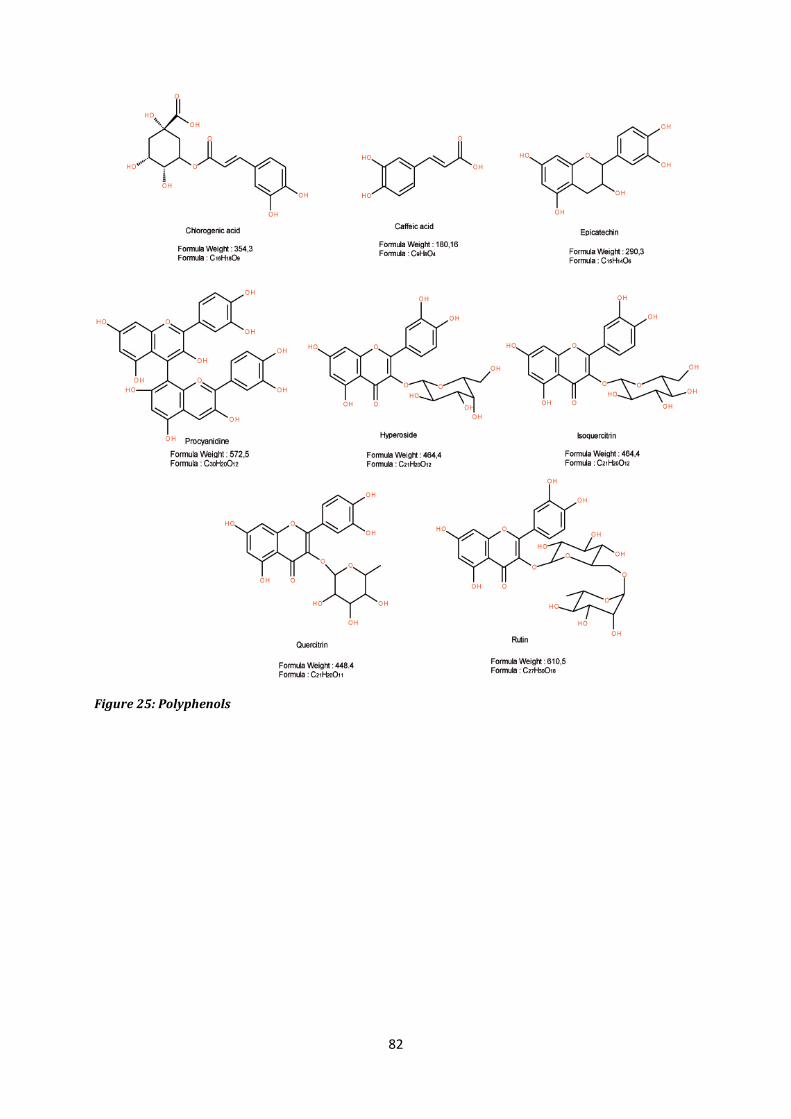
82
Figure 25: Polyphenols
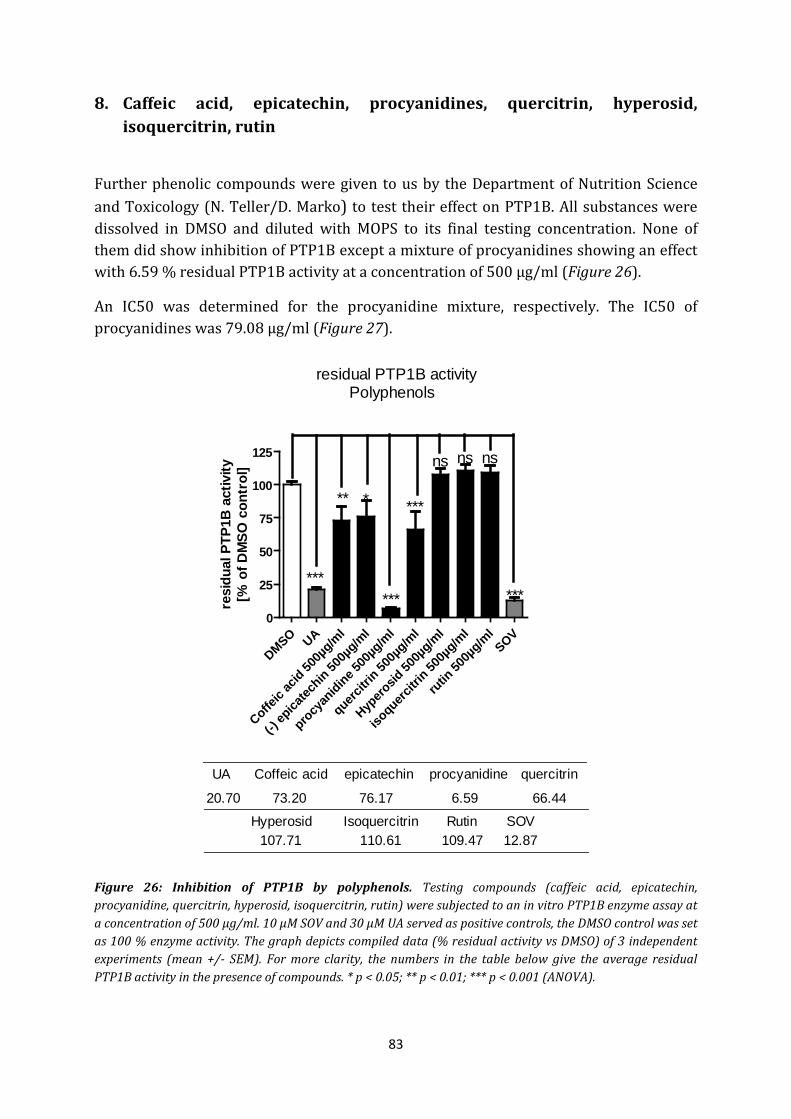
83
8. Caffeic acid, epicatechin, procyanidines, quercitrin, hyperosid, isoquercitrin, rutin
Further phenolic compounds were given to us by the Department of Nutrition Science and Toxicology (N. Teller/D. Marko) to test their effect on PTP1B. All substances were dissolved in DMSO and diluted with MOPS to its final testing concentration. None of them did show inhibition of PTP1B except a mixture of procyanidines showing an effect with 6.59 % residual PTP1B activity at a concentration of 500 µg/ml (Figure 26).
An IC50 was determined for the procyanidine mixture, respectively. The IC50 of procyanidines was 79.08 µg/ml (Figure 27).
DMSO UA
Coffeic
acid 50
0µg/m
l
(-) ep
icatec
hin 500µ
g/ml
procy
anidine 5
00µg
/ml
quercitr
in 500µ
g/ml
Hypero
sid 50
0µg/m
l
isoquerc
itrin 50
0µg/m
l
rutin
500µ
g/ml
SOV0
25
50
75
100
125
******
ns ns ns
***
UA Coffeic acid epicatechin procyanidine quercitrin
Hyperosid Isoquercitrin Rutin SOV
20.70 73.20 76.17 6.59 66.44
107.71 110.61 109.47 12.87
** * ***
residual PTP1B activity Polyphenols
resi
dual
PTP
1B a
ctiv
ity[%
of D
MSO
con
trol
]
Figure 26: Inhibition of PTP1B by polyphenols. Testing compounds (caffeic acid, epicatechin, procyanidine, quercitrin, hyperosid, isoquercitrin, rutin) were subjected to an in vitro PTP1B enzyme assay at a concentration of 500 µg/ml. 10 µM SOV and 30 µM UA served as positive controls, the DMSO control was set as 100 % enzyme activity. The graph depicts compiled data (% residual activity vs DMSO) of 3 independent experiments (mean +/- SEM). For more clarity, the numbers in the table below give the average residual PTP1B activity in the presence of compounds. * p < 0.05; ** p < 0.01; *** p < 0.001 (ANOVA).
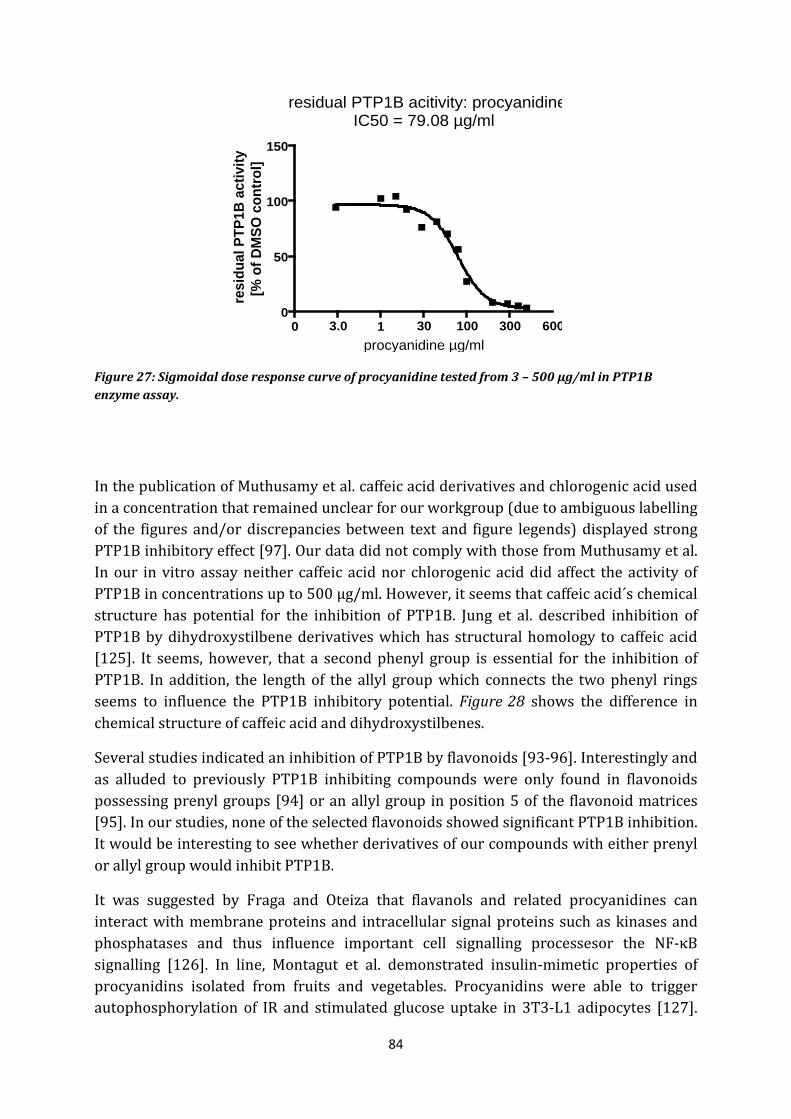
84
residual PTP1B acitivity: procyanidineIC50 = 79.08 µg/ml
0 10
50
100
150
3.0 30 100 300 600procyanidine µg/ml
resi
dual
PTP
1B a
ctiv
ity[%
of D
MSO
con
trol
]
Figure 27: Sigmoidal dose response curve of procyanidine tested from 3 – 500 µg/ml in PTP1B enzyme assay.
In the publication of Muthusamy et al. caffeic acid derivatives and chlorogenic acid used in a concentration that remained unclear for our workgroup (due to ambiguous labelling of the figures and/or discrepancies between text and figure legends) displayed strong PTP1B inhibitory effect [97]. Our data did not comply with those from Muthusamy et al. In our in vitro assay neither caffeic acid nor chlorogenic acid did affect the activity of PTP1B in concentrations up to 500 µg/ml. However, it seems that caffeic acid´s chemical structure has potential for the inhibition of PTP1B. Jung et al. described inhibition of PTP1B by dihydroxystilbene derivatives which has structural homology to caffeic acid [125]. It seems, however, that a second phenyl group is essential for the inhibition of PTP1B. In addition, the length of the allyl group which connects the two phenyl rings seems to influence the PTP1B inhibitory potential. Figure 28 shows the difference in chemical structure of caffeic acid and dihydroxystilbenes.
Several studies indicated an inhibition of PTP1B by flavonoids [93-96]. Interestingly and as alluded to previously PTP1B inhibiting compounds were only found in flavonoids possessing prenyl groups [94] or an allyl group in position 5 of the flavonoid matrices [95]. In our studies, none of the selected flavonoids showed significant PTP1B inhibition. It would be interesting to see whether derivatives of our compounds with either prenyl or allyl group would inhibit PTP1B.
It was suggested by Fraga and Oteiza that flavanols and related procyanidines can interact with membrane proteins and intracellular signal proteins such as kinases and phosphatases and thus influence important cell signalling processesor the NF-κB signalling [126]. In line, Montagut et al. demonstrated insulin-mimetic properties of procyanidins isolated from fruits and vegetables. Procyanidins were able to trigger autophosphorylation of IR and stimulated glucose uptake in 3T3-L1 adipocytes [127].
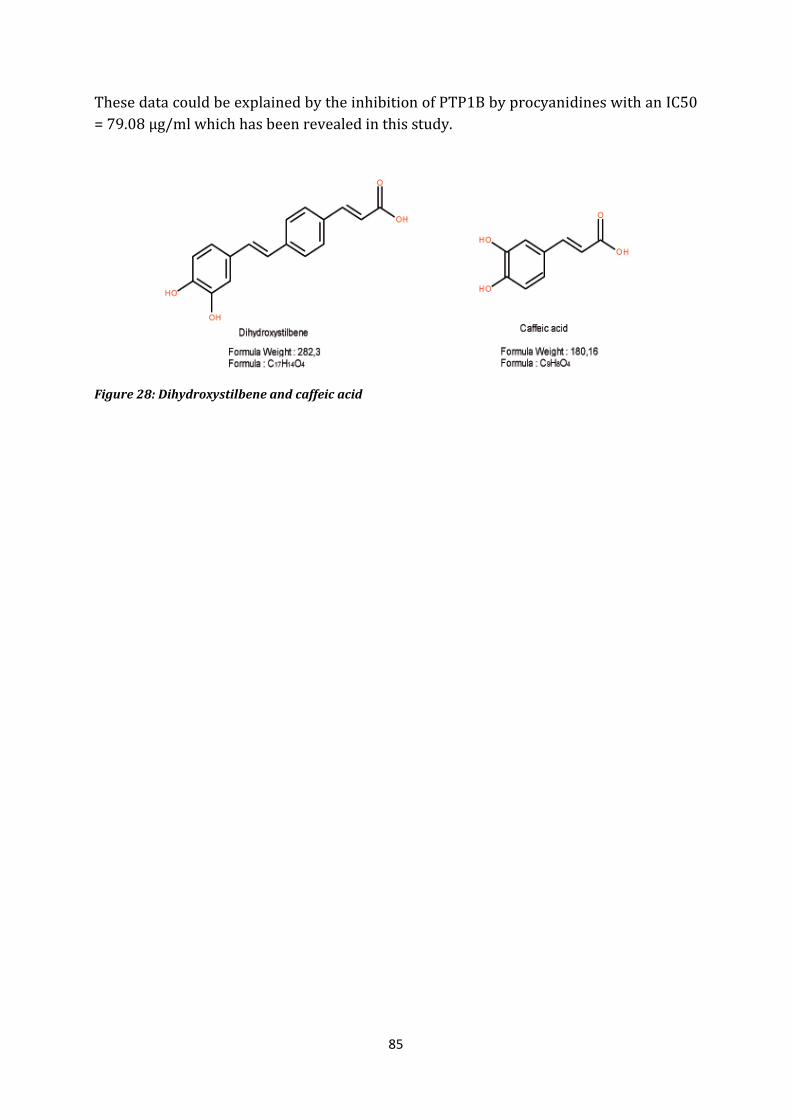
85
These data could be explained by the inhibition of PTP1B by procyanidines with an IC50 = 79.08 µg/ml which has been revealed in this study.
Figure 28: Dihydroxystilbene and caffeic acid
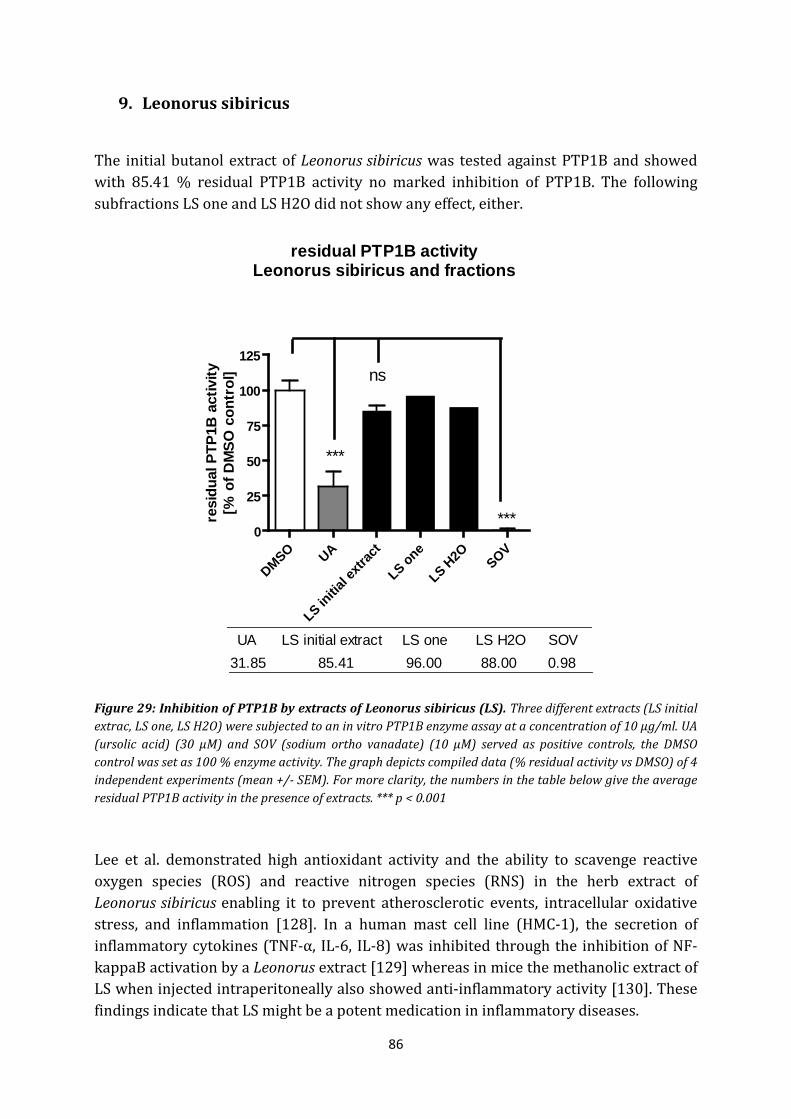
86
9. Leonorus sibiricus
The initial butanol extract of Leonorus sibiricus was tested against PTP1B and showed with 85.41 % residual PTP1B activity no marked inhibition of PTP1B. The following subfractions LS one and LS H2O did not show any effect, either.
residual PTP1B activityLeonorus sibiricus and fractions
DMSO UA
LS initia
l extr
act
LS one
LS H2O SOV
0
25
50
75
100
125
***
ns
***
UA LS initial extract LS one LS H2O SOV31.85 85.41 96.00 88.00 0.98
resi
dual
PTP
1B a
ctiv
ity[%
of D
MSO
con
trol
]
Figure 29: Inhibition of PTP1B by extracts of Leonorus sibiricus (LS). Three different extracts (LS initial extrac, LS one, LS H2O) were subjected to an in vitro PTP1B enzyme assay at a concentration of 10 µg/ml. UA (ursolic acid) (30 µM) and SOV (sodium ortho vanadate) (10 µM) served as positive controls, the DMSO control was set as 100 % enzyme activity. The graph depicts compiled data (% residual activity vs DMSO) of 4 independent experiments (mean +/- SEM). For more clarity, the numbers in the table below give the average residual PTP1B activity in the presence of extracts. *** p < 0.001
Lee et al. demonstrated high antioxidant activity and the ability to scavenge reactive oxygen species (ROS) and reactive nitrogen species (RNS) in the herb extract of Leonorus sibiricus enabling it to prevent atherosclerotic events, intracellular oxidative stress, and inflammation [128]. In a human mast cell line (HMC-1), the secretion of inflammatory cytokines (TNF-α, IL-6, IL-8) was inhibited through the inhibition of NF-kappaB activation by a Leonorus extract [129] whereas in mice the methanolic extract of LS when injected intraperitoneally also showed anti-inflammatory activity [130]. These findings indicate that LS might be a potent medication in inflammatory diseases.

87
The hypoglycemic effect indicated by our collaboration partners in Mongolia and reproduced in our laboratory in cultivated adipo- and myocytes could not be explained by the inhibition of PTP1B. The hypoglycemic effect might therefore employ other molecular mechanisms. The high antioxidative and anti-inflammatory ability of Leonorus sibiricus might prevent further impairment of insulin signalling and recommend Leonorus sibiricus for the treatment of the MetS and T2D.

88

89

90
E. Summary and Outcomes

91
92
E. Summary and Outcomes
In the present work, several plants traditionally used for treating the metabolic syndrome and type 2 diabetes were chosen through an ethnopharmacological approach combined with a bioassay-guided fractionation (fractionations are performed by our cooperation partners in Vienna and in Innsbruck), to test their impact on PTP1B, an intracellular enzyme known for negatively regulating insulin as well as leptin signalling.
Extracts of Averrhoa bilimbi, Agrimonia pilosa, Arisaema amurense, Phellodendron amurense and the extracts of an apple juice demonstrated promising PTP1B inhibition in an in vitro PTP1B enzyme assay, giving some comprehension on the molecular level of these extracts and their use against metabolic disorders. Additionally, further bioassay-guided fractionation may identify new leads for the development of new PTP1B inhibiting compounds. Additionally, we could confirm the PTP1B inhibitory effect of extracts of Averrhoa bilimbi in a human hepatoma cell line (HCC-1.2).
Moreover, through these methods we could identify compounds isolated from Phellodendron amurense and the apple juice as potent PTP1B inhibitors. Oleic acid isolated from Phellodendroni cortex showed an IC50 = 4.88 µM suggesting that other fatty acids might as well demonstrate PTP1B inhibition. Indeed we could show that palmitic acid (18.40 µM) and linoleic acid (13.34 µM) were strong PTP1B inhibitors whereas stearic acid was a weak PTP1B inhibitor. In apple the polyphenolic compound procyanidine demonstrated PTP1B inhibition with an IC50 = 79.08 µg/ml.
However, target selectivity is one important issue in order to prevent outbreak of lethal diseases. Whether the isolated compounds only affect PTP1B or also other phosphatases like TC-PTP which share 74 % structure identity with PTP1B still need to be elucidated. Another aspect is the bioavailability of PTP1B inhibitors, since the catalytic center of PTP1B is adapted to perfectly recruit two negatively charged pTyr, inhibitors of PTP1B targeting the catalytic center are usually not membrane permeable. Hence the effect of active PTP1B inhibiting compounds should as well be confirmed in cell models.

93

94
F. References

95
96
F. References
1. Alberti, K.G., Zimmet, P., Shaw, J. & Grundy, S.M. The IDF consensus worldwide definition of the Metabolic Syndrome. International Diabetes Foundation: Brussels (2006).
2. Meshkani, R. & Adeli, K. Hepatic insulin resistance, metabolic syndrome and cardiovascular disease. Clin Biochem 42, 1331-46 (2009).
3. Müller-Esterl, W. Biochemie - Eine Einführung für Mediziner und Naturwissenschaftler. Spektrum Akademischer Verlag 1. Auflage (2004).
4. Aktories, Förstermann, Hofmann & Starke. Allgemeine und spezielle Pharmakologie und Toxikologie. Urban & Fischer 9. Auflage (2005).
5. Salmeen, A., Andersen, J.N., Myers, M.P., Tonks, N.K. & Barford, D. Molecular basis for the dephosphorylation of the activation segment of the insulin receptor by protein tyrosine phosphatase 1B. Mol Cell 6, 1401-12 (2000).
6. Koren, S. & Fantus, I.G. Inhibition of the protein tyrosine phosphatase PTP1B: potential therapy for obesity, insulin resistance and type-2 diabetes mellitus. Best Pract Res Clin Endocrinol Metab 21, 621-40 (2007).
7. Leclercq, I.A., Da Silva Morais, A., Schroyen, B., Van Hul, N. & Geerts, A. Insulin resistance in hepatocytes and sinusoidal liver cells: mechanisms and consequences. J Hepatol 47, 142-56 (2007).
8. Lizcano, J.M. & Alessi, D.R. The insulin signalling pathway. Curr Biol 12, R236-8 (2002). 9. Biddinger, S.B. & Kahn, C.R. From mice to men: insights into the insulin resistance
syndromes. Annu Rev Physiol 68, 123-58 (2006). 10. Tripathy, D. et al. Elevation of free fatty acids induces inflammation and impairs
vascular reactivity in healthy subjects. Diabetes 52, 2882-7 (2003). 11. Despres, J.P. & Lemieux, I. Abdominal obesity and metabolic syndrome. Nature 444,
881-7 (2006). 12. Boden, G. & Shulman, G.I. Free fatty acids in obesity and type 2 diabetes: defining
their role in the development of insulin resistance and beta-cell dysfunction. Eur J Clin Invest 32 Suppl 3, 14-23 (2002).
13. Esper, R.J., Vilarino, J.O., Machado, R.A. & Paragano, A. Endothelial dysfunction in normal and abnormal glucose metabolism. Adv Cardiol 45, 17-43 (2008).
14. Dube, N., Cheng, A. & Tremblay, M.L. The role of protein tyrosine phosphatase 1B in Ras signaling. Proc Natl Acad Sci U S A 101, 1834-9 (2004).
15. Tonks, N.K. & Muthuswamy, S.K. A brake becomes an accelerator: PTP1B--a new therapeutic target for breast cancer. Cancer Cell 11, 214-6 (2007).
16. Zhang, Z.Y. Protein tyrosine phosphatases: prospects for therapeutics. Curr Opin Chem Biol 5, 416-23 (2001).
17. Barford, D., Jia, Z. & Tonks, N.K. Protein tyrosine phosphatases take off. Nat Struct Biol 2, 1043-53 (1995).
18. Lessard, L., Stuible, M. & Tremblay, M.L. The two faces of PTP1B in cancer. Biochim Biophys Acta 1804, 613-9 (2010).
19. Tonks, N.K. Protein tyrosine phosphatases: from genes, to function, to disease. Nat Rev Mol Cell Biol 7, 833-46 (2006).
20. Zhang, Z.Y. Protein tyrosine phosphatases: structure and function, substrate specificity, and inhibitor development. Annu Rev Pharmacol Toxicol 42, 209-34 (2002).
97
21. Pedersen, A.K. et al. Residue 182 influences the second step of protein-tyrosine phosphatase-mediated catalysis. Biochem J 378, 421-33 (2004).
22. van Montfort, R.L., Congreve, M., Tisi, D., Carr, R. & Jhoti, H. Oxidation state of the active-site cysteine in protein tyrosine phosphatase 1B. Nature 423, 773-7 (2003).
23. Brandao, T.A., Hengge, A.C. & Johnson, S.J. Insights into the reaction of protein-tyrosine phosphatase 1B: crystal structures for transition state analogs of both catalytic steps. J Biol Chem 285, 15874-83.
24. Dube, N. & Tremblay, M.L. Involvement of the small protein tyrosine phosphatases TC-PTP and PTP1B in signal transduction and diseases: from diabetes, obesity to cell cycle, and cancer. Biochim Biophys Acta 1754, 108-17 (2005).
25. Puius, Y.A. et al. Identification of a second aryl phosphate-binding site in protein-tyrosine phosphatase 1B: a paradigm for inhibitor design. Proc Natl Acad Sci U S A 94, 13420-5 (1997).
26. Myers, M.P. et al. TYK2 and JAK2 are substrates of protein-tyrosine phosphatase 1B. J Biol Chem 276, 47771-4 (2001).
27. Anderie, I., Schulz, I. & Schmid, A. Characterization of the C-terminal ER membrane anchor of PTP1B. Exp Cell Res 313, 3189-97 (2007).
28. Frangioni, J.V., Beahm, P.H., Shifrin, V., Jost, C.A. & Neel, B.G. The nontransmembrane tyrosine phosphatase PTP-1B localizes to the endoplasmic reticulum via its 35 amino acid C-terminal sequence. Cell 68, 545-60 (1992).
29. Liu, F., Hill, D.E. & Chernoff, J. Direct binding of the proline-rich region of protein tyrosine phosphatase 1B to the Src homology 3 domain of p130 (Cas). J Biol Chem 271, 31290-5 (1996).
30. Anderie, I., Schulz, I. & Schmid, A. Direct interaction between ER membrane-bound PTP1B and its plasma membrane-anchored targets. Cell Signal 19, 582-92 (2007).
31. Frangioni, J.V., Oda, A., Smith, M., Salzman, E.W. & Neel, B.G. Calpain-catalyzed cleavage and subcellular relocation of protein phosphotyrosine phosphatase 1B (PTP-1B) in human platelets. EMBO J 12, 4843-56 (1993).
32. Romsicki, Y., Reece, M., Gauthier, J.Y., Asante-Appiah, E. & Kennedy, B.P. Protein tyrosine phosphatase-1B dephosphorylation of the insulin receptor occurs in a perinuclear endosome compartment in human embryonic kidney 293 cells. J Biol Chem 279, 12868-75 (2004).
33. Boute, N., Boubekeur, S., Lacasa, D. & Issad, T. Dynamics of the interaction between the insulin receptor and protein tyrosine-phosphatase 1B in living cells. EMBO Rep 4, 313-9 (2003).
34. Sivaramakrishnan, S., Cummings, A.H. & Gates, K.S. Protection of a single-cysteine redox switch from oxidative destruction: On the functional role of sulfenyl amide formation in the redox-regulated enzyme PTP1B. Bioorg Med Chem Lett 20, 444-7.
35. Mahadev, K., Zilbering, A., Zhu, L. & Goldstein, B.J. Insulin-stimulated hydrogen peroxide reversibly inhibits protein-tyrosine phosphatase 1b in vivo and enhances the early insulin action cascade. J Biol Chem 276, 21938-42 (2001).
36. Ravichandran, L.V., Chen, H., Li, Y. & Quon, M.J. Phosphorylation of PTP1B at Ser(50) by Akt impairs its ability to dephosphorylate the insulin receptor. Mol Endocrinol 15, 1768-80 (2001).
37. Hsu, M.F. & Meng, T.C. Enhancement of insulin responsiveness by nitric oxide-mediated inactivation of protein-tyrosine phosphatases. J Biol Chem 285, 7919-28.
38. Cicirelli, M.F. et al. Microinjection of a protein-tyrosine-phosphatase inhibits insulin action in Xenopus oocytes. Proc Natl Acad Sci U S A 87, 5514-8 (1990).
98
39. Kenner, K.A., Anyanwu, E., Olefsky, J.M. & Kusari, J. Protein-tyrosine phosphatase 1B is a negative regulator of insulin- and insulin-like growth factor-I-stimulated signaling. J Biol Chem 271, 19810-6 (1996).
40. Byon, J.C., Kusari, A.B. & Kusari, J. Protein-tyrosine phosphatase-1B acts as a negative regulator of insulin signal transduction. Mol Cell Biochem 182, 101-8 (1998).
41. Goldstein, B.J., Bittner-Kowalczyk, A., White, M.F. & Harbeck, M. Tyrosine dephosphorylation and deactivation of insulin receptor substrate-1 by protein-tyrosine phosphatase 1B. Possible facilitation by the formation of a ternary complex with the Grb2 adaptor protein. J Biol Chem 275, 4283-9 (2000).
42. Wang, X.Y., Bergdahl, K., Heijbel, A., Liljebris, C. & Bleasdale, J.E. Analysis of in vitro interactions of protein tyrosine phosphatase 1B with insulin receptors. Mol Cell Endocrinol 173, 109-20 (2001).
43. Ahmad, F., Li, P.M., Meyerovitch, J. & Goldstein, B.J. Osmotic loading of neutralizing antibodies demonstrates a role for protein-tyrosine phosphatase 1B in negative regulation of the insulin action pathway. J Biol Chem 270, 20503-8 (1995).
44. Xie, L. et al. Cellular effects of small molecule PTP1B inhibitors on insulin signaling. Biochemistry 42, 12792-804 (2003).
45. Elchebly, M. et al. Increased insulin sensitivity and obesity resistance in mice lacking the protein tyrosine phosphatase-1B gene. Science 283, 1544-8 (1999).
46. Klaman, L.D. et al. Increased energy expenditure, decreased adiposity, and tissue-specific insulin sensitivity in protein-tyrosine phosphatase 1B-deficient mice. Mol Cell Biol 20, 5479-89 (2000).
47. Jequier, E. Leptin signaling, adiposity, and energy balance. Ann N Y Acad Sci 967, 379-88 (2002).
48. Myers, M.G., Jr., Leibel, R.L., Seeley, R.J. & Schwartz, M.W. Obesity and leptin resistance: distinguishing cause from effect. Trends Endocrinol Metab 21, 643-51.
49. Cheng, A. et al. Attenuation of leptin action and regulation of obesity by protein tyrosine phosphatase 1B. Dev Cell 2, 497-503 (2002).
50. Zabolotny, J.M. et al. PTP1B regulates leptin signal transduction in vivo. Dev Cell 2, 489-95 (2002).
51. Morrison, C.D. et al. Increased hypothalamic protein tyrosine phosphatase 1B contributes to leptin resistance with age. Endocrinology 148, 433-40 (2007).
52. Gu, F. et al. Protein tyrosine phosphatase 1B attenuates growth hormone-mediated JAK2-STAT signaling. Mol Cell Biol 23, 3753-62 (2003).
53. Zhang, S. & Zhang, Z.Y. PTP1B as a drug target: recent developments in PTP1B inhibitor discovery. Drug Discov Today 12, 373-81 (2007).
54. Galic, S. et al. Coordinated regulation of insulin signaling by the protein tyrosine phosphatases PTP1B and TCPTP. Mol Cell Biol 25, 819-29 (2005).
55. Iversen, L.F. et al. Structure determination of T cell protein-tyrosine phosphatase. J Biol Chem 277, 19982-90 (2002).
56. Galic, S. et al. Regulation of insulin receptor signaling by the protein tyrosine phosphatase TCPTP. Mol Cell Biol 23, 2096-108 (2003).
57. Heinonen, K.M. et al. T-cell protein tyrosine phosphatase deletion results in progressive systemic inflammatory disease. Blood 103, 3457-64 (2004).
58. Bourdeau, A. et al. TC-PTP-deficient bone marrow stromal cells fail to support normal B lymphopoiesis due to abnormal secretion of interferon-{gamma}. Blood 109, 4220-8 (2007).
99
59. Wiesmann, C. et al. Allosteric inhibition of protein tyrosine phosphatase 1B. Nat Struct Mol Biol 11, 730-7 (2004).
60. Baumgartner, R.R. et al. Bioactivity-Guided Isolation of 1,2,3,4,6-Penta-O-galloyl-d-glucopyranose from Paeonia lactiflora Roots As a PTP1B Inhibitor. J Nat Prod (2010).
61. Na, M. et al. Inhibition of protein tyrosine phosphatase 1B by ursane-type triterpenes isolated from Symplocos paniculata. Planta Med 72, 261-3 (2006).
62. Zhang, W. et al. Ursolic acid and its derivative inhibit protein tyrosine phosphatase 1B, enhancing insulin receptor phosphorylation and stimulating glucose uptake. Biochim Biophys Acta 1760, 1505-12 (2006).
63. Jung, S.H. et al. Insulin-mimetic and insulin-sensitizing activities of a pentacyclic triterpenoid insulin receptor activator. Biochem J 403, 243-50 (2007).
64. Lin, Z. et al. Oleanolic acid derivative NPLC441 potently stimulates glucose transport in 3T3-L1 adipocytes via a multi-target mechanism. Biochem Pharmacol 76, 1251-62 (2008).
65. Zhang, Y.N. et al. Oleanolic acid and its derivatives: new inhibitor of protein tyrosine phosphatase 1B with cellular activities. Bioorg Med Chem 16, 8697-705 (2008).
66. Pushpakumara, D.K.N.G. Biling - Averrhoa bilimbi L. http://www.worldagroforestry.org/downloads/publications/PDFs/BC07397.PDF (11.08.2011).
67. Kato, H., Li, W., Koike, M., Wang, Y. & Koike, K. Phenolic glycosides from Agrimonia pilosa. Phytochemistry 71, 1925-9.
68. Jung, J.H., Lee, H. & Kang, S.S. Diacylglycerylgalactosides from Arisaema amurense. Phytochemistry 42, 447-52 (1996).
69. Blaschek, W. et al. Hager ROM 2011 - Hagers Handbuch der Drogen und Arzneistoffe. Springer (2001).
70. Chevallier, A. Die BLV Enzyklopädie der Heilpflanzen. BLV Verlagsgesellschaft mbH 2 (2000).
71. Lin, R.D., Hou, W.C., Yen, K.Y. & Lee, M.H. Inhibition of monoamine oxidase B (MAO-B) by Chinese herbal medicines. Phytomedicine 10, 650-6 (2003).
72. Park, E.K. et al. Antiinflammatory effects of a combined herbal preparation (RAH13) of Phellodendron amurense and Coptis chinensis in animal models of inflammation. Phytother Res 21, 746-50 (2007).
73. Tang & Eisenbrand. Chinese Drugs of Plant origin: Chemistry, Pharmacology and use in traditional modern medicine. Springer (1992).
74. Ikuta, A., Urabe, H. & Nakamura, T. A new indolopyridoquinazoline-type alkaloid from phellodendron amurense callus tissues. J Nat Prod 61, 1012-4 (1998).
75. Wu, H., Fronczek, F.R., Ferreira, D., Burandt, C.L., Jr. & Zjawiony, J.K. Labdane diterpenoids from Leonurus sibiricus. J Nat Prod 74, 831-6.
76. Cafferty, S. Kosmos-Atlas Bäume der Welt. Kosmos (2008). 77. Boyer, J. & Liu, R.H. Apple phytochemicals and their health benefits. Nutr J 3, 5
(2004). 78. http://www.wien.gv.at/lebensmittel/lebensmittel/uebersicht/obst/apfel.html
(21.07.2011). 79. van Wyk, B. Handbuch der Nahrungspflanzen. Wissenschaftliche Verlagsgesellschaft
mbH Stuttgart (2005). 80. http://www.drugs.com/npp/apple.html. (25.07.2011).
100
81. Bradford, M.M. A rapid and sensitive method for the quantitation of microgram quantities of protein utilizing the principle of protein-dye binding. Anal Biochem 72, 248-54 (1976).
82. Laemmli, U.K. Cleavage of Structural Proteins during the Assembly of the Head of Bacteriophage T4. Nature 227, 680 - 685 (1970).
83. Tan, B.K., Tan, C.H. & Pushparaj, P.N. Anti-diabetic activity of the semi-purified fractions of Averrhoa bilimbi in high fat diet fed-streptozotocin-induced diabetic rats. Life Sci 76, 2827-39 (2005).
84. Pushparaj, P., Tan, C.H. & Tan, B.K. Effects of Averrhoa bilimbi leaf extract on blood glucose and lipids in streptozotocin-diabetic rats. J Ethnopharmacol 72, 69-76 (2000).
85. Pushparaj, P.N., Tan, B.K. & Tan, C.H. The mechanism of hypoglycemic action of the semi-purified fractions of Averrhoa bilimbi in streptozotocin-diabetic rats. Life Sci 70, 535-47 (2001).
86. Jeyakumar, S.M., Kumar, P.V., Giridharan, N.V. & Vajreswari, A. Vitamin A improves insulin sensitivity by increasing insulin receptor phosphorylation through protein tyrosine phosphatase1B regulation at early age in obese rats of WNIN/Ob strain. Diabetes Obes Metab.
87. Bae, H. et al. Inhibitory effect of Agrimoniae Herba on lipopolysaccharide-induced nitric oxide and proinflammatory cytokine production in BV2 microglial cells. Neurol Res 32 Suppl 1, 53-7.
88. Miyamoto, K., Kishi, N. & Koshiura, R. Antitumor effect of agrimoniin, a tannin of Agrimonia pilosa Ledeb., on transplantable rodent tumors. Jpn J Pharmacol 43, 187-95 (1987).
89. Zhu, L. et al. Antioxidant activities of aqueous extract from Agrimonia pilosa Ledeb and its fractions. Chem Biodivers 6, 1716-26 (2009).
90. Singh, K., Khanna, A.K., Visen, P.K. & Chander, R. Protective effect of ellagic acid on t-butyl hydroperoxide induced lipid peroxidation in isolated rat hepatocytes. Indian J Exp Biol 37, 939-40 (1999).
91. Swanston-Flatt, S.K., Day, C., Bailey, C.J. & Flatt, P.R. Traditional plant treatments for diabetes. Studies in normal and streptozotocin diabetic mice. Diabetologia 33, 462-4 (1990).
92. Gray, A.M. & Flatt, P.R. Actions of the traditional anti-diabetic plant, Agrimony eupatoria (agrimony): effects on hyperglycaemia, cellular glucose metabolism and insulin secretion. Br J Nutr 80, 109-14 (1998).
93. Cui, L. et al. New prenylated flavanones from Erythrina abyssinica with protein tyrosine phosphatase 1B (PTP1B) inhibitory activity. Planta Med 76, 713-8 (2010).
94. Li, S., Li, W., Wang, Y., Asada, Y. & Koike, K. Prenylflavonoids from Glycyrrhiza uralensis and their protein tyrosine phosphatase-1B inhibitory activities. Bioorg Med Chem Lett 20, 5398-401 (2010).
95. Yoon, G., Lee, W., Kim, S.N. & Cheon, S.H. Inhibitory effect of chalcones and their derivatives from Glycyrrhiza inflata on protein tyrosine phosphatase 1B. Bioorg Med Chem Lett 19, 5155-7 (2009).
96. Lee, M.S. et al. Genistein-derivatives from Tetracera scandens stimulate glucose-uptake in L6 myotubes. Biol Pharm Bull 32, 504-8 (2009).
97. Muthusamy, V.S. et al. Inhibition of protein tyrosine phosphatase 1B and regulation of insulin signalling markers by caffeoyl derivatives of chicory ( Cichorium intybus) salad leaves. Br J Nutr 104, 813-23 (2010).
101
98. Jung, J.H., Lee, C.O., Kim, Y.C. & Kang, S.S. New bioactive cerebrosides from Arisaema amurense. J Nat Prod 59, 319-22 (1996).
99. Margalit, M. et al. Glucocerebroside ameliorates the metabolic syndrome in OB/OB mice. J Pharmacol Exp Ther 319, 105-10 (2006).
100. Gao, C.R., Zhang, J.Q. & Huang, Q.L. [Experimental study on berberin raised insulin sensitivity in insulin resistance rat models]. Zhongguo Zhong Xi Yi Jie He Za Zhi 17, 162-4 (1997).
101. Xie, X. et al. Berberine ameliorates hyperglycemia in alloxan-induced diabetic C57BL/6 mice through activation of Akt signaling pathway. Endocr J (2011).
102. Cok, A. et al. Berberine acutely activates the glucose transport activity of GLUT1. Biochimie 93, 1187-92 (2011).
103. no author listed. Antidiabetic activity of berberin and extract, obtained from the bark of Phellodendron lavalei, introduced in subtropic regions of Georgia, in streptozotocin induced diabetic rats. Georgian Med News, 53-60.
104. Kim, H.J., Kong, M.K. & Kim, Y.C. Beneficial effects of Phellodendri Cortex extract on hyperglycemia and diabetic nephropathy in streptozotocin-induced diabetic rats. BMB Rep 41, 710-5 (2008).
105. Yan, Y.H., Chou, C.C., Lee, C.T., Liu, J.Y. & Cheng, T.J. Enhanced insulin resistance in diet-induced obese rats exposed to fine particles by instillation. Inhal Toxicol (2011).
106. Randle, P.J. Regulatory interactions between lipids and carbohydrates: the glucose fatty acid cycle after 35 years. Diabetes Metab Rev 14, 263-83 (1998).
107. Dresner, A. et al. Effects of free fatty acids on glucose transport and IRS-1-associated phosphatidylinositol 3-kinase activity. J Clin Invest 103, 253-9 (1999).
108. Griffin, M.E. et al. Free fatty acid-induced insulin resistance is associated with activation of protein kinase C theta and alterations in the insulin signaling cascade. Diabetes 48, 1270-4 (1999).
109. Teuscher, Melzig & Lindequist. Biogene Arzneimittel - Ein Lehrbuch der Pharmazeutischen Biologie. Wissenschaftliche Verlagsgesellschaft mbH Stuttgart 6. Auflage (2004).
110. Shao, J., Gao, Y. & Yuan, Z. [Free fatty acids promoting PTP1B expression in rat skeletal muscle and hepatic cells]. Zhonghua Yi Xue Za Zhi 78, 753-5 (1998).
111. Parvaneh, L. et al. Palmitate and inflammatory state additively induce the expression of PTP1B in muscle cells. Biochem Biophys Res Commun 396, 467-71 (2010).
112. Peng, G. et al. Oleate blocks palmitate-induced abnormal lipid distribution, endoplasmic reticulum expansion and stress, and insulin resistance in skeletal muscle. Endocrinology 152, 2206-18 (2011).
113. Wen, H. et al. Fatty acid-induced NLRP3-ASC inflammasome activation interferes with insulin signaling. Nat Immunol 12, 408-15 (2011).
114. Tuei, V.C., Ha, J.S. & Ha, C.E. Effects of human serum albumin complexed with free fatty acids on cell viability and insulin secretion in the hamster pancreatic beta-cell line HIT-T15. Life Sci 88, 810-8 (2011).
115. Yang, Z.H., Miyahara, H. & Hatanaka, A. Chronic administration of palmitoleic acid reduces insulin resistance and hepatic lipid accumulation in KK-Ay Mice with genetic type 2 diabetes. Lipids Health Dis 10, 120 (2011).
116. Pu, J. et al. Palmitic acid acutely stimulates glucose uptake via activation of Akt and ERK1/2 in skeletal muscle cells. J Lipid Res 52, 1319-27 (2011).
117. Crespin, S.R., Greenough, W.B., 3rd & Steinberg, D. Stimulation of insulin secretion by long-chain free fatty acids. A direct pancreatic effect. J Clin Invest 52, 1979-84 (1973).
102
118. Wagner, K.D. & Wagner, N. Peroxisome proliferator-activated receptor beta/delta (PPARbeta/delta) acts as regulator of metabolism linked to multiple cellular functions. Pharmacol Ther 125, 423-35 (2010).
119. Gerhauser, C. Cancer chemopreventive potential of apples, apple juice, and apple components. Planta Med 74, 1608-24 (2008).
120. Seymour, E.M., Spink, H.C., Kondoleon, M.G., Urcuyo-Llanes, D.E. & Bolling, S.F. Apple Intake Reduces Hypertension and Cardiac Pathology in Obese Rats with Metabolic Syndrome. Journal of the American DIetetic Association.
121. Ong, K.W., Hsu, A., Song, L., Huang, D. & Tan, B.K. Polyphenols-rich Vernonia amygdalina shows anti-diabetic effects in streptozotocin-induced diabetic rats. J Ethnopharmacol 133, 598-607 (2011).
122. Barbosa, A.C. et al. Varietal influences on antihyperglycemia properties of freshly harvested apples using in vitro assay models. J Med Food 13, 1313-23 (2010).
123. Benalla, W., Bellahcen, S. & Bnouham, M. Antidiabetic medicinal plants as a source of alpha glucosidase inhibitors. Curr Diabetes Rev 6, 247-54 (2010).
124. Karthikesan, K., Pari, L. & Menon, V.P. Combined treatment of tetrahydrocurcumin and chlorogenic acid exerts potential antihyperglycemic effect on streptozotocin-nicotinamide-induced diabetic rats. Gen Physiol Biophys 29, 23-30 (2010).
125. Jung, M. et al. Design, synthesis, and discovery of stilbene derivatives based on lithospermic acid B as potent protein tyrosine phosphatase 1B inhibitors. Bioorg Med Chem Lett 17, 4481-6 (2007).
126. Fraga, C.G. & Oteiza, P.I. Dietary flavonoids: Role of (-)-epicatechin and related procyanidins in cell signaling. Free Radic Biol Med 51, 813-23 (2011).
127. Montagut, G. et al. Oligomers of grape-seed procyanidin extract activate the insulin receptor and key targets of the insulin signaling pathway differently from insulin. J Nutr Biochem 21, 476-81 (2010).
128. Lee, M.J., Lee, H.S., Park, S.D., Moon, H.I. & Park, W.H. Leonurus sibiricus herb extract suppresses oxidative stress and ameliorates hypercholesterolemia in C57BL/6 mice and TNF-alpha induced expression of adhesion molecules and lectin-like oxidized LDL receptor-1 in human umbilical vein endothelial cells. Biosci Biotechnol Biochem 74, 279-84.
129. Shin, H.Y. et al. Anti-inflammatory activity of Motherwort (Leonurus sibiricus L.). Immunopharmacol Immunotoxicol 31, 209-13 (2009).
130. Islam, M.A., Ahmed, F., Das, A.K. & Bachar, S.C. Analgesic and anti-inflammatory activity of Leonurus sibiricus. Fitoterapia 76, 359-62 (2005).
131. Grundy, S.M. et al. Diagnosis and management of the metabolic syndrome: an American Heart Association/National Heart, Lung, and Blood Institute scientific statement: Executive Summary. Crit Pathw Cardiol 4, 198-203 (2005).
132. Baumgartner, R. Doctoral thesis, Virtual and real screening of natural products to find effective modulators of protein tyrosine phosphatase PTP1B. (2010).

103

104
G. Appendix

105
106
G. Appendix
Abbreviations
A
AE Arisaema species AGE Advanced glycosylation endproducts Ah Agrimoniae herba AKT/PKB Protein kinase B AS160 Akt substrate 160 Av Averrhoa bilimbi
B
BMI Body mass index
C
CGA Chlorogenic acid
E
ER Endoplasmic reticulum
F
FFA Free fatty acid FOXO Forkheadbox proteins
G
GLUT-4 Glucose transporter 4 GRB2 Growth factor receptor bound protein 2 GS Glycogen synthase GSK Glycogen synthase kinase
H
HCC-1.2 Human hepatocellular carcinoma cell line HDL-C High density lipoprotein - cholesterol HSL Hormone sensitive lipase
I
IFG Impaired fasting glucose IGT Impaired glucose tolerance
107
IR Insulin receptor IRS Insulin receptor substrate
J
JAK Janus Kinase / Just Another Kinase
L
LA Linoleic acid LPL Lipoproteine lipase LS Leonorus sibiricus
M
MAO Monoamino oxidase MAPK Mitogen activated protein kinase mc Monoclonal
MetS Metabolic syndrome
MSH Melanocyte stimulating hormone mTOR Mammalian target of Rapamycine
N
NPY Neuropeptide Y
O
OA Oleic acid
P
PA Palmitic acid Pc Phellodendroni cortex PDK Phosphatidylinositol dependent kinase PEPCK Phosphoenolpyruvate carboxy-kinase PI3K Phophatidylinositol 3-kinase pNP Para nitro-phenole pNPP Para nitro-phenole phosphate pSer Phospho serine pThr Phospho threonine PTK Proteine tyrosine kinase PTP Proteine tyrosine phosphatase PTP1B Proteine tyrosine phosphatse 1B pTyr Phospho tyrosine
108
R
ROS Reactive oxygen species RPTP Receptor proteine tyrosine phosphatase
S
SA Stearic acid SH2 Src homology 2 SOCS3 Supressor of cytokine signalling 3 SOV Sodium ortho vanadate SREBP1c Sterol regulatory element binding protein 1c STAT Signal transducers and activators of transcription protein
T
T2D Type 2 diabetes TC-PTP T-cell protein tyrosine phosphatase TG Triglyceride TNF Tumor necrosis factor Tyr Tyrosine
U
UA Ursolic acid
V
VLDL Very low density lipoproteine
109
List of tables
Table I: Definition of the metabolic syndrome by the WHO ........................................................ 18 Table II: Enzyme ........................................................................................................................................... 36 Table III: Buffers ........................................................................................................................................... 36 Table IV: Test compounds and controls .............................................................................................. 38 Table V: Medium and buffers ................................................................................................................... 41 Table VI: Buffers and solutions ............................................................................................................... 43 Table VII: Antibodies ................................................................................................................................... 44 Table VIII: Insulin ......................................................................................................................................... 45 Table IX: Bradford reagent ....................................................................................................................... 45 Table X: SDS Page ......................................................................................................................................... 48 Table XI: Solutions ....................................................................................................................................... 49 Table XII: Technical equipment and software................................................................................... 50 Table XIII: Tested compounds and extracts ....................................................................................... 60
List of figures
Figure 1: Simplified overview over the insulin signal pathway and the site of action of PTP1B ................................................................................................................................................................ 16 Figure 2: PTP1B Crystal Structure ......................................................................................................... 21 Figure 3: Substrate Recognition and Dephosphorylation byPTP1B ......................................... 21 Figure 4: Redoxregulation of PTP1B ..................................................................................................... 23 Figure 5: Snapshot on PTP1B in leptin signalling ............................................................................ 26 Figure 6: Schematic overview over the domains of PTP1B and TC-PTP ................................ 28 Figure 7: pNPP, the substrate of phosphatases ................................................................................ 39 Figure 8: pipette scheme of PTP1B colorimetric enzyme assay ................................................ 40 Figure 9: schematic figure of cells treatment and insulin stimulation. ................................... 44 Figure 10: Inhibition of PTP1B by extracts of Averroha bilimbi (AV). .................................... 61 Figure 11: Representative figure of insulin-dependent insulin receptor (IR) phosphorylation in HCC-1.2 treated with Averroha bilimbi extracts. ..................................... 62 Figure 12: Inhibition of PTP1B by extracts of Agrimoniae herba (Ah) separated on a Sephadex stationary phase ....................................................................................................................... 64 Figure 13: Inhibition of PTP1B by extracts of Agrimoniae herba (Ah) separated on RP-18. ....................................................................................................................................................................... 65 Figure 14: Inhibition of PTP1B by extracts of Arisaema sp (AE). .............................................. 68 Figure 15: Inhibition of PTP1B by dichlormethane subfractions of Arisaema sp (AE). ... 69 Figure 16: Inhibition of PTP1B by methanol subfrations of Arisaema sp (AE).................... 70 Figure 17: Inhibition of PTP1B by 2 different mixtures of glucocerebrosides ..................... 72 Figure 18: Inhibition of PTP1B by extracts of Phellodendroni cortex (Pc).. ......................... 73 Figure 19: Chemical structure of Palmitic acid, Stearic acid, Oleic acid and Linoleic acid. ............................................................................................................................................................................. 75 Figure 20: Inhibition of PTP1B by fatty acids.. .................................................................................. 76
110
Figure 21: Sigmoidal dose response curve of oleic acid determined in the PTP1B enzyme assay. ................................................................................................................................................................. 77 Figure 22: Sigmoidal dose response curve of palmitic acid determined in the PTP1B enzyme assay ................................................................................................................................................. 77 Figure 23: Sigmoidal dose response curve of Linoleic acid determined in the PTP1B enzyme assay. ................................................................................................................................................ 77 Figure 24: Inhibition of PTP1B by apple juice extracts enriched by either chlorogenic acid or glucose. .............................................................................................................................................. 80 Figure 25: Polyphenols ............................................................................................................................... 82 Figure 26: Inhibition of PTP1B by polyphenols................................................................................ 83 Figure 27: Sigmoidal dose response curve of procyanidine. ....................................................... 84 Figure 28: Dihydroxystilbene and coffeic acid .................................................................................. 85 Figure 29: Inhibition of PTP1B by extracts of Leonorus sibiricus (LS) ................................... 86
111
Curriculum vitae
Personal data Name: San-Po Pan Date and place of birth: 31. January 1984, Taiwan, Taipei Nationality: Taiwan R. O. C. Education 10/2004 – 09/2011 Study of Pharmacy, University of Vienna 03 - 06/2004 Study of Sinology, University of Vienna 10/2003 -02/2004 Study of Technical Chemistry, Technical
University of Vienna 09/1995 – 06/2003 Bundes / Realgymnasium Klosterneuburg,
Austria
1991 – 1995 Volksschule Klosterneuburg, Austria 1989 – 1991 Volksschule Taiwan, Taipei
112
Acknowledgements
First of all, I want to thank Univ.-Prof. Dr. Verena Dirsch who gave me the opportunity to work at my diploma thesis in the workgroup “Molecular Targets” at the Department of Pharmacognosy at the University of Vienna. Through this chance, I was able to learn the methods of scientific working in a professional atmosphere as well as the good laboratory practice.
Many thanks to Elke Heiss, who helped me writing and correcting my diploma work. It seems to me that she immediately dropped her own work and took time for me when I needed some advices.
I want to express my gratitude to Renate Baumgartner who introduced me to my diploma subjects and always helped me with my data analysis as well as Matthias Kramer who taught me the methods of scientific working with accuracy.
Furthermore, I also want to thank former and current members of the “Molecular Targets” for helping me, giving me advices, and the joyful times (tea time, party time) during my diploma work (Atanas Atanasov, Helge Joa, Judith Benedics, Nanang Fakhrudin, Tina Blazevic, Angela Ladurner, Daniel Schachner, Tenzi).
Many thanks to our cooperation partners in Innsbruck (D. Steinmann, S. Schwaiger, H. Stuppner) and Vienna (E. Rozema, B. Kopp, N. Teller, D. Marko) for providing the testing extracts/compounds as well as the background information.
At this point, I would like to thank Judith Hagenhofer who tried to correct my German translation and my girlfriend Juliana Wohlmuther who corrected my German translation. Moreover, I as well want to thank them for encouraging me.
Finally, I want to thank my mother who raised my brother and me as single parent and always accompanied me and supported me all these years. Without you I would not come this far.
Vienna, September 2011