DIMETHYL PHTHALATE (DMP) DIETHYL PHTHALATE (DEP)
31
DMP DEP DBP DEHP DNOP Target concentration: 5 mg/m 3 TWA 5 mg/m 3 TWA 5 mg/m 3 TWA 5 mg/m 3 TWA 5 mg/m 3 TWA OSHA PEL: 5 mg/m 3 TWA None 5 mg/m 3 TWA 5 mg/m 3 TWA None ACGIH TLV: 5 mg/m 3 TWA 5 mg/m 3 TWA 5 mg/m 3 TWA 5 mg/m 3 TWA 10 mg/m 3 STEL None DMP DEP DBP DEHP DNOP Reliable quantitation limits: 90 μg/m 3 68 μg/m 3 34 μg/m 3 55 μg/m 3 45 μg/m 3 Standard errors of estimate: 6.8% 6.7% 5.6% 5.4% 5.5% DIMETHYL PHTHALATE (DMP) DIETHYL PHTHALATE (DEP) DIBUTYL PHTHALATE (DBP) DI-2-ETHYLHEXYL PHTHALATE (DEHP) DI-n-OCTYL PHTHALATE (DNOP) Method number: 104 Matrix: Air Procedure: Samples are collected by drawing known volumes of air through OVS-Tenax sampling tubes. Samples are desorbed with toluene and analyzed by GC using a flame ionization detector (FID). Recommended air volume and sampling rate: 240 L at 1.0 L/min Status of method: Evaluated method. This method has been subjected to the established evaluation procedures of the Organic Methods Evaluation Branch. Date: August 1994 Chemist: Yihlin Chan Organic Methods Evaluation Branch OSHA Salt Lake Technical Center Salt Lake City, UT 84165-0200 1 of 31 T-104-FV-01-9408-M
Transcript of DIMETHYL PHTHALATE (DMP) DIETHYL PHTHALATE (DEP)
DMP DEP DBP DEHP DNOP
Target concentration: 5 mg/m3
TWA5 mg/m3
TWA5 mg/m3
TWA5 mg/m3
TWA5 mg/m3
TWA
OSHA PEL: 5 mg/m3
TWANone 5 mg/m3
TWA5 mg/m3
TWANone
ACGIH TLV: 5 mg/m3
TWA5 mg/m3
TWA5 mg/m3
TWA5 mg/m3
TWA10 mg/m3
STEL
None
DMP DEP DBP DEHP DNOP
Reliable quantitation limits: 90 µg/m3 68 µg/m3 34 µg/m3 55 µg/m3 45 µg/m3
Standard errors of estimate: 6.8% 6.7% 5.6% 5.4% 5.5%
DIMETHYL PHTHALATE (DMP)DIETHYL PHTHALATE (DEP)DIBUTYL PHTHALATE (DBP)
DI-2-ETHYLHEXYL PHTHALATE (DEHP)DI-n-OCTYL PHTHALATE (DNOP)
Method number: 104
Matrix: Air
Procedure: Samples are collected by drawing known volumes of air through OVS-Tenaxsampling tubes. Samples are desorbed with toluene and analyzed by GCusing a flame ionization detector (FID).
Recommended air volumeand sampling rate: 240 L at 1.0 L/min
Status of method: Evaluated method. This method has been subjected to the establishedevaluation procedures of the Organic Methods Evaluation Branch.
Date: August 1994 Chemist: Yihlin Chan
Organic Methods Evaluation BranchOSHA Salt Lake Technical Center
Salt Lake City, UT 84165-0200
1 of 31 T-104-FV-01-9408-M
1. General Discussion
1.1 Background
1.1.1 History
Airborne phthalates have been collected in ethylene glycol (Ref. 5.1), on mixed celluloseester membrane filters (Ref. 5.2), and on Tenax GC adsorbent (Ref. 5.3). The analyticalmethods include GC/FID, GC/MS, GC/ECD, and HPLC/UV. An OSHA stopgap methodspecifies collection on OVS-2 (OSHA Versatile Sampler), desorption with carbon disulfideand analysis by GC/FID (Ref. 5.4). OVS samplers, with a glass fiber filter in front to stopdroplets and sorbent behind to adsorb vapor, are ideal for collecting contaminants thatmay be present as both aerosol and vapor. The author of the stopgap study found thatmost of the phthalates spiked on the glass fiber filters migrated to the resin bed after 60 Lof air had been drawn through them, indicating that filters alone would not be sufficient. However, XAD-2 resin used in the OVS-2 is difficult to work with. During the transfer ofthe resin from the sample tube to a vial, many resin beads cling to the glass wall and areimpossible to dislodge. For these reasons OVS-Tenax was selected for the collection ofairborne phthalates.
1.1.2 Toxic effects (This section is for information only and should not be taken as the basis ofOSHA policy.)
Dimethyl phthalate (DMP). DMP is of low to moderate toxicity, but when accidentallyingested in large amounts it may cause gastrointestinal irritation, central nervous systemdepression with coma, and hypotension. It is an irritant to the eyes and the mucousmembranes. It is not irritant to the skin and is not absorbed. DMP is not known to causecancer in humans or animals. (Ref. 5.5)
Diethyl phthalate (DEP). Adverse effects on humans from exposure to DEP have notbeen reported. DEP has caused death in animals given very high doses by mouth, butbrief oral exposures to lower doses caused no harmful effects. The only effect found inanimals that ate high doses of DEP for long periods of time was a decrease in weight gainbecause they ate less food. DEP is not known to cause cancer in humans or animals. DEP does not appear to affect the ability of male animals to sire offspring. However, adecrease occurred in the number of live offspring born to female animals that wereexposed to DEP throughout their lives. Some birth defects occurred in newborn rats whosemothers received high doses (approximately 3 g/kg) of DEP by injection during pregnancy. DEP can be mildly irritating when applied to the skin of animals. It can also be slightlyirritating when put directly into the eyes of animals. (Ref. 5.6)
Dibutyl phthalate (DBP). Adverse effects on humans from exposure to DBP have notbeen reported. In animals, eating large amounts of DBP can affect their ability toreproduce. DBP can cause death of unborn animals. In male animals, sperm productioncan decrease after eating large amounts of DBP. However, when exposure to DBP stops,sperm production seems to return to near normal levels. Exposure to high levels of DBPmight cause similar effects in humans as in animals, but this is not known. There is noevidence that DBP causes cancer, but this has not been thoroughly studied. (Ref. 5.7)
Di-2-ethylhexyl phthalate (DEHP). From animal studies, breathing DEHP does notappear to have serious harmful effects. Studies in rats have shown that DEHP in the airhas no effect on lifespan or the ability to reproduce. However, eating high doses of DEHPfor a long time resulted in liver cancer in rats and mice. The U.S. Department of Healthand Human Services has determined that DEHP may reasonably be anticipated to be acarcinogen. (Ref. 5.8) IARC designated DEHP to Group 2B (possibly carcinogenic tohumans) (Ref. 5.9). Short-term exposures to DEHP interfered with sperm formation inmice and rats. These effects were reversible, but the process of sexual maturation was
2 of 31 T-104-FV-01-9408-M
delayed when the animals were exposed before puberty. Short-term exposures appearedto have no effect on male fertility. After long-term exposures, fertility of both male andfemale rats was decreased. Studies of pregnant mice and rats exposed to DEHP resultedin effects on the development of the fetus, including malformation of fetus and reductionin neonatal weights and survival. Long-term exposure of animals to DEHP resulted instructural and functional changes in the kidney. (Ref. 5.8)
Di-n-octyl phthalate (DNOP) . DNOP may cause irritation to the skin and may causesevere irritation and possible corneal damage to the eyes. Ingestion may cause centralnervous system depression with nausea, vomiting, dizziness, weakness, headache, anddifficult respiration. A large dose is required to cause death in animals. (Ref. 5.10)
1.1.3 Workplace exposure
DMP is used as a solvent and plasticizer for cellulose acetate and cellulose acetate-butyrate formulations. During World War II it was used effectively as a mosquito and insectrepellant. Occupational exposure may occur in industrial facilities where DMP ismanufactured or used in its various applications. No data on the extent of workplaceexposure were found. (Ref. 5.5)
DEP is used as a plasticizer for cellulose ester plastic films and sheets (photographic,blister packaging, and tape applications) and molded and extruded articles (consumerarticles such as toothbrushes, automotive components, tool handles, and toys). DEP wasreported as an ingredient in 67 cosmetic formulations at concentrations ranging from<0.1% to 25-50%. These cosmetics included bath preparations (oils, tablets, and salts),eye shadows, toilet waters, perfumes and other fragrance preparations, hair sprays, wavesets, nail polish and enamel removers, nail extenders, nail polish, bath soaps, detergents,aftershave lotions, and skin care preparations. In addition, DEP is used as a componentin insecticide sprays and mosquito repellents, as a camphor substitute, as a plasticizer insolid rocket propellants, as a wetting agent, as a dye application agent, as an ingredientin aspirin coatings, as a diluent in polysulfide dental impression materials, and inadhesives, plasticizers, and surface lubricants used in food and pharmaceutical packaging. Human exposure to DEP can result from breathing contaminated air, eating foods intowhich DEP has leached from packaging materials, eating contaminated seafood, drinkingcontaminated water, or as a result of medical treatment involving the use of PVC tubing(e.g., dialysis patients). The use of DEP in consumer products, however, is likely to be theprimary source of human exposure. DEP has been detected in adipose tissue samplestaken from people (including children) nationwide. Occupational exposure may occur inindustrial facilities where DEP is used in the manufacture of plastics or consumer products. (Ref. 5.6)
DBP is used primarily as a specialty plasticizer for nitrocellulose, polyvinyl acetate, andpolyvinyl chloride. It has been used in plastisol formulations for carpet back coating andother vinyl compounds. DBP has also been used as an adjusting agent for lead chromatepigments, as a concrete additive, as an insect repellant for the impregnation of clothing, asa solvent for perfume oils, and as a stabilizer in rocket propellants. DBP is widespread inthe environment and has been identified at low levels in air, water, and soil. Therefore,humans may be exposed to DBP by inhalation of air or by ingestion of water or foodcontaining DBP. Individuals who manufacture or use specialty plasticizers would have thehighest potential for exposure to DBP. No data were located on typical exposure levels inthe workplace. (Ref. 5.7)
DEHP is principally used as a plasticizer in the production of polyvinyl chloride (PVC) andvinyl chloride resins. Estimates are that at least 95% of the DEHP produced ends up inthese uses. PVC is flexible and is used in many common items such as toys, vinylupholstery, shower curtains, adhesives, coatings, and as components of paper andpaperboard. PVC is also used to produce disposable medical examination and surgicalgloves, the flexible tubing used to administer parenteral solutions, and the tubing used in
3 of 31 T-104-FV-01-9408-M
hemodialysis treatment. Non-plasticizer uses include the use of DEHP as a solvent inerasable ink; as an acaricide in orchards; as an inert ingredient in pesticide products,cosmetics, and vacuum pump oil; as a component of dielectric fluids in electricalcapacitors; to detect leaks in respirators; and to test air filtration systems. DEHP is aubiquitous environmental contaminant. The principal route of human exposure to DEHPis ingestion of contaminated food, especially fish, seafood, or fatty foods, with an estimateddaily dose of about 0.25 mg. The highest exposures to DEHP result from medicalprocedures such as blood transfusions or hemodialysis, during which DEHP may leachfrom plastic equipment into biological fluids. Workers in industries manufacturing or usingDEHP plasticizer may be frequently exposed to above average levels of this compound. (Ref. 5.8)
DNOP is used as a plasticizer in the production of polyvinyl chloride and vinyl chlorideresins. Occupational exposure may occur in the workplace where this compound is used. No data on the extent of workplace exposure were found. (Ref. 5.10)
1.1.4 Physical properties and other descriptive information (Ref. 5.11)
Dimethyl phthalate
CAS no.: 131-11-3synonyms: 1,2-benzenedicarboxylic acid, dimethyl ester; phthalic acid, dimethyl
ester; dimethyl 1,2-benzenedicarboxylate; dimethyl o-phthalate;Avolin; DMP; Fermine; Palitinol M; Unimoll DM; RCRA U102
structural formula:
molecular wt: 194.19boiling point: 284EC melting point: 0 - 2EC appearance: colorless to pale yellow oily liquidodor: slight aromatic odorspecific gravity: 1.1905vapor pressure: less than 1.3 Pa (0.01 mmHg) at 25ECflash point: 146EC (closed-cup)solubility: soluble in benzene, alcohol, ether, chloroform; slightly soluble in
mineral oil; practically insoluble in petroleum ether and other paraffinhydrocarbons
Diethyl phthalateCAS no.: 84-66-2synonyms: diethyl 1,2-benzenedicarboxylate; ethyl phthalate; Neantine; Palatinol
A; o-benzenedicarboxylic acid diethyl ester; Placidol E; 1,2-benzenedicarboxylic acid, diethyl ester; phthalic acid, diethyl ester;
phthalol; DEP; "Kodaflex" DEPPlasticizer; RCRA U088
structural formula:
4 of 31 T-104-FV-01-9408-M
molecular wt: 222.24boiling point: 298EC melting point: !41EC appearance: colorless liquidodor: odorlessspecific gravity: 1.1175vapor pressure: 1.9 kPa (14 mmHg) at 163EC, 0.22 Pa (1.65×10⁻³ mmHg) at 25ECflash point: 140EC (open cup)solubility: soluble in alcohol, ether, acetone, benzene; moderately soluble in
aliphatic solvents
Dibutyl phthalateCAS no.: 84-74-2synonyms: phthalic acid, dibutyl ester; di-n-butyl phthalate; butyl phthalate; o-
benzenedicarboxylic acid, dibutyl ester; dibutyl 1,2-benzenedi-carboxylate; dibutyl phthalate ester; benzene-o-dicarboxylic acid, di-n-butyl ester; DBP; Celluflex DBP; Elanol; Polycizer DBP; PX 104;Staflex DBP; bis-n-butyl phthalate; n-butyl phthalate; dibutyl o-phthalate
structural formula:
molecular wt:278.35
boiling point: 340EC melting point: !35EC appearance: colorless to faint yellow oily liquidodor: weak aromatic odorspecific gravity: 1.047vapor pressure: less than 1.3 Pa (0.01 mmHg) at 20ECflash point: 157EC (closed-cup); 171EC (open cup)solubility: soluble in acetone, alcohol, ether, benzene, and other common
organic solvents
Di-(2-ethylhexyl) phthalateCAS no.: 117-81-7synonyms: bis-(2-ethylhexyl) phthalate; 1,2-benzenedicarboxylic acid, bis-(2-
ethylhexyl) ester; DEHP; octyl phthalate; ethylhexyl phthalate; Bisoflex81; phthalic acid, dioctyl ester; phthalic acid, bis-(2-ethylhexyl) ester;diethylhexyl phthalate; dioctyl phthalate; di-(ethylhexyl) phthalate; 2-ethylhexyl phthalate; Fleximel; Flexol DOP; Kodaflex DOP; Octoil;RCRA U028
structural formula:
molecular wt:390.6
5 of 31 T-104-FV-01-9408-M
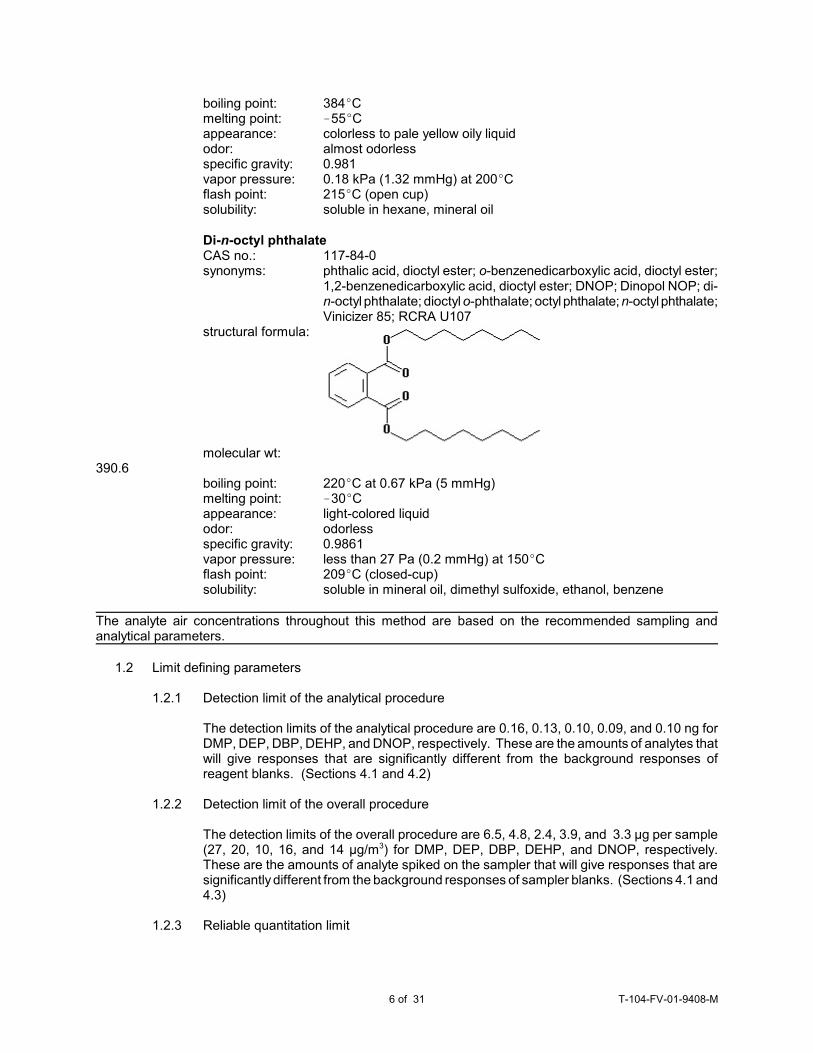
boiling point: 384EC melting point: !55EC appearance: colorless to pale yellow oily liquidodor: almost odorlessspecific gravity: 0.981vapor pressure: 0.18 kPa (1.32 mmHg) at 200ECflash point: 215EC (open cup)solubility: soluble in hexane, mineral oil
Di-n-octyl phthalateCAS no.: 117-84-0synonyms: phthalic acid, dioctyl ester; o-benzenedicarboxylic acid, dioctyl ester;
1,2-benzenedicarboxylic acid, dioctyl ester; DNOP; Dinopol NOP; di-n-octyl phthalate; dioctyl o-phthalate; octyl phthalate; n-octyl phthalate;Vinicizer 85; RCRA U107
structural formula:
molecular wt:390.6
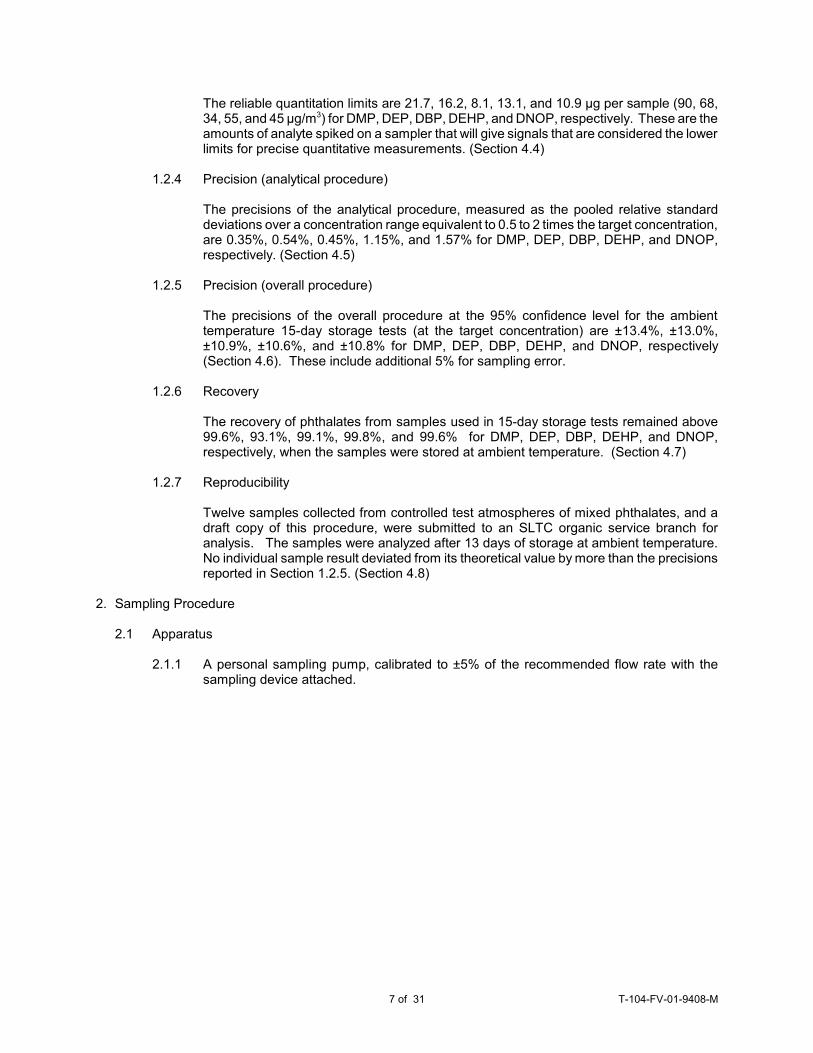
boiling point: 220EC at 0.67 kPa (5 mmHg) melting point: !30EC appearance: light-colored liquidodor: odorlessspecific gravity: 0.9861vapor pressure: less than 27 Pa (0.2 mmHg) at 150ECflash point: 209EC (closed-cup)solubility: soluble in mineral oil, dimethyl sulfoxide, ethanol, benzene
The analyte air concentrations throughout this method are based on the recommended sampling andanalytical parameters.
1.2 Limit defining parameters
1.2.1 Detection limit of the analytical procedure
The detection limits of the analytical procedure are 0.16, 0.13, 0.10, 0.09, and 0.10 ng forDMP, DEP, DBP, DEHP, and DNOP, respectively. These are the amounts of analytes thatwill give responses that are significantly different from the background responses ofreagent blanks. (Sections 4.1 and 4.2)
1.2.2 Detection limit of the overall procedure
The detection limits of the overall procedure are 6.5, 4.8, 2.4, 3.9, and 3.3 µg per sample(27, 20, 10, 16, and 14 µg/m3) for DMP, DEP, DBP, DEHP, and DNOP, respectively. These are the amounts of analyte spiked on the sampler that will give responses that aresignificantly different from the background responses of sampler blanks. (Sections 4.1 and4.3)
1.2.3 Reliable quantitation limit
6 of 31 T-104-FV-01-9408-M
The reliable quantitation limits are 21.7, 16.2, 8.1, 13.1, and 10.9 µg per sample (90, 68,34, 55, and 45 µg/m3) for DMP, DEP, DBP, DEHP, and DNOP, respectively. These are theamounts of analyte spiked on a sampler that will give signals that are considered the lowerlimits for precise quantitative measurements. (Section 4.4)
1.2.4 Precision (analytical procedure)
The precisions of the analytical procedure, measured as the pooled relative standarddeviations over a concentration range equivalent to 0.5 to 2 times the target concentration,are 0.35%, 0.54%, 0.45%, 1.15%, and 1.57% for DMP, DEP, DBP, DEHP, and DNOP,respectively. (Section 4.5)
1.2.5 Precision (overall procedure)
The precisions of the overall procedure at the 95% confidence level for the ambienttemperature 15-day storage tests (at the target concentration) are ±13.4%, ±13.0%,±10.9%, ±10.6%, and ±10.8% for DMP, DEP, DBP, DEHP, and DNOP, respectively(Section 4.6). These include additional 5% for sampling error.
1.2.6 Recovery
The recovery of phthalates from samples used in 15-day storage tests remained above99.6%, 93.1%, 99.1%, 99.8%, and 99.6% for DMP, DEP, DBP, DEHP, and DNOP,respectively, when the samples were stored at ambient temperature. (Section 4.7)
1.2.7 Reproducibility
Twelve samples collected from controlled test atmospheres of mixed phthalates, and adraft copy of this procedure, were submitted to an SLTC organic service branch foranalysis. The samples were analyzed after 13 days of storage at ambient temperature. No individual sample result deviated from its theoretical value by more than the precisionsreported in Section 1.2.5. (Section 4.8)
2. Sampling Procedure
2.1 Apparatus
2.1.1 A personal sampling pump, calibrated to ±5% of the recommended flow rate with thesampling device attached.
7 of 31 T-104-FV-01-9408-M
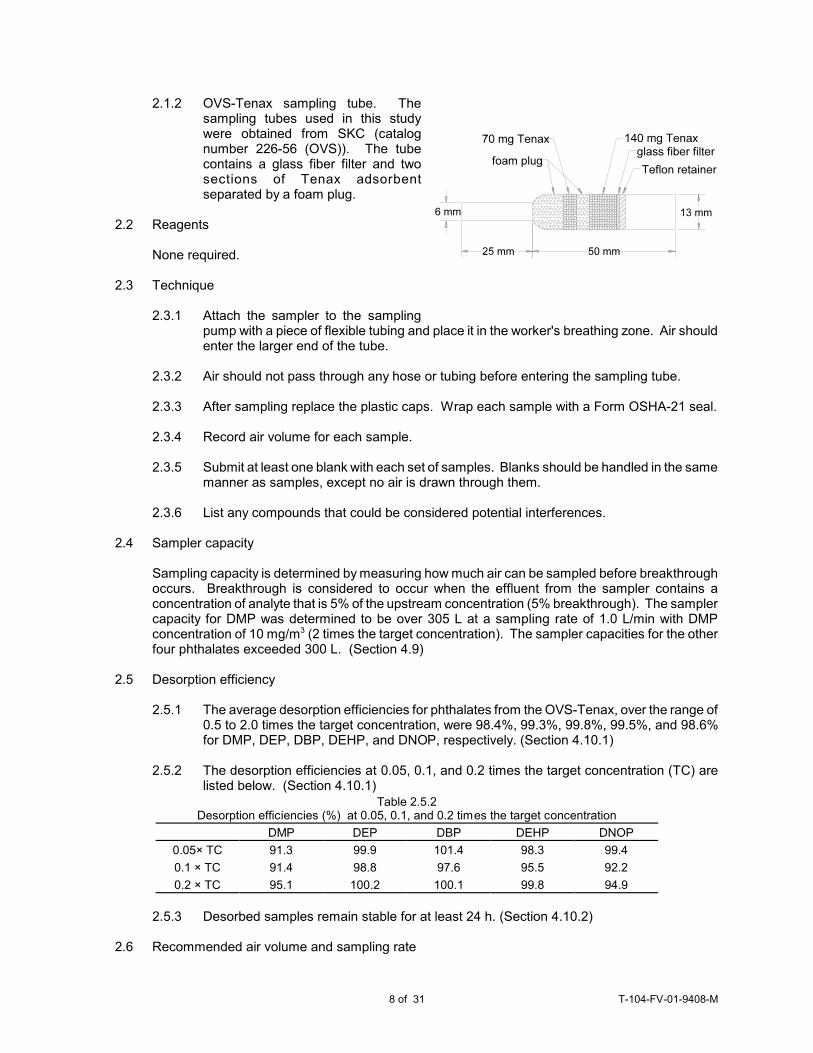
2.1.2 OVS-Tenax sampling tube. Thesampling tubes used in this studywere obtained from SKC (catalognumber 226-56 (OVS)). The tubecontains a glass fiber filter and twosections of Tenax adsorbentseparated by a foam plug.
2.2 Reagents
None required.
2.3 Technique
2.3.1 Attach the sampler to the samplingpump with a piece of flexible tubing and place it in the worker's breathing zone. Air shouldenter the larger end of the tube.
2.3.2 Air should not pass through any hose or tubing before entering the sampling tube.
2.3.3 After sampling replace the plastic caps. Wrap each sample with a Form OSHA-21 seal.
2.3.4 Record air volume for each sample.
2.3.5 Submit at least one blank with each set of samples. Blanks should be handled in the samemanner as samples, except no air is drawn through them.
2.3.6 List any compounds that could be considered potential interferences.
2.4 Sampler capacity
Sampling capacity is determined by measuring how much air can be sampled before breakthroughoccurs. Breakthrough is considered to occur when the effluent from the sampler contains aconcentration of analyte that is 5% of the upstream concentration (5% breakthrough). The samplercapacity for DMP was determined to be over 305 L at a sampling rate of 1.0 L/min with DMPconcentration of 10 mg/m3 (2 times the target concentration). The sampler capacities for the otherfour phthalates exceeded 300 L. (Section 4.9)
2.5 Desorption efficiency
2.5.1 The average desorption efficiencies for phthalates from the OVS-Tenax, over the range of0.5 to 2.0 times the target concentration, were 98.4%, 99.3%, 99.8%, 99.5%, and 98.6%for DMP, DEP, DBP, DEHP, and DNOP, respectively. (Section 4.10.1)
2.5.2 The desorption efficiencies at 0.05, 0.1, and 0.2 times the target concentration (TC) arelisted below. (Section 4.10.1)
Table 2.5.2Desorption efficiencies (%) at 0.05, 0.1, and 0.2 times the target concentration
DMP DEP DBP DEHP DNOP
0.05× TC 91.3 99.9 101.4 98.3 99.4
0.1 × TC 91.4 98.8 97.6 95.5 92.2
0.2 × TC 95.1 100.2 100.1 99.8 94.9
2.5.3 Desorbed samples remain stable for at least 24 h. (Section 4.10.2)
2.6 Recommended air volume and sampling rate
8 of 31 T-104-FV-01-9408-M
2.6.1 For TWA samples, the recommended air volume is 240 L at 1.0 L/min.
2.6.2 For STEL samples, the recommended air volume is 15 L at 1.0 L/min.
2.6.3 With short-term samples, the air concentration equivalents to the reliable quantitation limitsnecessarily become larger. For example, the reliable quantitation limit is 0.87 mg/m3 forDEHP when 15 L is collected.
2.7 Interferences (sampling)
2.7.1 Generally the presence of other organic contaminants in the air will reduce the capacity ofthe sampler to collect these phthalates.
2.7.2 Suspected interferences should be reported to the laboratory with submitted samples.
2.8 Safety precautions (sampling)
2.8.1 The sampling equipment should be attached to the worker in such a manner that it will notinterfere with work performance or safety.
2.8.2 All safety practices that apply to the work area being sampled should be followed.
3. Analytical Procedure
3.1 Apparatus
3.1.1 A GC equipped with an FID. A Hewlett-Packard 5890 GC equipped with an FID and a7673 autosampler were used in this evaluation.
3.1.2 A GC column capable of separating DMP, DEP, DBP, DEHP, DNOP, the internal standard,and any interferences. A 5-m HP-1 (0.53-mm i.d., 2.65-µm film) column was used in thisevaluation.
3.1.3 An electronic integrator or other suitable means of measuring detector response. A Waters860 Networking Computer System was used in this evaluation.
3.1.4 Glass vials, 4.5-mL, with poly(tetrafluoroethylene)-lined caps for desorbing samples. WISPvials were used in this study.
3.1.5 A dispenser capable of delivering 4.0 mL of desorbing solvent.
3.2 Reagents
3.2.1 Dimethyl phthalate. Dimethyl phthalate, 99%, was obtained from Aldrich.
3.2.2 Diethyl phthalate. Diethyl phthalate, 99%, was obtained from Kodak.
3.2.3 Dibutyl phthalate. Di-n-butyl phthalate, 99%, was obtained from Kodak.
3.2.4 Di-2-ethylhexyl phthalate. Di-2-ethylhexyl phthalate, 98%, was obtained from Aldrich.
3.2.5 Di-n-octyl phthalate. Di-n-octyl phthalate, EP grade, was obtained from Tokyo Kasei.
3.2.6 Toluene. Toluene, Optima grade, was obtained from Fisher.
3.2.7 1-Phenyldodecane. 1-Phenyldodecane, 99%, was obtained from Aldrich.
9 of 31 T-104-FV-01-9408-M
3.2.8 Desorbing solvent with internal standard. Dissolve 0.36 mL of 1-phenyldodecane in 1 L oftoluene.
3.3 Standard preparation
3.3.1 Prepare stock standards by diluting weighed amounts of phthalate in desorbing solvent.
3.3.2 Prepare analytical standards by diluting the stock standards with desorbing solvent. Foreach phthalate, a 300 µg/mL standard solution corresponds to the target concentration.
3.3.3 Prepare a sufficient number of analytical standards to generate a calibration curve. Analytical standard concentrations must bracket sample concentrations.
3.4 Sample preparation
3.4.1 Transfer the glass fiber filter, Tenax resin of the front section, and the middle foam plugto a WISP vial.
3.4.2 Transfer the Tenax resin of the back section and the back foam to another WISP vial.
3.4.3 Add 4.0 mL of the desorbing solvent to each vial.
3.4.4 Cap the vials and shake them on a mechanical shaker for 30 min.
3.5 Analysis
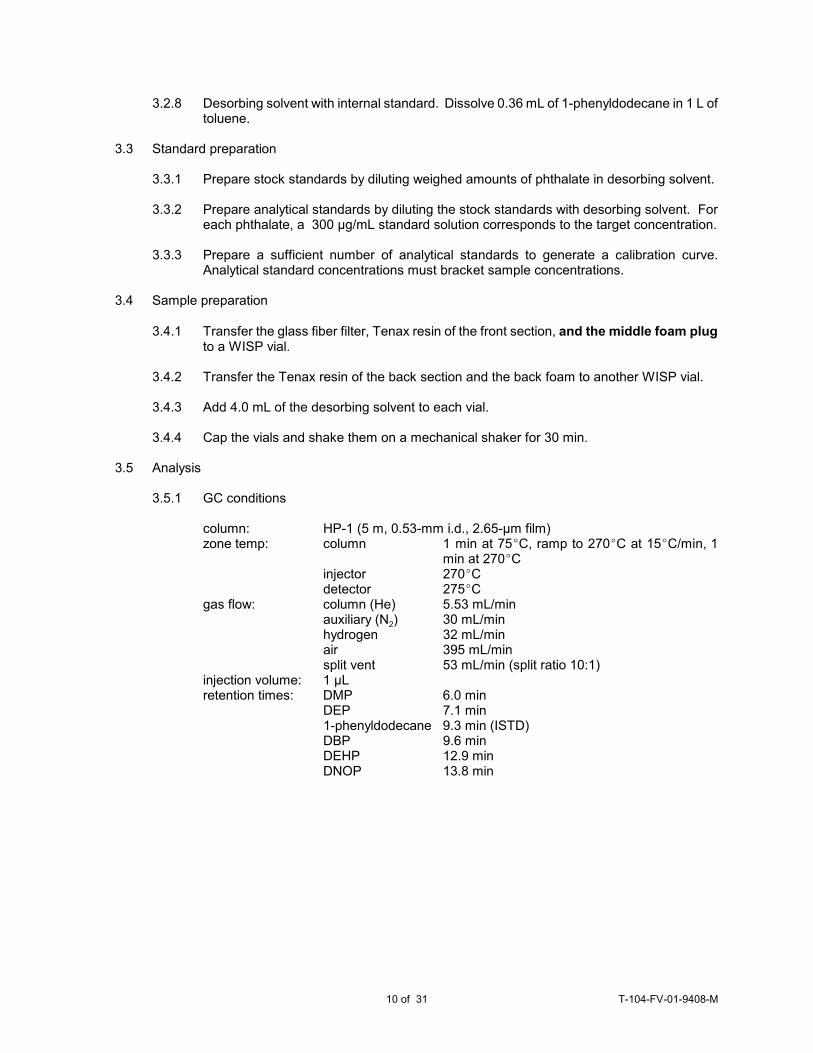
3.5.1 GC conditions
column: HP-1 (5 m, 0.53-mm i.d., 2.65-µm film)zone temp: column 1 min at 75EC, ramp to 270EC at 15EC/min, 1
min at 270ECinjector 270EC detector 275EC
gas flow: column (He) 5.53 mL/minauxiliary (N2) 30 mL/minhydrogen 32 mL/minair 395 mL/minsplit vent 53 mL/min (split ratio 10:1)
injection volume: 1 µLretention times: DMP 6.0 min
DEP 7.1 min1-phenyldodecane 9.3 min (ISTD)DBP 9.6 minDEHP 12.9 minDNOP 13.8 min
10 of 31 T-104-FV-01-9408-M
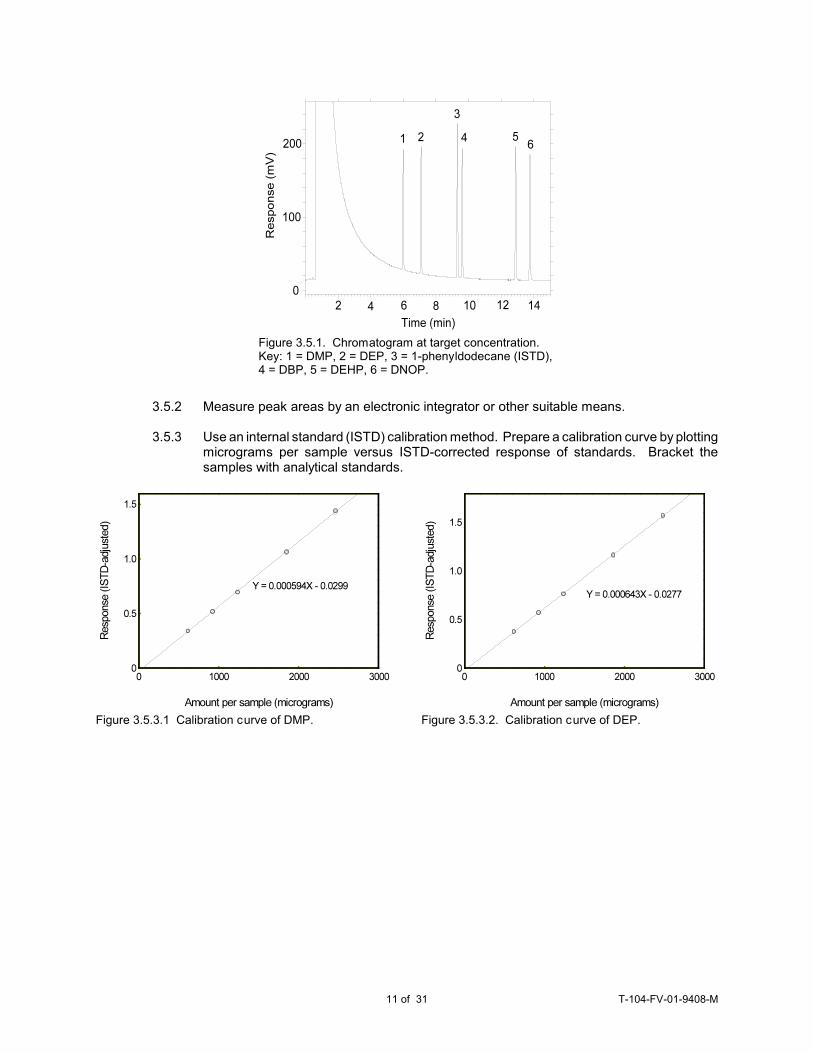
Figure 3.5.1. Chromatogram at target concentration. Key: 1 = DMP, 2 = DEP, 3 = 1-phenyldodecane (ISTD),4 = DBP, 5 = DEHP, 6 = DNOP.
Figure 3.5.3.1 Calibration curve of DMP. Figure 3.5.3.2. Calibration curve of DEP.
3.5.2 Measure peak areas by an electronic integrator or other suitable means.
3.5.3 Use an internal standard (ISTD) calibration method. Prepare a calibration curve by plottingmicrograms per sample versus ISTD-corrected response of standards. Bracket thesamples with analytical standards.
11 of 31 T-104-FV-01-9408-M
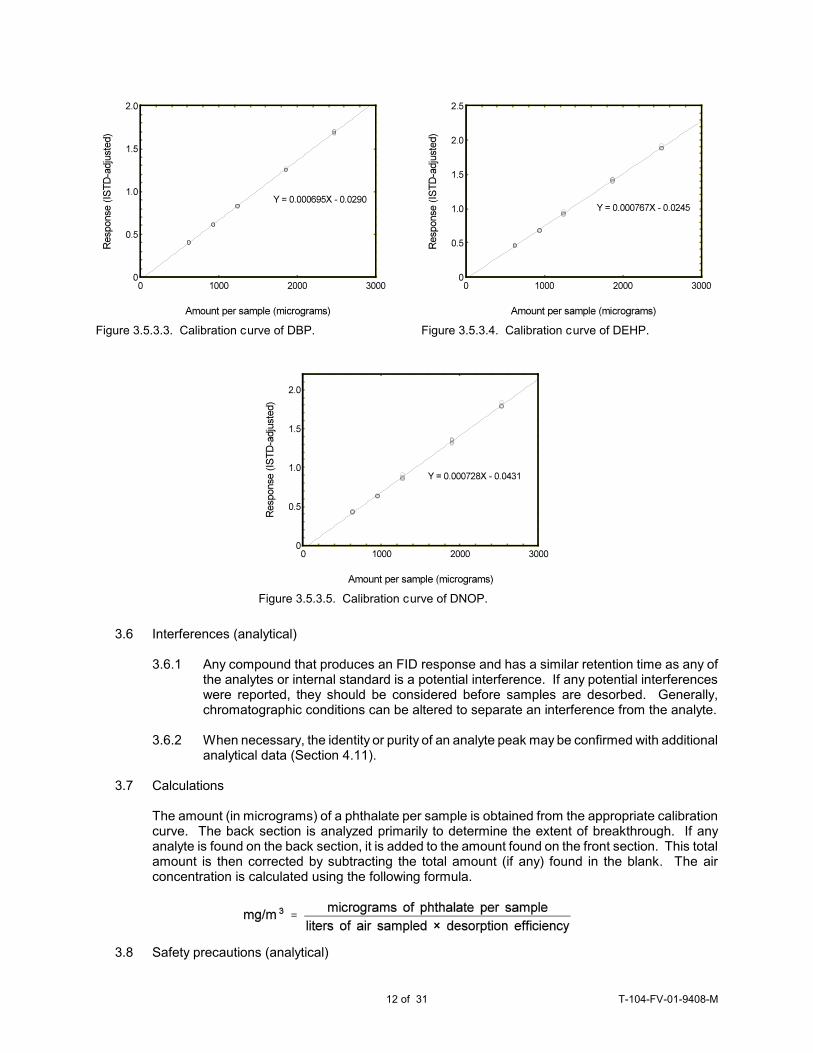
Figure 3.5.3.3. Calibration curve of DBP. Figure 3.5.3.4. Calibration curve of DEHP.
Figure 3.5.3.5. Calibration curve of DNOP.
3.6 Interferences (analytical)
3.6.1 Any compound that produces an FID response and has a similar retention time as any ofthe analytes or internal standard is a potential interference. If any potential interferenceswere reported, they should be considered before samples are desorbed. Generally,chromatographic conditions can be altered to separate an interference from the analyte.
3.6.2 When necessary, the identity or purity of an analyte peak may be confirmed with additionalanalytical data (Section 4.11).
3.7 Calculations
The amount (in micrograms) of a phthalate per sample is obtained from the appropriate calibrationcurve. The back section is analyzed primarily to determine the extent of breakthrough. If anyanalyte is found on the back section, it is added to the amount found on the front section. This totalamount is then corrected by subtracting the total amount (if any) found in the blank. The airconcentration is calculated using the following formula.
3.8 Safety precautions (analytical)
12 of 31 T-104-FV-01-9408-M
3.8.1 Adhere to the rules set down in your Chemical Hygiene Plan.
3.8.2 Avoid skin contact and inhalation of all chemicals.
3.8.3 Wear safety glasses and a lab coat at all times while in the lab area.
4. Backup Data
4.1 Determination of detection limits
Detection limits (DL), in general, are defined as the amount (or concentration) of analyte that givesa response (YDL) that is significantly different (three standard deviations (SDBR)) from thebackground response (YBR).
The direct measurement of YBR and SDBR in chromatographic methods is typically inconvenient anddifficult because YBR is usually extremely low. Estimates of these parameters can be made withdata obtained from the analysis of a series of analytical standards or samples whose responses arein the vicinity of the background response. The regression curve obtained for a plot of instrumentresponse versus concentration of analyte will usually be linear. Assuming SDBR and the precisionof data about the curve are similar, the standard error of estimate (SEE) for the regression curvecan be substituted for SDBR in the above equation. The following calculations derive a formula forDL:
Yobs = observed response Yest = estimated response from regression curve n = total no. of data points k = 2 for a linear regression curve
At point YDL on the regression curve
A = analytical sensitivity (slope)
therefore
Substituting 3(SEE) + YBR for YDL gives
4.2 Detection limit of the analytical procedure (DLAP)
The DLAP is measured as the mass of analyte actually introduced into the chromatographic column. Ten analytical standards whose concentrations were equally spaced from 0 to 12.5 µg/mL wereprepared. The standard containing 12.5 µg/mL represented approximately 10 times the baselinenoise for all analytes. These solutions were analyzed with the recommended analytical parameters(1 µL injection with 10:1 split). The data obtained were used to determine the required parameters(A and SEE) for the calculation of the DLAP. These parameters and the calculated DLAP's for thefive phthalates are listed below.
13 of 31 T-104-FV-01-9408-M
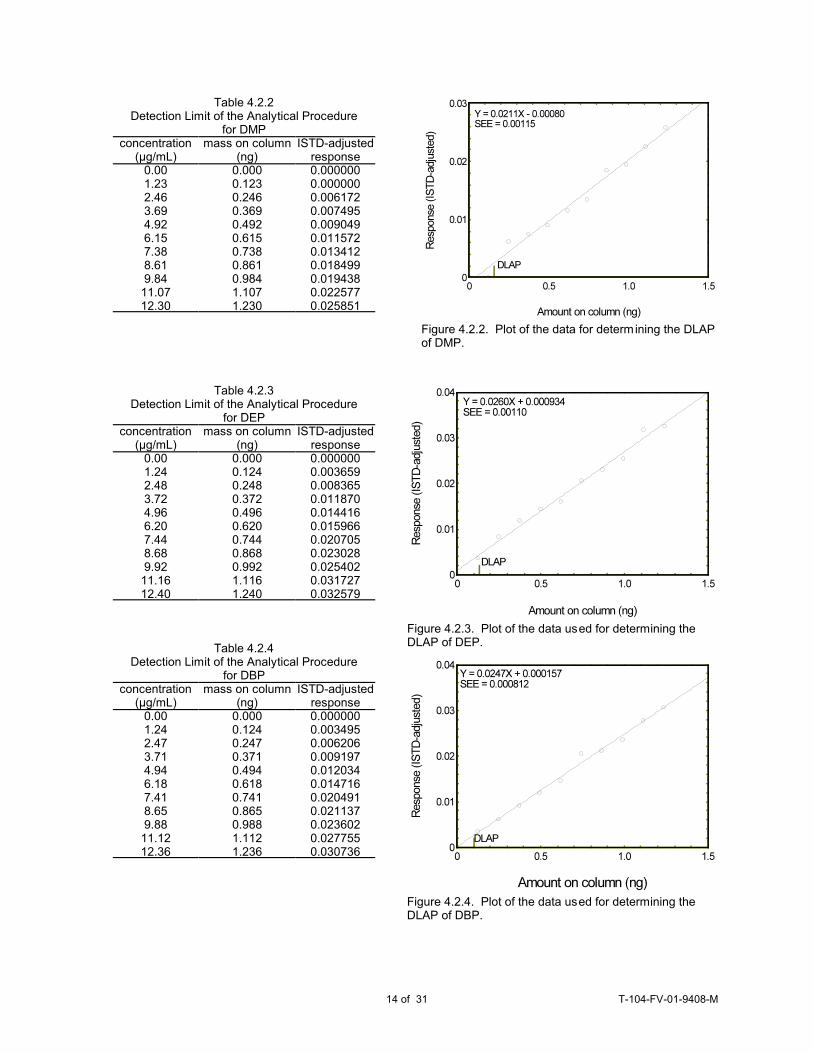
Table 4.2.2Detection Limit of the Analytical Procedure
for DMPconcentration
(µg/mL)mass on column
(ng)ISTD-adjusted
response0.001.232.463.694.926.157.388.619.84
11.0712.30
0.0000.1230.2460.3690.4920.6150.7380.8610.9841.1071.230
0.0000000.0000000.0061720.0074950.0090490.0115720.0134120.0184990.0194380.0225770.025851
Figure 4.2.2. Plot of the data for determining the DLAPof DMP.
Table 4.2.3Detection Limit of the Analytical Procedure
for DEPconcentration
(µg/mL)mass on column
(ng)ISTD-adjusted
response0.001.242.483.724.966.207.448.689.92
11.1612.40
0.0000.1240.2480.3720.4960.6200.7440.8680.9921.1161.240
0.0000000.0036590.0083650.0118700.0144160.0159660.0207050.0230280.0254020.0317270.032579
Figure 4.2.3. Plot of the data used for determining theDLAP of DEP.
Table 4.2.4Detection Limit of the Analytical Procedure
for DBPconcentration
(µg/mL)mass on column
(ng)ISTD-adjusted
response0.001.242.473.714.946.187.418.659.88
11.1212.36
0.0000.1240.2470.3710.4940.6180.7410.8650.9881.1121.236
0.0000000.0034950.0062060.0091970.0120340.0147160.0204910.0211370.0236020.0277550.030736
Figure 4.2.4. Plot of the data used for determining the DLAP of DBP.
14 of 31 T-104-FV-01-9408-M
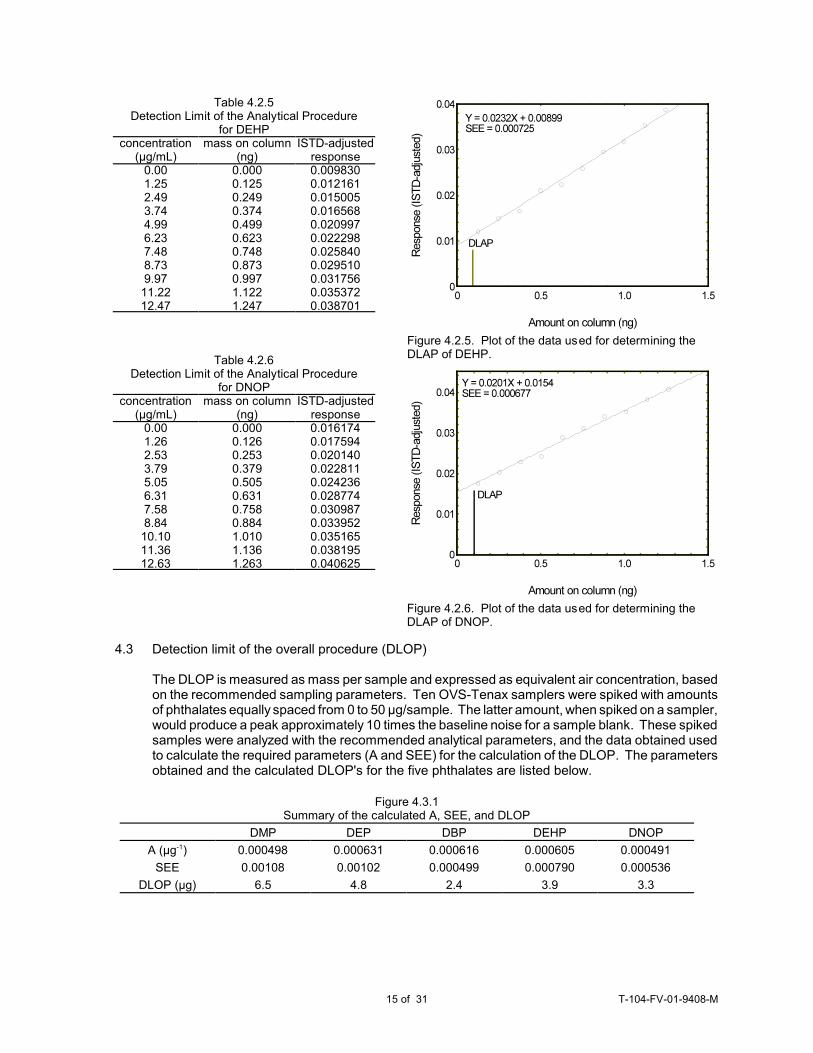
Table 4.2.5Detection Limit of the Analytical Procedure
for DEHPconcentration
(µg/mL)mass on column
(ng)ISTD-adjusted
response0.001.252.493.744.996.237.488.739.97
11.2212.47
0.0000.1250.2490.3740.4990.6230.7480.8730.9971.1221.247
0.0098300.0121610.0150050.0165680.0209970.0222980.0258400.0295100.0317560.0353720.038701
Figure 4.2.5. Plot of the data used for determining theDLAP of DEHP.
Table 4.2.6Detection Limit of the Analytical Procedure
for DNOPconcentration
(µg/mL)mass on column
(ng)ISTD-adjusted
response0.001.262.533.795.056.317.588.84
10.1011.3612.63
0.0000.1260.2530.3790.5050.6310.7580.8841.0101.1361.263
0.0161740.0175940.0201400.0228110.0242360.0287740.0309870.0339520.0351650.0381950.040625
Figure 4.2.6. Plot of the data used for determining theDLAP of DNOP.
Figure 4.3.1Summary of the calculated A, SEE, and DLOP
DMP DEP DBP DEHP DNOP
A (µg-1) 0.000498 0.000631 0.000616 0.000605 0.000491
SEE 0.00108 0.00102 0.000499 0.000790 0.000536
DLOP (µg) 6.5 4.8 2.4 3.9 3.3
4.3 Detection limit of the overall procedure (DLOP)
The DLOP is measured as mass per sample and expressed as equivalent air concentration, basedon the recommended sampling parameters. Ten OVS-Tenax samplers were spiked with amountsof phthalates equally spaced from 0 to 50 µg/sample. The latter amount, when spiked on a sampler,would produce a peak approximately 10 times the baseline noise for a sample blank. These spikedsamples were analyzed with the recommended analytical parameters, and the data obtained usedto calculate the required parameters (A and SEE) for the calculation of the DLOP. The parametersobtained and the calculated DLOP's for the five phthalates are listed below.
15 of 31 T-104-FV-01-9408-M
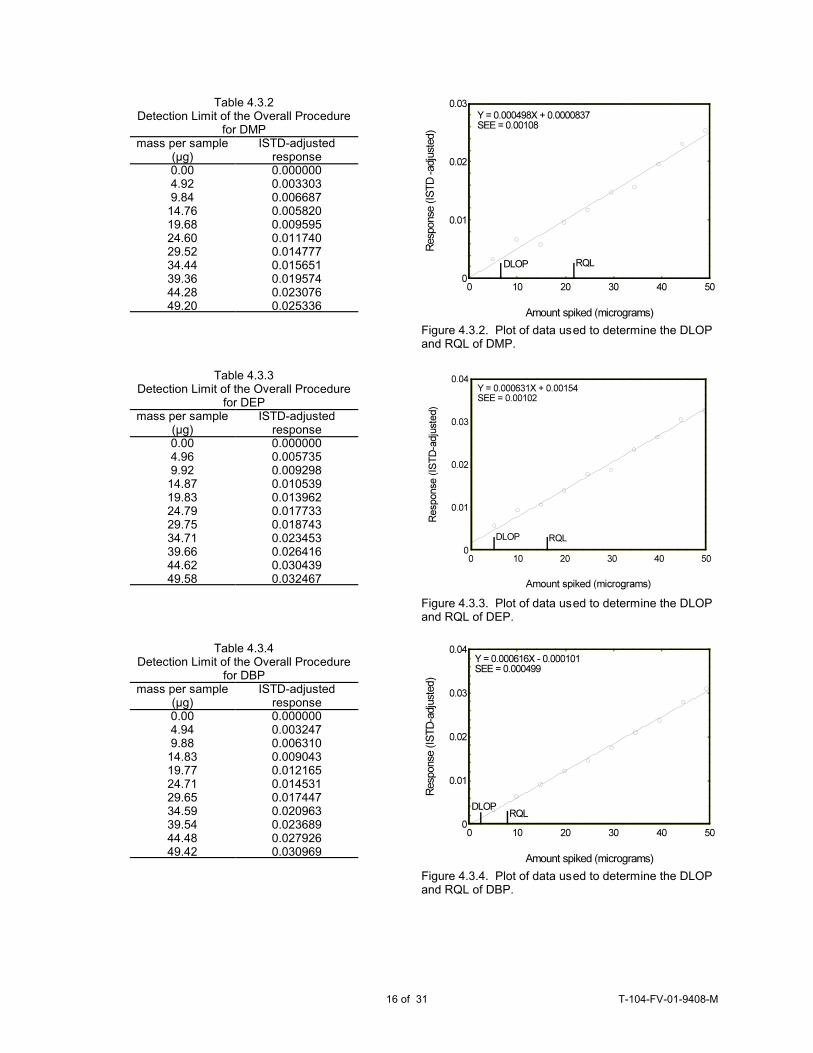
Table 4.3.2Detection Limit of the Overall Procedure
for DMPmass per sample
(µg)ISTD-adjusted
response0.004.929.84
14.7619.6824.6029.5234.4439.3644.2849.20
0.0000000.0033030.0066870.0058200.0095950.0117400.0147770.0156510.0195740.0230760.025336
Figure 4.3.2. Plot of data used to determine the DLOPand RQL of DMP.
Table 4.3.3Detection Limit of the Overall Procedure
for DEPmass per sample
(µg)ISTD-adjusted
response0.004.969.92
14.8719.8324.7929.7534.7139.6644.6249.58
0.0000000.0057350.0092980.0105390.0139620.0177330.0187430.0234530.0264160.0304390.032467
Figure 4.3.3. Plot of data used to determine the DLOPand RQL of DEP.
Table 4.3.4Detection Limit of the Overall Procedure
for DBPmass per sample
(µg)ISTD-adjusted
response0.004.949.88
14.8319.7724.7129.6534.5939.5444.4849.42
0.0000000.0032470.0063100.0090430.0121650.0145310.0174470.0209630.0236890.0279260.030969
Figure 4.3.4. Plot of data used to determine the DLOPand RQL of DBP.
16 of 31 T-104-FV-01-9408-M
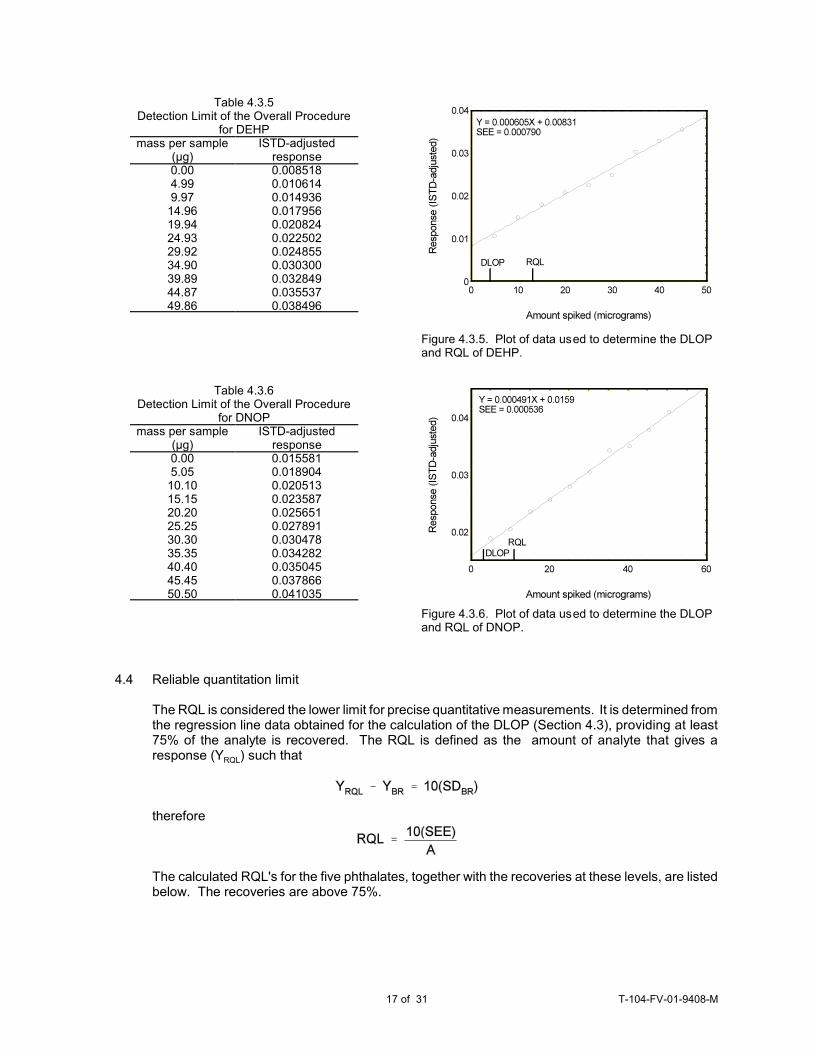
Table 4.3.5Detection Limit of the Overall Procedure
for DEHPmass per sample
(µg)ISTD-adjusted
response0.004.999.97
14.9619.9424.9329.9234.9039.8944.8749.86
0.0085180.0106140.0149360.0179560.0208240.0225020.0248550.0303000.0328490.0355370.038496
Figure 4.3.5. Plot of data used to determine the DLOPand RQL of DEHP.
Table 4.3.6Detection Limit of the Overall Procedure
for DNOPmass per sample
(µg)ISTD-adjusted
response0.005.05
10.1015.1520.2025.2530.3035.3540.4045.4550.50
0.0155810.0189040.0205130.0235870.0256510.0278910.0304780.0342820.0350450.0378660.041035
Figure 4.3.6. Plot of data used to determine the DLOPand RQL of DNOP.
4.4 Reliable quantitation limit
The RQL is considered the lower limit for precise quantitative measurements. It is determined fromthe regression line data obtained for the calculation of the DLOP (Section 4.3), providing at least75% of the analyte is recovered. The RQL is defined as the amount of analyte that gives aresponse (YRQL) such that
therefore
The calculated RQL's for the five phthalates, together with the recoveries at these levels, are listedbelow. The recoveries are above 75%.
17 of 31 T-104-FV-01-9408-M
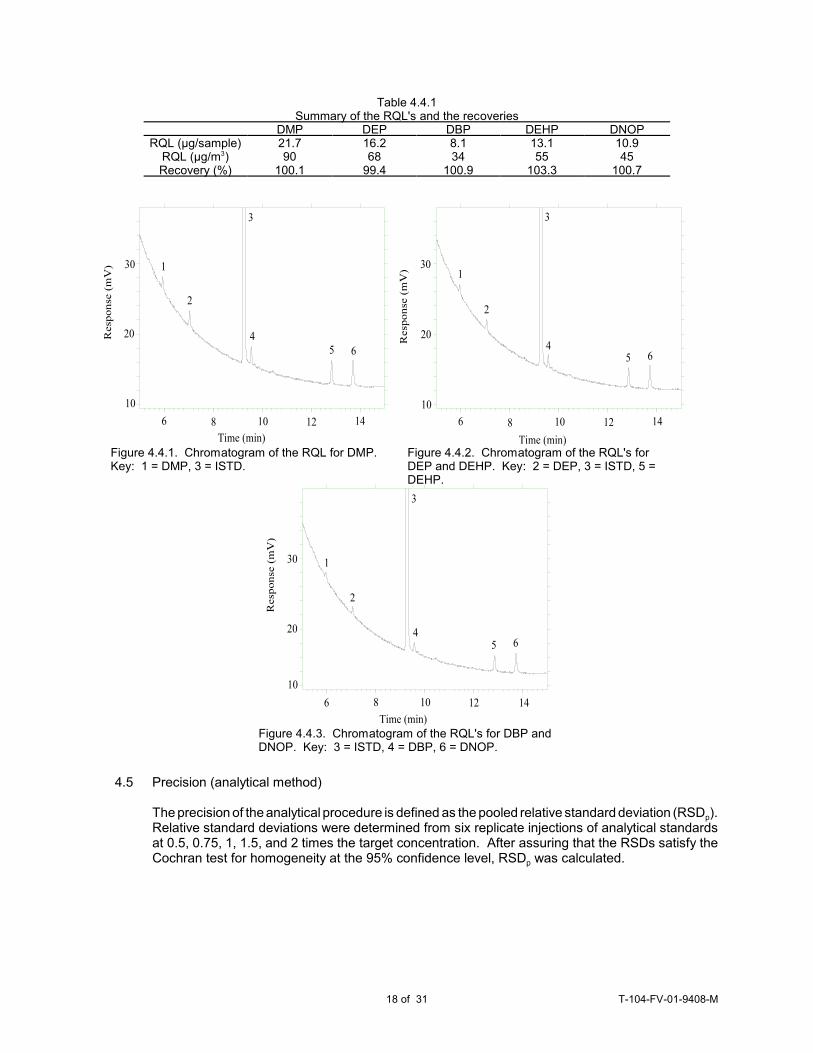
Figure 4.4.3. Chromatogram of the RQL's for DBP andDNOP. Key: 3 = ISTD, 4 = DBP, 6 = DNOP.
Table 4.4.1Summary of the RQL's and the recoveries
DMP DEP DBP DEHP DNOPRQL (µg/sample) 21.7 16.2 8.1 13.1 10.9
RQL (µg/m3) 90 68 34 55 45Recovery (%) 100.1 99.4 100.9 103.3 100.7
Figure 4.4.1. Chromatogram of the RQL for DMP. Key: 1 = DMP, 3 = ISTD.
Figure 4.4.2. Chromatogram of the RQL's forDEP and DEHP. Key: 2 = DEP, 3 = ISTD, 5 =DEHP.
4.5 Precision (analytical method)
The precision of the analytical procedure is defined as the pooled relative standard deviation (RSDp). Relative standard deviations were determined from six replicate injections of analytical standardsat 0.5, 0.75, 1, 1.5, and 2 times the target concentration. After assuring that the RSDs satisfy theCochran test for homogeneity at the 95% confidence level, RSDp was calculated.
18 of 31 T-104-FV-01-9408-M
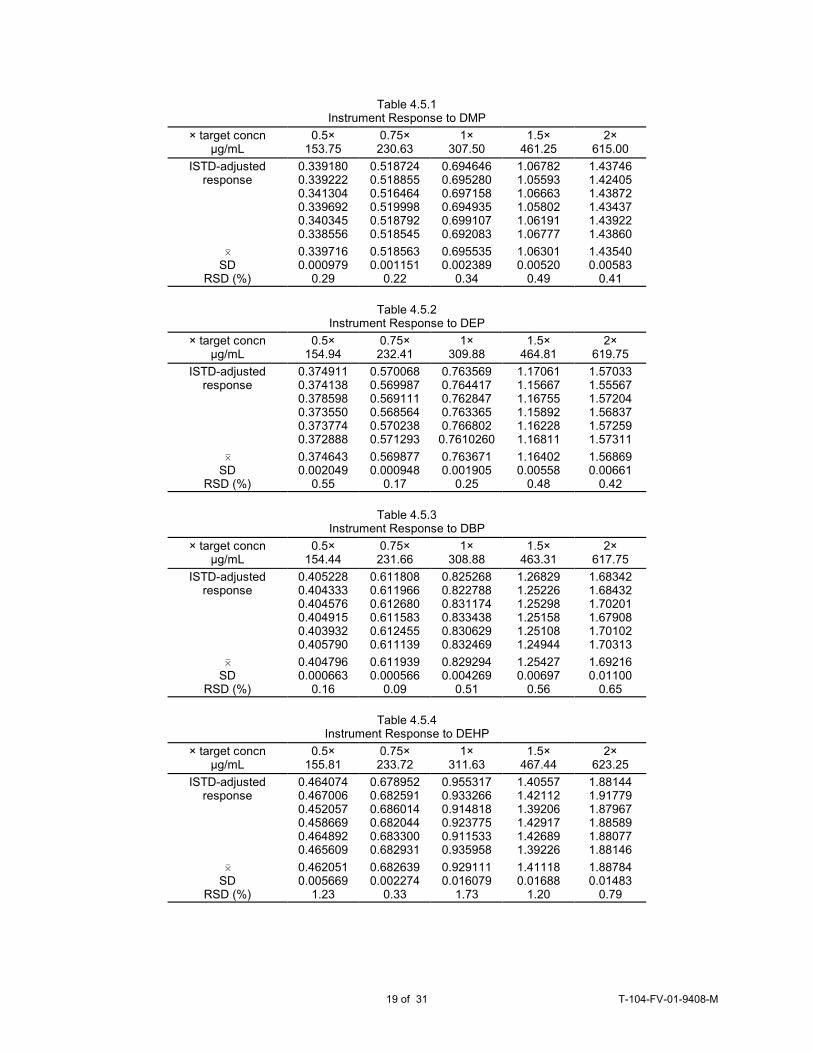
Table 4.5.1Instrument Response to DMP
× target concnµg/mL
0.5×153.75
0.75×230.63
1×307.50
1.5×461.25
2×615.00
ISTD-adjustedresponse
0.3391800.3392220.3413040.3396920.3403450.338556
0.5187240.5188550.5164640.5199980.5187920.518545
0.6946460.6952800.6971580.6949350.6991070.692083
1.067821.055931.066631.058021.061911.06777
1.437461.424051.438721.434371.439221.43860
0
SDRSD (%)
0.3397160.000979
0.29
0.5185630.001151
0.22
0.6955350.002389
0.34
1.063010.00520
0.49
1.435400.00583
0.41
Table 4.5.2Instrument Response to DEP
× target concnµg/mL
0.5×154.94
0.75×232.41
1×309.88
1.5×464.81
2×619.75
ISTD-adjustedresponse
0.3749110.3741380.3785980.3735500.3737740.372888
0.5700680.5699870.5691110.5685640.5702380.571293
0.7635690.7644170.7628470.7633650.766802
0.7610260
1.170611.156671.167551.158921.162281.16811
1.570331.555671.572041.568371.572591.57311
0
SDRSD (%)
0.3746430.002049
0.55
0.5698770.000948
0.17
0.7636710.001905
0.25
1.164020.00558
0.48
1.568690.00661
0.42
Table 4.5.3Instrument Response to DBP
× target concnµg/mL
0.5×154.44
0.75×231.66
1×308.88
1.5×463.31
2×617.75
ISTD-adjustedresponse
0.4052280.4043330.4045760.4049150.4039320.405790
0.6118080.6119660.6126800.6115830.6124550.611139
0.8252680.8227880.8311740.8334380.8306290.832469
1.268291.252261.252981.251581.251081.24944
1.683421.684321.702011.679081.701021.70313
0
SDRSD (%)
0.4047960.000663
0.16
0.6119390.000566
0.09
0.8292940.004269
0.51
1.254270.00697
0.56
1.692160.01100
0.65
Table 4.5.4Instrument Response to DEHP
× target concnµg/mL
0.5×155.81
0.75×233.72
1×311.63
1.5×467.44
2×623.25
ISTD-adjustedresponse
0.4640740.4670060.4520570.4586690.4648920.465609
0.6789520.6825910.6860140.6820440.6833000.682931
0.9553170.9332660.9148180.9237750.9115330.935958
1.405571.421121.392061.429171.426891.39226
1.881441.917791.879671.885891.880771.88146
0
SDRSD (%)
0.4620510.005669
1.23
0.6826390.002274
0.33
0.9291110.016079
1.73
1.411180.01688
1.20
1.887840.01483
0.79
19 of 31 T-104-FV-01-9408-M
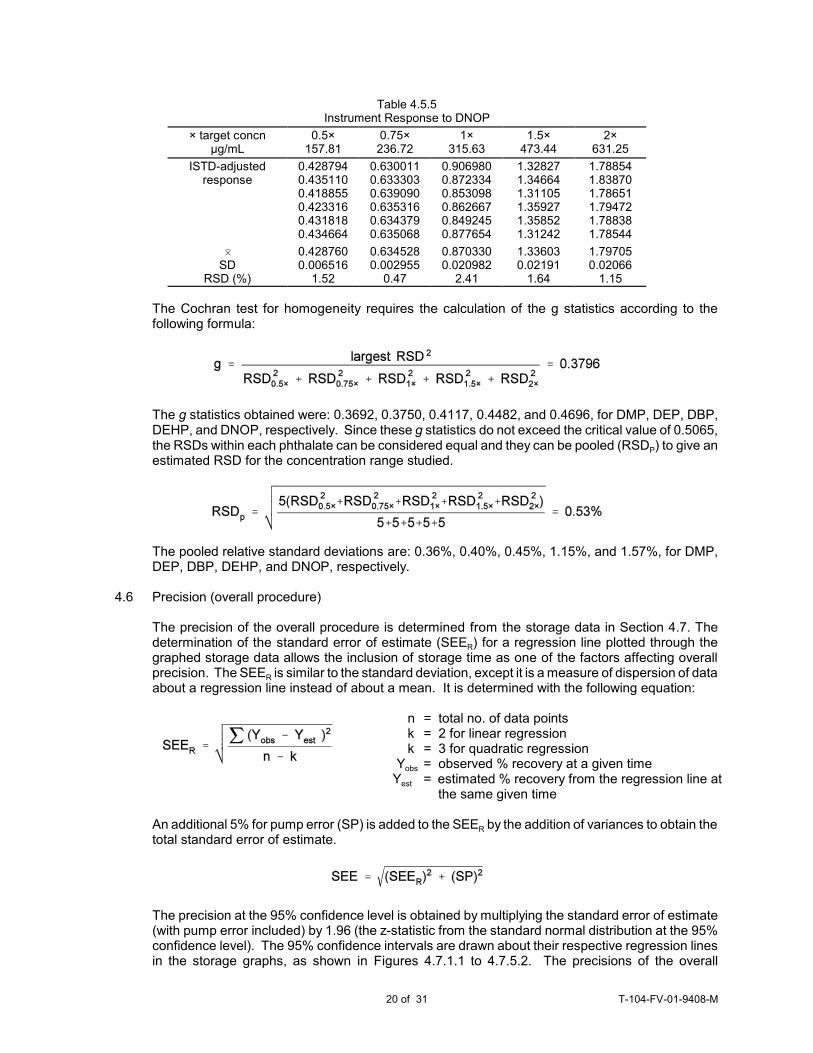
Table 4.5.5Instrument Response to DNOP
× target concnµg/mL
0.5×157.81
0.75×236.72
1×315.63
1.5×473.44
2×631.25
ISTD-adjustedresponse
0.4287940.4351100.4188550.4233160.4318180.434664
0.6300110.6333030.6390900.6353160.6343790.635068
0.9069800.8723340.8530980.8626670.8492450.877654
1.328271.346641.311051.359271.358521.31242
1.788541.838701.786511.794721.788381.78544
0
SDRSD (%)
0.4287600.006516
1.52
0.6345280.002955
0.47
0.8703300.020982
2.41
1.336030.02191
1.64
1.797050.02066
1.15
The Cochran test for homogeneity requires the calculation of the g statistics according to thefollowing formula:
The g statistics obtained were: 0.3692, 0.3750, 0.4117, 0.4482, and 0.4696, for DMP, DEP, DBP,DEHP, and DNOP, respectively. Since these g statistics do not exceed the critical value of 0.5065,the RSDs within each phthalate can be considered equal and they can be pooled (RSDP) to give anestimated RSD for the concentration range studied.
The pooled relative standard deviations are: 0.36%, 0.40%, 0.45%, 1.15%, and 1.57%, for DMP,DEP, DBP, DEHP, and DNOP, respectively.
4.6 Precision (overall procedure)
The precision of the overall procedure is determined from the storage data in Section 4.7. Thedetermination of the standard error of estimate (SEER) for a regression line plotted through thegraphed storage data allows the inclusion of storage time as one of the factors affecting overallprecision. The SEER is similar to the standard deviation, except it is a measure of dispersion of dataabout a regression line instead of about a mean. It is determined with the following equation:
n = total no. of data points k = 2 for linear regression k = 3 for quadratic regression Yobs = observed % recovery at a given time Yest = estimated % recovery from the regression line at
the same given time
An additional 5% for pump error (SP) is added to the SEER by the addition of variances to obtain thetotal standard error of estimate.
The precision at the 95% confidence level is obtained by multiplying the standard error of estimate(with pump error included) by 1.96 (the z-statistic from the standard normal distribution at the 95%confidence level). The 95% confidence intervals are drawn about their respective regression linesin the storage graphs, as shown in Figures 4.7.1.1 to 4.7.5.2. The precisions of the overall
20 of 31 T-104-FV-01-9408-M
Figure 4.7.1.1. Ambient storage test for DMP. Figure 4.7.1.2. Refrigerated storage test for DMP.
procedure are ±13.4%, ±13.0%, ±10.9%, ±10.6%, and ±10.8% for DMP, DEP, DBP, DEHP, andDNOP, respectively.
4.7 Storage test
Storage tests were conducted in three batches: DMP, DEP/DNOP, and DBP/DEHP. Storagesamples were prepared from the controlled test atmospheres of the appropriate phthalate orphthalate mixtures. Thirty-six samples were collected. Six samples were analyzed on the day ofpreparation. The rest of the samples were divided into two groups: 15 were stored at 5EC, and theother 15 were stored at ambient temperature (about 22EC) in a closed drawer. At 1-4 day intervals,three samples were selected from each of the two storage sets and analyzed.
Table 4.7.1Storage Test for DMP
time (days) percent recovery(ambient)
percent recovery(refrigerated)
001581215
104.599.597.698.097.798.6108.5
98.3100.097.4105.295.7102.4101.3
106.191.6105.2104.5106.2104.1113.0
104.599.598.196.988.597.997.9
98.3100.0104.395.4104.589.7112.4
106.191.6104.6104.1107.097.2110.5
Table 4.7.2Storage Test for DEP
time (days) percent recovery(ambient)
percent recovery(refrigerated)
003691315
97.6104.594.692.989.190.692.1
94.6104.993.9100.291.094.391.2
95.7102.7102.793.598.199.6100.3
97.6104.590.591.986.892.693.2
94.6104.9101.394.698.790.9104.5
95.7102.7102.2104.499.2100.7105.3
21 of 31 T-104-FV-01-9408-M
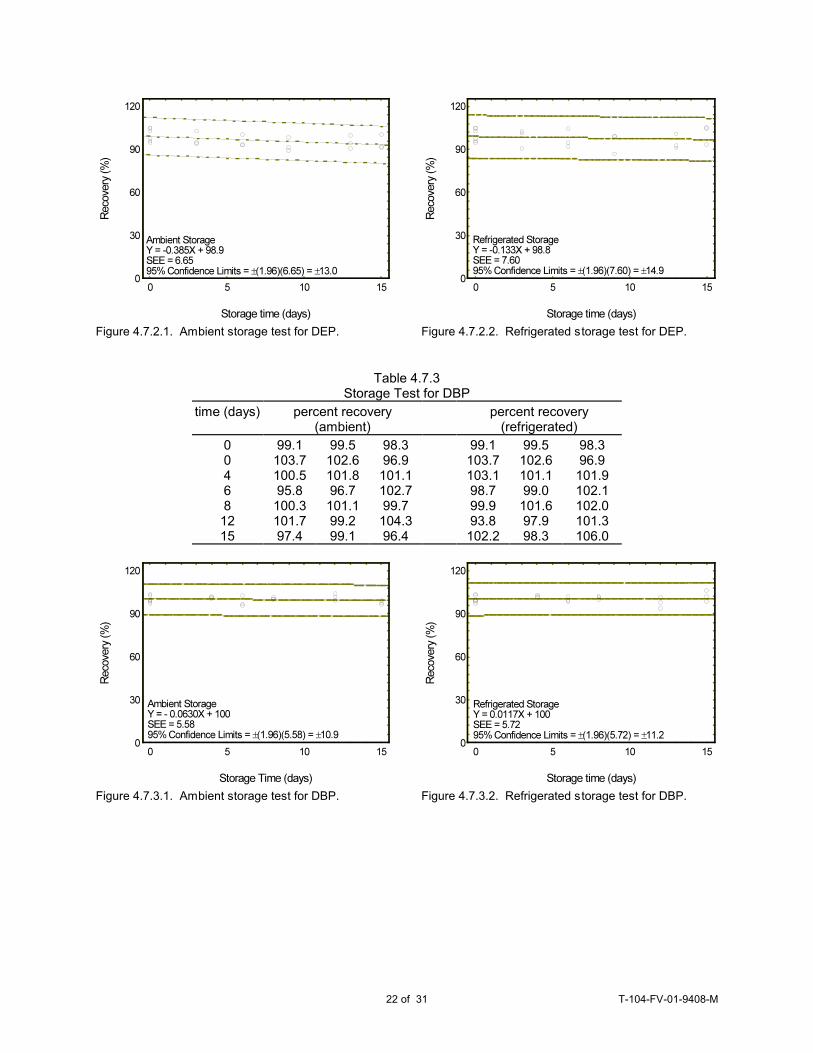
Figure 4.7.2.1. Ambient storage test for DEP. Figure 4.7.2.2. Refrigerated storage test for DEP.
Figure 4.7.3.1. Ambient storage test for DBP. Figure 4.7.3.2. Refrigerated storage test for DBP.
Table 4.7.3Storage Test for DBP
time (days) percent recovery(ambient)
percent recovery(refrigerated)
004681215
99.1103.7100.595.8100.3101.797.4
99.5102.6101.896.7101.199.299.1
98.396.9101.1102.799.7104.396.4
99.1103.7103.198.799.993.8102.2
99.5102.6101.199.0101.697.998.3
98.396.9101.9102.1102.0101.3106.0
22 of 31 T-104-FV-01-9408-M
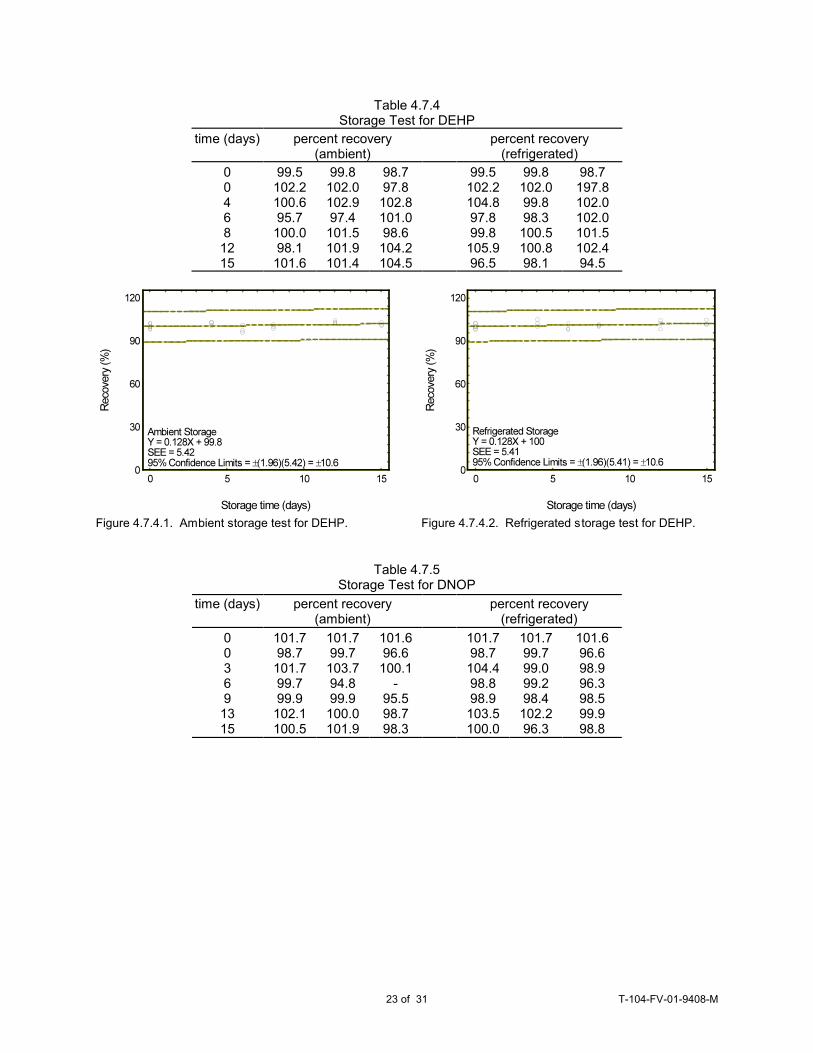
Figure 4.7.4.1. Ambient storage test for DEHP. Figure 4.7.4.2. Refrigerated storage test for DEHP.
Table 4.7.4Storage Test for DEHP
time (days) percent recovery(ambient)
percent recovery(refrigerated)
004681215
99.5102.2100.695.7100.098.1101.6
99.8102.0102.997.4101.5101.9101.4
98.797.8102.8101.098.6104.2104.5
99.5102.2104.897.899.8105.996.5
99.8102.099.898.3100.5100.898.1
98.7197.8102.0102.0101.5102.494.5
Table 4.7.5Storage Test for DNOP
time (days) percent recovery(ambient)
percent recovery(refrigerated)
003691315
101.798.7101.799.799.9102.1100.5
101.799.7103.794.899.9100.0101.9
101.696.6100.1
-95.598.798.3
101.798.7104.498.898.9103.5100.0
101.799.799.099.298.4102.296.3
101.696.698.996.398.599.998.8
23 of 31 T-104-FV-01-9408-M
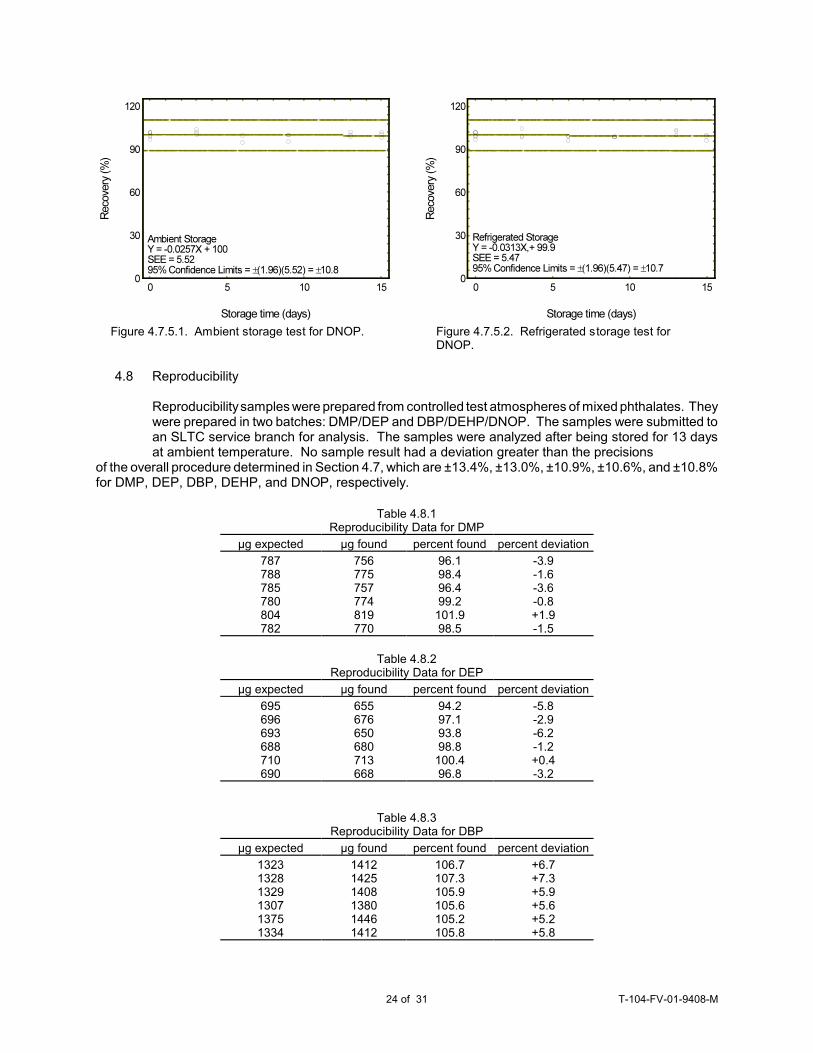
Figure 4.7.5.1. Ambient storage test for DNOP. Figure 4.7.5.2. Refrigerated storage test forDNOP.
4.8 Reproducibility
Reproducibility samples were prepared from controlled test atmospheres of mixed phthalates. Theywere prepared in two batches: DMP/DEP and DBP/DEHP/DNOP. The samples were submitted toan SLTC service branch for analysis. The samples were analyzed after being stored for 13 daysat ambient temperature. No sample result had a deviation greater than the precisions
of the overall procedure determined in Section 4.7, which are ±13.4%, ±13.0%, ±10.9%, ±10.6%, and ±10.8%for DMP, DEP, DBP, DEHP, and DNOP, respectively.
Table 4.8.1Reproducibility Data for DMP
µg expected µg found percent found percent deviation
787788785780804782
756775757774819770
96.198.496.499.2
101.998.5
-3.9-1.6-3.6-0.8+1.9-1.5
Table 4.8.2Reproducibility Data for DEP
µg expected µg found percent found percent deviation
695696693688710690
655676650680713668
94.297.193.898.8
100.496.8
-5.8-2.9-6.2-1.2+0.4-3.2
Table 4.8.3Reproducibility Data for DBP
µg expected µg found percent found percent deviation
132313281329130713751334
141214251408138014461412
106.7107.3105.9105.6105.2105.8
+6.7+7.3+5.9+5.6+5.2+5.8
24 of 31 T-104-FV-01-9408-M
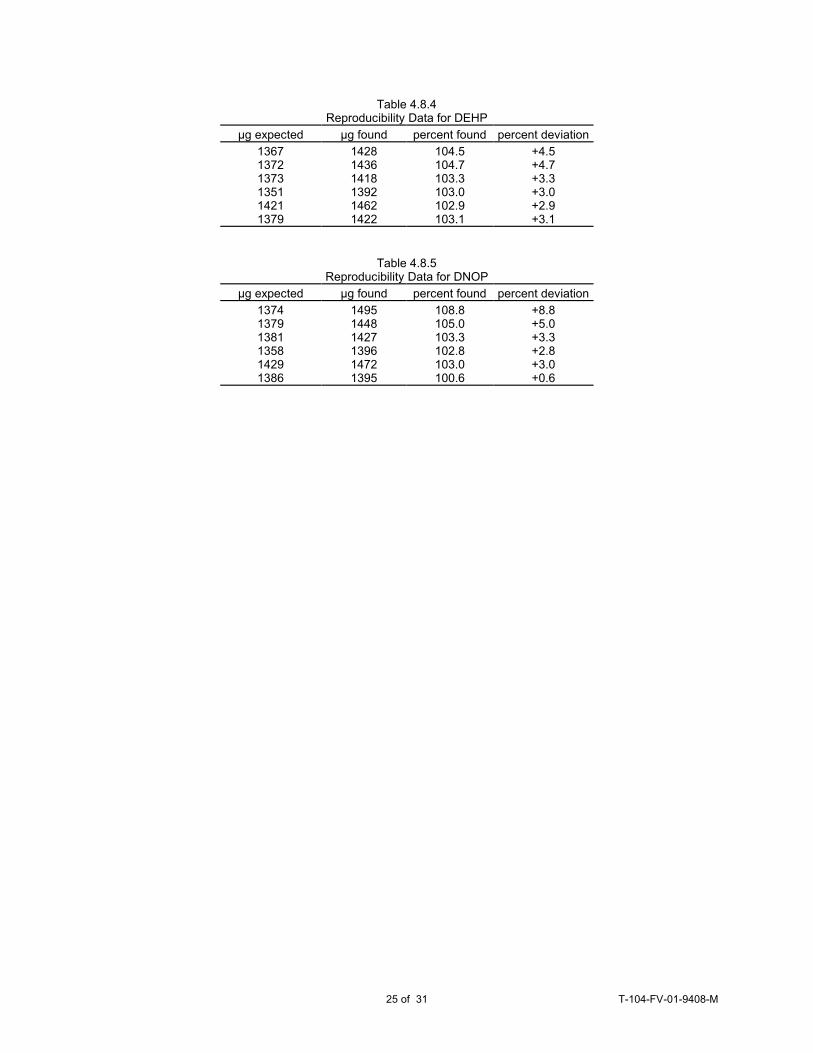
Table 4.8.4Reproducibility Data for DEHP
µg expected µg found percent found percent deviation
136713721373135114211379
142814361418139214621422
104.5104.7103.3103.0102.9103.1
+4.5+4.7+3.3+3.0+2.9+3.1
Table 4.8.5Reproducibility Data for DNOP
µg expected µg found percent found percent deviation
137413791381135814291386
149514481427139614721395
108.8105.0103.3102.8103.0100.6
+8.8+5.0+3.3+2.8+3.0+0.6
25 of 31 T-104-FV-01-9408-M
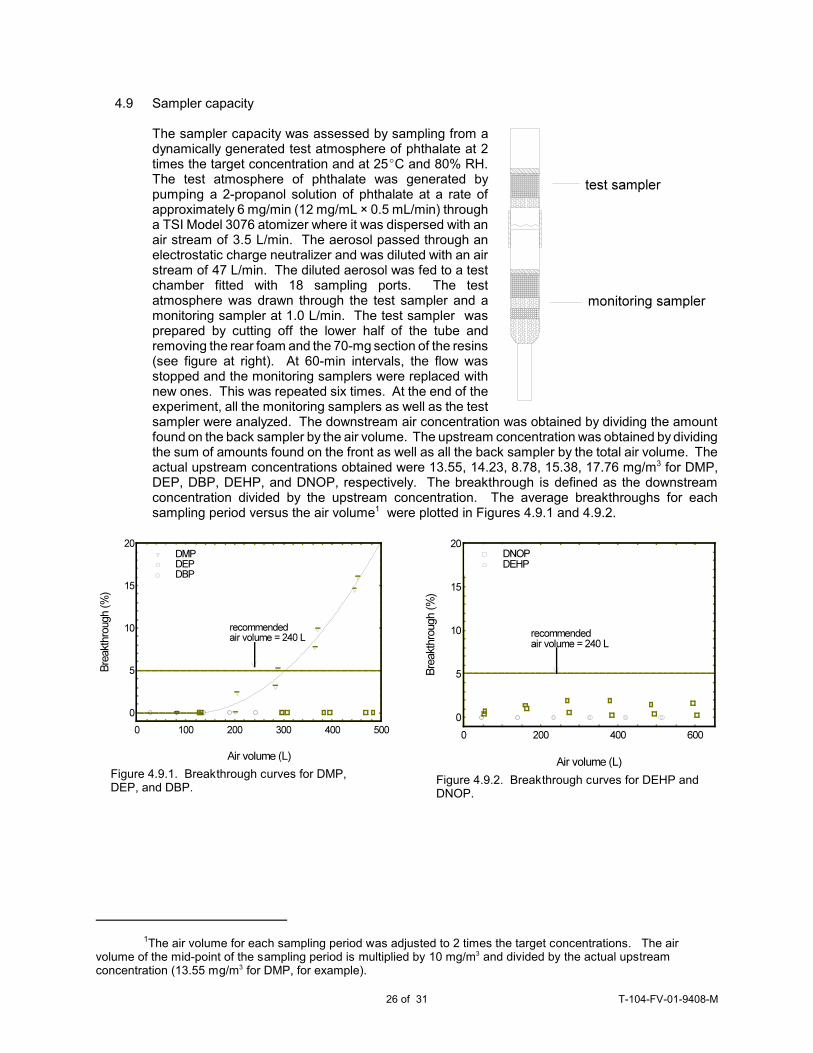
Figure 4.9.1. Breakthrough curves for DMP,DEP, and DBP.
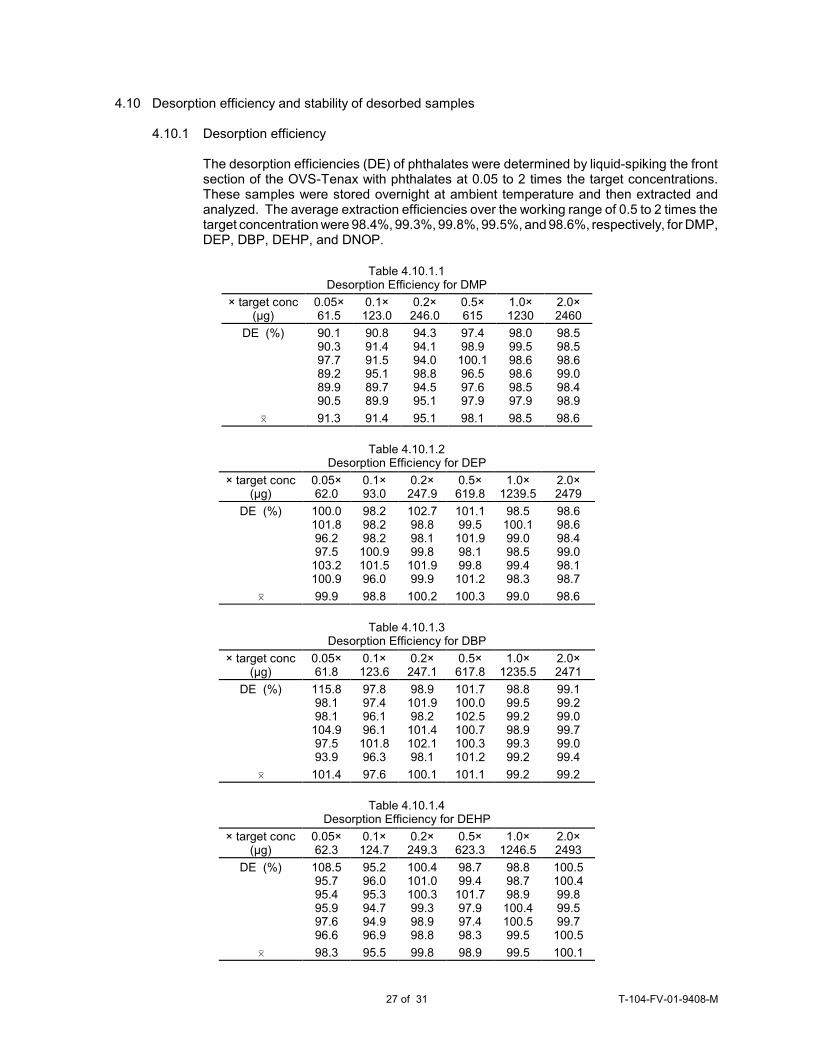
Figure 4.9.2. Breakthrough curves for DEHP andDNOP.
4.9 Sampler capacity
The sampler capacity was assessed by sampling from adynamically generated test atmosphere of phthalate at 2times the target concentration and at 25EC and 80% RH. The test atmosphere of phthalate was generated bypumping a 2-propanol solution of phthalate at a rate ofapproximately 6 mg/min (12 mg/mL × 0.5 mL/min) througha TSI Model 3076 atomizer where it was dispersed with anair stream of 3.5 L/min. The aerosol passed through anelectrostatic charge neutralizer and was diluted with an airstream of 47 L/min. The diluted aerosol was fed to a testchamber fitted with 18 sampling ports. The testatmosphere was drawn through the test sampler and amonitoring sampler at 1.0 L/min. The test sampler wasprepared by cutting off the lower half of the tube andremoving the rear foam and the 70-mg section of the resins(see figure at right). At 60-min intervals, the flow wasstopped and the monitoring samplers were replaced withnew ones. This was repeated six times. At the end of theexperiment, all the monitoring samplers as well as the testsampler were analyzed. The downstream air concentration was obtained by dividing the amountfound on the back sampler by the air volume. The upstream concentration was obtained by dividingthe sum of amounts found on the front as well as all the back sampler by the total air volume. Theactual upstream concentrations obtained were 13.55, 14.23, 8.78, 15.38, 17.76 mg/m3 for DMP,DEP, DBP, DEHP, and DNOP, respectively. The breakthrough is defined as the downstreamconcentration divided by the upstream concentration. The average breakthroughs for eachsampling period versus the air volume1 were plotted in Figures 4.9.1 and 4.9.2.
1The air volume for each sampling period was adjusted to 2 times the target concentrations. The airvolume of the mid-point of the sampling period is multiplied by 10 mg/m3 and divided by the actual upstreamconcentration (13.55 mg/m3 for DMP, for example).
26 of 31 T-104-FV-01-9408-M
4.10 Desorption efficiency and stability of desorbed samples
4.10.1 Desorption efficiency
The desorption efficiencies (DE) of phthalates were determined by liquid-spiking the frontsection of the OVS-Tenax with phthalates at 0.05 to 2 times the target concentrations. These samples were stored overnight at ambient temperature and then extracted andanalyzed. The average extraction efficiencies over the working range of 0.5 to 2 times thetarget concentration were 98.4%, 99.3%, 99.8%, 99.5%, and 98.6%, respectively, for DMP,DEP, DBP, DEHP, and DNOP.
Table 4.10.1.1Desorption Efficiency for DMP
× target conc(µg)
0.05×61.5
0.1×123.0
0.2×246.0
0.5×615
1.0×1230
2.0×2460
DE (%) 90.190.397.789.289.990.5
90.891.491.595.189.789.9
94.394.194.098.894.595.1
97.498.9
100.196.597.697.9
98.099.598.698.698.597.9
98.598.598.699.098.498.9
0 91.3 91.4 95.1 98.1 98.5 98.6
Table 4.10.1.2Desorption Efficiency for DEP
× target conc(µg)
0.05×62.0
0.1×93.0
0.2×247.9
0.5×619.8
1.0×1239.5
2.0×2479
DE (%) 100.0101.896.297.5
103.2100.9
98.298.298.2
100.9101.596.0
102.798.898.199.8
101.999.9
101.199.5
101.998.199.8
101.2
98.5100.199.098.599.498.3
98.698.698.499.098.198.7
0 99.9 98.8 100.2 100.3 99.0 98.6
Table 4.10.1.3Desorption Efficiency for DBP
× target conc(µg)
0.05×61.8
0.1×123.6
0.2×247.1
0.5×617.8
1.0×1235.5
2.0×2471
DE (%) 115.898.198.1
104.997.593.9
97.897.496.196.1
101.896.3
98.9101.998.2
101.4102.198.1
101.7100.0102.5100.7100.3101.2
98.899.599.298.999.399.2
99.199.299.099.799.099.4
0 101.4 97.6 100.1 101.1 99.2 99.2
Table 4.10.1.4Desorption Efficiency for DEHP
× target conc(µg)
0.05×62.3
0.1×124.7
0.2×249.3
0.5×623.3
1.0×1246.5
2.0×2493
DE (%) 108.595.795.495.997.696.6
95.296.095.394.794.996.9
100.4101.0100.399.398.998.8
98.799.4
101.797.997.498.3
98.898.798.9
100.4100.599.5
100.5100.499.899.599.7
100.5
0 98.3 95.5 99.8 98.9 99.5 100.1
27 of 31 T-104-FV-01-9408-M
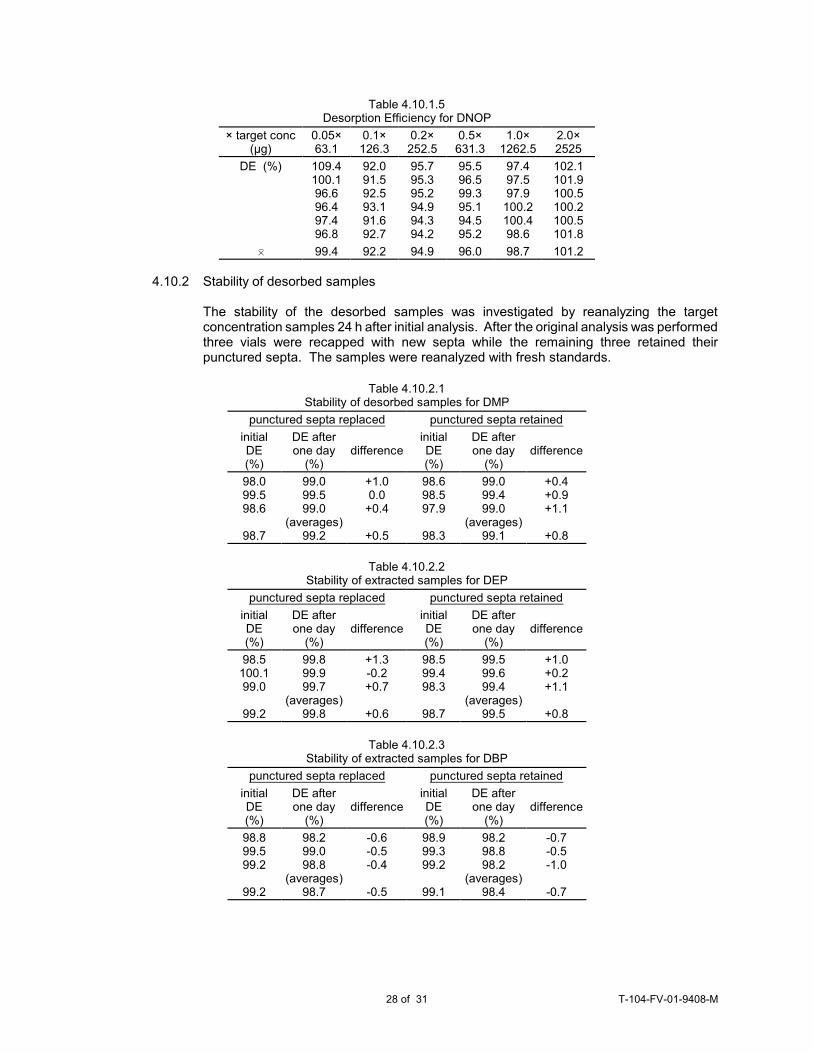
Table 4.10.1.5Desorption Efficiency for DNOP
× target conc(µg)
0.05×63.1
0.1×126.3
0.2×252.5
0.5×631.3
1.0×1262.5
2.0×2525
DE (%) 109.4100.196.696.497.496.8
92.091.592.593.191.692.7
95.795.395.294.994.394.2
95.596.599.395.194.595.2
97.497.597.9
100.2100.498.6
102.1101.9100.5100.2100.5101.8
0 99.4 92.2 94.9 96.0 98.7 101.2
4.10.2 Stability of desorbed samples
The stability of the desorbed samples was investigated by reanalyzing the targetconcentration samples 24 h after initial analysis. After the original analysis was performedthree vials were recapped with new septa while the remaining three retained theirpunctured septa. The samples were reanalyzed with fresh standards.
Table 4.10.2.1Stability of desorbed samples for DMP
punctured septa replaced punctured septa retained
initialDE(%)
DE afterone day
(%)difference
initialDE(%)
DE afterone day
(%)difference
98.099.598.6
98.7
99.099.599.0
(averages)99.2
+1.00.0
+0.4
+0.5
98.698.597.9
98.3
99.099.499.0
(averages)99.1
+0.4+0.9+1.1
+0.8
Table 4.10.2.2Stability of extracted samples for DEP
punctured septa replaced punctured septa retained
initialDE(%)
DE afterone day
(%)difference
initialDE(%)
DE afterone day
(%)difference
98.5100.199.0
99.2
99.899.999.7
(averages)99.8
+1.3-0.2+0.7
+0.6
98.599.498.3
98.7
99.599.699.4
(averages)99.5
+1.0+0.2+1.1
+0.8
Table 4.10.2.3Stability of extracted samples for DBP
punctured septa replaced punctured septa retained
initialDE(%)
DE afterone day
(%)difference
initialDE(%)
DE afterone day
(%)difference
98.899.599.2
99.2
98.299.098.8
(averages)98.7
-0.6-0.5-0.4
-0.5
98.999.399.2
99.1
98.298.898.2
(averages)98.4
-0.7-0.5-1.0
-0.7
28 of 31 T-104-FV-01-9408-M
Figure 4.11.1. Mass spectrum of DMP.
Table 4.10.2.4Stability of extracted samples for DEHP
punctured septa replaced punctured septa retained
initialDE(%)
DE afterone day
(%)difference
initialDE(%)
DE afterone day
(%)difference
98.898.798.9
98.8
96.897.798.0
(averages) 97.5
-2.0-1.0-0.9
-1.3
100.4100.599.5
100.1
96.997.697.2
(averages)97.2
-3.5-2.9-2.3
-2.9
Table 4.10.2.5Stability of extracted samples for DNOP
punctured septa replaced punctured septa retained
initialDE(%)
DE afterone day
(%)difference
initialDE(%)
DE afterone day
(%)difference
97.497.597.9
97.6
95.796.497.7
(averages) 96.6
-1.7-1.1-0.2
-1.0
100.2100.498.6
99.7
96.196.395.9
(averages)96.1
-4.1-4.1-2.7
-3.6
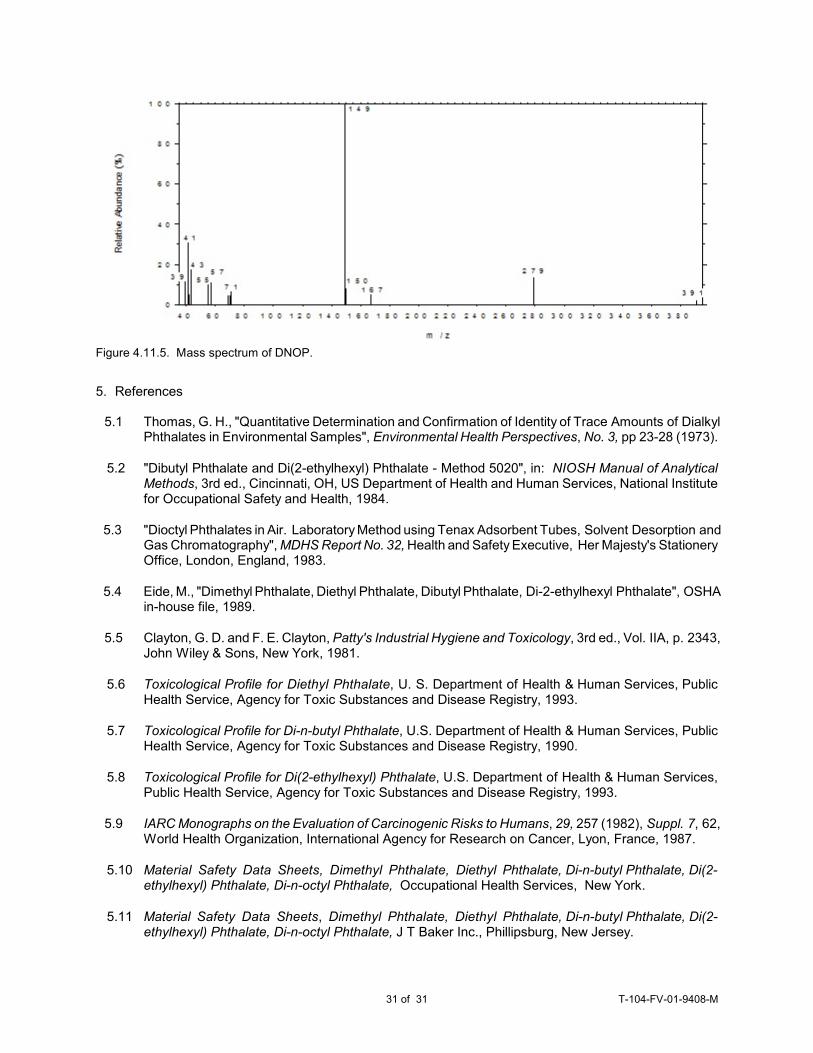
4.11 Qualitative analysis
The GC/MS of phthalates can be obtained by using GC conditions similar to those given in Section3.5. A Perkin-Elmer Ion Trap Detector interfaced to a Hewlett-Packard Series II GC was used toobtain the mass spectra shown below.
29 of 31 T-104-FV-01-9408-M
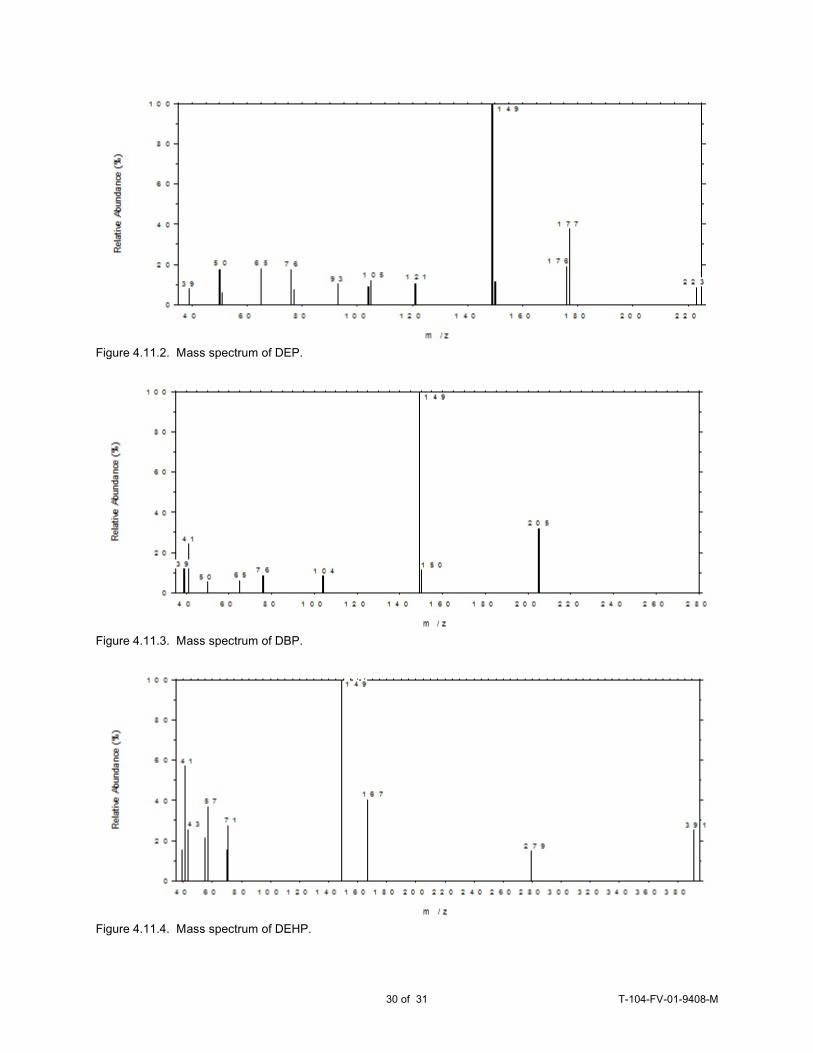
Figure 4.11.2. Mass spectrum of DEP.
Figure 4.11.3. Mass spectrum of DBP.
Figure 4.11.4. Mass spectrum of DEHP.
30 of 31 T-104-FV-01-9408-M
5.1 Thomas, G. H., "Quantitative Determination and Confirmation of Identity of Trace Amounts of DialkylPhthalates in Environmental Samples", Environmental Health Perspectives, No. 3, pp 23-28 (1973).
5.2 "Dibutyl Phthalate and Di(2-ethylhexyl) Phthalate - Method 5020", in: NIOSH Manual of AnalyticalMethods, 3rd ed., Cincinnati, OH, US Department of Health and Human Services, National Institutefor Occupational Safety and Health, 1984.
5.3 "Dioctyl Phthalates in Air. Laboratory Method using Tenax Adsorbent Tubes, Solvent Desorption andGas Chromatography", MDHS Report No. 32, Health and Safety Executive, Her Majesty's StationeryOffice, London, England, 1983.
5.4 Eide, M., "Dimethyl Phthalate, Diethyl Phthalate, Dibutyl Phthalate, Di-2-ethylhexyl Phthalate", OSHAin-house file, 1989.
5.5 Clayton, G. D. and F. E. Clayton, Patty's Industrial Hygiene and Toxicology, 3rd ed., Vol. IIA, p. 2343,John Wiley & Sons, New York, 1981.
5.6 Toxicological Profile for Diethyl Phthalate, U. S. Department of Health & Human Services, PublicHealth Service, Agency for Toxic Substances and Disease Registry, 1993.
5.7 Toxicological Profile for Di-n-butyl Phthalate, U.S. Department of Health & Human Services, PublicHealth Service, Agency for Toxic Substances and Disease Registry, 1990.
5.8 Toxicological Profile for Di(2-ethylhexyl) Phthalate, U.S. Department of Health & Human Services,Public Health Service, Agency for Toxic Substances and Disease Registry, 1993.
5.9 IARC Monographs on the Evaluation of Carcinogenic Risks to Humans, 29, 257 (1982), Suppl. 7, 62,World Health Organization, International Agency for Research on Cancer, Lyon, France, 1987.
5.10 Material Safety Data Sheets, Dimethyl Phthalate, Diethyl Phthalate, Di-n-butyl Phthalate, Di(2-ethylhexyl) Phthalate, Di-n-octyl Phthalate, Occupational Health Services, New York.
5.11 Material Safety Data Sheets, Dimethyl Phthalate, Diethyl Phthalate, Di-n-butyl Phthalate, Di(2-ethylhexyl) Phthalate, Di-n-octyl Phthalate, J T Baker Inc., Phillipsburg, New Jersey.
Figure 4.11.5. Mass spectrum of DNOP.
5. References
31 of 31 T-104-FV-01-9408-M

![Electrochemical Degradation of Diethyl Phthalate under … · Vol. 11, 2016 5010 the degradation of PAEs [5−7]; hence, PAEs have been frequently detected in surface and groundwater](https://static.fdocuments.in/doc/165x107/60756ea84d114b2f783e4d77/electrochemical-degradation-of-diethyl-phthalate-under-vol-11-2016-5010-the-degradation.jpg)