Dilemmas of Structural Adjustment and Environmental...
21
Pergamon WorldDevelopment, Vol. 24, No. 2, pp. 373-393. 1996 Copyright 0 1996 Elsevier Science Ltd Printed in Great Britain. All tights reserved 0305-750X/96 $15.00 + 0.00 0305-750x(95)00140-9 Dilemmas of Structural Adjustment and Environmental Policies Under Instability: Post-1980 Turkey KORKUT BORATAV University of Ankara, Turkey OKTAR TiiREL Middle East Technical University, Ankara, Turkey and EtiNC YELDAN Bilkent University, Ankara, Turkey Summary. - The Turkish structural adjustment since 1980 has been associated with chronic instability. Since the late 1980s. the weaknesses in the fiscal system and the premature external liberalization emerge as the main factors hindering the passage toward stable growth. Enforced and erratic distributional changes and relative stagnation of capital accumulation have undermined the growth potential of the economy. Fur- ther, it is demonstrated that existing market structures may negate environmental policies based on market incentives. These observations, as well as those on the interactions of the market system and the environ- ment, create strong arguments in favor of an active state. 1. RECENT ECONOMIC HISTORY (a) A synopsis of reforms and theirphasing At the time of the writing of this paper (September 1994), the Turkish economy had not yet recovered from a major financial crisis culminating between December 1993 and May 1994, with severe repercus- sions on the real side of the economy. Although desta- bilizing forces leading to financial misfortunes begin- ning in 1989 and extremely buoyant economic activity in 1993 gave signs of an impending breakdown, this paper excludes this recent phase, since it is too early to undertake a comprehensive analysis. The study covers 1981 to 1992-93; the earlier crisis of 1978-79 as well as the following year characterized by an orthodox shock treatment and the consequent relative price realignment are excluded. For purposes of comparison with the precrisis years of the 1970s either 1976 or 1977 is taken as a point of reference. Economic policies followed during 1981-1992 did not deviate from the basic philosophy of orthodox structural adjustment, but the same cannot be argued with respect to conventional stabilization policies, particularly during the second half of the period. On the basis of policy shifts, three subperiods, i.e. 1981-83,1984-88 and 1989-92 are delineated (Table 1). There are some peculiar features of 1988 in terms of quantitative indicators since this year saw a final (and unsuccessful) attempt at fiscal and monetary restraint with a view to correcting macro imbalances which had been gaining momentum from 1986 onwards (see Table 2). With this qualification in mind, the determining features of the three subperiods are as follows: - 1981-83 is the “military phase” characterized by enforced incomes policies, with emphasis on stabilization as a sequel to the shock treatment of 1980, deregulation of internal commodity markets and clumsy and disastrous moves into financial lib- eralization. - 1984-8 (with the exception of 1988) can be labeled the “golden years” of Motherland Party (MP) and its then leader, Mr. ozal. Decisive steps were taken in this subperiod toward trade and financial liberalization. The emphasis was put on structural adjustment and the necessary institution- building. Starting in 1985, expansionary fiscal policies and a public investment boom led to a vir- tual neglect of stabilization objectives. On the 373
Transcript of Dilemmas of Structural Adjustment and Environmental...

Pergamon WorldDevelopment, Vol. 24, No. 2, pp. 373-393. 1996
Copyright 0 1996 Elsevier Science Ltd Printed in Great Britain. All tights reserved
0305-750X/96 $15.00 + 0.00
0305-750x(95)00140-9
Dilemmas of Structural Adjustment and
Environmental Policies Under Instability:
Post-1980 Turkey
KORKUT BORATAV University of Ankara, Turkey
OKTAR TiiREL Middle East Technical University, Ankara, Turkey
and
EtiNC YELDAN Bilkent University, Ankara, Turkey
Summary. - The Turkish structural adjustment since 1980 has been associated with chronic instability. Since the late 1980s. the weaknesses in the fiscal system and the premature external liberalization emerge as the main factors hindering the passage toward stable growth. Enforced and erratic distributional changes and relative stagnation of capital accumulation have undermined the growth potential of the economy. Fur- ther, it is demonstrated that existing market structures may negate environmental policies based on market incentives. These observations, as well as those on the interactions of the market system and the environ- ment, create strong arguments in favor of an active state.
1. RECENT ECONOMIC HISTORY
(a) A synopsis of reforms and theirphasing
At the time of the writing of this paper (September 1994), the Turkish economy had not yet recovered from a major financial crisis culminating between December 1993 and May 1994, with severe repercus- sions on the real side of the economy. Although desta- bilizing forces leading to financial misfortunes begin- ning in 1989 and extremely buoyant economic activity in 1993 gave signs of an impending breakdown, this paper excludes this recent phase, since it is too early to undertake a comprehensive analysis. The study covers 1981 to 1992-93; the earlier crisis of 1978-79 as well as the following year characterized by an orthodox shock treatment and the consequent relative price realignment are excluded. For purposes of comparison with the precrisis years of the 1970s either 1976 or 1977 is taken as a point of reference.
Economic policies followed during 1981-1992 did not deviate from the basic philosophy of orthodox structural adjustment, but the same cannot be argued with respect to conventional stabilization policies, particularly during the second half of the period. On
the basis of policy shifts, three subperiods, i.e. 1981-83,1984-88 and 1989-92 are delineated (Table 1). There are some peculiar features of 1988 in terms of quantitative indicators since this year saw a final (and unsuccessful) attempt at fiscal and monetary restraint with a view to correcting macro imbalances which had been gaining momentum from 1986 onwards (see Table 2). With this qualification in mind, the determining features of the three subperiods are as follows:
- 1981-83 is the “military phase” characterized by enforced incomes policies, with emphasis on stabilization as a sequel to the shock treatment of 1980, deregulation of internal commodity markets and clumsy and disastrous moves into financial lib- eralization. - 1984-8 (with the exception of 1988) can be labeled the “golden years” of Motherland Party (MP) and its then leader, Mr. ozal. Decisive steps were taken in this subperiod toward trade and financial liberalization. The emphasis was put on structural adjustment and the necessary institution- building. Starting in 1985, expansionary fiscal policies and a public investment boom led to a vir- tual neglect of stabilization objectives. On the
373
314 WORLD DEVELOPMENT
other hand, the institutional and legal instruments inherited from the military phase continued to be used effectively to control labor incomes - The third phase signifies a “return to populism” plus external financial liberalization.” A wage explosion accompanied by higher agricultural prices led to further worsening of public sector finances. Privatization began to be seen as a substi- tute for fiscal reform. Short-term capital move- ments in response to fluctuations in exchange and interest rates created erratic changes in external accounts.’
A few supplementary remarks on the indicators given in Table 2 may be useful: - Once the initial slack in the economy which
In the context of a three-gap growth model (see, inter alia, Bacha 1990) the saving constraint turns out to be the least binding in the first subperiod. For the successive subperiods, fiscal and foreign exchange (FX) constraints respectively seem to be the least binding.2
contributed to a relatively rapid pace of recovery
- Neither current nor constant price calculations
and growth in the first two subperiods was exhausted, the economy settled down to slower growth. The potential growth rate of the Turkish
of average savings and investment propensities
economy moved to a lower plateau during the
indicate a significant and permanent improvement
1980s and the early 1990s. A 4.1% p.a. of potential GDP growth rate for the period under study com- pares poorly with the growth path of earlier decades. -The aftermath of MP’s boom is characterized by the shortening of the growth cycle. The post- 1987 growth average of 3.7% p.a. is made up of two above-trend performances in 1990 and 1992 and three years of declining per capita income (1988-89 and 1991). 1993 and 1994 also seem to fit well into this pattern of demand-led boom and the bust which sets in shortly after the ceiling of potential output is reached.
Table 1. Subperiods based on economicpolicy shifs, 1981-92
Policies 1981-83 1984-88 1989-92
Financial system
Fiscal system
Public enterprises (PEs)
Incomes policies
External policies
Macro policies & others
Diversification of financial instruments (FIs); freeing interest rates (i); bankers’ scandal; partial reversal
Attempt to reduce spending & increase taxes
PE accounts improve due to price increases
Military control of labor @)-market; agricultural support policies (ASP) curbed
Real depreciation (RD); import quotas reduced, heavy X- subsidies (XS); some forex controls (FC) lifted
Monetary restraint through CB credit controls, deregulation of internal markets
Environmental A series of environmental laws policies and regulations based on
“polluter pays” principle, with limited enforcement and open evasions
Interest rate policy under Interbank money and forex Central Bank (CB) control; markets with CB as participant; multiplication of FIs; gradual freed interest rates monitored domination of gov’t bonds (GBs) by CB
Lowering tax burden on High interest burden on budget; business, rentiers &high Treasury - CB conflict on incomes; value-added tax financing public deficit (PD) (VAT) adopted; higher spending after 1984
Privatization (PN) agency set up; minority shares sold; debt financing of PE investments
PN seen as major revenue source; debt burden worsens PE accounts
Anti-L, anti-farm, prorentier policies; L militancy in 1988
Return to populism on wages & ASP
Crawling peg targeting RD; XS All FC lifted; fully liberal K- remain; imports liberalized, account; market-based exchange external borrowing by firms rate; real appreciation &banks eased
Reduced control over PD, attempt at fiscal restraint in 1988
Indirect taxation on energy inputs: Energy costs accelerate over private producer prices while energy/output ratios am not affected
Control over PD & internal debt growth lost; CB loses ground on monetary policy
Ministry of Environment (ME) founded in 1991; efforts to administer an earmark environmental funding system under ME

TURKEY 315
Table 2. Major indicatorsfor subperiods, 1981-92 (index numbers (1977: 100) andpercentages)
1981-83 1984-87 1988 1989-92
GDP Growth, % pa. 5.0 6.9 2.1 3.7 Main macroeconomic aggregates as % of GNP*
- CAD, 2.4 1.7 -1.7 0.3 - SC 14.6 15.7 20.1 16.3 - 1, 17.0 17.4 18.4 16.6 - PSBRc 2.9 2.2 1.7 5.3 - CAD, 0.5 0.8 -2.8 -0.7 - S, 19.0 18.1 20.7 18.9 - 1, 15.0 18.9 17.9 18.2 - PSBR, 3.1 2.2 1.2 5.3
Inflation, % p.a.t 31.4 38.8 68.3 60.5 Capacity utilization rate, %$ 88.5 95.1 97.6 96.9 Real wages 77.0 63.3 68.9 93.76 TOTAR 60.7 63.0 50.0 65.4 REERII 123.7 148.0 151.9 128.9 Real interest rates, %**
- With ref. to current inflation 8.W 12.9 25.9 9.53X -With ref. to future inflation O.OVt 10.6 30.9 12.4$$
*Subscripts c and r in the following rows refer to current price and real (1987) price calculations. respectively. tin terms of WPI. $Method of calculation is described in Boratav and Tiirel(l989). §For 1989-90. uerms of trade for agriculture on the basis of implicit GDP deflators. IlBased on Uygur (1991) for 1981-90 and on Central Bank end-of-year estimates for 1991-92, this is real effective exchange rate for a basket of foreign currencies. Its increase signifies real depreciation of TL and vice versa. **Average bank lending rates based on Akkurt et al. (1991) deflated by WPI. ttRefers to 1982-83. #Refers to 1989-90.
over the past decades. As will be discussed later, the stagnation and even erosion of overall invest- ment rates are linked to substantial declines in pub- lic investment which is not made up by private investment. (See Table 5.) - Current account deficit (CAD)/GNP ratios, when averaged over the subperiods, give the impression of an overall improvement in external balance. Despite the appearance of alleviation of the chronic deficit position after 1988 with three surplus years, annual figures exhibit erratic and easily reversible movements. Following liberaliza- tion, the capital account also became more volatile. - The corrective effort to stem the rising trend of PSBR in 1988 turned out to be abortive when infla- tion moved onto a new and higher (60% p.a.) plateau from one around 30% p.a. in absence of significant cost-push elements. Despite the “wage explosion” and increased public deficits, the rate of inflation did not accelerate after 1988, but settled on this higher plateau. Real appreciation of the Turkish lira (TL) apparently alleviated inflationary pressures. -Wages and agricultural terms of trade indicators
for the last two subperiods reveal the extent of the post-1988 distributional changes - a drastic reversal of earlier trends which is studied in more detail in Boratav, Tiirkcan and Yeldan (1994). Although subject to sizable fluctuations, positive and sometimes very high interest rates prevailed throughout 1981 to 1992-93. Despite the apprecia- tion in the last subperiod, TL remained depreciated in real terms, in comparison to the values in the late 1970s and in 1980.
Despite the comprehensive economic and institu- tional reforms, environmental protection has never- theless been a neglected component of policy action in Turkey. Even though environmental concerns have been explicitly voiced in various policy documents, the country still lacks a sound environmental research and action program. Environmental policy-relevant research is still at its infancy; existing data are limited to air and water pollution in provincial areas, and is of dubious quality. On the other hand, the existing envi- ronmental policies are put into effect through a mix of pervasive but hardly enforceable controls and polluter charges which are neither comprehensive nor suffi- cient to prevent continuing environmental degrada-

316 WORLD DEVELOPMENT
Table 3. Decomposition of changes in external deficit, 1981-92 (as percentages ofpotential outpuf)*
1981-84 1984-87 1987-88 1988-92
Change in external Deficit’ -0.2 -1.3 -2.6 +2.3
External shock component +1.3 -2.8 -1.0 -1.7 (Terms of trade changes)$ +0.6 -2.8 +1.3 a.9 (World trade expansion) +l.O +0.8 -1.0 -0.5 (Interest rate shock) -0.1 -0.3 -0.1 -0.1 (Change in transfers) -0.2 -0.6 -1.2 -0.2
Debt burden component$ +o.s +0.4 +0.4 -0.7
Policy component -2.0 +1.2 -2.0 +4.7 (Increase in u)cfi +0.2 +0.3 -0.1 -0.0 (Import compression)” +2.6 +2.5 -1.3 +3.0 (Export penetration)** -4.8 -1.6 -0.6 +1.8
* figures may not sum up to totals because of rounding. t Negative figures imply reduction in balance of payments deficit relative to potential output. $ Positive figures imply adverse changes. 8 Positive figures imply adverse changes. The negative value for 1988-92 is due to real appreciation of TL. I u: rate of capacity utilization. I’ Negative figures imply import compression. ** Negative figures indicate export penetration due to reduced absorption. Source: Boratav, Tiirel and Yeldan (1994), p.7,
1981-92
-1.8
-4.3 -1.9 +0.3 a.5 -2.2
+0.5
+2.0 +o.s +6.8 -5.3
tion. In parallel with the general tenor of the post- 1980 reforms, Turkish environmental authorities (mostly with the support of the World Bank and other interna- tional donors) also tried to design market-based policy measures and thus shift from regulation to price mech- anisms in the realm of environmental management. Most of these measures however have not been imple- mented yet, mainly due to the lack of political will and proper organizational structures to administer envi- ronmentally sound tax/subsidy schemes.
(b) Decomposition of changes in external andfiscal
gaps
Constituent elements of changes in external and fis- cal gaps in line with Gibson’s (1991) decomposition framework are presented below. Although there are quite diverse movements in the subperiods, only the picture for the entire period as shown in the last columns of Tables 3 and 4 is described here.l
Over the entire 12-year span, the reduction in for- eign savings/potential output ratio (s,) by 1.8 percent- age points was essentially realized by favorable exter- nal conditions: A decline of 3.8 percentage points in foreign savings is accounted by the “external shock” component, after allowing for the impact of the debt burden; 2.2 percentage points out of the 3.8 are due to the rise in service exports and other invisibles. Although in the model framework these latter cate- gories are incorporated in the “external shock” com-
ponent, it should be noted that they are also responsive to policy variables. Nevertheless, the fact remains that adverse international developments which dominated 1973-81 were, as a whole, reversed in the following period.
On the policy front, the impact of import liberaliza- tion (leading to a 6.8 percentage points rise in s,) more than offset the positive impact of the export drive pro- ducing a 5.3 percentage point decline in sf. Hence, contrary to the widespread belief, economic policies, in toto, contributed to rises in external deficits by 2.0 percentage points. Had these policy choices produced an overall neutral impact on sr the Turkish economy in the early 1990s could have attained a modest, but per- sistent surplus in balance of payments instead of erratic movements.
Over 1981-92, a rise in 2.0 percentage points in PSBR is essentially explained by domestic interest rate shocks and changes in the domestic debt burden which account for a rise by 2.7 percentage points. The mildly favorable impact of external and policy compo- nents (-0.2 and -0.5 percentage points, respectively) account for the rest. Although the method of decom- position includes the impact of local interest rates in the “domestic shock” component, in the Turkish con- text it is essentially a policy-determined factor. One can conclude that the deterioration of public sector finances over time is, to a large degree, the outcome of costly domestic borrowing schemes, which toward the end of the period started to acquire the characteristics

TURKEY 377
Table 4. Decomposition of changes in PSBR, 1981-92 (as percentages ofpotential ouputJ*
1981-84 198&87 1987-88 1988-92 1981-92
Change in PSBRt -2.3 +1.7 -1.8 c4.4 +2.0
External shock component +0.3 +o. 1 +0.3 -0.9 -0.2 (Debt burden) +0.4 +0.3 +0.3 -0.8 +0.3 (Interest rate shock) -0.1 -0.2 -0.1 -0.1 -0.5
Domestic shock component (Debt burden) (Interest rate shock)
+0.3 +l.O +0.7 co.8 +2.7 -0.2 +0.8 -0.0 +o. 1 +0.7 +0.4 +O.l +0.7 +0.7 +2.0
Policy option component (Tax changes)$ (Distributional changes) (Increase in u)
(OtherS
-2.9 +0.7 -2.8 +4.5 -0.5 +2.7 -2.6 +l.O -2.7 -1.6 -0.1 Al.3 +O.l -0.5 -0.8 +O.O -0.0 +o.o 20.0 +o.o -5.6 +3.6 -3.9 +7.7 +I.9
* Figures may not sum up to totals because of rounding t PSBR stands for the investment-saving gap of the public sector relative to potential output. $ Increased tax effort produces a negative sign. 5 Impact of changing spending, tax and transfer patterns. The relatively large figure for 1988-92 is mainly due to rising cur- rent spending and erosion of PE surpluses. Source: Boratav, Tiirel and Yeldan (1994), p. 9.
of Ponzi financing. The policy option components which accounted for many of the changes in succes- sive subperiods seem to offset each other, leaving interest and debt shock as the major determining fac- tors of increased public deficits.
Policy makers’ response to increased public deficits was an unwillingness to reduce transfer spending and undertake serious tax reform. There is a -2.4 percent- age point tax effort component behind the modest -0.5 percentage point policy contribution to PSBR growth. But, as will be discussed below, this basically consists of (i) increased productivity of indirect taxation and (ii) the upward movement in wages and salaries during the last subperiod and the resulting increase in income tax revenue. No effort at reforming direct taxation took place. This led to a vicious circle of deficit finance via borrowing as the preferred alternative to meet expenditure gaps with all the adverse conse- quences.
The indirect taxation regime had important conse- quences for environmental policy making. It can be argued that in the absence of a comprehensive, direct regulatory system, price policy remains the only instrument to address environmental concerns. The rise in the cost of energy which increased by almost 50% faster than the industrial producer price in Turkey over the last decade is worth noting in this context. Thus, it can be argued that energy pricing policy suc- cessfully reflected the scarcity value of resources to the industrial producers. It could also be cited among
the so-called “win-win” policies of the World Bank in which policies for “efficient” income growth comple- ment those for environmental protection (World Bank, 1992). The technological input choice aspect of this policy has nevertheless yielded a rising trend in energy consumption both in terms of per unit of output and per labor employed in the manufacturing industry. despite the rising energy costs and a steep drop in real wages paid in the sector. On the other hand, polluter and/or user charges throughout the post-1980 period were neither sufficiently high nor strictly enforced to have a significant impact on the protection of environ- ment.
(c) The state and the bourgeoisie: Corruption and rent-seeking under a “liberal” regime
If we label as “rent-creating activities” all cases of economic decision making and policy implementation which create positions of advantage for individual businesses, as the economic regime moved further into liberalization, a broader the scope of rent-creation and rent-realization appears in post-1980 Turkey. This striking paradox created an embarrassing challenge to partisans of orthodoxy who had been advocating liber- alization on the basis of its favorable distributional consequences by lowering rents of all sorts emanating from a large, protective, interventionist state.
The problem with the utopian neoliberal position is that under the structural and class characteristics of

378 WORLD DEVELOPMENT
less-developed capitalism, there are objective limits to the shrinking of the state and the very process of liber- alization creates new rents. In this context it should be noted that in most Third World countries the bour- geoisie itself is a creation of the state and this histori- cal phenomenon has created cultural, sociological and economic traits which do not disappear with changes in the policy model. The very process of rent-seeking emanates from the bourgeoisie, not from the state per se and this is a well-known daily fact in the Turkish scene which only academic liberals ignore. The major areas of rent-seeking and rent-creation under the lib- eral model have been (i) illicit appropriation of export subsidies through fictitious exports, (ii) speculative urban and touristic rents, (iii) privatization and stock exchange operations, (iv) government tenders, (v) fis- cal incentives and bailing out of firms and banks in distress. These are reviewed in some detail in Boratav, Ttirel and Yeldan (1994). Although it is difficult to quantify, indirect evidence suggests that the relevant magnitudes (i.e. the rents or “spoils”) involved during the “liberal” phase may have been substantially larger than those under the ‘*protectionist/interventionist” phase. The mere fact that there has not been any period in the history of republican Turkey when corruption and economic scandals have so heavily dominated the public scene as the present one is significant in this context. Far from being transitional phenomena, rent- creating categories either persist or, as old patterns die out, new ones emerge.
There was, moreover, another new element even in the process of rent-creation under the liberal regime: Decision making and implementation on rent-allocat- ing activities definitely shifted into the prerogative of the political layer of the state structure as the upper bureaucracy was pushed increasingly into a passive position. This was a conscious policy move and was carried out under the banner of “less government by eliminating the bureaucratic fetters in economic deci- sion-making.” During the import-substituting phase, the basic function of the bureaucratic layer has been not the elimination of “rents,” but rather guaranteeing neutral and/or acceptable conditions among rivaling claims with respect to the distribution of rents. Although this state of things was never fully satisfac- tory for the political “class” and their constituencies within the business community, it was nonetheless instrumental in creating a significant degree of stabil- ity.
This modus vivendi which was gradually being undermined by uneasy coalition governments since the mid- 1970s was totally destroyed during the second half of the 1980s. A number of functions traditionally resting with the bureaucracy shifted to the political layer, e.g., directly to the Ministers or the Prime Min- ister. Key posts under the Ministry of Finance, SPO and the Central Bank, which had always been kept out of the reach of “outsiders” were now given to experts
“imported” from abroad with no experience in Turkish public administration and who acted merely as exten- sions of the political “class.” The traditional bureau- cratic layer was gradually rendered ineffectual. More- over, the gradual erosion of the real salaries of the upper bureaucracy had a destructive impact on the quality of public administration. The eventual paraly- sis of the bureaucracy resulted in arbitrariness in rent creation and realization: Personal connections of busi- nessmen with ministers gradually became the deter- mining factor in access to the “spoils” emanating from the government.
These new developments led to acute tensions and inner conflicts within the bourgeoisie as well as between certain business groups and the state particu- larly after the 1985-87 economic boom came to an end. Since all segments of the business community could not have equal access to the highest echelons of the political layer, it was natural that these orienta- tions, in the end, created more adversaries than sup- porters and led to the emergence of a strong sense of uncertainty and dissatisfaction within the bourgeoisie at large during the late 1980s.
2. WORKINGS OF THE ECONOMY
(a) Accumulation patterns
Index numbers of public, private and total gross fixed capital formation (GFCF) are presented in Table 5, taking 1977 as the reference year. The following points can be emphasized:
- In constant (1987) prices, the overall 1977 GFCF level was reached in 1986 and by 1992 exceeded the former magnitude by 30%. Due to GDP growth, this results in declining IGDP ratios (calculated at 1987 prices) during 24.5% to 16.8% during 1977-92. For the public sector, 1992 fig- ures are around the 1977 levels. Private GFCF reached the 1977 level also in 1986 (1989 if we exclude housing investments). Annual growth rates for total and private investments were slightly lower than 1.8% and 3.5% p.a. for the 15-yearper- lod beginning in 1977. -There were two upward spurts in private invest- ments: The first was due to the boom in housing investments which attained a 36% p.a. growth rate 1985-88 and the second in was a one-year “explo- sion” in real manufacturing GFCF by 64% in 1990. The level attained in 1990 was preserved during the following two years. It is very difficult to explain the second spurt with reference to conven- tional arguments (e.g., interest and inflation rates, crowding-in or crowding-out, acceleration factors, etc.) and this raises doubts about data reliability. - In terms of sectoral distribution, despite the 1990 boom in private manufacturing investments, dramatic declines in public GFCF pushed real total

TURKEY 379
Table 5. Index numbers (1977=100) of GFCF by sectors (1977: loo)
1981 1984 1989 1992
GFCF, 95.2 87.5 89.4 101.4
A+M+M 105.2 69.9 38.6 40.3 Infrastructure 92.0 103.9 126.4 122.6 Services 75.6 91.6 130.3 215.5
GFCF, 62.7 83.0 143.5 166.9 A+M+M 55. I 76.8 74.9 117.6
Infrastructure 75.0 104.4 114.2 188.5
Services 68.7 83.0 257.0 230.3
GFCF, 78.9 85.5 113.4 130.4
A+M+M 80.9 73.3 56.4 77.8
Infrastructure 88.3 103.8 123.6 123.6
Services 71.1 86.2 212.2 225.3
* Subscripts g, p and t refer to “public”, “private” and “total.”
Rows below GFCF, and GFCF,, are public and private sec-
tom1 GFCF figures. A+M+M: agriculture + mining + manu-
facturing; Infrastructure: energy + transport and communica-
tions: Services: all other sectors.
manufacturing GFCF 20% below its 1977 level. Indeed, in 1992 total real GFCF was below the 1977 level in agriculture, mining, manufacturing and energy sectors. It is, in our view, this dramatic shift against the “productive” sectors that lies behind the decline in potential growth rate. - Crowding-out theses of private by public investments are not validated in the Turkish case by econometric analysis. Financial crowding-out is irrelevant in this controversy because it refers not to public investment per se, but rather to public deficits covered by borrowing whatever the under- lying cause. Our own data suggest tradeoffs between private investments in housing versus manufacturing, rather than the public/private dichotomy.4
Declining rates in (and drastic changes in the sec- toral distribution of) capital formation was not accom- panied by higher efficiency of investments. The changing path of capital formation with no discernible improvement in output/capital ratios5 merely resulted in lower potential growth and a shift toward relative stagnation. Economists who share the foregoing diag- nosis are in agreement that a more active state is required for moving into a dynamic path of develop- ment.
(b) The pattern ofprice movements
(i) The wage cycle A grassroots workers’ movement starting in 1988
combined with the catastrophic electoral setback of 1989 for the ruling MP changed the industrial-social scene altogether. Elements of conventional populism have reemerged within, however, an essentially differ- ent overall environment: Turkey, unlike the 197Os, is now a major exporter of industrial products and, as will be discussed below is critically vulnerable to wage movements. The economy is facing a serious fis- cal constraint which is also highly sensitive to upward changes in public sector wages and salaries.
Table 6 provides a picture of the wage cycle of 15 years. By 1990 the preceding peak (1977 or 1978) for real wages was attained, but the W/Y ratio was sub- stantially behind the all-time peak due to productivity improvements which took place during the period. The magnitude of the wage explosion of 1989 and 1990 can be observed by the 1990/1988 ratio for real wages: 72% or 51% increases in real wages in the PE sector and in manufacturing industry respectively in two years can only be characterized as an internal shock to the economy. Turkish experience is striking both in terms of the length and magnitude of the wage erosion and of the speed and magnitude of the “correc- tion.” As the relationship between competitiveness and wages further on shows, the Turkish case also provides a lesson on the futility of relying on wage compression alone as a medium-term policy variable for achieving competitiveness. Public sector wage increases were significantly higher than those of the private sector which tried to defend its profits by layoffs, part-time schemes, subcontracting, fictitious dissolution and reestablishment of companies. 19900988 real wage ratios for public and private manufacturing industry were 1.76 and I .42, respec- tively. The outcome was further deterioration offinan- cial indicators for PEs after 1988 which facilitated the arguments of the pro-privatization lobby.
Turkish data on manufacturing industry also enable us to look into the determinants of the wage share. Apart from the simple relation between productivity and real wages, another way of looking into the prob- lem is through an investigation of the determinants of mark-up rates: Under assumptions of mark-up pricing, wages I value-added ratios are, by definition. deter- mined by the mark-up rate, and the ratio in v&e terms between nonlabor input costs (C’) and wages (W). Within such a framework, the factors which will affect W/Y downward are: increased mark-up rates. increased capital intensity of production under unchanging relative prices (constant real wages in terms of nonlabor input costs), and a decline in real wages (in terms of input costs), that is relative increases in intermediate costs (in terms of labor costs).

380 WORLD DEVELOPMENT
Table 6. Index numbers of real wages and wages/value-added (W/u) ratios, selected years*
Years W, W,, WJY, WdYv r(%o) CIW
1976 100.0 100.0 34.3 29.8 .358 5.601 1977 113.2 108.3 37.1 35.1 .305 5.065 1980 96.9 81.9 30.7 27.6 .359 6.318 1983 85.1 80.1 24.8 26.0 .316 8.015 1986 70.0 68.0 16.1 18.2 .381 10.832 1987 74.9 76.6 17.3 17.4 ,382 11.404 1988 74.0 74.6 15.4 16.7 .398 11.577 1989 103.7 90.1 19.0 19.7 ,363 10.246 1990 127.1 112.8 21.7 21.8 .408 7.815 TIP .556 .623 ,415 .476 1988/P ,587 ,689 .415 ,476 19900988 1.719 1.517 1.409 1.305 1990/P 1.009 1.042 ,585 .612
W,,: Real wages in PEs, Wmr: Real wages in total manufac- turing. T: All-time trough in real wages, P: Pre-1980s peak. r: Mark-up rates in private manufacturing. C/W: Nonlabor input costs relative to wage bill in private manufacturing. The deflator used in real wage calculations is based on wholesale price series of State Institute of Statistics (SIS) for 1981 onward and of the Treasury for preceding years. WJY,,, and W,,JYmp refer to total and private manufacturing sector in cur- rent prices, respectively.
The manufacturing industry data for 197690 sug- gest that the period covered can be divided into years when, first, stable mark-up rates + changing C/W ratios occurred, and second, when relatively substan- tial changes in (r) together with minor or significant changes in C/W ratios are observed. 1977, 1981, and 1983-85 are years when r dropped significantly to a lower level to recover immediately afterward, some- times to a higher plateau. The other years represent, roughly speaking, the first case above.
The data further suggest that productivity and real wage changes are the main determinants of variations in C/W ratios. Relative nonlabor input prices, chang- ing input coefficients and industrial coverage provide additional, but less important explanatory factors.
During a period of radical change in relative prices such as 1976-90, mark-up rates have been strikingly stable. On the basis of available Turkish data, one can propose three possible determinants in explaining changing mark-up rates: rates of capacity utilization, rates of protection for the relevant industries and rates of change in real wages.
The analysis in Boratav, Tiirel and Yeldan (1994) shows that until 1976, real wage growth rates seem to be more closely (and inversely) related with mark-up rates and capacity utilization rates seem to be another explanatory factor. The latter variable seems to affect (r) during 1974-77, the last years of the gowth cycle of the 1970s. During 1978-82, real wage declines seem
to explain the rise in (r) since this is a period of very low rates of capacity utilization. 1983-85 seems to have been an exceptional phase since it incorporates a decline in (r) together with lower real wages and higher capacity use. This may be the only subperiod where import liberalization under a stagnant conjunc- ture may have affected the erosion of profit margins. Higher capacity use in 1986-88 and 1990 and real wage movements in opposite directions in 1988 and 1989 seem to be the determining factors behind mark- up movements (continually rising rates from 1984 except in 1989). The absence of any strong link between rates of protection and mark-up rates is strik- ing except, as we have noted, for 1983-85. There seems to be no solid empirical ground for linking the so-called rents of protection and the trade regime. We return to this question when we investigate sectoral relative price movements below.
It should be clear that oligopolistic mark-up pricing has direct consequences for environment via the choice of input mix. For example, there is evidence that cost savings achieved from repressed wages and lagging material input prices (of the public enter- prises) served as a buffer against rising energy prices in the private manufacturing sector (Yeldan and Bakan, 1993). Consequently, in an oligopolistic envi- ronment private producers could exercise pricing strategies based on cost-plus-mark-ups and when prices of other factors of production lagged behind the price of energy, oligopolistic producer surpluses could be maintained, and the rise in energy prices did not necessarily result in substitution away from energy inputs. The pressure of this setting on the environment is potentially enormous, and is further compounded by the fact that the present technology in electricity pro- duction relies heavily on the use of low-grade coal.6 We reflect more on this issue inspection 4(c) below.
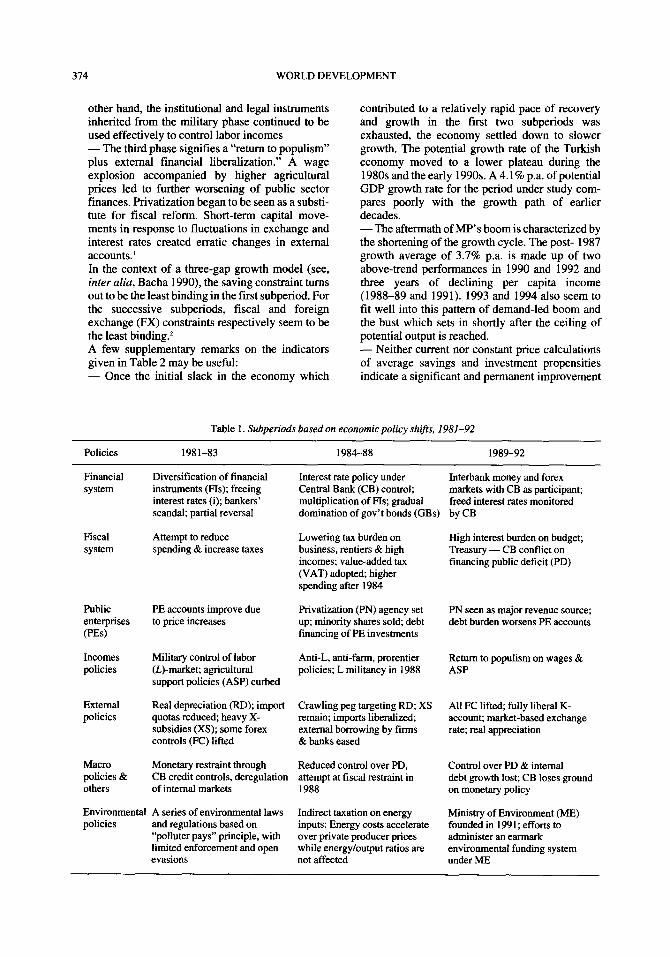
(ii) Agriculture’s terms of trade Table 7 produces the findings on Turkish and inter-
national terms of trade for agriculture (TOTA, and TOTA,, respectively). It shows the dramatic regres- sion in 197688 and the substantial recovery in 1989-90 in parallel with the “wage explosion” and as part of the overall process of the reemergence of pop- ulism. Table 8 provides hints on the role of the policy tools (i.e. the relative magnitude of support purchases and relative support prices) as a determinant of TOTA. Differential (i.e. flexible vs. mark-up) pricing behav- ior of agriculture and industry under specified macro policies and in response to productivity may provide an additional explanation of TOTA movements. On possible other determinants, differential income elas- ticities of demand and different income growth for the two sectors cannot provide an explanation of agricul- tural price movements of the 1980s in view of the real- ized growth of incomes and acceptable elasticity val- ues.
TURKEY 381
Table 7. Inlernal and inremational terms of trade for agri- culture: index numbers, ratios and rate of change (%J
Years TOTA, TOTA, T/W G,(s) G,,
1973 111.7 174.0 .642 - - 1974 119.8 162.2 .739 +7.3 -6.8 1975 116.9 143.0 ,817 -2.4 -11.8 1976 100.0 100.0 1.000 -14.5 -30.1 1977 99.5 89.5 1.112 a.5 -10.5 1978 96.7 104.1 ,929 -2.8 +16.3 1979 81.4 104.5 ,779 -15.8 +0.4 1980 67.3 137.2 ,491 -17.3 +31.3 1981 65.4 118.3 ,553 -2.8 -13.8 1982 56.7 90.3 .628 -13.3 -23.7 1983 59.2 99.3 ,596 +4.4 +lO.O 1984 66.1 92.3 ,716 +11.7 -7.0 1985 63.7 79.5 ,801 -3.6 -13.9 1986 62.1 71.4 ,870 -2.5 -10.2 1987 59.0 73.3 ,805 -5.0 +2.7 1988 49.8 80.8 ,623 -15.6 +9.1 1989 ’ 57.8 81.9 ,706 +16.1 i2.4 1990 70.7 73.1 ,967 +22.3 -10.7 1991 66.2 69.5 ,953 -6.4 -4.9
Table 8. Relative magnitude of support purchases (9;) and relative support prices (ratios between index numbers)
Years SP/A VA p/p
1976 14.7 1.000 1.000 1977-79 12.2 ,752 ,778 1980-86 8.6 ,673 ,867 1987 7.3 ,723 .856 1988 5.5 ,797 1.029 1989 5.7 ,826 ,944 1990 7.6 1.240 1.785 1991 12.0 1.143 I.268 1992 13.2 1.166 1.167
Notes: Calculations based on SPO and SIS data. SP: Value of support purchases by public agencies. AVA: Agricultural value-added. P, : Index number of weighed support prices for wheat, tobacco, sugar beet, cotton, sunflower seed, hazelnuts and tea (only the first three are considered for 199&91. and the first six for 1992). P: Wholesale price index. P, : Index number of implicit deflator for agriculture as calculated from GDP series.
Notes: TOTA, for 1973-89 is from Ttirel(l99 1) and updated for 199&91 based on the ratio between UNCTAD’s price indices for agricultural and manufactured commodities in world trade. TOTA, is based on GDP implicit deflators. G, and G, are annual growth rates for TOTA, and TOTA,.
As for the role of international terms of trade move- ments as a possible determinant of TOTA for Turkey, the question is important not only in its own right, but also for understanding the degree of freedom of domestic support policies vis-ci-vis world market para- meters. The overall impression one can get from Table 7 is that there is not a high degree of dependence of TOTA, on TOTA,: Out of the 18 years covered in the table, the direction of change is the same (both + or- signs) in only 10 years. It seems however, that follow- ing the price shock of 1980 - a year where, paradox- ically, there was a significant improvement in TOTA,-, internal price movements seem to fall more in line with international terms of trade: Divergence in direction of change in TOTA, and TOTA, occurs in four out of seven years during 1973-80, but only four out of 11 in the post-1980 years. Fluctuations around the mean during the first phase were relatively speak- ing, significantly higher than those during the latter period.
One can conclude that international price move- ments had some, and increasing, impact on local terms of trade; but it was not a dominant factor. By the end of
the 198Os, the ratio between local and international terms of trade was still significantly below the parity of 1976, and although 1987-89 and 1973-75 averages were nearer each other, Turkish farmers were still losers compared with world exporters of agricultural commodities. It also turns out that if local terms of trade had followed international prices during 1981-86, the relative price deterioration of Turkish farmers would have been significantly more serious.
The adjustment pattern of farmers in response to relative price changes is another crucial theme for debates on support policies. It is clear that the deterio- ration of relative prices affected farmers’ investments adversely during the 1980s. By the end of the decade. private investments in agriculture in real terms were less than one-third of the level attained in 1976. Public investments made up some of the deficiency, but still the overall picture is, at best, one of stagnant capital accumulation in agriculture. This would be expected to have adverse consequences for labor productivity. It did not happen during 1976-88, the trough year in terms of TOTA, average labor productivity growth is 1.3% p.a. - a rate which is, however, lower than that observed during the preceding 15 years.
To make up for the adverse impact of investment stagnation on output, farmers increased the intensity of land use in certain areas, but extended cultivation into marginal areas and/or undertook deforestation practices. Thus, as a percentage of the total cropland,

382 WORLD DEVELOPMENT
Table 9. Sectoral tenm of trade movements and the trade regime: index numbers, 1976=100 and shares/rates in percentage
Years 1979 1980 1983 1988 1989 1990 1991
Ind.
Agr.
Serv.
Const.
Trade
T&C
Finance
Housing
Lib. Pr.
Gov’t
E, (X+M)IY
(X+M)JY NP
111.1
90.5
104.6
130.8
93.7
102.4
88.0
195.4
100.6
101.0
83.8
9.3
11.1 -
116.7 123.6 138.5
78.5 73.1 68.9
110.3 109.2 104.9
116.0 119.8 153.0
112.9 115.1 108.0
108.2 121.7 114.9
76.9 96.0 151.0
125.0 124.5 85.6
95.7 98.6 82.8
82.8 61.5 58.5
111.7 153.6 169.7
15.5 24.3 27.8
13.9 15.8 16.4
129.0 119.0 59.0
131.2
75.9
104.3
134.6
109.5
111.5
133.3
69.4
80.5
81.8
154.6
24.9
16.1 -
118.1 117.9
83.4 80.0
105.5 107.6
136.7 147.4
101.9 100.4
109.8 110.8
160.9 202.1
64.8 72.9
80.0 79.7
106.8 117.0
134.4 143.5
23.3 23.2
17.3 16.2
28.7 28.3
* The first 10 rows are index numbers of sectoral relative prices from GDP series. (Each sectoral price index is related to the
GDP’s implicit deflator.) Rows 4-10 are subsectors of the service sector. The last four rows are effective real exchange rate
(TL per dollar, index number), trade/GNP shares in nominal terms, in terms of REER and weighted average of nominal tariff
rates (in percentages) respectively. For Er see Table 2. NP, taken from Krueger and Aktan (1992) is an unweighted average
rate of protection except for the 1990-91 figures which are weighted averages taken from Togan (n.d.). Research assistance
by N. Solakoglu is acknowledged.
the share of irrigated land increased only marginally from 7% to 9% over 1980-89. With shortened periods of fallow, the nutrient capacity of arable soil declined and together with forest clearing, exacerbated the extent of soil erosion.’
Complicating these problems further was the fact that more intensive agricultural practices resulted in the declining immunity of many crops to pest attacks. A typical response to such threats was to increase pes- ticide dosages or the frequency of spraying. This would offer temporary relief but in the meantime would only hasten the trend of pesticide resistance. In the process, farmers have become trapped on what the RFF (1994) refers as “the pesticide treadmill,” cycle of ever-growing dependence on chemicals that offers diminishing returns with consequent increased water pollution, while necessitating higher cash expendi- tures.
(iii) Sectoral relative prices and surplus redistribution
protection (NP) and external trade/GNP ratios (X+&f/y] are indicators presented in Table 9 represent- ing various aspects of the trade regime or the degree of “opening-up” of the national economy. On the basis of the foregoing changes on the trade regime and “open- ing-up,” incorporating significant import penetration as construed from Table 3, an orthodox neoclassical approach would expect relative prices between non- tradeable / tradeable sectors (roughly represented in our table by the relative sectoral price for “services”) and relative prices for industry and trade (incorporat- ing “rents of protection” and commercial margins, respectively) to decline significantly between the early and late 1980s. An improvement for relative prices in labor-intensive agriculture would then take place. 1988 can be set as a reference point by which all these predictions can be tested in view of the real depreciation by 5 1 %, a threefold increase in the share of the external trade from 1979 and a decline by 54% in nominal protection.
Table 9 provides findings on sectoral terms of trade Table 9 shows that orthodox predictions did not movements. The critical issue to be discussed is the take place. The predominantly nontradeable service following: Is the trade regime a crucial determinant of sector’s terms of trade improved by 5% during sectoral prices and, hence, of income distribution? Or, 1976-79 and remained stable thereafter. Industrial and alternatively, do internal and autonomous changes in agricultural relative prices moved in opposite direc- income distribution affect sectoral relative prices with tions, with an improvement in the former and a deteri- the trade regime playing a secondary role, if any? oration in the latter. Trade margins register a signifi-
Real exchange rate (E,) movements, the degree of cant widening, particularly during 1979-88.
TURKEY 3x3
Table 10. Indicators on the redistribution of the surplus*
Years
1976
1977
1979
1980
1983
1984
1985
1986
1987
1988
1989
1990
1991
1992
RIP,,
52.6
54.1
60.4
67.6
50.1
56.3
49.9
48.2
69.5
RIP,
13.4
22.1
53.7
42.0
46.0
39.0
45.2
41.5
42.2
47.3
63.3
-
Fin/GDP TrIGDP
2.2 15.3
1.9 15.4
2.1 15.3
2.0 16.5
2.3 18.3
2.2 19.2
2.2 19.0
2.4 17.9
3.0 20.3
3.3 20.3
2.8 19.7
3.2 19.5
4.2 18.9
4.3 19.1
R/GDP R(r)
2.0 100
6.8 393
7.9 488
8.5 579
8.8 677
8.2 695
9.8 857
10.3 929
8.7 859
P(br)
IO0 247
329
637
618
969
1310
I007
1525
* For symbols and concepts, see text. The first three columns are percentages, the last two columns are index numbers. RIP,,,, and RIP, refer to 500 largest firms in Turkey and to industry in Eskisehir region. respectively. The table is an updated and
adapted (to new GDP series) version of Boratav (1991, Table 1). R/GDP and R(r) are estimated anew on the basis of Temel’s
(1991) findings to which public sector interest payments are added.
We have already analyzed industry / agriculture price relations and therefore only discuss the factors which may have led relative prices for the service sec- tor to violate neoclassical expectations. A very simple answer could be that the components (subsectors) of the heterogenous service sector incorporate different internal distributional dynamics, each of which have affected pricing behavior in a discordant fashion. The composite relative price for the service sector is, there- fore, the outcome of what has happened within each of its components. Internal distributional dynamics emerge as the basic determinant in this respect, whereas the trade regime may act essentially as an indirect one.*
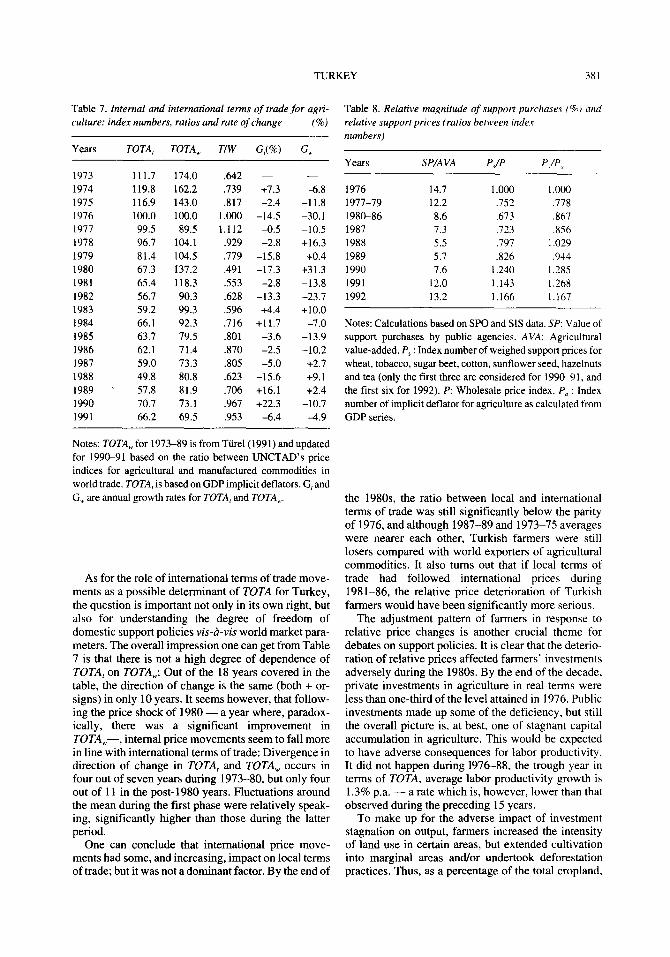
Sectoral terms of trade movements illuminate an important aspect of secondary relations of distribu- tion: Relative price movements of trade and finance vs. industry may provide some evidence with respect to the internal division of the surplus. Here, we inves- tigate this aspect of the redistribution of the surplus between financial, commercial and industrial capital and rentiers more directly. The indicators used are the share of interest costs in industrial gross profits (RIP), the share of finance and trade in GDP (Fin./GDP & Tr./GDP respectively), the share of interest revenues in GDP (R/GDP), interest income in constant prices [R(r)], and (v) profits of the banking sector in constant prices [P(br)]. The relevant findings are presented in Table 10.
The first two columns of the table show that with respect to the internal division of the surplus, a dra- matic progression of interest burden took place at the
cost of industrial profits during the 1980s. Financial capital and rentiers shared the benefits of “financial liberalization.” It should be noted that R/GDP and R(r) figures underestimate the size of interest revenue since they cover only those from time deposits, foreign exchange deposits, government bonds and Treasury bills but exclude interest revenues from investment funds managed by other financial institutions and from the new financial instruments of recent years.
Following the arguments in Akytiz ( 1991) and on the basis of casual observations, we can hypothesize that the typical nouveau n’che whose revenues are mainly of speculative character and based essentially on the ownership of financial assets and/or real estate have a low propensity to invest, exhibit extreme versions of conspicuous consumption and have both the capacity and inclination to switch resources abroad should appropriate conditions emerge. Their increased domination of the economic scene has seri- ous, unpredictable and most possibly adverse conse- quences. The perception of their separate identity is important because it will be primarily this group that is targeted for any serious fiscal reform during the com- ing years.
(c) Destabilizing processes: thefiscal andpnancial systems
(i) Fiscal strains The findings in Section 1 may suggest that Turkish
fiscal deficits were not as serious as that experienced by a number of developing countries during most of

384 WORLD DEVELOPMENT
the 1980s. On the other hand, after the financial col- lapse of 1982 financial liberalization continued at a relatively smooth pace and by the early 1990s had attained an advanced level both internally and exter- nally. Despite these satisfactory appearances, the interrelationship between the fiscal and financial sys- tems had started to create a number of tensions which, by the early 1990s. were leading to serious destabiliz- ing processes.
The following points concerning the changing structure of the fiscal system and the factors leading to fiscal strain are worth emphasizing:
- On the revenue side, it is not the changes in the overall tax burden, but rather those in its structure which have been the characteristic feature of the period covered. Although agricultural incomes were not satisfactorily taxed and payroll taxes con- tinued to be the most productive component, Turkey until 1984 was gradually moving toward a unified and progressive pattern of direct taxation with a direct to total tax ratio of around 57% in 1981. Tax reform in the 1980s reversed these developments. The income tax became drastically less progressive and more fragmented; dividends, interest income on bonds and government bills, realized capital gains on real estate and financial assets were excepted from taxation. Rental and intellectual property incomes and interest revenue on bank deposits were taxed at low and flat rates. Although the corporate tax rate was raised, effec- tive rates were reduced by a variety of exceptions and incentive schemes. On the other hand, the introduction of value-added tax (VAT) increased productivity of indirect taxation, contributing to a 17 percentage point decline in the direct to total tax ratio during 198 l-92. - On the expenditure side, interest payments on domestic debt soared by about four percentage points of GDP during 1979-92, due to ‘financial deepening” under high inflation. Public current spending was in a trough in 1988 mainly due to erosion of salaries, but upward adjustment of salaries and increased resource flow into military / security services pushed it upward again, bringing it to 12.2% of GDP, approximately two percentage points higher than that of the 1979. - Stagnation in tax revenues and increased trans- fer and current spending brought pressures for a downward adjustment of public investments. In relative terms, public investments were nearly halved during I98 l-92 with a heavy incidence on productive sectors. Adjustment in Z, was not suffi- cient however for improving overall balance. Both Zp-S, and PSBR to GDP ratios rose considerably after 1988 reaching 7.2% and 10.4% respectively, in 1991.’ On corrective actions, the government opted for palliatives during 1988-92; e.g., increased rates of monetization, further downward
pressures on Ip and stepping up the privatization campaign.
(ii) Towardfinancial misadventures? There is no doubt that in terms of conventional cri-
teria “financial deepening” has taken place (Cinder and Tiirel, 1993, Table 25). The question is not whether such a process has actually taken place, but rather whether it has resulted in increased efficiency of the financial system.
By the early 1990s the multiplication and diversifi- cation of new financial assets and instruments had taken a chaotic form: two-thirds of all new issues were being realized by the banking sector, the rest within the capital market. To overcome the increased cost of holding deposits, banks started to devise a number of new instruments exempt from compulsory liquidity requirements on deposits. What resulted was the emer- gence of a number of financial instruments offering (under inflation rates around 60%) positive real interest rates for almost perfectly liquid holdings (Yeldan, forthcoming; Sak and Yeldan, 1993). These may be interpreted as flexible methods for overcoming the constraints imposed on banks by the Central Govem- ment. An important by-product was, however, increased resource flow into idle financial assets by firms. A breakdown of the aggregated balance sheet of the 500 largest industrial firms shows that the share of nonindustrial revenues in total revenues averaged 45.0% in 1991-92 in contrast to 17.5% in 1982-83.1° Most of the former consisted of short-term returns on risk-free financial instruments and represent the unnat- ural situation of firms increasingly acting as rentiers.
As will be elaborated below in the discussion on the role of banks with respect to hot money movements, even banks have started to act increasingly as institu- tional rentiers. The share of gross bank revenues or profits from capital market and forex operations and from government bond holdings can be used as an indicator of the phenomenon. During the first half of 1993, gross revenues and profits from these three sources constituted 47.6% and 42.3% of the total.” The share of credit in the total assets of the banking system declined from 51.3% in 1980 to 36.5% in 1992.
On discussing the efficiency impact of financial lib- eralization, a distinction between allocational and technical efficiency will be useful. A narrowing of rate of return differentials between firms and industries would indicate an improvement in allocational effi- ciency. Another indication of improvement would be a reduction in the rates of nonperforming credits, loan defaults and bankruptcies of financial institutions.
During the 1980s the reallocation of credits of the banking system away from agriculture and industry toward construction, housing, transport, tourism and domestic trade does not signify a move in response to differentials in social rates of returns between sectors.

TURKEY 385
Within industrial subsectors, data for the private sector in the 500 largest industrial firms that coefficients of variation of profitability did not decline during 1982-91 (ijnder and Ttlrel, 1993). With respect to the latter indicator, although data coming from banks are unreliable, there is no doubt that financial liberaliza- tion was accompanied by higher rates of loan default Cases of bankruptcies or government-enforced merg- ers to prevent failures were common during the whole period.
Two indicators for measuring the technical effi- ciency of the financial system are proposed: costs of intermediation and real costs to the borrower. Figures on net spread in Akkurt et al. (1991) show that there had not been a permanent improvement in either. 1982 was an exceptionally chaotic year, yet it registered the largest net financial margins. During the relatively controlled period of 1983-87, the average net spread is 8.3 percentage points. The three years following the deregulation of interest rates in 1988, witnessed a sig- nificant widening of the spread. A more detailed breakdown of the components of the net spread shows that it is not labor costs, but rather the upward move- ment in management costs and net profits of the bank- ing system which have contributed to the phenome- non. This is, in our view, persuasive evidence that Turkish financial liberalization did not correspond to a move toward a more competitive environment, but rather vice versa.
Finally, let us note some implications of external financial liberalization. Rentiers, firms and banks are the agents behind hot money movements which have dominated the capital account of balance of payments and external debt growth from the late 1980s onward. Rentiers shift between FX and TL assets and engage in currency switching, capital flight and its return. Firms shift between borrowing in TL or FX locally and/or abroad. Banks - under current conditions - borrow abroad and lend domestically. The relevant rates of return affecting these agents is discussed in Boratav (1993). Except for 1989, the direction of short-term capital movements in response to interest rates and nominal exchange rate changes conform to the expected behavioral pattern.
The magnitude of unrecorded capital movements can be estimated by calculating the divergence between external debt growth and the cumulative cur- rent account deficits after correcting for reserve move- ments, errors and omissions, changes in cross exchange rates and misinvoicing of exports and imports. A study” on hot money movements, esti- mates that (after all aforementioned corrections) dur- ing 1989-91, $3.3 billions of unrecorded capital out- flow had taken place. There are difficulties with the underlying economic mechanisms, but there is no doubt that a liberalized regime of capital movements and erratic interest/exchange rate movements have been building an important element of instability into
the external balances of the economy. This is an extremely unpredictable environment.
The 1989-92 experience shows the serious problems confronting a developing economy which decides to move into full external and internal deregulation in the financial system under conditions of high inflation: “The spectre of capital flight” becomes the dominant motive in policy making and creates commitments to high interest rates and overvaluation. The links of these two policy variables with the real economy, i.e. investment rates and the current account of the balance of payments, are severed. High credit costs not only discourage fixed investment, but also lead to a pattern of factor use which runs counter to environmental pro- tection objectives. When adverse impacts particularly on the current balance become too destabilizing, real depreciation comes on the agenda which, however, needs to be matched by further upward adjustment in the rate of interest if currency switching or capital flight is to be restrained. Instability in exchange and interest rates creates feedbacks which lead the econ- omy further into instability.
The rational solution is to reimpose controls on cap- ital movements. There are, however, strong elements of irreversibility when a liberalized financial system is concerned. Some degree of control on short-term bor- rowing abroad of banks, firms and public agencies can be reestablished, but rentiers are less likely to be con- strained and it may very well be their collective behav- ior which carries the gravest risks of financial misad- ventures.
(d) Trade issues
An exercise at decomposing the factors behind the impressive Turkish export performance concludes that regional composition and product mix effects were either negative or negligible throughout except for 1981-82 when the regional factor prevailed mainly by successful penetration into Middle East markets.” The residual component, as high as 80%, turns out to be the major factor behind the Turkish export perfor- mance.
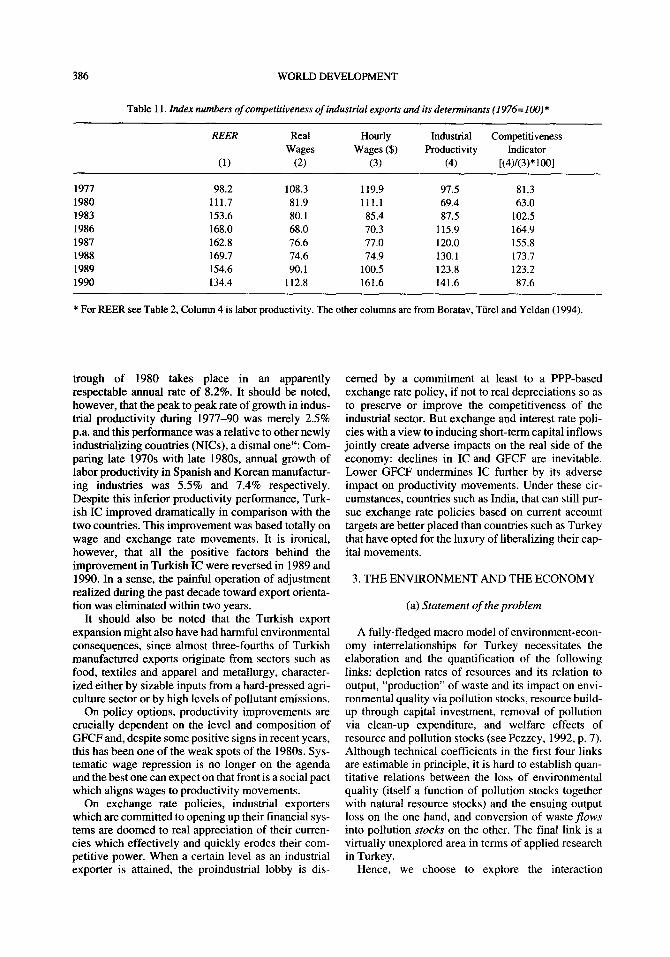
It is this residue which reflects changes in the com- petitiveness of Turkish export sectors. Considering the fact that export growth of the 1980s was based pre- dominantly on industrial goods which now constitute roughly 80% of commodity exports, one should look into changes in the degree of competitiveness of the manufacturing sector in analyzing the export perfor- mance of the Turkish economy. It is comprised, essen- tially, of movements in (i) the real exchange rate (including subsidy components) for industrial exports, (ii) real wages and (iii) labor productivity.
Table 11 shows the improvement in industrial com- petitiveness (IC) during 1980-88 which was, essen- tially, due to real devaluation and wage repression. Tbe productivity improvement starting from the
386 WORLD DEVELOPMENT
Table 11. Index numbers of competitiveness of industrial exports and its determinants (1976=100)*
REER
(1)
Real Wages
(2)
Hourly
Wages ($)
(3)
Industrial Competitiveness
Productivity Indicator
(4) [(4)/(3)*1001
1977 98.2 108.3 119.9 97.5 81.3 1980 111.7 81.9 111.1 69.4 63.0 1983 153.6 80.1 85.4 87.5 102.5 1986 168.0 68.0 70.3 115.9 164.9 1987 162.8 76.6 77.0 120.0 155.8 1988 169.7 74.6 74.9 130.1 173.7
1989 154.6 90.1 100.5 123.8 123.2
1990 134.4 112.8 161.6 141.6 87.6
* For REER see Table 2, Column 4 is labor productivity. The other columns are from Boratav, Ttirel and Yeldan (1994).
trough of 1980 takes place in an apparently
respectable annual rate of 8.2%. It should be noted, however, that the peak to peak rate of growth in indus- trial productivity during 1977-90 was merely 2.5% p.a. and this performance was a relative to other newly industrializing countries (NICs), a dismal one? Com- paring late 1970s with late 198Os, annual growth of labor productivity in Spanish and Korean manufactur- ing industries was 5.5% and 7.4% respectively. Despite this inferior productivity performance, Turk- ish IC improved dramatically in comparison with the two countries. This improvement was based totally on wage and exchange rate movements. It is ironical, however, that all the positive factors behind the improvement in Turkish IC were reversed in 1989 and 1990. In a sense, the painful operation of adjustment realized during the past decade toward export orienta- tion was eliminated within two years.
It should also be noted that the Turkish export expansion might also have had harmful environmental consequences, since almost three-fourths of Turkish manufactured exports originate from sectors such as food, textiles and apparel and metallurgy, character- ized either by sizable inputs from a hard-pressed agri- culture sector or by high levels of pollutant emissions.
On policy options, productivity improvements are crucially dependent on the level and composition of GFCF and, despite some positive signs in recent years, this has been one of the weak spots of the 1980s. Sys- tematic wage repression is no longer on the agenda and the best one can expect on that front is a social pact which aligns wages to productivity movements.
On exchange rate policies, industrial exporters which are committed to opening up their financial sys- tems are doomed to real appreciation of their curren- cies which effectively and quickly erodes their com- petitive power. When a certain level as an industrial exporter is attained, the proindustrial lobby is dis-
cemed by a commitment at least to a PPP-based exchange rate policy, if not to real depreciations so as to preserve or improve the competitiveness of the industrial sector. But exchange and interest rate poli- cies with a view to inducing short-term capital inflows jointly create adverse impacts on the real side of the economy: declines in IC and GFCF are inevitable. Lower GFCF undermines IC further by its adverse impact on productivity movements. Under these cir- cumstances, countries such as India, that can still pur- sue exchange rate policies based on current account targets are better placed than countries such as Turkey that have opted for the luxury of liberalizing their cap- ital movements.
3. THE ENVIRONMENT AND THE ECONOMY
(a) Statement of the problem
A fully-fledged macro model of environment-econ- omy interrelationships for Turkey necessitates the elaboration and the quantification of the following links: depletion rates of resources and its relation to output, “production” of waste and its impact on envi- ronmental quality via pollution stocks, resource build- up through capital investment, removal of pollution via clean-up expenditure, and welfare effects of resource and pollution stocks (see Pezzey, 1992, p. 7). Although technical coefficients in the first four links are estimable in principle, it is hard to establish quan- titative relations between the loss of environmental quality (itself a function of pollution stocks together with natural resource stocks) and the ensuing output loss on the one hand, and conversion of waste flows into pollution stocks on the other. The final link is a virtually unexplored area in terms of applied research in Turkey.
Hence, we choose to explore the interaction
TURKEY 387
between the environment and the economy, alongside with the third (and technically, the best known) link with an emphasis on policy issues for a specific pollu- tant category: We implement an archetype com- putable general equilibrium (CGE) model with rudi- mentary data from OECD sources to study incidences of industrial energy consumption on gaseous pollu- tion. Our conceptualization is based on the empirical regularities between industrial growth and emissions of gaseous pollutants-especially of CO, gases. With respect to emissions of greenhouse gases, Turkey dis- plays typical middle-income country characteristics: with a per capita CO, emission of 2.3 tons, it ranks below the world average of 4.2 tons. Yet, in compari- son along a CO, emissions per $ GDP scale, with its 2.2 kg/$, it fares unfavorably against many OECD countries, where the average lies around 0.8 kg/$. Studies further show that Turkey ranks among those countries where industrial use of commercial energy has risen the fastest during the last decade; and it is cited among the top 25 countries with the highest industrial emissions of CO, in 1991 (RFF, 1994, Table 11.8).
Although the energy and other factor prices in post- 1980 Turkey could be said to “correctly” reflect rela- tive scarcities of inputs, technological input choices concerning energy use did not respond to this relative price configuration at all. It was argued in section 2 (b) above that, in addition to the technological constraints. oligopolistic behavior may serve as a significant explanatory factor in the observed upward trend of industrial emissions of gaseous pollutants in Turkey. Under such a setting, industrialists command market power which, by shifting the burden of taxation on final consumers, can negate theoretically sound envi- ronmental policies based on market incentives.
Thus we suggest the working hypothesis that, as an indirect instrument of pollution control, the market mechanism will likely to have limited effects at best, given the Turkish socieconomic reality. Under such circumstances, we conceptualize the use of direct quantitative restrictions emission by setting explicit targets. We utilize the CGE model both to solve for the necessary tax rate to sustain the target emission level, and also to study the general equilibrium effects of this policy maneuver. We aim at investigating the conceiv- able effects of feasible environmental policies through a series of “what if’ scenarios using the general equi- librium model on a discrete time path, 1987-2000. To this end we first present the model’s distinguishing specifications.
(b) The CGE model specification
The model used in our environmental policy simu- lations is a discrete-dynamic CGE model with empha- sis on the real sectors. It is designed to capture the
level of gaseous (CO, NO* SO,) emissions resulting from industrial activity, as well as the returns to envi- ronmental policy to limit such emissions.
The model is based on five production sectors; three types of private households; (i.e. the rural class eam- ing agricultural value-added, industrial labor, services labor and two urban capitalist classes, industrial and commercial/Iinancial, capturing the sectoral (residual profits) and the government. A CES composite good formulation is adopted for import versus domestic consumption. Likewise, domestic export supply is determined via a transformation frontier with a con- stant elasticity between the domestic consumption and export. Private consumption demand follows fixed sectoral shares with the underlying assumption that agents have Cobb-Douglas preferences. Aggregate public consumption and investment are fixed exoge- nously.
Two sources of environmental pollution are distin- guished: first, CO,, SO,, and NO, gases are emitted in constant proportions to aggregate industrial output. Second, CO, emissions are further recognized in energy use, as constant proportions of intermediate energy input. Admittedly, this approach imposes a very severe rigidity into the model, since restricting emissions amount to restricting industrial output sup- ply. Conceptually, as noted in Bergman (1991), emis- sions of pollutants can be regarded as a distinct factor of production with an imputed elasticity of substitu- tion between other factor services. The nature and fea- sibility of such environment-friendly, “green” tech- nologies, however, still constitute an unsettled issue and given the lack of sound evidence and supporting data, we chose to assume proportional emission rates in the model solutions. Furthermore, following Gunter, van Nieuwkoop and Wiedmer (1992), the level of aggregate CO, emissions is assumed to depend on the amount of the pollutant-emitting inputs used, but is independent of the technology applied. Given the traditional factor contents of the industries, we are of the opinion that accommodating substitution possibilities across inputs are small for countries such as Turkey which have not yet completed diversifica- tion of their industrial base.15 Thus, given our charac- terization, the specification error in inferring CO? emissions from industrial activity can be small. The emissions data are documented in Table 12.
Product and factor markets are modeled following the classic hypotheses of me CGE literature: a CES aggregation of capital and labor for value-added and a separable specification for intermediate input use through fixed coefficients. For manufacturing indus- try, producers are hypothesized to command oligopo- listic mark-up pricing power and set price as average variable costs plus mark-ups. As suggested above, non-competitive behavior seems to be an important factor in explaining environmental abatement by Turkish industrialists in the 1990s. With market price

388 WORLD DEVELOPMENT
Table 12. Gaseous emissions and otherpollutants
from industrial processes in Turkey (late 1980s)
Ratio to Ratio to
Aggregate industrial worker
level* outputt employed*
Emissions from industrial activity
CO, 126,078 2.322 44.588
SO* 354 0.007 0.125
N4 175 0.003 0.062
Ratio
aggregate
Aggregate energy
level* demand?
Emissions from energy production COZ 28140 21.158
Sources:RPP(1994:Table24.1and24.5);OECD(1991:19).
Notes: * thousand metric tons.
t tons per million 1987 TL.
$ tons per worker-year employment.
determined a priori, industrial output is then demand- determined through endogenous movements of the rate of sectoral capacity utilization.
In the factor markets, urban wage is assumed to be fixed exogenously in nominal terms. Thus, with mark- up pricing possibilities and the nominal wage rigidity, there is a nonhomogenous inflationary effect on the real economy.
Given our discussion with respect to the behavior of mark-ups in section 2(b) above, we identify the changes in the nominal wage rate and the unemploy- ment rate (as a proxy for capacity utilization) as the main factors determining the changes in the mark-up rate. In the between period, dynamic stage of the model, we update the mark-ups and the (nominally fixed) urban-industrial wages using the observed rate of previous period inflation.16
In an attempt to capture the fiscal strains of the state, aggregate public spending is treated as fixed, giving rise to fiscal deficit. The inflation tax, which is based on the endogenous solution of the aggregate price level, serves as the major adjustment mechanism in bringing forth the necessary transfer of resources from the private sector.
The overall model is brought into equilibrium through endogenous iteration of product prices, the rural wage rate and the foreign exchange rate to clear the product markets, the rural labor market, and the current account. With nominal wage fixity, urban
labor market clears on the short side via adjustments of urban employment. Labor hire decisions of firms are based on real wage calculations along profit-maximiz- ing rules.
(c) Investigation of atemative policy scenarios
We now investigate the macro incidences of alter- native policy scenarios, contrasting these against the benchmark path of the unchanged practices scenario over 1987-2000. The simulations are implemented via parametric manipulations of selected policy parame- ters around their “base-run” values. We examine three sets of issues: first, we look at the continued stance of relying on the indirect price (dis)-incentives, and study their longterm efficacy as instruments of emissions control (El). Second, we conceptualize an active envi- ronmental policy stance and introduce explicit targets to restrict aggregate CO, emissions in industrial pro- duction, to be sustained by the introduction of a direct carbon taxation scheme per ton of CO, emitted (E2). We rely on the CGE model to solve for the equilibrium carbon tax rate, given emissions restrictions. Finally, we inquire into an alternative closure rule in the prod- uct markets, and contrast the effects of competitive vs. oligopolistic mark-up pricing (E3).
The growth path of the economy with current trends and current tax policies is spelled out in the “base-run” scenario. Here, the economy is totally driven by its endogenous dynamics of capital accumulation and population growth. Furthermore, we make the simpli- fying assumption that the exogenous foreign exchange variables, such as capital inflows and world prices remain unchanged at their initial 1987 levels. Under these assumptions, industry grows at an annual rate of 0.7%,” and energy at an annual rate of 4.8% over 1988-2000. Unemployment rate fluctuates around 13%; private consumption grows by 1.8%, and private investment by 1.2%, per annum. CO, emissions from industrial production reach to a total of 138.5 thousand tons, and aggregate gaseous emissions of CO,, SO*, and NO* add up to 17 1.7 thousand tons in 2000.
We first implement a parametric increase of the pro- duction tax rate in energy by 100% (El). We observe from Table 13 that the aggregate macro effects of this policy maneuver remain mild, and the net environ- mental effects are quite meager. Achieved rate of reduction of the CO, emissions in industry turns out be about 0.2%. Here the model captures the possibilities of profit maintenance at the technical level. With mark-ups, industrial relative price remains technically fixed and does not signal any change in real activity. This relatively weak response of gaseous pollution to indirect tax administration further suggests that the “marginal abatement cost” curve for such pollution may be low and/or flat, an observation which had been generalized for many developing economies in Taylor (1992).

TURKEY
Table 13. Environmental and macroeconomic indicators under altemativepolicy scenarios
389
Annual rates of growth, 1988-2000
1987 Base (bil.TL) run El E2 E3
Co, emissions*
from industry
from energy use
126079.6 0.69 0.67 0.36 a.24 28140.2 1.06 1.05 0.86 0.39
Total gaseous emissions* 154748.8 0.75 0.73 0.45 XI.11
Reduction rate in CO> emissions (relative to the base run)
from industry (%) - -
from energy use (%) - 0.19 4.45 11.70
0.23 2.91 8.68
Carbon tax ratet - 37010 37010
Production
Agriculture
Energy
Industry
Services
13824.7 2.61 2.61 2.30 2.46 3616.3 4.80 4.79 5.50 4.52
54292.9 0.70 0.69 0.37 a.23 32212.6 1.42 1.41 0.91 1.28
Capacity utilization in
industry (%)$ 100.0 97.1 97.6 99.8
Unemployment rate (o/o)* 13.7 12.8 13.4 17.4
100.0
19.0
Aggregate consumption
Private
Public
46835.5 1.80 1.70 1.61 1.51
6019.3 1.19 1.18 5.50 2.51
Agregate investment
Private
Public
7895.7 1.21 1.10 3.80 0.65
9164.8 1.58 1.50 2.61 1.59
Government’s fiscal balances
Budget revenues
Expenditures
Fiscal deficit$
19298.5 1.11
23010.6 1.20
2769.0 2.18
1.19 4.69 2.29
1.20 3.81 2.03
1.98 -5.10 0.24
* Million metric tons.
t TWton, 1987 prices, introduced in 1988. Average over 1988-2000
f Average over 1988-2000.
5 Net of foreign borrowing.
We next introduce a carbon emissions ceiling in of about 4.7%. The model solutions reveal that the industry together with a direct tax on CO, emissions equilibrium carbon tax rate to accommodate emis- (E2). Technically the equilibrium tax rate should be sions restriction follows an exponential path. and interpreted as the shadow price of the emissions con- reaches up to 74.700 TL (1987 prices) in 2000, from trol constraint. We introduce the carbon emissions its initial level of 2,800 TL in 1988. The tax brings an ceiling at half the annual rate of growth of the base-run immediate additional source of 355.8 billion (1987 path. Given the base-run accumulated increase of TL) in 1988, 2% of government’s total revenues of 9.3% of industrial CO, emissions between that year. By the end of the period, however, revenues 1987-2000, this means aggregate emissions savings from green taxes reach to 9621.5 billion (1987 TL);

390 WORLD DEVELOPMENT
which amount to 30% of total government revenues, or 11% of the gross domestic product.
Given constant proportions of pollutant emission, the policy effectively reduces the growth rate of indus- trial production to half of its base-run value, and squeezes industrial value-added. Furthermore, with extra public revenues of green taxes, fiscal deficit nar- rows and the aggregate price level falls sharply. This price deflation is the major mechanism in adjusting the domestic economy to the new environmental policy. With the mark-up predetermining the relative price of industry vis-ri-vis other sectors, increased average costs lead to a severe deterioration of the terms of trade for agriculture and commerce. Consequently, non- industrial growth slows down. Urban unemployment rate increases by six percentage points, and equilib- rium rural wage rate is reduced by half in real terms.
Clearly, under our rigid assumptions the environ- mental policy has direct and binding implications for industrial output and should be seen as the upper bound of policy effectiveness. In real life applications, we would expect both political and technological responses on the part of industrialists, issues that we are unable to capture.
The potential size of the CO, tax revenues brings forth the issue of its disposition through government expenditures. In the current policy environment, rev- enues were simply added to the budget with no accommodating changes in the administration of existing taxes. Consequently, the enhanced revenue base found itself a vent in increased public consump- tion, a conceptualization which also represents the current Turkish reality of disinvestment by the state sector. One can also speculate on the use of carbon tax revenues to finance, for instance, trade liberalization or reducing accumulated debt. Under additional experiments that we do not report here, we tried to substitute the carbon tax for the current tariff protec- tion and observed that the simultaneous use of a car- bon tax with tariff reduction leads to a more severe acceleration in the path of the equilibrium carbon tax as compared to the previous experiment. This is because with tariff liberalization, aggregate demand increases and with Keynesian demand-determined adjustment in industry, output supply is stimulated. To maintain the existing level of restrictions on industrial emissions, hence on output supply, the shadow price is bid up. With rate of growth in industrial production effectively checked to the level of that in E2, other macro indicators also maintain their trends. Thus, we obtain similar rates of growth in other sectors, and the rural economy and the urban labor market continue to bear the burden of adjustment.
Finally, we turn our focus to the issue of market structures. In many modelling exercises of environ- mental decision making, commodity and factor mar- kets are commonly assumed to be perfectly competi- tive. But, noncompetitive or missing market structures
and politicized (regulated) managerial practices, often based on imperfect and biased information, are perva- sive facts of life. As argued earlier, in most Third World countries, the entrepreneurial class is itself a politicized agent created by the state apparatus, and the very process of noncompetitive profit-seeking behav- ior emanates from the cultural, social and economic conditions which regenerate themselves in various forms. Turkey, as discussed earlier, continues to suffer from noncompetitive producer behavior based on rent- seeking (see, inter alia, Yeldan, 1993). In the current specification of the model, we try to capture such behavior through the oligopolistic mark-up determina- tion of producer price in the industrial sector.
Under E3, we implement a parametric change in the market specification, and allow for competitive mar- ginal cost pricing rules in all sectors. To be able to con- trast the CO2 emission savings obtained under E3 with those of E2, we impose the solution rates of equilibrium carbon tax of E2 parametrically. Thus, given the CO, taxes solved under E2, E3 now solves for the achieved CO? savings obtained under competitive conditions.
Given the same rates of green taxes, reductions obtained in aggregate CO, emissions are higher under the (hypothetical) competitive configuration. As Table 13 attests, oligopolistic producer behavior leads to a potential reduction in CO, emission savings of 7.2% in industry, and 5.9% in energy, relative to the base run. In fact, aggregate emissions of gaseous pol- lutants are effectively reduced under the competitive setting (at a rate of 0.1%). Under the presence of oli- gopolistic pricing rules, per contra, existing policies fail to generate substantive savings in gaseous pollu- tion. The mark-up effectively protects the industrial profits and by fixing the relative price of industrial output against the other sectors, secures labor employ- ment and maintains the existing level of production.
Thus, production and employment losses are milder under the oligopolistic environment of E2. Under competitive configuration, effective CO, taxation results in a more pronounced contraction of the econ- omy, and unemployment increases, on the average, by 6.2 points over the base run. Thus, one can conclude that, environmental policy, which fails to achieve the desired results within an oligopolistic economy, can succeed in promoting its objectives under competitive conditions, albeit at significant output loss. Given oli- gopolistic pricing opportunities, producers can shift the burden of taxes to the final consumers, and to the extent that their profit margins are secured, emissions by polluting industries may persist, counteracting the expected desirable results of the environmentally sound policy instruments.
It is a well-accepted fact that current global warm- ing due to carbon emissions is inherently a problem of “global commons”; and unless the potential major contributors to this process - many of them being newly industrializing Third World economies such as
TURKEY 391
India, China and Mexico - are brought under control, individual attempts to secure a pollution-free atmos- phere will fail. To the extent that pervasive noncompet- itive markets enable private interests to diverge from social objectives, environmental policy based on mar- ket incentives alone will not to achieve the desired ends.
4. CONCLUSION
Turkey’s post- 1980 experience with structural adjustment has been seen as a success story by many institutional and individual observers. Our study high- lights a number of problems and weaknesses usually disregarded by these circles. A distinguishing feature is the association of liberalization measures with chronic instability: high and fluctuating inflation rates and erratic changes in the current account of balance of payments have been pervasive features of the econ- omy when the economy was moving further and fur- ther toward liberalization.
Looking into issues related to dynamics of income distribution and accumulation, it seems that the observed weaknesses are not merely due to a neglect
of stabilization objectives. There are inherent difficulties with the neoliberal structural adjustment model, at least in the Turkish setting. A number of neo liberal expecta- tions with respect to resource allocation, rent-seeking, income distribution and growth potential failed to mate- rialize. A contradiction between the &uctmal ch;nacter- istics of the Turkish society and the simplified world of the neoliberal theory is, at least partly, responsible.
A similar interpretation is possible with respect to environmental issues. To the extent that market struc- tures in Turkey diverge from the competitive model, environmental policies based on market incentives will not achieve desired ends. An active state appears to be the answer to many of the problems confronting the economy during the recent period.
It is, however, well worth reflecting whether there is any practical sense to talk of economic policies with a longer perspective and which run counter to the inter- nationally prevailing conventional wisdom. Critical analysis is, as always, a powerful tool for interpreting and understanding the world; but, at this particular juncture, it is very doubtful whether it will have any impact on changing the world in which we live.
NOTES
1. For a similar kind of phasing, see ijnder and Ttirel(1993, pp. 123-128).
2. Ttirel (1989) tends to interpret the passage into the third period as a shift from a demand-constrainedxprice to a sup- ply-constrained/flexprice regime.
3. Parameters and variables estimated, used and derived for this decomposition exercise can be found in Borav. Ttirel and Yeldan (1994, pp. 11-12).
4 In a recent econometric study on the subject, Akinci (1933, p. 45) concludes that “during (1963-91). ., the com- plementary character of public and private investments pre- vails over their substitutability.” For earlier studies in the same vein, see Conway (1990), Uygur (1991) (who also finds tradeoffs between private manufacturing and housing invest- ments) and Anand er al. (1990).
5. For estimates of stagnant ICOR’s during the decade fol- lowing the late 1970s. see Uygur (1993, pp. 48-49).
6. The bulk of electricity production in Turkey is carried out by thermal power stations (almost 60%). The quality of coal used in thermal plants is known to be of low grade with high sulphur content. The Ministry of Environment estimates, for instance. that about 45.000 tons of SO, are emitted annually from a typical coal-operated plant with 100 MW power capacity (Ministry of Environment, 1991). Thus, primary energy production has a serious detrimental effect on the environment.
7. For similar observations, see Kazgan (1992, pp. 337-343).
8. See Boratav (1991, Table 1) for similar results using slightly different aggregations.
9. The deviation between 1,-S, and PSBR is due to the inch- sion of a number of quasi-transfers and accounting categories which are not covered in the former, but included in the latter. Also note that in Table 4 of Section 2. PSBR was defined as I&.
IO. ANkX (September 3. 1993).
I 1. ANKA. (October 18. 1993 I.
12. ErdemO993).
13. These findings are from an OECD study as quoted by Arslan and Celasun (I 992).
14. The international comparison of competitiveness is from Boratav, Ttirel and Yeldan (1994).
15. Under CGE modeling exercises, pollution savings com- ing from such price-sensitive substitution possibilities are expected to be rapidly overcome by parametric fixity of input-output relations in intermediate input use.
16. Formally, wage and mark-up adjustment mechanisms are bet as follows:

392 WORLD DEVEMPMENT
W,= W,_,((I+P,,)-a(l-~,P’-‘.~~,
r,= Q-1 (l+P,_,)
A full algebraic exposition of the model is given in Yeldan (1994).
17. It has to be noted that the base-run path should not be
wbereW,P,uandrstandforthenomioalwage.inflationrate, taken as a “‘projection” of the economy into 2000, but rather
tmemploynkmt rate and the (nominal) mark-up ratio. a is an should be regarded solely as a “reference” point for policy
adjustment m and A is the difference operator. simulations; since we abstain fmm issues of exogenous tech- nical change and focus on capital accumulation and labour
Ma+dation by substituting Pout yields force expansion as sources of growth.
r, = ‘r-1 Iw, + (l+u,,) &I A%,1 1 w,,
REFERENCES
Aktncr, A., “private sector investments in Turkey,” Indus- rrial Yearbook ‘93 (in Turkish), (Ankara, TC Kalktnma Bankast, 1993).
Akkurt, A. er al., “Developments in the Turkish banking see- tar: 19~1990,” K. Aydo&m and H. Ersel, Issues on Bunking Structures and Competition in a Changing World (Ankara: TCME!. 1991).
Aky& Y., “Financial liberalization in developing countries: A neo-Keynesian approach,” UNCTAD Discussion Paper, No. 36 (1991).
Anand, R. et al., “External balance and growth in Turkey: Can they be reconciled?,” in Artcanlt and Rodrik (Ed%), The Political Economy of Turkey (New York: Macmillan, 1990).
Ancanlt, T. and D. Rodrik (Editors), The Political Economy of Turkey, London and New York, Macmillan (1990).
Arslan, I. and M. G&sun, “Sustainability of industrial exports in a liberalizing economy,” Mime0 (Paris: OBCD, 1993).
Aydo&n, K. and H. Ersel, Issues on Banking Structure and Competition in a Changing World (Ankara: TCMB, (1991).
Bacha, E.L., “A three-gap model of foreign transfers and the GDP growth rate in developing countries,” Journal of Development Economics, Vol. 32 (1990), pp. 279-296.
Bergman, L., “General equilibrium effects of environmental policy: A CGE-modelling approach,” Environmental and Resource Economics, Vol. 1, No. 1 (1991) pp. 43-61.
Boratav, K., “External financial liberalization in developing countries: Some adverse consequences,” METU Studies in Development, Vol. 20, Nos. l-2, (1993) pp. l-18.
Boratav, -K., “Income distribution in the 1980s: A macro- analvsis,” in TUSES. Social Democratic Solutions in the Turkish Economy, Vol. III (Istanbul: TUSES. 1991), in Turkish.
Boratav, K. and 0. Turel, “Growth projections for the Turk- ish economy under alternative scenarios,” Mimeo (Ankara, 1989).
Boratav, K., 0. Turel and E. Yeldan, The Turkish Economy Towards the Next Millenium: A Balance Sheet, Problems and Prospects, A Study Prepared for WIDER. Ankara. (Ankara: WIDER, 1994).
Boratav, K. and E. Turkcan (Eds.), New Dimensions of Industrialization and Public Enterprises (Istanbul: Yurt, 1993) in Turkish.
Conway, P., “The record on private investment in Turkey,” In T. Artcanlr and D. Rodrik (Eds.) The Political Economy of Turkey (New York: Macmillan, 1990).
Erdem, N. Hot Money Movements and Capital Flight M.A. Dis-
settaion (Ankara: University of Ankara, 1993) in Turkish. Gunter, S., R. van Nieuwkoop and T. Wiedmer, “Social inci-
dence and economic costs of carbon limits, a computable general equilibrium analysis for Switzerland,” Environ- mental and Resource Economics No. 2 (1992). pp. 569-591.
Gibson B., “Methodology for the next round of papers,” Mimeo for Medium Term Development Strategies, Phase II Project (Helsinki: UNU/WIDER, 1991).
Kaytran, M., Impact of Taxes on Income Distribution, MA Dissertation (Ankara: University of Ankara, 1993).
Kazgan, G., “Current trends and prospects in Turkish agri- culture,” METU Studies in Develoument. Vol. 19. No. 3 (1992). pp. 337-360.
Koc, Y., Unionization and Collective Bargaining Agree- ments in Turkey, I-1991 (Istanbul: Friedrich Ebert Stiftung, 1992).
Krueger, A. and 0. Aktan, Swimming Against the Tide (San Francisco, CA: ICS Press, 1992).
Ministry of the Environment, Turkey: National Report to UNCED (Ankara: Government Printer, 199 1).
OECD. Environmental Indicators Paris: OECD, 1991). Onder, I. and 0. Tiirel, Public Finance, Financial System and
Policies in Turkey (Istanbul: Yurt, 1993) in Turkish. Pezzey, J., “Sustainable development concepts: An eco-
nomic analysis,” World Bank Environment Paper, No. 2 (Washington, DC: The World Bank, 1992).
Resources for the Future (RFF), World Resources, 1992-1993: A Guide for the Global Environment, Wash- ington DC: REF. 1994).
Sak, G. and E. Yeldan, “Reflections on asset-backed securiti- zation in Turkey: Results of a financial CGE model,” METU Studies in Development, Vol. 20, No. 3. (1993) pp. 325-356.
Taylor, L., “The World Bank and the environment: The World Development Report, 1992,” Mimeo Cambridge, MA: (Massachusetts Institute of Technology, July 1992).
Temel, A., “Developments of factor incomes: 1980-1990.” Mimeo (1991) in Turkish.
Togan, S., Foreign Trade Regime and Trade Liberalization in Turkey in the 1980s Research Series No. 1 (Ankara: Turk Eximbank, n.d.).
Turel, O., “Policy components in factor and commodity mar- kets and income distribution,” in TUSES. Social Democ- ratic Solutions in the Turkish Economy (Istanbul: TUSES, 1991).
Tiirel, O., “Growth and cycles in the Turkish economy in the 1980s: A synthesis,” in T. Bulutay (Ed.) Sadun Aren Festschrifr (Ankara: Mulkiyeliler Birligi, 1989) in Turkish.

TURKEY 393
TijSE.5, Social Democratic Solutions in the Turkish Econ- omy, Vol III(Istanbu1: TOSES, 1991), in Turkish.
Uygur, E., “Liberalization and economic performance in Turkey,” UNCTAD Discussion Paper, No. 65 (1993).
Uygur, E., “Policy, trade and growth in Turkey: 197&1990,” Mimeo (1991).
World Bank, World Development Report 1992 (New York: Oxford University Press, 1992).
Yeldan, E., “How the doctor’s prescriptions may fail: Envi- ronmental policy under alternative market structures,” Bilkent University, Department of Economics, Discussion Paper, No. 94-10 (Ankara: Bilkent University. March 1994).
Yeldan, E., “Conflicting interests and structural inflation: Turkey, 198&1991,” Pakistan Development Review, Vol. 32, No. 3 (1993). pp. 303-327.
Yeldan, E., “Financial liberalization and fiscal repression in Turkey: Policy analysis in a CGE model with financial markets,” Journal ofPolicy Modelling (forthcoming).
Yeldan, E. and G. Bakan, “Industrialization, energy demand and environmental pollution under Turkish structural adjustment: A case study with implications to other coun- tries,” Bilkent University Department of Economics. Dis- cussion Paper. No: 93-2 (Ankara: Bilkent University. Jan- uary 1993).

![0305-750x(90)90014-o] Stuart Corbridge -- Post-Marxism and Development Studies- Beyond the Impasse](https://static.fdocuments.in/doc/165x107/577cd9311a28ab9e78a2f452/0305-750x9090014-o-stuart-corbridge-post-marxism-and-development-studies-.jpg)