DIION PAPER ERIE - IZA Institute of Labor Economicsftp.iza.org/dp11126.pdfDIION PAPER ERIE IZA DP...
37
DISCUSSION PAPER SERIES IZA DP No. 11126 Vladimir Gimpelson Rostislav Kapeliushnikov Age and Education in the Russian Labour Market Equation NOVEMBER 2017
Transcript of DIION PAPER ERIE - IZA Institute of Labor Economicsftp.iza.org/dp11126.pdfDIION PAPER ERIE IZA DP...

DISCUSSION PAPER SERIES
IZA DP No. 11126
Vladimir GimpelsonRostislav Kapeliushnikov
Age and Education in the Russian Labour Market Equation
NOVEMBER 2017

Any opinions expressed in this paper are those of the author(s) and not those of IZA. Research published in this series may include views on policy, but IZA takes no institutional policy positions. The IZA research network is committed to the IZA Guiding Principles of Research Integrity.The IZA Institute of Labor Economics is an independent economic research institute that conducts research in labor economics and offers evidence-based policy advice on labor market issues. Supported by the Deutsche Post Foundation, IZA runs the world’s largest network of economists, whose research aims to provide answers to the global labor market challenges of our time. Our key objective is to build bridges between academic research, policymakers and society.IZA Discussion Papers often represent preliminary work and are circulated to encourage discussion. Citation of such a paper should account for its provisional character. A revised version may be available directly from the author.
Schaumburg-Lippe-Straße 5–953113 Bonn, Germany
Phone: +49-228-3894-0Email: [email protected] www.iza.org
IZA – Institute of Labor Economics
DISCUSSION PAPER SERIES
IZA DP No. 11126
Age and Education in the Russian Labour Market Equation
NOVEMBER 2017
Vladimir GimpelsonNational Research University Higher School of Economics and IZA
Rostislav KapeliushnikovNational Research University Higher School of Economics and IMEMO
ABSTRACT
IZA DP No. 11126 NOVEMBER 2017
Age and Education in the Russian Labour Market Equation1
This paper deals with age and educational dimensions of the labour supply in Russia
and explores two time periods: from 2000 to 2015 (retrospective), and the next 15 years
(prospective). For our analysis we exploit the micro-census (2015) data and all LFS waves
covering the retrospective period. Combining demographic projections with expected
employment rates and data on educational achievement we forecast the employment
composition up to 2030. If recent past changes in both age and education have contributed
to economic growth, their effect is likely to be negative in the next 15 years. These two
dimensions are directly associated with such challenges as ageing and over-education of
the labour force. Russia is not unique here, but it is more exposed to both dimensions than
are many other countries due to its demographic and educational developments. The paper
concludes with several tentative policies that could ease, although not cure, the problem.
JEL Classification: J11, J21, J24
Keywords: age, education, employment, over-education, aging, Russia
Corresponding author:Vladimir GimpelsonThe Centre for Labour Market StudiesHigher School of Economics20 Myasnitskaya StMoscow 101000Russia
E-mail: [email protected]
1 The paper is a draft chapter for the projected book “Perspectives on the Russian economy under Putin”. The
authors acknowledge support from the NRU-HSE Basic Research Program and appreciate comments and suggestions
both from participants of the conference in Stockholm (June 2017) and from Michael Alexeev, Susanne Oxenstierna,
and Thomas Remington.

2
1. Introduction
Economic growth and successful modernisation depend on the quantity and quality of the
labour supply; these are shaped primarily by the age and the education of the labour force. Younger
and better educated labour is more productive, more entrepreneurial, and more innovative than are
older and less trained workers. When young age and better education coincide, these two
dimensions strongly complement each other. However, they are directly associated with such
challenges as ageing and the slowdown in growth of educational attainment, which most developed
and some emerging economies are facing. Russia is not unique in facing these challenges but it
seems to be even more exposed to them than are many other countries, due to peculiarities of
demographic and educational developments.
The purpose of this paper is to explore the evolution of the labour supply in Russia through
the lenses of age and education and to outline its potential implications for economic growth. The
Russian economy has got stuck at the crossroads of modernisation and stagnation, and it seems that
an energetic and well-educated labour force is a vital condition for the country to resume moving
along its former path. Although the shortage of such a labour force can become an additional
constraint, for which few remedies are available, this problem has not been well understood yet.
In this paper we look at 2000–2015 and project the changes during the next 15 years (2016–
2030). In the retrospective period, the Russian economy enjoyed an enormous demographic
dividend that supported high growth rates. The size of labour force and levels of employment rose in
absolute numbers. The demographic dependency ratio was on the decline, while the fraction of the
most productive age groups within the employed population was on the rise. New age cohorts that
were entering the labour market had a much larger proportion of workers with tertiary education
than did the older cohorts that were exiting the workforce. The total demographic contribution to
economic growth was positive and accounted for one third of the GDP growth during 1997–2011,
according to the World Bank (2016). In 2011, the GDP in constant prices was 85 per cent higher
than in 1997 (Rosstat, 2016a) and, if World Bank estimates are correct, almost 30 per cent of the
GDP growth can be attributed to the demographic change.
In the middle of the 2010s, these fortunate trends stopped and even reversed. The working-
age population started shrinking, affecting employment negatively, ageing raised the dependency
ratio, and the age composition of employment shifted towards older groups. Large-scale contraction
of youth in the labour market is a threat to the expansion of entrepreneurship, innovation activity,
and technology diffusion. Meanwhile, educational attainment cannot rise forever and is unlikely to

3
compensate for demography-induced losses in the future. Therefore, instead of a double dividend
that contributes earlier to economic growth, the double penalty appears to be the most plausible
perspective option.
Two main messages come from the analysis. The first concerns long-term constraints on the
labour supply, i.e., a fall in the growth of the working age population, which brings little ‘optimism’.
These constraints are predetermined by demography, and even the first-best policy intervention can
mitigate them only partially. The second message is more ‘optimistic’, since the negative impact is
likely to be somewhat smaller than one might expect. Fortunately, the ageing of the total population
is not fully equivalent to the ageing of those in employment and their trends can diverge in the
future.
The analysis presented in the paper uses a wide set of data sources. It includes the micro-
census data (2015) and all labour force surveys (LFS) covering the retrospective period. Using
demographic projections from the Russian state statistical service (Rosstat) up to 2030 we can
forecast the age and educational composition of the employed population over the next 15 years.
Two important surveys are utilised to estimate returns to education. These are the Russian
Longitudinal Monitoring Survey (RLMS-HSE), which covers 2000–2016, and the so-called October
Wage Survey (OZPP), conducted by Rosstat, which covers 2005–2015.
The paper consists of introduction, two substantive sections and conclusions. Tables and
figures are collected in Appendix. Section 2 discusses retrospective and prospective changes in the
size and the age structure of the Russian employed population. Section 3 looks in the same spirit
into the educational attainment of the labour force and explores prospective interaction between age
and education. Conclusions sum up the preceding sections and discuss tentative policies to mitigate
the adverse effects.
2. Age dimension of employment
2.1. Almost ‘brilliant’ past
For Russia, the beginning of this millennium was marked by a gradual population contraction, from
146.3 million in 2000 to 142.7 million in 2009. The population size then grew to 143.7 million by
2014 and reached 146.4 million in 2015, due to the takeover of Crimea (Rosstat, 2015).
The age composition of the population during the most recent 15 years did not remain
constant either. The share of individuals under the working age, which is currently 16 to 54 for
women and 16 to 59 for men, decreased from 19.4 per cent in 2000 to under 18 per cent in 2015; in

4
the meantime, the share of those above the working age increased from 20 per cent to 24 per cent.
This resulted in a shrinking of the working age population (WAP) from 60 to 58 per cent.
The economic activity of individuals changes as they age. Participation and employment
rates are typically low for younger people; they stay very high and relatively stable for individuals
within the age brackets from 30 to pre-retirement, and then they go down again. This results in a
bell-shape with a long plateau in the middle. High participation/employment rates signal that the
working potential is fully utilised.
Figure 1 presents absolute numbers for employment and changes in employment across 5-
year age groups in 2000–2015. The increase in employment rates or the employment to population
ratio (e/p) in the main working age groups compensated for absolute losses in population (if the
inclusion of Crimea is not taken into account) and even brought some employment growth. For the
most recent 15 years, total employment, according to the LFS based estimates, grew from 65.3 to
72.3 million, or by 7.1 million (Rosstat, 2016).
Figure 1 about here
The observed employment growth was achieved during the economic boom of the early
2000s, being simultaneously its outcome and one of the drivers. The columns of the histogram show
absolute changes in employment. As we can easily see here, the pre-retirement and retirement age
cohorts made the largest contribution to the total employment growth, but one of the most
productive age groups, 25–34, expanded their employment by 5 million (Figure 1). The employment
contraction of the 35–49 age group was smaller than that gain and cannot change the principal
conclusion. Therefore, the economy enjoyed double benefits, both due to an increase in the total
employment and due to a rising share of the young prime-age cohort (this cohort had a very high e/p
ratio). However, the age composition in general did not move in a favourable direction, showing
clear signs of ageing (Table 1). The fraction of young workers, those aged 15–24, dropped by 4.6
percentage points during 2000–2015, while the fraction of the old (50 and over) increased by 8.2
percentage points, from 19.2 to 27.4 per cent. What follows from this fact is that the radical ageing
of the workforce that many observers expect in the future has already occurred, and the Russian
economy has adjusted to this change.
Table 1 about here

5
Figure 2 presents employment rates over age groups for the years 2000, 2008 and 2015
and their change over time measured in percentage points (Rosstat, Labour Force Surveys).
Visual inspection suggests the following:
Figure 2 about here
First, during the most recent 15 years, the employment rate increased in all groups over
25 years of age, with the highest gains being in the group aged 55–59 years. Young people
under 25, on the other hand, decreased their participation, and the decline was the largest
among the youngest.2 Second, the increase in the employment rates took place mainly in the
first half of the 2000s, or before 2008. It was supported by a growing labour demand during the
boom, when the rapid wage growth could drive up the substitution effect. After 2008, the e/p
ratios for younger ages continued to decrease. The contraction could be driven by the outflow
of youth from employment to education when the slide into stagnation began (the income
effect). Meanwhile, the fraction of youth aged 15–24 in the total population fell also, from
about 16 per cent in 2000 to 10 per cent in 2015. This reduction was shared between
employment and education and was not to the benefit of the former.
The e/p ratios over age presented in Figure 2 ignore the internal age-related
heterogeneity. To eliminate the impact of observed individual characteristics, we estimate the
simple probit regression, where the dependent variable is the dummy for
employment/nonemployment on age, controlling for education, marital status, children, and
region. The youngest age group is taken as the reference category.
The marginal effects, or changes in employment probabilities, from this regression
(here, we use 2015 LFS data) are given separately for men and women in Figure 3. They rise
sharply for both genders, then stay on a plateau and, starting from the preretirement age, move
down sharply again. In the two older groups, they become negative, meaning that employment
chances in this age are lower than for the youngest group, those aged 15–19. Interestingly, the
line for marginal effects for women goes higher than does that for men, though e/p ratios for
men are markedly higher than are those for women. This means that employment probabilities
2 In 2000, the proportion of students aged 16–19 in full-time education was 72 per cent, and this was
19 per cent for students aged 20-24. In 2015, these indicators were 88 per cent and 35 per cent,
respectively (authors’ calculations based on the Russian Labour Force Surveys’ data).

6
for women change over age more sharply than they do for men if other variables are constant.
In younger groups, this relates to the higher educational attainment of women and to some
delay in labour market entry due to maternity leave.
Figure 3 about here
Summing up this part of the discussion, we can say that, in the retrospective period,
demographic change that affected the Russian employment was very beneficial for economic
growth. As we will see, it will be different in the prospective period.
2.2 Less brilliant future
Understanding the main demographic and employment age-related trends helps us look
into the future. Labour supply depends on two main factors: i) the size of the working age
population and ii) the fraction of the population in employment. Both vary over age and are not
deemed to be constant over time. Knowing both we can estimate the prospective employment
both in the aggregate and by the age groups. Employment in year t is calculated as
, where . Index а is for age group and indexes 0 and t are for the
base and the prospective years, respectively. Е represents absolute employment numbers and
pop represents population size.
What population size is it reasonable to expect? Rosstat provides three prospective
scenarios of population growth based on different assumptions about future fertility, mortality,
and migration. Their resulting estimates are in the range of 143 to 152 million (Figure 4). The
medium scenario that we take as the baseline sees the population size reach approximately 147
million by 2030. Although this scenario does not envisage any further decline for the total, the
structural change within the population in terms of the age composition is expected to be
profound. According to this scenario, the fraction of the population aged 25–39 in the total
economically active population aged 15–72, according to Russian definition, will shrink from
32 per cent to 22 per cent, while the fraction of the older groups will expand correspondingly.
Figure 4 about here

7
Over the last few years, the employment rates have changed little, and the assumption
that they will stay stable looks quite plausible. Even in 2015, when the Russian economy
suffered from the acute crisis, the employment rates (Figure 2) did not show any sizable
reaction and stayed at the levels they had been at before. For our foresight calculation, we can
fix the employment rates at the level of the most recent year (or they can be averaged over a
few recent years) for which the actual data are available, and we take 2015 as the base year.
Depending on which of the above-mentioned Rosstat scenarios we take as basic, the
employment size in 2030 may vary from 63.6 to 67.1 million, with 65.5 in the medium option
(Figure 5). However, all scenarios predict a large employment contraction, and one can hardly
see any alternative, either a stable or an increasing employment trend.
Figure 5 about here
According to the medium scenario, by 2030 (compared to 2015), the contraction can
reach 7.0 million (from 72.3 million to 65.3 million), returning the Russian employment level
to the size it was in the early 2000s. The difference between now and then is that at that time
there were significant reserves of unutilised labour that could be mobilised through a decrease
in unemployment and an increase in labour market participation.
Histogram columns (Figure 6) show absolute gains and losses in employment by age
groups. Major losses are concentrated in ages under 40 years: by 2030, their employment will
shrink by almost a quarter compared to 2015. This loss can be compensated, though partially,
by increased employment in ages 40 and above, by 45 per cent only. The largest contraction is
expected among workers in the very productive age of 25–34 years, in which employment rates
are already very high. This prospect contrasts with what was observed in the previous 15-year
period. In fact, employment of individuals aged 50+ may contract by 1.5 million if the current
retirement policy does not change, while almost the total gain, which can be approximately 4
million, will be concentrated among those in their 40s. Comparing the current (2015) and the
prospective (2030) structures of employment we see little change in the age distribution in both
scenarios. The fractions of young and old workers will barely shift and major changes will be
contained within the middle part of the age distribution.
Figure 6 about here

8
Can population ageing proceed without employment aging? This paradox has real
grounds, and it can be explained by peculiarities of the Russian age structure. The fraction of
elderly persons aged 70+ is expected to increase by 4 percentage points, but is unlikely to add
much to employment numbers, because this age group has an e/p ratio close to zero.
In any case, by 2030, the workforce will be smaller and somewhat older, though better
educated. Employment contraction by 10 per cent within 15 years is unlikely to be painless. We
cannot remember any episode in modern history when the labour supply has dropped at such a
rate in peacetime. Accelerated washout of younger ages from the labour pool aggravates the
employment situation, since the young drive innovations and entrepreneurship. The only
smoothing factor is the fact that this contraction is going to be gradual over time, thereby easing
the adjustment. However, comparing retrospective and prospective changes in the fraction of
50+ year-old workers in the total employment figure, one can conclude that there was more
radical ageing in 2000–2015, when this fraction increased by 8 percentage points, while it will
be more modest in the future and is unlikely to cause higher unemployment among older
workers.
Comparisons of the Russian employment rates with those in the Organisation for
Economic Co-operation and Development (OECD) can provide some hints concerning reserves
for higher economic activity. Unemployment in Russia remains low, with the rates hovering
between 5 and 6 per cent even during crisis times. The employment rate for the 25–54 age
group exceeds that average in the OECD countries by 10 percentage points and is unlikely to go
up further. It is true that employment rates for the 15–24 and 55–64 age groups are 10
percentage points lower than the OECD average for these ages, but these reserves are not easy
to mobilise. The younger group is constrained by high and rising educational enrolment, the
older group suffers from poor health and loss of skills, and the future demand for their services
is not guaranteed.
A better understanding of where Russia stays in terms of e/p ratios for flanking age
groups comes from Figure 7. It ranks the OECD and some partner countries in ascending order
according to the ratio for the 55–64 age group. Employment rates in the 55–64 age group in
Russia are under 50 per cent, being 47.8 per cent in 2015, while they are above 70 per cent in
Scandinavian countries and Switzerland. However, the distance from the OECD average is only
10 percentage points (see above), while the distance from the Eurozone average is even smaller.
Moreover, the Russian e/p rates are comparable to those in many European countries with much

9
higher per capita GDP and with higher retirement ages, e.g., France, Italy, Austria, and Spain,
assuming that the association between the e/p ratio, on one hand, and the per capita GDP and
retirement age, on the other hand, is not automatic.
Figure 7 about here
The comparison suggests that the room for further rises in employment rates is not as
great as it may look. Human capital constraints will negatively affect employment rates even if
the retirement age is raised. For younger groups, higher education has become a strong social
norm that supports high enrolment. More flexible legal regulations of employment could help,
but the overall effect of this measure is hard to predict, and the deregulation itself is a complex
political matter.
Although the age structure of employment is almost predetermined by demography and
by age-related employment rates, an increase in the retirement age can affect employment rates
in the older age groups. The question is how and under what conditions and to what extent?
The legal retirement age in Russia is 55 years for women and 60 years for men, which
is lower than in most other developed and emerging economies. The effective retirement age is
even a few years lower, since multiple categories of workers, such as military, miners, teachers,
doctors, among a few others, are eligible for an earlier pension. Political discussions on
increasing the legal age of retirement have gone on for years, but they have always faced fierce
opposition from the Government and the State Duma. As of the time of writing this paper, it has
become quite evident that there is no alternative to raising the retirement age, but the particular
schedule of the transition to new retirement rules, as well as the contours of a new pension
system in general, remain unclear, despite multiple reformist attempts undertaken since the
early 1990s.
The Russian law allows continuation of paid employment beyond the legal retirement
age, and many individuals complement their modest pensions with full-time or part-time wage
work.3 This means that the expected change in retirement age (if this stipulation holds) will
affect employment rates in new working ages only marginally. We can assume that the further
3 Upward adjustment of the pensionable age leads to temporary loss of pension for those who
are affected by the reform and combine pensions and labour income. The discontent of this
group seems to be a major political constraint on the reform.

10
increase in retirement age will have a positive impact on employment rates, but the scale of the
effect is uncertain without having additional information about the design of the new pension
system. However, one can simulate tentative effects by setting up a few alternative scenarios
for the increase in e/p ratios for the older groups, given the current levels and those that are
observed in the OECD countries (Figure 7).
We may consider three different options for prospective change in the e/p ratio
associated with increasing the official retirement age by 5 additional years for both men and
women. They assume increases in the e/p by 5 either percentage points, 10 percentage points,
or 15 percentage points for the affected age groups, with corresponding implications for
absolute employment quantities. We keep ratios for age groups not affected by a change in
retirement age as fixed at the current level (as for 2015). The age brackets that are affected are
55–59 years for women and 60–64 years for men. Under the first option, i.e., growth by 5
percentage points, the employment to population ratio in affected groups goes up from 52 to 57
per cent for men and from 38 to 43 per cent for women. The second – growth by 10 percentage
points – and the third – growth by 15 percentage points – options raise the employment ratios
further. These rises bring the Russian e/p closer to the OECD averages. Thus, for women aged
55–59, the OECD e/p average is approximately 56 per cent, and for men aged 60–64 it is 60 per
cent. Even in the first and most modest option, Russia reaches the levels observed in Austria,
Belgium, or Finland. In the latter group of countries, the is considerably higher than is the
current retirement age in Russia, and even higher than that proposed in non-public expert
discussions (OECD 2015).
What could the total employment gains in 2030 be compared to the baseline scenario if
the e/p ratios are raised according to these options? How much would such adjustments
contribute to off-setting employment losses driven by the adverse demographic wave? Potential
gains are not large and cannot be guaranteed by a mechanical shift in retirement age. Those in
the disputed ages who have been outside of the labour force and are now considered a tentative
source for labour supply may have low employability, either due to weak human capital or due
to poor health, or both. Bringing them into employment would require additional training
and/or health care efforts, which are not without cost and are not easy to implement.
Each 5 percentage point increase is equivalent to bringing an additional 0.4 million
individuals to employment. The maximum option under consideration would add
approximately 1.2 million workers to total employment. This would be a useful addition, but it
is, nevertheless, much less than the total decline predicted by the baseline option. In this, the
11
most optimistic, case, the employment in 2030 will be smaller than that in 2015 by 5.8 million
workers (against a loss of approximately 7 million in the baseline option). Although even the
partial compensation of the loss can be beneficial, the associated increase in labour supply
should be matched by a corresponding increase in demand. We can assume quite safely that,
under conditions of such contraction in the labour supply, the demand for older workers will
remain stable and will not provoke a rise in unemployment, other things being equal. Indeed,
even an increase in the e/p ratio for old-age workers by 15 percentage points in the course of
the tentative pension reform will boost their share in the total employment by a modest 2
percentage points only.
Summing up this part of the discussion, we argue that, by 2030, the Russian economy
is destined to lose almost one-tenth of the quantity of workers employed in 2015. The most
dramatic part of this story concerns the distribution of employment across age groups. In 2000–
2015, the largest employment gain came about through increased young prime-age and old-age
cohorts. In the next 15 years, the incoming young prime-age cohorts in employment will
contribute to a drastic employment contraction. At the same time, the cumulative fraction of
young and old workers among the entire employed population will hardly change at all. The
long-run downward trend set by demography seems unavoidable and cannot be reversed by any
politically and technically feasible reform of the pension system.
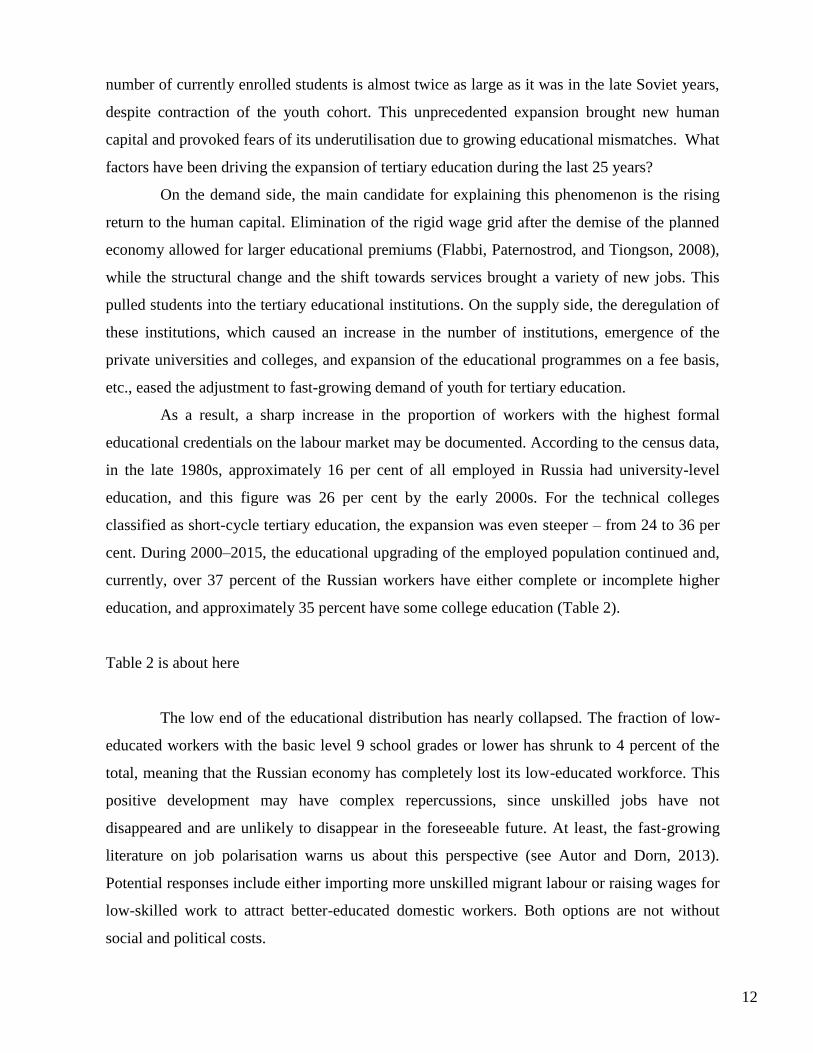
3. The challenge of over-education
High-quality education is an important pre-requisite of modernisation. However, as the
level of educational attainment and the supply of skilled workers rise, the demand for their
services does not always rise. This leads to under-utilisation of the human capital and
educational mismatch. In this case, over-education emerges as another long-term challenge,
with associated socio-political tensions. Emerging and developing economies usually have
larger mismatches than do developed economies, since a low-quality institutional environment
depresses job creation and the demand for skilled labour (McGuinness et al., 2017).
3.1 Anatomy of the educational boom
From 1990 to 2010, enrolment in university-level institutions experienced a real boom:
the number of students increased by 2.6 times, from 2.8 to 7.4 million, doubling for males and
tripling for females (Goskomstat, 2002; Education in the Russian Federation 2016). The
12
number of currently enrolled students is almost twice as large as it was in the late Soviet years,
despite contraction of the youth cohort. This unprecedented expansion brought new human
capital and provoked fears of its underutilisation due to growing educational mismatches. What
factors have been driving the expansion of tertiary education during the last 25 years?
On the demand side, the main candidate for explaining this phenomenon is the rising
return to the human capital. Elimination of the rigid wage grid after the demise of the planned
economy allowed for larger educational premiums (Flabbi, Paternostrod, and Tiongson, 2008),
while the structural change and the shift towards services brought a variety of new jobs. This
pulled students into the tertiary educational institutions. On the supply side, the deregulation of
these institutions, which caused an increase in the number of institutions, emergence of the
private universities and colleges, and expansion of the educational programmes on a fee basis,
etc., eased the adjustment to fast-growing demand of youth for tertiary education.
As a result, a sharp increase in the proportion of workers with the highest formal
educational credentials on the labour market may be documented. According to the census data,
in the late 1980s, approximately 16 per cent of all employed in Russia had university-level
education, and this figure was 26 per cent by the early 2000s. For the technical colleges
classified as short-cycle tertiary education, the expansion was even steeper – from 24 to 36 per
cent. During 2000–2015, the educational upgrading of the employed population continued and,
currently, over 37 percent of the Russian workers have either complete or incomplete higher
education, and approximately 35 percent have some college education (Table 2).
Table 2 is about here
The low end of the educational distribution has nearly collapsed. The fraction of low-
educated workers with the basic level 9 school grades or lower has shrunk to 4 percent of the
total, meaning that the Russian economy has completely lost its low-educated workforce. This
positive development may have complex repercussions, since unskilled jobs have not
disappeared and are unlikely to disappear in the foreseeable future. At least, the fast-growing
literature on job polarisation warns us about this perspective (see Autor and Dorn, 2013).
Potential responses include either importing more unskilled migrant labour or raising wages for
low-skilled work to attract better-educated domestic workers. Both options are not without
social and political costs.

13
Table 3 about here
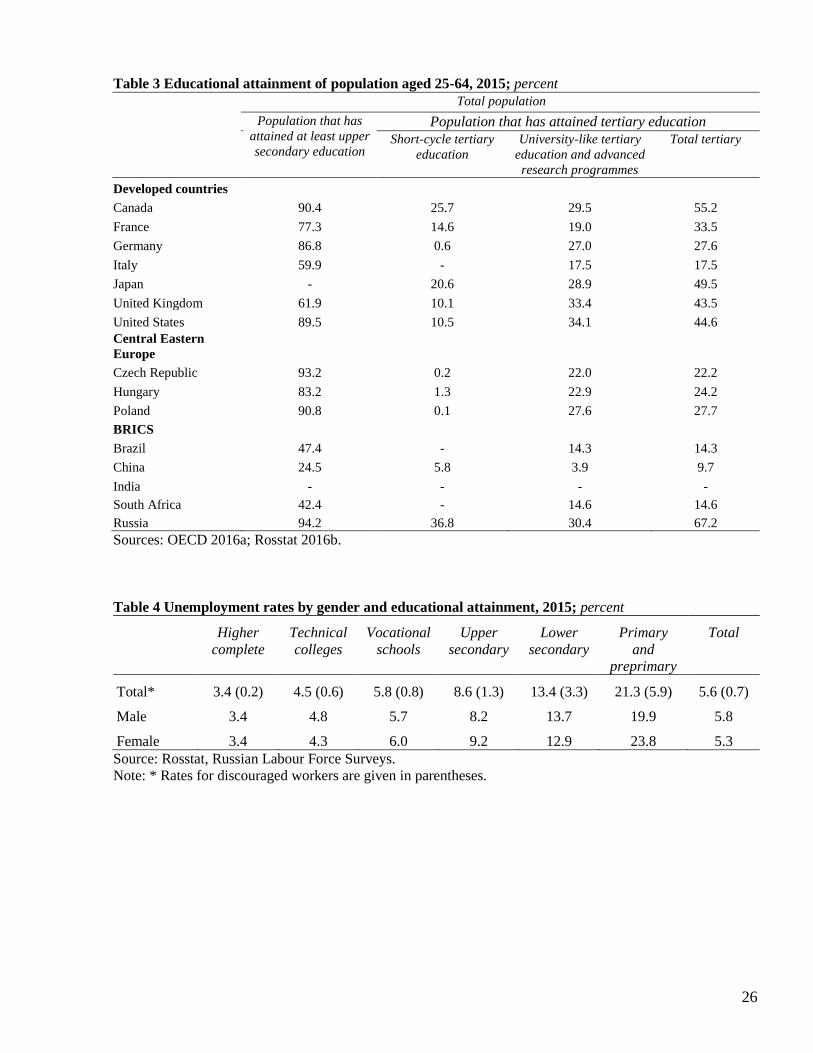
These developments have placed Russia among the leading group of countries,
according to the international comparisons of education (Table 3). In 2015, approximately 95
percent of Russians in the 25–64 age group had an education level that was not lower than
upper secondary. This is the highest proportion for all countries that are monitored and
accounted for by the OECD statistics. Other BRIC countries lag far behind, with this proportion
being under 50 percent in Brazil and under 25 percent in China. The proportion of people with
tertiary education – 67 percent – looks even more surprising; it is higher by 22 percentage
points than in Canada, which comes second, while other post-socialist countries do not reach
even 25 percent.4 All this makes Russia an obvious outlier on the educational achievement
versus per capita GDP plot (Figure 8). There is no other economy that leads in the first
dimension while being a mediocre performer in the second.
Figure 8 about here
3.2 Economic outcomes of educational boom
Expansion of the educated labour supply raises the question whether the Russian
economy has been able to generate enough skilled jobs to absorb the supply. If not, how can
this mismatch be managed and what are the social losses in terms of efficiency of utilisation of
the human capital? These are obvious questions, given the overall mediocre economic
performance and the weak institutional system in Russia.
If expectations of the growing mismatch hold true, falling returns to the human capital
seem an obvious outcome. When the supply of educated labour exceeds demand, a few
reactions are possible. First, excess workers face higher unemployment; second, relative
earnings fall; third, many diploma holders move to less skilled jobs. On the contrary,
maintaining low unemployment, providing large wage premiums, and preserving high
4 The composition of the the Russian educational system provides a partial clue to this paradox.
Short-cycle tertiary education, or technical colleges, constitutes an important component of the
tertiary education; however, even if it is completely excluded, the proportion of university-
level diploma holders (30.4 per cent) leaves Russia as an outsider, high above the general
trendline.

14
occupational status for this segment of the workforce would suggest that the demand for
educated labour keeps pace with the supply (Kapeliushnikov, 2012). Let us look more closely
at the empirical evidence.
What do unemployment rates show? Having a university-level diploma halves the
unemployment risk compared to average workers in the total labour force (Table 4). The risk of
unemployment for those with a level of education no higher than basic is 3 to 4 times higher
than on average. We observe similar variation when looking at long-term unemployment, the
duration of job searches, or discouraged workers. In all cases, the higher level of education
seems like good insurance, and we see no signs for a change in the trend.
Table 4 about here
The unemployment rates broken down by educational groups have moved in parallel
with changes in unemployment for the whole population (Figure 9). Contrary to widespread
alarmist predictions, a mass inflow of university and college graduates has caused no increase
in unemployment for these groups so far. Data presented in Figure 9 suggest that they are
pulled into employment, not pushed out.
Figure 9 about here
Are returns to education declining? Low unemployment rates do not exclude some
negative reaction on the wage side. The decrease in relative wages can be a price paid by
workers for stability of employment and avoidance of unemployment. We explore this issue
using major data sources available to date, including the Russian Longitudinal Monitoring
Survey (RLMS-HSE) and the October Wage Survey (OZPP).5 These two surveys differ in
5 The RLMS-HSE is the nationally representative panel study of Russian households (see more
on survey sampling and design in http://www.hse.ru/en/rlms/). The OZPP survey is the bi-
annual October Survey, conducted by Rosstat, and contains earnings’ data for approximately
750,000 workers in all Russian regions
(http://www.gks.ru/wps/wcm/connect/rosstat_main/rosstat/ru/statistics/wages/labour_costs/). It
covers large- and medium-sized firms only and excludes Agriculture, Finance, and Public

15
design and sampling and are not fully comparable. The RLMS data cover the years 1994–2016
(except for 1997 and 1999), while the OZPP covers 2005, 2007, 2009, 2011, 2013, and 2015.
We start with the ‘canonical’ specification of the Mincer equation that regresses the log
hourly wage on gender, the number of years of schooling, the number of years of potential
experience, and potential experience squared (see note to Figure 10). This specification
assumes that the return to one year of schooling does not vary across levels of education, which
cannot always hold true. For example, one year spent in primary school and one year of
university studies can have different impacts on productivity and wages (Carneiro and
Heckman, 2005: 91). To soften the assumption, we apply the alternative specification, in which
we use levels of completed education, instead of duration of schooling, as our main explanatory
variable. In the latter case, workers with upper secondary education make up the reference
group. Coefficients for our variable of interest (and this is either the number of years or the
level of schooling) is statistically highly significant (p<.01) in all specifications and data sets
utilised.
Returns to schooling, if estimated using the RLMS-HSE data set, varied from 6.7 per
cent to 9.3 per cent in 2000–2016 (Figure 10). They peaked by the early 2000s, when they
exceeded 9 per cent, but they lost 2.5 percentage points by the end of the decade. According to
these estimates, the educational boom of the 2000s trimmed the economic value of education to
some extent. A few factors that amplify each other could be at work here. First, increased
competition among university and college graduates on the labour market could result in
limited demand for their services and, therefore, compress their relative earnings. Second, the
expansion of tertiary education was likely to affect its quality negatively. The rising fraction of
part-time students is a clear indication of this. Third, easy enrolment into university-level
education makes it accessible to low-ability students and pulls in young people with no
educational prerequisites for these studies.
Figure 10 is about here
Although the decline in returns to education looks plausible, and its driving forces are
easy to imagine, the OZPP-based estimates fluctuate around the 10 percent level and show no
Administration, as well as all subcontractors, part-timers, top managers, and all those working
in small businesses with fewer than 15 employees.

16
decrease in returns in 2005–2015 (Figure 11). With this divergence in estimates, we remain
largely agnostic as to whether the returns have actually been falling.6
Figure 11 is about here
One way to explore further how the benefits brought to workers by higher education
evolved is to use an alternative specification measuring the completed education in levels, and
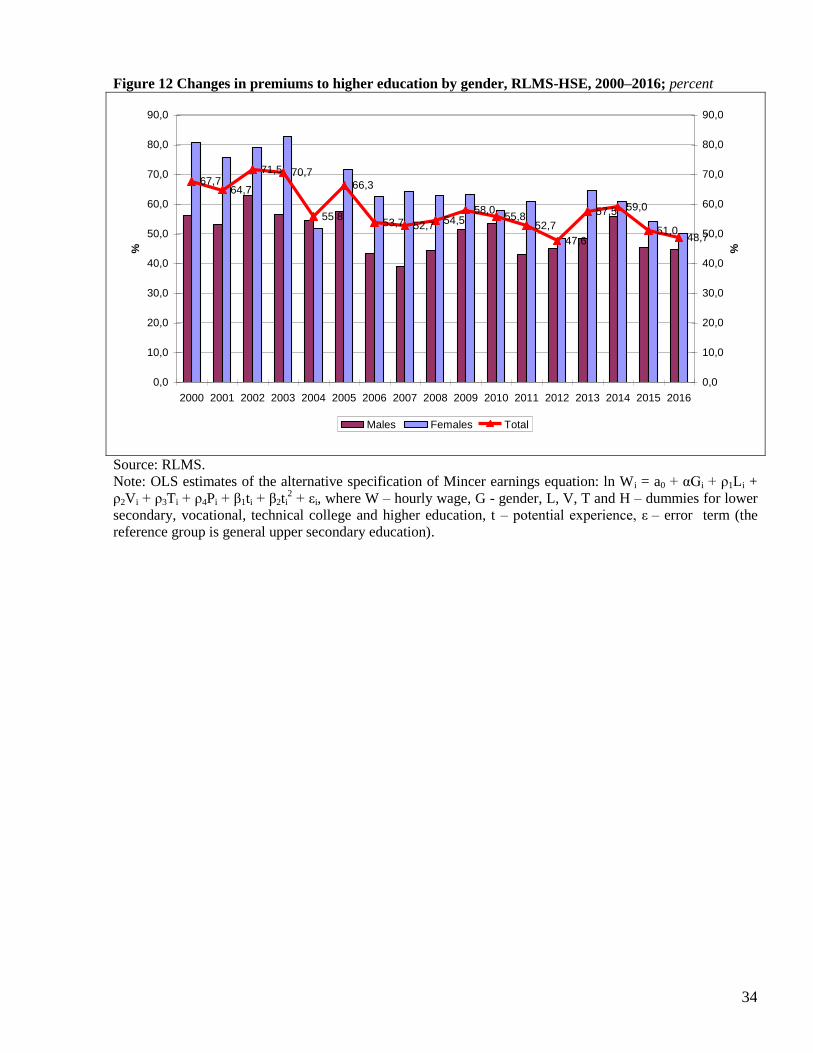
not just in years of schooling (see note to Figures 12–13). Figures 12–13 present educational
premiums or wage advantage for a university graduate relative to an observationally similar
worker with a high school certificate only. These estimates for 2000–2015 are based on the
same two data sets (RLMS-HSE and OZPP) and show a significant wage advantage of holding
a university diploma.
Figure 12 is about here
Figure 13 is about here
The premium fluctuated within the range of 50–77 percent, peaking by the early 2000s,
and then declined gradually to the current level of 55 percent, according to the RLMS-HSE.
The OZPP data set paint a more stable development, with just minor fluctuations within the
range of 73–76 percent. Although the upper bounds for the estimates derived from the
alternative data sets are similar, the lower bounds are not.7 Each of the data sets has its own
sources to bias the results, since they differ both in coverage of the work force (see fn.7) and in
the technology of data collection. The RLMS data come from household surveys, the OZPP
6 For women, the return to education turns out to be higher than it is for men: 7.0 against 6.4
percent in 2016, according to the RLMS-HSE, and 12.3 percent against 8.6 percent in 2015,
according to OZPP (Figures 10–11). Asymmetric returns across genders are typical for most
countries (Dougherty, 2003; Psacharopoulos and Patrinos, 2004).
7 University diplomas yield much higher payoffs for females than for males. According to the
RLMS-HSE, women enjoyed a larger premium to higher education higher than did men. The
difference was approximately 10 percent (Figure 12). This gender gap, as it emerged from the
OZPP data, was even larger: these premiums were close to 90 percent for women and 60
percent for men (Figure 13).
17
data are administrative data. Overall, the OZPP bias seems to be somewhat smaller than is that
of the RLMS-HSE. However, even if we accept the lower estimates, which point to a gradual
decline in the premium over time, the potential gains to employees remain high enough to keep
attracting young people into higher education.
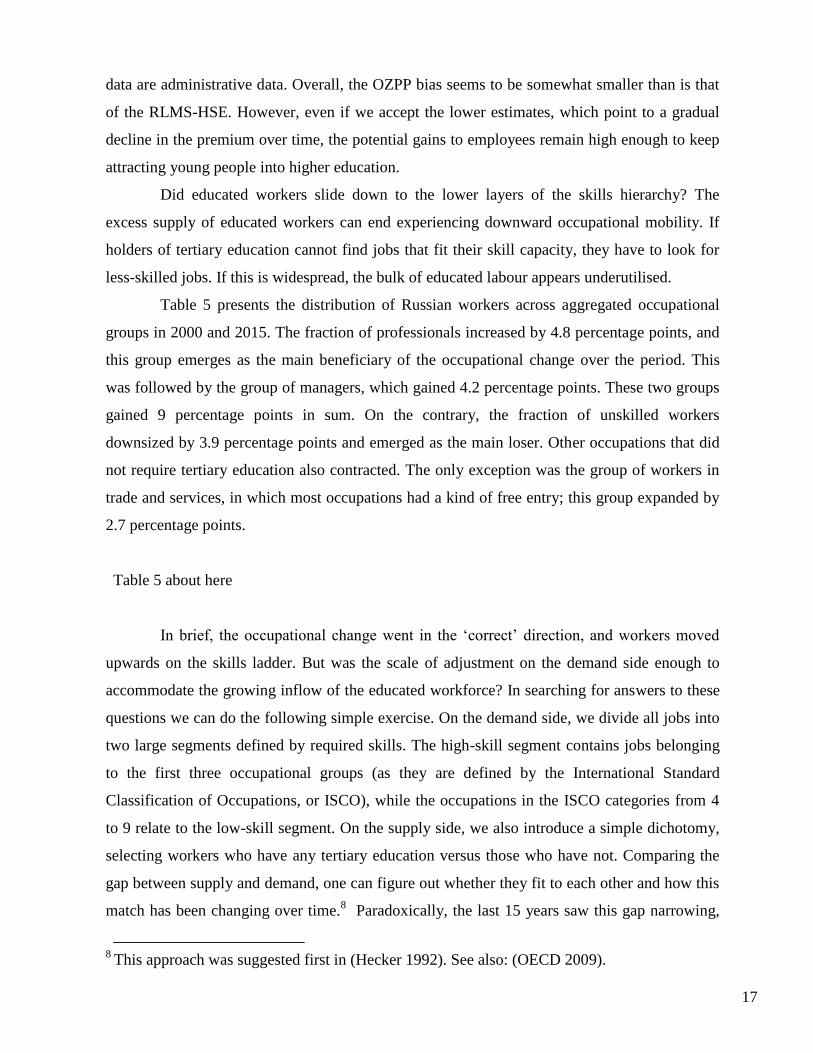
Did educated workers slide down to the lower layers of the skills hierarchy? The
excess supply of educated workers can end experiencing downward occupational mobility. If
holders of tertiary education cannot find jobs that fit their skill capacity, they have to look for
less-skilled jobs. If this is widespread, the bulk of educated labour appears underutilised.
Table 5 presents the distribution of Russian workers across aggregated occupational
groups in 2000 and 2015. The fraction of professionals increased by 4.8 percentage points, and
this group emerges as the main beneficiary of the occupational change over the period. This
was followed by the group of managers, which gained 4.2 percentage points. These two groups
gained 9 percentage points in sum. On the contrary, the fraction of unskilled workers
downsized by 3.9 percentage points and emerged as the main loser. Other occupations that did
not require tertiary education also contracted. The only exception was the group of workers in
trade and services, in which most occupations had a kind of free entry; this group expanded by
2.7 percentage points.
Table 5 about here
In brief, the occupational change went in the ‘correct’ direction, and workers moved
upwards on the skills ladder. But was the scale of adjustment on the demand side enough to
accommodate the growing inflow of the educated workforce? In searching for answers to these
questions we can do the following simple exercise. On the demand side, we divide all jobs into
two large segments defined by required skills. The high-skill segment contains jobs belonging
to the first three occupational groups (as they are defined by the International Standard
Classification of Occupations, or ISCO), while the occupations in the ISCO categories from 4
to 9 relate to the low-skill segment. On the supply side, we also introduce a simple dichotomy,
selecting workers who have any tertiary education versus those who have not. Comparing the
gap between supply and demand, one can figure out whether they fit to each other and how this
match has been changing over time.8 Paradoxically, the last 15 years saw this gap narrowing,
8
This approach was suggested first in (Hecker 1992). See also: (OECD 2009).
18
not enlarging, despite mass inflow of university and technical college graduates.9 Table 6
reports data on how workers aged 25–64 with a tertiary education are allocated across high-
/low-skilled jobs. The allocation in Russia contrasts with that in the OECD countries (OECD
2009).
Table 6 is here
The fraction of “overeducated” in Russian employment in the selected age was
approximately 40 per cent at the beginning of the period and approximately 30 percent by its
end. It is in clear contrast with the OECD average, which is around 20 per cent. Among all
developed countries, only Spain, Canada, and the USA demonstrate a similarly high rate of
underutilisation of a highly-educated educated labour force as the rate seen in Russia. For this
comparison, the Russian technical colleges were considered as tertiary education, with all
caveats applied to this classification.10
However, if we exclude this group from the tertiary
education and only focus on workers with a university diploma, the overeducated fraction in
Russia becomes even less than the OECD average.
The previous analysis did not account for heterogeneity of the labour force. One of the
dimensions directly affecting the overeducation gap is age. Labour market entrants, including
recent graduates, often make up the most vulnerable part of the workforce and face a higher risk
of downward occupational mobility than do either prime-age or older workers. However, the
fraction of workers aged 25–34 with a tertiary education in high-skilled jobs increased by 16
percentage points during 2000–2015 (Table 6). If higher education only is considered, the
change would be virtually zero (under 1 percentage points). The older workers, regardless of
the educational definition, were even less affected.
These estimates suggest that, during 2000–2015, the demand for educated labour in the
Russian economy outpaced its supply. High-skilled jobs were able to absorb the growing inflow
of university and college graduates. Although many young graduates had to accept low-skilled
9 This paradox is discussed in (Gimpelson, Kapeliushnikov 2016).
10 There are two channels of entry into technical colleges: after completing high school and
after completing 9 grades of secondary school. The latter option cannot be classified as part of
the ‘tertiary education’.

19
jobs in the early 1990s, by the middle of the 2010s their chances to get managerial or
professional jobs improved.
3.3. How bright does the future look?
In what direction can the evolution of the Russian human capital proceed? The long-
run supply side effects are set by demography and are path-dependent to the recent educational
trends that we discussed above. Their intersection shows a likely trajectory for the future and
narrows the space for diverging scenarios.
Most students graduate successfully from their universities by their mid-twenties.
Taking a conservative position on the future expansion of higher education, one can assume
safely that all subsequent five-year cohorts (those that were under 25 years old in 2015) will
end up with the same proportion of holders of higher education as was observed for the group
aged 25–29 in 2015. In other words, further educational upgrading will stop at the level of
2015, when about 40 per cent of male workers and 57 per cent of female workers aged 25–29
were endowed with higher education. Although these figures are surprisingly high for a middle-
income country, they reflect reality, and we take them as our basic scenario for the future.
Moreover, we cannot argue that the recent educational expansion is already totally exhausted,
and no further rise is plausible. Our alternative scenario assumes that further educational
upgrading is likely to continue, so that, in all subsequent 5-year cohorts that were younger than
25 in 2015, the proportion of holders of university level education will ultimately be 5
percentage points higher than in the 25–29 age group in 2015. Under these two scenarios, the
total number of workers endowed with higher education can increase by 2030 from the current
27 million to 29.5 million in the first scenario and 31 million in the second.11
Given that the
total workforce is going to contract substantially during the period, the proportion of workers
with higher education will increase from the current 37.4 percent to 43.6–45.4 percent in 2030.
The divergence between educational upgrading and population contraction does not
make our forecasts much more optimistic. In some age groups, the absolute number of workers
with higher education is likely to decrease (Figure 14). For instance, the numbers of each of the
25–29 and 30–34 age groups can decline by about 1.5-2 million persons. If new ideas are
11
The scenario with decreasing educational attainment does not seem plausible, because having
a higher education has become a strong social norm, and the associated economic benefits
remain substantial.
20
generated by educated young prime age cohorts, the stream of innovations will dry out. At the
same time, the increment of workers with higher education among 40 years olds will be huge
enough: nearly 4.5 million. The younger group will be in shorter supply, while the supply of the
older group will increase. If workers of different ages do not perfectly substitute each other, we
can expect changes in relative wages to the benefit of those who are younger.
Figure 14 is here
A huge increase in the proportion of workers with higher education requires adequate
growth in demand for their services. Fast growing GDP during the 2000s made this possible.
Unfortunately, at the time of writing this paper– as prospective stagnation looks like a more
probable option than modernisation – fast GDP growth does not emerge as the most likely
scenario. In this case, the gap between education and productivity, or between supply of
educated labour and its demand, is likely to widen. Actually, firms can react to the further
growth in the supply of formally educated labour in two different ways. They can either ignore
it or respond enthusiastically, creating new and technologically modern jobs at higher rates. In
theory, both options are possible, but an in-between scenario of limited adjustment seems the
more likely one.
If the demand for labour keeps growing, but at a slower pace than it did in the 2000s, it
can lose the race against the change in supply. Massive creation of high-skilled, high-tech jobs
requires huge investments, massive flows of technological and institutional innovations, and a
friendly business climate. These preconditions are currently absent, and their prospects look
gloomy. An expected slowdown in growth rates supports this forecast. The alternative and more
likely long-run scenario sees Russia moving to the structure of employment, with the limited set
of high-skilled, high-paid jobs open to a minority of well-trained job seekers. All other
candidates, regardless of their formal education, will have to take “bad” jobs: low-skilled and
low-paid jobs where complex human capital is not a hotly-required component. This type of
segmented labour market leaves little room for vertical social mobility, since most jobs are
dead-ends but not stepping stones to better occupational careers.
If the labour market evolves in the above-mentioned direction, multiple negative
implications, avoided so far, are pending. These include high unemployment of workers with
tertiary education (due to longer search for better jobs), falling returns to higher education (if
the educational variation disappears), downward occupational mobility, and further extensive

21
expansion in educational enrolment. To get better positions, job candidates will need to secure a
place closer to the top of the educational ladder and be one step ahead of many others. Having a
good formal education will not be enough. This will impel an endless race of individuals for
even higher formal educational credentials. Such evolution will destroy the advantages brought
(so far) by high education and will result in huge efficiency and welfare losses, as well as
unpredictable social and political implications.
4. Conclusions
There are multiple reasons why an economy can either choose the path of
modernisation or is doomed to stagnate. Institutional factors and human capital endowment are
often among priority explanations for prosperity associated with modern technologies and ideas
(Acemoglu and Robinson, 2012). This paper explores how the age and education of the
population shapes the supply side of the human capital for the Russian economy and how these
factors can become long-term constraints for development. As our preceding analysis shows,
whereas the beginning of the century (2000–2015) brought double benefits to the economy – in
terms of both age and education dimensions – the next 15 years are expected to be less
optimistic in this regard and promise a double penalty.
Although demography largely determines the labour supply, as the latter is likely to
evolve by 2030, are there any remedies, if not cures, to mitigate the negative impact? We
believe that there are, although the room for policies is limited, as they are not without political
and financial cost, and the success is far from being guaranteed. Given the expected 10 per cent
employment contraction, addressing the issue of early exit from the labour force is one of the
priorities. A few relevant policy measures in this direction are worth considering. Pension
reform, including a rise in retirement age, emerges as a self-evident option, but, as we
document, it is not sufficient to fill the emerging gap. As we can see, the reserves within the
Russian population are very scarce and are not easy to mobilise. To bring more individuals of
older ages into the labour market, such individuals should be retrained and their human capital
significantly updated. This poses complex challenges in the areas of life-long education and
training, as well as health care. Currently both are problematic and have no simple solution in
the medium-term future. Finally, the supply of labour in these age groups is highly elastic and
sensitive to terms of employment. This brings employment flexibility forward as an important
policy issue. The possibility of working either part-time, or short term, or out-of-office would
be attractive to many older (and younger) persons who do not want rigid attachment. So far, the
22
Russian employment regulations have remained very strict and unfriendly to any non-standard
options and have successfully resisted any liberalisation (Gimpelson and Kapeliushnikov 2013).
Filling the 25% gap in the younger labour force that is going to emerge over the next
15 years, due to the fact that the generation that has recently entered the labour is much smaller,
is an even more daunting task. Larger migration of young workers could be a part of the
potential solution, but the expected contraction is too large simply to fill it with migrants. Any
mass migration is not easy politically, and, in addition, the Russian-speaking pool of foreign
labour is limited and mostly low-skilled. Hopes to turn flows of youth towards employment
instead of education are unjustified. Such a policy, if undertaken, would undermine human
capital in the longer run. More flexible employment and economic restructuring that would
result in more efficient reallocation of younger workers can be a big help, but this measure
itself depends on modernisation, including modernisation of labour market institutions.
To be employable at any age, the human capital embodied in education and skills
should always be up-to-date. One-time large investments into education and training are not
enough on their own, and the whole educational system should be adaptive and highly sensitive
to occupational changes in labour demand. In addition, high rates of job creation are important,
since they reflect demand for labour.
To sum up, the demographic composition of the labour force is not neutral to the
labour market development and shapes long-term factors that either ease modernisation or
increase the likelihood of stagnation. Expected (and almost predetermined) changes in age and
educational composition do not make the hard task of achieving robust economic growth and
complex modernisation of the Russian society any easier. Policies to mitigate the emerging
constraints exist and are well known, although they are always risky and difficult to implement.
However, this choice is always political. All policies mentioned above need friendly and pro-
modernisation institutions that support competition, job creation, and demand for advanced
human capital. So far, this environment is absent, as are preconditions for the remedying
policies.
23
References
Acemoglu, D. and Robinson, J.A. (2012) Why Nations Fail: The Origins of Power, Prosperity,
and Poverty, New York: Crown Publishers.
Autor, D. and Dorn, D. (2013) ‘The growth of low-skill service jobs and the polarization of the
US labor market’, American Economic Review, 103(5): 1553–97.
Carneiro, P. and Heckman, J. (2006), ‘Human capital policy’, in Krueger, A. and Heckman, J.
Inequality in America: What Role for Human Capital Policies?, Cambridge (Mass.):
The MIT Press.
Dougherty, Ch. (2003) Why is the rate of return to schooling higher for women than for men?
CEP Discussion Paper.581.
Education in the Russian Federation (2016), Moscow: HSE Publishing House.
Flabbi, L., Paternostrod, S. and Tiongson, E.R. (2008) ‘Returns to education in the economic
transition: a systematic assessment using comparable data’, Economics of Education
Review, 27: 724–40.
Gimpelson, V. and Kapeliushnikov, R. (2013) ‘Labor market adjustment: is Russia different?’,
in M.Alexeev and S.Weber (ed.), Oxford Handbook of the Russian Economy, Oxford:
Oxford University Press.
Gimpelson, V. and Kapeliushnikov, R. (2016) ‘Polarization or upgrading? Evolution of
employment in transitional Russia’, Russian Journal of Economics, 2: 192-218.
Goskomstat (1989) Results of the All-Union Census of Population 1989. Moscow: Goskomstat
of the USSR . Vol. 3. Education.
Goskomstat (2002) Education in Russia, Moscow: Goscomstat.
Hecker, D.E. (1992) ‘Reconciling conflicting data on jobs for college graduates’, Monthly
Labor Review, 115: 3–12.
Kapeliushnikov, R. (2012) Spros i predlojenie vysokokvalifitsirovannoi rabochei sily: kto bejal
bystree? Chast 2’, Problems of Economics, 3: 120-47.
McGuinness, S., Pouliakas, K. and Redmond, P. (2017) How Useful is the Concept of Skills
Mismatch?, Geneva: International Labour Orgnization.
Psacharopoulos, G. and Patrinos, H.A. (2004) ‘Returns to investment in education: a further
update’, Economics of Education, 12: 111–34.
OECD (2009) Education at Glance, Paris: OECD.
OECD (2015) Pensions at a Glance, Paris: OECD.
24
OECD (2016a) Education at Glance, Paris: OECD.
OECD (2016b) Employment Outlook, Paris: OECD. 2016.
Rosstat (2004) The Russian Census of Population 2002. Moscow: Rosstat. Vol. 3. Education.
Rosstat (2012) The Russian Census of Population 2010, Moscow: Rosstat. Vol. 3. Education.
Rosstat (2015) Demographic Yearbook, Moscow: Rosstat.
Rosstat (2016a) Statistical Yearbook, Moscow: Rosstat.
Rosstat (2016b) Results of the Micro-Census of Population 2015 (www.gks.ru/free-
doc/new_site/population/demo/finish/micro-perepis/ mpn-2015-result.html)
Rosstat (2017) Demographic Prognosis till 2035
(http://www.gks.ru/wps/wcm/connect/rosstat_main/rosstat/ru/statistics/population/demography/
#)
Rosstat (various years) Labour Force Surveys, Moscow: Rosstat.
(http://www.gks.ru/wps/wcm/connect/rosstat_main/rosstat/ru/statistics/wages/labour_force/#)
World Bank (2016) Searching for a New Silver Age in Russia: The Drivers and Impacts of
Population Aging. Washington: The World Bank.
World Bank World Development Indicators
(http://databank.worldbank.org/data/reports.aspx?source=world-development-
indicators)

25
Appendix
Table 1 Distribution of the employed population by 5-year age groups, 2000, 2008, 2015, and 2030,
actual and prospective estimates; percent
15-19 20-24 25-29 30-34 35-39 40-44 45-49 50-54 55-59 60-72 Total
2000 2.6 9.6 12.1 11.6 15.0 15.8 14.1 9.8 4.4 5.0 100
2008 1.6 10.0 13.0 12.6 11.9 12.0 14.5 12.5 8.0 3.9 100
2015 0.6 7.0 14.5 13.9 13.0 12.2 11.4 13.0 9.3 5.1 100
2030 0.9 6.5 9.8 9.5 12.0 16.9 16.1 13.4 8.9 6.0 100
Source: Rosstat 2015.
Table 2 Distribution of the total and employed populations by educational attainment, 1989, 2002, and
2015; percent*
Highest level attained Total Population Aged 15 and
Over
Employed Population Aged 15
and Over
1989 2002 2015 1989 2002 2015
Higher complete 11.3 16.2 25.8 14.6 23.3 34.6
Higher incomplete 1.7 3.1 2.8 1.3 3.0 2.8
Technical colleges 19.2 27.5 31.1 24.3 35.7 34.7
Vocational schools 13.0 12.8 9.2 17.8 15.3 9.8
Upper secondary general 17.9 17.7 17.9 20.8 16.2 14.3
Lower secondary general 17.5 13.9 9.7 13.5 5.6 3.6
Primary 12.9 7.8 3.2 6.7 0.9 0.2
Preprimary 6.5 1.0 0.3 1.1 0.1 0
Total 100 100 100 100 100 100
Sources: Goskomstat 1989; Rosstat 2004; Rosstat 2016b.
* Without persons with unspecified educational levels.
26
Table 3 Educational attainment of population aged 25-64, 2015; percent
Total population
Population that has
attained at least upper
secondary education
Population that has attained tertiary education
Short-cycle tertiary
education
University-like tertiary
education and advanced
research programmes
Total tertiary
Developed countries
Canada 90.4 25.7 29.5 55.2
France 77.3 14.6 19.0 33.5
Germany 86.8 0.6 27.0 27.6
Italy 59.9 - 17.5 17.5
Japan - 20.6 28.9 49.5
United Kingdom 61.9 10.1 33.4 43.5
United States 89.5 10.5 34.1 44.6
Central Eastern
Europe
Czech Republic 93.2 0.2 22.0 22.2
Hungary 83.2 1.3 22.9 24.2
Poland 90.8 0.1 27.6 27.7
BRICS
Brazil 47.4 - 14.3 14.3
China 24.5 5.8 3.9 9.7
India - - - -
South Africa 42.4 - 14.6 14.6
Russia 94.2 36.8 30.4 67.2
Sources: OECD 2016a; Rosstat 2016b.
Table 4 Unemployment rates by gender and educational attainment, 2015; percent
Higher
complete
Technical
colleges
Vocational
schools
Upper
secondary
Lower
secondary
Primary
and
preprimary
Total
Total* 3.4 (0.2) 4.5 (0.6) 5.8 (0.8) 8.6 (1.3) 13.4 (3.3) 21.3 (5.9) 5.6 (0.7)
Male 3.4 4.8 5.7 8.2 13.7 19.9 5.8
Female 3.4 4.3 6.0 9.2 12.9 23.8 5.3
Source: Rosstat, Russian Labour Force Surveys.
Note: * Rates for discouraged workers are given in parentheses.

27
Table 5 Occupational composition of the employed population aged 15-72, 2000 and 2015; percent
Occupations 2000 2015
Managers 4.4 8.6
Professionals 15.6 20.4
Technicians 15.2 15.3
Clerks 3.4 2.9
Service workers 11.8 14.5
Skilled agricultural workers 6.3 3.4
Craft workers 16.3 13.1
Plant and machine operators 13.5 12.2
Elementary occupations 13.5 9.6
Total 100 100
Source: Rosstat, Russian Labour Force Surveys.
Table 6 Percentage of workers with tertiary education employed on high-skilled jobs (ISCO 1-3),
employed population aged 25-64, Russia and OECD countries; percent
Groups by age Increase for
group 25–34,
percentage
points
Increase for
total workers
25–64,
percentage
points
25–34 35–44 45–54 55–64 25–64
Russia-1*
2015 71.0 72.2 70.1 66.9 70.6 +16.2 +12.5
2000 54.8 56.4 61.9 64.2 58.1 – –
Russia-2**
2015. 82.4 86.8 87.7 84.9 85.2 -0.9 +0.1
2000 83.5 84.4 87.3 85.0 85.1 – –
OECD average
2006 79 82 85 86 82 –1 –2
1998 80 85 87 88 84 – –
Notes: * Basic definition: workers with university and technical college diplomas are qualified as having
tertiary education.
** Modified definition: only workers with university diplomas are qualified as having tertiary education.
Sources: Rosstat, Russian Labour Force Surveys; OECD 2009.

28
Figure 1 Employed population by age, 2000 and 2015; thousand
Source: Rosstat, Labour Force Surveys. Authors’ calculations.
Figure 2 Employment-to-population ratios (e/p) by age, 2000, 2008, and 2015; percent
Source: Rosstat, Labour Force Surveys. Authors’ calculations.

29
Figure 3 Marginal effects of age on probability of employment by gender; percent
Source: Authors’ calculations.
Figure 4 Population of Russia 2001-2015 and 2017-2030; million persons
Source: Rosstat 2017.

30
Figure 5 Employment forecast up to 2030; thousands
Source: Authors’ calculation on the basis of the Rosstat’s medium demographic prognosis (Rosstat 2017).
Figure 6 Distribution of employment over age, 2015 and 2030; thousand
Source: Authors’ calculations.

31
Figure 7 Employment-to-population ratios in the OECD countries, 2015; percent
Source: OECD 2016b.
Figure 8 Percentage of population aged 25-64 with tertiary education by GDP per capita, 2015
Sources: OECD 2016a; Rosstat 2016b; World Development Indicators.
y = 9,9626x - 68,831
R2 = 0,3806
0
5
10
15
20
25
30
35
40
45
50
55
60
65
70
8,0 8,5 9,0 9,5 10,0 10,5 11,0 11,5 12,0
log GDP per capita, PPP, 2015 (constant 2010 international $)
Pe
rce
nta
ge
of
po
pu
lati
on
ag
ed
25
-64
th
at
ha
s a
tta
ine
d t
ert
iary
ed
uc
ati
on
, %
, 2
01
5
Russia

32
Figure 9 Unemployment rates by educational attainment, the total labour force aged 15-72, 2000–2016; percent
Source: Rosstat, Russian Labour Force Surveys.
Figure 10 Dynamics in returns to education by gender, RLMS-HSE, 2000–2016; percent
Source: RLMS.
Note: OLS estimates of the “canonical” Mincer earnings equation: ln Wi = a0 + αGi + rSi + β1ti + β2ti2 + εi,
where W – hourly wage, G - gender, S – years of schooling, t – potential experience, ε – error term.
0
2
4
6
8
10
12
14
16
18
20
22
2000 2001 2002 2003 2004 2005 2006 2007 2008 2009 2010 2011 2012 2013 2014 2015 2016
%
Higher education Technical colleges Vocational schools Upper secondary Lower secondary Total
8,6
6,9
8,3
9,3
8,2 8,2 8,0 7,9 7,8 7,9 7,77,3 7,4 7,5 7,4
6,7 6,7
0,0
2,0
4,0
6,0
8,0
10,0
12,0
2000 2001 2002 2003 2004 2005 2006 2007 2008 2009 2010 2011 2012 2013 2014 2015 2016
%
0,0
2,0
4,0
6,0
8,0
10,0
12,0
%
Males Females Total

33
Figure 11 Dynamics in returns to education by gender, OZPP, 2005–2015; percent
Source: OZPP.
Note: OLS estimates of the “canonical” Mincer earnings equation: ln Wi = a0 + αGi + rSi + β1ti + β2ti2 + εi,
where W – hourly wage, G - gender, S – years of schooling, t – potential experience, ε – error term.
10,1 10,1
10,9 11,0
9,7
10,4
7,8 8,0
9,3 9,3
8,38,6
12,6 12,5 12,7 12,8
11,4
12,3
0,0
2,0
4,0
6,0
8,0
10,0
12,0
14,0
OZPP-05 OZPP-07 OZPP-09 OZPP-11 OZPP-13 OZPP-15
%
Total Males Females
34
Figure 12 Changes in premiums to higher education by gender, RLMS-HSE, 2000–2016; percent
Source: RLMS.
Note: OLS estimates of the alternative specification of Mincer earnings equation: ln Wi = a0 + αGi + ρ1Li +
ρ2Vi + ρ3Ti + ρ4Pi + β1ti + β2ti2 + εi, where W – hourly wage, G - gender, L, V, T and H – dummies for lower
secondary, vocational, technical college and higher education, t – potential experience, ε – error term (the
reference group is general upper secondary education).
67,764,7
71,5 70,7
55,8
66,3
53,7 52,754,5
58,055,8
52,7
47,6
57,5 59,0
51,048,7
0,0
10,0
20,0
30,0
40,0
50,0
60,0
70,0
80,0
90,0
2000 2001 2002 2003 2004 2005 2006 2007 2008 2009 2010 2011 2012 2013 2014 2015 2016
%
0,0
10,0
20,0
30,0
40,0
50,0
60,0
70,0
80,0
90,0
%
Males Females Total

35
Figure 13 Dynamics in premiums to higher education by gender, OZPP, 2005-2015; percent
Source: OZPP.
Note: OLS estimates of the alternative specification of Mincer earnings equation: ln Wi = a0 + αGi + ρ1Li +
ρ2Vi + ρ3Ti + ρ4Pi + β1ti + β2ti2 + εi, where W – hourly wage, G - gender, L, V, T and H – dummies for lower
secondary, vocational, technical college and higher education, t – potential experience, ε – error term (the
reference group is general upper secondary education).
Figure 14 Number of workers with complete and incomplete higher education by 5-year age groups,
2000, 2015 and 2030, actual and prospective estimates; million
Source: Authors’ calculations on the basis of Rosstat’s medium demographic prognosis (Rosstat 2017).
0
1
2
3
4
5
6
15-19 20 – 24 25 – 29 30 – 34 35 – 39 40 – 44 45 – 49 50 – 54 55 – 59 60 – 64 65 – 72
2000 2015 2030 (basic) 2030 (upgrading)
75,172,9
76,3 75,7
71,8 72,3
56,3 55,4
63,6 63,260,2
57,7
97,4
93,3 91,9 91,988,8 90,2
0
10
20
30
40
50
60
70
80
90
100
OZPP-05 OZPP-07 OZPP-09 OZPP-11 OZPP-13 OZPP-15
%
Total Males Females