DIION PAPER ERIE - ftp.iza.orgftp.iza.org/dp11969.pdf · and 2011. Consequently, most of the...
35
DISCUSSION PAPER SERIES IZA DP No. 11969 Alex Bryson Lucy Stokes David Wilkinson Is Pupil Attainment Higher in Well- Managed Schools? NOVEMBER 2018
Transcript of DIION PAPER ERIE - ftp.iza.orgftp.iza.org/dp11969.pdf · and 2011. Consequently, most of the...
DISCUSSION PAPER SERIES
IZA DP No. 11969
Alex BrysonLucy StokesDavid Wilkinson
Is Pupil Attainment Higher in Well-Managed Schools?
NOVEMBER 2018

Any opinions expressed in this paper are those of the author(s) and not those of IZA. Research published in this series may include views on policy, but IZA takes no institutional policy positions. The IZA research network is committed to the IZA Guiding Principles of Research Integrity.The IZA Institute of Labor Economics is an independent economic research institute that conducts research in labor economics and offers evidence-based policy advice on labor market issues. Supported by the Deutsche Post Foundation, IZA runs the world’s largest network of economists, whose research aims to provide answers to the global labor market challenges of our time. Our key objective is to build bridges between academic research, policymakers and society.IZA Discussion Papers often represent preliminary work and are circulated to encourage discussion. Citation of such a paper should account for its provisional character. A revised version may be available directly from the author.
Schaumburg-Lippe-Straße 5–953113 Bonn, Germany
Phone: +49-228-3894-0Email: [email protected] www.iza.org
IZA – Institute of Labor Economics
DISCUSSION PAPER SERIES
IZA DP No. 11969
Is Pupil Attainment Higher in Well-Managed Schools?
NOVEMBER 2018
Alex BrysonUCL, NIESR and IZA
Lucy StokesNIESR
David WilkinsonUCL and NIESR

ABSTRACT
IZA DP No. 11969 NOVEMBER 2018
Is Pupil Attainment Higher in Well-Managed Schools?*
Linking the Workplace Employment Relations Surveys 2004 and 2011 to administrative
data on pupil attainment in England we examine whether secondary and primary schools
who deploy more intensive human resource management (HRM) practices have higher
pupil attainment. We find intensive use of HRM practices is positively and significantly
correlated with higher labour productivity and quality of provision, and with better financial
performance, most notably in primary schools, but it is not associated with higher pupil
attainment as indicated by assessment scores at Key Stage 2, Key Stage 4 and value-added
measures based on assessments at these points.
JEL Classification: I21
Keywords: school performance, pupil attainment, value-added, human resource management
Corresponding author:Alex BrysonUniversity College London20 Bedford WayLondon WC1H 0ALUnited Kingdom
E-mail: [email protected]
* We thank the Nuffield Foundation (grant EDU/41926) for funding. The authors acknowledge the Department for
Business, Energy and Industrial Strategy, the Economic and Social Research Council, the Advisory, Conciliation and
Arbitration Service and the National Institute of Economic and Social Research as the originators of the Workplace
Employee Relations Survey data, and the Data Archive at the University of Essex as the distributor of the data. The
views expressed are those of the authors, and all errors and omissions remain the sole responsibility of the authors.
2
1. INTRODUCTION
The last decade or so has seen very substantial innovations in the way education is delivered
in England's schools, perhaps on a scale not seen since the introduction of comprehensives in
the 1960s and 1970s. Those reforms have included releasing many schools from local
authority control via the Academies system (Eyles and Machin, 2015) and, in schools
remaining within local authority control, extending Head Teachers' control over operations
within the school. The approach, which has been dubbed the "self-improving school-led
system" (Greany and Higham, 2018), is premised on the idea that schools are more likely to
prosper when managerial decisions are based on local knowledge of a school's circumstances
and pupils.
The idea that the quality of leadership in schools should and does matter for school
performance is generally accepted and appears uncontentious (Ahn and Vigdor, 2014), just as
it is in other organizational settings.1 The value of good management practices in schools is
less well-understood, partly because the literature is fairly recent and less extensive. In a
recent addition to that literature we established positive statistically significant partial
correlations between the intensive use of human resource management (HRM) practices and
managerial subjective assessments of schools' financial performance, labour productivity and
quality of provision. The associations with financial performance and labour productivity
were also apparent in first difference models based on a two-wave panel of schools over the
period 2004-2011 (Bryson et al., 2018b). However, those analyses did not include measures
of pupil attainment.
1 For some time, economists have argued that the CEOs of listed firms can have a substantial impact on their performance, for better or for worse, not only because CEOs will vary in their own productivity and ability, but because those differences will have spill-over effects on those lower down the corporate hierarchy (Rosen, 1990). It is for this reason that firms spend so much money and effort designing compensation structures and recruiting top executives. Similar claims have been made in other settings, such as the impact of Head Coaches on the fortunes of professional football teams (Bryson et al., 2018a). However, it has proven difficult establishing causal linkages between who leads the organization and its performance.

3
In this paper we examine the links between pupil attainment at school level and intensive
HRM which, we argue below, is an indicator of a school being well-managed. Doing so
requires us to link the workplace surveys (the 2004 and 2011 Workplace Employment
Relations Surveys)2 we used previously to the school-level measures of pupil attainment
available from the Department for Education Performance Tables. Whereas the latter are
comprehensive for maintained sector schools in England, WERS is a relatively small survey.
Consequently, our estimation samples are fairly modest which, in turn, means we rely on
fairly parsimonious models to identify associations between HRM and school performance.
Nevertheless, the models contain features of schools one would wish to control for in seeking
to isolate the association between HRM and school performance including the nature of the
pupils at the school, school size and location, and union density at the school.
Our data contain a range of pupil attainment outcomes, including levels of attainment at Key
Stage 4 and value-added measures for secondary schools and levels of attainment at Key
Stage 2 and progress indicators for primary schools. In most cases, due to changes in the way
performance is measured, those pupil attainment outcomes are not comparable across 2004
and 2011. Consequently, most of the analyses we run are separate regressions for primary and
secondary schools in 2004 and 2011. There is one pupil attainment measure that is common
across both years, allowing us to make direct comparisons in terms of pupil attainment at Key
Stage 4 for schools in 2004 and 2011.
The purpose of this study is three-fold. First, we wish to establish the correlation between
managers' subjective evaluations of their schools' performance and pupil attainment
2 Advisory, Conciliation and Arbitration Service, Department for Business, Innovation and Skills, National Institute of Economic and Social Research (2018) Workplace Employment Relations Survey: 1998-2011: Secure Access [data collection]. 5th Edition. UK Data Service. SN: 6712, http://doi.org/10.5255/UKDA-SN-6712-5.
4
measures. Positive significant correlations between the subjective measures and pupil
attainment might be taken as validation of the subjective measures. That said, the subjective
measures are, as we show below, requesting managerial assessments of their school's
performance relative to their notion of a school average, rather than making judgements about
their absolute performance. They are also asked to rate their schools on financial
performance, labour productivity and quality of service which, while potentially linked to
pupil attainment, are not necessarily highly correlated with it. For these reasons we might not
necessarily anticipate the correlations between subjective and pupil attainment measures of
performance to be very strong.3
Second, we seek to replicate findings from our earlier paper in which we established partial
correlations between managers' subjective assessments of their school's relative workplace
performance - its financial performance, labour productivity and quality of service - and the
intensity with which it deployed HRM. The samples in this paper are smaller which, other
things equal, might make it difficult to obtain a precise estimate of any positive association
with HRM. Furthermore, although the models condition on fewer variables than the earlier
study, those variables include controls for the nature of the pupils in the school which we did
not previously observe, thus permitting us to recover any HRM association over and above
that which might be correlated with the characteristics of the pupils attending the school.
Third, we extend the earlier paper by looking at links between HRM intensity and pupil
attainment. This is important since many analysts and policy-makers consider the education
of children to measurable academic standards to be the primary aim of the schooling system.
3 Forth and McNabb (2008) conducted a similar analysis for the for-profit sector comparing WERS metrics with accounting metrics of performance from the Annual Business Inquiry. In general, they found positive and statistically significant correlations.

5
They are certainly the primary indicator by which the government judges schools'
performance.
We found managers' subjective assessments of their schools' performance to be positively
and statistically significantly associated with pupil attainment in both primary and secondary
schools, although this varied depending on the measure and year. We were also able to
replicate the statistically significant partial correlations between HRM intensity and
managers' subjective assessments of schools' performance. However, HRM intensity was not
associated with pupil attainment levels or value-added. The findings raise some important
questions about the value of HRM investments for schools, particularly if schools are
primarily judged and resource allocations made on the basis of schools' positions in pupil
attainment league tables. A case for HRM investments would be easier to make if policy-
makers and parents placed at least some weight on the productivity of school staff and the
quality of its output.4
The remainder of the paper is organized as follows. Section Two briefly reviews the literature
on school performance and the role played by HRM. In Section Three we present our linked
WERS-pupil attainment data and discuss estimation issues before presenting our results in
Section Four and concluding in Section Five.
4 There is limited information about the weight parents attach to schools' relative ranking in pupil attainment because direct information on parental choice is not available. However, Allen et al. (2014) estimate that between 5% and 10% of secondary and primary school students could have attended a higher-performing school with spare capacity in their local area.

6
2. LITERATURE AND HYPOTHESIS
In the past the literature on the role of management practices in school performance has been
limited by the absence of data on practices in schools. This began to change in the United
States with growing interest in what appeared to be the relative success of Charter Schools
which operate under a charter outside the usual public school governance structures. Like
Academies in England, Charter Schools' governance arrangements gave Head Teachers and
their governing boards the scope to experiment with managerial practices which some
thought might be of benefit in public schools. In a series of field experiments Fryer (2014,
2017) found value-added in traditional public schools in Houston rose following the adoption
of five managerial practices that were common in high-achieving Charter Schools (namely
increased instructional time, a more rigorous approach to building human capital of teachers
and administrators, high-dosage tutoring, frequent use of data to inform instruction, and a
culture of high expectations) (Fryer, 2014). In a second field experiment involving 58
schools in Houston Fryer (2017) found intensive school principal training in relation to
instructional planning, data-driven instruction, and observation and coaching raised school
value-added at a low marginal cost to schools.
These field experiments provide plausibly causal evidence of the value of particular
management practices in schools in the United States. Although random assignment of
educational interventions is increasingly common in schools in England due to the work of
the Education Endowment Foundation, to our knowledge there are no studies to date
replicating the random assignment of management practices that are akin to those conducted
by Fryer in the United States. However, there is evidence of a partial correlation between
management practices and school performance in a study by Bloom et al. (2015) which

7
focuses on high schools in eight countries including England. They find substantial variance
in management practices across and within countries, with the latter determined in large part
by differences in school governance (particularly accountability for performance) and school
leadership. They confirm that management practices are linked to higher school value-added.
They focus on twenty practices falling into one of four domains: operations, monitoring,
target setting and people management (which relates largely to the management and
incentivising of talent). They find a linear association between management practice
intensity and pupil attainment.
The Bloom et al. (2015) study is particularly notable because, although their inventory of
management practices was tailored for a school setting, they broadly conform to management
practices that they found positively associated with a range of economic outcomes such as
higher profitability, improved labour productivity and lower closure rates in the for-profit
sector (Bloom et al., 2017). In a similar vein, Bryson et al. (2018b) found HRM intensity was
positively associated with managers' perceptions of school performance in much the same
way as it was associated with managers' perceptions of performance amongst "like"
workplaces outside the schools’ sector. The implication is that the intensity with which HRM
is implemented can be beneficial for organizations of different types and that, perhaps, the
literature which argues that the success of management practices is contingent on the degree
to which they “fit” with other internal features of the organization, or “external” factors such
as the market it operates in (Delery and Doty, 1996), may not be well-founded.
In the light of this literature we hypothesise that pupil attainment will be higher in schools
that deploy HRM more intensively. This should be the case in both primary and secondary
schools and in 2004 and 2011.

8
3. METHODS
In this section we introduce our data, present the key measures used in our analyses, and
describe our estimation strategy.
3.1 Data
We link survey data from the schools in the Workplace Employment Relations Surveys
(WERS) in 2004 and 2011 to school-level pupil attainment data from the Department for
Education Performance Tables.5
Appropriately weighted, WERS is a nationally representative survey of workplaces in Britain
with 5 or more employees covering all sectors of the economy except agriculture and mining
(van Wanrooy et al., 2013). Survey weights have been devised for each element of WERS to
account for sample selection probabilities and observable non-response biases (Van Wanrooy
et al, 2013: 212-3). However, we present unweighted analyses because our schools-only data
set which is confined to workplaces sampled in WERS which we can link with the
performance tables is unlikely to be representative of schools in general, even when survey-
weighted. Our analyses should therefore be treated as within-sample estimates, rather than
estimates that might be extrapolated to the population of schools as a whole.6 For
information, Table 1 presents descriptive statistics of our pupil attainment measures both for
the schools in our sample as well as for all schools.
The WERS data are cross-sectional, based on management interviews conducted face-to-face
with the most senior workplace manager responsible for employee relations. The 2011 survey
interviews were conducted between March 2011 and June 2012 (van Wanrooy et al., 2013)
and the 2004 survey interviews were conducted between February 2004 and April 2005
5 Available at: https://www.gov.uk/school-performance-tables 6 We also ran our analyses survey-weighted. The results were not substantively different to those presented here. They are available on request.

9
(Kersley et al., 2006). Schools are identified in the survey using their five-digit Standard
Industrial Classification. We distinguish between primary schools and secondary schools.7
There are 406 schools in the pooled cross-sectional data, over half of which are primary
schools (Appendix Table A1). However, we lose a large proportion of these when we link
the data to the pupil attainment data. This happens for a number of reasons, which we
discuss in further detail in the appendix. First, not all respondents in WERS give permission
for their data to be linked to other sources. Second, some of the 406 schools in WERS are
private sector and our focus is on the maintained sector (and for which we have data on
attainment and school characteristics). Third, our pupil attainment data are only available for
schools in England so that those in Scotland and Wales drop out of the analysis. Fourth, the
pupil attainment variables are generally only available for primary and secondary schools, not
the technical and vocational education workplaces which also appear in WERS. Finally, the
matching procedure relies on fuzzy matching using postcode data because there is no unique
numeric identifier in both data sets which would allow us to construct a clean match. The
postcodes of workplaces participating in WERS are available on the secure access version of
the WERS data made available through the UK Data Service Secure Lab, and so we use these
to match to school postcodes, which are publicly available (using the postcodes available on
the performance data files). In many cases, there is just one school located at each postcode,
and so we can be fairly confident in the accuracy of this match. In some cases, more than one
school was identified at a particular postcode, and there were a few schools identified in
WERS where there was no exact postcode match in the school data. We discuss this process
further in the appendix and check the robustness of our results to excluding schools where we
7 Under the SIC 2003 classification the codes identifying schools are 80100, 80210, 80220. Under the SIC 2007 classification the relevant codes are 85100, 85200, 85310, and 85320. Primary schools are coded 80100 under SIC 2003 and 85100 or 85200 in SIC 2007. Secondary schools are coded 80210 in SIC 2003 and 85310 in SIC 2007. Our secondary schools also include some Technical and Vocational schools which are coded 80220 in SIC 2003 and 85320 in SIC 2007.

10
were unable to obtain a direct postcode match. The final matched data unweighted samples
are shown in Appendix Table A2.
Pupil Attainment: Our analysis uses a range of pupil attainment measures taken from the
Department for Education Performance Tables. In 2011, for secondary schools, we use the
percentage of pupils achieving 5 or more GCSEs at grades A*-C including English and
Maths, which was the headline measure of school performance used at the time. We also
explore results for the indicator of value-added, “Best 8”, between KS2 and KS4. For primary
schools in 2011, we use the percentage achieving Level 4 in English and Maths, as well as
the percentage achieving at least two levels of progress in English and Maths. For primary
schools in 2004, we use the percentage of pupils achieving the specified levels (Level 4) in
English, maths and science (note that these are different to the KS2 measures available in
2011, due to changes in the way in which KS2 has been assessed over time). For 2004, the
sample of secondary schools for which we have pupil attainment data is too small to analyse
as a separate group. However, in both 2004 and 2011, the percentage of pupils achieving 5 or
more GCSEs at grades A*-C is available, and we use this in a model which pools both years.
Subjective workplace performance: our main dependent variable is an overall measure of
school performance which combines the manager’s subjective assessment on three separate
measures.8 We follow Bryson et al. (2017) in the construction of the dependent variable. It is
an additive scale combining managers' responses to three questions: "Compared to other
workplaces in the same industry how would you assess your workplace's...financial
performance; labour productivity; quality of product or service". Responses are recorded on
a 5-point Likert scale from "a lot better than average" to "a lot below average". The "a lot
below average" and "below average" codes are collapsed (as few workplaces record
8 These measures are frequently used in the HRM and economics literatures. For a recent example see Wu et al. (2015).

11
performing “a lot below average”) and scales scored from 0 to 3 where 3="a lot above
average". Summing them gives a scale of 0 (‘below average’ performance on all three items)
to 9 (performance ‘a lot better than average’ on all 3 items). Factor analysis identifies a single
factor with an eigen value of 2.14, and an alpha reliability coefficient for the composite
performance scale is 0.79.
We supplement the analysis of the additive workplace performance measure with analyses of
its three components (financial performance, labour productivity and quality of service).
Human resource management: Following Bloom et al. (2017) we construct a single HRM
index based on binary (0,1) indicators identifying the presence or absence of specific HRM
practices.9 The 48 items available are drawn from eight HRM domains, as indicated in Table
2. These domains include five that are commonly the focus in the “high performance work
systems” literature, namely teams, training, participation, selection, and incentives, together
with target setting and record keeping – emphasised in the work of Bloom et al. (2014; 2017)
– and total quality management (TQM) which is often identified as key to lean production.
The Kuder-Richardson coefficients of reliability are presented in the last column of Table 2.
They range from 0.47 for the TQM indicators to 0.85 for the eleven targets. The KR20 for all
48 items together is 0.88.
[INSERT TABLE 2]
Controls: all models control for the size of the school using the number of employees at the
school; region (a London dummy variable); and the percentage of employees belonging to a
trade union.10 In addition to these controls taken from the WERS data we use data from the
9 This is standard in the literature. As Becker and Huselid (1998: 63) say: ‘The overwhelming preference in the literature has been for a unitary index that contains a set (though not always the same set) of theoretically appropriate HRM policies derived from prior work’. 10 A large literature indicates that unionisation is often linked to workplace financial performance and labour productivity, including studies using WERS data. See, for example, Blanchflower and Bryson (2009).

12
Department for Education Performance Tables to control for the total number of pupils in the
school and pupil composition. The pupil composition variables available differ between
2004 and 2011. In 2004, in addition to the total number of pupils, we can account for the
number of pupils with special educational needs (SEN). In 2011, in addition to the 2004
pupil variables we are also able to control for the percentage of pupils for whom English is an
additional language; the percentage eligible for free school meals, and the percentage of boys
in the school. For some analyses of KS4 attainment we condition on KS2 attainment for the
same pupil cohort by introducing this as a control variable, so that the results provide a value-
added estimate.
3.2 Estimation
We run simple OLS estimates for all dependent variables described above. Initially we run
models which contain the HRM index without controls to establish the bivariate relationship
between HRM intensity and school performance. Then we introduce a vector of controls so
that the OLS estimates take the following form:
(1) pi = α + βhrmi + πXi + ɛi
where performance p of workplace i is a function of hrm, and a vector of controls X discussed
above. The Greek letters are parameters to be estimated. Separate models are run by year and
school type (primary school or secondary school). One of the pupil attainment metrics (the
percentage of pupils achieving 5+ GCSEs at A*-C (or equivalent)) is available in 2004 and
2011, allowing us to pool secondary schools from both years. This model also includes a year
dummy.

13
4. RESULTS
Our first aim is to establish whether the outcome measures are correlated with one another.
Table 3 presents correlations for primary school performance in 2004. It is apparent that the
WERS metrics are strongly and significantly correlated with one another, as are the pupil
attainment scores taken from the Department for Education Performance Tables. The WERS
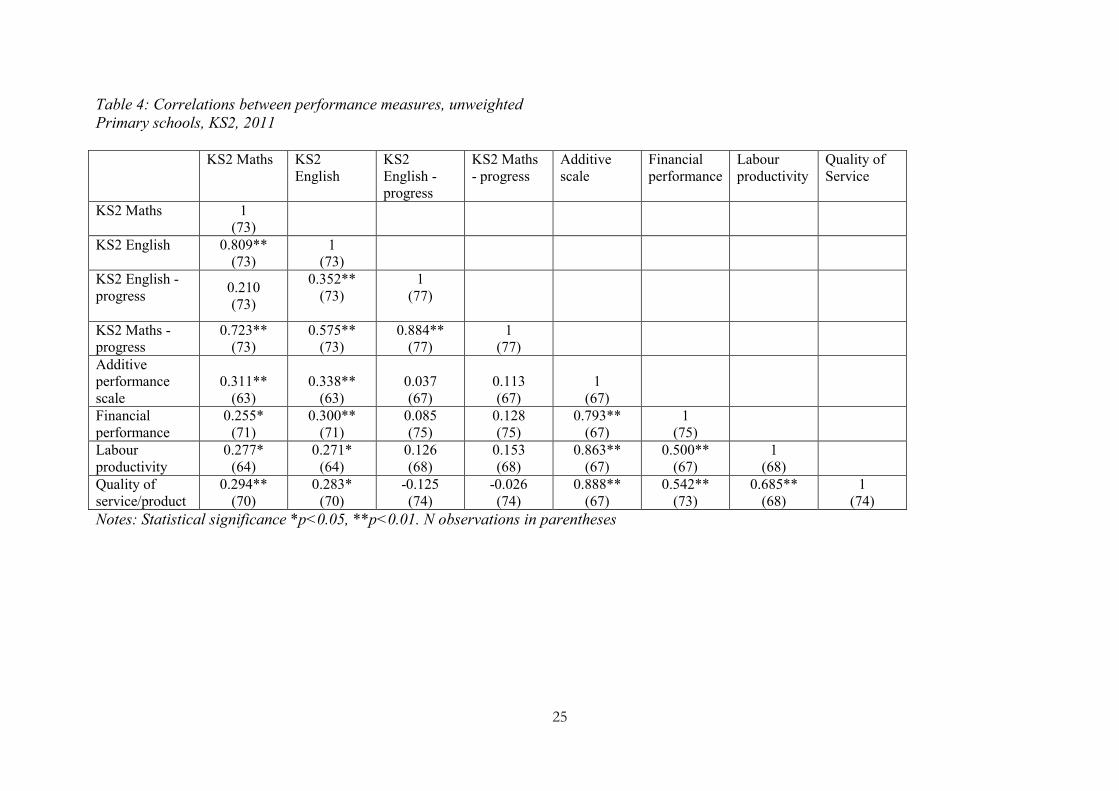
performance metrics are not correlated with pupil attainment measures. Table 4 presents
equivalent correlations for primary school performance in 2011. Here we do observe some
positive and statistically significant correlations between the measures of pupil attainment
and the WERS performance metrics, at least when attainment is considered in terms of the
percentage of pupils achieving Level 4 in English and Maths. However, measures of progress
are not correlated with the WERS performance metrics. For secondary schools in 2011 (Table
5), we also see positive and statistically significant correlations between the measures of
pupil attainment and the WERS metrics. This includes a positive correlation between value-
added and quality of service, although here no significant correlation was apparent for the
other WERS performance measures.11
[INSERT TABLES 3, 4 AND 5]
In Tables 6 and 7 we turn to the correlation between the linear HRM index and performance
outcomes in primary schools in 2004 and 2011 respectively. In 2004 the HRM index is
positively and significantly correlated with managers' subjective assessments of the school's
performance, driven by its positive correlation with financial performance and labour
productivity. There is no association with subjective assessments of the quality of service.
The positive correlation with financial performance and labour productivity is robust to the
11 There are only 20 observations for secondary schools in the 2004 WERS that can be linked to attainment outcomes, so these are not presented.

14
inclusion of control variables listed below Table 6. Indeed, the HRM coefficient for labour
productivity rises a little and is more precisely estimated when controls are included. In
contrast, the association between HRM and the three metrics for pupil attainment at Key
Stage 2, are all non-significant. This result is unaffected by the addition of control variables.
[INSERT TABLE 6]
Table 7 runs similar estimates for primary schools, but for 2011. As in 2004, the HRM index
and subjective school performance are positively and significantly correlated. The
association is stronger in 2011 than in 2004, as indicated by the size of the coefficients, and
there is a statistically significant correlation with quality of service which was not apparent in
2004. Again, the coefficients are a little larger and more precisely estimated controlling for
the variables identified at the bottom of the table.
[INSERT TABLE 7]
As noted above, a more extensive array of pupil attainment metrics is available in 2011 than
in 2004. But in all cases the correlation between the HRM index and pupil attainment is not
statistically significant, either raw or conditioning on other variables.
[INSERT TABLE 8]
Table 8 presents results for secondary schools in 2011. The upper row in Table 8 presents
raw correlations between the HRM index and school performance in 2011. The associations
are relatively weak: only the association with quality of service is positive and statistically
15
significant at conventional levels, although the associations with workplace performance and
financial performance are positive and significant at a 10 percent confidence interval. The
effects remain weak and similar in magnitude when conditioning on control variables,
including lagged pupil attainment which is itself statistically significant for workplace
performance and quality of service. The HRM index is not significantly associated with Key
Stage 4 pupil attainment (regardless of the measure used), either with or without controls.
[INSERT TABLE 9]
There are too few secondary schools in our 2004 data to present secondary school models for
2004 only, so instead we combine them with the schools in 2011 in a pooled model which
also contains a year dummy (Table 9). The results for these pooled models are not
substantively different from those presented in Table 8 for 2011 only.
5. CONCLUSIONS
Empirical studies for both the UK and the United States have identified positive associations
between the use of good management practices, captured in an HRM index, and school
performance, usually measured in terms of pupil attainment. Plausibly causal evidence exists
for the United States. The findings should come as no surprise because there is a much
broader literature linking good management practices with improvements in workplace and
firm performance.
In an earlier paper using the British Workplace Employment Relations Survey (WERS) we
found HRM was positively correlated with managerial perceptions of school performance
relative to the average in the sector (Bryson et al., 2018b). The associations were apparent

16
for school financial performance and labour productivity and were confirmed in a two-wave
panel showing both financial performance and labour productivity rose as schools undertook
more intensive HRM. However, pupil attainment data were not available in that study,
leaving open the question as to whether HRM intensity would also be linked to higher pupil
attainment. In this paper we answer that question by linking the WERS schools’ data to
information from the Department for Education Performance Tables. This permits us to
analyse the association between HRM intensity and school performance in secondary and
primary schools in 2004 and 2011 using a fuller array of performance metrics.
The new analyses differ from those presented in the earlier paper in two additional ways.
First, the data matching results in smaller sample sizes. Second, we are now able to condition
on pupil characteristics which are known to be correlated with pupil attainment, thus
conditioning out potentially confounding variables we were previously unable to account for.
Notwithstanding these differences, we are able to broadly replicate our earlier finding that the
HRM index was positively correlated with workplace performance, though the association
was stronger in primary schools. The association was robust to the addition of controls for
pupil composition and characteristics of the school such as its size and location. However,
HRM was not positively and significantly associated with pupil attainment or pupil value-
added in any of our models.
We find managers' subjective assessments of their schools' performance to be positively and
statistically significantly associated with pupil attainment in both primary and secondary
schools, although this varied depending on the measure and year. There are many reasons as
to why the correlations are not stronger and more consistent. First, the subjective metrics are
ordinal scales in which the workplace manager is asked to compare the school's performance

17
with the average performance of other schools, whereas the pupil attainment metrics are
absolute measures of pupil performance. Second, school managers are asked to rate the
financial performance, labour productivity and quality of service offered by the school.
Although potentially linked to pupil attainment, these metrics are conceptually different to
pupil attainment, so one might expect their associations with HRM practices to differ. Third,
it is possible that managerial assessments of school performance are unreliable and, as such,
should be jettisoned in favour of pupil attainment metrics.
We would caution against this third interpretation. Earlier studies have indicated that these
subjective metrics are predictive of performance-related outcomes, such as workplace
closure, suggesting they contain meaningful information about workplace performance
(Machin, 1995). Instead, given the recent debate over whether value-added metrics capture
teacher impacts on student performance (Chetty et al., 2016) it seems sensible to assess
school performance using a broad set of metrics. This seems all the more important when
those metrics capture financial performance of schools at a time when school resources are
under strain.
Because our analyses are cross-sectional we cannot rule out the possibility that HRM
intensity and good school performance are jointly determined by a third factor that we do not
observe, such as high quality leadership. There might also be a reverse causal link between
highly rated schools and HRM intensity if, for example, more financially secure schools and
those with higher labour productivity are prepared to invest more in HRM.
Notwithstanding these caveats, the findings in this paper, coupled with earlier studies for the
United States and Britain, suggest schools may benefit from more intensive investment in

18
HRM. Although there appear to be no immediate returns from those investments in terms of
pupil attainment, it may take time for those returns to emerge. This time element, coupled
with the need to identify causal linkages between HRM and school performance, point to the
value of future research based on longitudinal data linking school management practices to
school performance.

19
References
Ahn, T. and Vigdor, J. (2014) "The Impact of No Child Left Behind's Accountability
Sanctions on School Performance: Regression Discontinuity Evidence from North
Carolina", NBER Working Paper No. 20511
Allen, R., Burgess, S. and McKenna, L. (2014) "School performance and parental choice of
school: secondary data analysis", Department for Education Research Report
Appelbaum E., Bailey T., Berg P. and Kalleberg A.L. (2000) Manufacturing Advantage: Why
High-performance Work Systems Pay Off. Ithaca NY: Cornell University Press
Becker B. E. and Huselid, M.A. (1998) “High performance work systems and firm
performance: A synthesis of research and managerial implications”. In Ferris GR (ed.)
Research in Personnel and Human Resources Management, Vol. 16. Stamford, CT:
JAI Press, 53–101.
Bloom, N., Brynjolfsson, E., Foster, L., Jarmin, R. S., Patnaik, M., Saporta-Eksten, I. and
Van Reenen, J. (2017) “What drives differences in management?”, NBER Working
Paper No. 23300
Bloom, N., Lemos, R., Sadun, R. and Van Reenen, J. (2015) "Does Management Matter in
Schools", The Economic Journal, 125, 647-674
Bloom, N., Lemos, R., Sadun, R., Scur, D. and Van Reenen, J. (2014) “The new empirical
economics of management”, The Journal of the European Economic Association, 12, 4:
835–876
Bryson, A., Forth, J. and Stokes, L. (2017) ”How Much Performance Pay is there in the
Public Sector and What Are Its Effects?”, Human Resource Management Journal, doi:
10.1111/1748-8583.12153

20
Bryson, A., Buraimo, B. and Simmons, R. (2018a) "Special Ones? The Effect of Head
Coaches on Football Team Performance", UCL mimeo
Bryson, A., Stokes, L. and Wilkinson, D. (2018b) "Can HRM Improve Schools'
Performance?", IZA Discussion Paper No. 11348
Chetty, R., Friedman, J. N. and Rockoff, J. E. (2016) "Using lagged outcomes to evaluate
bias in value-added models", NBER Working Paper No. 21951
Delery, J. E., and Doty, D. H. (1996) “Modes of theorizing in strategic human resource
management: Tests of universalistic, contingent and configurational performance
predictions”, Academy of Management Journal, 39(4): 802-835
Eyles, A. and Machin, S. (2015) "The Introduction of Academy Schools to England's
Education", CEP Discussion Paper No. 1368
Forth, J. and McNabb, R. (2008) "Workplace performance: a comparison of subjective and
objective measures in the 2004 Workplace Employment Relations Survey", Industrial
Relations Journal, 39, 2: 104-123
Fryer, R. G. (2014), “Injecting Charter School Best Practices Into Traditional Public Schools:
Evidence from Field Experiments,” The Quarterly Journal of Economics 129(3): 1355-
1407
Fryer, R. G. (2017) “Management and Student Achievement: Evidence from a Randomized
Field Experiment”, NBER Working Paper No. 23437
Greany, T. and Higham, R. (2018) Hierarchy, Markets and Networks: Analysing the 'Self-
improving' School-led System Agenda in England and the Implications for Schools,
UCL IoE Press, London

21
Kersley, B., Alpin, C., Forth, J., Bryson, A., Bewley, H., Dix, G. and Oxenbridge, S. (2006)
Inside the Workplace: Findings from the 2004 Workplace Employment Relations
Survey, Routledge, London
Machin, S. (1995) "Plant closures and unionisation in British establishments", British Journal
of Industrial Relations, 33, 1: 55-68
Rosen, S. (1990) "Contracts and the Market for Executives", NBER Working Paper No. 3542
Van Wanrooy, B., Bewley, H., Bryson, A., Forth, J., Freeth, S., Stokes, L. and Wood, S.
(2013) Employment Relations in the Shadow of Recession: Findings from the 2011
Workplace Employment Relations Study, Palgrave MacMillan

22
Table 1: Attainment measures: descriptive statistics, analysis sample and full school population
Mean Standard deviation
N
KS4, 2011:
% pupils achieving 5 or more GCSEs at grades A*-C, including English and Maths
Sample 61.2 16.5 49
Population 62.4 19.3 3,963
Best 8 value added Sample 1002.6 19.5 49
Population 999.5 21.9 3,044
% pupils achieving 5 or more GCSEs at grades A*-C
Sample 85.5 11.8 49
Population 84.1 14.6 3,963
KS2, 2011:
% pupils achieving Level 4 or above, maths Sample 84.3 10.6 73
Population 85.0 11.9 14,606
% pupils achieving Level 4 or above, English Sample 84.6 10.5 73
Population 86.5 10.9 14,586
% pupils making at least 2 levels of progress, maths
Sample 84.7 16.5 76
Population 87.3 12.7 14,692
% pupils making at least 2 levels of progress, English
Sample 87.3 19.5 77
Population 90.0 11.4 14,684
KS2, 2004:
English Sample 78.9 13.5 54
Population 79.9 13.6 13,565
Maths Sample 74.8 15.7 54
Population 76.1 14.6 13,564
Science Sample 86.2 11.8 54
Population 87.4 11.4 13,566
Note: for KS4, schools where zero per cent of pupils achieved 5 or more GCSEs at grades A*-C including English and maths are excluded. For KS2, schools where zero per cent of pupils achieved the relevant threshold are excluded. Attainment data are taken from the Department for Education Performance Tables, 2004/5 and 2011/12.

23
Table 2: Management Practices
HRM Domain: HRM measures for each domain: KR20 Incentives (0,4)
Any performance pay; managers appraised; 100% non-managers appraised; non-manager appraisal linked to pay
0.50
Records (0,9) Sales, costs, profits, labour costs, productivity, quality, turnover, absence, training 0.77
Targets (0,11) Volume, costs, profits, ULCs, productivity, quality, turnover absence, training, job sat, client sat
0.85
Teams (0,4) 100% largest non-managerial occupation in teams; teams depend on each other to perform work; team responsible for products and services; team jointly decides how to do the work
0.63
Training (0, 5) 80% largest non-managerial occupation had on-job training lasts 12 months; workplace has strategic plan with employee focus; Investors in People Award; standard induction programme for new staff in largest non-managerial occupation; number of different types of training provided is above population median.
0.57
TQM (0, 3) Quality circles; benchmarking; formal strategic plan for improving quality. 0.47 Participation (0,5)
Formal survey of employee views in last 2 years; management-employee consultation committee; workforce meetings with time for questions; team briefings with time for questions; employee involvement initiative introduced in last 2 years.
0.55
Selection (0,7) References used in recruitment; recruitment criteria include skills; recruitment criteria include motivation; recruitment criteria include qualifications; recruitment criteria include experience; recruitment includes personality or aptitude test; recruitment includes competence or performance test.
0.51
Note: KR20 is the Kuder-Richardson coefficient of reliability used for dichotomous items.

24
Table 3: Correlations between performance measures, unweighted Primary schools, KS2, 2004 KS2
English KS2 Maths
KS2 Science
Additive scale
Financial performance
Labour productivity
Quality of Service
KS2 English 1 (54)
KS2 Maths 0.812** (54)
1 (54)
KS2 Science 0.800** (54)
0.864** (54)
1 (54)
Additive performance scale
0.050 (40)
0.138 (40)
0.079 (40)
1 (40)
Financial performance
-0.045 (49)
-0.119 (49)
-0.127 (49)
0.701** (40)
1 (49)
Labour productivity
0.094 (41)
0.293 (41)
0.209 (41)
0.827** (40)
0.307* (40)
1 (41)
Quality of service
0.116 (52)
0.176 (52)
0.053 (52)
0.745** (40)
0.242 (49)
0.543** (41)
1 (52)
Notes: Statistical significance *p<0.05, **p<0.01. N observations in parentheses
25
Table 4: Correlations between performance measures, unweighted Primary schools, KS2, 2011 KS2 Maths KS2
English KS2 English - progress
KS2 Maths - progress
Additive scale
Financial performance
Labour productivity
Quality of Service
KS2 Maths 1 (73)
KS2 English 0.809** (73)
1 (73)
KS2 English - progress 0.210
(73)
0.352** (73)
1 (77)
KS2 Maths - progress
0.723** (73)
0.575** (73)
0.884** (77)
1 (77)
Additive performance scale
0.311** (63)
0.338** (63)
0.037 (67)
0.113 (67)
1 (67)
Financial performance
0.255* (71)
0.300** (71)
0.085 (75)
0.128 (75)
0.793** (67)
1 (75)
Labour productivity
0.277* (64)
0.271* (64)
0.126 (68)
0.153 (68)
0.863** (67)
0.500** (67)
1 (68)
Quality of service/product
0.294** (70)
0.283* (70)
-0.125 (74)
-0.026 (74)
0.888** (67)
0.542** (73)
0.685** (68)
1 (74)
Notes: Statistical significance *p<0.05, **p<0.01. N observations in parentheses

26
Table 5: Correlations between performance measures, unweighted
Secondary schools, KS4, 2011 KS4
(5EM) Best 8 KS4
(5AC) Additive scale
Financial performance
Labour productivity
Quality of Service
KS4 (5EM) 1 (49)
Best 8 0.524** (49)
1 (49)
KS4 (5AC) 0.584** (49)
0.764** (49)
1 (49)
Additive performance scale
0.458** (46)
0.273 (46)
0.456** (46)
1 (46)
Financial performance
0.192 (49)
0.152 (49)
0.304* (49)
0.789** (46)
1 (49)
Labour productivity
0.330* (47)
0.246 (46)
0.372** (47)
0.895** (47)
0.581** (47)
1 (47)
Quality of service/product
0.663** (48)
0.359** (48)
0.569** (48)
0.850** (46)
0.472** (48)
0.682** (48)
1 (48)
Notes: Statistical significance *p<0.05, **p<0.01. N observations in parentheses

27
Table 6: Regression results, performance and HRM score, KS2, 2004, OLS. Primary Schools, unweighted
KS2 English
KS2 Maths
KS2 Science
Workplace performance
Financial Performance
Labour Productivity
Quality of Service
(1) Raw hrmscore -0.053 0.133 0.127 0.135* 0.059* 0.058 -0.009
(-0.13) (0.28) (0.36) (2.14) (2.52) (1.92) (-0.43)
N 54 54 54 40 49 41 52 r2_a 0.019 0.018 0.017 0.084 0.100 0.063 0.016
(2) Controls hrmscore 0.095 0.247 0.176 0.138* 0.054* 0.067* -0.003
(0.23) (0.51) (0.49) (2.00) (2.31) (2.02) (-0.15)
N 54 54 54 40 49 41 52 r2_a 0.031 0.022 0.019 0.013 0.158 0.023 0.076
Notes: controls are number of pupils in the school; percentage of pupils with SEN; number of employees in the school; dummy for London location; percentage of employees who are union members. Statistical significance *p<0.05, **p<0.01. t-statistics in parentheses

28
Table 7: Regression results, performance and HRM score, KS2, 2011, OLS. Primary Schools, unweighted
KS2 Maths (% pupils achieving Level 4 or
above)
KS2 English (% pupils achieving Level 4 or
above)
% pupils making at
least 2 levels of progress -
English
% pupils making at
least 2 levels of progress -
Maths
Workplace performance
Financial Performance
Labour Productivity
Quality of Service
(1) Raw
hrmscore 0.134 0.318 0.122 -0.009 0.152** 0.044** 0.060** 0.044*
(0.54) (1.32) (0.29) (0.02) (3.18) (2.71) (3.20) (2.29)
N 73 73 77 77 67 75 68 74 r2_a 0.010 0.010 0.012 0.013 0.121 0.079 0.121 0.055
(2) Controls
hrmscore 0.094 0.217 0.192 0.054 0.179** 0.049** 0.073** 0.057**
(0.38) (0.96) (1.06) (0.26) (3.29) (2.71) (3.42) (2.67)
N 64 64 68 68 58 66 59 65 r2_a 0.244 0.350 0.878 0.826 0.124 0.124 0.129 0.093
Notes: Controls are: number of pupils in school; percentage free school meals; percentage SEN; percentage EAL; percentage boys; number of employees; dummy for London location; percentage of employees who are union members. Statistical significance *p<0.05, **p<0.01. t-statistics in parentheses

29
Table 8: Regression results, performance and HRM score, KS4, 2011, OLS. Secondary Schools, unweighted
KS4 5EM
5+ GCSEs at A*-C
Best 8 value-added Workplace
performance Financial Performance
Labour Productivity
Quality of Service
(1) Raw
hrmscore 0.303 0.621 0.595 0.129 0.048 0.041 0.059*
(0.59) (1.76) (0.99) (1.86) (1.90) (1.55) (2.00)
N 49 49 49 46 49 47 48 r2_a -0.014 0.041 -0.000 0.052 0.052 0.030 0.060
(2) Controls
hrmscore 0.212 0.491 0.302 0.103 0.063 0.008 0.052
(0.63) (1.17) (0.37) (1.17) (1.86) (0.23) (1.76)
KS2 APS 8.757** 2.603** - 0.648* 0.165 0.096 0.411**
(7.57) (2.67) - (2.22) (1.40) (0.82) (4.08)
N 44 45 44 41 44 42 43 r2_a 0.774 0.173 0.195 0.178 0.087 0.019 0.493
Notes: Controls are: number of pupils in school; percentage free school meals; percentage SEN; percentage EAL; percentage boys; number of employees; dummy for London location; union density. Statistical significance *p<0.05, **p<0.01. t-statistics in parentheses. The models for Best 8 value-added do not include the average points score attained at KS2.

30
Table 9: Regression results, performance and HRM score, KS4, 2004 and 2011 pooled, OLS. Secondary Schools, unweighted
5+ GCSEs at A*-C Workplace
performance Financial Performance
Labour Productivity
Quality of Service
(1) Raw hrmscore 0.441 0.090 0.038 0.033 0.034
(1.32) (1.61) (1.75) (1.61) (1.40)
2011 83.235** .0923 -0.101 -0.086 0.158
(22.75) (0.15) (-0.41) (-0.36) (0.61)
N 70 61 65 62 66 r2_a 0.883 0.010 0.021 0.013 0.003
(2) Controls hrmscore 0.099 0.036 0.039 0.005 0.011
(0.25) (0.58) (1.53) (0.23) (0.41)
2011 83.747** -0.084 -0.121 -0.181 0.142 (21.71) (-0.13) (-0.46) (-0.78) (0.55) N 66 57 61 58 62 r2_a 0.884 0.046 0.009 0.024 0.060
Notes: Controls are: number of pupils in school; percentage free school meals; percentage SEN; percentage EAL; percentage boys; number of employees; dummy for London location; union density. Statistical significance *p<0.05, **p<0.01. t-statistics in parentheses

31
Appendix: Matching school-level measures of pupil attainment to workplaces in WERS
In this appendix we provide further details regarding the process of linking information on
school performance, as measured by pupil attainment, to the workplaces (schools) that are
included in the WERS surveys in 2004 and 2011.
Across 2004 and 2011, it is possible to identify 406 schools in WERS, based on SIC codes
(Table A1). In the majority (around 94 per cent) of these workplaces, the respondent gave
permission for data about the workplace to be linked to other sources of information. Those
workplaces where permission for data linkage was not given are therefore excluded from the
sample. While some information about attainment at KS4 is available for some independent
schools, we have limited other information about these schools, and thus our analysis is for
the state sector only. This further reduces our sample of schools. Furthermore, as our school
performance data relate to England only, we exclude those schools in WERS that are located
in Scotland and Wales. This leaves us with a total of 253 schools for which a match could
potentially be made, 156 in 2011 and 97 in 2004. In both years, these comprise primary and
secondary schools, as well as technical/vocational education.
Table A1: Number of schools participating in WERS and for whom linkage is feasible, 2004 and 2011
2004 2011 All N schools 140 266 406 Of which: Consent to data linkage 134 248 382 ...and are public sector 119 192 311 ...and are located in England 97 156 253 By type (with consent, in public sector and in England):
Primary 153 Secondary 75 Technical/vocational 25 Note: Numbers by type are not presented separately by year due to the small number of observations.

32
For the schools in WERS 2004, we attempt to match on school performance measures on the
basis of the school postcodes available in the 2004/5 Department for Education Performance
Tables data. For the schools in the 2011 WERS, we attempt to match on school performance
measures on the basis of the school postcodes available in the 2011/12 Performance Tables.
For the majority of schools, it was possible to identify a direct postcode match (Table A2).
This figure includes some multiple matches, i.e. more than one school existed at the postcode.
These were reviewed on a case by case basis to identify the most likely match. In 2011, many
of these were schools which converted to academies, and both the predecessor and successor
schools were included in the files. In this case we match according to the year in which the
school converted to academy status and dependent on which school had performance data
available. For the remaining cases where multiple schools were located at the same site, we
made an assumption about which school was the correct match (for example because of the
phase of the school, where both a primary and secondary school were located at the same
postcode).
We then reviewed the remaining cases where no exact postcode match could be identified,
additionally checking whether any matches could be made based on information available
through Edubase. This showed some of the technical/vocational and secondary education
workplaces to be further education providers, for whom we would then not expect KS4 data
to be available. Similarly, some schools that were identified as primary schools only covered
up to the end of KS1, or were nursery schools, and so by definition do not have data on KS2
performance. For the remaining schools, where possible a match was made to a school
located at the closest alternative postcode (but with the restriction that the postcode has to be
at least the same in terms of the outward part of the postcode plus the first digit of the second
33
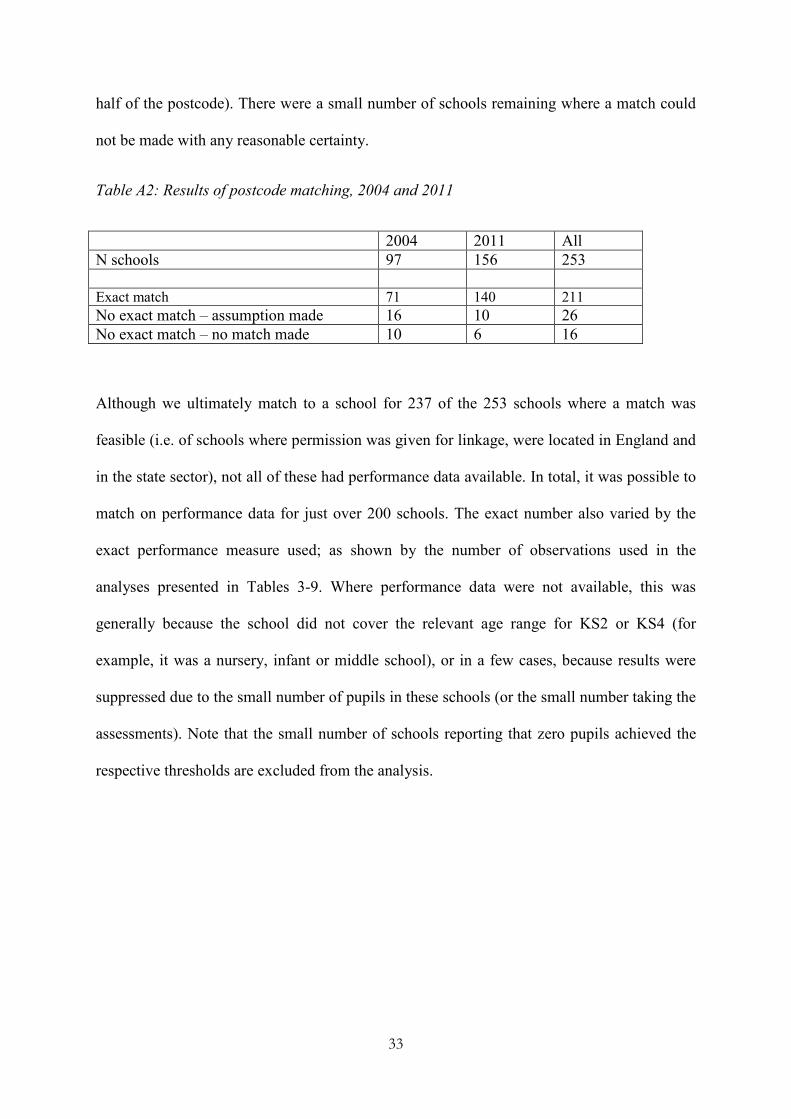
half of the postcode). There were a small number of schools remaining where a match could
not be made with any reasonable certainty.
Table A2: Results of postcode matching, 2004 and 2011
2004 2011 All N schools 97 156 253 Exact match 71 140 211 No exact match – assumption made 16 10 26 No exact match – no match made 10 6 16
Although we ultimately match to a school for 237 of the 253 schools where a match was
feasible (i.e. of schools where permission was given for linkage, were located in England and
in the state sector), not all of these had performance data available. In total, it was possible to
match on performance data for just over 200 schools. The exact number also varied by the
exact performance measure used; as shown by the number of observations used in the
analyses presented in Tables 3-9. Where performance data were not available, this was
generally because the school did not cover the relevant age range for KS2 or KS4 (for
example, it was a nursery, infant or middle school), or in a few cases, because results were
suppressed due to the small number of pupils in these schools (or the small number taking the
assessments). Note that the small number of schools reporting that zero pupils achieved the
respective thresholds are excluded from the analysis.


![Impact and Postbuckling Analyses - imechanicaPostbuckling Analyses Geometric Imperfections for Postbuckling Analyses • Using buckling modes for imperfections].. ...](https://static.fdocuments.in/doc/165x107/5e279cdbcab01659037bd7a7/impact-and-postbuckling-analyses-imechanica-postbuckling-analyses-geometric-imperfections.jpg)