Digitization of electron micrographs: A comparison of three different types of scanners
8
JOURNAL OF ELECTRON MICROSCOPY TECHNIQUE 8:381-388 (1988) Digitization of Electron Micrographs: A Comparison of Three Different Types of Scanners ANDERS OLOFSSON, URBAN KAVEUS, AND HANS HEBERT Department of Medical Biophysics, Karolinska Institutet, S-104 01 Stockholm. Sweden KEY WORDS Image processing, Molecular structure, Resolution assessment, Optical density response ABSTRACT Some aspects of digitization of electron micrographs have been investigated. The performances of a flat-bed, a rotating drum, and a diode array scanner have been evaluated. Estimates have been achieved for resolu- tion, mechanical and optical stability, and optical density response. It is con- cluded that for routine transmission electron microscopy of, for example, negatively stained biologic specimens, a diode array scanner produces data good enough to obtain resolutions at a level normally expected. High speed is the major advantage with this type of equipment. However, for high-resolution work it is necessary to use a conventional scanner with a relatively slow scan speed. INTRODUCTION Conventional transmission electron mi- croscopy combined with a variety of image processing methods has become an impor- tant technique for studying biologic struc- ture on the cellular and molecular level (Amos et al., 1982). The first attempts along these lines were carried out using physical methods to improve the signal-to-noise ratio in electron micrographs. Averaged struc- tures of periodic or symmetric specimens were obtained by the rotational and trans- lational approach of Markham et al. (1963) and later by optical diffraction (Klug and Berger, 1964) and filtering (Klug and De- Rosier, 1966) with visible light. The develop- ment of fast digital computers made it possible, once the density of the electron mi- crographs were available in digitized form, to do calculations based on the images. The first approach was made by DeRosier and Klug (1968), who also extended image pro- cessing, resulting in three-dimensional mod- els of biologic specimens. Since these pio- neering works, there has been a continuous development both concerning the experimen- tal part and the subsequent image process- ing. Numerous important contributions have been made in cellular and molecular biology. The conventional method to record trans- mitted electrons in the microscope is by us- ing photographic emulsions. Normally these have a linear response to the number of elec- trons forming the images (Valentine, 1966). The electron micrographs are then digitized into numbers proportional to the optical den- sity (OD). This step is executed by using scanners. It is important that the scanner does not lower the quality of the image nota- bly. Also the speed at which digitization can be performed might be of concern. Often nu- merous electron micrographs have to be pro- cessed, for instance when calculating three- dimensional reconstructions from tilt series of a specimen. In the present work we have investigated the performance of three scan- ners, representing different approaches to the problem of digitizing images. It is of special interest to compare a fast diode array system with more conventional equipment. MATERIALS AND METHODS Three different scanners were used in this investigation. The Joyce-Loebl Microdensi- tometer 6 (abbreviated MDM6) is a conven- tional, flat-bed microdensitometer utilizing double microscope optics in transmission mode. Optical density measurements are made using a double-beam optical principle. The scanning is performed as two-dimen- sional raster scans controlled by means of a Received September 7, 1987, accepted October 2, 1987. Address reprint requests to Dr. Hans Hebert, Department of Medical Biophysics, Karolinska Institutet, Box 60400, 5~104 01 Stockholm, Sweden. 0 1988 ALAN R. LISS. INC.
-
Upload
anders-olofsson -
Category
Documents
-
view
213 -
download
0
Transcript of Digitization of electron micrographs: A comparison of three different types of scanners

JOURNAL OF ELECTRON MICROSCOPY TECHNIQUE 8:381-388 (1988)
Digitization of Electron Micrographs: A Comparison of Three Different Types of Scanners
ANDERS OLOFSSON, URBAN KAVEUS, AND HANS HEBERT Department of Medical Biophysics, Karolinska Institutet, S-104 01 Stockholm. Sweden
KEY WORDS Image processing, Molecular structure, Resolution assessment, Optical density response
ABSTRACT Some aspects of digitization of electron micrographs have been investigated. The performances of a flat-bed, a rotating drum, and a diode array scanner have been evaluated. Estimates have been achieved for resolu- tion, mechanical and optical stability, and optical density response. It is con- cluded that for routine transmission electron microscopy of, for example, negatively stained biologic specimens, a diode array scanner produces data good enough to obtain resolutions at a level normally expected. High speed is the major advantage with this type of equipment. However, for high-resolution work it is necessary to use a conventional scanner with a relatively slow scan speed.
INTRODUCTION
Conventional transmission electron mi- croscopy combined with a variety of image processing methods has become an impor- tant technique for studying biologic struc- ture on the cellular and molecular level (Amos et al., 1982). The first attempts along these lines were carried out using physical methods to improve the signal-to-noise ratio in electron micrographs. Averaged struc- tures of periodic or symmetric specimens were obtained by the rotational and trans- lational approach of Markham et al. (1963) and later by optical diffraction (Klug and Berger, 1964) and filtering (Klug and De- Rosier, 1966) with visible light. The develop- ment of fast digital computers made it possible, once the density of the electron mi- crographs were available in digitized form, to do calculations based on the images. The first approach was made by DeRosier and Klug (1968), who also extended image pro- cessing, resulting in three-dimensional mod- els of biologic specimens. Since these pio- neering works, there has been a continuous development both concerning the experimen- tal part and the subsequent image process- ing. Numerous important contributions have been made in cellular and molecular biology.
The conventional method to record trans- mitted electrons in the microscope is by us- ing photographic emulsions. Normally these have a linear response to the number of elec-
trons forming the images (Valentine, 1966). The electron micrographs are then digitized into numbers proportional to the optical den- sity (OD). This step is executed by using scanners. It is important that the scanner does not lower the quality of the image nota- bly. Also the speed at which digitization can be performed might be of concern. Often nu- merous electron micrographs have to be pro- cessed, for instance when calculating three- dimensional reconstructions from tilt series of a specimen. In the present work we have investigated the performance of three scan- ners, representing different approaches to the problem of digitizing images. It is of special interest to compare a fast diode array system with more conventional equipment.
MATERIALS AND METHODS Three different scanners were used in this
investigation. The Joyce-Loebl Microdensi- tometer 6 (abbreviated MDM6) is a conven- tional, flat-bed microdensitometer utilizing double microscope optics in transmission mode. Optical density measurements are made using a double-beam optical principle. The scanning is performed as two-dimen- sional raster scans controlled by means of a
Received September 7, 1987, accepted October 2, 1987. Address reprint requests to Dr. Hans Hebert, Department of
Medical Biophysics, Karolinska Institutet, Box 60400, 5~104 01 Stockholm, Sweden.
0 1988 ALAN R. LISS. INC.

382 A. OLOFSSON, U. KAVEUS, AND H. HEBERT
Fig. 1. Test picture used for estimation of resolution. On the original negative digitized in the scanners, the spacing between dark lines of the star in the center of the image shortens to 20 Wm.
Fig. 2. Reproduction of the central part of the star as presented on the graphics display. Data were obtained with the OSIRIS scanner (a), the MDM6 scanner 6). and the P l O O O scanner (c) respectively.
host computer, which gauges the stage posi- to be imaged by a monocular viewer or to be tions along the x- and y-axes in increments projected on to a 80-mm display screen. of 2.5 pm. In this way a total area of 250 x Optronics P-1000 (abbreviated P1000) is a 250 mm can be recorded. As an aid for set- rotating drum microdensitometer. The film up, a parfocal and coaxial viewing system is mounted on a cylinder, and the image is permits a 1-mm-diameter area of the sample scanned, pixel by pixel, within a given scan

DIGITIZATION OF ELECTRON MICROGRAPHS 383
a MDMB, horizontal lines MDMG, vertical lines
-
1 1 I I I 1 1 I I I I 1 1 I
5 10 15 20 25 3 0 35 5 10 15 20 25 3 0 35 I I R Pixels R Pixels
P1000, horizontal lines b P1000, vertical lines
1
2 0
I 1 I I 1 I 5 10 15 2 0 25 30 35 5 10 15‘ 20 25 30 35
R Pixels Pixels
n OSIRIS, horizontal lines OSIRIS, vertical lines
5 10 15 2 0 25 30 35 I
Pixels R
I I 1 I I 1
5 10 15 2 0 25 30 35 I
Pixels R
Fig. 3. Contrast difference expressed in relative optical density between a dark and a transparent converging line of the star picture. The abscissa corresponds to the distance from the center of the star expressed in pixels. For each scanner [MDMG (a), P l O O O @), and OSIRIS (c)], measurements have been made both along horizontal
and vertical lines. The curves can be used to estimate the vertical and horizontal resolution respectively. R indicates the position where the contrast difference has been reduced to lie of its original value. Distance be- tween lines in pm is 1.7(pixe1-2)+20.
line, and line by line until the designated two-dimensional area is covered. The illumi- nating and imaging optics are mounted on opposite arms of a “C” carriage, through which the cylinder drum rotates. Apertures from 12.5 x 12.5 pm to 400 x 400 pm can be selected. The photodetector is recalibrated once per revolution by measurement of light
transmission through an opening in the drum.
OSIRIS (abbreviation for Our Second Im- age Reading Instrument System) is a diode array scanner constructed at the Rqyal Insti- tute of Technology in Stockholm (Aslund et al., 1977). The illuminated area of the image is projected onto a linear array of 1,024 diodes
384 A. OLOFSSON, U. KAVEUS, AND H. HEBERT
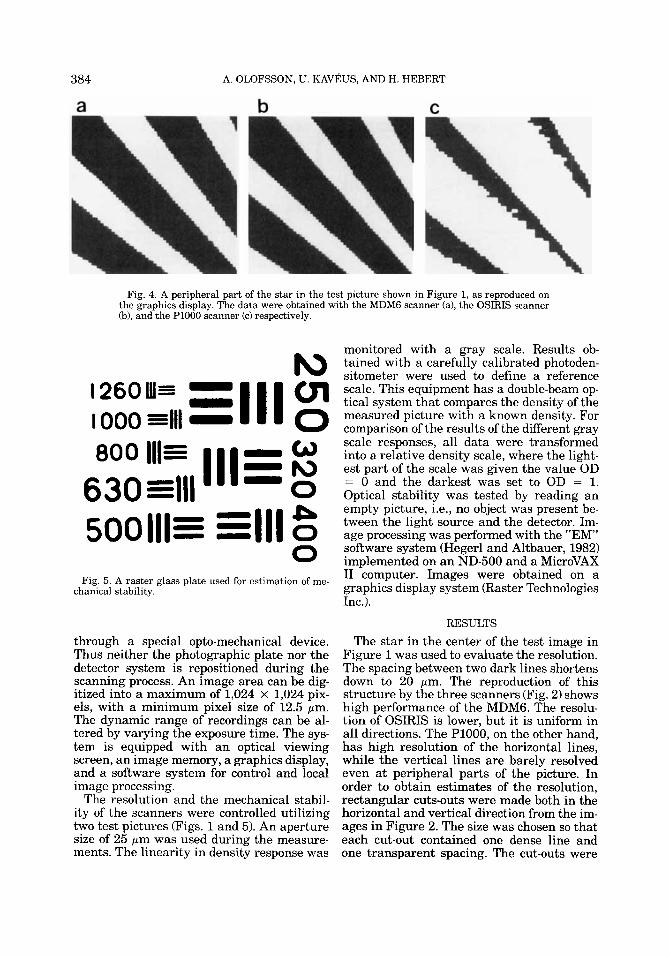
Fig. 4. A peripheral part of the star in the test picture shown in Figure 1, as reproduced on the graphics display. The data were obtained with the MDMG scanner (a), the OSIRIS scanner (b), and the P l O O O scanner (c) respectively.
Fig. 5. A raster glass plate used for estimation of me- chanical stability.
through a special opto-mechanical device. Thus neither the photographic plate nor the detector system is repositioned during the scanning process. An image area can be dig- itized into a maximum of 1,024 x 1,024 pix- els, with a minimum pixel size of 12.5 pm. The dynamic range of recordings can be al- tered by varying the exposure time. The sys- tem is equipped with an optical viewing screen, an image memory, a graphics display, and a software system for control and local image processing.
The resolution and the mechanical stabil- ity of the scanners were controlled utilizing two test pictures (Figs. 1 and 5). An aperture size of 25 pm was used during the measure- ments. The linearity in density response was
monitored with a gray scale. Results ob- tained with a carefully calibrated photoden- sitometer were used to define a reference scale. This equipment has a double-beam op- tical system that compares the density of the measured picture with a known density. For comparison of the results of the different gray scale responses, all data were transformed into a relative density scale, where the light- est part of the scale was given the value OD = 0 and the darkest was set to OD = 1. Optical stability was tested by reading an empty picture, i.e., no object was present be- tween the light source and the detector. Im- age processing was performed with the “EM’ software system (Hegerl and Altbauer, 1982) implemented on an ND-500 and a MicroVAX I1 computer. Images were obtained on a graphics display system (Raster Technologies Inc.).
RESULTS The star in the center of the test image in
Figure 1 was used to evaluate the resolution. The spacing between two dark lines shortens down to 20 pm. The reproduction of this structure by the three scanners (Fig. 2) shows high performance of the MDMG. The resolu- tion of OSIRIS is lower, but it is uniform in all directions. The P1000, on the other hand, has high resolution of the horizontal lines, while the vertical lines are barely resolved even at peripheral parts of the picture. In order to obtain estimates of the resolution, rectangular cuts-outs were made both in the horizontal and vertical direction from the im- ages in Figure 2. The size was chosen so that each cut-out contained one dense line and one transparent spacing. The cut-outs were

DIGITIZATION OF ELECTRON MICROGRAPHS 385
Fig. 6 . Two parts of the plate in Figure 5 as reproduced on the graphics display. The data were obtained with the MDM6 scanner (a) and the OSIRIS scanner (b), respectively. The magnification factor is approximately 220 in (a) and approximately 44 in (b).
Reference and MDM6 line,
OSfRlS dots, P1000 dashes
5 10 15 2 0 Steps in the grey-scale
Fig. 7. Optical density response of the scanners and a carefully calibrated photodensitometer. Measurements were obtained from a gray scale. the optical density at the light and dark ends of the scale was set to 0 and 1 respectively.
normalized and graphs were made showing the density of a dark line and a transparent area as a function of the distance in pixels from the center of the star (Fig. 3). The dis- tances where the contrast had decreased to l/e of its original value was chosen as the resolution limit and marked with an R in the graphs. The results thus obtained show that MDMG and OSIRIS have an isotropic resolu-
tion measuring about 30 pm (Fig. 3a) and 60 pm (Fig. 3c), respectively. The resolution of the P l O O O extends down to 20 pm for horizon- tal lines, while the contrast is decreased when rotating to the vertical lines, giving an R value of 45 pm (Fig. 3b). Figure 4 shows reproductions of peripheral parts of the star picture. MDMG and ORISIS both show a shadow close to the minimum width of 1 pixel, which is due to a random match be- tween pixel positions and edge. The P l O O O gives a gradual contrast response.
To obtain information about mechanical stability, a raster image with different grat- ings was used (Fig. 5). Since this was an exposure made on a glass plate, it could not be mounted to the rotating cylinder of the drum scanner. Figure 6a shows that MDMG has a certain slack in its mechanism. The difference in distance between successive line-scans is up to 10 pm. High mechanical stability is obtained with OSIRIS (Fig. 6b).
The optical density responses depicted in Figure 7 show that MDMG follows the refer- ence curve obtained with the calibrated stan- dard photodensitometer over the measured range. Both OSIRIS and PlOOO deviate from linearity, but at different ends of the density scale. The nonlinearity of OSIRIS is most pronounced when measuring dark areas,

386 A. OLOFSSON, U. KAVEUS, AND H. HEBERT
Fig. 8. A measurement obtained with OSIRIS without any object between the light source and the detector. The lines are due to different characteristics of the diodes in the array, and the gradual density variation is explained by nonhomogeneous illumination.
TABLE 1. Comparison of the merits of the scanners used in the present work
Horizontal Vertical Mechanical Optical resolution resolution stability Density stability
Scanner (pm) (pm) (pm) response .OD'
MDMG 30 30 10 Linear 0.2 PlOOO 45 20 Not Nonlinear < 0.2
OSIRIS 60 60 < 10 Nonlinear 0.9 measured at low OD
at high OD
'Standard deviation of the optical density expressed in percent of the average OD.
while the density response of the P l O O O is not linear when measuring relatively light parts.
Optical stability was tested by recording an empty image. The result obtained with OSIRIS shows that the different diodes in the array have varying characteristics (Fig. 8). A slight gradient in illumination is also ob- served. The standard deviation in optical density is approximately 0.9% at normal
density levels. The same value obtained with MDMG is 0.2%. The P l O O O proved to be very stable optically.
DISCUSSION The ideal equipment for measuring optical
density of electron micrographs should be fast and still produce accurate data. With the technology available at present, this aim is unlikely to be achieved completely, and con-

DIGITIZATION OF ELECTRON MICROGRAPHS 387
sequently compromises have to be made. In this work, data are presented for the perfor- mance of three scanners representing differ- ent technical approaches to optical density measurements. Both MDMG and PlOOO are frequently used by electron microscopists doing image processing. OSIRIS is not yet commercially available but has been used in many works originating from our laboratory.
A comparison of the merits of the three scanners is summarized in Table 1. The res- olution, as measured from the diagrams in Figure 3, is about twice as good for the MDMG as for OSIRIS. The directional-depen- dent resolution of the P l O O O indicates that the rotation speed of the drum is too fast compared with the time constant of the im- age detector. The number of revolutions per second changes automatically with the size of the aperture. It is, however, not possible to vary the speed when employing one and the same aperture. Although we obtained an is- otropic resolution for OSIRIS, the reproduc- tion of the raster in Figure 6 indicates that the resolution along the diode array, i.e., hor- izontally, is reduced. This is probably due to scattering of light between the diodes. The mechanical stability is high for OSIRIS, as would be expected from this relatively rigid construction. The arrangement of diodes in a fixed array reduces one direction of move- ment during the measurement. The response to optical density is close to linearity for MDM6. High accuracy is obtained by a dou- ble-beam system for recording. The nonline- arity of OSIRIS at high optical densities could be due to stray light or dark currents from the diodes. The high optical stability of the P l O O O is probably due to a recalibration made once per revolution. Different characteristics of the diodes in the detector system of OSIRIS explain the pattern obtained in Figure 8. In modified versions of this scanner, it is possi- ble to compensate for the dark currents of the diodes.
When performing structure analysis with electron microscopy and image processing, the time consumption for digitization of elec- tron micrographs is significant. This is espe- cially true for three-dimensional work, where a number of tilted views of a specimen are recorded. If the scanner is connected to a host computer, capacity for other users may be reduced for long time intervals. Scanning 512 x 512 pixels with the MDMG takes about 40 minutes, while PlOOO requires a few min- utes. With OSIRIS, this time is reduced to
less than a minute, and experimental data from a complete tilt series is available after a few hours.
Some additional advantages with this type of equipment are interactive easy operation and the possibility of performing local image processing. The cost one has to pay is a re- duction of the resolution. Assuming 60 pm as an estimate for the resolution limit and a normal electron optical magnification of 60,000 x , the smallest unit reproduced on the object level is 10 A . This is close to the nec- essary sampling interval for negatively stained specimens, since a l$ologically signif- icant resolution of 20-25 A usually can be expected. The test pictures used in this work present extreme cases of contrast variation not normally encountered in electron micro- graphs of biologic specimens. Thus the fig- ures above can be considered as conservative estimates. From electron micrographs of neg- atively stained catalase platelet crystals, we have observed significant- diffraction spots from OSIRIS data at 1/11 A-’. Thus we con- clude that a diode array scanner like OSIRIS provides data good enough for negatively stained specimens. However, for high-reso- lution work from, for instance, cryoelectron microscopy, it is necessary to use more con- ventional methods for the digitization of the electron micrographs.
ACKNOWLEDGMENTS
We would like to thank Prof. Nils Aslund and Dr. Kjell Carlsson at the Physics Depart- ment at the Royal Institute of Technology in Stockholm for putting the OSIRIS equip- ment to our disposal and for assistance dur- ing the scanning sessions. This work was supported by the Swedish Medical Research Council (Grant No. 144) and Magnus Bergvalls Stiftelse.
REFERENCES
Amos, L.A., Henderson, R., and Unwin, P.N.T. (1982) Three-dimensional structure determination by elec- tron microscopy of two-dimensional crystals. Prog. Bio- phys. Molec. Biol., 39:183-231. A slund, N., Carlsson, K., Majlof, L., and Olsson, L. (1977)
A general purpose version of the computer-controlled image scanner OSIRIS. In: Proceedings of the Inter- national Symposium on Image Processing. F.W. Le- berl, eds. Verlag fur die Technische Universitat, Graz, Austria, pp. 15-18.
DeRosier, D.J., and Klug, A. (1968) Reconstruction of three dimensional structures from electron micro- graphs. Nature, 217:130-134.
Hegerl, R., and Altbauer, A. (1982) The “EM’ program system. Ultramicroscopy, 9:109-116.

388 A. OLOFSSON, U. KAVEUS, AND H. HEBERT
Klug, A., and Berger, J.E. (1964) An optical method for the analysis of periodicities in electron micrographs and some observations on the mechanism of negative staining. J . Mol. Biol., 10565-569.
Klug, A,, and DeRosier, D.J. (1966) Optical filtering of electron micrographs: Reconstructions of one sided im- ages. Nature, 212:29-32.
Markham, R., Frey, S., and Hills, G.J. (1963) Methods
for the enhancement of image detail and accentuation of structure in electron microscopy. Virology, 20:88- 102.
Valentine, R.C. (1966) The response of photographic emulsions to electrons. In: Advances in Optical and Electron Microscopy. R. Barer and V.E. Coslett, eds. Academic Press, London, New York, Vol. 1, pp. 180- 202.