Digitalization Maturity - Siemens€¦ · organizations, where digital technology has transformed...
45
African Digitalization Maturity Report 2017 Click to enter
Transcript of Digitalization Maturity - Siemens€¦ · organizations, where digital technology has transformed...

African Digitalization Maturity Report2017
Click to enter
This document is based on statistical research and contains prognoses and personal views. The statements made in this document furthermore are of a general nature and not intended as a guideline for business decisions.
Siemens neither assumes responsibility for the correctness or completeness of the statements made in this document, nor any liability for loss or damage suffered in reliance on any of the statements made in this document.
Disclaimer
Disclaimer
Foreword
Introduction
Research Methodology
Country Analysis
Industry Analysis
Industry Analysis: Manufacturing
Industry Analysis: Energy
Industry Analysis: Transport
Key insights and recommendations
Conclusion
Glossary of terms
References
INDEX (Click on categories to navigate)

The world has never been so closely linked – or as digital – as it is today. Digitalization has found a home in everything from personal devices to complex industrial systems. Our world is taking on a digital dimension wherever you look.
But what does this digital world look like in the African context? Is it on the same trajectory as developed economies? Is it right to assume it is playing catch-up or is there an opportunity for digitalization on the continent to create its own route to developing new and transformative technologies that ultimately increase the competitiveness of Africa’s economies?
If Africa is to compete in the digital age, we need to shift our traditional thinking. Competing against each other is counter-productive. The collaboration between government, business (local and international), labor and academia has the ability to change mindsets, implement policy and create an environment for knowledge sharing and execution. With these shifts it is possible and highly likely that digitalization will happen quite rapidly in Africa, and bring about developmental changes on the continent. One need only look at the impact of cellphone technology and smart phones in Africa to see how innovation can leapfrog older technologies at an almost breathtaking speed.
Varied levels of maturity across industries and markets and the extent of cultural innovation, adoption of digital operations as well as digital
customer offerings is to be expected. While we are seeing growing adoption of advanced analytics within certain industry sectors, such as the automotive sector, the real opportunity lies in sectors where it has not yet been explored. Manufacturing, while the most mature in its transformation and adoption of digital technologies in Africa, remains a marginal player struggling to make a bigger impact on country GDPs. The question governments need to ask themselves is how they align a ‘here-and-now’ emphasis on job creation with the necessary focus on digitalization. This will enable Africa to create a niche within the global economy. If we fail to pro-actively select our place within the global manufacturing industry we run the risk of continuing on this path of non-industrialization.
In the energy industry, a stable supply of electricity is critical for digitalization to flourish. By providing high levels of infrastructure and power supply Africa will be able to attract the necessary investment across various industry sectors. Diversification of energy is critical.
Based on the report’s findings, the understanding of energy diversification across the continent is not very high. In some countries, paraffin lamps are considered as alternative energy sources indicating the level of gaps in infrastructure which exist. However, to a greater extent, countries are beginning to realize they can no longer rely on one primary source of energy. This thinking is opening up opportunities for a diversified energy ecosystem. Also driving the need for
a broader energy mix is the distribution of populations across African countries. The cost of transmission to customers is excessive and there is therefore a bias to decentralized distributed power.
In the transport industry, digitalization can facilitate the moving of people and goods from an efficiency, customer experience and safety perspective. Never before has technology complemented transport so eloquently. Data, and the ability to interpret it is as much a part of the transport ecosystem as roads and rails. Digitalization has the potential to turn predictive maintenance into real-time monitoring and allow transport operators across the continent to deliver services efficiently and safely.
For Siemens, digitalization is much more than a business field; it is a growth driver. With our broad range of offerings across energy, manufacturing and transportation, we’re ideally equipped for the era of digitalization. We have much to offer Africa.
It is against this backdrop that Siemens has collaborated with an external service provider to conduct a Digitalization Maturity Report in Africa. The findings from the study are just a starting point. We hope it will begin a dialogue and provide a frame to some of the unique opportunities that exist. We hope you enjoy reading through the findings and look forward to sharing further insights related to specific countries and industries.
Foreword
Sabine Dall’Omo
Siemens CEO, Southern and Eastern Africa
Driving African development through smarter technology
Disclaimer
Foreword
Introduction
Research Methodology
Country Analysis
Industry Analysis
Industry Analysis: Manufacturing
Industry Analysis: Energy
Industry Analysis: Transport
Key insights and recommendations
Conclusion
Glossary of terms
References
INDEX (Click on categories to navigate)

Digitalization refers to leveraging digital technology and insights from data for concrete customer benefits.
In today’s ever-changing business world, competitors are no longer the traditional large organizations. They are agile organizations and entrepreneurs that are embracing new and exponential technologies to compete and disrupt markets through digitalization. Large, established organizations need to create a business construct and culture that is quick to recognize these challenges; to adapt, innovate and compete successfully in an ever-accelerating business environment.
Mass market disruption was considered fringe science for a long time. However, disruptive technologies and business models have become a common discussion around the boardroom table. These technologies need to be enabled by strategically aligning the development of digital capabilities of the organization’s people, culture, activities and structure to fundamentally dematerialize traditional concepts of products, services and knowledge. Digitally advanced organizations, where digital technology has transformed processes, talent engagement, and
business models, are integrating their digital strategy with the organization’s overall strategy1.
Organizations in Africa are digitalizing, although the level of digital maturity is not the same in all countries. The purpose of this report is to understand the relative degree to which digital is present within organizations in Africa and assess maturity across different industries (manufacturing, energy and transport) and countries (Ethiopia, Kenya, Nigeria and South Africa).
Ultimately, the question we asked was: “What is the state of digital maturity in Africa?” The research methodology used has been tailored to assess digitalization-relevant macro-economic, micro-economic and industry-specific indicators for Africa. There is an opportunity for developing nations to understand how digitalization can assist in solving challenges which are often unique to the continent. The findings from this report can be used by industry professionals, and government-owned entities operating within industry, to understand considerations when approaching digitalization in Africa
Introduction
Disclaimer
Foreword
Introduction
Research Methodology
Country Analysis
Industry Analysis
Industry Analysis: Manufacturing
Industry Analysis: Energy
Industry Analysis: Transport
Key insights and recommendations
Conclusion
Glossary of terms
References
INDEX (Click on categories to navigate)

The research conducted combined both primary and secondary methods within Africa. The primary research tool was made up of an assessment that included questions to understand organization and industry-specific digital indicators. The assessment was sent to existing and potential Siemens’ customers across South Africa, Nigeria, Kenya and Ethiopia. The method of contact included both email and SMS with the assessment being accessible for completion on PCs or mobile devices.
105 responses were received from South African organizations with respondents being in ownership,
C-suite, engineering and technical roles across the manufacturing, energy and transport industries. Limited responses from the other African countries were received and were discounted from the findings. Qualitative interviews were conducted with industry representatives from Siemens and an external service provider across South Africa, Nigeria, Kenya and Ethiopia. The purpose was to validate research findings and gather insight into the relative potential state of digital maturity in Africa.
Respondents’ and interviewee’s inputs and insights were kept confidential and as such stakeholders have not been cited nor directly referenced in this report.
Research Methodology
Digital Maturity Assessment (DMA) Approach
Continue
Figure 2: Research methodology overview
InfrastructureMacro-
EconomicIndicators
Economic Maturity
Environment Digital Literacy
Micro-EconomicIndicators
DigitalIndustry
Indicators
Products & customer
engagement
Coreoperations
Culture of innovation
Manufacturing
Energy
Transport(Road & Rail)
KEY: Country Specific
Organization specific
Industry specific
Number of Digital indicators #
9
5
7
4
4
4
4 8
10Disclaimer
Foreword
Introduction
Research Methodology
Country Analysis
Industry Analysis
Industry Analysis: Manufacturing
Industry Analysis: Energy
Industry Analysis: Transport
Key insights and recommendations
Conclusion
Glossary of terms
References
INDEX (Click on categories to navigate)
10

The industry-specific analysis looked at digital capabilities which contribute towards digitalization of the industry across a micro-economic and industry-specific perspectives. Levels of digitalization were classified into four maturity levels:
1 Emerging: countries/organizations are facing critical challenges in pursuing digital transformation in basic aspects. Where quantified, agreement or strong agreement to indicators were found to be <35 percent.
2 Developing: countries/organizations have started the digitalization path, providing the necessary environment for its development but still with significant challenges. Where quantified, agreement or strong agreement to indicators were found to be between 35 and 65 percent.
3 Established: countries/organizations have reliable digital adoption but with room for important advances in some areas. Where quantified, agreement or strong agreement to indicators were found to be between 65 and 90 percent.
4 Advanced: countries/organizations were categorized as having very high-levels of digital maturity and adoption. Where quantified, Agreement or Strong Agreement to indicators were found to be >90 percent.
An Advanced state of maturity allows for organizations to drive digitalization not only from a leadership level, but across the entire organization. It is important to understand this state because it was used as the relative point of assessment in this report. No indicators measured fell into this category.
Research Methodology
Continue
To assess the readiness of South Africa, Nigeria, Kenya and Ethiopia to capitalize on digitalization, we created a macro-economic digital maturity assessment (DMA) comprising of 26 individual indicators grouped into four pillars:
1 Economic Maturity: size, growth and sophistication of the economy.
2 Environment: the extent to which the business, legal and regulatory environment is conducive to digitalization.
3 Infrastructure: the extent of Information and Communication Technology (ICT) infrastructure that is currently in place for connectivity as well the affordability and use thereof.
4 Skills and Digital Literacy: the extent and quality of a country’s human resources and current use of digital technology and platforms.
Data for the individual indicators were sourced from surveys
and publications produced by the following international organizations and firms:
International Monetary Fund (IMF)
World Economic Outlook, October 2016
World Economic Forum (WEF) Global Information Technology Report, 2016
United Nations Development Programme (UNDP) Human Development Index, 2015
GSMA Mobile Intelligence, various publications
World Bank, Doing Business Survey 2016
Facebook penetration rate
ITU, various publications
Alliance for Affordable Internet (A4AI)
Harvard Atlas of Economic Complexity, 2014
Country Analysis
The computation of the overall DMA score is based on the following formula: Macro-economic DMA = Average (Economic Maturity + Environment + Infrastructure + Skills & Digital Literacy)
Industry Analysis
Disclaimer
Foreword
Introduction
Research Methodology
Country Analysis
Industry Analysis
Industry Analysis: Manufacturing
Industry Analysis: Energy
Industry Analysis: Transport
Key insights and recommendations
Conclusion
Glossary of terms
References
INDEX (Click on categories to navigate)

Research MethodologyIndustry Analysis continued
In this state of maturity, organizations create a culture of innovation according to a defined digital vision across executive leadership. The vision includes direction and clarity about the position the organization seeks within the digital ecosystem (e.g. platform, provider, retailer, etc.). Furthermore, buy-in and oversight from executives for developing a leading digital business is present and includes visible commitment, linkage to overall corporate objectives and executive metrics linked to digital initiatives.
Once executive leadership is aligned, there is a transition to digitalization that is supported by a strategic approach and roadmap that balances transitioning from the legacy business to the digital business. These advanced organizations typically engage with outside entities to shape standards and practices to support the business’s product and market objectives. The organization has robust financial budgeting and support and prioritizes digitalization business cases as they emerge.
The organization’s business model is defined and matches product offerings coordinated across digital and physical platforms, to avoid cannibalization. There is often a strategy for pricing digital offerings across channels and/or platforms, taking existing, new, and future offerings as well as routes to market into account. The business model strategically targets customer segments and includes cross-segment marketing campaigns with separate but coordinated physical and digital segmentation approaches. Business model evolution is supported by analysis of customer and consumer data and behavior to identify and realize revenue, margin or other brand-value opportunities across all customer engagement platforms.
Employees in Advanced state organizations are a key ingredient to their success. These organizations are able to proactively evaluate, determine, acquire, retain and reward the roles and responsibilities required in order to meet
digitalization objectives. Performance frameworks, and setting of associated personal and business objectives that take into account both linear/analogue/legacy and new digital elements of the organization, are defined and supported by activities related to the training and increasing of awareness needed to deliver in a digitalized environment.
Agile and proactive development of new and existing products with a focus on innovation is found. In Advanced maturity organizations, these product approaches are taken in relation to customer or consumer billing and account management to ensure a well-coordinated product and service strategy. These strategies are in turn supported by coherent and consistent approaches to process and workflow, across the core value chain, in order to support the creation and distribution of both legacy and new products. Inclusion of digital strategy in overall technology and infrastructure planning and decision making is also paramount. Underpinning the process, is a technology architecture that considers both digital and physical strategy architecting for agile, extensible and open technology environments. Architectures are designed to evolve as required by the organization including rapid scaling in support of new business models, products and platforms.
Finally, Advanced maturity organizations within the energy, transport and manufacturing industries have industry-unique characteristics. Assessment of digital maturity was based on understanding the extent of individual and combined states of Electrification, Automation and Digitalization per industry. This concept to approach digitalization is used by Siemens and practically allows organizations to progress their maturity.
As an example, digitalization of the manufacturing industry has progressed through different levels of industrialization. Once production is electrified and automated, digitalization can be achieved by connecting machinery in a ‘smart’ way and allowing software to intelligently improve productivity, speed and flexibility of production.
Disclaimer
Foreword
Introduction
Research Methodology
Country Analysis
Industry Analysis
Industry Analysis: Manufacturing
Industry Analysis: Energy
Industry Analysis: Transport
Key insights and recommendations
Conclusion
Glossary of terms
References
INDEX (Click on categories to navigate)

Much has been said, in recent years, about the influence of information and communication technology, or ICT, on economic growth and social development. The World Economic Forum Global Information Technology Report2 suggests that the global economy is entering a fourth industrial revolution, driven by exponential growth in the adoption of digital technology and unprecedented increases in access to knowledge and innovation in data processing and storage capabilities.
Countries that embrace new technological developments and deal with risks strategically are more likely to prosper and achieve inclusive growth. However, those who do not foster an environment in which digital technologies can flourish are likely to fall behind. They run the risk of facing increasing inequality and greater chances of economic divisions.
The aim of this chapter is to assess the ability of selected sub-Saharan economies to capitalize on digitalization given the prevailing macro-economic and business environment. The countries that have been included are the largest economies in Sub-Saharan Africa (SSA) viz. Nigeria, South Africa and two East African economies (Kenya and Ethiopia, which were identified as countries that had recently made great strides in ICT adoption).
Composition of the Macro-economic Review
The first pillar, Economic Maturity, is an assessment of the size, growth and sophistication of the economy. The rationale for the inclusion of this pillar is that digital technologies are likely to be more rapidly adopted in larger and faster growing economies that boast an established or growing middle class (proxied roughly as GDP per capita).
In addition, the more sophisticated the economy the more likely it is that a diverse range of services-
related and knowledge-intensive activity takes place which in turn, drives the demand and uptake of digital technology.
The second pillar, Environment, is a measure of the extent to which the country has a business, legal and regulatory environment that supports and protects the development of digital business. Here we have included indicators such as the overall ease of doing business, ability to enforce contracts, the presence and enforcement of ICT-related laws, the protection of intellectual property and evidence of ICT-related innovation and start-up activities. The third pillar, Infrastructure, assesses the extent to which the country has invested in the ICT infrastructure that is required to support the digital economy. Here we have included indicators on access to and use of infrastructure, as well as affordability. Indicators include access to international bandwidth, mobile-network coverage, internet and mobile-phone penetration, the costs of broadband and mobile-phone access.
The fourth pillar, Skills and Digital Literacy, reflects the human capital endowment of a country. The rationale for including this pillar is that digital technologies flourish in knowledge-based economies which also typically boast higher levels of educational attainment and provide better quality education. The current use of common digital platforms such as social media also provide an indication of how ‘digitally literate’ the population is.
The computation of the overall DMA score is based on normalized scores of individual indicators.
This is done by taking an average across the respective categories. Categories are aggregated into the four sub-indices which are then averaged to produce the overall DMA score.
Country Analysis
Continue
Disclaimer
Foreword
Introduction
Research Methodology
Country Analysis
Industry Analysis
Industry Analysis: Manufacturing
Industry Analysis: Energy
Industry Analysis: Transport
Key insights and recommendations
Conclusion
Glossary of terms
References
INDEX (Click on categories to navigate)

Country AnalysisWhere possible, the country scores per indicators have been normalized relative to the minimum and maximum score for the full assessment sample, which varies between a group of between 14 African countries (e.g. for GSMA indicators3), or 185 international countries (e.g. World Bank Doing Business Survey4).
The normalized score out of 100 therefore represents the distances from either the African or
Global benchmark depending on the indicator. Equal weighting has been assumed on all indicators within a category, and all categories within a sub-category.
The only exceptions are the scores for GDP and GDP per capita. These were multiplied by 10 to give them a reasonable weight in the Economic Maturity pillar score, as all four countries were very distant from the Global benchmark in terms of size of the economy and per capita income.
Table 1: Summary of the macro-economic assessment indicators
Continue
Pillar Sub-category Indicator
Economic maturity Size and growth GDP, current prices, $US billions. Forecast GDP growth rate (2017 to 2012).
Complexity Economc complexity index.
Environment Digital protection Laws relating to ICTs. To what extend does the regulator and/or competitions commission enforce the country’s ICT licencing requirements and regulations?
Business and Intellectual property protection. Judicial independance. regulatory environment Overall ease of doing business. Number of procedures to enforce a contract. Number od days to enforce a contract. Number od active tech hubs. Tech start-up funding landscape ($US million).
Infrastructure Access and use International internet bandwiths bit/s per internet user. Unique mobile subscribers, % population. Mobile Netwotk coverage, % population. 3G network coverage. Percentage of households with internet.
ICT affordability WEF NRI ICT affordability score. (prices for mobile, broadband and competition).
Skills and Digital Literacy Digital training Internet access in schools.
Digital tools usage Use of IP messaging. Facebook penetration rate.
Skills Secondary and Tersiary education gross enrolement rate. Population with some secondary education. Primary school teachers trained to teach.
Disclaimer
Foreword
Introduction
Research Methodology
Country Analysis
Industry Analysis
Industry Analysis: Manufacturing
Industry Analysis: Energy
Industry Analysis: Transport
Key insights and recommendations
Conclusion
Glossary of terms
References
INDEX (Click on categories to navigate)

Country AnalysisOverall results
Chart 1: Overall DMA Results Results from the above chart are discussed in greater detail under each pillar.
Economic Maturity pillar
The Economic Maturity pillar takes the size, growth and complexity of the economies into account. Overall, South Africa ranks number one, followed by Kenya, Ethiopia and finally, Nigeria (Chart 2).
There are three components to the size and growth indicator - GDP (current prices, US$ billions), expected GDP growth between 2017 and 2021, and finally, GDP per capita (current prices, US$).
Chart 2: Overall economic maturity pillar results
Continue
100
90
80
70
60
50
40
30
20
10
0 Economic Matirity Environment Infrastructure Skills & Digital Literacy
27
55
46
60
33
4449
82
2038 35
53
2633
18
43
Ethiopia Kenya Nigeria South Africa
100
90
80
70
60
50
40
30
20
10
0 Ethiopia Kenia Nigeria South Africa
Economic Complexity Size and Growth
51
36
37
29
A summary of the overall DMA scores by country, and scores for each of the four pillars and sub-categories is provided in Chart 1.
South Africa emerges as the country with the highest potential to realize digital maturity followed by Kenya, Nigeria and Ethiopia.
Disclaimer
Foreword
Introduction
Research Methodology
Country Analysis
Industry Analysis
Industry Analysis: Manufacturing
Industry Analysis: Energy
Industry Analysis: Transport
Key insights and recommendations
Conclusion
Glossary of terms
References
INDEX (Click on categories to navigate)
22
30
4
31

Country Analysis
Chart 3: Three components (GDP, GDP growth and GDP per Capita) of the Economic Size and Growth indicators
The relative performance of the four countries in terms of these three measures is summarized in Chart 3. While Nigeria has a larger economy than South Africa and is forecast to grow at a slightly faster rate over the next five years, it has a much lower per capita income so comes second to South Africa. The Ethiopian economy is roughly the same size as the Kenyan economy but scores slightly higher as it is expected to achieve faster average annual real GDP growth (7.2% over the next five years).
The economic complexity indicator provides an indication of the sophistication and diversity of economic activity in a country and is taken from the Harvard Atlas of Economic Complexity5. On economic complexity Kenya is strides ahead of both Ethiopia and Nigeria. The Harvard Atlas on Economic Complexity measures how a country’s total trade dynamics (imports, exports, growth and emerging industries, etc.) change over time. The atlas further explores a country’s potential for trade growth over the next five to ten years, and measures this against more than 100 countries
worldwide. On this basis it clarifies why a sizeable economy like Nigeria would be lagging. Unlike South Africa, Kenya and Ethiopia, Nigeria has a relatively undiversified trade profile. It is currently experiencing several policy challenges in diversifying the economy beyond oil.
McKinsey & Company6 report that Nigeria’s economy, like South Africa, is highly reliant on imported technology. However, as part of government’s support for local content, Nigeria is expanding into hardware manufacturing and software development. Nigeria manufactures laptops, and is looking to expand into affordable mobile phones for the domestic and regional market.
Kenya is the largest economy in East Africa. It acts as a port of entry for goods destined for most East and Central African countries6. Despite this it too faces high levels of unemployment and inequality. Due to it being a hub for trade in the region, it carries a higher ranking than a country like Ethiopia, which is land-locked and therefore
Continue
Ethiopia (GDP $62B) Kenya (GDP $63B) Nigeria (GDP $494B) South Africa (GDP $315B)
100
90
80
70
60
50
40
30
20
10
0
$1 000.000 $2 000.00 $3 000.00 $4 000.00 $5 000.00 $6 000.00 $7 000.00
$686.59 , 7.4$1 434.36 , 6.4
$2 763.14 , 2.5
$5 726.88 , 1.8
GDP per Capita $US/anum
Fore
cast
GP
D g
row
th (
20
14
to
20
17
)
Disclaimer
Foreword
Introduction
Research Methodology
Country Analysis
Industry Analysis
Industry Analysis: Manufacturing
Industry Analysis: Energy
Industry Analysis: Transport
Key insights and recommendations
Conclusion
Glossary of terms
References
INDEX (Click on categories to navigate)

dependent on neighboring countries to support trade. Ethiopia’s geographic position on the continent means that it is highly reliant on Kenya to facilitate its trade. Eritrea, Djibouti and Somalia are in conflict (and in most instances under sanction), and extremely under-developed in terms of industry and trade. It is unclear whether Kenya’s score in the atlas has been adjusted for the trade that would be in-transit to Ethiopia. The 2016 African Economic Outlook7 states that over the next three to five years, economies on the continent are expected to continue to strengthen their business environments, and expand regional markets to benefit from increased intra-regional trade, economies of scale and lower transaction costs. This, along with a
significant demographic dividend, means that opportunities exist for these countries to grow exponentially. Much of this, however, is highly dependent on developing and implementing the right polices, legislation, and institutions to take advantage of this potential. These aspects, when grouped with the ICT ‘revolution’, mean that countries like Kenya, Ethiopia, Nigeria and South Africa, have the opening to leapfrog economic development and compete with more developed economies across the globe. Of course, bear in mind that there are several context-specific indicators that work together to create favorable outcomes. Findings in this report should not be taken outside of consideration of these indicators.
Country Analysis
Environment in this instance refers to the kind of regulation that exists to enable a prosperous ICT sector, as well as the ease of doing business in the country. Investors need an environment that allows them to engage in business activities with a tolerable amount of risk and favorable return. Ideally, there should be stable institutions, low transaction costs and a flexible regulatory environment that lends itself to opportunities for foreign direct investment and social entrepreneurship. Anecdotally, it is often believed
that simply by the nature of their lower income status, and sometimes poor human development indicators, countries like Nigeria, Ethiopia, Kenya and South Africa do not offer the best returns for investors and entrepreneurs. Chart 4 indicates the rankings of the four countries for digital protection and the business and regulatory environment. Digital protection combines indicators for (i) laws relating to ICTs, (ii) the extent to which regulator or competition commission enforces the ICT licensing requirements
Continue
Chart 4: Overall results for the environmental pillar
Environment pillar
100
90
80
70
60
50
40
30
20
10
0 Digital Protection Business and Regulatory Environment
30
53
42
53
Ethiopia Kenya Nigeria South Africa
23
5850
67
Disclaimer
Foreword
Introduction
Research Methodology
Country Analysis
Industry Analysis
Industry Analysis: Manufacturing
Industry Analysis: Energy
Industry Analysis: Transport
Key insights and recommendations
Conclusion
Glossary of terms
References
INDEX (Click on categories to navigate)
Environment pillar

Country Analysisand regulations in the country, and (iii) intellectual property protection.
Overall South Africa ranks first, followed by Kenya, Nigeria and then Ethiopia. On digital protection South Africa and Kenya both score 53 and sit tied at number one (Chart 4). The government of Kenya has done a lot towards improving the regulatory environment for ICT, including removing VAT and import duties on handsets in 20096. The private sector, namely Safaricom, has also played a key role by investing in affordable access and technology literacy6.
Similarly, the South African government’s Department of Trade and Industry (dti) has implemented initiatives to improve the ICT environment, albeit within a rather fragmented policy environment. For example, the dti partnered with the Business Trust to increase the availability of skills, provide incentives and attract new investment to launch a successful business process outsourcing industry6. This may have partly assisted, but high connectivity costs and poor access in many parts of the country mean that ICT development does little to lower inequality in the country.
Due to several challenges within the ICT policy environment in South Africa, as well as service delivery issues experienced by government, several private sector organizations (banks,
telecoms, retailers, etc.) have stepped in to fill the gap. As a result, many services such as bank payments and transfers, billing, and so on are available through mobile and digital technology. Existing policies relating to the ICT sector in Nigeria, as stated in the National ICT policy (2012)8, require a review. There are currently, various uncoordinated policies guiding different facets of the Nigerian ICT sector. Ethiopia still faces a gap between its ICT ambitions to support economic growth and the policy and regulatory instruments to enable fulfilment9.
According to the World Bank Group’s Doing Business survey4, South Africa ranks 74 out of 190 countries. Nigeria received a ranking of 169; Kenya 92; and Ethiopia 159. A high (i.e. closer to one) ease of doing business ranking means the regulatory environment is more conducive to starting and operating of a local firm. The rankings are determined by sorting the aggregate distance to benchmark scores on ten topics, each consisting of several indicators, giving equal weight to each topic4. The rankings for economies are benchmarked to June 2016.
While this survey considers different indicators than what has been included above, it does provide a snapshot of the likelihood of improved digital maturity and its influence on the ability of the ICT sector to create the foundation for inclusive and rapid economic growth.
Continue
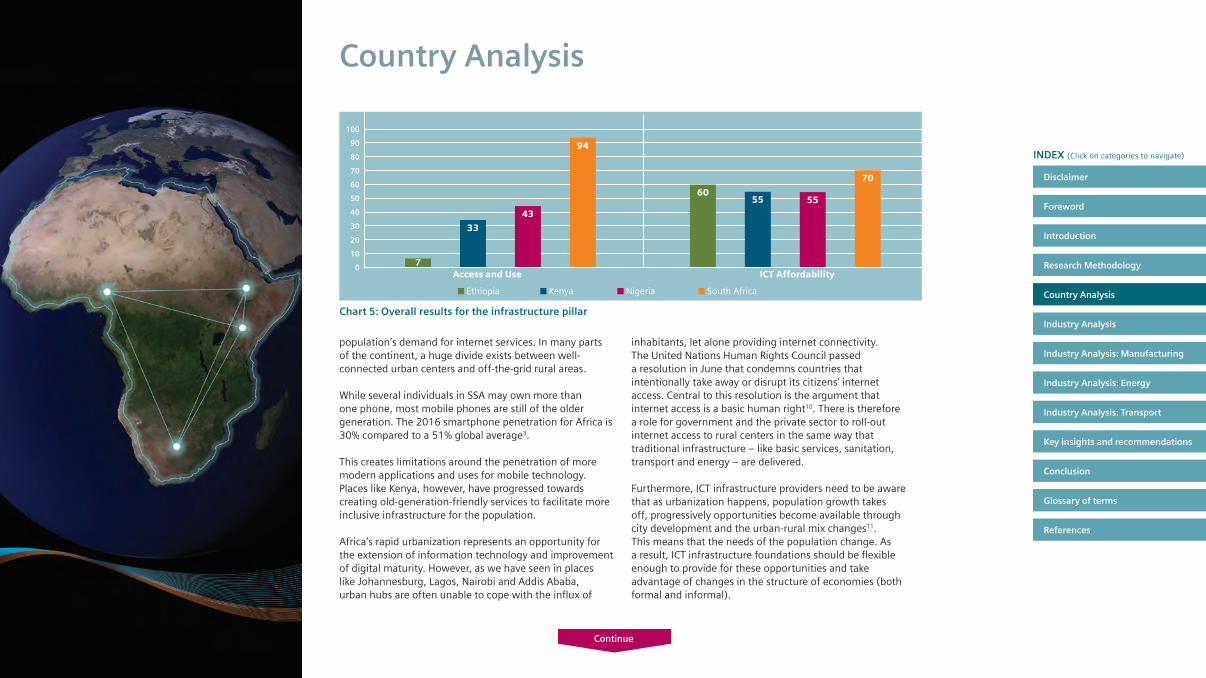
There are two dimensions to the Infrastructure pillar – Access and Use, and ICT Affordability. In terms of Access and Use, South Africa ranks first, followed by Nigeria, then Kenya, with Ethiopia lagging far behind with a score of 7 (Chart 5). The Access and Use measure takes account of:
1 international internet bandwidth bit/s per internet user
2 unique mobile subscription as a percentage of the population
3 mobile network coverage also measured as a percentage of the population
4 3G network coverage
5 the percentage of households with internet access
The World Economic Forum’s Global Information Technology Report (2015)2 explains that initiatives taken by countries to expand inclusive internet can be broken down into two groups. The first group is made up of initiatives that facilitate investments in networks in existing and new areas. These may be urban or rural, but mostly urban. The second group comprises plans and projects that increase the unconnected
Infrastructure pillar
Disclaimer
Foreword
Introduction
Research Methodology
Country Analysis
Industry Analysis
Industry Analysis: Manufacturing
Industry Analysis: Energy
Industry Analysis: Transport
Key insights and recommendations
Conclusion
Glossary of terms
References
INDEX (Click on categories to navigate)
Country Analysis
population’s demand for internet services. In many parts of the continent, a huge divide exists between well-connected urban centers and off-the-grid rural areas.
While several individuals in SSA may own more than one phone, most mobile phones are still of the older generation. The 2016 smartphone penetration for Africa is 30% compared to a 51% global average3.
This creates limitations around the penetration of more modern applications and uses for mobile technology. Places like Kenya, however, have progressed towards creating old-generation-friendly services to facilitate more inclusive infrastructure for the population.
Africa’s rapid urbanization represents an opportunity for the extension of information technology and improvement of digital maturity. However, as we have seen in places like Johannesburg, Lagos, Nairobi and Addis Ababa, urban hubs are often unable to cope with the influx of
inhabitants, let alone providing internet connectivity.The United Nations Human Rights Council passed a resolution in June that condemns countries that intentionally take away or disrupt its citizens’ internet access. Central to this resolution is the argument that internet access is a basic human right10. There is therefore a role for government and the private sector to roll-out internet access to rural centers in the same way that traditional infrastructure – like basic services, sanitation, transport and energy – are delivered.
Furthermore, ICT infrastructure providers need to be aware that as urbanization happens, population growth takes off, progressively opportunities become available through city development and the urban-rural mix changes11. This means that the needs of the population change. As a result, ICT infrastructure foundations should be flexible enough to provide for these opportunities and take advantage of changes in the structure of economies (both formal and informal).
Continue
Chart 5: Overall results for the infrastructure pillar
Environment pillar
100
90
80
70
60
50
40
30
20
10
0 Access and Use ICT Affordability
7
33
43
94
Ethiopia Kenya Nigeria South Africa
6055 55
70 Disclaimer
Foreword
Introduction
Research Methodology
Country Analysis
Industry Analysis
Industry Analysis: Manufacturing
Industry Analysis: Energy
Industry Analysis: Transport
Key insights and recommendations
Conclusion
Glossary of terms
References
INDEX (Click on categories to navigate)

Country AnalysisThe second element of the Infrastructure pillar is ICT Affordability. According to the World Economic Forum’s Networked Readiness Index ICT12 affordability score, South Africa also ranks number one, followed by Ethiopia, and Kenya and Nigeria tied in third.
This may very well have to do with the penetration of smart phones in the South African and Nigerian market, as well as the number of service providers. This ranking includes measures of the price for mobile and broadband connectivity, as well as competition within
the information technology sector.Even though South Africa ranks number one in this category in comparison to more developed countries, the cost of internet access is still relatively high particularly in relation to mobile data and broadband. Service providers argue that, in terms of the mobile network, prices are kept high to maintain connectivity speeds.
The cost to service providers is minimal but by lowering the price, the network would be unable to support the demand for access.
Continue
Skills and Digital Literacy pillar
The Skills and Digital Literacy pillar consists of three categories, Digital Training, Tools Usage and Skills which is a measure combining educational attainment with some indication of the quality of education provided in each country.
South Africa ranks first once again, followed by Kenya then Nigeria and finally Ethiopia. Ethiopia does relatively well in providing digital training which is proxied by a
measure of the availability of internet at schools, but educational attainment in Ethiopia is quite low. For example, only 12.5% of the population over the age of 25 years reported that they have some secondary (high school) education. Use of digital tools such as Internet Protocol (IP) messaging and Facebook is also relatively low. Only 5% of the population of Ethiopia are reported to use Facebook while less than 10% use IP messaging services which is one of the lowest figures
Chart 6: Overall results for the skills and digital literacy pillar
100
90
80
70
60
50
40
30
20
10
0 Digital Training Digital Tools usage Skills
45 48
33 37
2
23
4758
13
43
24
65
Ethiopia Kenya Nigeria South Africa
Disclaimer
Foreword
Introduction
Research Methodology
Country Analysis
Industry Analysis
Industry Analysis: Manufacturing
Industry Analysis: Energy
Industry Analysis: Transport
Key insights and recommendations
Conclusion
Glossary of terms
References
INDEX (Click on categories to navigate)

Country Analysisamong the 14 African countries surveyed by GSMA3 (hence the low normalized score of two). This calls for action to be taken to provide access to the internet and make the shift to smartphones more affordable in these countries. Kenya and South Africa fare much better than Nigeria and Ethiopia when it comes to educational attainment with scores of 43 and 65 respectively. The scores however are well below 100, meaning that both countries are still quite far off the
international benchmark for educational attainment. This is particularly evident in the gross tertiary education enrolment rate which is 4% for Kenya and 20% for South Africa compared against an international maximum score of 98% and minimum score of 2%.
Kenya achieved the highest score in Digital Training which was reflective of the high indicator scoring found in relation to internet access in Kenyan schools.
Figure 3: Summary of country macro-economic Digital Maturity Assessment
Summary of DMA scores by country
Continue
A summary of each country’s DMA scores relative to the international or regional benchmark (i.e. score of 100) as well as the average score achieved by the four countries is provided in the figures that follow
Summary of DMA scores Ethiopia Kenya Nigeria South Africa
Economic Assessment of size, growth and 27 55 46 60 Maturity sophistication of the economy
Extend to which the country has a
Environment business, legal and regulatory
33 44 49 82
environment that supports and protects the development of digital business
Infrastructure Infrastructure: extent to which the
20 39 37 55
country has invested in ICT infrastructure required to support the digital economy
Digital Digital literacy and skills: assessment 26 33 18 43 Literacy reflecting the human capital
endowment of a country
Country Macro-economic DMA 26 43 37 60
Disclaimer
Foreword
Introduction
Research Methodology
Country Analysis
Industry Analysis
Industry Analysis: Manufacturing
Industry Analysis: Energy
Industry Analysis: Transport
Key insights and recommendations
Conclusion
Glossary of terms
References
INDEX (Click on categories to navigate)

Country Analysis
Continue
South Africa scores above the four-country average in all areas except for Digital Training (internet access in schools). South Africa’s score is very close to the international benchmark in the area of Access and Use. This is largely because of very good mobile network access. The South African population has 100% mobile network coverage and 93% have 3G coverage.
In terms of mobile phone usage, South Africa also does well by international standards. The number of unique mobile subscriptions are 71% of the adult population. However, when it comes to internet access, only 37% of households have consistent
South Africa
Chart 7: Summary of South Africa’s DMA Scores in each category relative to four-country average
Average South Africa
0
20
40
60
80
100
Digital protection
Business and regulatory environment
Accessand Use
ICTAffordability
Skills
Digital Training
Digital Tools Usage
Size andGrowth
Complexity
access to the internet (which is defined as access any time over mobile phone or computer).
Despite the roll-out of initiatives to connect schools to broadband by government in Gauteng and Western Cape, most schools do not have internet access in the classrooms. The Gauteng government’s ‘Gauteng Online Schools Programme’13 project launched in 2002 aimed to connect 100% of schools in the province. However, an internal audit of the R1 billion programme revealed that the appointed contractor fell short of delivering on its mandate in many respects. The Gauteng Government is currently busy with the roll-out of a provincial broadband network to several government buildings and hopes to migrate the school programme onto the new network in time.
The Western Cape government in partnership with Neotel and the Cape Digital Foundation (a government agency) aims to connect all schools in the province with broadband. By March 2016 it had connected over 692 schools and created 3,300 smart classrooms.
South Africa is relatively close to the international benchmark in the areas of ICT Affordability and the general Business and Regulatory environment. South Africa scores close to 70 out of 100 on both counts. The WEF’s ICT Affordability measure includes prepaid mobile cellular tariffs in PPP $/min* , fixed broadband Internet tariffs in PPP $/month** and a measure of competition in the internet and telephony industry12.While mobile data and broadband costs in South Africa have fallen substantially in recent years, an assessment by the SA Institute of Race Relations in 2015 suggested that the average monthly mobile broadband fees in South Africa were still 10 times higher than those in the United Kingdom and 5 times higher than American fees with lower levels of service offered14.
* Prepaid mobile cellular tariffs in Purchasing Power Parity (PPP) $ per minute** Fixed broadband Internet tariffs in Purchasing Power Parity (PPP) $ per month
Disclaimer
Foreword
Introduction
Research Methodology
Country Analysis
Industry Analysis
Industry Analysis: Manufacturing
Industry Analysis: Energy
Industry Analysis: Transport
Key insights and recommendations
Conclusion
Glossary of terms
References
INDEX (Click on categories to navigate)

Country Analysis
Continue
Nigeria only scores above the four-country average in one area – Digital Tools Usage. Nigeria however scores close to, or on the four-country average in the areas of Business and Regulatory Environment, Digital Protection, ICT Affordability and Size and Growth.
Chart 8: Summary of Nigeria’s DMA Scores in each category relative to four-country average
Nigeria
A survey by GSMA on the mobile economy in Africa3 suggested that nearly 50% of Nigerians make use of Internet Protocol (IP) messaging services (e.g. WhatsApp, Snapchat, and WeChat), while 12% make use of Facebook.
It is interesting to note that while Nigeria scores much lower on the access and use measure than South Africa (a score of 44 as opposed to 94), the proportion of Nigerians using IP messaging is the same as it is in South Africa (close to 50%).
Taking a closer look at the access and use indicators for Nigeria, it is apparent that close to 100% of the population has mobile network coverage in Nigeria while 55% have access to a 3G network.
Internet penetration in Nigeria (defined as consistent access all the time to the internet via mobile or fixed line) is relatively low at 8.5% of the population.
Nigeria performs particularly poorly when it comes to the sophistication or complexity of its economy, with a score of less than 10 out of 100. This suggests that it remained too heavily reliant on a single commodity, oil, for export revenue.
Disclaimer
Foreword
Introduction
Research Methodology
Country Analysis
Industry Analysis
Industry Analysis: Manufacturing
Industry Analysis: Energy
Industry Analysis: Transport
Key insights and recommendations
Conclusion
Glossary of terms
References
INDEX (Click on categories to navigate)
Average Nigeria
0
20
40
60
80
100
Digital protection
Business and regulatory environment
Accessand Use
ICTAffordability
Skills
Digital Training
Digital Tools Usage
Size andGrowth
Complexity

Country Analysis
Continue
Kenya scores relatively well (above the four-country average) in the areas of Business and Regulatory Environment, Digital Protection, Complexity (or sophistication of the economy), Skills and Digital Training. The country performs relatively poorly when it comes to Access and Use, Digital Tools Usage as well as the Economic Size and Growth indicator.
As noted above, Kenya is ahead of both Ethiopia and Nigeria on the economic complexity measure. The Harvard Atlas on Economic Complexity measures how a country’s total trade dynamics (imports,
Chart 9: Summary of Kenya’s DMA Scores in each category relative to four-country average
Kenya
exports, growth and emerging industries and so forth) change over time. Kenya has a well-diversified economy with services accounting for roughly 60% of GDP.
Tourism is Kenya’s largest services industry and a mainstay of the economy but the country also has a relatively large and diverse agricultural industry. As the largest economy in East Africa, Kenya is also a vital port of entry for goods destined for most East and Central African countries6 and while its manufacturing industry only accounts for 14% of GDP it is the largest in the region. Kenya is recognized as one of the most computer literate societies in Africa and for the adoption of mobile-based services such as mobile money. This is reflected in part in relatively high scores for Digital Training and skills. However, in this context the relatively low scores on Access and Use and Digital Tools Usage are quite surprising and may reflect unequal access between people living in the relatively affluent urban areas and poor rural communities.
Data from GSMA suggest that only 23% of Kenya’s population use IP messaging services (as compared to nearly 50% in Nigeria and South Africa) while 15% use Facebook. 89% of Kenya’s population have access to a mobile network but this was the lowest of the four countries. As a result, Kenya received a normalized score of zero. This in part explains the oddly low overall access score. 64% of the population have access to a 3G network which is relatively high compared to Ethiopia and Nigeria. Kenya is also well ahead of Ethiopia and Nigeria when it comes to internet penetration – 16% of the population have consistent access to the internet.
Disclaimer
Foreword
Introduction
Research Methodology
Country Analysis
Industry Analysis
Industry Analysis: Manufacturing
Industry Analysis: Energy
Industry Analysis: Transport
Key insights and recommendations
Conclusion
Glossary of terms
References
INDEX (Click on categories to navigate)
Average Kenya
0
20
40
60
80
100
Digital protection
Business and regulatory environment
Accessand Use
ICTAffordability
Skills
Digital Training
Digital Tools Usage
Size andGrowth
Complexity

Country Analysis
Continue
Ethiopia is the smallest and least developed of the four economies assessed. It is not surprising to find that it is the laggard in most areas of the DMA. The exceptions are ICT Affordability and Digital Training where it slightly outperforms the average.
The lack of supporting ICT infrastructure in Ethiopia is likely to be one of the major indicators hindering growth and
Chart 10: Summary of Ethiopia ’s DMA Scores in each category relative to four-country average
Ethiopia
uptake of digital services. Ethiopia’s score on the Access and Use measure is only 7 out of 100.
While 90% of the Ethiopian population have access to a mobile network, access to the internet (fixed or mobile) is very limited. Only 7% of the population have access to a 3G network while only 2.9% of households have consistent access to the internet (fixed or mobile).
As a result, less than 10% of the Ethiopian population currently make use of IP messaging services and less than 5% use Facebook.
Ethiopia does relatively well on the ICT Affordability measure where based on the WEF measure it scores slightly higher than both Kenya and Nigeria but less than South Africa. The WEF’s ICT Affordability measure includes prepaid mobile cellular tariffs in PPP $/min, fixed broadband Internet tariffs in PPP $/month and a measure of competition in the internet and telephony industry12.
Ethiopia achieves a similar score to Nigeria in the World Bank’s Ease of Doing Business survey4, with a relatively low score of 47 out of 100 and tech innovation scores show that it currently attracts very little tech start-up funding relative to the other four countries; although there are evident signs of government driving activity in this space.
Disclaimer
Foreword
Introduction
Research Methodology
Country Analysis
Industry Analysis
Industry Analysis: Manufacturing
Industry Analysis: Energy
Industry Analysis: Transport
Key insights and recommendations
Conclusion
Glossary of terms
References
INDEX (Click on categories to navigate)
Average Ethiopia
0
20
40
60
80
100
Digital protection
Business and regulatory environment
Accessand Use
ICTAffordability
Skills
Digital Training
Digital Tools Usage
Size andGrowth
Complexity
The DMA provides an overview of the readiness of selected Sub-Saharan African countries to capitalize on the digitalization in four key areas – Economic Maturity, ICT Infrastructure, Skills and Digital Literacy.
While larger and more developed economies tend to be more digitally mature. The analysis has shown that there are many other indicators that can influence a country’s ability to capitalize on digitalization. If done correctly it can drive entrepreneurial competition in the market.
For example, while the Ethiopian and Kenyan economies are of a similar size and are growing at similar rate, Kenya is ahead of Ethiopia in terms of digital maturity. This is attributed firstly to Kenya having far more extensive ICT Infrastructure and particularly mobile internet or 3G infrastructure to support Access and Use and secondly because it is a much more diverse and services-oriented economy, which typically
supports and drives the expansion of digital services. While the Nigerian economy remains heavily reliant on oil for export revenues and on that basis is a relatively unsophisticated economy, it has also benefitted from extensive investment in ICT and particularly 3G network coverage. This infrastructure appears to have supported widespread uptake and the use of digital tools such as IP messaging and social networking.
South Africa with its relatively large and diverse economy and extensive and high-quality mobile broadband infrastructure, remains the leader of the four countries in most areas. There remains significant room for improvement when compared to the international benchmark in the areas of consistent and affordable internet access and the provision of digital training (internet in schools) and skills.
South Africa therefore has the highest digitalization Maturity of the countries assessed.
Conclusion of Macro-economic findings
Country Analysis
Disclaimer
Foreword
Introduction
Research Methodology
Country Analysis
Industry Analysis
Industry Analysis: Manufacturing
Industry Analysis: Energy
Industry Analysis: Transport
Key insights and recommendations
Conclusion
Glossary of terms
References
INDEX (Click on categories to navigate)

The manufacturing, energy and transport industries showed varied levels of maturity across micro-economic digital indicators. Focus should be placed on better customer engagement through orchestrated digital solutions to drive revenue generation with digitally enhanced product offerings.
The research conducted yielded 105 qualified responses around micro-economic digital indicators from various industries. While responses were received from outside South Africa, these were removed from the analysis as the number was not significant enough
to provide a relevant comparative understanding for Africa. South Africa’s digital maturity can be classified as Established. It has a reliable digital adoption but with room for important advances in areas which will be explored in this section.
The micro-economic indicators were structured to assess digital maturity across three dimensions:
1 Culture of Innovation2 Digital Operations3 Digital Customer and Offerings
Industry Analysis
Figure 4: Micro-economic Digital Maturity (South Africa)
Continue
Select research outcomes: Manufacturing Energy Transport Other Cross-industry
Culture ofInnovation
DigitalOperations
Digital Customer &Offerings
Micro-economic Digital MaturityFocus should be placed on better customer engagement through orchestrated digital solutions and to drive revenue generation withdigitally enhanced product offerings.
Leadership indicators included the existance of a long term plan for how digital will help to deliver organizational objectives. There was also agreement among respondents that leaders embrace digital change within their organizations.
Near unanimous agreement that digital skills were required in order to be successful and that their organization fully enabled employees by providing them with the digital tools they needed. Below average maturity in Energy and Transport with reference to integration of systems
On average 4 in 10 respondents from the entire sample agreed to having launched revenue generating digital solutions into the market. Around single view of customer, Energy was aligned with the industry norm, Manufacturing was 10% higher and Transport 20% less than the average.
Established Established Established Established Established
+0.1 -0.1 -0.4 0.1 • • • • •
Delta from Cross-indistry Average
2.8/3 2.6/3 2.2/3 2.6/3 2.7/3
Established Established Developing Established Established
Developing Developing Emerging Developing Developing
Disclaimer
Foreword
Introduction
Research Methodology
Country Analysis
Industry Analysis
Industry Analysis: Manufacturing
Industry Analysis: Energy
Industry Analysis: Transport
Key insights and recommendations
Conclusion
Glossary of terms
References
INDEX (Click on categories to navigate)

In order to drive digital maturity within an organization, effort must be put into creating a culture of innovation. This applies not only at the leadership level but also across the organization. The digital skillset of employees must be assessed and actively improved so that digital misnomers are understood. Misnomers regarding not only the misconceptions of job loss but also around the true nature of digitalization should be confronted. The former concern needs to be tempered through a better understanding that digital drives increased productivity, growth and ultimately creation of employment opportunities.
The Culture of Innovation was measured across two areas viz. (1) leadership; and (2) organization and talent. At least 4 out of 5 respondents pointed to the presence of both of these indicators across all the industries analyzed within South Africa (there was no considerable difference by industry).
Leadership indicators include the existence of a long-term plan for digital that enables organizational objectives. There was also agreement among respondents that leaders embrace digital change within their organizations.
The research found near unanimous agreement that digital skills were required in order to be successful. Most respondents went on to indicate that their organization fully enabled employees by providing them with the digital tools they needed to do their jobs.
When considering the same dimension for Africa, careful attention must be paid to the cultural and work ethic differences that may exist. Inherited maturity from large international organizations and vendors also tend to drive a certain culture that can bring accelerated maturity as long as local nuances are addressed.
Digitalization of operations refers to the ability to create, analyze and act upon data and information to drive decisions that are based on insight. This requires accurate data proliferation and integration of systems. As such, the research conducted measured digital operations across two areas viz. (1) data and information; and (2) systems efficiency and integration.
Data and information indicators showed Established maturity for the manufacturing and energy industries. These indicators look at whether internal data and information was easily collected, managed and shared across the organization. Further to this, the usage of data to make decisions was also assessed. Across these areas, there was a lower level of maturity, specifically in the transport industry, which poses an opportunity for development.
Digital indicators relating to system efficiency showed Established maturity in the manufacturing and transport industries. Below industry average maturity levels were found to exist in the energy
and transport industries with reference to indicators related to the integration of systems.
Ultimately, the goal of digitalizing operations is to ensure that technology, business and customer data is created, consolidated and analyzed across various islands of usage to provide insight and foresight. When considering these digital maturity dimensions within Africa, it was noted during industry representative conversations that the method of data collection and use must be interrogated.
Typically, the types of systems used can vary from spreadsheet applications to more advanced analytics; with the latter found to exist more often in large corporations that have implemented operations in Africa. Similarly, system integration, which is important for data completeness, may come inherently when large international organizations implement parent-company, or best-of-suite technology assets.
Industry Analysis
Continue
Culture of Innovation
Digital Operations
Disclaimer
Foreword
Introduction
Research Methodology
Country Analysis
Industry Analysis
Industry Analysis: Manufacturing
Industry Analysis: Energy
Industry Analysis: Transport
Key insights and recommendations
Conclusion
Glossary of terms
References
INDEX (Click on categories to navigate)

Digital Customers and Offerings
Industry Analysis
Research into the third micro-economic dimension for digitalization, Digital Customer Offerings, found a Developing level of maturity across the manufacturing and energy industries. The transport industry comparatively showed an Emerging maturity in this dimension and therefore represents an area of focus for the industry to enhance maturity.
Perspectives around the existence of a single view of the customer varied widely. While the energy industry showed maturity closely aligned with the industry norm, the manufacturing industry showed 10% higher evidence. On the other side of the spectrum, the transport industry showed almost 20% less evidence than the industry average.
This portion of the research also looked at whether respondents launched revenue generating digital solutions into the market. On average 4 in 10 respondents from the entire sample agreed to having done so. The manufacturing, energy and ‘Other’* industry respondents indicated a combined average of >20% non-applicability to this indicator; there is some reflection needed on this fact that points to a missed opportunity, since digital should drive better revenue generating offerings into the market –
regardless of whether this is done for end consumers (B2C) or other businesses (B2B).
Overall, opportunity exists in the way digital can better connect organizations with their customers. This can be done across the entire organization’s value chain. Digital enables omni-channel interaction across various products. Offerings themselves can be digitalized to become ‘self-aware’ in terms of how they adjust to the end customer needs. Robotic Process Automation (RPA) is allowing organizations to engage with the end customer over traditional systems but through a scalable workforce of robotic agents that learn and adjust how they interact with customers.
Similarly, large organizations are employing technologies that bridge the islands of automation that exist within their business environments. These systems allow for intelligent, autonomous, dynamic operations and offerings that adjust how they behave and interact across the value chain to provide increasing levels of efficiency and reliability. This is more deeply explored in the industry-specific analysis that follows.* Examples of ‘Other’ industries noted by respondents included: Engineering,
Mining, Electrical Automation, Industry Association, System Integration etc.
Disclaimer
Foreword
Introduction
Research Methodology
Country Analysis
Industry Analysis
Industry Analysis: Manufacturing
Industry Analysis: Energy
Industry Analysis: Transport
Key insights and recommendations
Conclusion
Glossary of terms
References
INDEX (Click on categories to navigate)

Figure 5: Manufacturing industry digital maturity (South Africa)
Industry Analysis: Manufacturing
Continue
Africa’s manufacturing industry presents above average digital maturity when compared to other industries. Opportunity exists to uniquely solve for African challenges through the use of disruptive technologies; especially in order to address supply chain challenges.
Digitalization within the manufacturing industry goes beyond the automation of production. It paves the way for new methods and approaches to manufacturing processes and the supply chain that enables it. The proliferation of ‘smart’ technology within the manufacturing industry creates real opportunities to merge the digital and physical worlds. For example machinery that adjusts its operating parameters based on the information it receives from other machines. This allows manufacturers to create networks of advanced capabilities that create opportunities to better influence production performance, predictability and scalability; this is the
practical realization of Industry 4.0. Within an African context, there is a unique path that presents itself to realize how Industry 4.0 creates smart technology, smart plants, smart products and smart services – all of which needs to serve increasingly smart customers! Based on the interviews conducted, the research noted that the manufacturing industry within Africa is comprised predominately of two types of organizations: (1) “family-owned” small and medium organizations competing with (2) large international organizations.
It is important to note that the maturity scoring explained over the next few sections is based on large international organizations, as majority of the respondents hailed from these types of businesses.Digital maturity measured within South Africa presented an above average maturity in both the micro-economic and industry-specific dimensions.
Manufactiring Digital MaturityOpportunity exists to uniquely solve Africa’s challenges through the use of disruptive technologies; especially so to improve supply chain challenges for manufacturers.
+0.5
+0.1 • •
Delta from Cross-indistry Average 2.2/3 1.7/3
2.8/3 2.7/3
AdvancedMaterials
DigitalTwin
DigitalValue Chain
ManufacturingAutomation
ManufacturingAnalytics
Emerging
Developing
Developing
Established
Established
Emerging
Developing
Developing
Developing
Established
AdditiveManufacturing
Real-timeMonitoring
SmartProduct Data
Connected Machines
PLM
Almost one in two respondents indicated that their organisation maintained a digital representation (or a “digital twin”) of some piece of equipment, plant or machine to improve efficiency and quality. This response was noted as being unusually high when discussed during SME conversation and attributed somewhat to the potential existance of CAD and CAM technology in the industry.
Three in ten respondents indicated that they were already making use of 3D printing technologies for prototyping parts and products in South Africa.
• • Manufacturing Cross-industry
Industry-specific score
Macro-economicscore
Disclaimer
Foreword
Introduction
Research Methodology
Country Analysis
Industry Analysis
Industry Analysis: Manufacturing
Industry Analysis: Energy
Industry Analysis: Transport
Key insights and recommendations
Conclusion
Glossary of terms
References
INDEX (Click on categories to navigate)

Micro-economic Recap
Manufacturing Digitalization
Industry Analysis: Manufacturing
Continue
The manufacturing industry relies on specific macro-economic as well as infrastructure inputs such as raw materials, energy and labor. Outside of these basic inputs, digital maturity within the industry is influenced by indicators within the operational environment; specifically
the (1) Culture of Innovation, (2) Digital Operations and (3) Digital Customer Offerings. The manufacturing maturity scoring for South Africa indicated an Established level of maturity across the first two indicators with a Developing maturity measured for the third.
The research conducted measured an Emerging maturity across advanced materials and additive manufacturing indicators. These indicator measurements were found to be valid, based on feedback from industry representatives, given that the base of respondents came from a number of large international corporations. Three in ten respondents indicated that they were already making use of 3D printing technologies for prototyping parts and products in South Africa. This level of adoption is encouraging and is believed to be driven by the large organizations with cross-continental operations.
Within the context of Africa, these technologies offer an opportunity to resolve unique challenges related to supply chain logistics. African landscapes are vast and business hubs scattered. As long as additive materials can be transported to their end location, 3D printers can be used to service needs for replacement parts and/or manufacturing tools and alleviate the needs for costly supply chains. This can work well in the manufacturing industry where parts, that can take a long time to deliver, can be manufactured in-house based on vendor specifications. 46% of respondents indicated that their organization maintained a digital representation (or “digital twin”) of some piece of equipment, plant or machine to improve efficiency and quality. This response was noted as being unusually high when discussed during SME conversation and attributed
somewhat to the potential existence of Computer Aided Design (CAD) and Computer Aided Manufacturing (CAM) technology in the industry. The true implementation of digital twins however would refer to Cyber Physical Systems (CPS) that allow manufacturers to respond flexibly to customer behavior and market changes.
Other areas of Developing maturity in this industry were related to:
Real-time monitoring of equipment for maintenance purposes
Existence of digital tools to view the manufacturing value chain
The use of data from smart products by product managers to improve product supply, demand and design
The use of automation solutions to increase productivity and ensure quality consistency
Across all the areas of Developing maturity it was noted, during SME reviews, that opportunities would exist in Africa. This again is attributed to the presence of large international organizations that would have similar or lower levels of maturity to those that provided a response in the survey.
With deeper inspection, these trends are still in their infancy in manufacturing organizations, industrial sectors and geographies, however in others, the transformation to Industry 4.0 is already well underway.
Disclaimer
Foreword
Introduction
Research Methodology
Country Analysis
Industry Analysis
Industry Analysis: Manufacturing
Industry Analysis: Energy
Industry Analysis: Transport
Key insights and recommendations
Conclusion
Glossary of terms
References
INDEX (Click on categories to navigate)
Real-Time Data
Automation versus Digitalization
Industry Analysis: ManufacturingIndustry 4.0
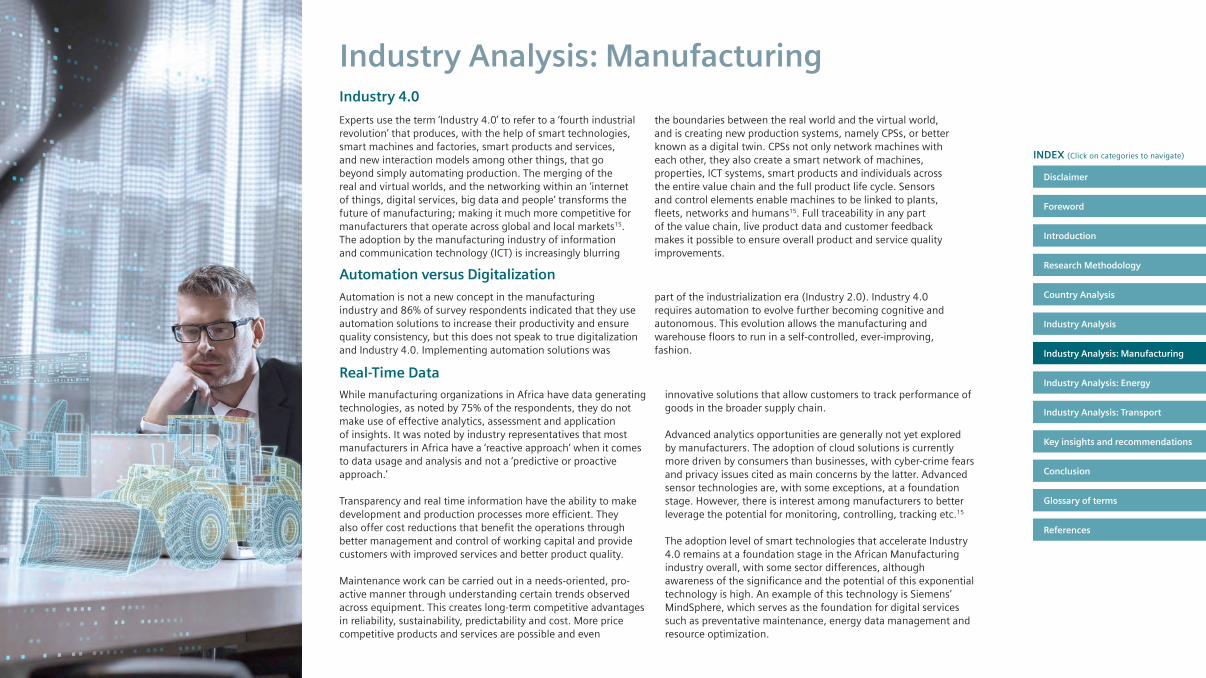
Experts use the term ‘Industry 4.0’ to refer to a ‘fourth industrial revolution’ that produces, with the help of smart technologies, smart machines and factories, smart products and services, and new interaction models among other things, that go beyond simply automating production. The merging of the real and virtual worlds, and the networking within an ‘internet of things, digital services, big data and people’ transforms the future of manufacturing; making it much more competitive for manufacturers that operate across global and local markets15. The adoption by the manufacturing industry of information and communication technology (ICT) is increasingly blurring
the boundaries between the real world and the virtual world, and is creating new production systems, namely CPSs, or better known as a digital twin. CPSs not only network machines with each other, they also create a smart network of machines, properties, ICT systems, smart products and individuals across the entire value chain and the full product life cycle. Sensors and control elements enable machines to be linked to plants, fleets, networks and humans15. Full traceability in any part of the value chain, live product data and customer feedback makes it possible to ensure overall product and service quality improvements.
Automation is not a new concept in the manufacturing industry and 86% of survey respondents indicated that they use automation solutions to increase their productivity and ensure quality consistency, but this does not speak to true digitalization and Industry 4.0. Implementing automation solutions was
part of the industrialization era (Industry 2.0). Industry 4.0 requires automation to evolve further becoming cognitive and autonomous. This evolution allows the manufacturing and warehouse floors to run in a self-controlled, ever-improving, fashion.
While manufacturing organizations in Africa have data generating technologies, as noted by 75% of the respondents, they do not make use of effective analytics, assessment and application of insights. It was noted by industry representatives that most manufacturers in Africa have a ‘reactive approach’ when it comes to data usage and analysis and not a ‘predictive or proactive approach.’
Transparency and real time information have the ability to make development and production processes more efficient. They also offer cost reductions that benefit the operations through better management and control of working capital and provide customers with improved services and better product quality.
Maintenance work can be carried out in a needs-oriented, pro-active manner through understanding certain trends observed across equipment. This creates long-term competitive advantages in reliability, sustainability, predictability and cost. More price competitive products and services are possible and even
innovative solutions that allow customers to track performance of goods in the broader supply chain.
Advanced analytics opportunities are generally not yet explored by manufacturers. The adoption of cloud solutions is currently more driven by consumers than businesses, with cyber-crime fears and privacy issues cited as main concerns by the latter. Advanced sensor technologies are, with some exceptions, at a foundation stage. However, there is interest among manufacturers to better leverage the potential for monitoring, controlling, tracking etc.15
The adoption level of smart technologies that accelerate Industry 4.0 remains at a foundation stage in the African Manufacturing industry overall, with some sector differences, although awareness of the significance and the potential of this exponential technology is high. An example of this technology is Siemens’ MindSphere, which serves as the foundation for digital services such as preventative maintenance, energy data management and resource optimization.
Disclaimer
Foreword
Introduction
Research Methodology
Country Analysis
Industry Analysis
Industry Analysis: Manufacturing
Industry Analysis: Energy
Industry Analysis: Transport
Key insights and recommendations
Conclusion
Glossary of terms
References
INDEX (Click on categories to navigate)

Figure 6: Energy Industry Digital Maturity (South Africa)
Industry Analysis: Energy
Micro-economic Recap
The energy industry within Africa presents digital maturity just below average when compared to other industries. Digitalization efforts must focus on solving unique supply-side challenges by bridging gaps across current emerging generation capabilities.
Without stable electricity it is challenging to do anything digitally, which is a fundamental infrastructure problem. Low levels of infrastructure and power supply are a deterrent for
many wanting to invest across various industries in Africa16. Some of the main challenges facing the African power industry are related to unreliable generation capacity, costly transmission, limited skilled workforces and underdeveloped customer and billing management systems. Digital maturity measured within South Africa presented a scoring just below the cross-industry average in both the micro-economic and industry-specific dimensions.
The energy industry drives critical infrastructure components that contribute to macro-economic maturity. Outside of this perspective, digital maturity within the industry is influenced by indicators within the operational environment; specifically the
(1) Culture of Innovation, (2) Digital Operations and (3) Digital Customer Offerings. The energy industry maturity score for South Africa indicated an Established level of maturity across the first two indicators with a Developing maturity for the third.
Continue
Energy Digital MaturityOpportunity exists to uniquely solve Africa’s chalenges through the use of disruptive technologies; especially so to improve supply chain challenges for manufacturers.
-0.1
-0.1 • •
Delta from Cross-indistry Average 1.6/3 1.7/3
2.68/3 2.7/3
Real-timeMonitoring
Integrated Energy Management
SmartNetworks
DemandManagement
Developingg
Emerging
Developing
Developing
Field ServiceAutomation
SupplyManagement
DistributedGeneration
OperationalSafety
• • Energy Cross-industry
Emerging
Emerging
Developing
Developing
Industry-specific score
Macro-economicscore
Almost two out of three survey resopndents indicated that they are able to manage their network infrastructure through smarter energy systems supporting better energy management and pricing structures
Truly managing different energy sources in Africa with no micro-grid pressence
Less than one third of survey respondents have given their field workforce access to mobile solutions. Support in the field on how to complete tasks based on standard operation procedures (SoP) are not digitalized and opportunity exists here to counter the effects of scarce skilled labour through field service automation
In many countries across the continent populations are highly dispersed, and this challenges the traditional grid model, where transmission and distribution costs begin to make up an unsustainable part of the energy price. This creates a bias for distributed energy systems, but affordability can remain a key inhibitor as funding remains a challenge
Disclaimer
Foreword
Introduction
Research Methodology
Country Analysis
Industry Analysis
Industry Analysis: Manufacturing
Industry Analysis: Energy
Industry Analysis: Transport
Key insights and recommendations
Conclusion
Glossary of terms
References
INDEX (Click on categories to navigate)

Energy Digitalization
The research conducted measured an Emerging maturity across the Field Service Automation and Integrated Energy Management indicators. Support in the field on how to complete tasks based on standard operating procedures (SOPs) are not digitalized and an opportunity exists here to counter the effects of scarce skilled labor through field service automation.
The maturity of integrated energy management systems in Africa is expected to also be Emerging based on feedback from the SMEs. Few organizations are truly managing different energy sources in Africa with limited micro-grid presence that combine utility-sources and independently generated power. It is interesting to note that in South Africa the cost of generating power independently is higher than obtaining power from Eskom.
Certain parts of Durban in South Africa are powered entirely by established sugar manufacturers in the area. There is growing maturity in South Africa around tariff policy for Independent
Power Producers (IPPs) that incentivize generating and putting power back into the grid.
Africa, being a wealth of resources, has the ideal opportunity to advance integrated energy solutions, but unless existing islands of excellence are managed in an integrated fashion this is unlikely to result in a solution to the continent’s energy challenges. A report by the International Energy Agency noted that between 2000 to 2012 energy demand in SSA grew by around 45%, whilst more than 620 million people have no access to electricity17.
Another area noted to be in an Emerging state within the energy industry was Supply Management. Responses indicated that maturity improvements could be made to enable organizations to alternate the power generation mix to maximize efficiency. While Eskom is able to switch supply in an effective manner, industry players generally only have back-up power for automatic cut over but not planned or real-time mixing of supply.
Industry Analysis: Energy
Continue
Smart TechnologiesTwo thirds of the survey respondents indicated that they are able to manage their network infrastructure through smarter energy systems supporting better energy management and pricing structures16. Smart technology is also changing the relationship between energy producers and consumers.
Greater energy usage visibility is enabling consumers to better manage household spend. It is also allowing energy producers to optimize their generation and distribution costs. Excess energy generated has export potential, especially between neighboring African countries. Optimizing asset utilization and operational efficiency can be major benefits of smart grid solutions.
Electricity supply networks that use digital communications technology like GSM (Global System for Mobile Communications) or PLC (Power-Line Communication), to analyze, detect and react to local changes, are increasingly being incorporated into the African power utilities’ action plans16.
The progress each country is making against their plans differs. South Africa is advancing in line with other developed countries. Kenya and Ethiopia have already developed “good” systems according to industry professionals. The same team of professionals agree that Nigeria is finding ways to better utilize their existing infrastructure.
Disclaimer
Foreword
Introduction
Research Methodology
Country Analysis
Industry Analysis
Industry Analysis: Manufacturing
Industry Analysis: Energy
Industry Analysis: Transport
Key insights and recommendations
Conclusion
Glossary of terms
References
INDEX (Click on categories to navigate)

Industry Analysis: Energy
Continue
Digitalization in Action:Jeffrey’s Bay Wind Farm24/7 Remote Monitoring via Brande, Denmark
• Remote diagnostics centre in Denmark to monitor more than 10,000 installed Siemens wind turbines worldwide with over 200 gigabytes of new data collected each day
• More than 130 experts with 15 years of expertise analyse data to prevent maintenance for the wind turbines
• Help customers to lower the overall cost of energy and operate at maximum efficiency
• Contribution to enhance turbine performance over a long term and draw trends from data collected.
On revenue management, most countries in Africa have adopted numerous payment methods for electricity, ranging from the old-school walk-in cash transactions to mobile and internet payments. In South Africa for instance, the introduction of prepaid metering is improving the revenue management system in the country’s energy industry. This is also the case in areas where pilot off-grid renewable energy is being implemented16.
In Kenya, the Lake Turkana Wind Power (LTWP) project is the largest single wind power project in Africa18. Different features and technologies help turn wind turbines into even more productive, reliable, and adaptable assets. By doing so, they fulfil diverse needs. However, while this island of excellence exists, the distribution of the generated energy is not reaching the masses, due to the lack of transmission and distribution infrastructure.
With aging assets and an aging workforce, utilities need to find more effective and efficient ways to maintain and monitor their critical assets through the introduction of networked smart grids and intelligent devices on the power grid – with high availability and reliability. The ultimate objective of traditional or smart asset management is to reduce, minimize and optimize asset lifecycle costs across all phases19.
Few utilities in Africa monitor their equipment in real-time for maintenance purposes with on average, one in two survey respondents indicating that this was done. There are mining organizations in South Africa running pilots in monitoring automation and aggregating data for real-time analytics.
Disclaimer
Foreword
Introduction
Research Methodology
Country Analysis
Industry Analysis
Industry Analysis: Manufacturing
Industry Analysis: Energy
Industry Analysis: Transport
Key insights and recommendations
Conclusion
Glossary of terms
References
INDEX (Click on categories to navigate)

The definition of energy in Africa is an interesting one as consumers still make use of kerosene lamps and stoves, and the use of wood for heating and cooking is significant. This talks to the infrastructure gap that exists on the continent. However, Africa’s energy mix is changing, as noted in Chart 11, driven in part by the fact that the region’s energy woes have been underpinned by the reliance on a single source of electricity production. This overreliance on a single source of energy generation is waning and sources are diversifying16.
It is important to understand that African countries with its distributed population make it difficult to only make use of energy grids that follows a centralized distribution model. The cost of transmission to customers is high and there should be an increasing bias towards decentralized distributed power. In this regard, digitalization can assist in enabling decentralized power generation through intelligent integration of energy supply structures, forecasting for optimum scheduling and real-time optimization.
While power generation from coal still accounts for an important share of the energy mix in the foreseeable future, African countries are reducing their dependence on coal and oil-based energy sources. Countries are diversifying into more sustainable solutions including non-hydro renewables and natural gas, as the fast-dropping cost of these technologies make them increasingly viable16. The premium put on products and services for socially and environmentally considerate products is minimal or does not exist in Africa.
Just having affordable energy is the first objective. In Nigeria large organizations generate their own energy and also sell to neighboring consumers. In some instances, these generators can create up to 1 MW of energy. Digitalization can offer
unique solutions such as using blockchain for Independent Power Producers (IPPs) to better control transactions making it easier to trade power between generators, suppliers and consumers.
To address some of the long-term issues of energy security, increased regional collaboration is crucial. Kenya for example does not have a lack of energy supply, however, a great number of the population cannot afford it and electricity. It is still seen as a luxury. More affordable tariffs and an optimal generation capacity could be developed in the energy industry through infrastructure linkages of power utilities and the regional power pools. These challenges also include overcoming the energy industry’s funding gaps16.
Energy Mix
Industry Analysis: Energy
Continue
Chart 11: SSA’s Diversifying energy mix (2011 vs 2022f)16
100
90
80
70
60
50
40
30
20
10
0 2011 2020f
Disclaimer
Foreword
Introduction
Research Methodology
Country Analysis
Industry Analysis
Industry Analysis: Manufacturing
Industry Analysis: Energy
Industry Analysis: Transport
Key insights and recommendations
Conclusion
Glossary of terms
References
INDEX (Click on categories to navigate)
KEY:
Non-Hydropower Renewables
Hidropower
Nuclear
Oil
Natural Gas
Coal

Utilities today are at a crossroad, looking for ways to moderate capital investments while also enhancing operational capabilities. While many utilities are undertaking large-scale initiatives, few have realized the full potential of enhancing their operations by modernizing the processes and technology in the field.
Utilities that modernize their field service operations for a modest investment can gain real value, such as cost efficiency, improved productivity, higher reliability, enhanced safety, and greater customer satisfaction.
Mobility should no longer lie at the fringe of the utilities discussion, yet less than a third of survey respondents have given their field workforce access to mobile solutions. Mobility solutions should be at the heart of
organization strategy so that the industry at large can find innovative ways to increase the efficiency and productivity of one of its most valuable resources, the field workforce. They are on the front line of customer service.
By providing field workers with tools that can help them accomplish tasks more effectively and efficiently, utilities can stay competitive and gain top-line growth by enhancing greater productivity, cost savings, reliability, compliance and safety.
With fast, seamless access to organization data, applications and business processes, the workforce in the field can make better decisions that can significantly improve operations and service delivery.
Workforce Mobility
Industry Analysis: Energy
Disclaimer
Foreword
Introduction
Research Methodology
Country Analysis
Industry Analysis
Industry Analysis: Manufacturing
Industry Analysis: Energy
Industry Analysis: Transport
Key insights and recommendations
Conclusion
Glossary of terms
References
INDEX (Click on categories to navigate)

The transport industry within Africa presents digital maturity below average when compared to other industries assessed. The Rail sector requires focus on electrification and automation of the network. The Road sectors requires focus to extend existing solutions and avoid new ‘islands of excellence’ that only solve point-to-point needs of citizens but not for end-to-end mobility.
New ways of using existing infrastructure more efficiently are being enabled through digitalization in the transport industry. It offers the chance to rethink approaches to mobility challenges
and prepare for a transportation system based on a very different set of features to the one we grew up with. The challenge that policymakers face — from auto manufacturers, transit officials, for-profit and non-profit entrepreneurs — is how to solve overarching mobility needs of end users and not just point-to-point solutions. This requires looking across both road and rail to unlock opportunities for mobility solutions, enabled through digitalization. Digital maturity measured within South Africa presented a scoring below the cross-industry average in both the micro-economic and industry-specific dimensions.
Figure 7: Transport (Road and Rail) Industry digital maturity (South Africa)
Industry Analysis: Transport
Continue
The transport industry drives critical infrastructure components that contribute to macro-economic maturity. Outside of this perspective, digital maturity within the industry is influenced by indicators within the operational environment; specifically the (1) Culture of Innovation, (2) Digital Operations and (3) Digital
Customer Offerings. The transport maturity scoring for South Africa indicated an Established level for the first indicator, a Developing maturity scoring for the second dimension and an Emerging maturity for the third.
Micro-economic Recap
Transport Digital MaturityRail focus should move beyond electrification and automation to truly digital capabilities for rail. Road focus should extend existing/avoid new ‘islands of excellence’ and solve for mobility needs of citizens.
-0.5
-0.4 • •
Delta from Cross-indistry Average 1.2/3 1.7/3
2.3/3 2.7/3
Digital Asset Management
Real-timePerformanceManagement
OfferingAutomation
Customer InfoComm
Real-timeMonitiring
Digital Management System
OperationalSafety
PerscriptiveMaintenance
InfrastructurePlanning
E-ticketing
• • Transport Cross-industry
Industry-specific score
Macro-economicscore
Excluding Not Applicable responses, there was even split of agreement and disagreement by respondents related to the existence of digital management systems to monitor incidents on their transport infrastructure
Maturity around the use of automation to enhance capacity, reliability and convenience of transportation offerings was also noted as developing
Many transport organizations indicated that they make use of digital management systems to determine lifecycle status, costing, and financial performance of assets. These indicator measurements were found to be inaccurate, based on feedback from industry representatives who noted that in most cases these are not being tracked digitally.
Emerging
Emerging
Developing
Emerging
Emerging
Developing
Emerging
Emerging
Emerging
Emerging
29% of respondets indicated that customer payments can be made through digital channels - this is largely accounted to B2B transactions. 29% of respondets indicated that infraastructure decisions are supported by data analysis. Considering these two responses, significant opportunity lies in driving digital methods of payment and using this data to then support better decision making re infrastructure
Disclaimer
Foreword
Introduction
Research Methodology
Country Analysis
Industry Analysis
Industry Analysis: Manufacturing
Industry Analysis: Energy
Industry Analysis: Transport
Key insights and recommendations
Conclusion
Glossary of terms
References
INDEX (Click on categories to navigate)

The transport industry within South Africa leads in comparison to other African countries. Despite that, there were only two out of ten indicators that were Developing in maturity; all the others were measured as Emerging maturity. The focus on Africa should be on enabling Emerging capabilities to Developing ones since the challenges faced
in this industry are basic ones. Auto-manufacturer’s focus on next-generation vehicles that embrace the “information everywhere” world, will utterly disrupt the transportation status quo. What would the impact be in Africa, where less than 1% of the population owns a car, and connectivity and electricity remains a challenge?
Industry Analysis: Transport
Continue
Transport Digitalization
50% of respondents agreed to the use of digital management systems to monitor incidents on their transport infrastructure. Maturity around the use of automation to enhance capacity, reliability and convenience of transportation offerings measured at Developing - automation of the railway optimizes signaling to increase throughput. One of the challenges is the misconception of digitalization and the benefits it offers the industry.
Many transport organizations indicated that they make use of digital management systems to determine lifecycle status, costing, and financial performance of assets. These indicator measurements were found to be inaccurate, based on feedback from industry representatives who noted that in most cases these are not being tracked digitally. This gap represents an area of focus for the industry.
Digital management systems
Automation, to some degree, is not new to transport. Country statistics and police reports often point to human error as being the single greatest cause of injury and death in transport systems. This is despite great advances in technology that has improved safety through better signaling systems and automotive safety features. A South African rail accident that occurred in October 2016 was caused by the driver passing a red light signal20. This could have been avoided if the train was automated.
Today automation is based on the foundation of science and engineering. As we progress towards greater degrees of automation, the logic of engineering is being disrupted by the exponential potential offered by cognitive technologies. This technology is able to analyze vast quantities to data points, giving transport systems and human operators the ability to continuously learn, make informed decisions in real time, and also predict and anticipate conditions ahead.
Transport organizations are also putting emphasis on digital technologies which ensures safe operations. Using advanced software, digital technologies allow trains to check the state of rail signals and to intervene if the driver is acting in contradiction to the signal. Autonomous driving on rail requires infrastructure to pass through the stages of electrification and automation in order to be digitalized.
Technological advances are reshaping the travel experience. In South Africa, the Ekurhuleni municipality endeavors to become a smart and sustainable city. They’ve recently launched a state-of the-art Transport Management Centre (TMC), which is the nerve center for the management of their Bus Rapid Transit (BRT) system. The facility is vital in monitoring activities along the transport corridor through CCTV cameras – improving turnaround time from any disruption or act of crime21. Kenya’s Transport Integrated Management Systems (TIMs) was established to implement an
Automation
Disclaimer
Foreword
Introduction
Research Methodology
Country Analysis
Industry Analysis
Industry Analysis: Manufacturing
Industry Analysis: Energy
Industry Analysis: Transport
Key insights and recommendations
Conclusion
Glossary of terms
References
INDEX (Click on categories to navigate)

Industry Analysis: Transport
Continue
Open data is transforming the way we use transport. Information is as much basic part of the infrastructure of transport as roads and rails are. The combination or fusion of multiple sources of data has implications for transport operators, who have to rely on incomplete data to monitor and predict the state of their network.
By fusing data sets they create a more accurate and richer picture of their operations and correlate the running of services with the interventions they make.
Innovative traffic management systems interconnect roads and rails, while information systems help passengers find efficient travel routes. Fully automated metros can be flexibly adapted to passenger volume while dynamic traffic control systems guarantee an optimized traffic flow. The result: Optimally networked conurbations that flexibly adapt to changing requirements23.
Even though most transport organizations are monitoring their equipment, maintenance is done after the fact and not pro-actively. Even so, this is sometimes noted as predictive maintenance and represents a digital misnomer in Africa.
Predictive MaintenanceDigitalization in Action:Centrally Controlled Operations Centre - Gauteng Nerve Centre • A new signalling system on the PRASA network
and a state of the art centrally controlled operations centre was implemented as a core component of the Gauteng Resignalling Project.
• It enables greater efficiencies in rail operations and train safety and more frequent service through higher line capacity.
• This allows control of railway traffic and an increase in the number of passengers that can be safely transported everyday by rail.
internet and mobile technologies enabled Transport Integrated Management (TIM) system. The intention was to leverage the economy and scalability of today’s sophisticated enterprise architectures to meet its needs and provide a foundational technology platform which can be used to improve service delivery to the public, law enforcement agencies as well as other attendant organizations22. Smart technology solutions greatly impact the performance of transport infrastructure
when monitored in real-time against predefined Key Performance Indicators (KPIs). The Passenger Rail Agency of South Africa (PRASA), as an example, benchmarks its performance around a range of key performance indicators including productivity, staff training, efficiencies and financials. It also conducts six studies per annum that are of interest to all stakeholders, providing an opportunity to learn from each other and establish best practices for suburban rail43.
Disclaimer
Foreword
Introduction
Research Methodology
Country Analysis
Industry Analysis
Industry Analysis: Manufacturing
Industry Analysis: Energy
Industry Analysis: Transport
Key insights and recommendations
Conclusion
Glossary of terms
References
INDEX (Click on categories to navigate)

Industry Analysis: Transport
As people become increasingly familiar with real-time information in their hands, it places expectations on transport operators to deliver accurate and timely information in a consistent manner. When this breaks down or disruption occurs, users suffer missed connections and frustration.
Using Kenya’s mobile-money system (m-Pesa), paying for a taxi ride using your mobile phone is easier in Nairobi than it is in New York24. m-Pesa lets people transfer cash using their phones and has become the standard for payment by customers. Methods of payment have also had to keep pace
to ensure customer satisfaction. Today people readily expect to be able to pay by card – having exact change is a thing of the past. With the development of applications like Apple Pay, PayPal and Kenya’s m-Pesa it’s becoming increasingly more accessible for transport operators to offer a platform that allows for varied methods of payment.
In the future, payments may move from our smartphone to our wrists as wearable technology offers secure ways to carry your digital currency. Africa has started on the path to allow customers to pay through digital channels, and Kenya is leading the way.
Customer centricity
Disclaimer
Foreword
Introduction
Research Methodology
Country Analysis
Industry Analysis
Industry Analysis: Manufacturing
Industry Analysis: Energy
Industry Analysis: Transport
Key insights and recommendations
Conclusion
Glossary of terms
References
INDEX (Click on categories to navigate)
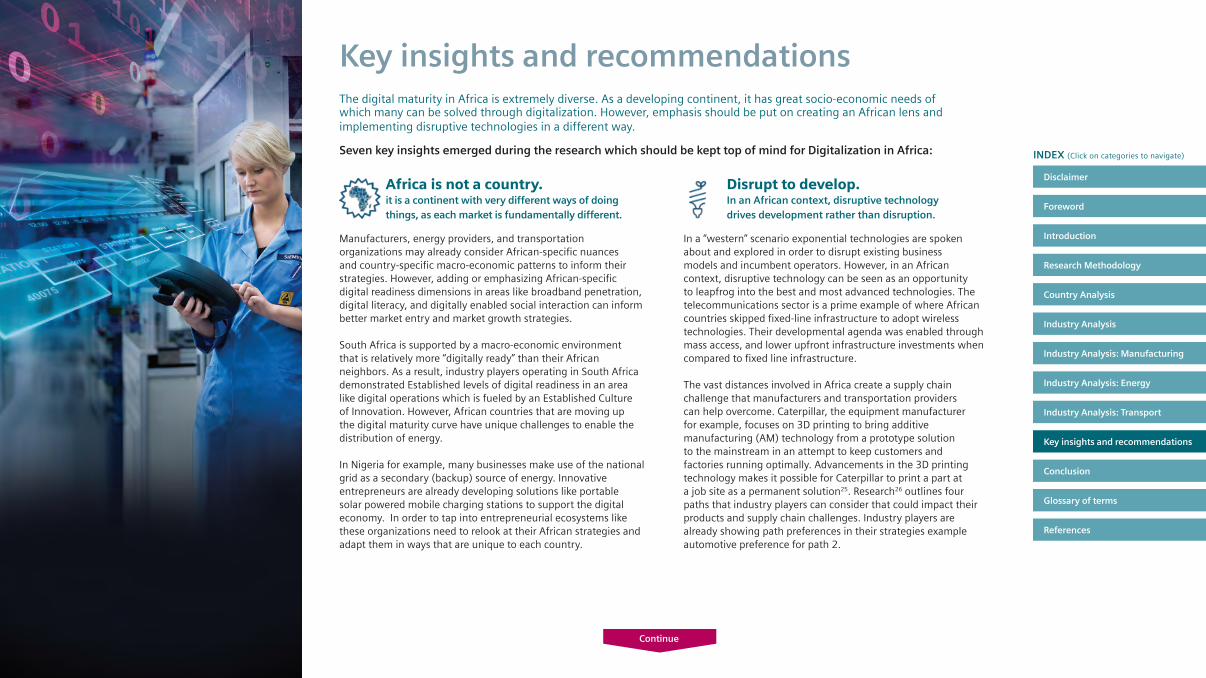
Manufacturers, energy providers, and transportation organizations may already consider African-specific nuances and country-specific macro-economic patterns to inform their strategies. However, adding or emphasizing African-specific digital readiness dimensions in areas like broadband penetration, digital literacy, and digitally enabled social interaction can inform better market entry and market growth strategies.
South Africa is supported by a macro-economic environment that is relatively more “digitally ready” than their African neighbors. As a result, industry players operating in South Africa demonstrated Established levels of digital readiness in an area like digital operations which is fueled by an Established Culture of Innovation. However, African countries that are moving up the digital maturity curve have unique challenges to enable the distribution of energy.
In Nigeria for example, many businesses make use of the national grid as a secondary (backup) source of energy. Innovative entrepreneurs are already developing solutions like portable solar powered mobile charging stations to support the digital economy. In order to tap into entrepreneurial ecosystems like these organizations need to relook at their African strategies and adapt them in ways that are unique to each country.
Africa is not a country. it is a continent with very different ways of doing things, as each market is fundamentally different.
Key insights and recommendations
Continue
In a “western” scenario exponential technologies are spoken about and explored in order to disrupt existing business models and incumbent operators. However, in an African context, disruptive technology can be seen as an opportunity to leapfrog into the best and most advanced technologies. The telecommunications sector is a prime example of where African countries skipped fixed-line infrastructure to adopt wireless technologies. Their developmental agenda was enabled through mass access, and lower upfront infrastructure investments when compared to fixed line infrastructure.
The vast distances involved in Africa create a supply chain challenge that manufacturers and transportation providers can help overcome. Caterpillar, the equipment manufacturer for example, focuses on 3D printing to bring additive manufacturing (AM) technology from a prototype solution to the mainstream in an attempt to keep customers and factories running optimally. Advancements in the 3D printing technology makes it possible for Caterpillar to print a part at a job site as a permanent solution25. Research26 outlines four paths that industry players can consider that could impact their products and supply chain challenges. Industry players are already showing path preferences in their strategies example automotive preference for path 2.
Disrupt to develop.In an African context, disruptive technology drives development rather than disruption.
The digital maturity in Africa is extremely diverse. As a developing continent, it has great socio-economic needs of which many can be solved through digitalization. However, emphasis should be put on creating an African lens and implementing disruptive technologies in a different way. Seven key insights emerged during the research which should be kept top of mind for Digitalization in Africa:
Disclaimer
Foreword
Introduction
Research Methodology
Country Analysis
Industry Analysis
Industry Analysis: Manufacturing
Industry Analysis: Energy
Industry Analysis: Transport
Key insights and recommendations
Conclusion
Glossary of terms
References
INDEX (Click on categories to navigate)
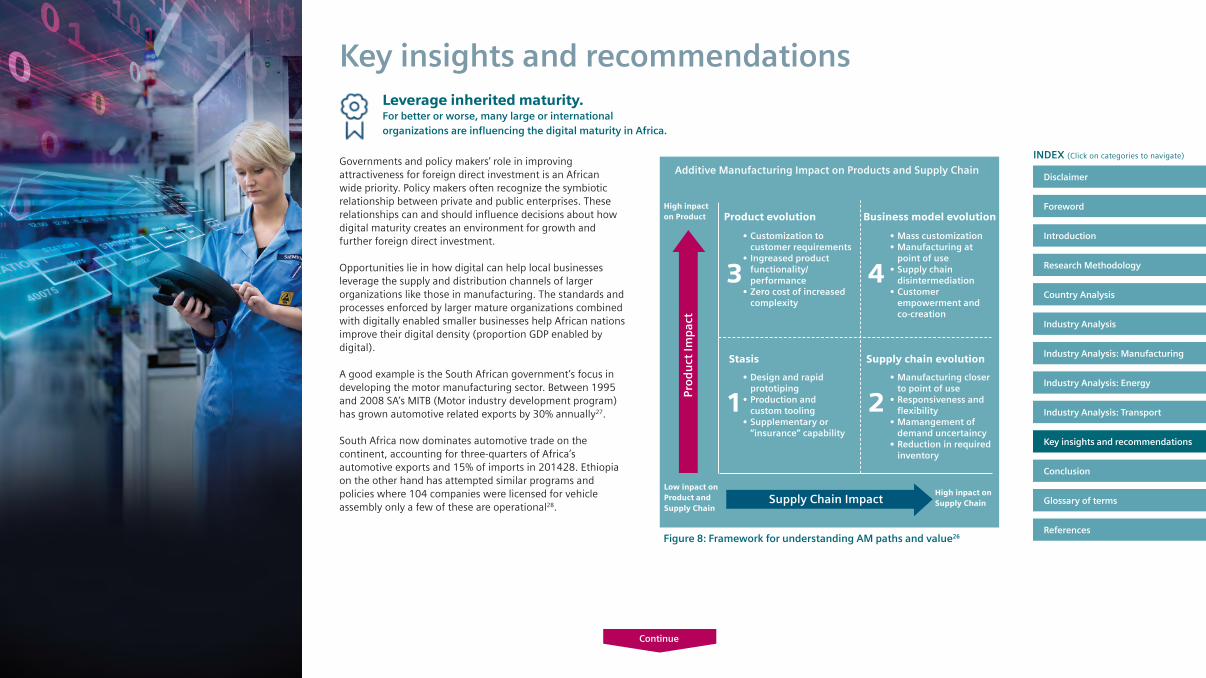
Key insights and recommendations
Continue
Governments and policy makers’ role in improving attractiveness for foreign direct investment is an African wide priority. Policy makers often recognize the symbiotic relationship between private and public enterprises. These relationships can and should influence decisions about how digital maturity creates an environment for growth and further foreign direct investment.
Opportunities lie in how digital can help local businesses leverage the supply and distribution channels of larger organizations like those in manufacturing. The standards and processes enforced by larger mature organizations combined with digitally enabled smaller businesses help African nations improve their digital density (proportion GDP enabled by digital).
A good example is the South African government’s focus in developing the motor manufacturing sector. Between 1995 and 2008 SA’s MITB (Motor industry development program) has grown automotive related exports by 30% annually27.
South Africa now dominates automotive trade on the continent, accounting for three-quarters of Africa’s automotive exports and 15% of imports in 201428. Ethiopia on the other hand has attempted similar programs and policies where 104 companies were licensed for vehicle assembly only a few of these are operational28.
Leverage inherited maturity.For better or worse, many large or international organizations are influencing the digital maturity in Africa.
Figure 8: Framework for understanding AM paths and value26
Low inpact on Product and Supply Chain
Supply Chain Impact
Pro
du
ct Im
pac
t
High inpact on Supply Chain
High inpact on Product
Additive Manufacturing Impact on Products and Supply Chain
1 2
3 4
• Customization to customer requirements
• Ingreased product functionality/performance
• Zero cost of increased complexity
• Mass customization• Manufacturing at
point of use• Supply chain
disintermediation• Customer
empowerment and co-creation
• Design and rapid prototiping
• Production and custom tooling
• Supplementary or “insurance” capability
• Manufacturing closer to point of use
• Responsiveness and flexibility
• Mamangement of demand uncertaincy
• Reduction in required inventory
Business model evolutionProduct evolution
Stasis Supply chain evolution
Disclaimer
Foreword
Introduction
Research Methodology
Country Analysis
Industry Analysis
Industry Analysis: Manufacturing
Industry Analysis: Energy
Industry Analysis: Transport
Key insights and recommendations
Conclusion
Glossary of terms
References
INDEX (Click on categories to navigate)

Every country has a different profile which shapes digitalization based on their maturity. We measured macro-economic fertility for digital products and services against nine metrics across four pillars; Size and Growth, Economic Complexity, Digital Protection, Business and Regulatory Environment, Access and Use, ICT Affordability, Digital Training, Usage of Digital Tools and Digital Skills. This demonstrates the wide-ranging factors that have an influence on the ability to adopt digital and/or advance maturity.
In the countries where economic size, growth and complexity indicators were analyzed, South Africa ranked number one, followed by Kenya, Ethiopia and finally, Nigeria. While Nigeria has a larger economy than South Africa and is forecast to grow at a slightly faster rate over the next five years, it has a much lower per capita income so comes second to South Africa overall.
The Ethiopian economy is roughly the same size as the Kenyan economy but scores slightly higher as is expected to achieve faster average annual real GDP growth (7.2% over the next five years). On economic complexity specifically, Kenya is ahead of both Ethiopia and Nigeria.
On this basis it is easier to understand why a sizeable economy like Nigeria would be lagging. Although South Africa is ranked number one in the group it is important to understand its relative level of sophistication on a global level on the digital maturity index so as not to be
misled around the potential in this regard. In terms of an enabling environment South Africa scores 60 from a global benchmark of 100.
So although this was the highest score amongst its peers, South Africa would only rank in the 60th percentile on a global basis for enabling environment demonstrating that the country lags leaders in this space. In contrast, South Africa ranks in the 82nd percentile when it comes to infrastructure, indicating that in this regard South Africa is globally competitive.
It is the Infrastructure indicator that ultimately places South Africa at the top of its peers as it shows the greatest range, with Nigeria coming second at only 49. The average Digital Literacy of South Africa however shows a significant underperformance relative to the Environment and Infrastructure, scoring in the 55th percentile against global peers. And most concerning is that South Africa falls below the global average for Economic Maturity falling within the 43rd percentile compared to global peers.
The take away of this macro-economic comparison is that although the levels of fertility are generally in the upper 50th percentile on a global comparison, there is a road to walk for these economies to be ready for true digitalization. Understanding the nuances per market is key to realizing this potential, as local macro-economic factors may have a significant bearing on the success of global business models without significant market localization and innovation.
Macro-environment fertility.The successful adoption of digitalization is highly dependent on a fertile macro-economic environment.
Key insights and recommendations
Continue
Disclaimer
Foreword
Introduction
Research Methodology
Country Analysis
Industry Analysis
Industry Analysis: Manufacturing
Industry Analysis: Energy
Industry Analysis: Transport
Key insights and recommendations
Conclusion
Glossary of terms
References
INDEX (Click on categories to navigate)
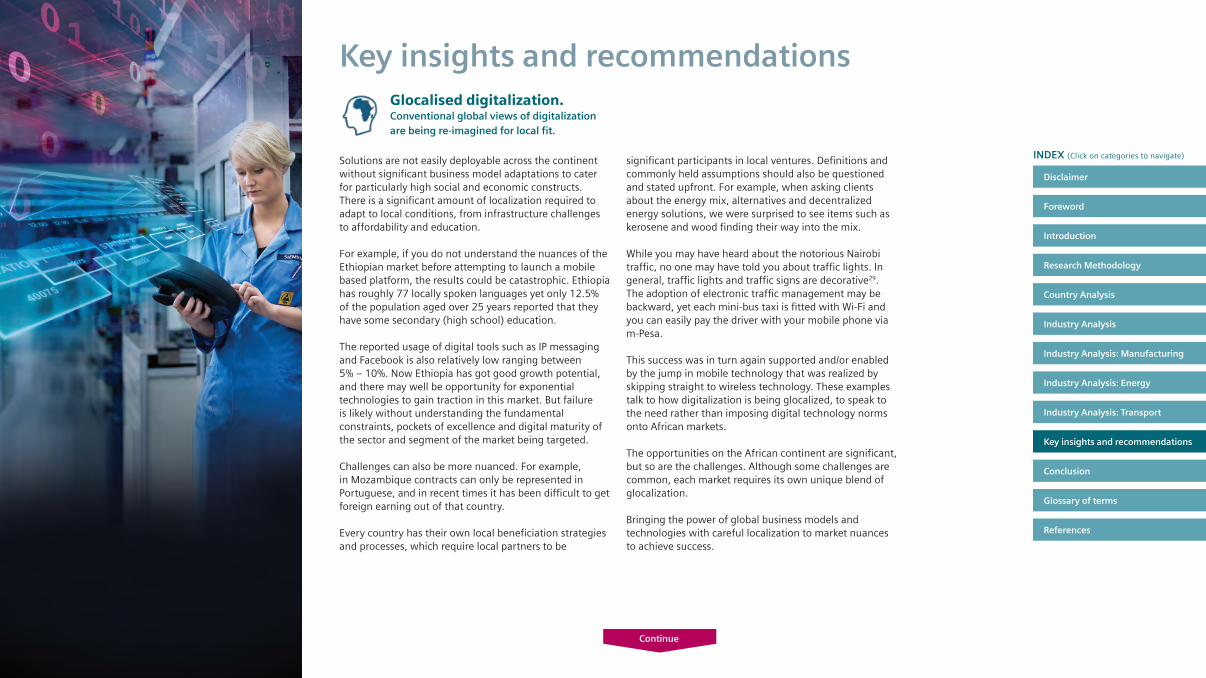
Solutions are not easily deployable across the continent without significant business model adaptations to cater for particularly high social and economic constructs. There is a significant amount of localization required to adapt to local conditions, from infrastructure challenges to affordability and education.
For example, if you do not understand the nuances of the Ethiopian market before attempting to launch a mobile based platform, the results could be catastrophic. Ethiopia has roughly 77 locally spoken languages yet only 12.5% of the population aged over 25 years reported that they have some secondary (high school) education.
The reported usage of digital tools such as IP messaging and Facebook is also relatively low ranging between 5% – 10%. Now Ethiopia has got good growth potential, and there may well be opportunity for exponential technologies to gain traction in this market. But failure is likely without understanding the fundamental constraints, pockets of excellence and digital maturity of the sector and segment of the market being targeted.
Challenges can also be more nuanced. For example, in Mozambique contracts can only be represented in Portuguese, and in recent times it has been difficult to get foreign earning out of that country.
Every country has their own local beneficiation strategies and processes, which require local partners to be
significant participants in local ventures. Definitions and commonly held assumptions should also be questioned and stated upfront. For example, when asking clients about the energy mix, alternatives and decentralized energy solutions, we were surprised to see items such as kerosene and wood finding their way into the mix.
While you may have heard about the notorious Nairobi traffic, no one may have told you about traffic lights. In general, traffic lights and traffic signs are decorative29. The adoption of electronic traffic management may be backward, yet each mini-bus taxi is fitted with Wi-Fi and you can easily pay the driver with your mobile phone via m-Pesa.
This success was in turn again supported and/or enabled by the jump in mobile technology that was realized by skipping straight to wireless technology. These examples talk to how digitalization is being glocalized, to speak to the need rather than imposing digital technology norms onto African markets.
The opportunities on the African continent are significant, but so are the challenges. Although some challenges are common, each market requires its own unique blend of glocalization.
Bringing the power of global business models and technologies with careful localization to market nuances to achieve success.
Glocalised digitalization.Conventional global views of digitalization are being re-imagined for local fit.
Key insights and recommendations
Continue
Disclaimer
Foreword
Introduction
Research Methodology
Country Analysis
Industry Analysis
Industry Analysis: Manufacturing
Industry Analysis: Energy
Industry Analysis: Transport
Key insights and recommendations
Conclusion
Glossary of terms
References
INDEX (Click on categories to navigate)
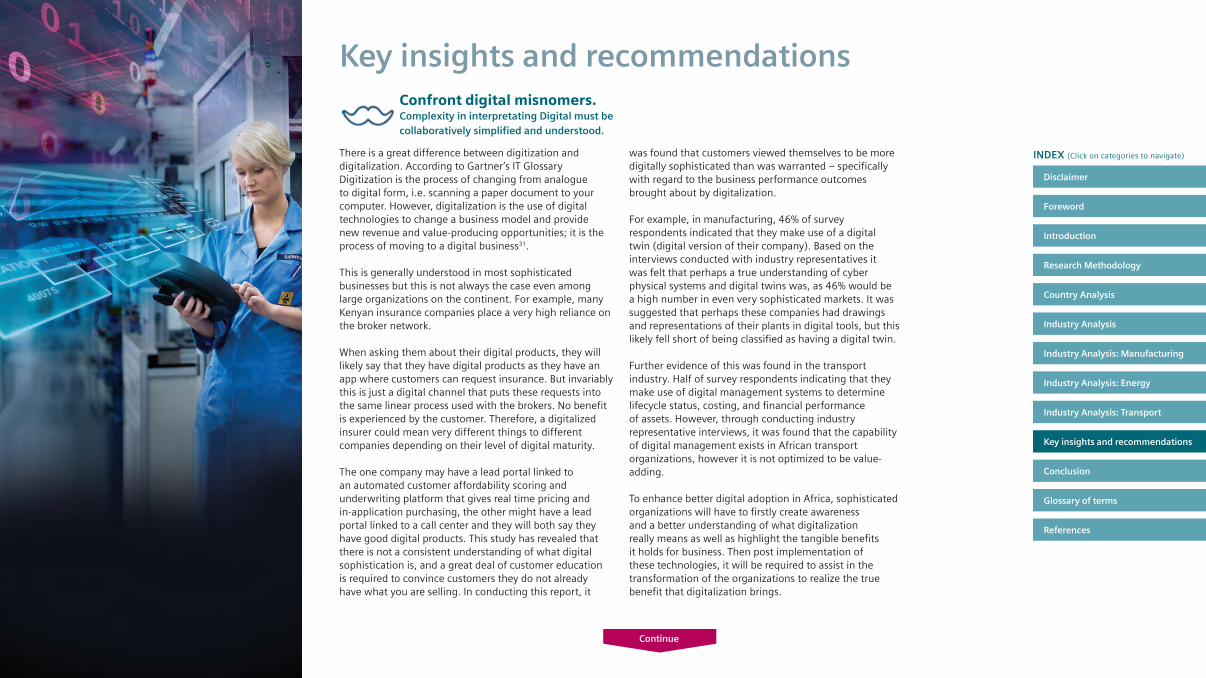
Key insights and recommendations
Continue
There is a great difference between digitization and digitalization. According to Gartner’s IT Glossary Digitization is the process of changing from analogue to digital form, i.e. scanning a paper document to your computer. However, digitalization is the use of digital technologies to change a business model and provide new revenue and value-producing opportunities; it is the process of moving to a digital business31.
This is generally understood in most sophisticated businesses but this is not always the case even among large organizations on the continent. For example, many Kenyan insurance companies place a very high reliance on the broker network.
When asking them about their digital products, they will likely say that they have digital products as they have an app where customers can request insurance. But invariably this is just a digital channel that puts these requests into the same linear process used with the brokers. No benefit is experienced by the customer. Therefore, a digitalized insurer could mean very different things to different companies depending on their level of digital maturity.
The one company may have a lead portal linked to an automated customer affordability scoring and underwriting platform that gives real time pricing and in-application purchasing, the other might have a lead portal linked to a call center and they will both say they have good digital products. This study has revealed that there is not a consistent understanding of what digital sophistication is, and a great deal of customer education is required to convince customers they do not already have what you are selling. In conducting this report, it
was found that customers viewed themselves to be more digitally sophisticated than was warranted – specifically with regard to the business performance outcomes brought about by digitalization.
For example, in manufacturing, 46% of survey respondents indicated that they make use of a digital twin (digital version of their company). Based on the interviews conducted with industry representatives it was felt that perhaps a true understanding of cyber physical systems and digital twins was, as 46% would be a high number in even very sophisticated markets. It was suggested that perhaps these companies had drawings and representations of their plants in digital tools, but this likely fell short of being classified as having a digital twin.
Further evidence of this was found in the transport industry. Half of survey respondents indicating that they make use of digital management systems to determine lifecycle status, costing, and financial performance of assets. However, through conducting industry representative interviews, it was found that the capability of digital management exists in African transport organizations, however it is not optimized to be value-adding.
To enhance better digital adoption in Africa, sophisticated organizations will have to firstly create awareness and a better understanding of what digitalization really means as well as highlight the tangible benefits it holds for business. Then post implementation of these technologies, it will be required to assist in the transformation of the organizations to realize the true benefit that digitalization brings.
Confront digital misnomers.Complexity in interpretating Digital must be collaboratively simplified and understood.
Disclaimer
Foreword
Introduction
Research Methodology
Country Analysis
Industry Analysis
Industry Analysis: Manufacturing
Industry Analysis: Energy
Industry Analysis: Transport
Key insights and recommendations
Conclusion
Glossary of terms
References
INDEX (Click on categories to navigate)
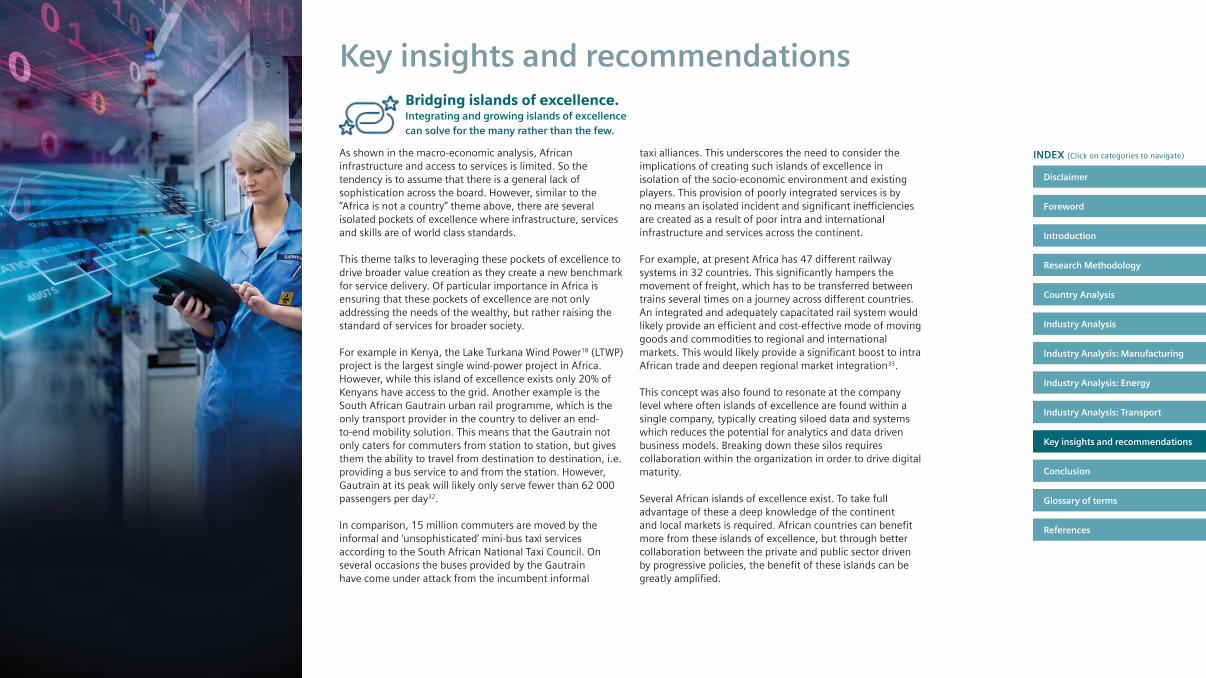
As shown in the macro-economic analysis, African infrastructure and access to services is limited. So the tendency is to assume that there is a general lack of sophistication across the board. However, similar to the “Africa is not a country” theme above, there are several isolated pockets of excellence where infrastructure, services and skills are of world class standards.
This theme talks to leveraging these pockets of excellence to drive broader value creation as they create a new benchmark for service delivery. Of particular importance in Africa is ensuring that these pockets of excellence are not only addressing the needs of the wealthy, but rather raising the standard of services for broader society.
For example in Kenya, the Lake Turkana Wind Power18 (LTWP) project is the largest single wind-power project in Africa. However, while this island of excellence exists only 20% of Kenyans have access to the grid. Another example is the South African Gautrain urban rail programme, which is the only transport provider in the country to deliver an end-to-end mobility solution. This means that the Gautrain not only caters for commuters from station to station, but gives them the ability to travel from destination to destination, i.e. providing a bus service to and from the station. However, Gautrain at its peak will likely only serve fewer than 62 000 passengers per day32.
In comparison, 15 million commuters are moved by the informal and ‘unsophisticated’ mini-bus taxi services according to the South African National Taxi Council. On several occasions the buses provided by the Gautrain have come under attack from the incumbent informal
taxi alliances. This underscores the need to consider the implications of creating such islands of excellence in isolation of the socio-economic environment and existing players. This provision of poorly integrated services is by no means an isolated incident and significant inefficiencies are created as a result of poor intra and international infrastructure and services across the continent.
For example, at present Africa has 47 different railway systems in 32 countries. This significantly hampers the movement of freight, which has to be transferred between trains several times on a journey across different countries. An integrated and adequately capacitated rail system would likely provide an efficient and cost-effective mode of moving goods and commodities to regional and international markets. This would likely provide a significant boost to intra‐African trade and deepen regional market integration33.
This concept was also found to resonate at the company level where often islands of excellence are found within a single company, typically creating siloed data and systems which reduces the potential for analytics and data driven business models. Breaking down these silos requires collaboration within the organization in order to drive digital maturity.
Several African islands of excellence exist. To take full advantage of these a deep knowledge of the continent and local markets is required. African countries can benefit more from these islands of excellence, but through better collaboration between the private and public sector driven by progressive policies, the benefit of these islands can be greatly amplified.
Bridging islands of excellence.Integrating and growing islands of excellence can solve for the many rather than the few.
Key insights and recommendations
Disclaimer
Foreword
Introduction
Research Methodology
Country Analysis
Industry Analysis
Industry Analysis: Manufacturing
Industry Analysis: Energy
Industry Analysis: Transport
Key insights and recommendations
Conclusion
Glossary of terms
References
INDEX (Click on categories to navigate)

We asked the question:
“What is the state of digital maturity in Africa and what opportunity lies in Digitalization?”
Conclusion
The journey to discover the answer has led to many unintended outcomes, but a good understanding of the continent’s digitalization path.
Africa is unique in many ways. Its emerging state of digitalization provides the necessary environment for its development, but with significant challenges.
While conducting the primary research, the digital maturity of the four African countries was experienced first-hand through the limited use of digital technologies and an inconsistent view of digital sophistication. Generally there was a misconception of what digitalization really means and the true benefits that this should bring to business.
Digitalization cannot be imposed on Africa and a one-size-fits-all strategy will fit very few of the African countries. In order to ensure digital adoption across the different countries, business needs to solve for a specific need, and not only optimize digital business performance.
African countries have a lot of needs, and digital can solve for many of those needs by using disruptive technology to develop markets, governments, services and societies.
Sophisticated organizations should put great emphasis on creating awareness around digitalization as this has become a business imperative and no longer a pending trend.
To enable this call to action, we have proposed very specific themes for consideration:
Africa is not a country
Disrupt to develop
Leverage inherited maturity
Macro-economic fertility
Glocalized digitalization
Confront Digital Misnomers
Bridging islands of excellence
The greatest challenge in digitalizing Africa lies in integrating all stakeholders to collaborate more effectively. There is a clear requirement for integration between government, regulators, society, local “family” businesses, large international organizations and the public sector.
Bridging the many islands of excellence and breaking down silos across countries, regions and the continent, will enable Africa to create a digitalized future for the benefit of the many, and not only the select few.
Disclaimer
Foreword
Introduction
Research Methodology
Country Analysis
Industry Analysis
Industry Analysis: Manufacturing
Industry Analysis: Energy
Industry Analysis: Transport
Key insights and recommendations
Conclusion
Glossary of terms
References
INDEX (Click on categories to navigate)
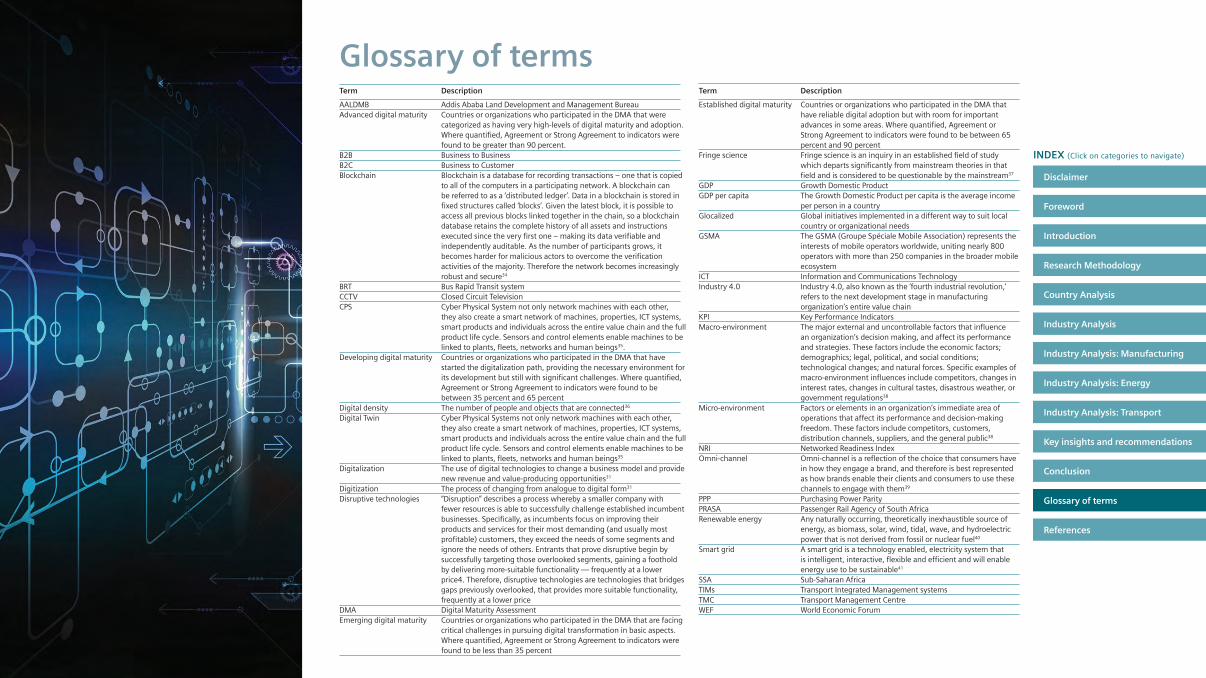
Glossary of termsTerm Description
AALDMB Addis Ababa Land Development and Management BureauAdvanced digital maturity Countries or organizations who participated in the DMA that were
categorized as having very high-levels of digital maturity and adoption. Where quantified, Agreement or Strong Agreement to indicators were found to be greater than 90 percent.
B2B Business to BusinessB2C Business to CustomerBlockchain Blockchain is a database for recording transactions – one that is copied
to all of the computers in a participating network. A blockchain can be referred to as a ‘distributed ledger’. Data in a blockchain is stored in fixed structures called ‘blocks’. Given the latest block, it is possible to access all previous blocks linked together in the chain, so a blockchain database retains the complete history of all assets and instructions executed since the very first one – making its data verifiable and independently auditable. As the number of participants grows, it becomes harder for malicious actors to overcome the verification activities of the majority. Therefore the network becomes increasingly robust and secure34
BRT Bus Rapid Transit systemCCTV Closed Circuit TelevisionCPS Cyber Physical System not only network machines with each other,
they also create a smart network of machines, properties, ICT systems, smart products and individuals across the entire value chain and the full product life cycle. Sensors and control elements enable machines to be linked to plants, fleets, networks and human beings35.
Developing digital maturity Countries or organizations who participated in the DMA that have started the digitalization path, providing the necessary environment for its development but still with significant challenges. Where quantified, Agreement or Strong Agreement to indicators were found to be between 35 percent and 65 percent
Digital density The number of people and objects that are connected36
Digital Twin Cyber Physical Systems not only network machines with each other, they also create a smart network of machines, properties, ICT systems, smart products and individuals across the entire value chain and the full product life cycle. Sensors and control elements enable machines to be linked to plants, fleets, networks and human beings35
Digitalization The use of digital technologies to change a business model and provide new revenue and value-producing opportunities31
Digitization The process of changing from analogue to digital form31
Disruptive technologies “Disruption” describes a process whereby a smaller company with fewer resources is able to successfully challenge established incumbent businesses. Specifically, as incumbents focus on improving their products and services for their most demanding (and usually most profitable) customers, they exceed the needs of some segments and ignore the needs of others. Entrants that prove disruptive begin by successfully targeting those overlooked segments, gaining a foothold by delivering more-suitable functionality — frequently at a lower price4. Therefore, disruptive technologies are technologies that bridges gaps previously overlooked, that provides more suitable functionality, frequently at a lower price
DMA Digital Maturity AssessmentEmerging digital maturity Countries or organizations who participated in the DMA that are facing
critical challenges in pursuing digital transformation in basic aspects. Where quantified, Agreement or Strong Agreement to indicators were found to be less than 35 percent
Term Description
Established digital maturity Countries or organizations who participated in the DMA that have reliable digital adoption but with room for important advances in some areas. Where quantified, Agreement or Strong Agreement to indicators were found to be between 65 percent and 90 percent
Fringe science Fringe science is an inquiry in an established field of study which departs significantly from mainstream theories in that field and is considered to be questionable by the mainstream37
GDP Growth Domestic ProductGDP per capita The Growth Domestic Product per capita is the average income
per person in a countryGlocalized Global initiatives implemented in a different way to suit local
country or organizational needsGSMA The GSMA (Groupe Spéciale Mobile Association) represents the
interests of mobile operators worldwide, uniting nearly 800 operators with more than 250 companies in the broader mobile ecosystem
ICT Information and Communications TechnologyIndustry 4.0 Industry 4.0, also known as the ‘fourth industrial revolution,’
refers to the next development stage in manufacturing organization’s entire value chain
KPI Key Performance IndicatorsMacro-environment The major external and uncontrollable factors that influence
an organization’s decision making, and affect its performance and strategies. These factors include the economic factors; demographics; legal, political, and social conditions; technological changes; and natural forces. Specific examples of macro-environment influences include competitors, changes in interest rates, changes in cultural tastes, disastrous weather, or government regulations38
Micro-environment Factors or elements in an organization’s immediate area of operations that affect its performance and decision-making freedom. These factors include competitors, customers, distribution channels, suppliers, and the general public38
NRI Networked Readiness IndexOmni-channel Omni-channel is a reflection of the choice that consumers have
in how they engage a brand, and therefore is best represented as how brands enable their clients and consumers to use these channels to engage with them39
PPP Purchasing Power ParityPRASA Passenger Rail Agency of South AfricaRenewable energy Any naturally occurring, theoretically inexhaustible source of
energy, as biomass, solar, wind, tidal, wave, and hydroelectric power that is not derived from fossil or nuclear fuel40
Smart grid A smart grid is a technology enabled, electricity system that is intelligent, interactive, flexible and efficient and will enable energy use to be sustainable41
SSA Sub-Saharan AfricaTIMs Transport Integrated Management systemsTMC Transport Management CentreWEF World Economic Forum
Disclaimer
Foreword
Introduction
Research Methodology
Country Analysis
Industry Analysis
Industry Analysis: Manufacturing
Industry Analysis: Energy
Industry Analysis: Transport
Key insights and recommendations
Conclusion
Glossary of terms
References
INDEX (Click on categories to navigate)

References 1 Kane et al. (2016). Aligning the organization for its digital future. Deloitte University Press. Available at: http://sloanreview.mit.edu/projects/aligning-for-digital-future/ 2 World Economic Forum (2016). The Global Information Technology Report 2015: ICTs for Inclusive Growth. 3 GSMA (2016). The mobile economy - Africa 2016. 4 The World Bank (2016). Doing Business Survey. Available at: http://www.doingbusiness.org/rankings 5 Harvard (2014). Harvard Atlas of Economic Complexity. Available at: http://atlas.cid.harvard.edu/ 6 McKinsey & Company (2013). Lions go digital: The Internet’s transformative potential in Africa. 7 African Economic Outlook (2016). African Economic Outlook 2016: Sustainable Cities and Structural Transformation. Available at: http://www.afdb.org/fileadmin/uploads/afdb/
Documents/Publications/AEO_2016_Report_Full_English.pdf. 8 Ministry of Communication Technology (2012). NATIONAL INFORMATION AND COMMUNICATION TECHNOLOGY (ICT) FINAL DRAFT POLICY. Available at: http://commtech.gov.ng/
images/docs/Approved_ICT_Policy.pdf 9 Gillwald et al. (2013). Understanding what is happening in ICT in South Africa. Available at: http://www.researchictafrica.net/docs/South_Africa_Country_Report_2013_Final.pdf10 Velocci (2016) Internet Access Is Now A Basic Human Right. Available at: http://gizmodo.com/internet-access-is-now-a-basic-human-right-178308186511 UrbanAfrica.Net (2016). Available at: http://www.urbanafrica.net/12 World Economic Forum (2015). Networked Readiness Index 2015. Available at: http://reports.weforum.org/global-information-technology-report-2015/network-readiness-index/13 Gauteng Province (2013). The Gauteng Online schools project reviewed.14 Stanlib (2015). Internet access, speed and cost: South Africa is improving but remains well behind the global standard meaning we are missing out on growth opportunities.
Available at: http://www.stanlib.com/EconomicFocus/Pages/Internetaccessspeedrsa.aspx15 Deloitte South Africa (2016). Industry 4.0: Is Africa ready for digital transformation? Available at: https://www2.deloitte.com/content/dam/Deloitte/za/Documents/manufacturing/
za-Africa-industry-4.0-report-April14.pdf16 Deloitte (2015). Sub-Saharan Africa Power Trends: Power disruption in Africa. Available at: https://www2.deloitte.com/content/dam/Deloitte/za/Documents/energy-resources/
ZA_AfricaPowerTrendsReport_EnergyResources_200515.pdf17 IEA (2014) Africa Energy Outlook. Available at: http://www.iea.org/publications/freepublications/publication/WEO2014_AfricaEnergyOutlook.pdf 18 Al Bawaba (2016). “Kenya – Africa’s largest wind farm set to power Kenya.” Published in: African Business. Middle East, June 30 Issue.19 Cognizant (2014). Using Predictive Analytics to Optimize Asset Maintenance in the Utilities Industry. Available at: https://www.cognizant.com/whitepapers/using-predictive-
analytics-to-optimize-asset-maintenance-in-the-utilities-industry-codex964.pdf20 Bornman (2016). “Human error” might have caused Monday’s Metrorail accident in which one person was killed and almost 250 others were injured. Times Live. Available at:
http://www.timeslive.co.za/thetimes/2016/10/26/Human-error-may-have-caused-train-crash21 City of Ekurhuleni (2016). State of the city address. Available at: http://www.ekurhuleni.gov.za/2707-soca-2016-final-18-april/file22 ICT authority. Transport Integrated Management Systems (TIMs). http://www.icta.go.ke/transport-integrated-management-systems-tims/23 Siemens (2016) Urban Mobility. https://www.mobility.siemens.com/mobility/global/en/urban-mobility/Pages/urban-mobility.aspx?istablet=true24 The Economist (2013). Why does Kenya lead the world in mobile money. http://www.economist.com/blogs/economist-explains/2013/05/economist-explains-1825 Caterpillar (2016). Additive Manufacturing. Available at: http://www.caterpillar.com/en/company/innovation/customer-solutions/technology/additive-manufacturing.html26 Deloitte University Press (2014). 3D opportunity: Additive manufacturing paths to performance, innovation, and growth. Available at: https://dupress.deloitte.com/dup-us-en/
deloitte-review/issue-14/dr14-3d-opportunity.html27 Kaggwa (2008). Modelling South Africa’s incentives under the motor industry development programme. University of Pretoria.28 Deloitte Africa (2016). Automotive Insights: Navigating the African Automotive Sector - Ethiopia, Kenya and Nigeria.29 Jaoko (2016). 17 Things they don’t tell you about visiting Nairobi. Available at: https://theculturetrip.com/africa/kenya/articles/17-things-they-don-t-tell-you-about-visiting-nairobi/30 Philips (2014). Philips inaugurates Africa’s first Community Life Center aimed at strengthening primary health care and enabling community development. Available at: http://
www.philips.com/a-w/about/news/archive/standard/news/press/2014/20141003-Philips-inaugurates-Africas-first-Community-Life-Center-aimed-at-strengthening-primary-health-care-and-enabling-community-development.html
31 Gartner 2016. Gartner IT Glossary. http://www.gartner.com/it-glossary/32 Molatlhwa (2014). Gautrain is milking taxpayers of millions. Times Live. Available at: http://www.timeslive.co.za/thetimes/2014/07/07/gautrain-is-milking-taxpayers-of-millions33 GESAT (2013). GE, Transnet partner to revive Africa’s rail, drive regional integration and growth. Available at: http://www.gesat.co.za/news/entry/ge-transnet-partner-to-revive-
africas-rail-drive-regional-integration-and-g.34 Deloitte (2016) Blockchain: Enigma. Paradox. Opportunity. Available at: https://www2.deloitte.com/uk/en/pages/innovation/articles/blockchain.html35 Parashar (2016). Factory 4.0 – A Smart Factory. Available at: http://sites.tcs.com/blogs/digital-reimagination/factory-4-0-smart-factory36 Zamora (2013). Digital Density: Reshaping Business Models and Organizations. Available at: http://blog.iese.edu/faceit/2013/digital-density-reshaping-business-models-and-
organizations/37 Wikipedia (2016). Available at: https://en.wikipedia.org/wiki/Fringe_science38 WebFinance Inc. (2016). Macro Environment. Available at: http://www.businessdictionary.com/definition/macro-environment.html.39 Newman (2014). The Omni-Channel Experience: Marketing Meets Ubiquity. Forbes. Available at: http://www.forbes.com/sites/danielnewman/2014/07/22/the-omni-channel-
experience-marketing-meets-ubiquity/#2192cac4648740 Dictionary.com (2016). Renewable energy. Available at: http://www.dictionary.com/browse/renewable-energy41 SASGI (2012). About SASGI. Available at: http://www.sasgi.org.za/about-sasgi/42 Christensen et al. (2015). What is disruptive innovation? Harvard Business Review. Available at: https://hbr.org/2015/12/what-is-disruptive-innovation.43 Qualitative interviews were conducted with industry representatives from Siemens and an external service provider in the Manufacturing, Energy and Transport industries
familiar with South Africa, Nigeria, Kenya and Ethiopia.
Disclaimer
Foreword
Introduction
Research Methodology
Country Analysis
Industry Analysis
Industry Analysis: Manufacturing
Industry Analysis: Energy
Industry Analysis: Transport
Key insights and recommendations
Conclusion
Glossary of terms
References
INDEX (Click on categories to navigate)