
Digital Tech Sector Data Pack - newanglia.co.uk · 2 Contents Page - Introduction to the Sector...
67
Digital Tech Sector Data Pack Version 3.2.1 Final
Transcript of Digital Tech Sector Data Pack - newanglia.co.uk · 2 Contents Page - Introduction to the Sector...

Digital Tech Sector Data Pack
Version 3.2.1 Final

2
Contents Page
- Introduction to the Sector Data Pack 3
- Introduction to and Definition of the Digital Tech Sector 3
- Key Findings from the Data Analysis 5
- The Digital Tech Sector in New Anglia 6
o GVA 9 o Employment 12 o Businesses 29 o Wages 34 o Qualifications and Skills 38 o Vacancies 41
- A Future View of the Digital Tech Sector 47
- Views from Sector Stakeholders 56
- Appendices 62
o Appendix 1 – Digital Tech sector definition 63 o Appendix 2 – New Anglia LEP Digital Tech sector definition comparison with other recognised 65
definitions of the sector o Appendix 3 – TechNation16 report definition of Digital Tech sector jobs using Standard 67
Occupational Classification

3
Introduction to the Sector Data Pack The role of the Sector Data Pack is to bring together the latest socio-economic and labour market data and present both an up-to-date, and future view, of the sector and any underlying issues within the area that could impact upon it. Information and feedback collected from stakeholder consultation (through workshops, meetings, and survey) is also presented and summarised (where available and applicable).
The Data Pack sits below the Sector Skills Plan, with the key findings from the data analysis helping to inform the priorities developed in the plan. In most instances data has been analysed and presented down to local authority level. In some instances, and even where local authority data is available, it has not been presented in the data pack due to issues of unreliability and small sample sizes. This is particularly the case with data from the Annual Population Survey and the Annual Survey of Hours and Earnings.
Throughout the Data Pack findings are also presented for the areas of Lincolnshire (county), Greater Cambridge and Greater Peterborough (GCGP) Local Enterprise Partnership (LEP), Greater Lincolnshire LEP (GLLEP), and South East LEP (SELEP). These comparator areas were agreed in consultation with the Digital Tech sector group and New Anglia LEP officers.
Introduction to and Definition of the Digital Tech Sector The Digital Tech economy recognises the primary job roles involved in digital tech industries, such as computer programming and digital games design alongside the enabling role digital tech occupations make with traditional (non-digital) industries- such as finance and culture and tourism. The New Anglia Local Enterprise Partnership has previously prioritised the ICT Sector as one of five high impact sectors within its Strategic Economic Plan (SEP) (2014)1. The SEP defines a series of major economic targets (by 2026), which includes a net increase of jobs growth by 95,000, 10,000 new businesses created and an overall increase to productivity for the region by Gross Value Added (GVA) (from £36,000 to £40,000). These high impact sectors have been prioritised as those that demonstrate the greatest opportunity for economic growth, therefore underpinning the SEP’s headline targets.
Initially defined as ‘ICT’, the LEP supported the development of business intelligence through an ICT partnership, initially hosted by the Suffolk Chamber of Commerce (as the ‘IP Network’) and the commissioning of research to ‘map’ the sector’s key businesses and gather evidence on the opportunities, and challenges that the ICT sector faces2.
Partnership development based on the evidence findings of the mapping work highlighted the growing recognition of the significance of the sector economically, including its employment, business and jobs density being higher than previously assessed. This analysis was
1 New Anglia LEP Strategic Economic Plan (2014), New Anglia LEP 2 Mapping New Anglia’s ICT Sector (2015), Regeneris

4
consolidated further with the Tech Nation Report- Transforming UK Industries (2016)3, which highlighted that both Ipswich and Norwich were part of a list of 27 nationally significant tech business clusters.
The Tech Nation report used defined indicators that included jobs density, economic performance and the extent to which key local organisations are effectively engaged with local businesses. Significantly, the Tech Nation report positioned industries, such as telecommunications and networking and hardware development alongside a range of other industries including app and software development, digital media and gaming- to promote the importance of the Digital Tech economy.
The Digital Tech economy recognises the primary job roles involved in digital tech industries, such as computer programming and digital games design alongside the enabling role digital tech occupations make with traditional (non-digital) industries- such as finance and culture and tourism. Accordingly, both the former Department for Business Innovation & Skills (BIS) and the Department for Culture, Media and Sport (DCMS) identified the importance of addressing labour and skills shortages for key roles within the primary digital tech market and also the adoption of digital capability across the wider economy, to drive innovation and market competitiveness4.
For the purposes of this work Digital Tech, rather than ICT, has been adopted, which aligns well with the Tech Nation context and builds on the previous ICT sector mapping and New Anglia Local Enterprise Partnership supported research. A complete breakdown of the Standard Industrial Classification (SIC) categories that complete the scope of the Digital Tech definition can be found in the appendices along with information on how this definition compares with SICs used for the previous ICT sector mapping analysis and the Tech Nation 2016 report, and the framework used by the Department for Culture, Media and Sport (DCMS). Important to the definition is a framework which:
- Captures in its entirety the SICs used for the previous ICT sector mapping analysis and the Tech Nation 2016 report;
- Includes additional SICs that align with the Department for Culture, Media and Sport (DCMS) framework for digital technology; and
- Based on stakeholder feedback includes a number of SICs including digital media, publishing, PR and communications activities, which reflects the increasing adoption of digital methods and subsequent skills needed, for important business activities across the New Anglia region. For these additional SICs the overall contribution evidenced towards key indicators such as jobs and employment share have been balanced using a standard percentage. This complements the Tech Nation methodology of equating digital economy activity
across industries previously considered as being on the periphery.
It is important to note that the process for categorisation of businesses by SIC is somewhat unregulated and is largely dependent on the initial registration a business makes with Companies House upon business start-up (and on subsequent annual returns). There is therefore an inherent risk with using SIC analysis as the sole methodology for assessing the scale of an industrial sector and subsequent evidence based action planning. For the purposes of the Digital Tech Skills Plan, a methodology has been developed that balances SIC analysis of secondary
data alongside primary qualitative data obtained through key partner focus groups and semi-structured interviews.
3 Tech Nation- Transforming UK Industries (2016), Tech Nation 4 Digital Skills for the UK Economy (2016), BIS & DCMS

5
Key Findings from the Data Analysis:
- The Digital Tech sector in New Anglia was worth approximately £1.3bn in 2015
- This £1.3bn equates to just below 4 per cent of New Anglia’s economy total value, which is less than its LEP comparators and nationally, suggesting that the sector is underperforming
- Growth in value in the sector has been in line with that of nationally, but again below that of comparator areas
- 16,600 people were employed in the sector in 2015, around 2.5 per cent of the total workforce, which again is below LEP comparator areas and nationally
- Digital Tech sector employment within New Anglia is concentrated in Suffolk Coastal, Norwich, and Ipswich
- Growth in employment has again been solid but lags behind that of its neighbours and nationally
- Some local authority areas within New Anglia have experienced reductions in Digital Tech sector employment
- New Anglia’s Digital Tech sector Location Quotient is below that of its two main comparator LEPs and has fallen since 2010
- Suffolk Coastal has a high LQ of 1.6 but this has fallen over the last 5 years
- The decline in part-time employment in the New Anglia Digital Tech sector has been more pronounced than nationally
- At the same time, growth in full-time employment has been just above that of nationally
- There are 3,425 Digital Tech businesses in New Anglia and unlike employment, there is a good spread of these businesses across the area
- The proportion of New Anglia residents with higher level qualifications is increasing but remains below national averages - Level 4 qualifications and above within the New Anglia Digital Tech sector are also below the national average
- Growth in Digital Tech sector apprenticeships has in the main been flat since 2011 but there has been a shift in apprenticeship delivery more in line with the sector mix locally
- Forecasts for employment growth in the sector are fairly flat, however, at the same time, management positions, and professional and associate professional occupations, are all set to grow in importance over time and fuel demand for higher skills within the sector and area.

6
The Digital Tech Sector in New Anglia

7
3.6%
2.5%
4.7%
GVA Employment Businesses
Digital Tech sector’s contribution to the local economy
The Digital Tech sector contributes the following to the New Anglia LEP economy:
- Nearly 4 per cent of total economic value (Gross Value Added or GVA) generated, which is around £1.3bn of the £35.5bn generated by the New Anglia economy in 2015.
- 2.5 per cent of total employment (655,000), equating to 16,600 employees in 2015.
- Nearly 5 per cent of businesses, over 3,400 of the 72,900 businesses in New Anglia.
Sources: Sub-regional GVA; Business Register and Employment Survey, UK Business Counts; all Office for National Statistics
Please note that values for GVA are based on the Information and Communication Sector, with values for employment and businesses based on the SIC codes detailed in the appendices.

8
Digital Tech sector’s contribution to growth in the local economy (2010=100)
Growth in GVA in the sector has been higher than that of total growth in the New Anglia economy, whilst growth in business numbers has been roughly in line with that of total business numbers. The stand out element here is the fluctuations in employment in the Digital Tech sector. Based on feedback from the Office for National Statistics on this issue it appears that the 2014 totals overestimated employment in the sector, whereas 2015 estimates are in fact closer to reality. The shift was due to the sampling of two businesses in the sector who went through relatively unique circumstances (one moved employment into another industry between 2014-15, whereas the other went through a restructure which saw employment numbers allocated differently in 2014 than in 2015). Sources: Sub-regional GVA; Business Register and Employment Survey, UK Business Counts; all Office for National Statistics
90
100
110
120
130
2010 2011 2012 2013 2014 2015 2016
Digital Tech GVA Digital Tech Employment
Digital Tech Business Total GVA
Total Employment Total Business

9
£1,277m
£453m
£824m
£289m
£2,275m
£343m
£3,453m
New Anglia
Norfolk
Suffolk
Lincolnshire
GCGP
GLLEP
SELEP
Digital Tech sector GVA (£m) across comparator areas, 2015
Sources: Sub-regional Gross Value Added (GVA), Office for National Statistics
In GVA terms then New Anglia LEPs Digital Tech sector dwarfs that of the Greater Lincolnshire LEPs.
However, when we look to the other LEP comparator areas of Greater Cambridge & Greater Peterborough and South East, then the sector in these areas is much larger.
Does this mean that the sector is more significant in those areas?
New Anglia’s Digital Tech
sector was worth approximately
£1.3bn in 2015

10
3.6%
2.4%
4.9%
2.1%
6.0%
1.7%
4.0%
5.4%
6.5%
New Anglia
Norfolk
Suffolk
Lincolnshire
GCGP
GLLEP
SELEP
East of England
United Kingdom
Sources: Sub-regional Gross Value Added (GVA), Office for National Statistics
Proportion of total GVA produced by Digital Tech sector across comparator areas, 2015
In response to the question of sectoral significance then the answer is both yes and no.
The Digital Tech sector provided nearly
4% of New Anglia’s total economic value
in 2015
Despite South East LEPs Digital Tech sector generating more than double that of New Anglia’s, relative to the size of the total economy then the sector generates roughly the same amount i.e. 3 to 4 per cent.
In the Greater Cambridge & Greater Peterborough LEP then the sector generates much more of total economic value at around six per cent.
However, when we look at the Digital Tech sector’s contribution nationally then all areas are underperforming to a certain extent.

11
90
100
110
120
130
140
150
160
170
2010 2011 2012 2013 2014 2015
New Anglia Norfolk Suffolk
Lincolnshire GCGP GLLEP
SELEP East of England United Kingdom
Sources: Sub-regional Gross Value Added (GVA), Office for National Statistics
Change in Digital Tech sector GVA across comparator areas (2010 = 100)
Growth in GVA of the Digital Tech sector in New Anglia has in the main been above the national average between 2010 and 2015. Despite this, figures for 2015 show that five year growth across the sector at both New Anglia and UK has been approximately the same (around 25 per cent).
Economic growth in New Anglia’s Digital
Tech sector has been in line with national
growth
Growth in sectoral GVA across comparator LEP areas has been much higher, in particular in the Greater Lincolnshire LEP area though this is obviously countered to a certain extent by the sector being much smaller in that area.

12
16,600
7,400
9,200
5,300
28,900
6,600
51,700
New Anglia
Norfolk
Suffolk
Lincolnshire
GCGP
GLLEP
SELEP
Employment in the Digital Tech sector across comparator areas, 2015
Source: Business Register and Employment Survey, Office for National Statistics
16,600 people were employed in
New Anglia’s Digital Tech
sector in 2015

13
2.5%
2.1%
2.9%
1.9%
4.3%
1.6%
3.2%
4.1%
4.6%
New Anglia
Norfolk
Suffolk
Lincolnshire
GCGP
GLLEP
SELEP
East of England
England
Proportion of employment provided by the Digital Tech sector across comparator areas, 2015
Source: Business Register and Employment Survey, Office for National Statistics
Digital Tech provides 2.5 per cent of total employment in New Anglia, which is well below the 4.6 per cent provided nationally by the sector.
In line with economic value, the Digital
Tech sector is under represented in
employment terms when compared to its neighbours and
nationally

14
Employment in the Digital Tech sector across New Anglia, 2015
Employment in the Digital Tech sector in New Anglia is concentrated in the local authority areas of Suffolk Coastal, Norwich, and Ipswich.
0%
1%
2%
3%
4%
5%
6%
7%
8%
0
500
1,000
1,500
2,000
2,500
3,000
3,500
4,000
Digital Tech Employment % Digital Tech Employment
Digital Tech sector employment in New
Anglia is concentrated in Suffolk Coastal,
Norwich and Ipswich
Source: Business Register and Employment Survey, Office for National Statistics
Suffolk Coastal local authority area is home to Adastral Park, resulting in it having the highest employment number. It is closely followed by Norwich and then Ipswich, the two further centres of activity for the sector. Suffolk Coastal also has the highest proportion of its total employment provided by the Digital Tech sector.

15
10%
9%
4%
9%
20%
3%
27%
21%
14%
Norfolk
Suffolk
Lincolnshire
New Anglia LEP
GCGP
GLLEP
SELEP
East of England
England
Source: Business Register and Employment Survey, Office for National Statistics
Change in Digital Tech sector employment across comparator areas, 2010 - 2015
Overall, employment in the sector in New Anglia has grown by around nine per cent but this is much lower than two out of its three neighbouring LEP area, and both regional and national averages.

16
-40% -30% -20% -10% 0% 10% 20% 30% 40% 50%
Breckland
North Norfolk
Norwich
South Norfolk
Broadland
King`s Lynn and West Norfolk
Great Yarmouth
Waveney
Babergh
Ipswich
Mid Suffolk
Suffolk Coastal
St Edmundsbury
Forest Heath
Source: Business Register and Employment Survey, Office for National Statistics
Change in Digital Tech sector employment across New Anglia, 2010 - 2015
Below LEP level, and looking at changes in employment at local authority level, then there are some very encouraging figures with many areas experiencing growth rates above that of the national average.
Of particular note is Norwich which has a large number of people employed in the sector and had above average growth over the five year period in question.

17
Top 5 Digital Tech sub sectors, 2015
Source: Business Register and Employment Survey, Office for National Statistics
Industry Sector Code Industry Sector Name Employment
% of total
DigiTech sector
employment
Change in
employment 2010 -
2015
61900 Other telecommunications activities 4,000 24% -8%
62020 Computer consultancy activities 3,600 22% 44%
62012 Business and domestic software development 1,700 10% 65%
62090 Other information technology and computer service activities 1,500 9% -7%
46520 Wholesale of electronic and telecommunications equipment and parts 700 4% -7%

18
Top growth Digital Tech sub sectors with 100 employees or more
Industry Sector Code Industry Sector Name Employment
% of total
DigiTech sector
employment
Change in
employment
2010 - 2015
59112 Video production activities 100 0% 2175%
61200 Wireless telecommunications activities 200 1% 1392%
63120 Web portals 100 1% 303%
59200 Sound recording and music publishing activities 100 0% 223%
61100 Wired telecommunications activities 100 1% 211%
58142 Publishing of consumer, business and professional journals and periodicals 200 1% 204%
59113 Television programme production activities 100 1% 134%
63990 Other information service activities nec 100 1% 116%
58110 Book publishing 100 0% 100%
58290 Other software publishing 100 1% 69%
Source: Business Register and Employment Survey, Office for National Statistics

19
0.45
0.64
0.41
0.54
0.94
0.34
0.71
0.46
0.65
0.43
0.55
0.90
0.36
0.63
0 0.2 0.4 0.6 0.8 1
Norfolk
Suffolk
Lincolnshire
New Anglia LEP
GCGP
GLLEP
South East LEP
2015 2010
Source: Business Register and Employment Survey, Office for National Statistics
Digital Tech sector location quotients across comparator areas, 2015
Location quotients (LQs) are a useful way of showing a sectors importance to the local economy relative to the national picture. The analysis presented here uses employment with an LQ above 1 showing a higher concentration than nationally, and an LQ of below than 1 a lower concentration.
As with employment numbers then New Anglia remains below its nearest Digital Tech competitors of South East LEP and Greater Cambridge Greater Peterborough (GCGP) in terms of the sectors LQ. It is also worth noting the fall in New Anglia’s LQ over time, albeit small, compared to the rises in LQs for the South East LEP and GCGP.
SELEP

20
0.34
0.54
0.31
0.21
0.23
0.76
0.41
0.65
0.40
0.58
0.45
0.38
1.60
0.24
0.29
0.56
0.48
0.28
0.21
0.70
0.42
0.55
0.57
0.57
0.44
0.44
1.72
0.17
0 0.5 1 1.5 2
Breckland
Broadland
Great Yarmouth
King`s Lynn & West Norfolk
North Norfolk
Norwich
South Norfolk
Babergh
Forest Heath
Ipswich
Mid Suffolk
St Edmundsbury
Suffolk Coastal
Waveney
2015 2010
Digital Tech sector location quotients across New Anglia, 2015
Source: Business Register and Employment Survey, Office for National Statistics
With the presence of Adastral Park then Suffolk Coastal is the only local authority area in New Anglia with a Digital Tech sector location quotient above 1. This is tempered by the fact that its LQ has fallen between 2010 and 2015, though this is not the only local authority district area across New Anglia to experience this.

21
Industry Sector Code Industry Sector Name Employment
% of total
DigiTech sector
employment
LQ
95120 Repair of communication equipment 500 3% 4.8
59140 Motion picture projection activities 300 2% 1.8
59112 Video production activities 100 0% 1.4
26110 Manufacture of electronic components 300 2% 1.2
58142 Publishing of consumer, business and professional journals and periodicals 200 1% 1.1
58130 Publishing of newspapers 200 1% 1.1
Digital Tech sub sectors (100+ employees) with location quotients (LQs) above 1
Source: Business Register and Employment Survey 2015, Office for National Statistics

22
Industry Sector Code Industry Sector Name Employment
% of total
DigiTech sector
employment
Index
(UK=1)
95120 Repair of communication equipment 500 3% 8.9
59140 Motion picture projection activities 300 2% 3.3
59112 Video production activities 100 0% 2.5
26110 Manufacture of electronic components 300 2% 2.1
58142 Publishing of consumer, business and professional journals and periodicals 200 1% 2.0
58130 Publishing of newspapers 200 1% 2.0
61900 Other telecommunications activities 4,000 24% 1.9
59200 Sound recording and music publishing activities 100 0% 1.7
46520 Wholesale of electronic and telecommunications equipment and parts 700 4% 1.4
58190 Other publishing activities 100 0% 1.3
74100 Specialised design activities 300 2% 1.2
26301 Manufacture of telegraph and telephone apparatus and equipment 100 1% 1.2
26120 Manufacture of loaded electronic boards 100 1% 1.2
58110 Book publishing 100 0% 1.2
95110 Repair of computers and peripheral equipment 500 3% 1.1
Digital Tech sub sectors (100+ employees) that supply a greater proportion of Digital Tech sector employment than UK average
Source: Business Register and Employment Survey 2015, Office for National Statistics
23
85%
89%
87%
87%
89%
86%
87%
87%
89%
15%
11%
13%
13%
11%
14%
13%
13%
11%
Norfolk
Suffolk
Lincolnshire
New Anglia LEP
GCGP
GLLEP
SELEP
East of England
England
Full-time Part-time
Source: Business Register and Employment Survey, Office for National Statistics
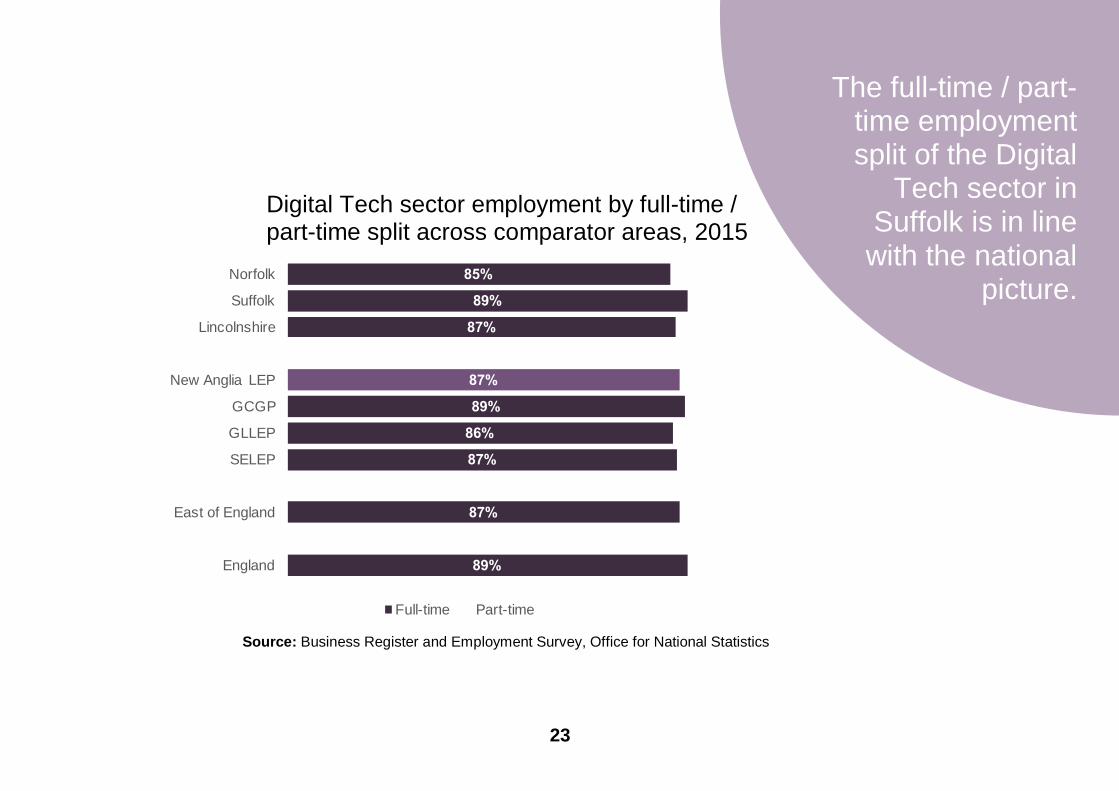
Digital Tech sector employment by full-time / part-time split across comparator areas, 2015
The full-time / part-time employment split of the Digital
Tech sector in Suffolk is in line with the national
picture.

24
91%
86%
88%
85%
86%
86%
84%
85%
81%
85%
85%
86%
93%
83%
9%
14%
11%
14%
14%
14%
16%
15%
19%
16%
15%
13%
7%
17%
Babergh
Breckland
Broadland
Forest Heath
Great Yarmouth
Ipswich
King`s Lynn and West Norfolk
Mid Suffolk
North Norfolk
Norwich
South Norfolk
St Edmundsbury
Suffolk Coastal
Waveney
Full-time Part-time
Digital Tech sector employment by full-time / part-time split across New Anglia, 2015
Source: Business Register and Employment Survey, Office for National Statistics
Of particular note here is the local authority area of Suffolk Coastal (the home of Adastral Park) with its employment structure geared towards full-time more than any other local authority area in New Anglia. At the opposite end of the scale is North Norfolk with nearly a fifth of its 300 people employed in the sector working part-time.
25
-50% -40% -30% -20% -10% 0% 10% 20% 30% 40%
Norfolk
Suffolk
Lincolnshire
New Anglia LEP
GCGP
GLLEP
SELEP
East of England
England
Full-time
Part-time
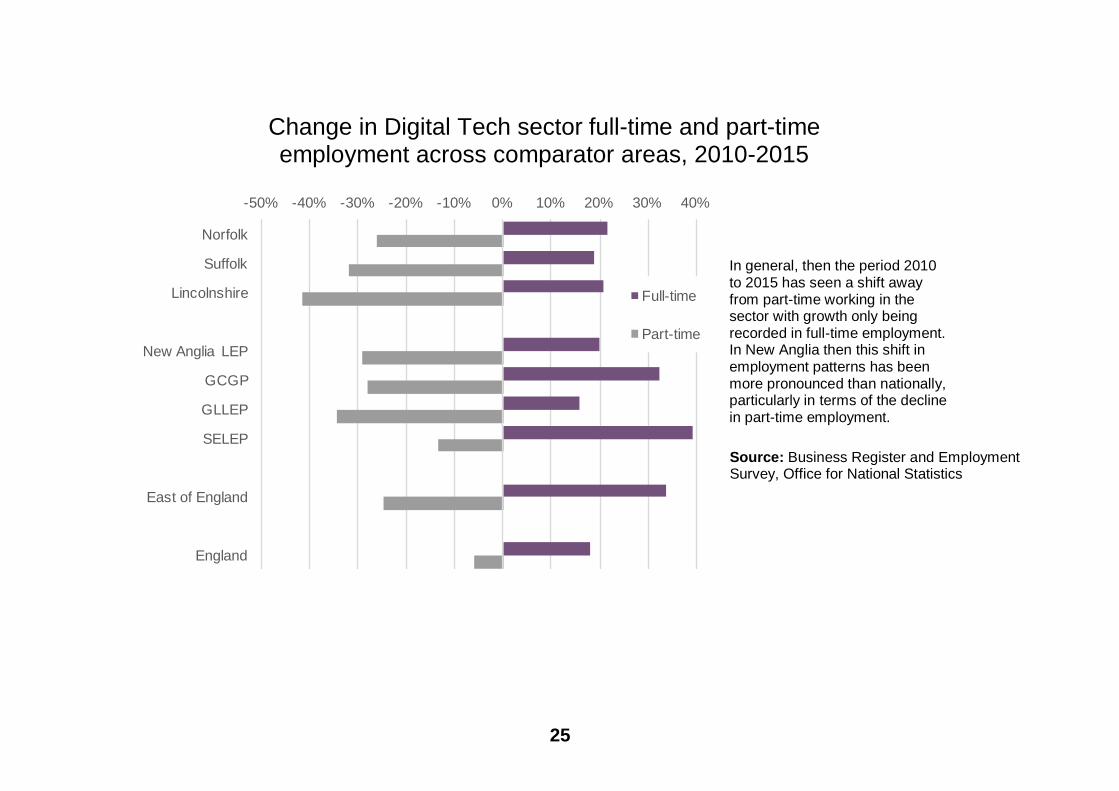
Change in Digital Tech sector full-time and part-time employment across comparator areas, 2010-2015
In general, then the period 2010 to 2015 has seen a shift away from part-time working in the sector with growth only being recorded in full-time employment. In New Anglia then this shift in employment patterns has been more pronounced than nationally, particularly in terms of the decline in part-time employment. Source: Business Register and Employment Survey, Office for National Statistics

26
-80% -40% 0% 40% 80% 120%
Breckland
North Norfolk
Broadland
South Norfolk
Norwich
King`s Lynn and West Norfolk
Great Yarmouth
Waveney
Babergh
Mid Suffolk
Ipswich
St Edmundsbury
Suffolk Coastal
Forest Heath
Full-time
Part-time
Change in Digital Tech sector full-time and part-time employment across New Anglia, 2010-2015
Source: Business Register and Employment Survey, Office for National Statistics
In contrast to the national and LEP level picture, at local authority level across New Anglia then there are two instances of where part-time employment has actually grown between 2010 and 2015 most notably Norwich being one of those areas.
Unsurprisingly those areas which have experienced declines in full-time employment are also those that have experienced declines in total employment in the sector.

27
52%
67%
71%
76%
82%
87%
58%
61%
60%
50%
55%
57%
48%
33%
29%
24%
18%
13%
42%
39%
40%
50%
45%
43%
0% 50% 100%
Total
Digital Tech
Total
Digital Tech
Total
Digital Tech
Total
Digital Tech
Total
Digital Tech
Total
Digital Tech
Em
plo
ym
ent
11 C
orp
ora
te
managers
and d
irecto
rs
21 S
cie
nce,
researc
h,
engin
eering
and
technolo
gy
pro
fessio
nals
24 B
usin
ess,
media
and
public
serv
ice
pro
fessio
nals
34 C
ultu
re,
media
and
sport
s
occupatio
ns
35 B
usin
ess
and p
ublic
serv
ice
associa
te
pro
fessio
nals
Male Female
Male and Female employment in the Digital Sector and Top 5 Occupations for Employment
Source: UKCES Working Futures 2014 - 2024

28
86%
76%
14%
24%
All Sectors
Digital Tech
Employees Self-employed
Self-employment in the Digital Tech sector
Source: New Anglia Economic Strategy evidence base work

29
28%
28%
27%
29%
28%
30%
29%
31%
32%
29%
35%
38%
23%
28%
35%
36%
9%
10%
9%
10%
10%
9%
10%
10%
31%
33%
29%
23%
39%
33%
26%
22%
0% 100%
New Anglia LEP
Norfolk
Suffolk
GCGP
GLLEP
SELEP
East of England
England
113 Functional Managers and Directors
213 Information Technology and Telecommunications Professionals
313 Information Technology Technicians
524 Electrical and Electronic Trades
Workplace Digital Tech employment 2011 by broad Standard Occupational Classification (SOC) across comparator areas
Source: 2011 Census, Office for National Statistics
Analysis of higher level Standard Occupational Classifications that contain those lower level Digital Tech sector occupations (detailed in appendix 3 on page X) hints at some distinct differences in the structure of employment across comparator areas. New Anglia LEP appears to be more geared towards the Electrical and Electronic Trades associated with the sector than nationally whereas as Greater Cambridgeshire Greater Peterborough LEP has a greater proportion of IT and Telecommunications Professionals.

30
32%
26%
28%
26%
32%
27%
31%
32%
31%
26%
34%
34%
18%
27%
19%
31%
18%
17%
20%
40%
29%
31%
22%
37%
25%
26%
53%
20%
7%
9%
9%
10%
8%
13%
9%
8%
12%
11%
7%
8%
7%
9%
43%
33%
44%
48%
41%
21%
30%
29%
35%
26%
34%
32%
22%
44%
0% 100%
Breckland
Broadland
Great Yarmouth
King`s Lynn and West Norfolk
North Norfolk
Norwich
South Norfolk
Babergh
Forest Heath
Ipswich
Mid Suffolk
St Edmundsbury
Suffolk Coastal
Waveney
113 Functional Managers and Directors
213 Information Technology and Telecommunications Professionals
313 Information Technology Technicians
524 Electrical and Electronic Trades
Source: 2011 Census, Office for National Statistics
Workplace Digital Tech employment 2011 by broad Standard Occupational Classification (SOC) across New Anglia
These differences in the structure of employment in the sector become even more apparent when looking at the local authority areas that make up New Anglia. For example, Suffolk Coastal and Norwich are particularly geared towards IT and Telecommunications Professionals.

31
1,095
1,660
1,770
1,415
3,425
5,455
13,270
0 2,000 4,000 6,000 8,000 10,000 12,000 14,000
Lincolnshire
Norfolk
Suffolk
GLLEP
New Anglia LEP
GCGP
South East LEP
14
18
23
13
21
37
30
010203040
Digital Tech sector business numbers across comparator areas, 2016
Source: UK Business Counts, and Sub-national Population Estimates, Office for National Statistics
SELEP
GCGP
New Anglia LEP
GLLEP
Suffolk
Norfolk
Lincolnshire
Number of Business Units
Number of Business Units per 10,000
Population

32
85
125
125
140
180
210
235
245
250
290
290
360
380
385
Great Yarmouth
Forest Heath
Waveney
North Norfolk
Breckland
King`s Lynn and West Norfolk
Babergh
Mid Suffolk
St Edmundsbury
South Norfolk
Broadland
Ipswich
Suffolk Coastal
Norwich
Digital Tech sector business numbers across New Anglia, 2016
Source: UK Business Counts, Office for National Statistics
When compared with the concentrated picture of employment, then business numbers show a good spread across the New Anglia area though again with the top three areas composed of Norwich, Suffolk Coastal, and Ipswich.
Unlike employment, Digital Tech sector
businesses are spread out across
the New Anglia area

33
92%
92%
93%
92%
91%
93%
94%
93%
92%
6%
7%
5%
6%
7%
5%
5%
5%
6%
2%
1%
1%
1%
1%
1%
1%
1%
1%
80% 85% 90% 95% 100%
Norfolk
Suffolk
Lincolnshire
New Anglia LEP
GCGP
GLLEP
SELEP
East of England
England
0-9 10-49 50-249 250+
Digital Tech sector business numbers by size across comparator areas, 2016 Source: UK Business Counts, Office for National Statistics
No. of employees
94%
94%
95%
92%
82%
88%
93%
96%
96%
87%
95%
90%
92%
96%
4%
6%
5%
8%
12%
10%
5%
4%
4%
10%
2%
8%
7%
4%
2%
1%
4%
2%
1%
80% 85% 90% 95% 100%
Babergh
Breckland
Broadland
Forest Heath
Great Yarmouth
Ipswich
King`s Lynn & West Norfolk
Mid Suffolk
North Norfolk
Norwich
South Norfolk
St Edmundsbury
Suffolk Coastal
Waveney
0-9 10-49 50-249
Digital Tech sector business numbers by size across New Anglia, 2016 Source: UK Business Counts, Office for National Statistics
At LEP and County level then there is very little to choose between areas in terms of the make-up of businesses by employee numbers. However, at local authority level then both Norwich and Ipswich in particular stand out, with 10 per cent of businesses employing between 10 and 49 people. Norwich too has the largest percentage of businesses employing between 50 and 249 people. Please note that at Local Authority level that businesses employing more than 250 people are not reported due to their very small numbers and resulting disclosive nature.

34
14%
5%
9%
9%
20%
9%
32%
29%
37%
Norfolk
Suffolk
Lincolnshire
New Anglia LEP
GCGP
GLLEP
SELEP
East of England
England
Source: UK Business Counts, Office for National Statistics
Change in Digital Tech business units across comparator areas, 2010 - 2016

35
-10% -5% 0% 5% 10% 15% 20% 25% 30% 35% 40%
Great Yarmouth
Breckland
South Norfolk
North Norfolk
Broadland
Norwich
King`s Lynn and West Norfolk
Mid Suffolk
Suffolk Coastal
Babergh
Waveney
St Edmundsbury
Ipswich
Forest Heath
Sources: UK Business Counts, Office for National Statistics
Change in Digital Tech business units across New Anglia, 2010 - 2016 Below the New Anglia geography then we can observe some very different fortunes in business growth across the local authorities. However, please note the small bases for measuring change here. Forest Heath in particular, has seen business unit numbers increase by 33% but from a base of around 95. This is still surprising given that employment fell over roughly the same period.
The large employment areas of Norwich and Ipswich have both performed well but worth noting the fall in business unit numbers in Suffolk Coastal.

36
Digital Tech sector wages – Median gross annual pay all employees (UK)
£40,053
£27,211
£60,062
£43,540
£46,970
£41,028
£39,362
£28,445
£38,894
£26,739
£27,922
£31,348
£23,409
£37,065
£41,380
£28,247
£69,026
£47,020
£47,937
£44,226
£39,771
£30,000
£36,896
£27,905
£28,376
£32,681
£26,597
£39,130
Information technology and telecommunications professionals (213)
Information technology technicians (313)
Information technology and telecommunications directors (1136)
IT specialist managers (2133)
IT project and programme managers (2134)
IT business analysts, architects and systems designers (2135)
Programmers and software development professionals (2136)
Web design and development professionals (2137)
IT and telecommunications professionals n.e.c. (2139)
IT operations technicians (3131)
IT user support technicians (3132)
Telecommunications engineers (5242)
IT engineers (5245)
Digital Tech (average median value)
2016
2014
Source: Annual Survey of Hours and Earnings, Office for National Statistics
(3%)
(4%)
(15%)
(8%)
(6%)
(14%)
(4%)
(2%)
(4%)
(-5%)
(5%)
(1%)
(8%)
(2%)
Figures in brackets denote percentage change between 2014 and 2016

37
£40,874
£28,288
£64,469
£44,858
£47,648
£41,837
£40,137
£29,026
£39,652
£27,905
£28,580
£31,474
£26,960
£38,413
£42,515
£28,831
£71,161
£47,768
£48,536
£44,832
£40,687
£30,392
£39,253
£28,813
£28,830
£32,702
£26,901
£39,989
Information technology and telecommunications professionals (213)
Information technology technicians (313)
Information technology and telecommunications directors (1136)
IT specialist managers (2133)
IT project and programme managers (2134)
IT business analysts, architects and systems designers (2135)
Programmers and software development professionals (2136)
Web design and development professionals (2137)
IT and telecommunications professionals n.e.c. (2139)
IT operations technicians (3131)
IT user support technicians (3132)
Telecommunications engineers (5242)
IT engineers (5245)
Digital Tech (average median value)
2016
2014
Digital Tech sector wages – Median gross annual pay full time employees (UK)
Source: Annual Survey of Hours and Earnings, Office for National Statistics
(4%)
(1%)
(3%)
(-1%)
(5%)
(1%)
(7%)
(2%)
(6%)
(10%)
(2%)
(4%)
(0%)
(4%)
Figures in brackets denote percentage change between 2014 and 2016

38
3%
4%
3%
4%
3%
5%
4%
3%
3%
10%
11%
9%
12%
9%
13%
14%
11%
9%
14%
17%
12%
19%
12%
19%
18%
14%
12%
16%
18%
15%
18%
13%
17%
17%
15%
14%
50%
44%
55%
40%
58%
39%
41%
51%
57%
6%
6%
6%
6%
5%
6%
6%
6%
6%
New Anglia LEP
Norfolk
Suffolk
Lincolnshire
GCGP
GLLEP
SELEP
East of England
England
No qualifications Level 1 qualifications
Level 2 qualifications Level 3 qualifications
Level 4 qualifications and above Apprenticeships and other qualifications
Source: 2011 Census, Office for National Statistics
Qualification levels in the sector (noting again that the Information and Communication industry is a broad approximation of the sector) in New Anglia compare favourably with those regionally and some comparator LEP areas. However, when compared with Greater Cambridgeshire and Greater Peterborough LEP and nationally then New Anglia falls short of those with level 4 qualifications and above.
Information and Communication Industry Workplace Qualifications across comparator areas, 2011

39
155
100
50 60
65
100
105
135
1520
25
15
65 95
6545
20
0
50
100
150
200
250
300
350
2011/12 2012/13 2013/14 2014/15
Social Media and Digital Marketing Providing Financial Services
Marketing IT, Software, Web & Telecoms Professional
IT Application Specialist Design
Creative and Digital Media
What is initially apparent from this data is the reduction
Digital Tech Apprenticeships
Source: Skills Funding Agency Data Cube
There has been a shift in apprenticeship
delivery more in line with the Digital Tech
sector mix locally
in IT Application Specialist course starts, and a corresponding increase in IT, Software, Web & Telecoms Professional. Also, Social Media and Digital Marketing appears to be a relatively new course, and growing.

40
0
100
200
300
400
500
600
700
800
New Anglia LEP East of England England
Change in Digital Tech Apprenticeships, Index 2005/6 = 100
Source: FE Data Library, Department for Education
Analysis of Digital Tech type apprenticeship starts since 2005/6 shows that there has been growth in numbers until around 2011 but that this growth has then effectively flat lined. Please note that this analysis uses a less precise definition of the digital tech sector (Information and Communication Technology apprenticeships) as opposed to the previous data cube analysis.

41
0 500 1,000 1,500 2,000 2,500 3,000 3,500
Norwich
Ipswich
St. Edmundsbury
Forest Heath
Suffolk Coastal
South Norfolk
Breckland
Great Yarmouth
Kings Lynn and West Norfolk
Waveney
Mid Suffolk
Babergh
North Norfolk
Broadland
Source: Labour Insight Jobs, Burning Glass Technologies
Digital Tech sector vacancies across New Anglia, Jan 2012 – Dec 2016
According to the Labour Insight Jobs tool, then there were 10,821 postings for the sector in New Anglia between Jan. 1, 2012 and Dec. 31, 2016. A further 1,521 postings had the potential to be within the sector but a final judgement could not be made on these due to their unspecified or unclassified nature.
The definition for the Digital Tech sector used in this exercise is wider than that previously defined but it still provides us with some useful information on vacancy numbers and types.
The definition captures the following industry and sectors: Information & Communication; Advertising and market research; Other professional, scientific and technical activities; Creative, arts and entertainment activities; Libraries, archives, museums and other cultural activities; Repair of computers and personal and household goods.
Please note that some caution needs to be applied to this data as results may reflect the way different sectors recruit rather than real differences in the number of jobs.

42
0 200 400 600 800 1,000 1,200
Serco Group
D A Languages Ltd
Absolute Interpreting Translations Ltd
Vodafone Group
National Trust
GFK
Wincanton
ADOS Solutions
Sage Group
Alpha Language Services
RSPB
BT
Virgin Media
Oracle
Xerox Ltd
The Mill
Sanderson Group
Cosine
Telecom Plus
Daisy Group
Archant Ltd
EE Ltd
Simply Ltd
Iconic Event Strategies
Vacancies are often raised by large
outsourced service providers and a cross-
cutting range of traditionally non-digital employers
0 200 400 600 800 1,000 1,200
Serco Group
D A Languages Ltd
Absolute Interpreting Translations Ltd
Vodafone Group
National Trust
GFK
Wincanton
ADOS Solutions
Sage Group
Alpha Language Services
RSPB
BT
Virgin Media
Oracle
Xerox Ltd
The Mill
Sanderson Group
Cosine
Telecom Plus
Daisy Group
Archant Ltd
EE Ltd
Simply Ltd
Iconic Event Strategies
Top Digital Tech Sector Employers across New Anglia, Jan 2012 – Dec 2016 Source: Labour Insight Jobs, Burning Glass Technologies
43
Source: Labour Insight Jobs, Burning Glass Technologies
0 100 200 300 400 500 600
Marketing associate professionals (3543)
Authors, writers and translators (3412)
Business sales executives (3542)
Sales and retail assistants (7111)
Sales related occupations n.e.c. (7129)
Programmers and software development professionals (2136)
Telephone salespersons (7113)
Other administrative occupations n.e.c (4159)
Market research interviewers (7215)
Web design and development professionals (2137)
Sales accounts and business development managers (3545)
Customer service occupations n.e.c (7219)
Quantity surveyors (2433)
Graphic designers (3421)
Photographers, audio-visual and broadcastign equipment operators (3417)
IT business analysts, architects and system designers (2135)
Physiotherapists (2221)
Marketing and sales directors (1132)
Call and contact centre occupations (7211)
Managers and proprietors in other services n.e.c. (1259)
Financial accounts managers (3538)
IT user support technicians (3132)
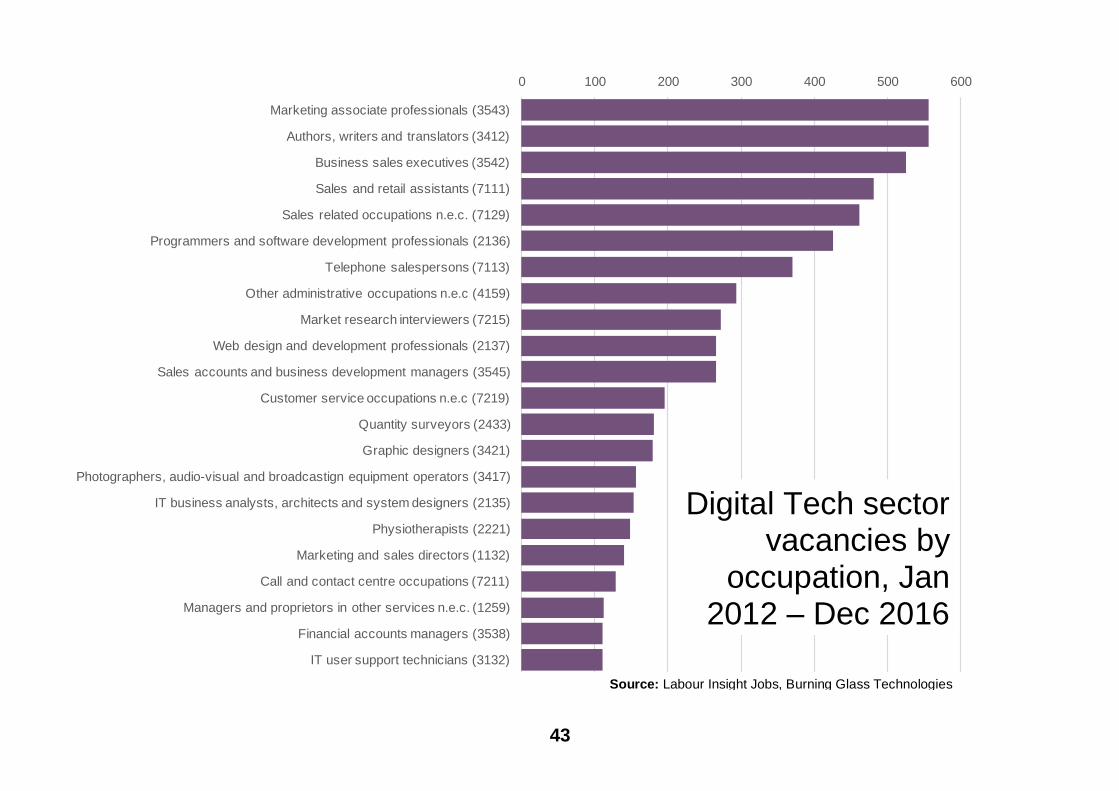
Digital Tech sector vacancies by
occupation, Jan 2012 – Dec 2016
Source: Labour Insight Jobs, Burning Glass Technologies

44
0 200 400 600 800 1,000 1,200
Sales Executive
Customer Service and Sales
Research Interviewer
Account Manager
Graphic Designer
Android Developer
Marketing Manager
Customer Service Advisor
Marketing Assistant
Business Development Executive
Sales Representative
PHP Developer
Web Developer
Marketing Analyst
Retail Salesperson
Sales Consultant
Assistant Manager
Retail Advisor
Sales Manager
Digital Tech sector vacancies by job title, Jan 2012 – Dec 2016
Source: Labour Insight Jobs, Burning Glass Technologies

45
Digital Tech sector vacancies by qualification level required,
Jan 2012 – Dec 2016
864
483
243
6149
49
13
Bachelor's degrees, graduate certificates and diplomas
GCSEs, Standard Grades, and Level 2 S/NVQs
A-Levels, Highers, and Level 3 S/NVQs
Level 4 diplomas and certificates, HNCs, Level S/NVQs
Foundation degrees and HNDs
Post graduate degrees, Level 5 S/NVQs, certificates and
diplomas
Source: Labour Insight Jobs, Burning Glass Technologies

46
0 200 400 600 800 1,000 1,200 1,400 1,600 1,800
Sales
Customer Service
Marketing Sales
Microsoft Excel
Market Research
Marketing
Customer Contact
Business Development
Product Sales
Graphic Design
Telecommunications
Business Management
Accountancy
Project Management
Sales Recruiting
Microsoft Office
JavaScript
Social Media
Purchasing
Contract Management
Telesales
Financial Accountancy
Promotional Marketing
Sales Management
Advertising Sales
Digital Tech sector vacancies by skills required,
Jan 2012 – Dec 2016 Source: Labour Insight Jobs, Burning Glass Technologies

47
A Future View of the Digital Tech Sector
48
80
90
100
110
120
2014 2015 2016 2017 2018 2019 2020 2021 2022 2023 2024
Publishing & broadcasting (EEFM) Telecoms (EEFM)
Computer related activity (EEFM) Digital Tech (EEFM)
Media (WF) Information technology (WF)
Digital Tech (WF)
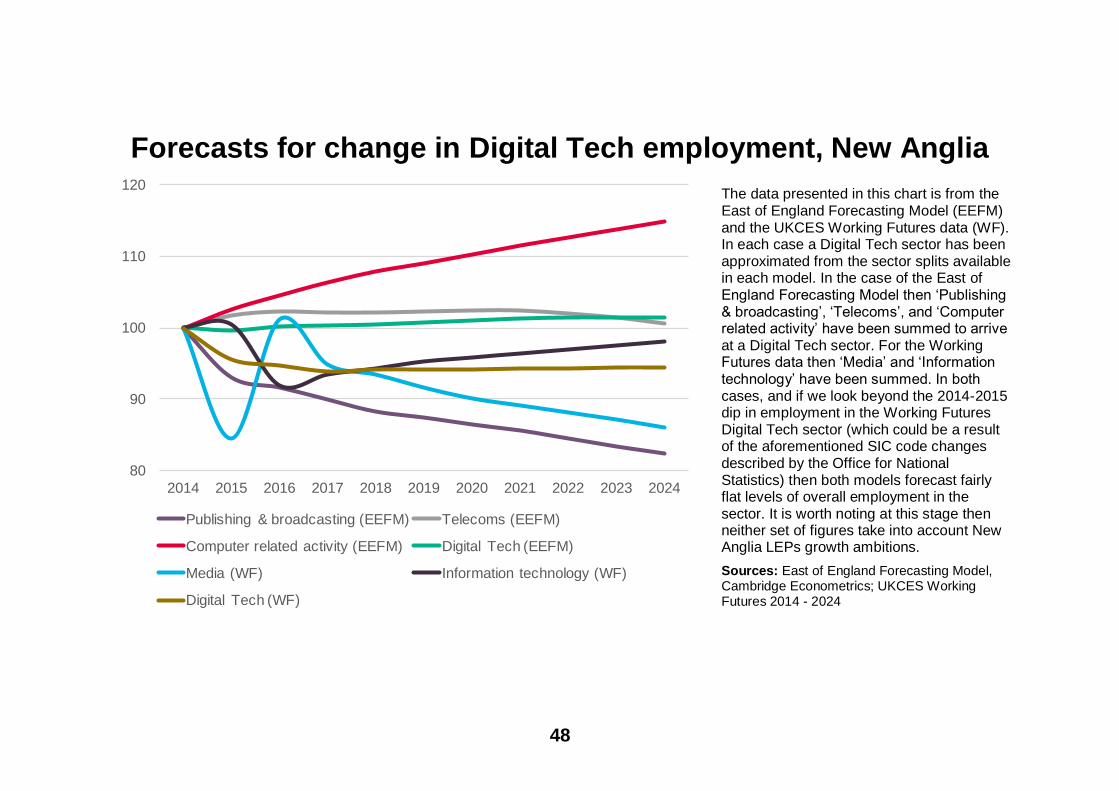
Forecasts for change in Digital Tech employment, New Anglia
Sources: East of England Forecasting Model, Cambridge Econometrics; UKCES Working Futures 2014 - 2024
The data presented in this chart is from the East of England Forecasting Model (EEFM) and the UKCES Working Futures data (WF). In each case a Digital Tech sector has been approximated from the sector splits available in each model. In the case of the East of England Forecasting Model then ‘Publishing & broadcasting’, ‘Telecoms’, and ‘Computer related activity’ have been summed to arrive at a Digital Tech sector. For the Working Futures data then ‘Media’ and ‘Information technology’ have been summed. In both cases, and if we look beyond the 2014-2015 dip in employment in the Working Futures Digital Tech sector (which could be a result of the aforementioned SIC code changes described by the Office for National Statistics) then both models forecast fairly flat levels of overall employment in the sector. It is worth noting at this stage then neither set of figures take into account New Anglia LEPs growth ambitions.

49
13% 14% 15% 15% 16%
30% 33%37% 38% 39%
21%22%
22% 23% 23%13%
9%8% 6% 6%12% 10% 8% 7% 7%
5% 5% 4% 4% 4%
0%
20%
40%
60%
80%
100%
2004 2009 2014 2019 2024
Digital Tech
Elementary occupations Process, plant and machine operatives
Sales and customer service Caring, leisure and other service
Skilled trades occupations Administrative and secretarial
Associate professional and technical Professional occupations
Managers, directors and senior officials
Occupational composition of employment in New Anglia’s Digital Tech sector over time
Management positions, professional and associate professional occupations are all set to maintain the bulk of the Digital Tech sector employment and grow in importance over time.
At the same time, skilled trade and administrative occupations are set to decline.
A similar pattern can be observed if we look at the same results for the sectors of Media and Information Technology used to create the Digital Tech sector.
Source: UKCES Working Futures 2014 - 2024

50
13% 14% 15% 15% 16%
36%39%
44% 45% 45%
18%19%
19% 19% 19%13%
8%7% 6% 6%
11% 10% 8% 7% 7%
5% 5% 4% 4% 4%
0%
20%
40%
60%
80%
100%
2004 2009 2014 2019 2024
Information Technology
Elementary occupations Process, plant and machine operatives
Sales and customer service Caring, leisure and other service
Skilled trades occupations Administrative and secretarial
Associate professional and technical Professional occupations
Managers, directors and senior officials
12% 12% 16% 15% 16%
17% 19%21% 22% 23%
27%29%
29%33% 33%
12%11%
9%7% 6%13% 11%
9% 8% 7%
9% 10% 8% 7% 7%
0%
20%
40%
60%
80%
100%
2004 2009 2014 2019 2024
Media
Elementary occupations Process, plant and machine operatives
Sales and customer service Caring, leisure and other service
Skilled trades occupations Administrative and secretarial
Associate professional and technical Professional occupations
Managers, directors and senior officials
13% 14% 15% 15% 16%
36%39%
44% 45% 45%
18%19%
19% 19% 19%13%
8%7% 6% 6%
11% 10% 8% 7% 7%
5% 5% 4% 4% 4%
0%
20%
40%
60%
80%
100%
2004 2009 2014 2019 2024
Information Technology
Elementary occupations Process, plant and machine operatives
Sales and customer service Caring, leisure and other service
Skilled trades occupations Administrative and secretarial
Associate professional and technical Professional occupations
Managers, directors and senior officials
Media
Information Technology
Source: UKCES Working Futures 2014 - 2024
2004 2009 2014 2019 2024

51
-1,000 1,000 3,000 5,000 7,000
All occupations
Science, research, engineering and
technology professionals
Corporate managers and directors
Business and public service associate
professionals
Culture, media and sports occupations
Business, media and public service
professionals
Expansion demand Replacement demand Net requirement
Digital Tech Replacement and Expansion Demand by Occupation
Source: UKCES Working Futures 2014 - 2024
Given the baseline projection of a flat level of employment growth seen in the previous section then the net requirement of posts to be filled across the sector is created totally by replacement demand i.e. people leaving or retiring from the workforce. Between 2014 and 2024 then there will be close to 6,000 positions created through retirement that will need filling.
However, if we go below the ‘All occupations’ element and have a look at the top five occupations (based on total net requirement of jobs over the period 2014-2024) in the sector then we can see that there are elements of expansion demand despite the projected no change in total employment.
52
-20%
-10%
0%
10%
20%
30%
40%
50%
All
occupations
Science,
research,
engineering and
technology
professionals
Corporate
managers
and directors
Business
and public
service associate
professionals
Culture,
media and
sports occupations
Business,
media and
public service
professionals
Expansion demand Replacement demand Net requirement
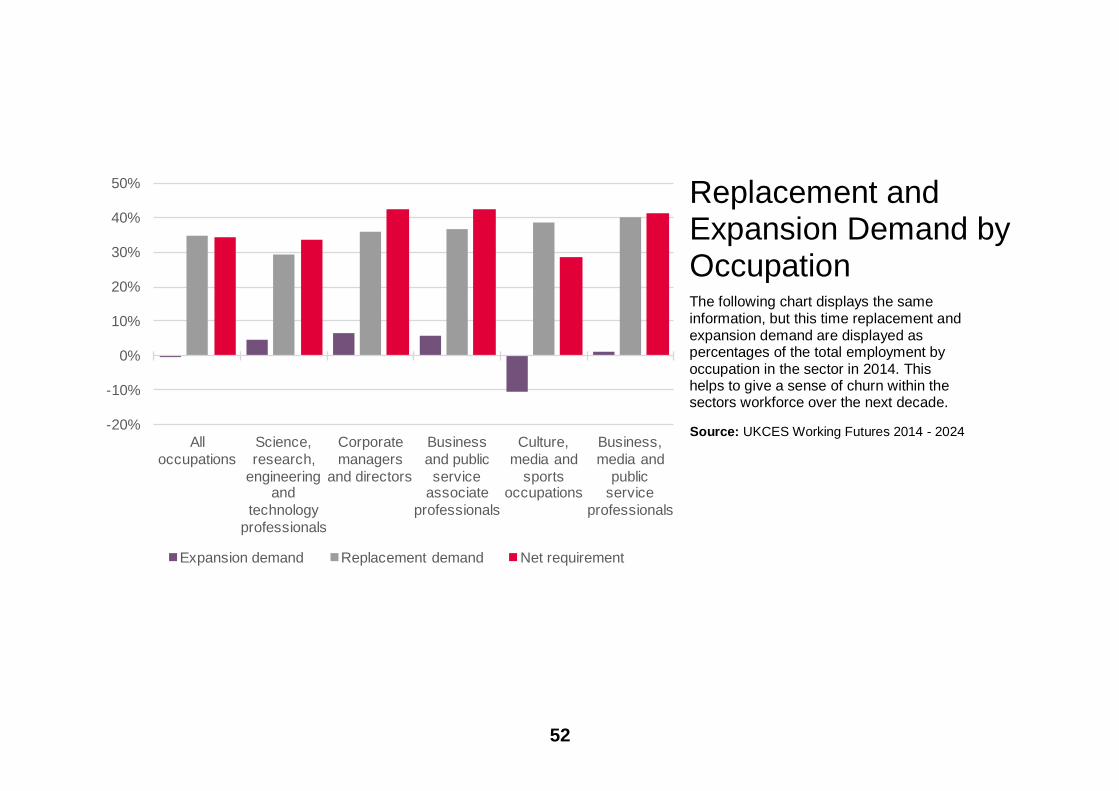
The following chart displays the same information, but this time replacement and expansion demand are displayed as percentages of the total employment by occupation in the sector in 2014. This helps to give a sense of churn within the sectors workforce over the next decade.
Replacement and Expansion Demand by Occupation
Source: UKCES Working Futures 2014 - 2024

53
-1,000 0 1,000 2,000 3,000 4,000 5,000
QCF 7-8
QCF 4-6
QCF 3
QCF 2
QCF 1
No Qual
Expansion Demand
Replacement Demand
The UKCES Working Futures data also enables us to consider levels of future replacement and expansion demand in terms of the levels of qualifications that will be leaving and required in the workforce as it changes over time. As we can see from the chart, positive replacement and expansion demand within the Digital Tech sector is going to be dominated by the demand for a first degree level of qualification.
Please note that the Working Futures data uses the following breakout of qualification levels: QCF8 - Doctorate QCF7 - Other higher degree QCF6 - First degree QCF5 - Foundation degree; Nursing; Teaching QCF4 - HE below degree level QCF3 - A level & equivalent QCF2 - GCSE (A-C) & equivalent QCF1 - GCSE (below grade C) & equivalent No Q - No Qualification
Replacement and Expansion Demand by Qualification, 2014 - 2024
Source: UKCES Working Futures 2014 - 2024

54
10% 6%
15%8%
16%
9%
44% 59%
13%
17%
2014 2024
No Qual
QCF 1
QCF 2
QCF 3
QCF 4-6
QCF 7-8
Digital Tech Sector Employment Change by Qualification Level (including TechEast job creation target)
2014
16,600 jobs
2024
21,100 jobs 10% 6%
15%8%
16%
9%
44%59%
13%17%
2014 2024
No Qual
QCF 1
QCF 2
QCF 3
QCF 4-6
QCF 7-8
10% 6%
15%8%
16%
9%
44%59%
13%17%
2014 2024
No Qual
QCF 1
QCF 2
QCF 3
QCF 4-6
QCF 7-8
10% 6%
15%8%
16%
9%
44%59%
13%17%
2014 2024
No Qual
QCF 1
QCF 2
QCF 3
QCF 4-6
QCF 7-8
10% 6%
15%8%
16%
9%
44%59%
13%17%
2014 2024
No Qual
QCF 1
QCF 2
QCF 3
QCF 4-6
QCF 7-8
10% 6%
15%8%
16%
9%
44%59%
13%17%
2014 2024
No Qual
QCF 1
QCF 2
QCF 3
QCF 4-6
QCF 7-8
10% 6%
15%8%
16%
9%
44%59%
13%17%
2014 2024
No Qual
QCF 1
QCF 2
QCF 3
QCF 4-6
QCF 7-8
The TechEast target of 5,000 jobs includes job creation in Cambridge. If we break this target down, based on employment in each of TechEast’s constiuent areas, then the target for New Anglia comes out at 2,237 jobs by 2020. If we push that jobs target forward to 2024, bringing it into line with the Working Futures data we are using to estimate replacement and expansion demand, then this target reaches approximately 4,500 jobs (please note that in total target calculations this figure is rounded to the nearest thousand i.e. 4,000). Given that forecasts for employment in the sector show that growth will be in those jobs with higher level qualifications (QCF 4 and above), there will be less roles in lower qualification roles, and we can assume that any additional job creation in the sector will be in those higher skilled roles as well.
Source: UKCES Working Futures 2014 - 2024

55
Digital Tech Sector Replacement and Expansion Demand by Qualification Level 2017 - 2024
+ - 0
-2,000 jobs
+2,000 jobs
No Qual QCF 1 QCF 2 QCF 3 QCF 4-6 QCF 7-8
Job creation and loss by qualification level, 2017 - 2024 (Expansion Demand)
0 +
Job creation and loss by qualification level, 2017 - 2024 (Replacement Demand)
+4,000
jobs 44% 13% 16% 15% 10%
These two charts are presented to show forecast change in the Digital Tech workforce over the period from when the TechEast job creation target came into affect (2017) and the latest date of Working Futures data (2024) used to procude this analysis.
Source: UKCES Working Futures 2014 - 2024

56
Views from Sector Stakeholders

57
Key Issues/Challenges
- The feedback we have had from SMEs within the Digital Tech sector is that the main demand for recruitment comes at graduate level, with most employers favouring graduates with around 2 years of experience. There is some reticence to take on newly qualified graduates with employers recognising employability and competency as being as equally important as a qualification;
- Therefore, more needs to be done to ensure employability is developed through schools, FE colleges and University. UEA, NUA and UCS have schemes in place that could be developed further through school engagement;
- The retention of talent (graduates) is a challenge, with Norwich in particular more likely to see graduates leave the area for employment elsewhere (particularly London). Norwich has a strong digital creative presence and the recent activity to raise the profile of the sector (SyncNorwich etc) needs to be capitalised on by profiling the depth and value of the sector and the careers it offers. Ipswich’s presence in telecoms & software engineering (at Adastral Park) and the Innovation Martlesham activity are key drivers for competitive advantage for the region too and the ‘place marketing’ strategy for the area needs to make careful reference to the skills supply and offer for start-ups, growing SMEs and inward investment. There is also a strong need to engage with schools to inform the career choices of young people on this basis;
- The FE sector and independent training base has great potential to collaborate through a joined-up offer but from an employer perspective their profile is relatively low, with businesses more likely to train internally or seek technical training outside of the area. Pursuing greater flexibility of the adult skills budget could enable a far more responsive post-16 skills response, with the Local Authorities able to influence the match between training provision and need; and help the skills offer become more accessible to SMEs;
- Developing a leadership and ownership function to take forward the skills strategy is of paramount importance- given the need to represent the demands of the industry and engender a more joined-up and responsive skills offer. Ownership that demonstrates the investment the sector is prepared to make in skills can act as an important catalyst for extra resources linked to skills reform and technical excellence - such as highlighted in the Industrial Strategy and made available through New Anglia LEP’s Skills Deal programme.
Key Skills Shortages
- Multi-application software design/language coding;
- Cloud based platform enterprise architecture and development;
- AWS and Azure- cloud based transitioning and development;
- App development for mobile solutions;
Key findings from stakeholder consultation:

58
- Digital marketing- both ‘soft’ and technical skills;
- Technical design skills- with a focus on digital capability (and not graphic design). Particularly UX design;
- IT security- data loss prevention;
- Business analysts- behaviour driven design, problem solving skills.
Apprenticeships
- SMEs within the sector indicate a willingness to consider apprenticeship recruitment in the future but are concerned about the cost and time implications of apprenticeship recruitment;
- Overall apprenticeship starts across New Anglia as a whole within ICT have reduced since a peak of starts for the 2012/13 academic year. This is also in line with national trends. The reform of apprenticeships from frameworks to standards represents a strong opportunity for SMEs and larger employers to take ownership of new apprenticeship occupational areas. The emerging Skills Plan for the Digital Tech sector is identifying how skills providers and employers can best collaborate to respond to the reform policy, in line with the skills gaps;
- Both UEA and NUA are engaged in the development of degree apprenticeships and are well placed to coordinate engagement with the sector to raise the profile of apprenticeships and develop pathways to encourage greater take-up.

59
Task and Finish Group (i) - Adastral Park, Martlesham Heath, Suffolk, AM Friday 6th Jan 2017 Key Points:
- Demand focuses on graduate level skills, however current local output often lacks enterprise/applied understanding. Larger firms often
favour a graduate with +2 years of experience.
- SMEs lack the capacity to take on Level 3/A Level equivalent and invest in training and development to get them to graduate.
- Interns are used, particularly during the summer, and have become a useful source of return employment once their qualifications are in
place.
- Developers identified issues with the ability for graduates to be able to code ‘from scratch’.
- Lack of insight into ‘key competencies’ within HEI content.
- Over reliance on contractors, who are expensive and transitory.
- Low levels of engagement with FE and the independent training market.
- Essex University is often used for graduate recruitment purposes, with the belief that local HEIs do not necessarily produce the
appropriate type of skills, particularly applied skills. Furthermore, due to the lack of locally led and delivered workforce training provision,
employers often refer to London based training institutions for in-work development solutions.
- Fundamental challenges in sourcing talent locally and problems with ‘place attraction’ for graduate level supply to relocate to the Suffolk
area.
- Software engineering is overlooked as a profession.
- Off-shoring of work presents mixed value but due to ‘pipeline’, labour costs and entry level ‘front end’ skills abilities, it often becomes a
solution.
- There needs to be a balance of new business clustering across New Anglia alongside the concentration of activity within existing
significant clusters- particularly at Adastral Park (Telecoms, Software Development and Engineering) and in Norwich (Digital Creative),
a key part of the TechEast role.
- Wide networking is favoured, which needs to be made more appealing to SMEs. This could be achieved through signature ‘shows’ and
demonstrations, utilising the testing centre ‘assets’ across the HEIs.
- Focus on encouraging the larger employers to share skills resource and purchase locally.
60
- The existence of the Skills Framework for the Information Age (SFIA); an open source framework for assessing skills in a standard
industry pattern and introducing structured development, including key competencies around influencing, autonomy, and decision-
making. The use of SFIA could help demonstrate to staff the progress they can make in developing industry standard skills within the
workplace, therefore reducing churn.
Key Skills Needs:
- Multi-application software design/language coding.
- Cloud based platform enterprise architecture and development.
- AWS and Azure- cloud based transitioning and development.

61
Task and Finish Group (ii) - White Space, Norwich, Norfolk, PM Friday 6th Jan 2017 Key Points:
- No clear indications were given as to why there has been a drop in employment levels between 2010 and 2015, however it was felt that
the redefinition of business location by a number of larger employers may have affected the statistics.
- The unique offer for the region should be centred around the two primary clusters in Norwich (Digital Creative) and Adastral
Park/Martlesham Heath (Telecoms/Software Development and Engineering).
- Some uncertainty regarding the allocation of SIC codes with reference to digital media services, recognising the unregulated nature of
SIC code allocation by businesses overall. Therefore, the view was that the scale and economic contribution of the sector is probably
understated through SIC code modelling, particularly given the cross-cutting nature of the digital tech sector.
- Demand is usually at graduate levels, with constraints surrounding finding suitable talent below degree level and supporting their job
readiness- due to SME capacity constraints. This has particularly affected the take up of apprentices.
- As with Suffolk, the attraction and retention of talent to the local area is a key barrier.
- School engagement is seen as a priority but can be a timely and complex process. This was emphasised by the ‘Digital City’ events,
which is popular with businesses, stimulating strong interaction with UEA and NUA, but lacks overall school engagement. The sector
recognises as a priority the need to develop an organised and structured process for engaging with schools/colleges to help develop the
pipeline of talent.
- There is an underlying issue of ensuring candidates have sufficient relevant experience.
- There is also less focus on FE and independent training market engagement.
Key Skills Needs:
- App development for mobile solutions.
- Digital marketing- both ‘soft’ and technical skills.
- Technical design skills- with a focus on digital capability (and not graphic design).
- IT security- data loss prevention.
- Business analysts- behaviour driven design, problem solving skills.
62
Appendices

63
Appendix 1 – Digital Tech sector definition
Standard Industrial Classification (SIC) Code SIC Details % of SIC applicable to sector
26110 Manufacture of electronic components
26120 Manufacture of loaded electronic boards
26200 Manufacture of computers and peripheral equipment
26301 Manufacture of telegraph and telephone apparatus and equipment
26309 Manufacture of communication equipment
26400 Manufacture of consumer electronics
26800 Manufacture of magnetic and optical media
46510 Wholesale of computers, computer peripheral equipment and software
46520 Wholesale of electronic and telecommunications equipment and parts
58110 Book Publishing 18.4
58120 Publishing of directories and mailing lists 18.4
58130 Publishing of newspapers 18.4
58141 Publishing of learned journals 18.4
58142 Publishing of consumer, business and professional journals and periodicals 18.4
58190 Other publishing activities 18.4
58210 Publishing of computer games
58290 Other software publishing
59111 Motion picture production activities 33.2
59112 Video production activities 33.2
59113 Television programme production activities 33.2
59120 Motion picture, video and television programme post-production activities 33.2
59131 Motion picture distribution activities 33.2
59132 Video distribution activities 33.2
59133 Televison programme distribution activities 33.2
59140 Motion picture projection activities 33.2
59200 Sound recording and music publishing activities 33.2
60100 Radio broadcasting 33.2
60200 Television programming and broadcasting activities 33.2
64
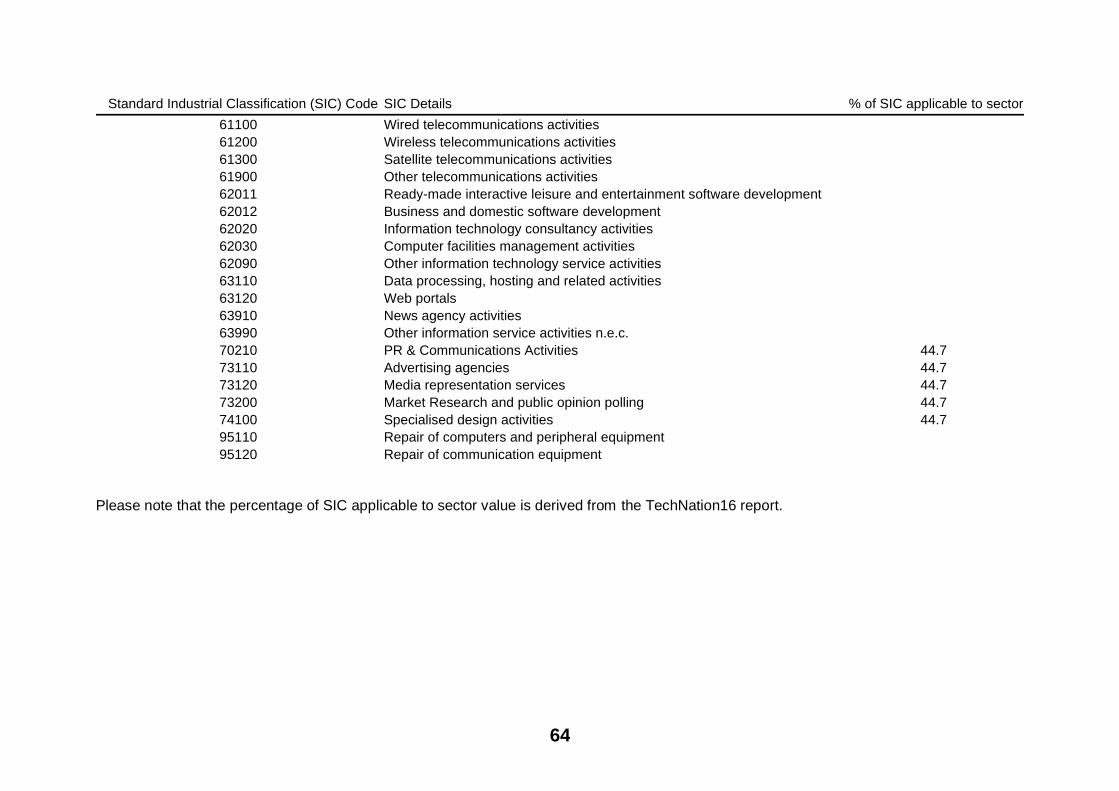
Please note that the percentage of SIC applicable to sector value is derived from the TechNation16 report.
60200 Television programming and broadcasting activities 33.2
Standard Industrial Classification (SIC) Code SIC Details % of SIC applicable to sector
61100 Wired telecommunications activities
61200 Wireless telecommunications activities
61300 Satellite telecommunications activities
61900 Other telecommunications activities
62011 Ready-made interactive leisure and entertainment software development
62012 Business and domestic software development
62020 Information technology consultancy activities
62030 Computer facilities management activities
62090 Other information technology service activities
63110 Data processing, hosting and related activities
63120 Web portals
63910 News agency activities
63990 Other information service activities n.e.c.
70210 PR & Communications Activities 44.7
73110 Advertising agencies 44.7
73120 Media representation services 44.7
73200 Market Research and public opinion polling 44.7
74100 Specialised design activities 44.7
95110 Repair of computers and peripheral equipment
95120 Repair of communication equipment

65
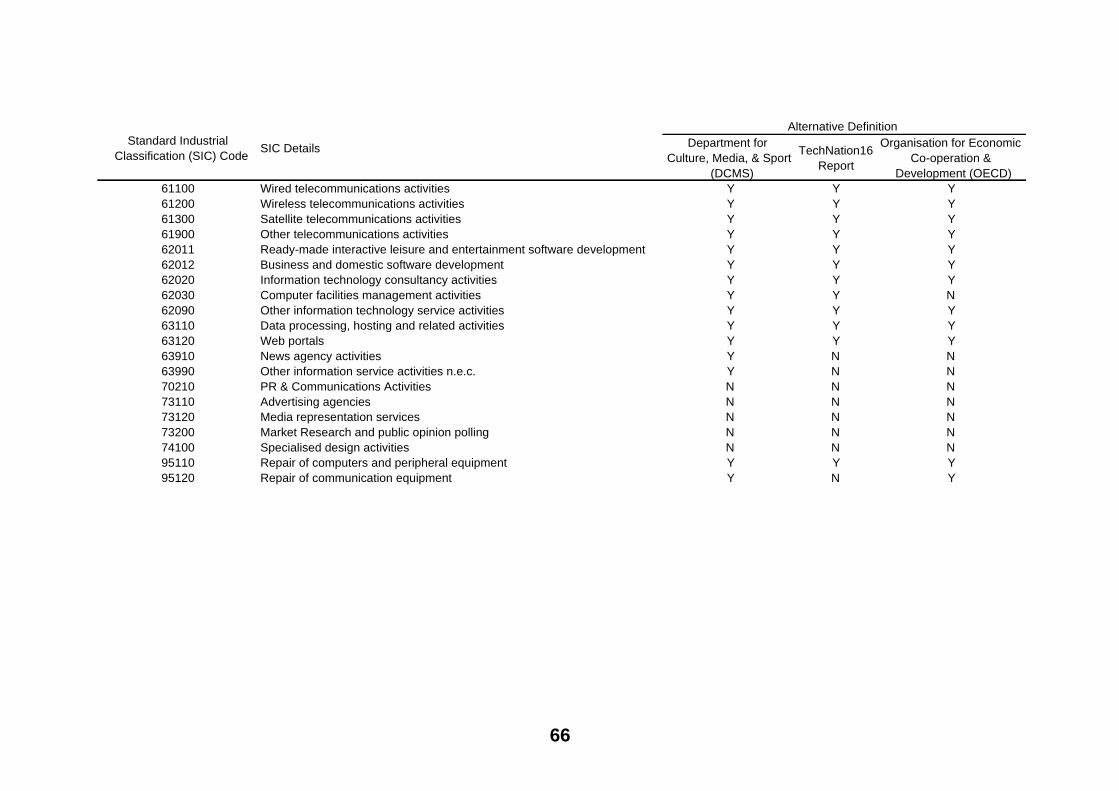
Appendix 2 – New Anglia LEP Digital Tech sector definition comparison with other recognised definitions of the sector
Department for
Culture, Media, & Sport
(DCMS)
TechNation16
Report
Organisation for Economic
Co-operation &
Development (OECD)
26110 Manufacture of electronic components Y N Y
26120 Manufacture of loaded electronic boards Y N Y
26200 Manufacture of computers and peripheral equipment Y Y Y
26301 Manufacture of telegraph and telephone apparatus and equipment Y N Y
26309 Manufacture of communication equipment Y N Y
26400 Manufacture of consumer electronics Y N Y
26800 Manufacture of magnetic and optical media Y N Y
46510 Wholesale of computers, computer peripheral equipment and software Y N Y
46520 Wholesale of electronic and telecommunications equipment and parts Y N Y
58110 Book Publishing Y N N
58120 Publishing of directories and mailing lists Y N N
58130 Publishing of newspapers Y N N
58141 Publishing of learned journals Y N N
58142 Publishing of consumer, business and professional journals and periodicals Y N N
58190 Other publishing activities Y N N
58210 Publishing of computer games Y Y Y
58290 Other software publishing Y Y Y
59111 Motion picture production activities Y N N
59112 Video production activities Y N N
59113 Television programme production activities Y N N
59120 Motion picture, video and television programme post-production activities Y N N
59131 Motion picture distribution activities Y N N
59132 Video distribution activities Y N N
59133 Televison programme distribution activities Y N N
59140 Motion picture projection activities Y N N
59200 Sound recording and music publishing activities Y N N
60100 Radio broadcasting Y N N
60200 Television programming and broadcasting activities Y N N
Alternative Definition
Standard Industrial
Classification (SIC) CodeSIC Details
66
60200 Television programming and broadcasting activities Y N N
Department for
Culture, Media, & Sport
(DCMS)
TechNation16
Report
Organisation for Economic
Co-operation &
Development (OECD)
61100 Wired telecommunications activities Y Y Y
61200 Wireless telecommunications activities Y Y Y
61300 Satellite telecommunications activities Y Y Y
61900 Other telecommunications activities Y Y Y
62011 Ready-made interactive leisure and entertainment software development Y Y Y
62012 Business and domestic software development Y Y Y
62020 Information technology consultancy activities Y Y Y
62030 Computer facilities management activities Y Y N
62090 Other information technology service activities Y Y Y
63110 Data processing, hosting and related activities Y Y Y
63120 Web portals Y Y Y
63910 News agency activities Y N N
63990 Other information service activities n.e.c. Y N N
70210 PR & Communications Activities N N N
73110 Advertising agencies N N N
73120 Media representation services N N N
73200 Market Research and public opinion polling N N N
74100 Specialised design activities N N N
95110 Repair of computers and peripheral equipment Y Y Y
95120 Repair of communication equipment Y N Y
Standard Industrial
Classification (SIC) CodeSIC Details
Alternative Definition

67
Appendix 3 – TechNation16 (TechCity) report definition of Digital Tech sector jobs using Standard Occupational Classification
Standard Occupational Classification (SOC)
Code (Revised 2007)SOC Details
1136 IT and telecommunications directors
2133 IT specialist managers
2134 IT project and programme managers
2135 IT business analysts, architects & system designers
2136 Programmers & software development professionals
2137 Web design & development professionals
2139 IT & telecommunications professionals not elsewhere classified
3131 IT operations technicians
3132 IT user support technicians
5242 Telecommunications engineers
5245 IT engineers