digital signs and kiosks - services.google.com · A Forrester Total Economic Impact™ Study...
21
A Forrester Total Economic Impact™ Study Commissioned By Google September 2018 The Total Economic Impact ™ Of Google Chrome Kiosks And Digital Signage Cost Savings And Business Benefits Enabled By Chrome Kiosks And Digital Signage For Enterprise
-
Upload
duongthuan -
Category
Documents
-
view
216 -
download
0
Transcript of digital signs and kiosks - services.google.com · A Forrester Total Economic Impact™ Study...
A Forrester Total Economic Impact™
Study Commissioned By Google
September 2018
The Total Economic Impact™ Of Google Chrome Kiosks And Digital Signage
Cost Savings And Business Benefits Enabled By Chrome Kiosks And Digital Signage For Enterprise
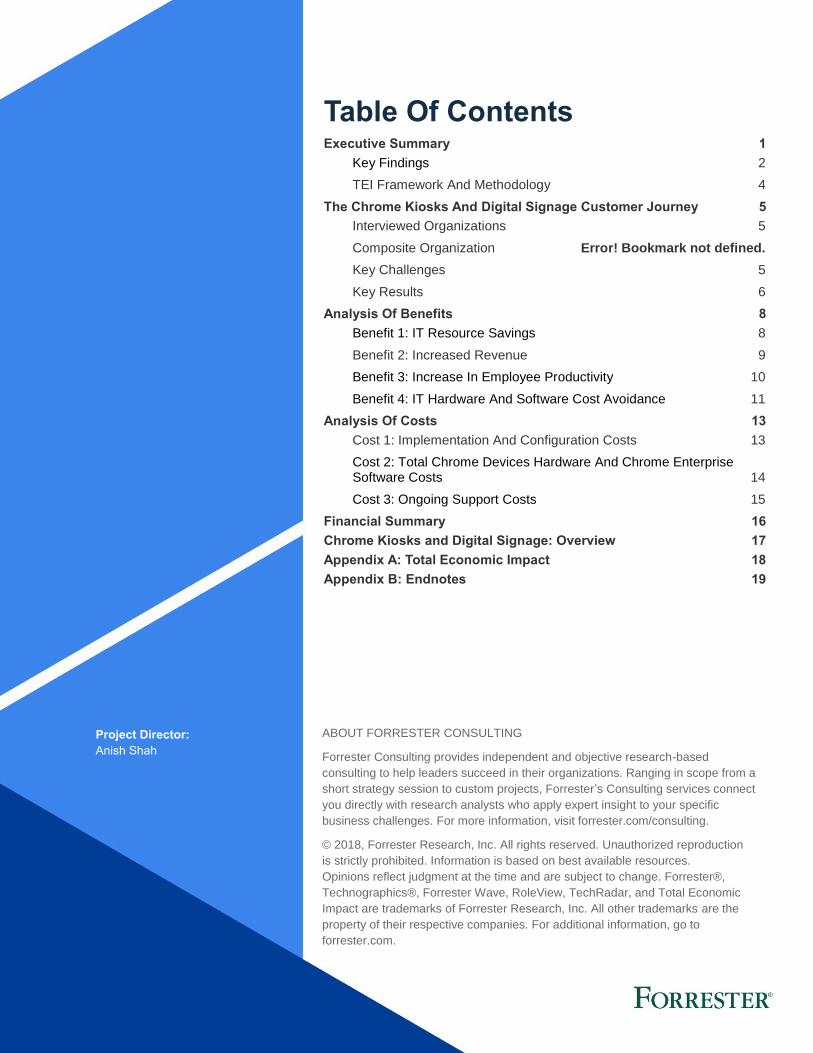
Table Of Contents Executive Summary 1
Key Findings 2
TEI Framework And Methodology 4
The Chrome Kiosks And Digital Signage Customer Journey 5
Interviewed Organizations 5
Composite Organization Error! Bookmark not defined.
Key Challenges 5
Key Results 6
Analysis Of Benefits 8
Benefit 1: IT Resource Savings 8
Benefit 2: Increased Revenue 9
Benefit 3: Increase In Employee Productivity 10
Benefit 4: IT Hardware And Software Cost Avoidance 11
Analysis Of Costs 13
Cost 1: Implementation And Configuration Costs 13
Cost 2: Total Chrome Devices Hardware And Chrome Enterprise Software Costs 14
Cost 3: Ongoing Support Costs 15
Financial Summary 16
Chrome Kiosks and Digital Signage: Overview 17
Appendix A: Total Economic Impact 18
Appendix B: Endnotes 19
Project Director:
Anish Shah
ABOUT FORRESTER CONSULTING
Forrester Consulting provides independent and objective research-based
consulting to help leaders succeed in their organizations. Ranging in scope from a
short strategy session to custom projects, Forrester’s Consulting services connect
you directly with research analysts who apply expert insight to your specific
business challenges. For more information, visit forrester.com/consulting.
© 2018, Forrester Research, Inc. All rights reserved. Unauthorized reproduction
is strictly prohibited. Information is based on best available resources.
Opinions reflect judgment at the time and are subject to change. Forrester®,
Technographics®, Forrester Wave, RoleView, TechRadar, and Total Economic
Impact are trademarks of Forrester Research, Inc. All other trademarks are the
property of their respective companies. For additional information, go to
forrester.com.
1 | The Total Economic Impact™ Of Google Chrome OS With GSuite
Executive Summary
Customer experience can have enormous ramifications on an
organization’s bottom line. Positive experiences can foster loyalty, improve
brand sentiment, and increase customer engagement while a single
negative experience can turn customers away and erode trust. Providing
customers with easy-to-access, self-service information about your
product and pricing, along with options to quickly complete transactions,
not only improves customer experience but drives organizational
efficiencies and employee productivity.
Many organizations across industries are leveraging single-purpose
Chrome OS devices for their customers and their employees. These
devices are used both as kiosks to access a single application and as
digital signage to easily share and display content without the hassles of
relying on IT resources. According to Forrester’s research1, 66% of
customers want to self-serve for routine tasks and information and want
this experience to be easy with minimal friction.1 Chrome kiosks and digital
signage add significant value to organizations by providing personalized
assistance to customers that can be easily replicated and deployed at any
location. In addition, Chrome kiosks augment operations, boosting
employee productivity and experience.
Google commissioned Forrester Consulting to conduct a Total Economic
Impact™ (TEI) study and examine the potential return on investment (ROI)
enterprises may realize by leveraging Chrome devices for single-purpose
kiosks and digital signage. The purpose of this study is to provide
organizations with a framework to evaluate the potential financial impact of
deploying Chrome kiosks and digital signage for their employees and
customers.
To better understand the benefits, costs, and risks associated with this
investment, Forrester interviewed and surveyed several customers with
multiple years of experience using Chrome kiosks and digital signage.
Customers mentioned the following reasons for deploying these Chrome
devices in their organizations:
› Improve customer experience to drive sales, average order value, and faster service.
› Offer an easy way for field employees, store employees, healthcare staff, and other workers to access web-based applications, conduct training, and quickly enter in information.
› Drive employee engagement by providing employees with Chrome kiosks in breakrooms to access emails. With single sign-on features, it makes it easy for organizations to deliver this shared experience.
› Allows organizations to easily create and push out content and marketing messages without relying on IT support and services.
› Reduce IT capex spend by lowering the cost of acquiring, shipping, and deploying each device.
› Reduce burden on IT teams by decreasing the time spent on hardware configurations, managing updates, re-imaging devices, and troubleshooting.
› Increase the scale with which devices and new marketing material can be rolled out across locations.
Benefits And Costs
Increased revenue:
$3,329,273
IT resource savings:
$1,007,175
Implementation, hardware, software licensing, and ongoing resources costs:
$977,477
Key Findings
Quantified benefits. The following risk-adjusted present value (PV)
quantified benefits are representative of those experienced by the
companies interviewed and surveyed over three years:
› Reduced burden on IT resources resulted in $1.0M in savings. With
Chrome devices, IT teams spent much less time on deployment, device
management, remediation of issues, re-imaging devices, and managing
security updates. Surveyed companies estimated that prior to Chrome
devices, IT teams would spend an average of 1 hour a week on these
tasks. With Chrome devices, the companies estimated an 80% reduction
in time for these tasks. These IT resource savings resulted in a three-
year productivity benefit of $1.0 million.
› Leveraging Chrome devices as customer self-service kiosks
increased sales, resulting in $3.3 million in additional bottom-line
benefits. Interviewed organizations noted that consumer expectations are
no longer limited to just the digital shopping experience. Their customers
expect physical stores to deliver the same product assortment, rapid
delivery, and product information that they get online. Providing customers
with self-service kiosks to browse products, review options, and make
transactions significantly improved the customer experience, increased
average transaction value, and drove additional sales. For each retail
operation that rolled out a customer-facing Chrome kiosk, the interviewed
organizations estimated a 3% overall lift in revenue, which resulted in a
three-year benefit of over $3.3 million.
› Chrome kiosks and digital signage drove over $755K in employee
productivity. Chrome devices helped interviewed and surveyed
organizations across retail, manufacturing, and healthcare industries
improve employee productivity. Healthcare caregivers did not have to
carry their personal devices to log in and track patient information.
Manufacturing organizations could provide kiosks that allowed multiple
floor workers access to business applications. In retail, employees could
perform many day-to-day functions like logging inventory all by
accessing a self-service Chrome kiosk in the back room. In addition,
retail workers could leverage Chrome devices to push out marketing
messages and content without the assistance of IT support and
services.
› Chrome devices resulted in over $495K of IT hardware and
software cost savings. By implementing Chrome devices for self-
service kiosks and digital signage, interviewed customers saved on both
hardware device costs and ongoing license costs. The customers noted
that Chrome devices were priced less than 50% of other comparable
options, and there were ongoing license costs savings as well. These IT
capex and opex savings allowed the interviewed organizations to quickly
roll out devices to many countries and enabled them to scale faster.
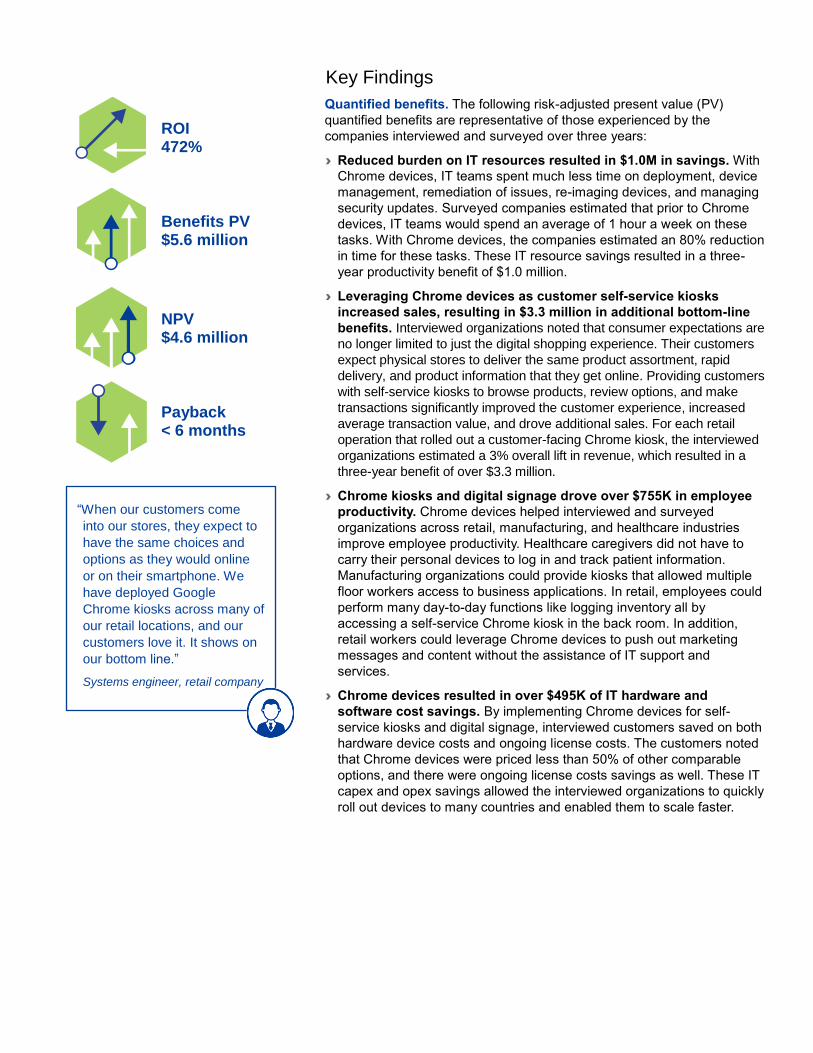
ROI 472%
Benefits PV $5.6 million
NPV $4.6 million
Payback < 6 months
“When our customers come
into our stores, they expect to
have the same choices and
options as they would online
or on their smartphone. We
have deployed Google
Chrome kiosks across many of
our retail locations, and our
customers love it. It shows on
our bottom line.”
Systems engineer, retail company
Unquantified benefits. The interviewed and surveyed organizations
experienced the following benefits, which are not quantified for this study:
› IT resources can redeploy time from reactive technical tasks to more
value-added, strategic initiatives.
› Organizations can reduce data and security breaches and related costs.
› Chrome Enterprise has built-in reporting that streamlines compliance
and audit processes. Google maintains and adheres to many industry
security standards. As such, this ensures organizations stay compliant
while reducing the effort needed for internal and external audits.
Costs. The interviewed and surveyed organizations experienced the
following risk-adjusted PV costs:
› Implementation and configuration lasted five months and cost
$275,000. On average, five internal FTEs needed five months to
implement, test, and deploy 450 Chrome devices across locations in the
existing environment. These devices were both internal- and external-
facing.
› Chrome devices and Chrome Enterprise annual licenses cost
$210,050. The average cost per Chrome device for kiosks and digital
signage was $300 per unit and an annual license cost of $50 per unit.
› Chrome kiosks and digital signage support cost approximately
$198,000 per year. This included the annual internal marketing and IT
resource costs to update content, manage security updates, ensure
compatibility with new applications, and troubleshoot requirements from
Chrome.
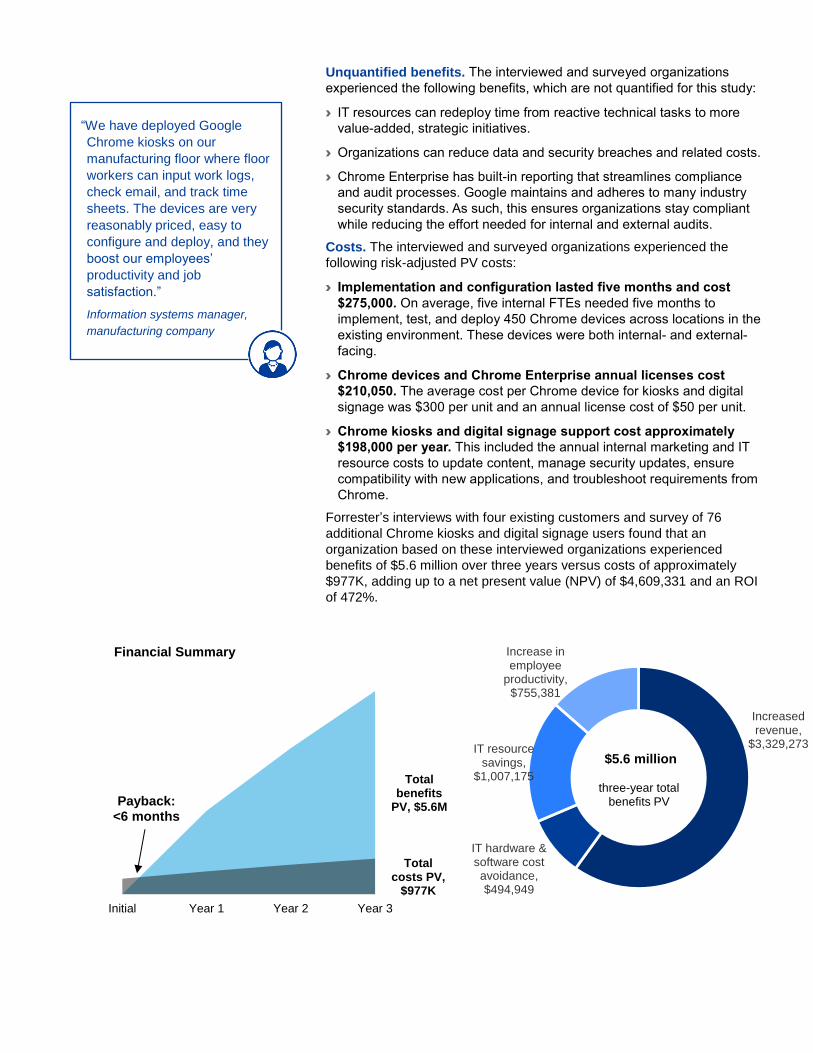
Forrester’s interviews with four existing customers and survey of 76
additional Chrome kiosks and digital signage users found that an
organization based on these interviewed organizations experienced
benefits of $5.6 million over three years versus costs of approximately
$977K, adding up to a net present value (NPV) of $4,609,331 and an ROI
of 472%.
Total benefits
PV, $5.6M
Total costs PV,
$977K
Initial Year 1 Year 2 Year 3
Financial Summary
Payback:<6 months
Increased revenue,
$3,329,273
IT hardware & software cost avoidance, $494,949
IT resource savings,
$1,007,175
Increase in employee
productivity, $755,381
three-year total benefits PV
$5.6 million
“We have deployed Google
Chrome kiosks on our
manufacturing floor where floor
workers can input work logs,
check email, and track time
sheets. The devices are very
reasonably priced, easy to
configure and deploy, and they
boost our employees’
productivity and job
satisfaction.”
Information systems manager,
manufacturing company
TEI Framework And Methodology
From the information provided in the interviews, Forrester has constructed
a Total Economic Impact™ (TEI) framework for those organizations
considering implementing Google Chrome kiosks and digital signage.
The objective of the framework is to identify the cost, benefit, flexibility, and
risk factors that affect the investment decision. Forrester took a multistep
approach to evaluate the impact that Google Chrome kiosks and digital
signage can have on an organization:
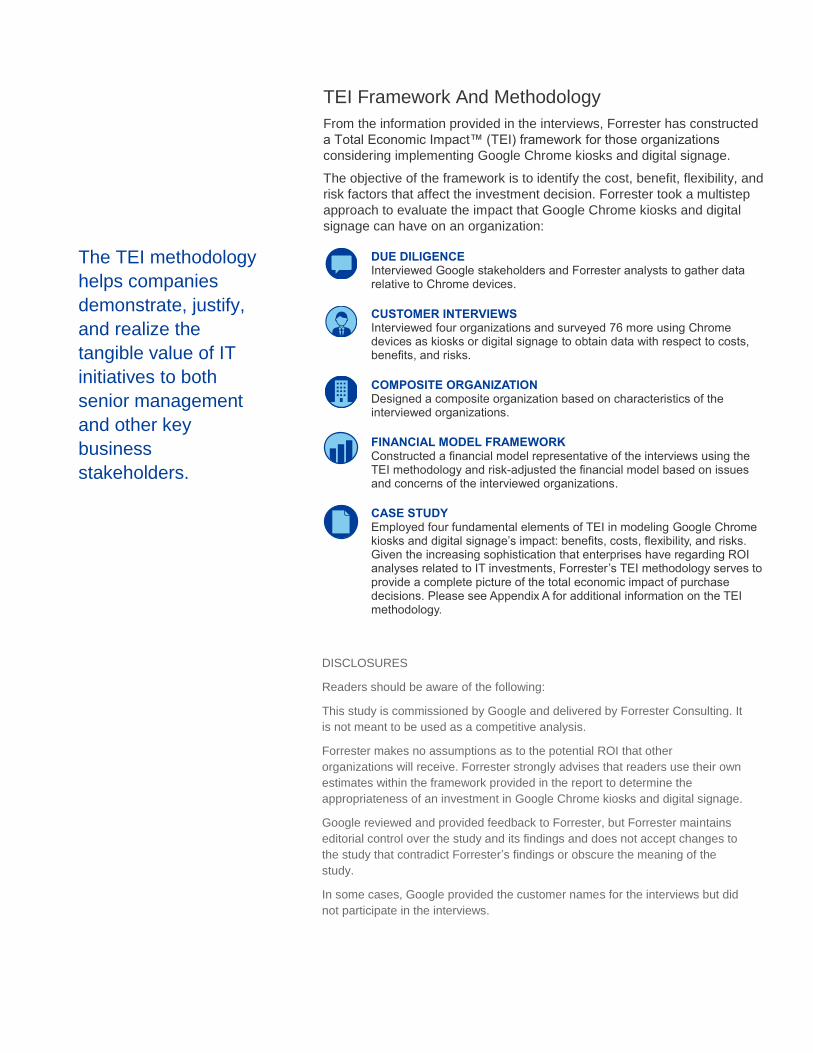
DUE DILIGENCE Interviewed Google stakeholders and Forrester analysts to gather data relative to Chrome devices.
CUSTOMER INTERVIEWS Interviewed four organizations and surveyed 76 more using Chrome devices as kiosks or digital signage to obtain data with respect to costs, benefits, and risks.
COMPOSITE ORGANIZATION Designed a composite organization based on characteristics of the interviewed organizations.
FINANCIAL MODEL FRAMEWORK Constructed a financial model representative of the interviews using the TEI methodology and risk-adjusted the financial model based on issues and concerns of the interviewed organizations.
CASE STUDY Employed four fundamental elements of TEI in modeling Google Chrome kiosks and digital signage’s impact: benefits, costs, flexibility, and risks. Given the increasing sophistication that enterprises have regarding ROI analyses related to IT investments, Forrester’s TEI methodology serves to provide a complete picture of the total economic impact of purchase decisions. Please see Appendix A for additional information on the TEI methodology.
The TEI methodology
helps companies
demonstrate, justify,
and realize the
tangible value of IT
initiatives to both
senior management
and other key
business
stakeholders.
DISCLOSURES
Readers should be aware of the following:
This study is commissioned by Google and delivered by Forrester Consulting. It
is not meant to be used as a competitive analysis.
Forrester makes no assumptions as to the potential ROI that other
organizations will receive. Forrester strongly advises that readers use their own
estimates within the framework provided in the report to determine the
appropriateness of an investment in Google Chrome kiosks and digital signage.
Google reviewed and provided feedback to Forrester, but Forrester maintains
editorial control over the study and its findings and does not accept changes to
the study that contradict Forrester’s findings or obscure the meaning of the
study.
In some cases, Google provided the customer names for the interviews but did
not participate in the interviews.
The Chrome Kiosks And Digital Signage
Customer Journey
BEFORE AND AFTER THE CHROME KIOSKS AND DIGITAL SIGNAGE
INVESTMENT
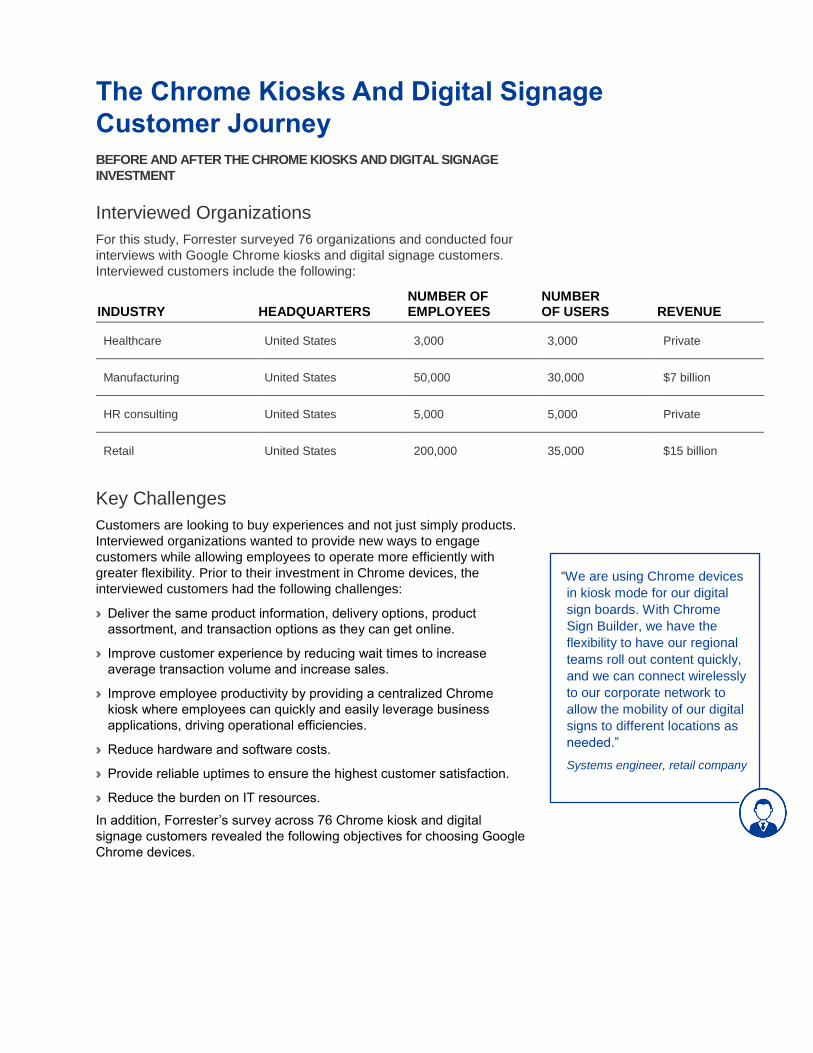
Interviewed Organizations
For this study, Forrester surveyed 76 organizations and conducted four
interviews with Google Chrome kiosks and digital signage customers.
Interviewed customers include the following:
Key Challenges
Customers are looking to buy experiences and not just simply products.
Interviewed organizations wanted to provide new ways to engage
customers while allowing employees to operate more efficiently with
greater flexibility. Prior to their investment in Chrome devices, the
interviewed customers had the following challenges:
› Deliver the same product information, delivery options, product
assortment, and transaction options as they can get online.
› Improve customer experience by reducing wait times to increase
average transaction volume and increase sales.
› Improve employee productivity by providing a centralized Chrome
kiosk where employees can quickly and easily leverage business
applications, driving operational efficiencies.
› Reduce hardware and software costs.
› Provide reliable uptimes to ensure the highest customer satisfaction.
› Reduce the burden on IT resources.
In addition, Forrester’s survey across 76 Chrome kiosk and digital
signage customers revealed the following objectives for choosing Google
Chrome devices.
INDUSTRY HEADQUARTERS NUMBER OF EMPLOYEES
NUMBER OF USERS REVENUE
Healthcare United States 3,000 3,000 Private
Manufacturing United States 50,000 30,000 $7 billion
HR consulting United States 5,000 5,000 Private
Retail United States 200,000 35,000 $15 billion
“We are using Chrome devices
in kiosk mode for our digital
sign boards. With Chrome
Sign Builder, we have the
flexibility to have our regional
teams roll out content quickly,
and we can connect wirelessly
to our corporate network to
allow the mobility of our digital
signs to different locations as
needed.”
Systems engineer, retail company
Key Results
Eighty-four percent of survey respondents stated that they received a
positive ROI from their investment. Key quantified results from the
Chrome kiosks and digital signage investment for the composite
organization include:
› Increased revenue from improved customer experience and drove
higher average transaction value and additional sales.
› Increased IT productivity time savings from deploying Chrome devices
and handling standard bug fixes and security issues.
› Improved employee productivity by providing more flexibility to roll out
content, reducing the reliance on IT to configure and deploy digital
signage.
› Reduced device hardware and software license costs.
In addition, Forrester’s survey across 76 Chrome customers found
several key benefits from their Chrome kiosk and digital signage
investment.
“Our doctors and nurses do not
need to unnecessarily carry
large hardware devices from
room to room. They can now
just log in with their credentials
on our Google Chrome kiosks
and quickly access and enter
in patient data.”
Desktop architect, healthcare
company
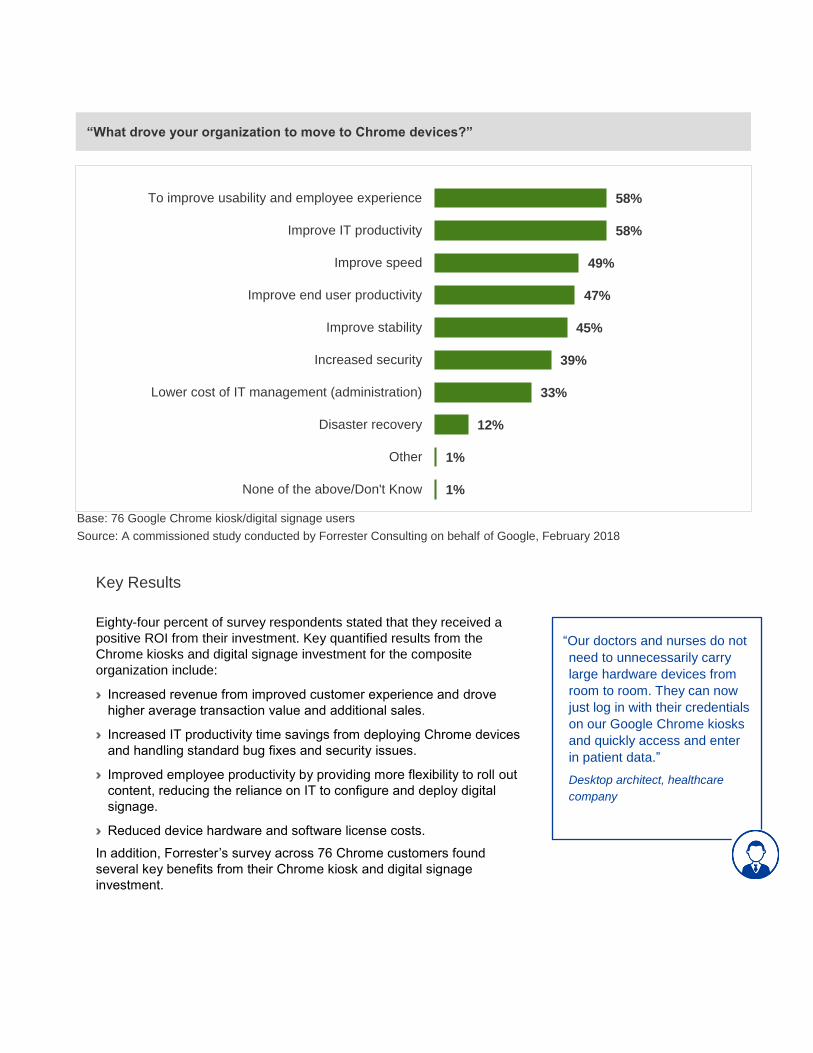
58%
58%
49%
47%
45%
39%
33%
12%
1%
1%
To improve usability and employee experience
Improve IT productivity
Improve speed
Improve end user productivity
Improve stability
Increased security
Lower cost of IT management (administration)
Disaster recovery
Other
None of the above/Don't Know
“What drove your organization to move to Chrome devices?”
Base: 76 Google Chrome kiosk/digital signage users Source: A commissioned study conducted by Forrester Consulting on behalf of Google, February 2018
Composite Organization
Based on the interviews, Forrester constructed a TEI framework, a
composite company, and an associated ROI analysis that illustrates the
areas financially affected. The composite organization is representative
of the four companies that Forrester interviewed and is used to present
the aggregate financial analysis in the next section. The composite
organization that Forrester synthesized from the customer interviews has
the following characteristics:
Description of composite. The composite organization is a global
business with sales through both online and retail stores. The
organization has 50,000 total employees and has deployed 450 Chrome
kiosks and digital signage across 75 locations.
The composite organization generates approximately $7 million in
annual revenue and has deployed 300 customer-facing Chrome devices
and 150 internal employee use devices. The composite organization
deployed Chrome devices to improve customer experience and reduce
hardware, software, and IT resource costs.
Deployment characteristics. The composite organization’s customers
and employees can leverage Chrome devices as a simple platform
across various use cases from accessing product information,
conducting transactions, checking inventory, and doing other back-end
functions at scale. These devices are secured, can easily be deployed
without a heavy burden on IT teams, and are connected the corporate
network.
Key assumptions
450 Chrome devices
deployed as kiosks and
digital signage
300 external customer-
facing devices
150 internal employee-
facing devices
$7 million in annual
revenue per retail location
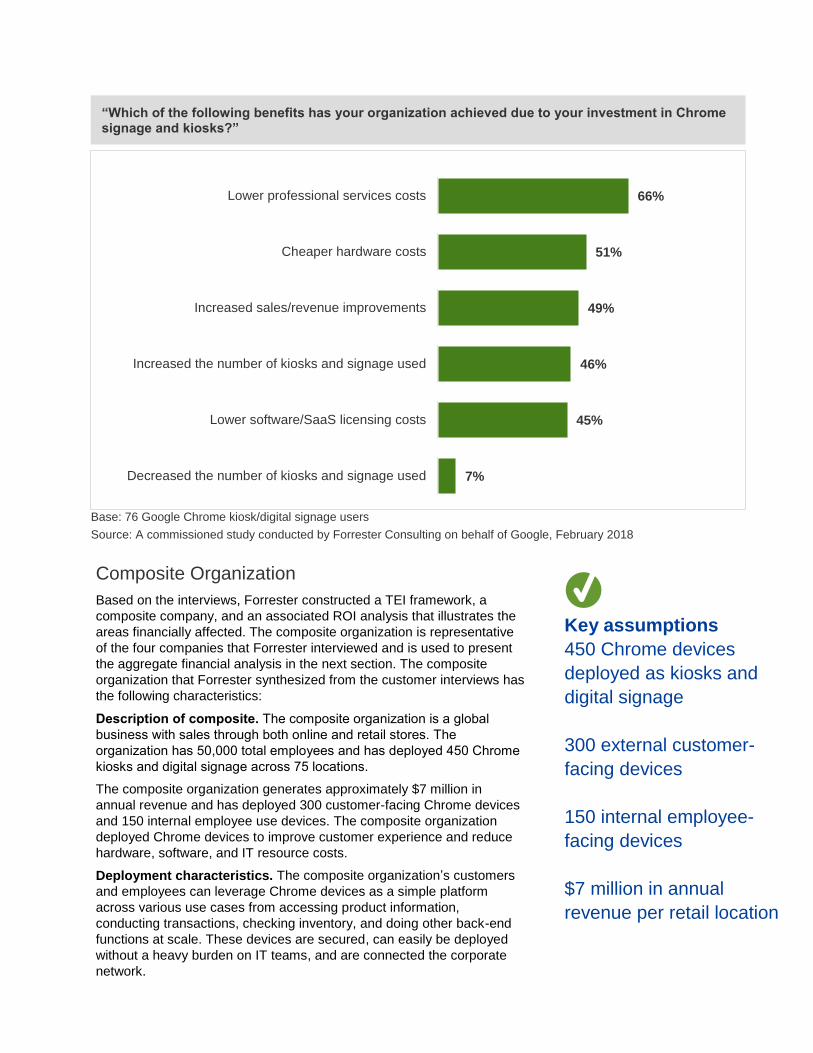
66%
51%
49%
46%
45%
7%
Lower professional services costs
Cheaper hardware costs
Increased sales/revenue improvements
Increased the number of kiosks and signage used
Lower software/SaaS licensing costs
Decreased the number of kiosks and signage used
“Which of the following benefits has your organization achieved due to your investment in Chrome signage and kiosks?”
Base: 76 Google Chrome kiosk/digital signage users Source: A commissioned study conducted by Forrester Consulting on behalf of Google, February 2018
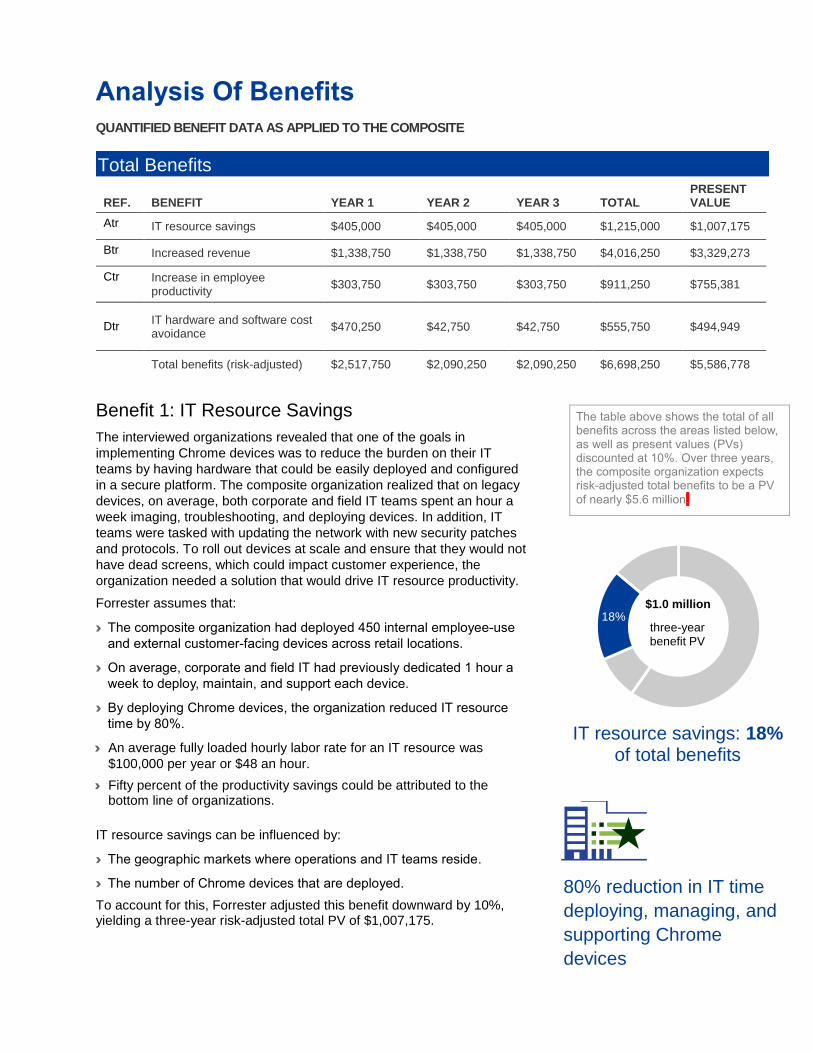
The table above shows the total of all benefits across the areas listed below, as well as present values (PVs) discounted at 10%. Over three years, the composite organization expects risk-adjusted total benefits to be a PV
of nearly $5.6 million.
IT resource savings: 18%
of total benefits
18%three-year benefit PV
$1.0 million
Analysis Of Benefits
QUANTIFIED BENEFIT DATA AS APPLIED TO THE COMPOSITE
Benefit 1: IT Resource Savings
The interviewed organizations revealed that one of the goals in
implementing Chrome devices was to reduce the burden on their IT
teams by having hardware that could be easily deployed and configured
in a secure platform. The composite organization realized that on legacy
devices, on average, both corporate and field IT teams spent an hour a
week imaging, troubleshooting, and deploying devices. In addition, IT
teams were tasked with updating the network with new security patches
and protocols. To roll out devices at scale and ensure that they would not
have dead screens, which could impact customer experience, the
organization needed a solution that would drive IT resource productivity.
Forrester assumes that:
› The composite organization had deployed 450 internal employee-use
and external customer-facing devices across retail locations.
› On average, corporate and field IT had previously dedicated 1 hour a
week to deploy, maintain, and support each device.
› By deploying Chrome devices, the organization reduced IT resource
time by 80%.
› An average fully loaded hourly labor rate for an IT resource was
$100,000 per year or $48 an hour.
› Fifty percent of the productivity savings could be attributed to the bottom line of organizations.
IT resource savings can be influenced by:
› The geographic markets where operations and IT teams reside.
› The number of Chrome devices that are deployed.
To account for this, Forrester adjusted this benefit downward by 10%, yielding a three-year risk-adjusted total PV of $1,007,175.
80% reduction in IT time
deploying, managing, and
supporting Chrome
devices
Total Benefits
REF. BENEFIT YEAR 1 YEAR 2 YEAR 3 TOTAL PRESENT VALUE
Atr IT resource savings $405,000 $405,000 $405,000 $1,215,000 $1,007,175
Btr Increased revenue $1,338,750 $1,338,750 $1,338,750 $4,016,250 $3,329,273
Ctr Increase in employee productivity
$303,750 $303,750 $303,750 $911,250 $755,381
Dtr
IT hardware and software cost avoidance
$470,250 $42,750 $42,750 $555,750 $494,949
Total benefits (risk-adjusted) $2,517,750 $2,090,250 $2,090,250 $6,698,250 $5,586,778
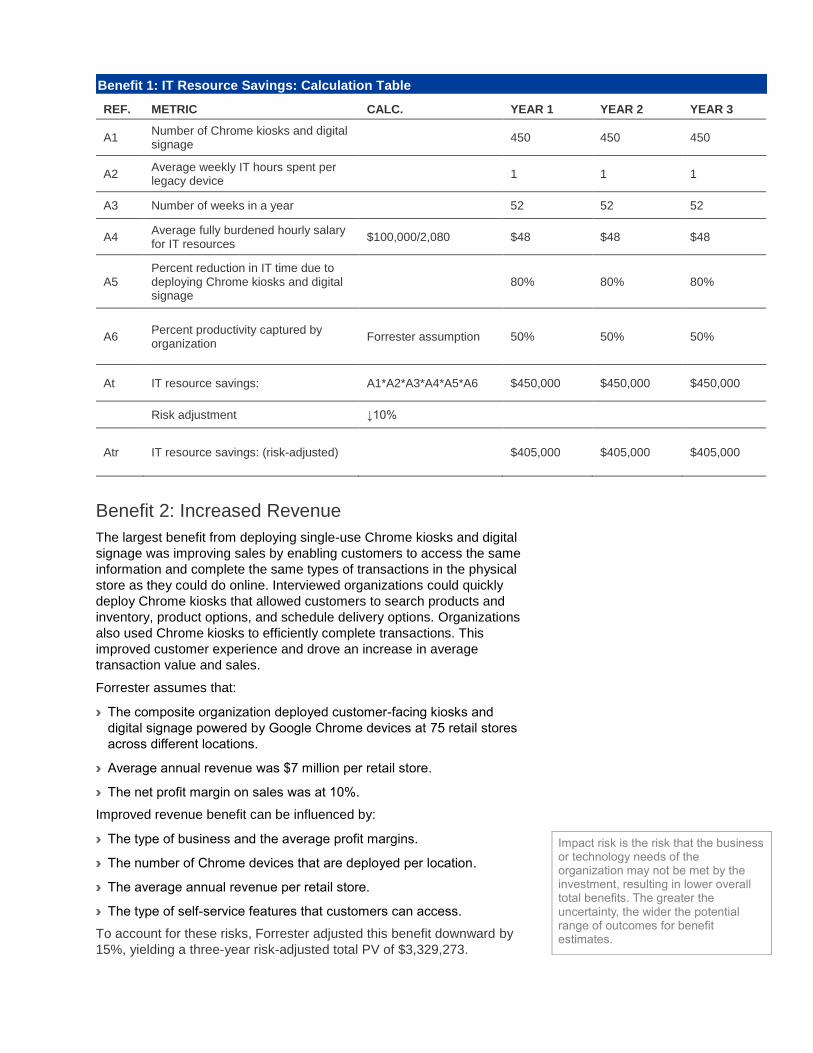
Impact risk is the risk that the business or technology needs of the organization may not be met by the investment, resulting in lower overall total benefits. The greater the uncertainty, the wider the potential range of outcomes for benefit estimates.
Benefit 2: Increased Revenue
The largest benefit from deploying single-use Chrome kiosks and digital
signage was improving sales by enabling customers to access the same
information and complete the same types of transactions in the physical
store as they could do online. Interviewed organizations could quickly
deploy Chrome kiosks that allowed customers to search products and
inventory, product options, and schedule delivery options. Organizations
also used Chrome kiosks to efficiently complete transactions. This
improved customer experience and drove an increase in average
transaction value and sales.
Forrester assumes that:
› The composite organization deployed customer-facing kiosks and
digital signage powered by Google Chrome devices at 75 retail stores
across different locations.
› Average annual revenue was $7 million per retail store.
› The net profit margin on sales was at 10%.
Improved revenue benefit can be influenced by:
› The type of business and the average profit margins.
› The number of Chrome devices that are deployed per location.
› The average annual revenue per retail store.
› The type of self-service features that customers can access.
To account for these risks, Forrester adjusted this benefit downward by
15%, yielding a three-year risk-adjusted total PV of $3,329,273.
Benefit 1: IT Resource Savings: Calculation Table
REF. METRIC CALC. YEAR 1 YEAR 2 YEAR 3
A1 Number of Chrome kiosks and digital signage
450 450 450
A2 Average weekly IT hours spent per legacy device
1 1 1
A3 Number of weeks in a year 52 52 52
A4 Average fully burdened hourly salary for IT resources
$100,000/2,080 $48 $48 $48
A5 Percent reduction in IT time due to deploying Chrome kiosks and digital signage
80% 80% 80%
A6 Percent productivity captured by organization
Forrester assumption 50% 50% 50%
At IT resource savings: A1*A2*A3*A4*A5*A6 $450,000 $450,000 $450,000
Risk adjustment ↓10%
Atr IT resource savings: (risk-adjusted) $405,000 $405,000 $405,000
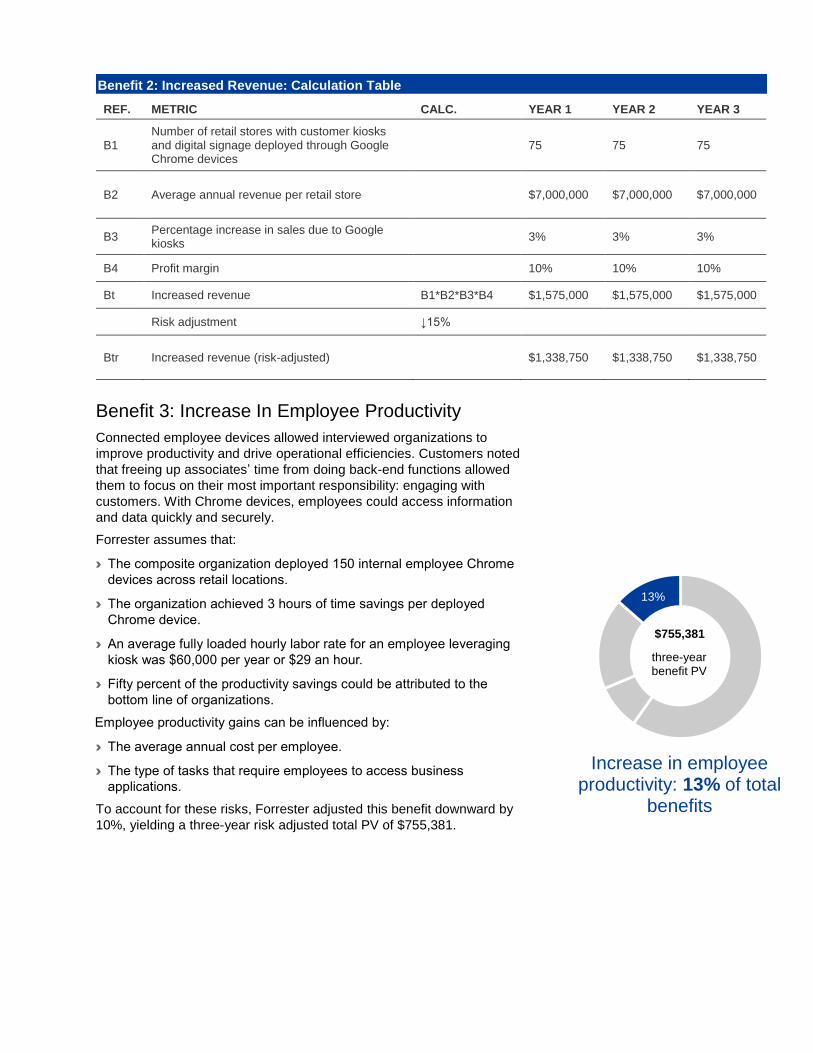
Increase in employee
productivity: 13% of total benefits
13%
three-year benefit PV
$755,381
Benefit 3: Increase In Employee Productivity
Connected employee devices allowed interviewed organizations to
improve productivity and drive operational efficiencies. Customers noted
that freeing up associates’ time from doing back-end functions allowed
them to focus on their most important responsibility: engaging with
customers. With Chrome devices, employees could access information
and data quickly and securely.
Forrester assumes that:
› The composite organization deployed 150 internal employee Chrome
devices across retail locations.
› The organization achieved 3 hours of time savings per deployed
Chrome device.
› An average fully loaded hourly labor rate for an employee leveraging
kiosk was $60,000 per year or $29 an hour.
› Fifty percent of the productivity savings could be attributed to the
bottom line of organizations.
Employee productivity gains can be influenced by:
› The average annual cost per employee.
› The type of tasks that require employees to access business
applications.
To account for these risks, Forrester adjusted this benefit downward by
10%, yielding a three-year risk adjusted total PV of $755,381.
Benefit 2: Increased Revenue: Calculation Table
REF. METRIC CALC. YEAR 1 YEAR 2 YEAR 3
B1 Number of retail stores with customer kiosks and digital signage deployed through Google Chrome devices
75 75 75
B2 Average annual revenue per retail store $7,000,000 $7,000,000 $7,000,000
B3 Percentage increase in sales due to Google kiosks
3% 3% 3%
B4 Profit margin 10% 10% 10%
Bt Increased revenue B1*B2*B3*B4 $1,575,000 $1,575,000 $1,575,000
Risk adjustment ↓15%
Btr Increased revenue (risk-adjusted) $1,338,750 $1,338,750 $1,338,750
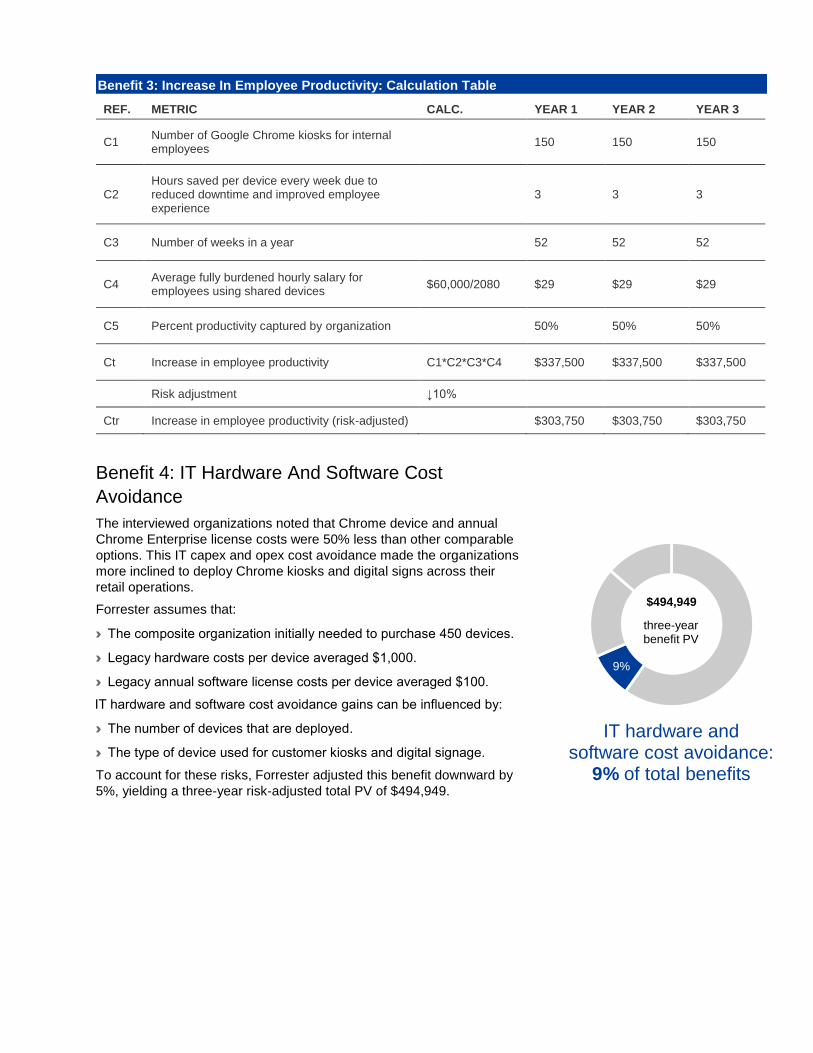
IT hardware and
software cost avoidance: 9% of total benefits
9%
three-year benefit PV
$494,949
Benefit 4: IT Hardware And Software Cost
Avoidance
The interviewed organizations noted that Chrome device and annual
Chrome Enterprise license costs were 50% less than other comparable
options. This IT capex and opex cost avoidance made the organizations
more inclined to deploy Chrome kiosks and digital signs across their
retail operations.
Forrester assumes that:
› The composite organization initially needed to purchase 450 devices.
› Legacy hardware costs per device averaged $1,000.
› Legacy annual software license costs per device averaged $100.
IT hardware and software cost avoidance gains can be influenced by:
› The number of devices that are deployed.
› The type of device used for customer kiosks and digital signage.
To account for these risks, Forrester adjusted this benefit downward by
5%, yielding a three-year risk-adjusted total PV of $494,949.
Benefit 3: Increase In Employee Productivity: Calculation Table
REF. METRIC CALC. YEAR 1 YEAR 2 YEAR 3
C1 Number of Google Chrome kiosks for internal employees
150 150 150
C2 Hours saved per device every week due to reduced downtime and improved employee experience
3 3 3
C3 Number of weeks in a year 52 52 52
C4 Average fully burdened hourly salary for employees using shared devices
$60,000/2080 $29 $29 $29
C5 Percent productivity captured by organization 50% 50% 50%
Ct Increase in employee productivity C1*C2*C3*C4 $337,500 $337,500 $337,500
Risk adjustment ↓10%
Ctr Increase in employee productivity (risk-adjusted) $303,750 $303,750 $303,750
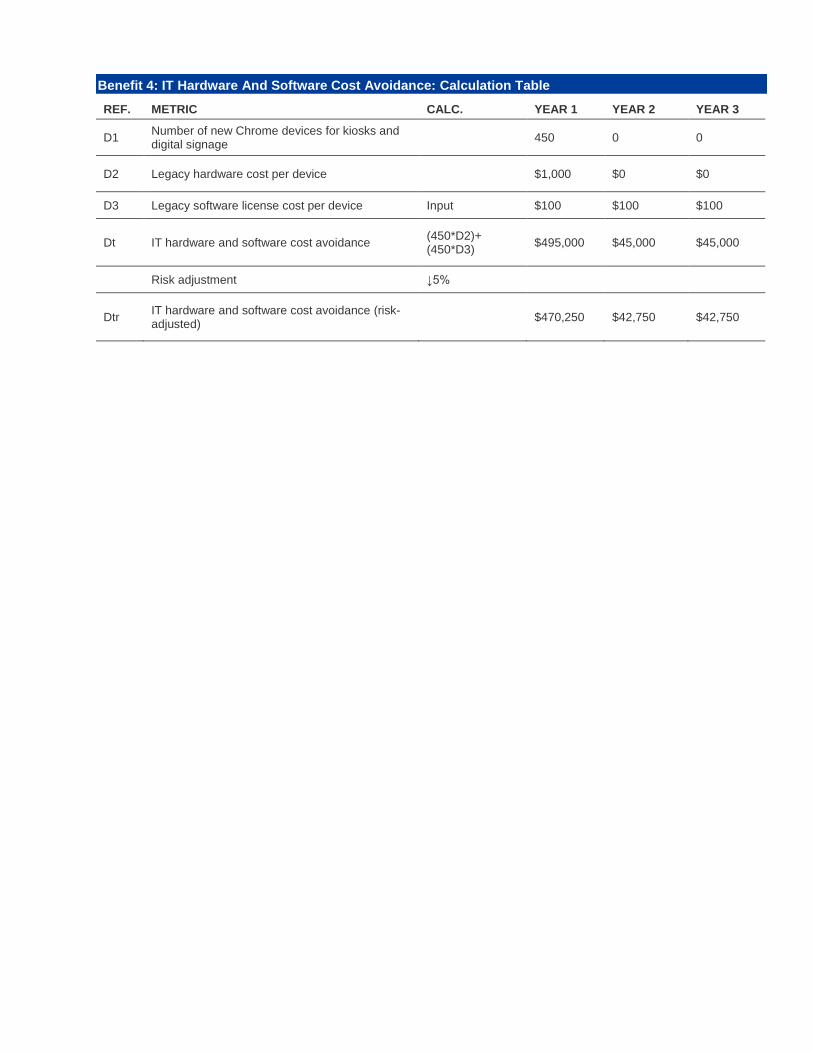
Benefit 4: IT Hardware And Software Cost Avoidance: Calculation Table
REF. METRIC CALC. YEAR 1 YEAR 2 YEAR 3
D1 Number of new Chrome devices for kiosks and digital signage
450 0 0
D2 Legacy hardware cost per device $1,000 $0 $0
D3 Legacy software license cost per device Input $100 $100 $100
Dt IT hardware and software cost avoidance (450*D2)+ (450*D3)
$495,000 $45,000 $45,000
Risk adjustment ↓5%
Dtr IT hardware and software cost avoidance (risk-adjusted)
$470,250 $42,750 $42,750
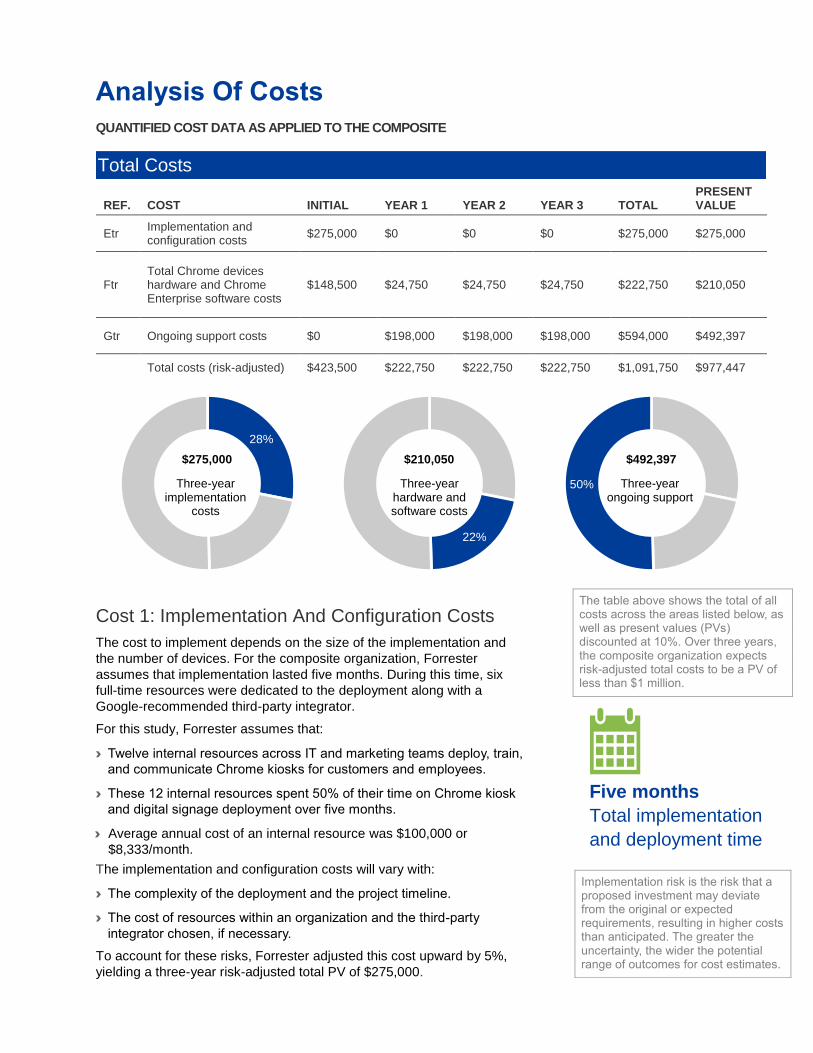
The table above shows the total of all costs across the areas listed below, as well as present values (PVs) discounted at 10%. Over three years, the composite organization expects risk-adjusted total costs to be a PV of less than $1 million.
Implementation risk is the risk that a proposed investment may deviate from the original or expected requirements, resulting in higher costs than anticipated. The greater the uncertainty, the wider the potential range of outcomes for cost estimates.
Analysis Of Costs
QUANTIFIED COST DATA AS APPLIED TO THE COMPOSITE
Cost 1: Implementation And Configuration Costs
The cost to implement depends on the size of the implementation and
the number of devices. For the composite organization, Forrester
assumes that implementation lasted five months. During this time, six
full-time resources were dedicated to the deployment along with a
Google-recommended third-party integrator.
For this study, Forrester assumes that:
› Twelve internal resources across IT and marketing teams deploy, train,
and communicate Chrome kiosks for customers and employees.
› These 12 internal resources spent 50% of their time on Chrome kiosk
and digital signage deployment over five months.
› Average annual cost of an internal resource was $100,000 or
$8,333/month.
The implementation and configuration costs will vary with:
› The complexity of the deployment and the project timeline.
› The cost of resources within an organization and the third-party
integrator chosen, if necessary.
To account for these risks, Forrester adjusted this cost upward by 5%,
yielding a three-year risk-adjusted total PV of $275,000.
Total Costs
REF. COST INITIAL YEAR 1 YEAR 2 YEAR 3 TOTAL PRESENT VALUE
Etr Implementation and configuration costs
$275,000 $0 $0 $0 $275,000 $275,000
Ftr Total Chrome devices hardware and Chrome Enterprise software costs
$148,500 $24,750 $24,750 $24,750 $222,750 $210,050
Gtr Ongoing support costs $0 $198,000 $198,000 $198,000 $594,000 $492,397
Total costs (risk-adjusted) $423,500 $222,750 $222,750 $222,750 $1,091,750 $977,447
28%
Three-year implementation
costs
$275,000
22%
Three-year hardware and software costs
$210,050
50% Three-year ongoing support
$492,397
Five months
Total implementation
and deployment time
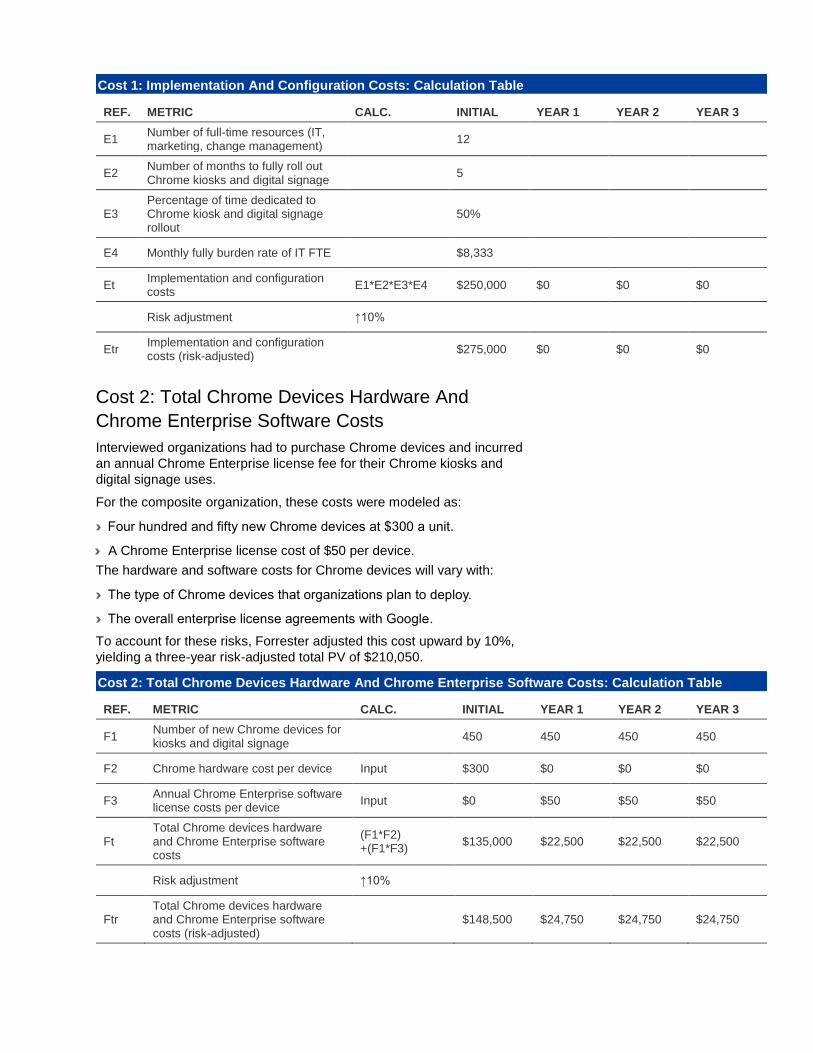
Cost 2: Total Chrome Devices Hardware And
Chrome Enterprise Software Costs
Interviewed organizations had to purchase Chrome devices and incurred
an annual Chrome Enterprise license fee for their Chrome kiosks and
digital signage uses.
For the composite organization, these costs were modeled as:
› Four hundred and fifty new Chrome devices at $300 a unit.
› A Chrome Enterprise license cost of $50 per device.
The hardware and software costs for Chrome devices will vary with:
› The type of Chrome devices that organizations plan to deploy.
› The overall enterprise license agreements with Google.
To account for these risks, Forrester adjusted this cost upward by 10%,
yielding a three-year risk-adjusted total PV of $210,050.
Cost 1: Implementation And Configuration Costs: Calculation Table
REF. METRIC CALC. INITIAL YEAR 1 YEAR 2 YEAR 3
E1 Number of full-time resources (IT, marketing, change management)
12
E2 Number of months to fully roll out Chrome kiosks and digital signage
5
E3 Percentage of time dedicated to Chrome kiosk and digital signage rollout
50%
E4 Monthly fully burden rate of IT FTE $8,333
Et Implementation and configuration costs
E1*E2*E3*E4 $250,000 $0 $0 $0
Risk adjustment ↑10%
Etr Implementation and configuration costs (risk-adjusted)
$275,000 $0 $0 $0
Cost 2: Total Chrome Devices Hardware And Chrome Enterprise Software Costs: Calculation Table
REF. METRIC CALC. INITIAL YEAR 1 YEAR 2 YEAR 3
F1 Number of new Chrome devices for kiosks and digital signage
450 450 450 450
F2 Chrome hardware cost per device Input $300 $0 $0 $0
F3 Annual Chrome Enterprise software license costs per device
Input $0 $50 $50 $50
Ft Total Chrome devices hardware and Chrome Enterprise software costs
(F1*F2) +(F1*F3)
$135,000 $22,500 $22,500 $22,500
Risk adjustment ↑10%
Ftr Total Chrome devices hardware and Chrome Enterprise software costs (risk-adjusted)
$148,500 $24,750 $24,750 $24,750
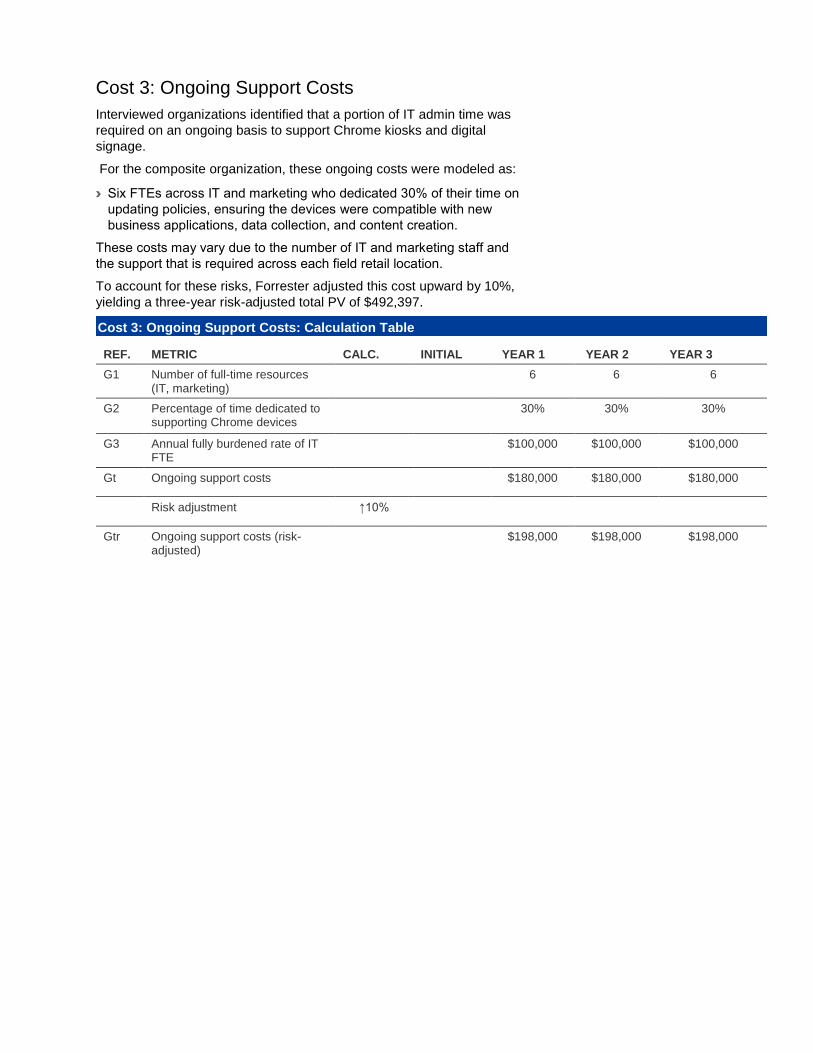
Cost 3: Ongoing Support Costs
Interviewed organizations identified that a portion of IT admin time was
required on an ongoing basis to support Chrome kiosks and digital
signage.
For the composite organization, these ongoing costs were modeled as:
› Six FTEs across IT and marketing who dedicated 30% of their time on
updating policies, ensuring the devices were compatible with new
business applications, data collection, and content creation.
These costs may vary due to the number of IT and marketing staff and
the support that is required across each field retail location.
To account for these risks, Forrester adjusted this cost upward by 10%,
yielding a three-year risk-adjusted total PV of $492,397.
Cost 3: Ongoing Support Costs: Calculation Table
REF. METRIC CALC. INITIAL YEAR 1 YEAR 2 YEAR 3
G1 Number of full-time resources (IT, marketing)
6 6 6
G2 Percentage of time dedicated to supporting Chrome devices
30% 30% 30%
G3 Annual fully burdened rate of IT FTE
$100,000 $100,000 $100,000
Gt Ongoing support costs $180,000 $180,000 $180,000
Risk adjustment ↑10%
Gtr Ongoing support costs (risk-adjusted)
$198,000 $198,000 $198,000
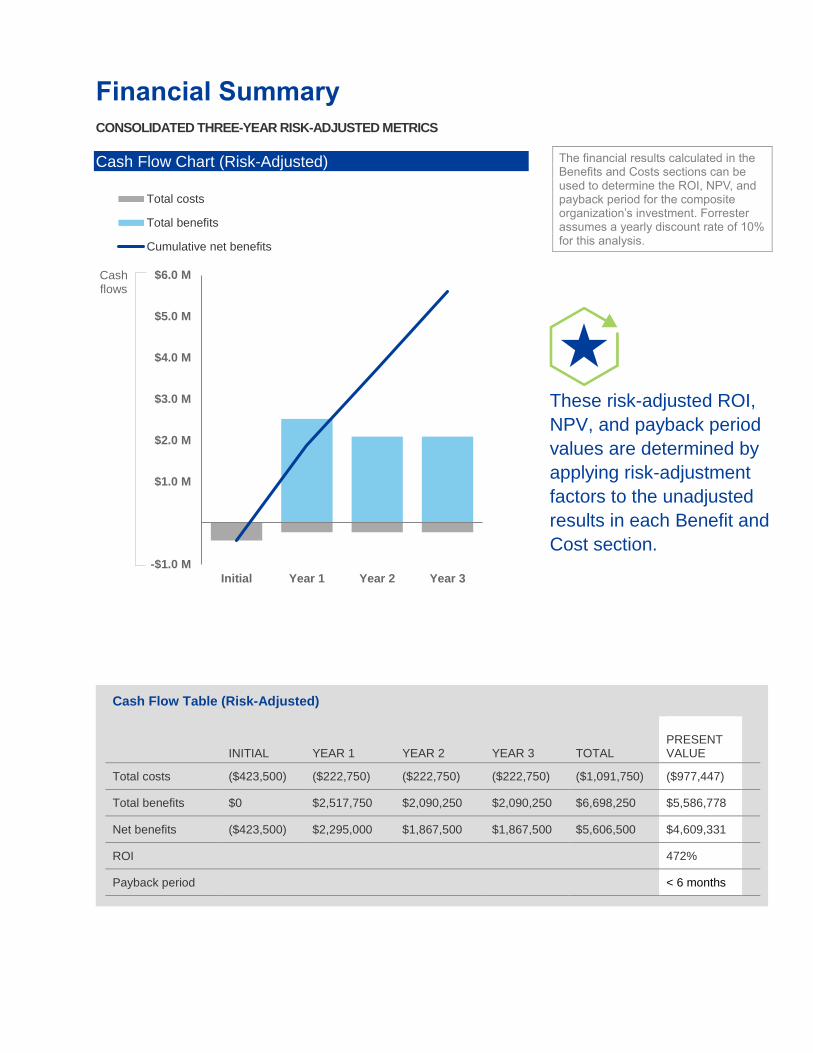
The financial results calculated in the Benefits and Costs sections can be used to determine the ROI, NPV, and payback period for the composite organization’s investment. Forrester assumes a yearly discount rate of 10% for this analysis.
Financial Summary
CONSOLIDATED THREE-YEAR RISK-ADJUSTED METRICS
Cash Flow Chart (Risk-Adjusted)
-$1.0 M
$1.0 M
$2.0 M
$3.0 M
$4.0 M
$5.0 M
$6.0 M
Initial Year 1 Year 2 Year 3
Cashflows
Total costs
Total benefits
Cumulative net benefits
These risk-adjusted ROI,
NPV, and payback period
values are determined by
applying risk-adjustment
factors to the unadjusted
results in each Benefit and
Cost section.
Cash Flow Table (Risk-Adjusted)
INITIAL YEAR 1 YEAR 2 YEAR 3 TOTAL PRESENT VALUE
Total costs ($423,500) ($222,750) ($222,750) ($222,750) ($1,091,750) ($977,447)
Total benefits $0 $2,517,750 $2,090,250 $2,090,250 $6,698,250 $5,586,778
Net benefits ($423,500) $2,295,000 $1,867,500 $1,867,500 $5,606,500 $4,609,331
ROI 472%
Payback period < 6 months
Chrome Kiosks and Digital Signage: Overview
The following information is provided by Google. Forrester has not validated any claims and does not endorse
Google or its offerings.
CHROME ENTERPRISE
Chrome Enterprise includes Google's managed Chrome OS offering for enterprise customers. Chrome OS is a cloud-native operating system running on a variety of form factors including Chromebooks, Chromeboxes, and Chromebases. It features built-in security, and provides regular, automatic updates that run in the background to keep devices up-to-date. It boots quickly and provides a continuous experience across devices, and enables user access to enterprise applications via the web, managed Google Play store, or third-party virtualization providers. Chrome OS can be paired with the Chrome Enterprise license which can be purchased for an annual, per device fee to manage Chrome devices in addition to enabling third party integrations with EMM and identity providers. For more information, visit chrome.com/os
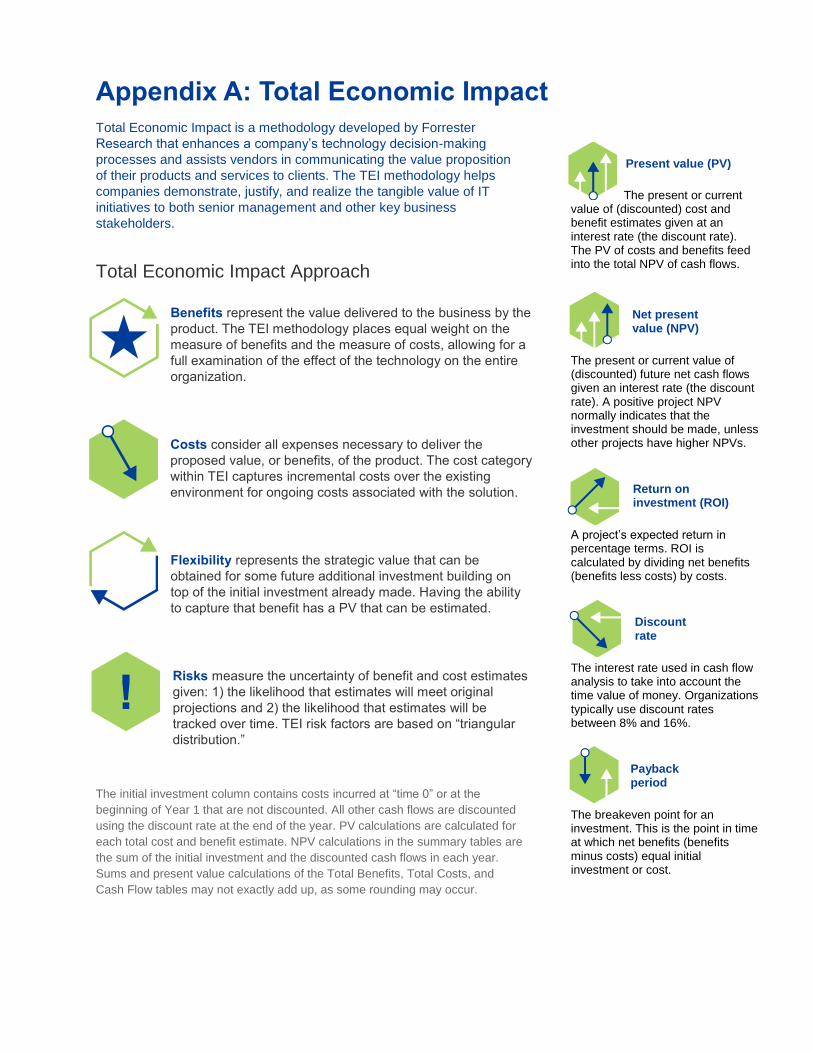
Appendix A: Total Economic Impact
Total Economic Impact is a methodology developed by Forrester
Research that enhances a company’s technology decision-making
processes and assists vendors in communicating the value proposition
of their products and services to clients. The TEI methodology helps
companies demonstrate, justify, and realize the tangible value of IT
initiatives to both senior management and other key business
stakeholders.
Total Economic Impact Approach
Benefits represent the value delivered to the business by the
product. The TEI methodology places equal weight on the
measure of benefits and the measure of costs, allowing for a
full examination of the effect of the technology on the entire
organization.
Costs consider all expenses necessary to deliver the
proposed value, or benefits, of the product. The cost category
within TEI captures incremental costs over the existing
environment for ongoing costs associated with the solution.
Flexibility represents the strategic value that can be
obtained for some future additional investment building on
top of the initial investment already made. Having the ability
to capture that benefit has a PV that can be estimated.
Risks measure the uncertainty of benefit and cost estimates
given: 1) the likelihood that estimates will meet original
projections and 2) the likelihood that estimates will be
tracked over time. TEI risk factors are based on “triangular
distribution.”
The initial investment column contains costs incurred at “time 0” or at the
beginning of Year 1 that are not discounted. All other cash flows are discounted
using the discount rate at the end of the year. PV calculations are calculated for
each total cost and benefit estimate. NPV calculations in the summary tables are
the sum of the initial investment and the discounted cash flows in each year.
Sums and present value calculations of the Total Benefits, Total Costs, and
Cash Flow tables may not exactly add up, as some rounding may occur.
Present value (PV)
The present or current value of (discounted) cost and benefit estimates given at an interest rate (the discount rate). The PV of costs and benefits feed into the total NPV of cash flows.
Net present value (NPV)
The present or current value of (discounted) future net cash flows given an interest rate (the discount rate). A positive project NPV normally indicates that the investment should be made, unless other projects have higher NPVs.
Return on investment (ROI)
A project’s expected return in percentage terms. ROI is calculated by dividing net benefits (benefits less costs) by costs.
Discount rate
The interest rate used in cash flow analysis to take into account the time value of money. Organizations typically use discount rates between 8% and 16%.
Payback period
The breakeven point for an investment. This is the point in time at which net benefits (benefits minus costs) equal initial investment or cost.

Appendix B: Endnotes
1 “Drive Revenue, Please Customers By Connecting Customer Journeys,” Forrester Research, Inc., April 19, 2017.