Psychophysics علی یونسی What is psychophysics Methods Applications.

DIGITAL PICTURE PROCESSING AND PSYCHOPHYSICS:
A STUDY OF BRIGHTNESS PERCEPTION
by
Patrick Colas-Baudelaire
March 1973 UTEC-CSc-74-025
This research was supported by the Advanced Research Projects
Agency of the Department of Defense, under contracts F30602-70-C-0300,
monitored by Rome Air Development Center, G r iffiss Air Force Base, New
York 13440, and DAHC15-7 3-C-0363.

TABLE OF CONTENTS
ABSTRACT ...................................................................................................................... v i i i
INTRODUCTION .............................................................................................................. 1
Psychophysics in Computer Science ...................................................... 2
Computer Science in Psychophysics ...................................................... 4
Contributions of the Present Research ............................................. 6
CHAPTER I : MACH BANDS AND OTHER BRIGHTNESS CONTRAST PHENOMENA . . 9
Mach Bands ........................................................................................................ 10
Simultaneous Brightness Contrast ........................................................ 12
Hermann Grid ................................................................................................... 12
Inhibitory Mechanisms ................................................................................ 16
CHAPTER I I : PSYCHOPHYSIOLOGICAL AND THEORETICAL BASIS FOR A
HOMOMORPHIC MODEL OF NEURAL INTERACTION ........................ 17
Basis for a Linear Model of Neural Interaction .......................... 19
Non-Linearity o f the Visual System .................................................... 24
The Homomorphic Model of Brightness perception .......................... 29
CHAPTER I I I : PARAMETERS OF THE LINEAR-HOMOMORPHIC MODEL ............... 35
Optical and Neural Factors ..................................................................... 36
Contrast Threshold Measurements .......................................................... 38
Transfer Function of the Visual Optics ........................................... 41
Estimating the Transfer Function of the Neural Network ......... 44
Results o f the Psychophysical Measurements ................................... 53
CHAPTER IV : THE LINEARITY OF NEURAL INTERACTION ................................. 56
Extrapolation of the Transfer Functions ......................................... 56
Brightness Contrast Effects with Smooth Patterns ...................... 59
Patterns with Edges .................................................................................... 77
CHAPTER V; EDGE EFFECTS .................................................................................... 88
The Perception of Intensity Steps ...................................................... 88
Possible Local Edge-Oriented Mechanism ........................................... 92
Effect o f Contours on Brightness Perception ................................. 99
peripheral and/or Central Mechanisms ............................................... 100
Effect of Stimulus Border ....................................................................... 107
Page
LIST OF FIGURES ............................................................................................................. iv
i i
Theories of Color V ision ..............................................
Three Independent Inhibitory Receptors Networks
Color Effects on Smooth Patterns ............................
CHAPTER V I I : CONCLUSIONS ......................................................
On the Side of Psychophysics .....................................
On the Side of D ig ital Picture Processing...........
ACKNOWLEDGMENTS ............................................................................
REFERENCES.........................................................................................
APPENDIX A: DESCRIPTION OF THE EXPERIMENT....................
APPENDIX B: THE MATHEMATICS OF TWO-DIMENSIONAL
LINEAR SYSTEMS ..................................................
APPENDIX C: THE COMPUTER SYSTEM .......................................
CHAPTER V I : COLOR CONTRAST .....................................................

L IS T OP FIGUEES
1
2
3
4
5
6
7
8
9
10
Figure
11
12
Mach. band patterns.
Simultaneous brightness contrast.
Simultaneous brightness contrast. *
Hermann grid contrast effect .
Neural structure of the primate retina .
Block diagram of the linear-homomorphic model of
brightness perception.
Sinusoidal pattern showing threshold contrast in function
of spatial frequency.
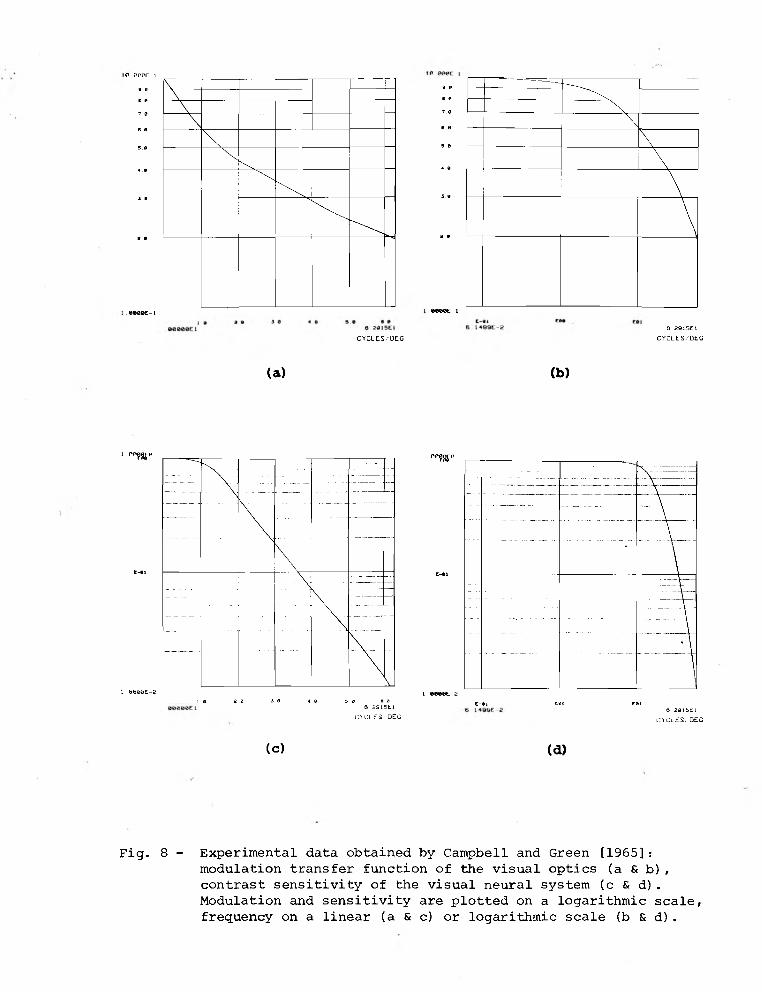
Experimental data obtained by Cambell and Green [1965]:
modulation transfer function of the visual optics (a & b)
contrast sensitivity o f the visual neural system (c & c ) .
Sinusoidal test pattern corresponding to the density
functions:
(a) kj s in (2 tt f x) + kj s in (6 tt f x) ,
(b) kj s in (2 tt f x) + 0 .1 kj s in (6 tt f x) .
(a) Sinusoidal test pattern corresponding to the
function:
kj s in (2 ir f x) + 0 .5 kj s in (6 ir f x) .
(b) Experimental data for frequency modulation by
neural interaction.
(c) Three transfer functions having the same property.
Same test pattern as P ig . 9 , for a background frequency
of approximately 0 .1 2 3 cycles/degree: original (a)
and compensated ( b ) .
Same test pattern as F ig . 9 and 10 , for a background
frequency f of about 1 .2 3 cycles/degree: original
(a) and compensated ( b ) .
11
13
£4
15
21
33
33
42
47
48
Page
49
•50
iv

Modulation transfer function and corresponding
line-spread function for neural interaction
(sub-system N on F ig . 6 ) j
(a & b) Ignoring high frequency attenuation
by neural blur;
(c & d) Using data of Fig . 8d, for high frequency
attenuation by neural blur .
Stimulus density (left) and corresponding predicted
subjective brightness (r ig h t ) :
(a) sin(2iT f x) + s in (6 it f x ) ; .
(b) s in (2 it f x) + 0 . 8 s in (10 it f x) .
Test pattern corresponding to the density function of
F ig . 14c, for a background frequency f of about .37
cycles/degree: original (a) and compensated ( b ) .
Test pattern corresponding to the density function
of F ig . 14c, for a background frequency f o f about
0 .1 2 cycles/degree: original (a) and compensated ( b ) .
Stimulus density (left) and corresponding predicted
subjective brightness (r ig h t ) :
(a) s in (2 it f x) • (1 - cos (4 ir f x ) ) ;
(c) s in (2 ir f x) • (1 - cos (8 ir f x ) ) .
Test pattern corresponding to the density function of
Fig . 17a , for a background frequency f of about 0 .25
cycles/degree: original (a) and compensated ( b ) .
Test pattern corresponding to the density function of
F ig . 17c, for a background frequency f of about 0 .2 5
cycles/degree: original (a) and compensated ( b ) .
Separable frequency spectra of the separable functions:

21
22
23
24
25
26
27
28
29
30
Figure
Plot on an arbitrary scale of : 71
(a) Separable stimulus density:
(1 + cos (2 it f x) ) • (,1 + cos (2 it f y ) ) ;
(b) Predicted subjective brightness (notice brightness contrast effect at the intersections of the grid);
(c) Compensated stimulus density.
Test pattern corresponding to the separable density 72
function of F ig . 21 : original (a ) , compensated (b)
and over-compensated ( c ) .
Test pattern corresponding to the separable density 75
functions:
(1 + cos (2 it f x ) ) • (1 + cos (2 it 2/2 f y ) ) .
Original ( a ) , compensated (b) and over-compensated ( c ) .
Scheme for brightness contrast compensation, according 79
to the homomorphic model for neural interaction (Fig . 6 ) :
complete model ( a ) ; sim plified model ( b ) , ignoring
optical and neural blur.
(a) Test pattern with edges, derived from the smooth 80
pattern of Fig . 17c and 19a. Compare its Fourier
magnitude spectrum (c) with the spectrum of the smooth
pattern ( b ) .
(a) Test pattern of F ig . 25a, compensated for brightness 81
contrast by the method of Fig . 24a.
(b) Corresponding Fourier magnitude spectrum.
(a) Test pattern of F ig . 25a , compensated for bright- 83
ness contrast by the sim plified method of F ig . 24b.
(b) Corresponding Fourier magnitude spectrum. Compare with Fig. 26.
(a) Test pattern of F ig . 25a, empirically compensated 84
for brightness contrast.
(b) Corresponding Fourier magnitude spectrum. Compare with Fig. 27.
Stimulus density (left) and corresponding subjective 85
brightness (r ig h t ) , predicted by the sim plified model.
Test pattern (a) and predicted subjective brightness 89
( b ) . Notice the inversion of curvature on the pre
dicted subjective brightness.
Page
v i

Linear density gray scale (a) and predicted subjective brightness (b).
Intensity step (a) isolated from the gray scale of
F ig . 31a, and predicted subjective brightness ( b ) .
Intensity square wave ( c ) , and predicted subjective
brightness ( d ) .
Three equivalent linear systems for neural interaction
(a) Non-linear system for neural interaction, derived
from Fig . 3 3 (c ) , which eliminates sharpening of edges.
(b) Generalization of the non-linear system (a), in the form of a tunable summation system, linear in the absence of edges.
Cornsweet illu s io n , on a rectilinear (a) and circular
(b) test pattern.
Bennussi ring.
Compare visual appearance (a & c) and predicted
subjective brightness (b & d) of intensity step
and intensity gradient.
Patterns showing transition between a ramp and a step.
A typical density scan-line of a digital picture (a), processed by the model of Fig. 6 (b).
Color contrast compensation for smooth patterns.
A computer system for experimental d ig ital picture
processing. Computer Science Department (University
of U tah ).
Linear density gray scale used for picture calibration(a) compensated for photographic film distortion ;
(b) uncompensated.
(c) Compensation curve used for Polaroid film , Type 52

ABSTRACT*
A computer driven display system was used to study brightness
contrast phenomena, in a project motivated by research in d ig ital picture
processing. The modeling approach was that of Stockham and Davidson:
the v isual system is modeled as the cascade of a linear system (eye optics)
and a m ultiplicative homomorphic system— that is , a logarithmic trans
formation (retinal receptors), followed by a linear system (neural
in teraction ).
In order to test the linearity of neural interaction, smooth stimulus
patterns were u tilize d , containing only a few sinusoidal components within
the low frequency band, and exhibiting classical brightness contrast
effects (Mach bands, simultaneous brightness contrast, Hermann grid
e f f e c t ) . Data were collected from brightness matching experiments with
these smooth patterns. The data were verified in preliminary experiments
on similar patterns d ig itally processed by the inverse of the model, in
order to obtain cancellation of the brightness contrast e ffects . The
experimental results showed to be in agreement with Davidson 's data,
obtained by a fundamentally different method. This new experimental
approach indicated that the hypothesis of linearity of neural interaction
is ju stified for smooth patterns. Further studies suggested that
intensity edges and contours cause strong departure from linearity . Some
steps were also taken toward extending the homomorphic model for color
contrast phenomena.
*This report reproduces a dissertation of the same t it le submitted
to the Department of Electrical Engineering, University of Utah, in
partial fulfillm ent of the requirements for the degree of Doctor of
Philosophy.
v i i i

Conclusions are drawn about the implications of these experiments
in the fields of computer image processing and visual psychophysics.
The advantages of computer techniques in visual experiments are presented;
the applications of the homomorphic model of brightness perception to
digital picture processing are reviewed, and the implications of the
experimental findings are discussed.

INTRODUCTION
The physiology and psychology of perception have fascinated
scientists for a long time. Physiologists study the structures and
functions of the extremely complex neural network which is responsible
for our communicating with the outside world; psychologists analyse the
qualitative and quantitative properties of our perceptual system.
Sometimes, they attempt to establish theoretical models which formally
describe some perceptual phenomena, and are supported by physiological
as well as psychophysical facts . More recently, the fie ld o f perception
has attracted several brands of computer and information scientists ;
their research interests range widely from a r t ific ia l intelligence
[Feigenbaum and Feldman 1963], to scene analysis [Roberts 1963] \ and
to computer-aided psychophysics [Julesz 1971 ; R . I . Land 1969, 1972;
Sekino 1970]. Our motivation here is related to the latter.
One particularly interesting aspect of visual perception is the
complexity of the perception of brightness. In particular, some
striking iZtus'ions3 known as Mach bands and simultaneous brightness
contrast, indicate evidence of some preprocessing of the retinal image
at the early stages of the visual pathway. From now on, these phenomena
w ill be referred to altogether as brightness contrast e ffects .
1 Most studies in pattern recognition and scene analysis rely only
marginaly on psychophysiological theories. However, i t is interesting
to observe that the intuitive importance of edge detection in most scene
analysis schemes agrees w ith the experimental notion of edge-oriented
mechanism in the visual system, as w ill be described herein .

This subject gained recognition mainly through the pionneering work
o f Ernst Mach (1865, 1866 and 1 8 6 8 ), and have motivated numerous studies
in the last thirty years. Two main forces have in itiated these
e fforts : The f irst is the role played in these phenomena by neural
interaction and inh ib ition , which prove to be a fundamental ingredient
in our sensory systems; the second is that, provided some sim plifying
assumptions on the properties o f the visual system (which seem
reasonable), the brightness contrast effect can be modeled using the
powerfull tools of Fourier analysis . The po ssib ility of describing such
complex phenomena by such a simple formalism is very attractive, subject
to the condition that i t does not oversimplify or mask the facts . We
w ill show, with the help o f computer techniques, that the modeling
methods based on Fourier analysis are quite simple, descriptive, and
accurate (under certain conditio ns). Indeed, linear models of
brightness contrast have been with us for some time and the importance
o f this approach can be indicated by the profusion of technical
literature , which includes several monographs [Ratliff 1965; von Bekesy
1967 ; Cornsweet 1970]. But the motivation for a computer sc ientist to
venture on these already well traveled routes exists nonetheless.
Besides the fact that it is always interesting to study the information
processing aspects of human perception mechanisms, the reasons are
basically twofold.
1 / Psychophysics in computer science
F irst , in the perspective o f dig ital image processing, i t is
important to understand the fundamental properties of the human visual

system; the human observer is the fin al stage of any man-machine image
processing scheme, and therefore properties of this final element are
relevant to the rest of the system. In the case o f computer image
enhancement and bandwith compression, the existence of a reasonably
valid model for human vision should influence the design of the
machine-based stages. In particular , Stockham has demonstrated
[1968b, 1972] that the notion of processing pictures by m ultiplicative
homomorphic systems [Oppenheim et a l . 1968] rather than by additive
(linear) systems is in harmony with the physics of image formation and
the automatic gain control property o f the visual system. The same
author also indicated that special attention to these properties might
give some insight for a better subjective quality criterion for
pictures. Research is being currently pursued in this area.
S t il l another example would be the problem of proper color balance
in photographic pr in ts . As is well known, the human eye shows a
tremendous ability to adapt to the illum inating lig h t , be i t solar or
a r t if ic ia l (this fundamental property w ill be studied in the perspective
of the homomorphic m odel). On the other hand, photographic film , with
its fixed spectral response, records the illuminance of a scene without
filterin g out the color bias introduced by the illum ination. As a
result, photographs printed without correction w ill show an
unsatisfactory colored overtone, i f the film was not adapted to the
illum ination (daylight, tungsten lamp, e t c . ) . Since the amateur
photographer is usually not prepared to select the film according to the
ambiant illum ination, a solution is to attempt to balance empirically
the colors during the printing process; automation of this procedure

would be an interesting improvement. A good understanding and model of
the adaptative properties o f the visual system w ill certainly provide a
so lid basis for research in d ig ital color compensation of photographic
prints , and other related processing of d ig ital images.
I I / Computer science in psychophysics
Our second motivation is that a computer system equipped with a
high quality display device is a powerful aid in psychophysics
research. Appendix C describes how a d ig ital picture processing
equipment, composed of an off the shelf general purpose computer,
along with sophisticated display apparatus, makes a powerful and
original tool in visual psychophysics research.
Von Bekesy introduced the notion of simulating the effect of neural
inhibition [1960]; his model approximately implements a convolution
process with a crude impulse response, the neural unit. Obviously,
the computer w ill provide a much greater versatility and fle x ib ilit y for
testing models by numerical simulation, verifying whether results
predicted by the simulation are qualitatively and quantitatively
confirmed by experimental facts . When, moreover, the model is
invertible , as is the case in the present study, simulation of the
inverse model allows the production of compensated pictures [Stockham
1968b, 1972] . In other words, i f some invertible model V is considered
2 _ ,Flying-spot cathode ray tubes w ith half-tone capabilities are now
standard devices; combined with some photographic equipment, and careful
calibration procedures, they can produce very high-quality pictures
(Appendix C ) . However, computer driven television monitors w ill
certainly prove more advantageous in the near future, as their
technology improves; this w ill be pointed out on several occasions.

as representing properly the visual system Ss then a pattern processed
through the inverse system V- - should appear subjectively to the
observer like the original pattern is objectively , without brightness
contrast e ffects . This results from processing in cascade by two
inverse systems (V-l and S= V ) , which is equivalent to no processing
at a l l . This is indeed a very powerful and attractive concept. As
w ill be shown further, the success and failures of a given model can be
clearly demonstrated. The notion of the null experiment is well
established in the fie ld of experimental psychology. Von Bekesy
[1972a, 1972b] recently studied Madh bands and contour effects by
compensation methods. Rather than measuring these phenomena by some
sort o f brightness matching technique (which generally makes use of an
additional stimulus, thereby introducing some perturbation in the
phenomenon [R atliff 1965 , pp. 51- 52]), a modified stimulus is presented
such that the brightness contrast effect is cancelled. Thus, the
modification applied to the stimulus indicates the magnitude o f the
visual phenomenon. However, these experiments, conducted with the
perennial color-mixing wheel and sim ilar mechanical apparatus, cannot
match the precision and fle x ib ility obtained in computer aided
experiments such as the ones presented and described herein .
The computer actually permits one to devise and produce all
possible sorts o f patterns, for selectively inducing brightness contrast
effects o f different kinds. The only lim it would seem to be the
imagination of the experimenter . . .Ifor the realization o f color
patterns, the advantage o f computer driven display devices over M.unsell
paper and spinning wheels is overwhelming, despite the calibration

6
problems when photographic film is used as final output medium3 . This
ab ility was exploited here, in particular for producing patterns without
edges and with a limited number of frequency components, which would
show classical brightness contrast effects (Mach bands, simultaneous
brightness contrast and grid e f f e c t ) . These patterns permitted a full
test of the validity of a homomorphic model in a certain band of
frequencies.
I l l / Contributions of the present research
It has been suggested for some time [Fry 1948; O 'B rien 1958;
Davidson and Whiteside 1971] that linear inhibition models were not
quite su ffic ien t to elucidate the complexity of brightness contrast
phenomena, with regard to the appearance o f edges and uniform intensity
fie ld s . In particular , these models do not account for the complicated
mutual interaction between the perception o f contours and the perception
of brightness [Ratliff 1971].
In addition , the peripheral visual system^ has several optical and
neural components likely to modify the brightness pattern o f the visual
image. These components are combined in a fashion which hinders easy
probing of the different constituents. However, one can assert that
3 A restriction exists however: i f the stimuli used are reflection
patterns, one cannot obtain very bright retinal illuminances for which
color effects are stronger. Brighter stimuli can be obtained by
projecting slides on a high reflectance screen; however, for a quick
turn-over procedure, one has to resort to Polaroid films (or much
better, a real-time color d is p la y !) .
^ This term refers here and thereafter to the f irst stages of the
visual system, namely the eye and the retinal neural network, as opposed
to the central (or cortical) stages. It is not meant to apply to vision
at the periphery of the retina , as opposed to foveal v ision .

brightness contrast is mainly the result of neural processing, and that,
from the point of view of Fourier analysis , it is characterized by an
attenuation of low frequencies, which are otherwise not seriously
pertubated by the optical component of the visual system.
With these premises in mind, we intended in this research, to
isolate and probe the inhibitory neural process by : ,
-limiting the frequency content of the stimuli to the band of
frequencies where the retinal network is believed to operate;
-thereby eliminating edges, and, in theory, by-passing other neural
processes presumably operating on contours.
Using these tools and techniques just described, an original
psychophysical experiment was designed and conducted in order to
estimate the frequency transfer properties o f the neural network, by
testing the brightness contrast phenomenon d irectly . The results proved
to be fully consistent with data obtained previously , from a different
experiment based on the same model [Davidson 1968]. Brightness effect
compensation on a variety of patterns, using the experimental data,
showed the range o f validity o f this model and its lim itations.
The main contribution was the precise investigation o f the
linearity property of neural interaction . A ll prior studies on the
modulation transfer properties o f the neural system have assumed, but
not directly v er ifie d , the linearity hypothesis. By reducing our
ambition to probing the band of low frequencies considered to be of most
importance, in relation with the inhibitory process, we were able to
demonstrate the reasonable linearity of neural inhib itio n for smooth

stim uli. Futhermore, more evidence was obtained supporting the view
that the invalidity of the model over the fu ll range o f frequencies is
related to non-linear edge e ffe c ts .
Chapter I I I and IV present the computer experiments and the
implication of their results . Prelim inarily , Chapters I and I I prepare
the way by introducing the visual phenomena involved, and the
physiological, psychological and theoretical basis for the homomorphic
model. In Chapter V the question o f edges is approached in a more
conjectural manner, in relation with hypothetical cortical mechanisms.
Chapter VI suggests the extensibility of the model to account for
sim ilar color e ffects . F inally , Chapter V II draws the conclusion of
this research from the dual point of view of d igital image processing
and computer aided psychophysics.
A ll the pictures illustrating this dissertation have been generated
d ig itally on the equipment and by the procedure described in
Appendix C. Some brightness contrast effects are dependent on the
viewing distance, since the size o f the retinal image changes in inverse
ratio to the viewing distance, and the frequency spectrum is scaled
accordingly. The standard viewing distance for the pictures presented
here, in proper relation with the frequency units (cycle/degree)
u tilized throughout, is about arms length.

CHAPTER I >
MACH BANDS AND OTHER
BRIGHTNESS CONTRAST PHENOMENA
Optical illusions have been a favorite subject of investigation by
psychologists, because they are dramatic manifestations of the complex
unconscious processing of visual information, and help focusing on
specific aspects of this processing. Most of these illusions involve
quite abstract mechanisms, probably located in cortical stages o f the
human information processing system. Other visual phenomena, in which
we are interested here, can be attributed mainly to the inhibitory
properties of the peripheral neural networks, and have correlates in the
other sensory systems [von Bekesy 1960, 1967]. They imply modification
o f the contrast and relative brightness o f the visual stimulus, as a
function o f its spatial variation , by mechanisms b u ilt in the neural
structure o f the peripheral visual system^'. Before undertaking the
study o f these mechanisms, we present several classical examples of
brightness contrast phenomena, which result in seemingly different
visual e ffects , but are most probably subserved by the same fundamental
processes. Although sim ilar phenomena are induced with color patterns
[Albers 1963], we w ill f irst restrict ourselves to monochromatic black
and white stim uli; we are therefore concerned here with foveal cone
1 It is believed that most of this processing takes place in the
retina , but sim ilar effects have been demonstrated at other stages of
the visual pathway [Jung 1967]. Therefore it is quite possible that
this mechanism be physiologically distributed all along the visual
system, but this does not bear on the overall modeling approach taken
here.
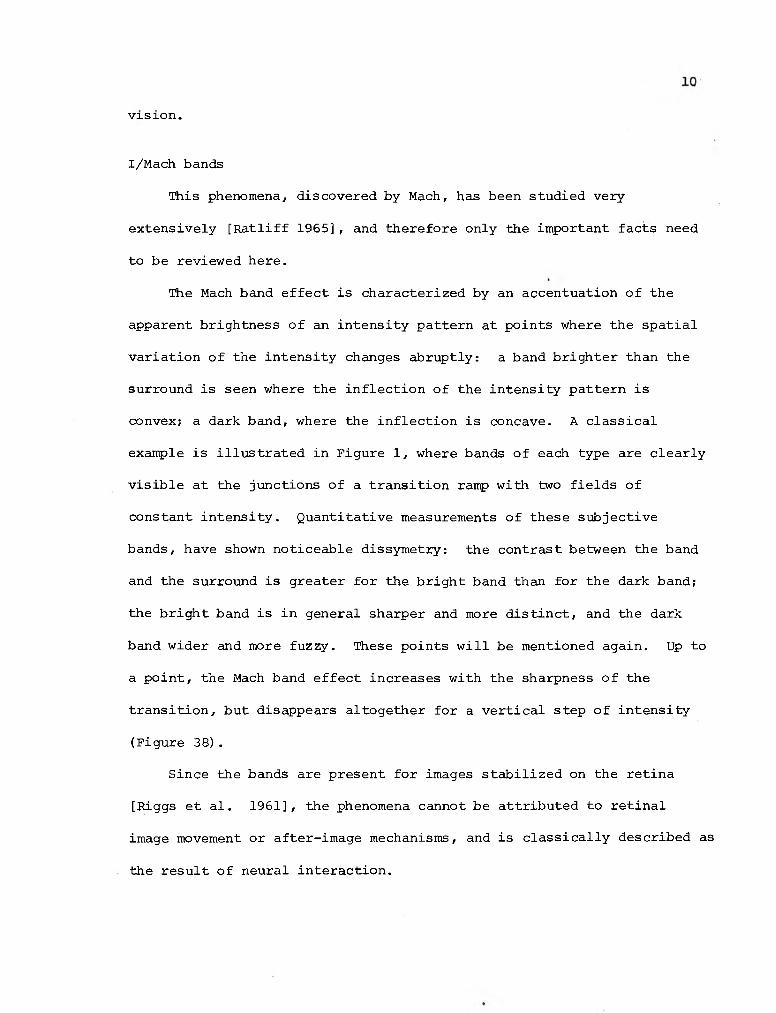
I/Mach bands
This phenomena., discovered by Mach, has been studied very
extensively [Ratliff 1965] , and therefore only the important facts need
to be reviewed here.
The Mach band effect is characterized by an accentuation of the
apparent brightness o f an intensity pattern at points where the spatial
variation o f the intensity changes abruptly: a band brighter than the
surround is seen where the in flection of the intensity pattern is
convex; a dark band, where the inflection is concave. A classical
example is illustrated in Figure 1 , where bands of each type are clearly
v isib le at the junctions of a transition ramp with two fields of
constant intensity . Quantitative measurements of these subjective
bands, have shown noticeable dissymetry: the contrast between the band
and the surround is greater for the bright band than for the dark band;
the bright band is in general sharper and more d istinct , and the dark
band wider and more fuzzy . These points w ill be mentioned again. Up to
a po int , the Mach band effect increases with the sharpness o f the
transition , but disappears altogether for a vertical step of intensity
(Figure 38 ).
Since the bands are present for images stab ilized on the retina
[Riggs et a l . 1961], the phenomena cannot be attributed to retinal
image movement or after-image mechanisms, and is classically described as
the result of neural interaction .
v is io n .


II/ Simultaneous brightness contrast
The same cause is attributed to the phenomena of simultaneous
brightness contrast, whereby the apparent brightness of parts of the
visual image is affected by the intensity of the surround. For example,
in Figure 2 a, the four small gray squares have exactly the same
intensity, but their apparent brightness is strikingly different and is
a function of the brightness of the surround; the darker the surround,
the brighter the gray patch will appear, and conversely. As shown on
Figure 2 b, the inducing background need not be uniform in intensity,
nor extended in space. As will be demonstrated further, the presence of
edges is also not necessary to the phenomenon. The spread of influence
of the background is quite extended, as can be seen on Figure 3; the
gray scale helps estimating the effect of viewing distance on brightness
contrast, indicating somehow the extent of the inhibitory action.
Ill/ Herman grid
The illusion of "fuzzy intersections" apparent on the Hermann grid
pattern (Figure 4) is also a result of induction by the background. In
Figure 4 (top left), the intersection of the bright bars are surrounded
by more bright areas that the straight portions of the same bars, and as
a result appear darker. The effect is opposite for a dark grid on a
bright background. Here also edges are not necessary for the phenomenon
(Chapter IV), and therefore edge mechanisms cannot be held responsible,
as had been suggested [reported in Julesz 1970].

Fig. 2 Simultaneous brightness contrast.
(a) The four small squares have same gray level.
(b) The two vertical bands have same gray level; the background is an exponentiated sinusoide.
(b)

Fig . 3 - Simultaneous brightness contrast: two identical gray
scales imbedded in dark and bright surrounds.

Examples of the Hermann grid contrast e ffect . Notice
the darker or brighter spots at the intersections of the
g r id s .

Let us now indicate br ie fly how inhibitory mechanisms could explain
brightness contrast phenomena qualitatively . Let us consider an array
o f photoreceptors having the following inhibition property, typical of
retinal networks [Poliak 1957 ; Hartline 1969]: an excited receptor w ill
in h ib it the activity of neighboring receptors in a manner roughly
proportional to its own activity and as a decreasing function of their
distance. This interaction is simultaneous and mutual, and the activity
transmitted to the next stage of the neural system is the result of
temporal and spatial summation. I f we consider now a cluster of
adjacent receptors, in an area o f uniform retinal illum ination, their
mutual interaction w ill not alter the uniformity of their neural
activ ity . But i f the same cluster of receptors is exposed to a
spatially varying intensity stimulus then contrast between bright and
dark areas w ill be increased by the mutual action of inh ib itio n . It is
now apparent how mutual inhibition between adjoining visual receptors
would account qualitatively for the sharpening of spatial
discontinuities in the intensity pattern (Mach b a n d s ), and for the
redistribution of brightness of certain areas, as induced by their
surround (brightness contrast).
We now turn to a more careful analysis of these processes via a
precise convolution model. We w ill attempt to estimate the parameters
of such a model, to study its range and condition of valid ity , and to
relate the inconsistencies with the particular problem of edges.
16
I V / In h ib ito r y mechanisms

CHAPTER I I
PSYCHO-PHYSIOLOGICAL AND THEORETICAL
BASIS FOR A HOMOMORPHIC MODEL
OF NEURAL INTERACTION
After presenting diverse brightness contrast phenomena in the prior
chapter, we indicated how they can be intuitively linked to inhibitory
interaction in the retina . Mach him self suggested that the brightness
effect he studied, was probably attributable to neural interaction.
However, physiological evidence were lacking at the time for developing
this idea further. Mach resorted, for the theoretical formulation of
the phenomenon, to diverse algebraic expressions involving the second
derivative ( i .e . the curvature) of the intensity function. With the
advance of physiology, leading in particular to evidence of quasi-linear
neural inhibition mechanisms in the retinal receptors of prim itive
organisms, and with the expansion of Fourier analysis in the fields of
optics , strong interest developed in the study o f the visual system as a
linear system. The research effort prior to 1965 is reviewed and
discussed in the excellent monograph on Mach bands by F . R a tliff [1965],
which includes the work of Mach him self. R a tliff showed that the
earlier models were somewhat equivalent, even i f d ifferent in formalism,
especially since most relied on the hypothesis o f the linearity of
neural interaction.
Since we intend to propose a non-linear model o f brightness

perception, following Davidson [1968] and Stockham [1968b], we w ill not
dwell on the merits and drawbacks o f the earlier linear models,
appropriately studied in R a t l if f 's book. However, the homomorphia^
approach s t il l assumes linearity o f neural interaction it s e l f .
Therefore, we w ill present in section I the psycho-physiological
evidence supporting such an hypothesis. ,
In short, the earlier studies of brightness contrast phenomena were
mainly concerned with the inhibitory interaction in the neural system,
but overlooked, or ignored, a fundamental property of the visual system,
namely the ab ility for compressing the range o f visual stim uli, revealed
by the phenomenon of visual adaptation. The homomorphic model
incorporates this property, in the form of a non-linear stage— a
logarithmic transformation— located at the retinal photoreceptors. As
was pointed out by Stockham [1968a, 1968b] the combination of a
logarithmic transformation, followed by a linear system attenuating low
frequencies implements adequately a dynamic range compression process,
typical of the adaptation mechanism in the retina . These ideas w ill be
reviewed in the second section. Justificatio n of the assumption of
logarithmic sensitivity of the retina w ill also be presented. Our
contribution w ill b e , then, to demonstrate that, in the frame of a
homomorphic model, linearity of neural interaction , under restricted
conditions, can be demonstrated by psychophysical experiments (Chapter
I I I and I V ) .
1 For the reader not fam iliarized with the work of Oppenheim and
Stockham [1968] on generalized linear systems, the terminology w ill be
defined further in the present Chapter (Section I I I ) .
18

The present section focus on the ju stification for modeling neural
interaction in the retina as a linear system. Neural interaction is
basically o f either excitatory o f inhibitory nature.
A) Neural inhibition
Inhibition appears to be a fundamental feature of neural systems.
Von Bekesy showed that i t is present in all human sensory organs [I960,
1967] , and that sensory effects analogous to Mach bands are observable
in hearing and touch. Lateral neural inhibition has been demonstrated
electro-physiologically in the retina of the vertebrate (cat, monkey,
frog, goldfish , e t c ) , as w ell as o f the invertebrate. But, i t is in the
prim itive eye o f the Limulus (horseshoe c ra b ), where inhibition was
discovered by Hartline [1949] , that i t has been studied the most
extensively^.
The structural sim plicity of the Limulus eye makes i t a favorite
subject o f visual physiology experiment. I t is a compound eye formed of
some 1000 receptors (ommat'Ld'ia) , interconnected by a network o f neural
f ib e r s . The nerves originating from each ommatidium are connected to
their neighbors, and collected into bundles forming the optical nerve.
The activity o f an individual fiber can be recorded and analysed, as
individual selected receptors are stimulated by ligh t . By this method,
lateral inhibition can be studied spatially and temporally [R atliff ,
Hartline and M iller 1963]. These studies show that linearity o f neural
2 The literature on the physiology of neural interaction is impressive;
the reader w ill find comprehensive coverage in [Hartline 1969], [Ratliff
1965 , Chap. 1-4], [C.H. Graham 1965, Chap. 5 ] .
19
1 / B a sis for a l in e a r model o f neural in ter a ctio n

interaction is generally well v er ified , and that the response o f retinal
receptors, resulting from recurrent interaction with their neighbors,
can be expressed by simultaneous linear equations (within threshold
lim its , and given the restriction that inhibition is not exactly
homogeneous in the r e t in a ) . These equations express the fact that the
response o f an individual receptor is the simultaneous result (algebraic
summation) o f positive activity (excitation) and negative activity
(in h ib it io n ).
Neural inhibition is quite certainly present in the human and
primate visual system, as is suggested by psychophysics (Chapter I ) , and
physiology (Figure 5 ) . Its organization is also much more complex in
the vertebrate visual system than in the prim itive eye o f the Limulus
[Poliak 1957; Michael 1969; Werblin 1973] . However, i f one subscribes
to the likely assumption that the perception of brightness is correlated
directly to electrical activity in nerve fibers , the study of simple
inhibitory mechanisms, as we just described, offers some insight toward
an interesting modeling approach.
B) Linear model for neural interaction
In particular, i f one extends the physiological evidence of
linearity in the Limulus eye, into a convenient (and p lausible , as we
shall see) linearity hypothesis for neural interaction in the human
3retina , it results that one can use a convolution model . This method
requires the additional assumption of spatial homogeneity, and some
3 Let us remind the reader that Fourier methods (spatial frequency
analysis) and convolution are equivalent approaches, uniquely associated
with the property of linearity .
20

It!
Fig . 5 - Neural structure of the primate retina . Note the complex
synaptical connections. [From Polyak, The Vertebrate Visual
System. Reproduced by permission of the publisher: The
University of Chicago P re ss ] .

sim plification concerning threshold effects , temporal effects and other
lim iting conditions. The convolution approach implies that the pattern
response of the array of retinal receptors is the point-wise summation
of individual responses, each proportional to a standard response,
termed the impulse response or point spread function of the retinal
system. This summation can be mathematically expressed by the
integral: •
r (x ,y ) = / / e (£ /n) h(x-£, y-H) d£ dn,
relating neural excitation e (x ,y ) to neural response r ( x ,y ) . Following
intuitive reasoning (Chapter I ) , and supported by physiological data
[R atliff 1965], one can describe the important features of the neural
impulse response h (x ,y ) as: a narrow central excitatory peak,
surrounded by a wide inhibitory area, whose amplitude decreases with
distance (Figure 1 3 ) .
As results from Fourier analysis , a space invariant linear system
can also be characterized by its frequency response (or modulation
transfer functionj noted M .T .F . ) , which is the Fourier transform of the
impulse response. As is well known, the advantage of the frequency
domain representation is that i t reduces the input-output relation
defining the system to a simple m ultiplication:
R (u ,v) = E (u ,v ) • H (u ,v ) ,
where R, E and H are the Fourier transforms of r ,e and h,
respectively. Then, it is easy to re alize , by theoretical Fourier
analysis , that the transfer function corresponding to the impulse
response just described, w ill exh ib it , as its main feature, attenuation
22

of low frequencies (Figure 13)'. Accordingly, one recognizes that the
brightness contrast effects presented in the f ir s t Chapter (Figure 2 ) ,
can be related to an attenuation of the low spatial frequencies.
C) The visual system as a linear system
Then, given that an optical system can be described by Fourier
analysis [Goodman 1968], a sim plifying approach (defective as we shall
see) is to idealize the visual system as a cascade of two linear
systems: the visual optics, followed by a linear model o f neural
interaction in the retina . The transfer function of the overall system
is then the product of the transfer functions of each component. The
frequency response of the visual optics is , typically , a decreasing
function of spatial frequencies [Goodman 1968]. The retinal system
presents low frequency attenuation (as we have seen, in relation with
brightness contrast effects)', and also some high frequency attenuation
(since the discreteness of the retinal receptor mosaic results in
lim ited reso lutio n ). Therefore, the frequency response of the overall
system would exhibit a maximum at the intermediate spatial frequencies.
These features have been confirmed by several experiments based on the
linear model. Experimental methods have consisted in :
-measurement of the subjective brightness of Mach bands [Lowry and
De Palma 1961; Brynghdal 1964a ];
-measurement of the contrast of sinusoidal gratings [Brynghdal
1964b , 1965];
-measurement of the threshold contrast for sinusoidal gratings
iLowry and De Palma 1962; Campbell and Green 1965; Robson 1966 ; Watabene
et al. 1968] .

But, the modeling approach described in the previous section,
relies on the linearity of the visual system, whereas there is strong
evidence to the contrary. Some of this evidence results directly from
the experimental data.
A) Deficiencies in the linear model _
For instance, Brynghdal [1965] measured the subjective contrast
of an intensity sinusoide
L + a s in (2 t: f x) .
According to the linear model, the subjective brightness is in theory;
kQ L + kf a s in (2 t: f x) ,
where kQ and k^ are respectively the visual response at DC and at
spatial frequency f . Defining the contrast of a sinusoidal grating as
the ratio of its amplitude over its mean, then the objective contrast of
the test grating is
C = a /L ,
whereas the subjective contrast of the same grating is
C' = (kf a) / (kQ 1) = (kf/ k Q) C.
as a result, the ratio C '/C of the subjective and objective contrast
should be dependent only on the frequency f , and independent of the mean
luminance L, or o f the objective contrast a /L . As Brynghdal observed,
this was not verified in the experimental data.
Also , Marimont [1963] noted that, i f the visual system were linear,
then bright and dark bands for a linear intensity ramp should be
symmetrical, since inhibition is certainly symmetrical, and a linear
24
I I / N on- linearity of the v is u a l system

ramp has odd symmetry. But, as we indicated in the f irst chapter,
matching experiments and common observation show Mach bands to be very
dissymmetric in brightness.
B) Non-linear response o f retinal receptors
Some of these discrepancies could perhaps be related to a property
of the retinal photoreceptors which is not included in a total linear
model; namely that the electro-physiologic activity of a receptor, not
subject to inh ib itio n , is proportional not to the intensity of the
stimulus, but rather to its logarithm, over a wide range of stimulus
intensity^. On these physiological premises, i t is tempting to
correlate brightness sensitiv ity , in the absence of in h ib itio n , to the
logarithm of the stimulus intensity . This notion is supported by the
psychophysical evidence that the visual system is more sensitive to
brightness ratio than to brightness difference . This psychophysical
property is expressed in the well known Fechner's law, which states that
the just noticeable brightness difference is proportional to the
logarithm of the stimulus intensity [Hurvitch and Jameson 1966] .
Coming back to the physiological significance o f the non-linear
sensitivity of photo-receptors, one w ill note that the quasi logarithmic
mapping of intensity into neural activity permits to the retina to
accept visual inputs over an enormous range of intensities [Hartline
1969] . This ab ility for visual range compression at the receptors,
along with neural interaction, is the fundamental physiological basis
25
^ See for instance: [Tomita 1968], [R atliff 1965 , p . 1 1 4 ] , [Cornsweet
1970, p . 249].
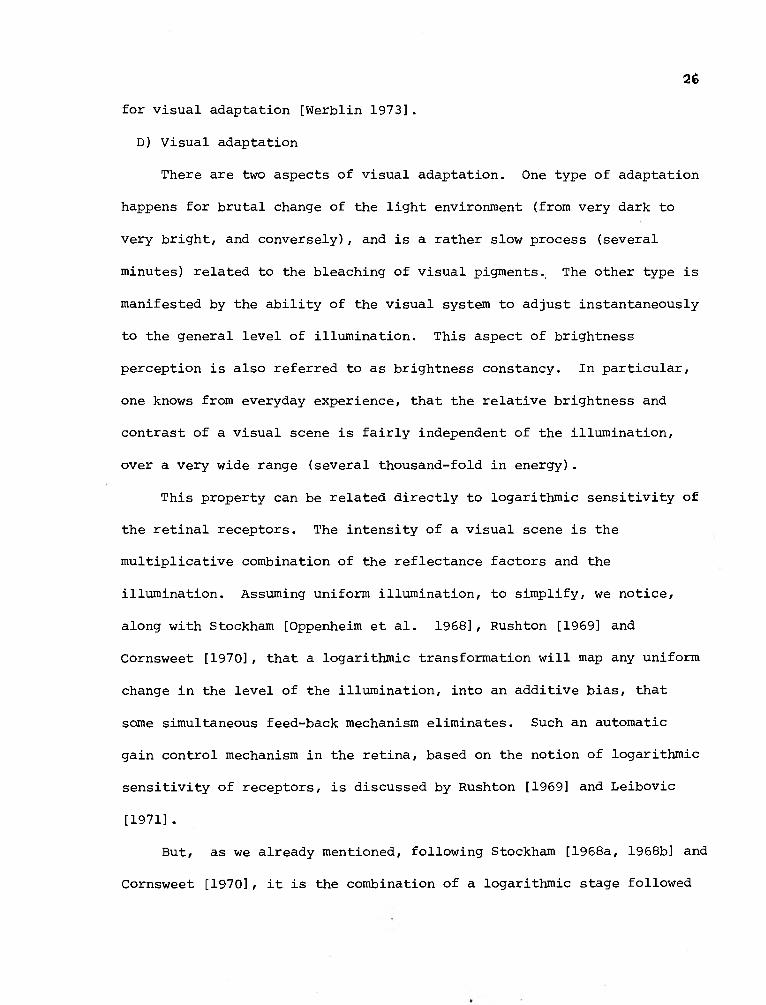
D) V isual adaptation
There are two aspects of visual adaptation. One type of adaptation
happens for brutal change of the light environment (from very dark to
very bright, and conversely), and is a rather slow process (several
minutes) related to the bleaching of visual pigments., The other type is
manifested by the ab ility of the visual system to adjust instantaneously
to the general level of illum ination. This aspect of brightness
perception is also referred to as brightness constancy. In particular,
one knows from everyday experience, that the relative brightness and
contrast of a visual scene is fa ir ly independent of the illum ination,
over a very wide range (several thousand-fold in energy).
This property can be related directly to logarithmic sensitivity of
the retinal receptors. The intensity of a visual scene is the
m ultiplicative combination of the reflectance factors and the
illum ination. Assuming uniform illum ination, to sim plify , we notice,
along with Stockham [Oppenheim et a l . 1968], Rushton [1969] and
Cornsweet [1970], that a logarithmic transformation w ill map any uniform
change in the level of the illum ination, into an additive b ia s , that
some simultaneous feed-back mechanism elim inates. Such an automatic
gain control mechanism in the retina , based on the notion of logarithmic
sensitivity of receptors, is discussed by Rushton [1969] and Leibovic
[1971].
But, as we already mentioned, following Stockham [1968a, 1968b] and
Cornsweet [1970], it is the combination of a logarithmic stage followed
26
for v is u a l adaptation [W erblin 1 9 7 3 ] .

by a linear high-pass system (neural in teraction ), which carries out a
more general and more adequate dynamic range compression process. This
property appears to be the most significant support for the homomorphic
model of brightness perception. It is in agreement with the
physiological findings that the brightness sensitivity of the retina is
the result of not only logarithmic response of the receptors, but also
neural interaction [Werblin 1973].
D) The perception of lightness
The more attractive attribute of the homomorphic model of retinal
brightness perception is probably how i t implements concurrently a
mechanism for brightness contrast and for brightness constancy, or
tightness perception. We mention here the terminology of E .H . Land
[1964, 1971], signifying the perception of the reflectance
characteristics of the visual scene, independently of the nearly
spatially invariant illumination component. We just indicated how the
logarithmic sensitivity of the receptors would, by it s e lf , be the basis
of a visual adaptation mechanism when illumination is uniform. We
notice now that the attenuation of low spatial frequencies by linear
neural interaction (causing brightness contrast effects) w ill provide an
even more flexible mechanism by filterin g out, or at least strongly
attenuating, non-uniform illumination components, since they are
typically slowly varying spatially [Stockham 1968a; Oppenheim et a l .
1968].
E .H . Land and McCann [1971] proposed also a retinal model for
lightness perception based on pair-wise subtraction of the output of
27

neighboring logarithmic receptors. Cumulating these d ifferentia l data
along a path connecting two retinal points w ill y ield the ratio of the
visual intensity at these two points, and therefore permit the
comparison the relative reflectance brightness (lightness) of the
corresponding stimulus points, and this independently o f uniform or
quasi-uniform illumination factors. This retinal mechanism is akin to
the homomorphic model, as i t relies also on the notion of logarithmic
receptors and subtractive interaction (in h ib it io n ) . However, a
fundamental drawback is that i t does not include brightness contrast, as
the relative brightness of two points is independent of brightness
elsewhere. In other words, i t is roughly equivalent to a homomorphic
system with a crude linear component. The homomorphic model appears
therefore more complete and more sophisticated.
E) The dissymetry of Mach bands
But, a critical point seems apparently not to be resolved by the
homomorphic model, namely the dissymetry of Mach bands for a linear
intensity ramp. One w ill easily notice that the homomorphic model w ill
predict dissymmetric bands, but in opposite manner to what has been
reported from brightness matching experiments [Ratliff 1965, p . 55 ] . It
predicts an undershoot (dark band) larger than the overshoot (bright
b a n d ), since the log transformation applied to a linear ramp results in
a sharper in flection at the juction of the gradient with the dark
f ie ld . Surprisingly , von Bekesy [1968b] relies on the converse
assumption (which seems erroneous) that a logarithmic stage of visual
stimulus compression prior to a linear inhibition stage, w ill produce
dissymmetric Mach bands, in conformity with experience, thereby
28

On the other hand, Whiteside and Davidson [1971] experimented with
a family o f luminance gradients (linear , logarithmic, exponential, in
power law) , and reported that observers judged the most symmetrical Mach
bands to be produced by an exponential ramp. This experiment clearly
supports the hypothesis of the logarithmic stage preceding the linear
system of neural interaction , since the input to the latter system would
then be a symmetric linear ramp, when the external stimulus is an
exponential gradient, and would therefore exhibit symmetric Mach bands.
Whiteside and Davidson associate the inconsistency reported before , from
brightness matching experiments, to the fact that both test stimulus and
matching stimulus are affected by the non-linear (logarithmic)
transformation. In other words, brightness matching technique would
measure the antilog of the subjective brightness rather than the
subjective brightness it s e l f . This would explain the inverse
dissymmetry obtained by such experimental measurements.
In conclusion, there seems now to be strong evidence, both
physiological and psychophysical, supporting not only the principle of
a non-linear model for brightness perception, but also the notion of
structuring it in the form of a logarithmic stage (retinal receptors)
prior to a linear system (neural inhibitory in tera ction ).
I l l / The homomorphic model of brightness perception
The notion o f logarithmically sensitive receptors was found in some
o f the earlier models, such as Mach's [Ratliff 1965 , p . 273] , Taylor's
29
ju s t i f y in g h is approach.

[Ratliff 1965 , p . 118] , Marimont1s [1962]. Subsequently, several
workers mentioned and studied a model including a logarithmic stage
followed by a linear system of neural inhibitory interaction.
Brynghdal [1964a] noted that, i f the visual system is
logarithmically sensitive to stimulus intensity , then, in brightness
matching experiments with Mach bands, the linear model of neural
interaction should relate , not stimulus intensity (objective
measurement) and matching intensity (subjective measurement), as Lowry
and De Palma [1961] assumed, but rather the logarithm of these
quantities . He used in his experiments a smooth intensity gradient, in
order to lim it the frequency content of his pattern to the low spatial
frequencies. Ihe data appeared to verify his hypothesis, but suffer
from the experimental d iffic u lt ie s of brightness matching with weak Mach
bands. Von Bekesy [1968b] studied Mach bands in the hypothesis of a
stimulus compression stage (logarithm ic), followed by a neural network
of inhibitory interaction (assumed l in e a r ) . The same model was proposed
and tested by Davidson [1968] and Stockham [1968b], namely the cascade
o f a linear system (visual o p t ic s ) , a logarithmic transformation
(retinal receptors), and a linear system (neural in tera ctio n ).
A) The homomorphic system
Following the terminology developed by Oppenheim et a l . [1968] on
generalized linear filte r in g , we w ill apply the term homomorphic to such
a system composed of a logarithmic stage followed by a linear system.
This defin itio n , of mathematical o rig in , describes the fact that such a
system obeys to superposition relatively to m ultiplication, and is
30

therefore an example o f generalization o f linear systems, which obey
superposition relatively to addition. The notion of generalized linear
systems permits the application o f the powerful tool of Fourier analysis
to filte r in g problems involving input signals combined by addition,
m ultiplication and convolution [Gold and Rader 1969, Chap. 8] [Oppenheim
et a l . 1968]. .
B) Advantages o f the homomorphic approach
The theoretical debate concerns, among other points, the structural
relation between the notion of logarithmic sensitivity and the
hypothesis of linear interaction, that is to say whether inhibition is
additive or m ultiplicative^, and, in the former case, whether the
visual stimulus compression stage precedes or is concurrent with neural
interaction. We have indicated previously how the homomorphic model is
in harmony with the notion of visual adaptation to illumination level,
and how i t implements adequately the appropriate gain control mechanism.
As shown by Davidson [1968], Stockham [1968b, 1972] and Cornsweet [1970],
and as we w ill demonstrate in detail herein , the homomorphic model
permits a precise investigation o f brightness contrast e ffects . In
particular , its fundamental parameters can be estimated by
psychophysical experiments.
Also computational ease favors the homomorphic formalism, over the
m ultiplicative (or shunting) model o f lateral inh ib itio n , although they
In his comparison o f substractive (linear) and m ultiplicative
(shunting) inh ib itio n , Furman [1965] overlooks the fact that linear
models o f inh ib itio n , when coupled with a logarithmic stage, are
equivalent to shunting models [Sperling 1970] , and probably more
powerful computation-wise.
31

have been shown to be equivalent [Sperling 1970]: basically both
account for visual adaptation and brightness contrast, and share the
same deficiencies for the prediction of brightness near edges and for
uniform intensity areas (Chapter V ) . Therefore, given the fast and well
developed techniques for implementation of linear and generalized linear
systems on d igital computers [Gold and rader 1969] ,. and the experimental
compensation technique introduced by Stockham [1968b, 1972] (illustrated
in Figure 2 4 ) , we w ill study here brightness perception in the
theoretical frame of the combined linear-homomorphic system depicted in
Figure 6.
Davidson [1968] measured the frequency transfer characteristics of
the neural interaction network; his experiment is presented in Chapter
I I I , and the data is compared with results form our own experiment. We
present a method which focuses principally on the linearity property of
the neural network, and help demonstrate that i t is satisfied for
patterns without edges.
C) The linear-homomorphic model o f brightness perception
Figure 6 depicts the complete linear-homomorphic model of
brightness perception, which includes both the optical and neural
aspects o f the peripheral visual system. In order to fac ilitate
reference to different stages and aspects of this model, let us make
some defin itio ns . An intensity (or luminance) stimulus is the external
visual input to this system. Following Stockham [1972], we define the
logarithm of this objective all-positive quantity as the stimulus
density. The output of the total system is the perceived or subjective

STIMULUSINTENSITY
LINEARSYSTEM
L
RETINALINTENSITY Log
RETINALBRIGHTNESS
LINEARSYSTEM
N
SUBJECTIVEBRIGHTNESS
EYE OPTICS R E TIN A L N EURALRECEPTORS INTERACTION
F ig . 6 - Block diagram o f the linear-homomorphic model o f brightness
perception.
Figf. 7 - Sinusoidal pattern showing threshold contrast in function of
spatial frequency. Spatial frequency varies exponentially
along the horizontal a x is . Contrast varies exponentially along
the vertical ax is , at constant mean luminance. The pattern
outlines the threshold contrast sensitiv ity on a log-log scale
[after Campbell 1968].

brightness. The term retinal intensity (or retinal luminance) applies
to the image formed by the optics of the eye on the retina . The term
retinal brightness (which we prefer to retinal density) refers to the
logarithm of the retinal intensity , that is to say the output o f the
retinal photo-receptors, and also the input to the linear stage of
neural interaction . i
A quite sim plifying hypothesis about such a model is spatial
isotropy. It is probably verified for a non astigmatic eye. It is also
convenient to assume that lateral inhibition presents circular symmetry,
although it is plausible that complex neural structure have directional
preference, and although it is certain that inhibition in the retina is
not quite isotropic , as is the case in the Limulus eye. However, the
two linear systems of the model w ill be assumed to have circular
symmetry, for the sake of sim plicity . As is developed in Appendix B , it
is then simpler to study the equivalent one-dimensional system.
Therefore, we w ill experiment here with one-dimensional rectilinear
patterns. The transfer functions o f the one-dimensional systems w ill be
the radial frequency response of the corresponding two-dimensional
systems, and their impulse response the line-spread function of the
two-dimensional equivalent.

C H A P T E R I I I
PARAMETERS OF THE
LINEAR-HOMOMORPHIC MODEL
In summary of the preceding chapters, i t appears that the ,
characteristic properties of the peripheral visual system, which we
attempt to model by a combined linear-homomorphic system, are:
a) limited resolution,
b) dynamic range compression,
c) spatial redistribution of brightness.
Although it would seem that a fu ll coverage of the visual
homomorphic model should require a study of the modulation transfer
functions of the peripheral visual system over the fu ll range of spatial
frequencies, this is not necessarily true, insofar as we are mainly
interested in properties b) and c ) . Since brightness contrast phenomena
are the result of neural processing, and, as we have already indicated,
are characterized by an attenuation of low frequencies, we w ill focus
our attention on the low frequency factors. Therefore we intend to
ignore somehow in our experiments the high frequency attenuation factor
of the system, and be satisfied with estimates of these characteristics
published previously and obtained by contrast threshold methods
[Campbell and Green 1965].
Our purpose here is to justify the model block-diagramed in Figure
6 , by demonstrating the linearity of neural interaction. Of course,
linearity is meant here in terms of retinal brightness, defined as the
logarithm of retinal intensity . At the same time we w ill provide
quantitative data on the modulation o f spatial frequencies resulting
from this neural interaction . In order to justify our approach, we need
to make clear the contributions o f the d ifferent parts of the peripheral
visual system in the context of the linear-homomorphic model, and
indicate how we w ill be able to neglect some portions of the system with
impunity.
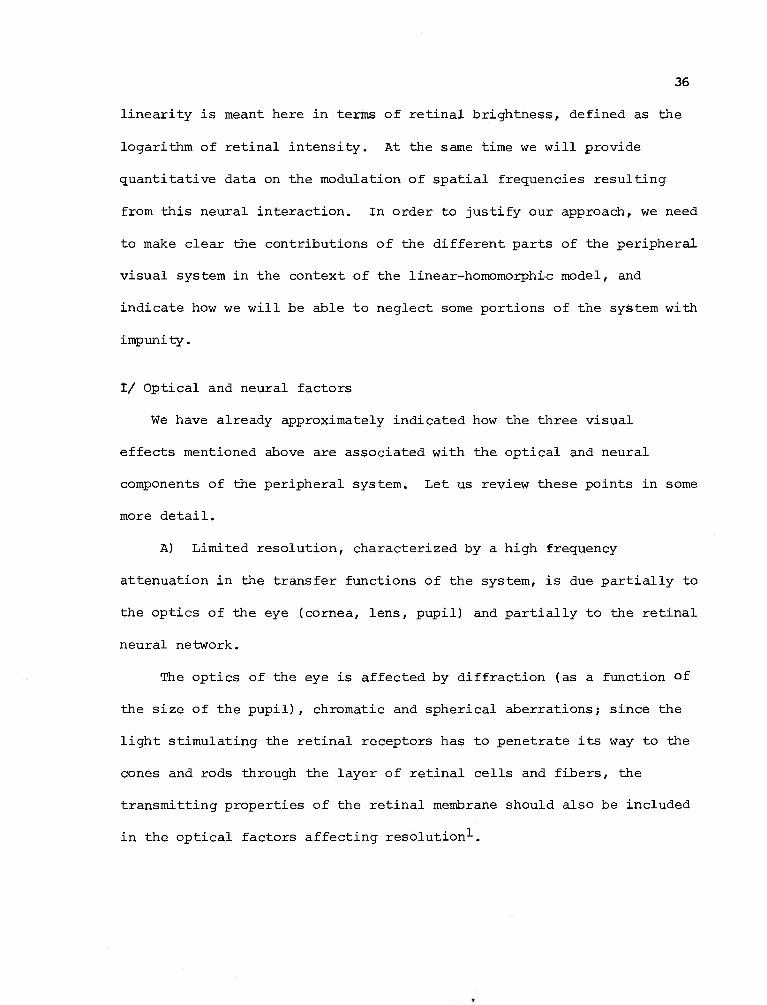
1 / Optical and neural factors
We have already approximately indicated how the three visual
effects mentioned above are associated with the optical and neural
components of the peripheral system. Let us review these points in some
more deta il .
A) Limited resolution, characterized by a high frequency
attenuation in the transfer functions o f the system, is due p artially to
the optics o f the eye (cornea, lens, pupil) and partially to the retinal
neural network.
The optics of the eye is affected by diffraction (as a function of
the size o f the p u p i l ) , chromatic and spherical aberrations; since the
light stimulating the retinal receptors has to penetrate its way to the
cones and rods through the layer o f retinal cells and fibers , the
transmitting properties o f the retinal membrane should also be included
in the optical factors affecting resolution^.
36

The retina being a fin ite mosaic o f discrete receptors, its
resolving power is affected by the density of receptors, the spatial
summation of neural activity and also, the ratio of receptors to nerve
fibers emanating from the retina .
B) The non-linear stimulus compression stage, associated in our
model to a logarithmic transformation of the retinal intensity stimulus,
is located after the optical stage of the system. The notion that this
data compression stage is located before a linear inhibition stage was
ju st ifie d in the previous chapter. However, modeling does not imply
that the block-diagram structure o f the model has to mimic the structure
of the neural mechanisms; all that is desired from a successful model is
to verify as well as possible the basic psychophysical facts . As we
have reported already, a quite different formal approach can be taken:
i t has been shown that m ultiplicative interaction mechanisms (labelled
shunting in h ib it io n ) , coupled with feedforward and feedback, are quite
equivalent in their modeling power to a m ultiplicative homomorphic
system [Sperling 1970]. Therefore, i t seems reasonable to take
advantage of the power of Fourier analysis by using the homomorphic
model approach. Let us note, before leaving the subject, that the claim
that shunting mechanisms of lateral interaction model more appropriately
visual adaptation [Sperling 19 70] is su p erfic ia l. After data
compression by a logarithmically sensitive stage, mapping of the
stimulus range into the fu ll range o f subjective brightness ( i .e .
1 Optical modulation by the isolated fovea has been recently studied on
an excised retina: [Ohzu et a l . 1972] . It has been found that the rods
and cones transfer the optical image in a manner sim ilar to a bundle of
optical f ib e r s . The frequency attenuation is of the same order than for
the eye optics (lens and cornea).
37

visual adaptation), is just a matter of appropriate bias and scaling
factors in the linear stage o f the homomorphic model; the automatic gain
control property o f the visual system is transparent to our model, which
does not include explic it provision for evaluating the proper bias and
scale factor, from the input stimulus. In other words, the homomorphic
model predicts outputs on an arbitrary scale of subjective brightness.
C) Brightness contrast is the main object of this study. We have
previously indicated how i t is related to neural interaction, and
characterized by low frequency attenuation. However, our model supposes
linearity of this neural mechanism. Proper experimental demonstration
o f the linearity property is necessary in order that the quantitative
data obtained on the basis o f this model be considered v alid . Our
experiment, soon to be described, allowed at the same time to evaluate
the linearity hypothesis and to collect quantitative measurements.
Having related the diverse psycho-physiological aspects o f the
peripheral visual system with the elements o f our model, we can consider
the possible experimental methods for measuring its quantitative
characteristics. But we now face the problem of estimating
experimentally the transfer functions o f two linear components o f a
non-linear system.
I I / Contrast threshold measurements
As we have seen in Chapter I I , the non-linear logarithmic stage
imbedded in the array of receptors, invalidates any attempt to evaluate
the overall transfer characteristics of the visual system. However, it
is possible to ignore the effect of the non-linear stage, when the
38

intensity amplitude (or contrast) of the stimulus is near threshold of
perception, since the non-linear transformation which is imbedded in the
retinal receptors, presumably introduces negligible distortion in this
lim it case. Therefore the threshold contrast sensitivity can
legitimately be tested for the total visual system, as a function of
spatial frequency. The results show generally a maximum contrast
sensitiv ity at about 6 to 10 cycles/degree, and an attenuation at higher
and lower frequencies. The reader w ill get a visual approximation of
these features, on a log-log scale , by observing the pattern of Figure 7,
after Campbell [1968]; this pattern pictures a sinusoidal grating
with frequency increasing exponentially along the horizontal ax is , and
with amplitude ( i .e . contrast) decreasing exponentially along the
vertical ax is , at a constant luminance level. The triangular contour
perceived when observing the pattern, outlines the threshold of contrast
perception in function o f spatial frequency, and therefore in function
o f the viewing distance. Not surprisingly , the contrast sensitivity
data reflects the combined properties of the modulation transfer
functions o f the eye optics and the neural network.
However, it is questionable to assert that these data coincide with
the m ultiplicative combination of the two transfer functions. This
point of view would imply that a sinusoidal grating is perceived when
its contrast is above a given threshold uniform for all frequencies.
This is quite debatable, because i t is not clear how a neural mechanism,
which is linear only as a f irst approximation, would be able to detect
relatively to the same threshold low frequency gratings and high
frequency gratings, which produce, for the same amplitude, very
39

different intensity gradients on the retina . In other words, the
additional non-linearity which undoubtedly appears at threshold
conditions, is likely to be a function of spatial frequency. In
particular , it has been demonstrated [Watebene et a l . 1968] that
threshold contrast sensitivity varies strongly with mean luminance, a
fact which implies non-linearity. On the other hand, as we shall see,
our experiment, as well as Davidson 's , indicate that linearity is well
verified for low frequency patterns. This suggests that spatial
frequency attenuation by neural inh ib itio n , and spatial frequency
detection, are not related in a simple way.
In addition, several recent studies tend to indicate that spatial
frequency detection is mediated by independant frequency channels ,
[Campbell et a l . 1970; Sachs et a l . 1971 ; Richards and Spitzberg
1972]. In particular , i t has been shown that adaptation to a given spat
ia l frequency raises the contrast threshold at the adaptive frequency, and
also that a sinusoidal grating is masked only by noise o f sim ilar
spatial frequency [Stromeyer and Julesz 1972].
Nonetheless, contrast sensitivity measurements allowed Campbell and
Green [1965] to estimate, by an innovative technique, the modulation
transfer function of the optics o f the eye. We w ill u tilize their data
in our model, and, despite the reservations presented above, we w ill
also consider their measure of the contrast sensitivity o f the neural
system at high frequencies as a good estimate o f the blurring
characteristics of the retina . There are two main reasons. The f irst
one lies in the d iffic u lty of employing brightness matching techniques
40

for high frequencies; this w ill be clear when we present the pattern
used in our brightness matching experiment for measuring frequency
attenuation by the neural interaction. The other reason is that a f irst
order approximation of the high frequency region w ill be su ffic ien t ,
given the more drastic discrepancies in our model which we w ill
encounter later and which can be attributed to non-linear edge effects
rather than to defective measurements. We w ill address these problems
in the next two chapters.
I l l / Transfer function of the visual optics
Campbell and Green were able to measure the contrast sensitiv ity ,
as a function o f spatial frequency, o f the neural system alone, by
creating directly on the retina , by interference methods, a grating
stimulus, which was therefore undistorted by the optics o f the eye.
Their results are plotted in Figure 8c and 8d, for frequencies above
approximatelly 6 cycles/degree. Values for lower frequencies were
ignored here, because it is for these low frequencies that contrast
threshold method are the more questionable^, and this is actually the
band of frequencies which is relevant for studies o f brightness contrast
phenomena and on which we w ill focus our attention next. One w ill
notice how the data, above 10 cycles/degree, is well fitted by a linear
2 For reasons of retinal anisotropy and non uniform ity, these studies
on frequency attenuation and sensitivity must be restricted to foveal
v ision , which implies a lim ited fie ld of view; as the reader can verify
for him self on Figure 7 , the detection of contrast for very low
frequencies is very uncertain. Campbell and Green also mentioned
d iffic u lt ie s in measuring the threshold contrast at very high
frequencies (above 40 cycles/degree), as fixation becomes d if f ic u lt with
very narrow fr in g e s .
41
CYCLES/DEG8 2915E1
CYCLES/DEC
la) (b)
8 291SE1C'lCLES. DEG
6 291b£ IClCLES/DEG
(c) (d)
F ig . 8 - Experimental data obtained by Campbell and Green [1965]:
modulation transfer function of the visual optics (a & b ) ,
contrast sensitiv ity of the visual neural system (c & d ) .
Modulation and sensitiv ity are plotted on a logarithmic scale ,
frequency on a linear (a & c) or logarithmic scale (b & d ) .

function when plotted on a logarithmic scale of contrast and a linear
scale of frequencies.
Campbell and Green also evaluated the resolving power of the total
visual system with external sinusoidal gratings of varying frequency and
varying contrast. As expected, the contrast sensitivity for external
gratings is lower than that for retinal fringes, as a result of
attenuation by the visual optics. Ignoring the non-linear stage, since
we are at threshold, and assuming that the overall contrast sensitivity
of the visual system is the product of the transfer function of the
optics by the contrast sensitivity of the neural system itself, the MTF
of the eye optics is obtained by the division of the two series of
results obtained through these two experiments (Figure 8a and 8b, for
a 2 mm pupil). This transfer function is similar to estimates obtained
previously by theoretical considerations of diffraction and optical
aberrations [Westheimer 1963; Fry 1963], by studies of light scatter on
the retina [Gubisch 1967], and optometric methods (reflection of light
on the retina); for a review of these researchs, see [Fry 1970]. The
transfer function there obtained is typical of a mediocre quality *
diffraction-limited optical system, but it shows, for a 2 mm pupil, less
attenuation than the neural system; in other words, the visual optics
appears to resolve better than the retinal receptors.
As results from the considerations above, we can regard these data
as a good estimate of the MTF of the eye optics. We will use it in our
model, although it will be more often for pointing out that its effect
can be neglected, than for actual computation...
43

A measurement of the transfer function of the neural network, in
the context of the non-linear model of Figure 6 , has already been
offered by Davidson [1968]. His experiment, however, did not
demonstrate convincingly the hypothetical linearity of neural
interaction, since he measured the modulation of individual sinusoidal
components, and not the modulation of combined frequency components.
But the notion of linearity actually involves two distinct properties;
additivity and scalab ility . Davidson's results indicated that the
modulation at low frequencies is quite independent of the contrast level
(that is of the amplitude of the target s in u so id e ). This is certainly
in agreement with the scalability hypothesis. We w ill test the other
aspect of linearity , perhaps the more important, namely additiv ity . In
order to prevent interference with other factors, we w ill use patterns
at a constant contrast and mean luminance level. "
Davidson employed a contrast matching technique: a reference
grating of frequency fo is compared to a test grating of frequency f , of
variable contrast. The contrast setting such that the two grating
appear subjectively to be of comparable contrast, is taken to indicate
the relative modulation of the two frequencies f and fo . Davidson
experimented over a wide range of frequencies, and at several levels o f
contrast. The gratings were sinusoides exponentiated for compensation
of the logarithm transformation stage, ignoring the negligible
effect of the visual optics. These results w ill be presented further,
in parallel with the data from our experiment, which we proceed to
describe now.
44
I V / Estim ating the tran sfer function o f the neural network

Since the frequency attenuation carried out by the neural
processing is revealed by the "il lu s io n ” of brightness contrast, we w ill
attempt a measurement of this modulation in a psychophysical experiment
involving a stimulus exhibiting some brightness contrast effect .
Futhermore, since our model is based on the hypothesis of linearity of
neural interaction , we rely on the analysis of stimulus patterns in
terms of sinusoidal components. Therefore, we w ill search for patterns
which are simple in terms of Fourier analysis , and which display
brightness contrast effects . The simplest is probably obtained by
composition of two sinusoides of frequency f and 3f , in phase, as
illustrated in Figure 14a. Since we want to estimate the modulation
property of the neural stage alone (linear system N) , we desire a
stimulus which produces a retinal brightness distribution (refer to
Figure 6) of the form
sin(2ir f x) + sin(6ir f x) . -
Therefore we want to preprocess this pattern of inten sities , in order to
compensate for the effect of the visual optics (linear system L) and
the logarithmic transformation stage. As is apparent from the data of
Figure 8b, the effect of the visual optics, in the band of frequencies
that we are going to study (approximately from 0 .1 to 4 cycles/degree),
can be considered as negligible for only two frequencies f and 3f . For
instance, the strongest relative attenuation for the stimuli used in our
experiment, would occur on the pattern o f highest base frequency (1 .2 3
cycle/degree, Figure 1 2 ) , and would have a value of about 95%; this is
negligible with regards to the intrinsic uncertainties of psychophysical
measurements. Therefore we w ill only compensate for the non-linear
45

stage at the receptors, by exponentiating the sinusoidal distribution of
intensities.
As can be verified on Figure 9a, an intensity distribution
exp( ki sin (2 it f x) + k 3 sin(6 it f x) ) ,
will produce fairly strong simultaneous brightness contrast when the two
sinusoidal components have the same amplitude k} = kg). On the other
hand, when the amplitude k 3 of the fast component is only a fraction of
that of the slow component (kj = 0.1 ki, in Figure 9b), the background
predominates completely. We might consider that as an over-cancellation
of the original brightness contrast effect. In a sense, a reversal of
the relative apparent brightness of bands exhibiting brightness contrast
on the original pattern, occurs between these two extreme cases. In
other words, there exists a value of k 3 , less than kj and greater than
0.1 ki, for which the intermediate bands have the same subjective
brightness. For this situation, the ratio ki/k3 will indicate the
relative amplification of the frequencies f and 3f.
An experiment was set up, with the knowledgeable help of Dr. William
Lee, in order to evaluate by this method the relative modulation of
frequencies f and 3f, for several values of the base frequency f. This
experiment is described in detail in Appendix A. Patterns of five base
frequencies were used, from 0.123 to 1.230 cycles/degree; three of them
are illustrated here (Figure 9a, 11a and 12a); in order to obtain
these exact angular frequencies, the photographic illustrations should
be viewed so that the horizontal field of view sustains an angle of
approximately 8.1 degree, that is to say from a distance of about 55 cm
46

(b)
Fig. 9 - Sinusoidal test pattern corresponding to the density functions:(a) k^ sin(2iT f x) + k^ sin(6iT f x) ,
(b) k1 sin (2 tt f x) + 0.1 k sin(6Tr f x) .
The background frequency f is approximately 0.50 cycles/degree at arm length viewing distance.

e.I4QBC-2 6 . 201 SCIcyci.es/ocq
(b) (c)
(a) Sinusoidal test pattern corresponding to the density function:
k^ sin(2n f x) + 0.5 k^ sin(6ir f x) .
Shows the result of compensating for brightness contrast the pattern of Fig. 9(a), according to the average data from the experiment (Appendix A).
(b) Experimental data for frequency modulation by neural interaction, showing the linear relationship, in the band of frequency tested, between log of modulation and log of frequency.
(c) Three transfer functions having the same property.

(a)
(b)
Fig. 11 - Same test pattern as Fig. 9, for a background frequency of approximately 0.123 cycles/degree: original (a) and compensated (b).
Vi?


a 29:i t i
C'iCLES/DEG
(a ) (b )
Cl CL ES/DEG
(c ) (d)
F ig . 13 - M o d u la t io n t r a n s f e r f u n c t io n and c o r re s p o n d in g l in e - s p r e a d f u n c t io n f o r n e u r a l i n t e r a c t i o n (s u b -s y s te m N on F ig . 6 ) :
(a & b ) Ig n o r in g h ig h fre q u e n c y a t t e n u a t io n by n e u r a l b l u r r ;
(c & d ) U s in g d a ta o f F ig . 8 d , f o r h ig h fre q u e n c y a t t e n u a t io n b y n e u r a l b l u r r .
T r a n s f e r f u n c t io n s a r e p l o t t e d on lo g - lo g s c a le . L in e -s p r e a d fu n c t io n s a r e p l o t t e d f o r a span o f one d e g re e o f v i s u a l a n g le .

(a ) (b)
( c ) (d )
F ig . 14 - S t im u lu s d e n s i t y ( l e f t ) and c o r re s p o n d in g p r e d ic t e d s u b je c t iv e b r ig h tn e s s ( r i g h t ) :
(a ) s in (2 7 r f x ) + s in (6 ? r f x ) ;
(c ) s in ( 2 i r f x ) + 0 .8 s in (1 0 i r f x) .
S c a le s o f d e n s i t y and b r ig h tn e s s a r e a r b i t r a r y . N o t ic e th e p r e d ic t e d b r ig h tn e s s c o n t r a s t e f f e c t .

As a m a t te r o f f a c t , th e v ie w in g d is ta n c e has no n o t ic e a b le
in f lu e n c e on th e b r ig h tn e s s c o n t r a s t e f f e c t , f o r th e s e p a r t i c u l a r
p a t t e r n s , as i s c o n firm e d by th e f in d in g s o f th e e jq o e rim e n t. The
r e s u l t s (T a b le I I I ) in d ic a t e t h a t th e r e l a t i v e m o d u la t io n o f f re q u e n c ie s
f and 3 f i s a p p ro x im a te ly a f a c t o r o f 2 , u n ifo r m ly o v e r th e ra n g e o f
f r e q u e n c ie s s tu d ie d . As a t r e n d , th e n e u r a l s ys te m a m p l i f ie s tw ic e as
much f re q u e n c ie s w h ic h a r e t h r i c e as l a r g e . . .O b v io u s ly , th e s e r e s u l t s
m ust be a c c e p te d w i t h in some m a rg in o f u n c e r t a in t y , as i s u s u a l in
p s y c h o p h y s ic a l e x p e r im e n ts ; th e d a ta i s c o l le c t e d in A p p en d ix A.
These f in d in g s im p ly t h a t th e p a t t e r n f o r w h ic h k 3 = k 1 /2 i s
com pensated f o r b r ig h tn e s s c o n t r a s t ; t h i s p a t t e r n i s i l l u s t r a t e d in
F ig u r e 1 0 a . Some re a d e rs m ig h t h av e r e s e r v a t io n s a b o u t th e
c a n c e l la t io n o f th e b r ig h tn e s s c o n t r a s t on th e p h o to g ra p h ic
i l l u s t r a t i o n . B e s id e s th e f a c t t h a t th e e x p e r im e n t was u n d er d i f f e r e n t
v ie w in g c o n d it io n s , th e r e s u l t s c l e a r l y i n d i c a t e , n o t o n ly a w id e
v a r ia n c e in th e ju d g em en t b e tw e en s u b je c ts (T a b le I I ) , b u t a ls o a
v a r i a t i o n o f ju d g em en t f o r a g iv e n s u b je c t and a g iv e n s t im u lu s
(T a b le I ) . The r e a d e r w i l l e a s i ly e x p e r ie n c e t h a t th e ju d g em en t on th e
r e l a t i v e b r ig h tn e s s o f th e t a r g e t b a n d s , may v a ry f o r a g iv e n p a t t e r n
w ith th e mode o f f i x a t i o n , in p a r t i c u l a r a t low f re q u e n c ie s (F ig u r e
1 2 b ) . D ep en d ing on w h e th e r one b a n d , o r th e o t h e r , o r th e w h o le f i e l d
i s o b s e rv e d , th e r e l a t i v e b r ig h tn e s s can be p e r c e iv e d v e r y d i f f e r e n t l y ,
and t h i s u n c e r t a in t y in c re a s e s as th e b as e fre q u e n c y i s lo w e r and th e
53
V/ Results of the psychophysical measurements

t a r g e t bands w id e r and f u z z i e r . Von B ekesy [1 9 6 8 ] in d ic a t e d a s i m i l a r
e f f e c t w i t h Mach bands o f s te e p lu m in a n c e g r a d ie n t s . T h is p ro b le m ,
com bined w i t h th e n e c e s s ity o f re d u c e d f i e l d o f v ie w ( fo v e a l v is io n )
s e ts th e p r a c t i c a l l i m i t s o f th e lo w e r f re q u e n c ie s to a b o u t 0 .1
c y c le s /d e g r e e (F ig u r e 1 1 ) . The h ig h e r f re q u e n c ie s a re a ls o l i m i t e d f o r
p r a c t i c a l re a s o n s , as i t becomes in c r e a s in g ly d i f f i c u l t to e x p re s s a
ju d g em en t o f r e l a t i v e b r ig h tn e s s f o r a h ig h c o n c e n tr a t io n o f f r in g e s
(F ig u r e 1 2 ) . I n c o n c lu s io n , th e e x p e r im e n ta l d a ta m ust be c o n s id e re d
o n ly as an a v e ra g e t r e n d . The r e s u l t s c o u ld p ro b a b ly be im p ro v ed in
te rm s o f u n c e r t a in t y , by more c a r e f u l l y a n a ly s in g th e e f f e c t o f th e mode
o f f i x a t i o n , and by t r a i n i n g th e s u b je c t i n t h i s r e s p e c t . We w i l l le a v e
to th e p s y c h o lo g is t th e ta s k o f e x p e r im e n t in g and in v e s t i g a t in g more
p r e c is e ly i n t h i s dom ain .
On o u r p a r t , we w i l l be c o n te n te d by th e f a c t t h a t th e d a ta w i l l be
s a t i s f a c t o r i l y c o n firm e d by com p en sa tio n e x p e r im e n ts on o th e r p a t t e r n s
(n e x t c h a p t e r ) , and t h a t th e y a re f u l l y c o n s is te n t w ith th e r e s u l t s o f
D av id so n [1 9 6 8 ] , b as ed on th e same m odel and o b ta in e d th ro u g h a
d i f f e r e n t e x p e r im e n t , in d i f f e r e n t v ie w in g c o n d it io n s ( b r i e f l y f la s h e d
a c h ro m a tic p h o to p ic f i e l d s v ie w e d m o n o c u la r ly ) . As we h ave s e e n ,
D av id so n e s t im a te d th e m o d u la t io n o f i n d iv id u a l s in u s o id a l com ponents;
we h av e e s t im a te d th e r e l a t i v e a m p l i f i c a t io n o f added s in u s o id a l
com ponents , in q u i t e d i f f e r e n t i l l u m i n a t i o n and c o n t r a s t c o n d it io n s .
T h a t th e r e s u l t s b e s im i l a r can c e r t a i n l y b e c o n s id e re d as a good
i n d ic a t io n o f th e l i n e a r i t y p r o p e r ty o f th e n e u r a l p r o c e s s in g . We w i l l
in d ic a t e more e v id e n c e i n th e com ing c h a p te r .

I f H ( f ) i s th e m o d u la t io n t r a n s f e r fu n c t io n w h ic h we h ave
s u p p o s e d ly e s t im a te d i n t h i s e x p e r im e n t , th e n f o r a band o f low
f r e q u e n c ie s , th e fo l lo w in g r e l a t i o n h o ld s a p p ro x im a te ly :
H (3 f ) = 2 H ( f ) .
S i m i l a r l y , D a v id s o n 's d a ta show t h a t , i n th e same ra n g e , th e r e l a t i o n
H (3 f ) = 2 .2 H ( f ) . ,
i s a p p ro x im a te ly v e r i f i e d . H ie r e a d e r w i l l re c o g n iz e t h a t th e s e
e q u a tio n s e x p re s s a p o w er law r e la t io n s h i p b e tw e en fre q u e n c y and
m o d u la t io n , w h ic h i s c h a r a c t e r iz e d b y a l i n e a r r e la t io n s h ip b e tw e en th e
lo g a r i th m o f th e m o d u la t io n H ( f ) and th e lo g a r i th m o f th e fre q u e n c y f
( [D a v id so n 1 9 6 8 , F ig u r e 1 0 ] ; o u r d a ta , F ig u r e 1 0 ) .
I t i s i n t e r e s t i n g to n o t i c e , a lo n g w it h D r . T .G . S tockham , J r . , t h a t
th e in d ep e n d an ce ( w i t h in c e r t a i n l i m i t s ) o f th e m o d u la t io n o f low
f r e q u e n c ie s fro m th e s p a t i a l s t r e t c h in g o f th e c o rre s p o n d in g im a g e , as
i t r e s u l t s fro m th e pow er la w r e l a t i o n , im p l ie s th e n ic e p r o p e r ty t h a t
th e r e l a t i v e b r ig h tn e s s o f th e s iz a b le com ponents o f th e v is u a l
e n v iro n m e n t w i l l n o t v a ry w i t h th e v ie w in g d is ta n c e .
We now p ro c e e d to v e r i f y w h e th e r th e e x p e r im e n ta l d a ta a c c u r a te ly
p r e d ic t s b r ig h tn e s s c o n t r a s t e f f e c t s , f o r more com plex s t i m u l i ; t h a t i s
to say w h e th e r th e l i n e a r i t y h y p o th e s is i s v e r i f i e d i n a more g e n e ra l
s e n s e .
55

THE L IN EA R ITY OF NEURAL
INTERACTION
The agreem en t b e tw e en D a v id s o n 's d a ta and o u r r e s u l t s i s an
in d ic a t io n o f th e l i n e a r i t y o f th e i n h i b i t o r y i n t e r a c t i o n , s in c e in th e
f i r s t case th e m o d u la t io n o f s in g le fre q u e n c y com ponents was m easu red ,
i n th e second case th e r e l a t i v e m o d u la t io n o f two added fre q u e n c y
com ponents was t e s te d . I t a ls o in d ic a t e s t h a t such c o n d it io n s as
i l l u m in a t i o n l e v e l , do n o t a l t e r s i g n i f i c a n t l y th e fu n d a m e n ta l
c h a r a c t e r i s t i c o f th e t r a n s f e r f u n c t io n o f th e n e u r a l s y s te m , nam ely
t h a t lo g a r i th m o f fre q u e n c y and lo g a r i th m o f m o d u la t io n a re ro u g h ly
p r o p o r t io n a l , a t l e a s t i n th e ra n g e o f lo w f r e q u e n c ie s . I t i s now
d e s i r a b le t o t e s t more g e n e r a l ly th e m odel and th e d a ta , in o r d e r to
v e r i f y w h e th e r th e im p o r ta n t p r o p e r ty o f l i n e a r i t y i s s t i l l v a l i d f o r
le s s r e s t r i c t e d c o n d it io n s on th e s t im u lu s p a t t e r n .
1 / E x t r a p o la t io n o f th e t r a n s f e r fu n c t io n s
S in c e we a s s o c ia te th e lo w fre q u e n c y a t t e n u a t io n b y th e n e u r a l
system w it h l i n e a r in h i b i t o r y i n t e r a c t i o n , and b ecau se n e u r a l i n h i b i t i o n
p ro b a b ly has p h y s ic a l l y a f i n i t e e x t e n t , t h i s lo w fre q u e n c y a t t e n u a t io n ,
as e s t im a te d i n th e p re c e d in g c h a p te r , s h o u ld o n ly a p p ly o v e r a l i m i t e d
ra n g e . S e v e r a l s tu d ie s h ave in d ic a t e d t h a t th e s p re a d o f th e i n h i b i t o r y
a c t io n i s p r o b a b ly no more th a n 10 to 20 m in u te s o f v is u a l a n g le
[Growney and W e in s te in 1 9 7 2 ] . T h e r e fo r e , we may re a s o n a b ly assume t h a t
CHAPTER IV

th e t r a n s f e r fu n c t io n o f th e i n h i b i t o r y sys tem is f l a t f o r fre q u e n c y
h ig h e r th a n , say 10 c y c le s p e r d e g re e ( t o be c o n s e r v a t iv e ) . Such
e s t im a te s can b e o b ta in e d , f o r in s ta n c e , fro m t h e o r e t i c a l c o n s id e r a t io n s
on an id e a l i z e d g a u s s ia n l i n e s p re a d f u n c t io n h a v in g some 20 m in u te s o f
i n h i b i t o r y s p re a d [F ry 1 9 7 0 ] .
We v ie w , h e r e , n e u r a l i n h i b i t i o n q u i t e s e p a r a t e ly fro m n e u r a l
sum m ation . O f c o u rs e , i t i s o n ly a t h e o r e t i c a l c o n v e n ie n c e to s e p a r a te
th e n e u r a l s ys tem N (F ig u r e 6) i n t o th e cascad e o f two s u b -s y s te m s : a
r e t i n a l sum m ation s u b -s y s te m , w i t h h ig h fre q u e n c y a t t e n u a t io n ; and a
n e u r a l i n h i b i t o r y s u b -s y s te m , w ith lo w fre q u e n c y a t t e n u a t io n . The t o t a l
m o d u la t io n f r a n s f e r f u n c t io n o f th e n e u r a l s ys tem w o u ld be th e
m u l t i p l i c a t i v e c o m b in a tio n o f th e s e two M T F 's . B u t i t seems c le a r t h a t ,
a lth o u g h th e two p ro c e s s e s a re i n f a c t p h y s io lo g ic a l l y com bined , t h e i r
m o d u la t io n e f f e c t s on s p a t i a l f re q u e n c ie s a re q u i t e s e p a r a b le , and t h a t
o u r t h e o r e t i c a l d ich o to m y is j u s t i f i e d . We d is c u s s e d a lr e a d y i n
C h a p te r IV th e re as o n s f o r u s in g th r e s h o ld c o n t r a s t d a ta f o r th e MTF o f
th e sum m ation s u b -s y s te m , c h a r a c t e r iz e d by b l u r and lo s s o f r e s o lu t io n .
L e t us now c o n s id e r th e in h i b i t o r y s u b -s y s te m , and re v ie w how much we
know a b o u t i t a f t e r o u r e x p e r im e n t .
C l e a r l y , th e kno w led g e o f a pow er la w f o r th e band fro m 0 .1 to 4
c y c le s p e r d e g re e , and o f u n ifo r m a t t e n u a t io n f o r f re q u e n c ie s h ig h e r
th a n 10 c y c le s /d e g r e e , does n o t p e r m it a u n iq u e d e f i n i t i o n o f th e
1 T h is te rm i s m eant h e re to in c lu d e a l l f a c to r s a f f e c t i n g th e r e s o lu t io n o f th e s u b je c t iv e image, t h a t i s : f i n i t e r e c e p to r m o saic (s in c e t h i s i s e q u iv a l ie n t to summing w i t h in th e w indow o f one r e c e p t o r ) , and a c t u a l n e u r a l sum m ation a t d i f f e r e n t le v e ls o f th e r e t i n a l and n e u r a l n e tw o rk .
57

p o s s ib le t r a n s f e r f u n c t io n . H o w ever, th e s i t u a t i o n i s n o t so b a d ,
b ec au s e th e band o f f re q u e n c ie s b e tw e en 0 .1 and 4 to 5 c y c le s /d e g r e e
r e a l l y i s th e im p o r ta n t r e g io n w i t h re g a r d t o b r ig h tn e s s c o n t r a s t
e f f e c t s ; e x t r a p o la t io n i n o th e r re g io n s s h o u ld o n ly h ave a m in o r e f f e c t .
F o r in s ta n c e , F ig u r e 10c p ic t u r e s th r e e p o s s ib le such t r a n s f e r
f u n c t io n s ; th e in te r m e d ia te c u r v e , a ls o p l o t t e d on F ig u r e 1 3 a , le v e ls
o f f a t a b o u t 10 c y c le s /d e g r e e , w h ic h i s a b o u t th e p e a k o f D a v id s o n 's
d a ta [1 9 6 8 , F ig u r e 1 0 ] , b u t th e lo w fre q u e n c y a t t e n u a t io n i s a l i t t l e
le s s s te e p f o r o u r d a ta . The c o r re s p o n d in g l i n e s p re a d f u n c t io n ,
re p r e s e n te d on F ig u r e 13b f o r a span o f one d e g re e o f v is u a l a n g le , has
an i n h i b i t o r y s p re a d o f 15 to 20 m in u te s o f a r c .
We w i l l now a t te m p t t o t e s t i n f u r t h e r d e t a i l th e l i n e a r i t y
h y p o th e s is o f n e u r a l i n t e r a c t i o n , b y v e r i f y i n g th e p r e d i c t io n o f th e
m odel on more com plex p a t t e r n s e x h ib i t in g th e d iv e r s e b r ig h tn e s s
c o n t r a s t e f f e c t s (Mach b a n d s , s im u lta n e o u s b r ig h tn e s s c o n t r a s t , Herm ann
g r id e f f e c t ) . As we m e n tio n e d i n th e in t r o d u c t io n , g iv e n th e com pu tin g
t o o l a t o u r d is p o s a l , a n a t u r a l m ethod f o r t e s t i n g o u r d a ta i s th e n u l l
e x p e r im e n t . S in c e th e com ponents o f th e lin e a r -h o m o m o rp h ic m odel o f th e
v is u a l sys tem a re i n v e r s i b l e , one s h o u ld o b s e rv e c a n c e l la t io n o f th e
b r ig h tn e s s " i l l u s i o n " on p a t t e r n p re -p ro c e s s e d by th e c o m p en sa tio n
system b lo c k d ia g ra m e d on F ig u r e 2 4 a , a f t e r S tockham [1 9 6 8 b , 1 97 2 ] .
H o w ever, th e r e a r e some unknowns in th e p a ra m e te rs o f o u r s ys te m .
T h is im p l ie s t h a t , in o r d e r to draw v a l i d c o n c lu s io n s fro m th e
fo r th c o m in g e x p e r im e n ts , we w i l l h av e to s e le c t p a t t e r n s such t h a t th e
e f f e c t o f th e n e c e s s a ry e x t r a p o la t io n s b e m in im iz e d . The d u b io u s
re g io n s a re :
58

-T h e v e r y lo w f r e q u e n c ie s ( le s s th a n 0 .1 c y c le s /d e g r e e ) , f o r w h ic h
i t i s d i f f i c u l t to e x p e r im e n t;
-T h e in te r m e d ia te f r e q u e n c ie s (fro m 6 to 10 c y c le s /d e g r e e ) , w here
b r ig h tn e s s m a tc h in g e x p e r im e n ts become d i f f i c u l t and w h ere n e u r a l
i n h i b i t i o n and n e u r a l b lu r b e g in to i n t e r f e r e .
We a ls o m e n tio n e d i n th e p re v io u s c h a p te r , t h a t d a ta f o r h ig h
f r e q u e n c ie s a r e b ased on th r e s h o ld c o n t r a s t e x p e r im e n ts , and t h e r e f o r e
can o n ly be c o n s id e re d as f i r s t o r d e r a p p ro x im a tio n o f f re q u e n c y
a t t e n u a t io n d a t a . In v ie w o f th e s e re p e a te d c a u t io n s , o u r e x p e r im e n ts
w o u ld seem to be b ased on v e r y p r e c a r io u s fo u n d a t io n s . L e t us r e p e a t
t h a t , i n f a c t , th e band o f f r e q u e n c ie s f o r w h ic h we h ave been a b le to
c o l l e c t d a ta is th e fu n d a m e n ta l band as f a r as b r ig h tn e s s c o n t r a s t
e f f e c t s a r e c o n c e rn e d .
We p ro c e e d to d e m o n s tra te t h i s w i t h v e r y s im p le p a t t e r n s ,
d is p la y in g th e c la s s i c a l b r ig h tn e s s c o n t r a s t e f f e c t s , and c o n ta in in g
o n ly a few fre q u e n c y com ponents . T h e r e f o r e , th e s e p a t t e r n s w i l l be
sm ooth , w ith o u t edges; as a r e s u l t , we w i l l a v o id a s u s p e c te d cause o f
2n o n - l i n e a r i t y i n th e n e u r a l i n h i b i t i o n m echanism .
I I / B r ig h tn e s s c o n t r a s t e f f e c t s w i t h sm ooth p a t t e r n s
We a r e g o in g to e x p e r im e n t w i t h p a t t e r n s c o n ta in in g o n ly fre q u e n c y
T h i s q u e s t io n has been q u a l i t a t i v e l y s tu d ie d , i n th e c o n te x t o f n e u r a l i n t e r a c t i o n m echanism s [F r y 1 94 8 ; O 'B r ie n 1 95 8 ; R a t l i f f 1 9 7 1 ] . D a v id s o n in d ic a t e d t h a t edge e f f e c t s w e re in c o m p a t ib le w i t h th e q u a n t i t a t i v e p r e d ic t io n o f th e hom om orphic ( i . e . l o g - l i n e a r m odel o f r e t i n a l i n t e r a c t i o n [D a v id so n and W h ite s id e 1 9 7 1 ]) . We w i l l a d d re s s t h i s s u b je c t f u r t h e r (C h a p te r V ) , r e s t r i c t i n g o u r a m b it io n h e re t o sm ooth p a t t e r n s .
59

com ponents w i t h in th e band w here o u r d a ta has been c o l le c t e d . We w i l l
a ls o ig n o r e th e e f f e c t o f o p t i c a l and n e u r a l b l u r , i n th e same m anner
and f o r same re a s o n s as in th e e x p e r im e n t d e s c r ib e d in C h a p te r IV .
T h e r e f o r e , in t h i s p a r t i c u l a r c a s e , th e m odel i s s i m p l i f i e d to a
lo g a r i th m ic t r a n s fo r m a t io n fo l lo w e d by a l i n e a r i n h i b i t i o n s y s te m , f o r
w h ic h a l l th e t r a n s f e r fu n c t io n s o f F ig u r e 10c a re e q u iv a le n t .
The f o l lo w in g e x p e r im e n ts have n o t been c o n d u cted on s e v e r a l
s u b je c ts ., , and th e comments p re s e n te d h e re r e l y on th e s u b je c t iv e
ju d g em en t o f th e a u th o r as th e u n iq u e o b s e r v e r . The p s y c h o p h y s io lo g is t
w o u ld p r o b a b ly d e s ir e m ore c a r e f u l e x p e r im e n ta l p ro c e d u re s , b u t , as we
h ave in d ic a t e d , o u r p o in t o f v ie w i s o f a com pu ter s c i e n t i s t , and th e s e
s u b je c t iv e ju d g em en ts w i l l s u f f i c e t o p o in t o u t new in t e r e s t i n g r e s u l t s .
A) B r ig h tn e s s c o n t r a s t
I n th e c o n te x t o f o u r s im p l i f i e d m odel ( i . e . lo g t r a n s fo r m a t io n
fo l lo w e d by h ig h p ass l i n e a r system o f n e u r a l i n t e r a c t i o n , F ig u r e 2 4 b ) ,
i t i s c o n v e n ie n t to c o n s id e r p a t t e r n s h a v in g an i n t e n s i t y d i s t r i b u t i o n
o f th e fo rm
I (x ) = exp ( k D ( x ) ) ,
w h ere th e d e n s ity d i s t r i b u t i o n D ( x ) i s a l i n e a r c o m b in a tio n o f a few
s in u s o id a l te rm s . By v i r t u e o f th e s im p l i f i e d m o d e l, D ( x ) i s c o n s id e re d
t o be a ls o th e r e t i n a l b r ig h t n e s s , i . e . th e lo g a r ith m o f th e r e t i n a l
i n t e n s i t y (F ig u r e 6 ) . Then D ( x ) i s th e in p u t to th e l i n e a r sys tem o f
We use h e re th e p h o to g ra p h ic te r m in o lo g y , w h ic h d e f in e s th e d e n s ity as th e lo g a r ith m o f th e i n t e n s i t y [S tockham 1 9 7 2 ] . O ur te rm in o lo g y f o r brightness a t d i f f e r e n t s ta g e s o f th e v is u a l m odel (F ig u r e 6 ) , i s d e f in e d in C h a p te r I I .
60

n e u r a l i n t e r a c t i o n , and th e c o rre s p o n d in g o u tp u t B (x ) i s th e s u b je c t iv e
b r ig h t n e s s . S in c e , th ro u g h o u t t h i s s e c t io n , D (x ) c o n ta in s o n ly a few
fre q u e n c y com ponents, th e c o m p u ta tio n o f B (x ) in v o lv e s o n ly s im p le
m a th e m a tic a l c o n s id e r a t io n s .
O ur e x p e r im e n t in d ic a t e d t h a t f o r th e s t im u lu s p a t t e r n w ith d e n s ity
D ( x) = s in ( 2 it f x) + 2 s in ( 6 it f x) . .
th e b r ig h tn e s s c o n t r a s t was th e r e s u l t o f th e r e l a t i v e a m p l i f i c a t io n by
a f a c t o r o f a b o u t 2 o f th e f re q u e n c ie s f and 3 f . In o th e r w o rd s , th e
s u b je c t iv e b r ig h tn e s s i s p r e d ic t e d to be a p p ro x im a te ly
B (x ) = s in ( 2 tt f x) + 2 s in ( 6 u f x) .
T h is i s sum m arized on F ig u re 14a and 1 4b .
I f we c o n s id e r now th e s t im u lu s p a t t e r n w ith d e n s ity
D(x ) = s i n ( 2 tt f x) + 0 . 8 s in (1 0 tt f x) ,
th e a p p ro x im a te pow er la w f o r fre q u e n c y m o d u la t io n w o u ld p r e d i c t a
r e l a t i v e a m p l i f ic a t io n by a f a c t o r o f 2 . 7 5 o f th e f r e q u e n c ie s f and 5 f ,
i . e . a p r e d ic t e d s u b je c t iv e b r ig h tn e s s
B (x ) = s i n ( 2 tt f x) + 2 . 2 s in (1 0 tt f x ) ,
as i l l u s t r a t e d in F ig u re 14c and 1 4 d . The b r ig h tn e s s c o n t r a s t e f f e c t
i s v i s i b l e on F ig u r e 15a ( f = 0 . 3 7 c y c le s /d e g r e e ) and 16a ( f = 0 . 1 2 3
c y c le s /d e g r e e ) . I n o r d e r to t e s t t h is p r e d i c t io n , th e com pensated
p a t t e r n s c o r re s p o n d in g to th e d e n s ity d i s t r i b u t i o n
D 1 (x ) = s i n (2 it f x) + 0 . 8 / 2 . 7 5 s i n (10 n f x ) ,
a re p re s e n te d in F ig u r e 15b and 16b r e s p e c t iv e ly . F o r th e a u th o r , as
one o b s e r v e r , th e c a n c e l la t io n does n o t seem e x a c t ly s u f f i c i e n t ,
p r i n c i p a l l y i n F ig u r e 15b ; b u t f o r th e same o b s e r v e r , i t i s a ls o th e
61

Fig. 15 - Test pattern corresponding to the density function of Fig. 14c,for a background frequency f of about .37 cycles/degree:original (a) and compensated (b).

(b )
Fig. 16 - Test pattern corresponding to the density function of Fig. 14c,for a background frequency f of about 0.12 cycles/degree:original (a) and compensated (b).

case for Figure 10a, presumably compensated according to the average of
10 observers. This might probably be a matter of individual
differences, and a more carefully study would require that the different
stimulus patterns be tested in the same conditions by the same
observers. We will leave this for further studies, and we will retain
the first order conclusion that, so far, results are roughly in
agreement with the linearity hypothesis.
B) Mach bands
Mach bands can be obtained on smooth patterns with a proper change
in spatial inflection of the intensity. Such is the case for the
density function:
D(x) = sin(2 ir f x) . (1 - cos(4 ir f x)) ,
where an all-positive sinusoide of frequency 2f is modulated by a
sinusoide of frequency f (Figure 17a). As linear analysis will show
easily, the resulting product actually contains only the frequency terms
f and 3f. Accordingly, the different amplification of these two
components by the neural system results in Mach bands (Figure 17b), ,
which are readily observable on Figure 18a, although the effect is
weaker than for usual Mach bands (Figure 1). This effect is analogous
to the "brightness paradox" studied by Bergstrom [1967, 1970], and is
exactly a Mach band effect, that is to say resulting from intensity
pattern curvature rather than background induction (superficial
distinction, however). Inverse modulation blurs out the bands, as can
be seen on Figure 18b, thereby cancelling completely the brightness
phenomenon.


Test pattern corresponding to the density function of Fig. 17a,Fig. 18 -for a background frequency of about 0.50 cycles/degree:original (a) and compensated (b).

(b )
Fig. 19 - Test pattern corresponding to the density function of Fig. 17c,for a background frequency f of about 0.25 cycles/degree:original (a) and compensated (b).

D(x) = sin(2 ir f x) . Cl - cos (8 it f x) ) ,
containing the frequency terms f, 3f and 5f, exhibits at the same time
Mach bands and simultaneous brightness contrast, as observable on Figure
19a, and as predicted on Figure 17d. The effect also appears to be
approximately cancelled by inverse modulation (Figure 19b).
One might notice that the Mach band effect is more strongly
compensated than simultaneous brightness contrast, but this could
probably result from the fact that, for smooth patterns, the Mach band
effect is weaker than the brightness contrast effect. So far, the
linearity hypothesis appears to be generally well verified, according to
the prediction of the model, and as confirmed by cancellation
experiments.
C) Hermann grid effect
Let us now turn to the two-dimensional grid effect, noticing that
similar phenomena can be obtained from smooth patterns. An interesting
mathematical property of the grid patterns displaying this classical
"illusion" (Figure 4), is that the intensity function is separable, that
is to say is the product of two independant functions of the spatial
variables x and y:
I(x,y) = Ii(x) . I2 (y)-
Consider now the following density function:
D(x,y) = (1 + cos (.2 tt f jx) ) . Cl + cos (2 ir f y) ) ,
which mathematically describes a surface similar to an infinite
corrugated egg crate (Figure 21a). The corresponding stimulus pattern
A slightly different.density function (Figure 17c),

is illustrated in Figure 22a, for the negated density function
-D(x.y) . Sign reversal of the density function, as far as the
mathematics of our model are concerned, merely results in the physical
inversion of black and whites, since the neural system mapping D(x) into
B(x) is presumably linear. A bright grid is illustrated in Figure 22a
rather than the symmetric dark grid^, because the gloss of photographic
illustrations, makes the effect of brightening at the intersections of
the dark grid, less observable than the converse effect for a bright
grid.
The darkening at the intersections of the bright grid, observable
on Figure 22a, is predicted by the linear model of inhibition (Figure
21b). These results are easy to compute, as a consequence of the
separability of the density functions, since the Fourier transform of a
separable function is also separable. Figure 20 illustrates this
property, and shows the frequency components of the density functions:
(1 + a cos (2 tt f x)) . (1 + a cos (2 tt f y)) ,
(1 + a cos (2 tt fl x)) . (1 + b cos (2 tt f 2 y) ) .
Let us consider, first, the case where the separable functions in x and
y have same frequency f. Then, the radial frequency terms for the
two-dimensional grid are f and as shown on Figure 20a. One will
^ The patterns previously presented have totally symmetric density functions, and therefore, there should be, in theory, a complete symmetry between bright and dark regions. However, the reader will observe that it is not exactly the case: bright bands are generally more narrow than "symmetric" dark counterparts. This might be interpreted as an indication that the notion of logarithmic transformation at the level of retinal receptors is approximate, as we mentioned in Chapter II.


(C)
F ig . 21 - P l o t on an a r b i t r a r y s c a le o f :
(a) Separable stimulus density:(1 + cos(27r f x)) • (1 + c o s ( 2 tt f y )) ;
(b) Predicted subjective brightness (notice brightness contrast effect at the intersections of the grid);
(c) Compensated stimulus density.

• • • • • • • •• • • • • • • •
• • § # « • • •
• # $ # • # # +
• • • • m m m m m m m
(a) (b)
(c )
F ig . 22 - T e s t p a t t e r n c o r re s p o n d in g t o th e s e p a r a b le d e n s i t y f u n c t io n o f F ig . 2 1 : o r i g i n a l ( a ) , com pensated (b ) and o v e r-c o m p e n s a te d ( c ) . N o t ic e t h a t th e g r id in t e r s e c t io n s a re d a r k e r i n ( a ) , and b r i g h t e r i n ( c ) .

note on this diagram that the ration of this two frequency components is
equal to a. Therefore the relative modulation of the frequencies f and
i ~ 2 f is directly related to the coefficient a. We will use this
property to generate in a simple way a separable smooth grid for any
ratio of the frequencies f and f ~ 2 f.
Our experimental power law, would predict a relative amplification
of these two frequencies by a factor of 1.25 (Figure 10b). In other
words, to the density function
D(x,y) = (1 + cos(2 tt f x) ) . (1 + cos(2 tt f y) ) ,
plotted on Figure 21a and displayed on Figure 22a, would correspond
the subjective brightness
B(x,y) = (1 + 1.25 cos(2 tr f x) ) . (1 + 1.25 cos (2 tt f y) ) ,
plotted on Figure 21±>. To obtain these expressions, we have ignored DC
components in D(x,y) and B(x,y). These effects are qualitatively
verified on Figure 22a. In order to confirm quantitatively, we apply
the usual compensation procedure. If the relative amplification factor
is 1.25, as implied by the experimental data, then the density
distribution of Figure 21d:
D 1 (x,y) = (1 + 0.8 cos(2 tt f x) ) . (1 + 0.8 cos(2 tt f y) ) ,
should exhibit cancellation of the grid effect. The compensation
appears to be quite effective (Figure 22b). An excessive compensation
is obtained on Figure 21d, for a = 0.7, as the intersections of the
grid now seem much brighter. These findings indicate that for the two
dimensional radial frequencies f and / T f, the relative amplification is
of the order of 1.25 = 1/0.8, which confirms our prior results.
73

It is possible to utilize a similar stimulus pattern in order to
test our experimental data, which:showed the relative amplification of
frequencies f and 3f. Figure 20b illustrates the generalization to a
separable grid such that the two independant functions of the spatial
variables x and y have different frequencies and different amplitudes.
Then, it is easy to observe that, in order to test radial frequencies f
and 3f, it suffices to generate the pattern with density function:
D(x,y) = (1 + cos(2 T7 f x) ) . (1 + cos(4 /2 tt f y )),
since the frequency terms involved will then be f, 2 Z2- f and 3f. Such
a pattern is illustrated in Figure 23, and shows the expected grid
effect. In order to compensate for the relative amplification of these
three frequency components (a- factor of 2 for 3f and f; a negligible
factor of 1.05 for 3f and 2 /2 f), one displays the density pattern:
D'(x,y) = (1 + 0.995 cos(2 ir f x) ) . (1 + 0.5 cos(4 / 2 ~’ir f y) ) ,
as on Figure 23b. Over-compensation is obtained on Figure 23c. Here
again, the predicted cancellation is verified.
D) Conclusions
The various brightness contrast effects obtainable with smooth
patterns seem to be in good agreement with the experimental power law,
as results from cancellation experiments. We noticed, however, that
Mach band effects and grid effects were more strongly cancelled than
simultaneous brightness contrast effects. We mentioned that .this could
be attributed to the fact that the former are weaker effects than the
latter. Cancellation experiments, which are not illustrated here,
showed better results for the compensation of simultaneous brightness

(c)
F ig . 23 - T e s t p a t t e r n c o r re s p o n d in g t o th e s e p a r a b le d e n s i t y fu n c t io n s
(1 + cos (2 i r f x ) ) • (1 + c o s ( 2 ir 2 /2 f y ) ) .
O r i g i n a l ( a ) , com pensated (b ) and o v e r-c o m p e n s a te d ( c ) .

contrast with a slightly steeper attenuation of low frequencies (i.e. a
slope 10% steeper on a log-log scale). Such a value is very close to
Davidson's data. Also, we noticed that it is for the patterns of Figure
14c, 15a and 16a., that the brightness compensation is the least
successful; this pattern contains frequencies f and 5f. Referring to
the plot of Figure 10b, one will realize that, if we assume a power law
modulation at low frequencies (as Davidson's data and ours suggest)j
then experimental error should be less when comparing the modulation of
frequencies f and 5f, than when comparing that of frequencies f and
3f. The reason is that errors in estimating the slope of a straight
line from pairs of points, diminish when the points are further apart.
Then, in brightness matching experiments with the family of patterns
containing the frequencies f and n f (where n is odd), one should
utilize the largest possible values of n. However, one is limited
practically, because patterns for large n, containing (n-l)/2 bands per
half-period of the background, become confusing for the observer. Also,
these remarks are valid only if a power law, i.e. a linear relation on
a log-log scale, is sufficiently well verified.
However, we will estimate that our results are consistent enough,
to consider that the linearity hypothesis is satisfactorily verified in
a limited band of frequencies (approximately, from 0.1 to 4
cycles/degree). Obviously, there is room for more precise and more
extensive experimentation, but they were not pursued in the frame of the
present study. The concluding chapter indicates the type of equipment
which would be desirable for more accurate and more efficient
experiments, in the same line of research.

Considering our results conclusive enough for smooth patterns, we
will turn now to more complex stimuli. In particular, we are now
interested in patterns having more intricate frequency contents, and
also edges (since they are fundamental features of the visual
environment) .
Ill/ Pattern with edges
We encounter now the problem that we have addressed in some
detail before; namely that the only data available for high frequency
attenuation is related to threshold of contrast. Thus, in order to
minimize errors due to these extrapolated data, we will consider a
pattern such that the bulk of its spectral energy is located within the
band of frequencies that we have well explored. In fact, any pattern
exhibiting strong brightness contrast will have its energy concentrated
at low frequencies. But we can be more restrictive, and, for instance,
generate a pattern with edges closely related to one of our smooth
patterns. As we already noticed, the pattern corresponding to the
density function
D(x) = sin(2 tt f x) . (1 - cos(8 tt f x)) ,
illustrated on Figure 17c and 19a, has only three frequency components
(f, 3f, 5f); its magnitude Fourier spectrum is plotted on Figure
The spectra plotted here and thereafter are digital discrete spectra, since we deal with, digital discrete pictures. As a result of the resolution of the pictures processed here, the Fourier spectrum is computed only for 1024 equidistant frequencies, from DC to the Nyquist frequency. Because the plotting program extrapolates linearly between data points, isolated frequency components are actually plotted as triangular spikes.

If we modulate the background sinusoide, of frequency f, by an
all-positive square wave of pseudo frequency 4f, we obtain the density
pattern plotted on Figure 29a, and displayed on Figure 25a. This
stimulus exhibits sharp edges and strong simultaneous contrast, which is
induced by the sinusoidal background at frequency 0.24 cycles/degree.
The reader will verify on Figure 25c that the main components of this
patterns are still the frequencies f, 3f and 5f, as in the
corresponding smooth pattern.
For such a pattern, we need to consider the full linear-homomorphic
model of Figure 6a, extrapolating, as we said, the high frequency terms
of the transfer functions. Namely, we utilize the data of Figure 8a
[Campbell and Green 1965] for the linear sub-system L (eye optics); we
combine the data of Figure 8c [Campbell and Green 1965] and Figure 13a
[our data] for the linear sub-system N (neural interaction). The
resulting transfer function and line spread function are plotted on
Figure 13c and d.
Then, compensating according to the block diagram of Figure 24a,
we obtain the pattern displayed on Figure 26a, and the corresponding
Fourier spectrum (Figure 26b). Examination of the compensated pattern
suggests the following remarks:
- the compensated pattern is strongly blurred;
- £ome local edge effect has been introduced;
- the brightness contrast cancellation is not quite successful.
We will first take care of the second item, by. noticing that the
somewhat "artificial" border effect created by the compensation process


(a)
Fig. 25 - (a) Test pattern with edges, derived from the smooth pattern of Fig. 17c and 19a. Compare its Fourier magnitude spectrum (c) with the spectrum of the smooth pattern (b).


is exclusively the result of high frequency amplification in the inverse
sub-systems L 1 and N This can be.understood from theoretical
considerations, since the inverses of the transfer functions of Figure 8
will result in amplification of the high frequencies. We can verify
this experimentally; if the same initial pattern is compensated by the
simplified model of Figure 24b (ignoring the optical blur-system L - t
and ignoring the neural blur-high frequencies of system N ~ ) / we obtain
the result of Figure 27a and b. The patterns compensated by the
complete system (Figure 26a) and by the simplified system (Figure 27a)
differ only by the fringing edge effect. But, clearly, these artificial
edges do not compensate for the blur, which is a consequence of
brightness contrast compensation only. In other words, helped by the
particular frequency content of the original pattern, we can separate
the result of the inverse system in two separate effects:
- brightness contrast compensation, is mainly the result of
modulating the three low frequency terms and causes concurrently a
strong blur;
- compensation of optical and neural blur, resulting in the
amplification of the high frequency terms, causes a very local and
"artificial-looking" edge effect.
Why brightness contrast compensation creates such a strong blur can
be understood when realizing how exaggerately sharp is the subjective
brightness predicted by the model; Figure 29 (a,h/e/f) illustrates
this point. Then, the unsuccessful cancellation of the original pattern
can be linked to the fact that the prediction of the model is not in
agreement with the visual experience. But the discrepancies between

e-ei C006 1496C-2 S 201SE1
CYCLES/DEG
(b)
Fig. 27 - (a) Test pattern of Fig. 25a, compensated for brightness contrast by the simplified method of Fig. 24b.(b) Corresponding Fourier magnitude spectrum.Compare with Fig. 26.

11
1J I
I 1,1 h t . , II ---
c-ei C0B cei6 1499E-2 8 201SEI
CYCLES/DEC
(b)
F ig . 28 - (a ) T e s t p a t t e r n o f F ig . 2 5 a , e m p i r ic a l l y com pen sated f o r b r ig h tn e s s c o n t r a s t .
(b ) C o rre s p o n d in g F o u r ie r m a g n itu d e s p e c tru m .Compare w i t h F ig . 2 7 .

(e ) ( f )
F ig . 29 - S t im u lu s d e n s ity ( l e f t ) and c o r re s p o n d in g s u b je c t iv eb r ig h tn e s s ( r i g h t ) , p r e d ic t e d by th e s i m p l i f i e d m o d e l.

prediction and reality could be twofold; on one hand, the edge
crispening predicted by the model is unrealistic; on the other hand,
ignoring for the moment the exaggerated edge sharpening, the question
remains whether the magnitude of the over-all brightness contrast effect
is predicted approximately.
Of course, it is somewhat difficult to dissociate subjectively
these two effects. However, we can attempt to compare the magnitude of
the brightness contrast effect for the two unprocessed patterns (smooth
and with edges): examine Figures 19a and 25a, Figures 17c and d, and
Figures 29a and b. Since it is actually easier to judge subjectively
similar brightness than similar contrast, we can also compare the
patterns of Figure 27a and 28a. The smooth pattern (Figure 27a) is
the result of processing the original picture for brightness
compensation. The sharp pattern (Figure 28a) has been empirically
compensated from the same picture, to show similar compensation. One
will verify that the modulation of the three low frequency terms (f, 3f
and 5f) is of the same order— as can be verified on their respective
spectrum on Figure 27b and 28b— , and that they differ mostly by their'
sharpness. One will notice furthermore that the brightness contrast is
not exactly compensated in either one of these two patterns, but that
the effect is of the same magnitude. Figure 29 (c to f) illustrates the
predictions of the model, which, besides the crispening edge effect, are
quite comparable and in reasonable agreement with the experience (Figure
27a and 28a). Therefore, it.would seem that, at first approximation,
for similar modulation of similar low frequency components, a similar
brightness contrast effect is obtained.

Then, our conclusion will be that the modulation of low frequency
predicted by the homomorphic model and the experimental data (Davidson's
and ours) is generally in agreement throughout the cancellation
experiments. In other words, the peripheral visual system, and in
particular the neural network, seems to behave reasonably linearly in
the band of low frequencies, as we verified by using smooth patterns.
However, strong discrepancies are revealed when the pattern has edges,
which suggest important local non-linearity in the vicinity of sharp
intensity discontinuities. The next chapter will be devoted to these
complex edges effects.

CHAPTER V
EDGE EFFECTS
The last section of the preceding chapter suggested that some
discrepancies in the subjective brightness predicted by the homomorphic
model, could be attributed to local non-linearity of inhibitory
interaction near edges. The present chapter will address these
questions in some detail. Of course, we mean here, by edges,
discontinuities or steps of the intensity stimulus projected on the
retina, and not some abstract concept such as lines, objects outline,
etc... But, obviously, the two notions are related in some complex
manner, about which we know certainly little.
1/ The perception of intensity steps
Let us return to the density pattern of Figure 29a, and compare
its subjective appearance (Figure 25a) with the brightness predicted by
the model (Figure 29b). Focusing particularly on the edge sharpening
effects, it is clear that the predicted enhancement of edges is
completely out of proportion with their actual appearance. The
contradiction is even more apparent for the pattern illustrated on
Figure 30, for which the predicted brightness presents a complete
reversal of the curvate of the intensity profile.
But, it is a mathematical law, built into the linearity property of
the inhibition model, that the crispening effect at points of extreme

Test pattern (a) and predicted subjective brightness (b). Notice the inversion of curvature on the predicted subjective brightness.
(a) (b)
Linear density gray scale (a) and predicted subjective brightness (b). Notice the cusped brightness of the intermediate gray steps (a), similar to the prediction (b).

curvature in the intensity pattern, increases drastically with the
curvature. As a result, Mach bands will be predicted at a maximum for a
vertical step, as can be observed on Figure 37b and d. However, it has
been well noted [as reviewed in Ratliff 1965, pp. 55-61] that, if it is
true that Mach bands increase in amplitude when the width of the
transition ramp diminishes, they altogether disappear when the ramp
vanishes into a step. At most, some very narrow bands are perceived,
but hardly distinguishable from the edge itself (Figure 38).
A brightness effect of different spatial magnitude is observable on
multiple intensity steps, such as on Figure Sla"*". The brightness of
each step is not uniform, but inclined, in general conformity with the
prediction of the model (Figure 31b). But, there again, the strong and
wide bands predicted by the model are not observable. However, neither
the Mach bands, nor the slope in brightness is perceived when only one
step is present (Figure 32a), or when the steps alternate in direction
(Figure 32c). The difference between these two effects can be
experienced more dramatically by alternately covering and uncovering all
but one step on the pattern of Figure 31a. That the local appearance ■
of an intensity step be dependent on broad properties of the stimulus is
perplexing, and suggests that some higher level mechanisms are involved.
However, before getting deeper into the issues involving the effect
of contour on overall brightness perception, and ignoring for the time
being the paradoxical differences just mentioned, we would like to
A standard pattern in the field of technical photography where it is used for calibration purposes; the amateur snapshooter will find it on the boxes of Polaroid films (type 107)...

(c ) (d)
F ig . 32 - I n t e n s i t y s te p (a ) i s o la t e d fro m th e g ra y s c a le o f F i g . 3 1a , and p r e d ic t e d s u b je c t iv e b r ig h tn e s s ( b ) . I n t e n s i t y s q u a re wave ( c ) , and p r e d ic t e d s u b je c t iv e b r ig h tn e s s ( d ) . N o t ic e how th e m odel p r e d ic t s s i m i l a r b r ig h tn e s s e f f e c t s f ° r p a t t e r n s 3 1 a , 32a and 3 2 c .

contemplate first the possibility of some local non-linear process,
prior to or imbedded in the convolution model of neural inhibition, and
accounting for the different effect observable near edges.
II/ Possible local edge oriented mechanisms
In order to speculate on the possibility of additional neural
mechanism controlling the appearance of edges and intensity steps, a
convenient approach is to consider Mach bands as additive perturbations
to the input density signal and to separate the convolution process
representing neural excitation-inhibition into two additive processes,
as described in Figure 33. For the sake of simplicity, we will suppose
that the excitation process is a perfect transducer, without degradation
of the input, with an ideal impulse response e(x) = a6(x). We consider a
typical inhibition process, with a weight of -b (G<b<a, for theoretical
as well as experimental reasons). Then, the convolution pictured in
Figure 33a:
0 (x) = I (x) * (a 5 (x) + h (x)) ,
is identical to the sum of convolutions:
0 (x) = (I (x) * (a-b) 6 (x) ) + (I(x) * (b <5 (x) +h(X))),
as illustrated in Figure 33b. This additive decomposition is such that
the second convolution term involves an impulse response with null
weight. In this manner, we have isolated the edge crispening process
(sub-system C2, bottom of Figure 33b) as an additive perturbation to
the input signal, which would be otherwise arbitrarily scaled through
sub-system Cl (top of Figure 33b).


With this convenient conceptual dichotomy in mind, we may attempt
to imagine a scheme for controlling the relative amplitude of the Mach
bands created by the perturbation convolution C2. At this point, the
only available evidence on these edge phenomena is psychophysical,
whereas the homomorphic model for neural interaction is well supported
by physiological experiments, as seen in Chapter II. Therefore, our
motivation for considering hypothetical neural mechanisms for edge
effects in the retina, is mainly to study whether a convolution model
could be theorically generalized or adapted, and not to assert the
existence, locus and physiological structure of such mechanisms, since
we do not have presently methods for investigating them. As we shall
see in Section IV, the problem is complicated by the fact that some
central processes are probably involved. We consider first the
hypothesis that the peripheral system (retinal inhibitory network)
behaves non-linearly when edges are present. However, we probably know
enough of the general properties of neural networks to evaluate whether
a given mechanism might be "implemented" in a network of neurons;
■ ■ 2 •obviously, the last word belongs to the physiologist .
A first solution could be a threshold function applied to the
output of convolution C2. However this is not satisfying, because it
does not seem likely that a fixed threshold would attenuate the Mach
bands resulting from a step function sufficiently: These bands would be
at least as visible as the brightest Mach bands obtainable with an
^ Neural interaction was postulated very early as explanation of brightness contrast phenomena [Mach 1968, in Ratliff 1965, p. 316], but clear physiological evidence of such inhibitory interaction in retinal networks was demonstrated much later, in the Limulus eye [Hartline 1949]. .

intensity ramp. As has been reported above, this is clearly not the
case.
It is also possible to imagine a tuning mechanism which would
locally attenuate the crispening effect, according to the intensity
gradient of the input signal. Let us first notice that any convolution
is equivalent to a differentiation followed by another convolution:
f(x) * 6(x) = f' (x) * s(x),
where f 1 (x) is the derivative of f(x), and s(x) is the undefined
integral of <5(x). In other words, a linear stationary system with
impulse response 6 (x), can be analysed in terms of its step response
s(x). By this transformation, the system of Figure 33b can be
assimilated to a differentiator followed by a convolution C3, whose
impulse response (which is also the step response of C2) corresponds to
the hypothetical Mach bands of a unit step function.
With this image in mind, we see that it is sufficient to insert a
very simple (non-linear) mechanism in the system, in order to eliminate
sharpening of intensity steps. Such a mechanism for eliminating
impulses at the output of the differentiator, and prior to the
convolution stage C3 (Figure 34a), would compare the input value at
each point with the neighboring points, and replace, by an average of
the surrounding input values, any input which is strongly different from
its neighbors. We name this impulse elimination mechanism a m a j o r i t y
r u l e , which results in ignoring individual points where the gradient
computed by the differentiator is too large. The spread of input of the
m a j o r i t y r u l e would partly determine the critical gradient. We have


here a satisfying method for sharpening only contours which are not keen
enough. This scheme fits in the context of a peripheral system which
has as its objective the pre-processing of visual information in
preparation for a higher level system for which edges are fundamental
features. The notion that edges and contours convey a great part of the
visual information is commonplace, and suggests the existence of
specific edge-oriented mechanisms in the central visual system. In this
context, the effects of peripheral processing would be to accentuate
intensity gradients in the visual image, in order to enhance contours,
and perhaps compensate for inherent optical and neural loss of
resolution. Mach bands would be visible manifestation of this
processing. Then, it would make sense if edges which are already well
resolved, were not subject to excessive sharpening.
But there are some difficulties with this approach. First, is the
fact that, although the implementation of Figure 34a provides for
brightness contrast when the intensity variation of the inducing
background is gradual (as in Figure 2b), that will not be the case when
its variation is stepwise (as in Figure 2a). The second point is that
there is no reason to believe that the retinal network, for instance,
operates and is structured in the way suggested by Figure 35a; we chose
this representation for reasoning convenience only. But as a result of
introducing a non-linear process, such as the majority rule, this system
is not convertible easily into the more realistic inhibitory model of
Figure 33a. However, taking the "black box" approach, it is possible
to imagine a locally tunable inhibition process, quasi linear and
isotropic in the absence of edges, operating in a similar way to the

system j u s t d e s c r ib e d . I n th e v i c i n i t y o f e d g e s , th e s p re a d and
a m p litu d e o f i n h i b i t i o n w ou ld be c o n t r o l le d b y an edge d e t e c t io n
m echanism (o r i n f l e c t i o n a n a ly s e r ) , r e s u l t in g i n a s tro n g a t t e n u a t io n o f
th e c r is p e n in g e f f e c t , w ith o u t s u p p re s s io n o f b r ig h tn e s s c o n t r a s t
(F ig u r e 3 4 b ) . One w i l l n o t ic e t h a t th e " b la c k box" j u s t d e s c r ib e d
r e q u ir e s a somewhat f l e x i b l e and a d a p t iv e o r g a n is a t io n o f n e u ro n s , b u t
in v o lv e s no more th a n c l a s s i c a l e x c i t a t o r y and i n h i b i t o r y
in te r c o n n e c t io n . F o r in s ta n c e , edge d e t e c t io n i s r e a d i l y p e rfo rm e d by
p a ir w is e c o n n e c tio n o f n e ig h b o r in g r e c e p to r s , a l t e r n a t e l y e x c i t a t o r y and
The m a in re a s o n f o r c o n te m p la t in g such a h y p o t h e t ic a l n o n - l in e a r
and a d a p t iv e s y s te m , a lth o u g h p r e c is e p s y c h o p h y s ic a l and p h y s io lo g ic a l
d a ta a re la c k in g , i s t h a t , h a v in g shown e v id e n c e o f th e l i n e a r i t y o f
n e u r a l i n h i b i t i o n f o r sm ooth s t i m u l i , and h a v in g r e la t e d i t c o n c lu s iv e ly
to b r ig h tn e s s c o n t r a s t phenom ena, i t i s n a t u r a l to t r y t o in v e s t i g a t e
to com portm ent o f such s p a t i a l m echanism s i n th e v i c i n i t y o f e d g e s .
T h e re has b een s tu d ie s on th e s p re a d o f l a t e r a l i n h i b i t i o n , re v ie w e d in
[Growney and W e is s te in 1 9 7 2 ] , show ing i n g e n e r a l t h a t th e s p re a d o f '
l a t e r a l i n h i b i t i o n i s l a r g e r a t th e v i c i n i t y o f e d g e s . H o w ever, th e
r e s u l t s a re o f t e n c o n f l i c t i n g , and th e e x p e r im e n ta l d e s ig n s d i f f e r e n t ,
and som etim es to o c ru d e , c o n s id e r in g th e c o m p le x ity o f th e n e u r a l
m echanism s in v o lv e d . Von B ekesy [1 9 6 8 a , 1972a ] p r e f e r r e d to d is t in g u is h
two ty p e s o f l a t e r a l i n h i b i t i o n s , r e s p o n s ib le r e s p e c t iv e ly f o r th e
n a rro w Mach band e f f e c t (Mach inhibitionj w it h a n a rro w s p r e a d ) , and
f o r th e b r ig h tn e s s s lo p e o f i n t e n s i t y s te p s (Heving inhibitionj w it h a
la r g e s p r e a d ) . H is d ic h o to m y i s based on e x p e r im e n ts show ing d i f f e r e n t

a c t io n o f f a c to r s such as a d a p ta t io n and f l i c k e r on th e two b r ig h tn e s s
e f f e c t s . S im u la t in g w i t h h is newc'dl unit, he in d ic a t e d t h a t th e two
ty p e s o f i n h i b i t i o n c o u ld be c h a r a c t e r iz e d m a in ly b y a d i f f e r e n t s p a t i a l
s p re a d . H o w ever, t h i s t h e o r e t i c a l s e p a r a t io n i s n o t r e a l l y n e c e s s a ry ,
s in c e we showed t h a t th e l i n e s p re a d f u n c t io n o b ta in e d b y b r ig h tn e s s
c o n t r a s t e x p e r im e n ts (C h a p te r I I I ) w o u ld a ls o c r e a te Mach bands (F ig u r e
37b and d) and b r ig h tn e s s s lo p e f o r in t e n s i t y s te p s (F ig u r e 3 1 ) .
T h e r e fo r e , we fa v o r th e n o t io n o f a s in g le i n h i b i t i o n m echanism , b u t
s p a t i a l l y a d a p t iv e and n o n - l in e a r n e a r e d g e s . The d i f f e r e n t in f lu e n c e
o f th e f a c to r s m e n tio n e d above c o u ld c e r t a i n l y be r e la t e d t o s tro n g
n o n - l i n e a r i t y .
The m ain p ro b le m is t h a t some a d d i t io n a l n e u r a l sys te m , c o n n ected
w ith e d g e s , a re p ro b a b ly in v o lv e d i n th e p e r c e p t io n o f b r ig h t n e s s , as we
s h a l l see now.
I l l / E f f e c t o f c o n to u rs on b r ig h tn e s s p e r c e p t io n
The e v id e n c e t h a t edge e f f e c t s a re r e la t e d to more com plex
m echanisms t h a t l o c a l n o n - l i n e a r i t y o f n e u r a l i n h i b i t i o n , i s th e
f o l lo w in g : th e a p p a re n t s lo p e , o r f l u t i n g , o r th e b r ig h tn e s s o f
i n t e n s i t y s te p s i s d ep en d en t on th e c h a r a c t e r i s t i c s o f th e w h o le
p a t t e r n . In p a r t i c u l a r , th e s lo p e in b r ig h tn e s s o f a u n ifo r m , o r n e a r ly
u n ifo r m , i n t e n s i t y a r e a seems to be s u b je c t iv e l y a p p a re n t o n ly when th e
n e ig h b o r in g in d u c in g f i e l d s h ave in t e n s i t y le v e ls above and b e lo w t h a t
o f th e in d u c e d f i e l d , as i s th e case f o r a m u l t ip le s te p fu n c t io n
(F ig u r e 3 1 ) ; c o n v e r s e ly , t h i s i s n o t o b s e rv e d when th e s u r ro u n d in g
f i e l d s a re b o th b r ig h t e r o r d a r k e r th a n th e in d u c e d f i e l d (F ig u r e 3 2 ,
99

3 3 ) . B u t , even when th e e f f e c t i s p r e s e n t , i t i s n o t as s tro n g as
p r e d ic t e d by a l i n e a r m odel (F ig u r e 31a and b ) . I t i s i n t e r e s t i n g to
r e l a t e to t h i s phenom enon, th e C o rn sw e e t i l l u s i o n [C o rn s w e et 1 9 7 0 ,
p . 272] i l l u s t r a t e d on F ig u r e 3 5 , o r th e e f f e c t s r e p o r te d by O 'B r ie n
[ 1 9 5 8 ] , w hereby an i n t e n s i t y cusp a t th e b o rd e r o f u n ifo rm f i e l d s
in d u c e s d i f f e r e n t b r ig h tn e s s f o r f i e l d s o f th e same i n t e n s i t y . I t does
n o t seem p o s s ib le to e x p la in such an e f f e c t by i n h i b i t i o n m echanism
(w h e th e r i t i s l i n e a r o r n o t ) , b ecau se th e phenomenon i s u n ifo rm o v e r
th e w h o le v is u a l f i e l d , w h ereas p e r ip h e r a l n e u r a l i n h i b i t i o n i s a q u i t e
l o c a l p ro c e s s .
T h en , i t i s te m p tin g to im a g in e an a d d i t io n a l m echanism , s u b seq u en t
to th e n o n - l in e a r i n h i b i t o r y p ro c e s s .
I V / P e r ip h e r a l a n d /o r c e n t r a l m echanism s
One p o s s i b i l i t y i s an equalizing p ro c e s s , a p p l ie d to th e o u tp u t o f
th e p e r ip h e r a l i n h i b i t o r y s ys te m , w h ic h w o u ld c o l l e c t b r ig h tn e s s
in fo r m a t io n p r i n c i p a l l y a t th e e d g e s , and e x t r a p o la t e i n b e tw e e n . Such
a th e o r y has been o f f e r e d e a r l i e r [F r y 1 9 4 8 ] , and th e s u b je c t i s
re v ie w e d by R a t l i f f [ 1 9 7 1 ] . I n t h i s c o n t e x t , u n ifo rm i n t e n s i t y a re a s
w o u ld h ave b r ig h tn e s s s lo p e , o n ly when th e edge enhancem ent r e s u l t in g
fro m p e r ip h e r a l p ro c e s s in g i s i n o p p o s it io n , as i s th e case f o r a s in g le
s te p i n a m u l t ip le s te p wedge (F ig u r e 3 1 ) . When th e p e r ip h e r a l edge
c r is p e n in g i s i n th e same d i r e c t io n (F ig u r e 3 2 , 3 3 ) , i t w o u ld be
e l im in a te d by th e e x t r a p o la t in g m echanism . T h is e m p ir ic a l r u l e i s
a c t u a l l y w e l l v e r i f i e d q u a l i t a t i v e l y , as can be o b s e rv e d on th e v a r io u s
p a t t e r n s p re s e n te d h e r e . T h e n , such a c e n t r a l p ro c e s s , to g e th e r w i t h an
100

(a)
(b)
Fig. 35 - Cornsweet illusion, on a rectilinear (a) and circular (b) test pattern. The two fields composing the picture, have same intensity and different brightness, except near their border.

(b )
F ig . 36 - B e n n u s s i r in g : n o t ic e how th e s im u lta n e o u s b r ig h tn e s s c o n t r a s t e f f e c t i s p e r c e iv e d o n ly when some d e l i m i t e r s e p a r a te s l e f t and r i g h t f i e l d s o f th e p a t t e r n ( b ) .


(b)
Fig. 39 - A typical density scan-line of a digital picture (a), processed by the model of Fig. 6 (b).

i n h i b i t o r y r e t i n a l n e tw o rk , n o n - l in e a r n e a r e d g e s , w ou ld e x p la in how
t h r e e p a t t e r n s f o r w h ic h th e b r ig h tn e s s p r e d ic t e d by a l i n e a r m odel o f
i n h i b i t i o n i s s i m i la r (F ig u r e 3 1 , 3 2 , 3 3 ) , a p p e a r s u b je c t iv e l y q u i t e
d i f f e r e n t . D a v id s o n and W h ite s id e [1 9 7 1 ] p ro p o se a b r ig h tn e s s
i n t e g r a t i n g m echanism , summing o r a v e ra g in g in d e p e n d e n t ly o v e r a re a s
s e p a r a te d by c o n to u rs , and g e n e r a t in g fro m t h i s o p e r a t io n a b r ig h tn e s s
m ore u n ifo r m th a n th e o u tp u t o f th e p e r ip h e r a l i n h i b i t i o n n e tw o rk . B o th
schemes j u s t d e s c r ib e d , w ou ld a c c o u n t q u a l i t a t i v e l y f o r b r ig h tn e s s
p e r c e p t io n , i n th e v i c i n i t y o f e d g e s , in c lu d in g C o rn s w e e t 's i l l u s i o n .
H ow ever, a t t h i s p o in t , one o b v io u s q u e s t io n i s why Mach bands
s h o u ld be v i s i b l e a t a l l . I n o th e r w o rd s , why w ou ld th e system s j u s t
d e s c r ib e d n o t o p e r a te on an u n ifo r m f i e l d s e p a ra te d on one s id e by a
s h a rp e d g e , on th e o th e r s id e by a ramp (F ig u r e 3 7 ) , l i k e i t does when
b o th s id e s a r e s h a rp e d g e s . One p o s s ib le answ er i s t h a t s h a rp edges a re
e a s i l y d e t e c t a b le by th e r e t i n a l n e tw o rk , and t h a t t h i s p a r t i c u l a r
a s p e c t o f th e im age i s a c r i t i c a l e le m e n t o f v is u a l in f o r m a t io n , to
w h ic h both p e r ip h e r a l and c e n t r a l system s c o u ld be tu n e d . T h is id e a was
th e m o t iv a t io n f o r c o n s id e r in g th e g e n e r a l iz e d n o n - l in e a r i n h i b i t o r y
system o f F ig u r e 3 4 . B u t such th e o r y i s th o ro u g h ly s p e c u la t iv e , and
p h y s io lo g ic a l and p s y c h o p h y s ic a l e v id e n c e i s la c k in g and u r g e n t ly
n e c e s s a ry .
I n c o n c lu s io n , th e r e seems to be some e v id e n c e o f tw o b a s ic
m echanism s i n th e v is u a l system
- A n e u r a l i n t e r a c t i o n n e tw o rk , q u i t e l i n e a r i n th e absen ce o f
e d g e s , as has been d e m o n s tra te d h e r e in ;
106

- An edge o r ie n te d m echanism , in f lu e n c in g th e w h o le v is u a l f i e l d .
A lth o u g h th e r e a r e some in d ic a t io n s t h a t th e fo rm e r p ro c e s s i s
b a s i c a l l y r e t i n a l , and th e l a t t e r c e n t r a l , i t i s q u i t e p ro b a b le t h a t
th e y a re i n f a c t i n t im a t e ly m ixed and th e com plex r e s u l t o f n e u r a l
s t r u c tu r e s im p le m e n te d a l l a lo n g th e v is u a l p a th w a y . T h e r e fo r e , i t i s
d i f f i c u l t to e s t im a te how much a g iv e n e x p e r im e n t s t im u la te s d i f f e r e n t
m echanism s. The fo r th c o m in g c h a lle n g e i n th e f i e l d o f e x p e r im e n ta l
p s y c h o p h y s ic s w i l l be to d e v e lo p m ethods f o r s t im u la t in g and p r o b in g th e
d i f f e r e n t com ponents o f t h i s system i n o r d e r to g a in know ledge a b o u t i t s
o r g a n is a t io n a l and p h y s io lo g ic a l s t r u c t u r e . The B en u s s i r in g i l l u s i o n
g iv e s some in s ig h t o f th e c o m p le x ity o f th e p ro b le m (F ig u r e 3 6 ) ; i t
shows how lo c a l b r ig h tn e s s c o n t r a s t i s d e p e n d e n t on th e p re s e n c e o f a
c o n to u r s e p a r a t in g th e r in g i n tw o h a lv e s on d i f f e r e n t b ac k g ro u n d s .
Berman and L e ib o w itz [19 65 ] showed e x p e r im e n ta l ly th e im p o r ta n t e f f e c t
o f th e d iv id in g c o n to u r f o r a s im i l a r t e s t p a t t e r n .
V / E f f e c t o f S t im u lu s b o rd e r
I n r e l a t i o n w i t h edge and c o n to u r phenom ena, one q u e s t io n is
r a is e d , nam ely th e e f f e c t o f l i m i t a t i o n i n space o f th e v is u a l s t im u lu s ,
u s u a l ly f i n i t e and s u rro u n d e d by a b r i g h t , o r p r e f e r a b ly d a r k ,
b ac k g ro u n d . O b v io u s ly , th e s p a t i a l t r u n c a t io n o f th e i n t e n s i t y f u n c t io n
in t r o d u c e s e x tra n e o u s fre q u e n c y com ponents , as e le m e n ta ry F o u r ie r
a n a ly s is w i l l t e l l u s . K e l ly [19 70 ] showed how t h i s t r u n c a t io n by th e
s u rro u n d r e s u l t s i n v a r io u s edge e f f e c t s in f lu e n c in g th e p e r c e p t io n o f
s in u s o id a l g r a t in g s . I n p a r t i c u l a r , th r e s h o ld c o n t r a s t m easurem ents a re
changed by th e phase o f th e t r u n c a t io n o f th e g r a t in g , when th e o b s e rv e r
107

f i x a t e s th e e d g e . H ow ever, we w i l l n o t f o l lo w K e l ly i n s a y in g t h a t , in
s p a t i a l fre q u e n c y a n a ly s is o f th e v is u a l sys te m , " th e s ta n d a rd t a r g e t
s iz e s h o u ld be i n f i n i t e , " i n o r d e r to be r ig o r o u s . I f th e s u b je c t
f i x a t e s th e c e n te r o f th e s t im u lu s p a t t e r n , th e p ro b le m i s s im p ly
w h e th e r th e b r ig h tn e s s d is tu r b a n c e g e n e ra te d by th e t a r g e t edges have a
s p a t i a l e x t e n t b ro a d enough to p e r t u r b a t e th e c e n t r a l p a r t o f th e
s tim u lu s w here m easurem ents a r e m ade. I n o th e r w o rd s , i t h a r d ly m a tte r s
t h a t , m a th e m a t ic a l ly , s p a t i a l t r u n c a t io n p e r tu r b a te s th e fre q u e n c y
c o n te n t o f an h y p o t h e t ic a l i n f i n i t e i n t e n s i t y p a t t e r n , i f th e n e u r a l
i n t e r a c t i o n m echanism r e s p o n s ib le f o r b r ig h tn e s s e f f e c t s , has a f i n i t e
s p a t i a l s p re a d . T h is a p p l ie d w h e th e r th e m odel i s l i n e a r o r n o t . I n
th e r e s t r i c t e d c o n d it io n s a d o p te d h e re (sm ooth p a t t e r n s ) , i t seems
p ro b a b le t h a t n e u r a l i n t e r a c t i o n r e s u l t s i n a q u a s i l i n e a r and is o t r o p e
sum m ation e f f e c t , o f l i m i t e d s p a t i a l e x t e n t (p e rh a p s some 2 0 ' o f v is u a l
a n g l e ) . T h e r e fo r e , th e e x p e r im e n ta l t a r g e t s and m ethods u t i l i z e d h e re
a re j u s t i f i e d in t h i s r e s p e c t .
H ow ever, we a ls o j u s t re v ie w e d some e v id e n c e o f n o n - l in e a r edge
e f f e c t s , a t t r i b u t a b l e to some, as y e t u n s p e c i f ie d , p re s u m a b ly c e n t r a l
m echanism , w h ic h in v o lv e s la r g e p o r t io n s o f th e f i e l d o f v ie w . B u t a
c h a r a c t e r i s t i c o f th e s e e f f e c t s i s t h a t th e y a re u n ifo rm i n n a tu r e .
T h e r e fo r e , th e y can p ro b a b ly be ig n o r e d , f o r s ta n d a rd v ie w in g
c o n d it io n s , s in c e th e y do n o t seem to p e r tu r b a te th e r e l a t i v e b r ig h tn e s s
in s id e th e t a r g e t c o n to u rs .

CHAPTER VI
Brightness phenomena are also present for color stim u li. But color
being "three-dim ensional", in the sense that a given color sensation
may vary in brightness3 saturation and h u e ^ , color interaction
phenomena resu lt in the subjective modification o f not only the
brightness o f the induced color, but also i t s saturation and hue. This
has been known and used e ffe c tiv e ly by a r tis ts [Albers 1963]. Color
contrast phenomena seem q u a lita tiv e ly quite sim ilar to the corresponding
achromatic brightness e ffe c ts , and a l l o f the c la ssic a l e ffe c ts (Mach
bands— although th is s t i l l is a controversial matter— , background
induction, grid e ffe c t) have their correlates for color stim u li.
Therefore one is tempted to study how the homomorphic model for
peripheral neural processing could be extended to incorporate color
e ffe c ts .
Some empirical formulations, such as von Kries c o e ffic ie n ts , have
been offered for color induction phenomena, and for the predictive
description o f subjective colors . But i t seems that the homomorphic
model would prove a more powerful to o l, since i t already models
reasonably well brightness constancy and brightness contrast, for low
For the d efin ition o f these terms, see for instance [C.H. Graham 1965, p. 6 0 ].
See for instance: [Judd 1940], [Richards and Parks 1971; Richards 1972], [Takasaki 1969].
COLOR CONTRAST .

frequency patterns. However, this approach c a lls for some understanding
of the basic color vision mechanisms, or at le a st for some ju s tifia b le
hypothesis about these mechanisms. But th is issue turns out to be quite
controversial [Sheppard 1969] .
1 / Theories o f color vision
For an in-depth compilation o f recent data and theories, the reader
is referred to [C.H. Graham 1965]3 ; only the most relevant points w ill
be reviewed here, with the risk o f over-sim plifying.
Trichromacy theory originated from the experimental and theoretical
studies o f Young and Helmholtz, developed through the work o f Hering and
others, up to the recent research e ffo r ts of De V alois, Hubei, W iesel,
Rushton and McNichol. The theory r e lie s on the psychophysical facts of
metamerism ( i .e . tr ivarian t color mixture) and on the reasonably w ell
established physiological notion that the retina contains three kinds of
cone receptors with d ifferen t photochemical se n sitiv ity in the v is ib le
spectrum; these receptors are characterized by overlapping response
curves, with peak at approximately 620, 530 and 470 m.y [McNichol
1964].
There is also evidence that color vision is probably a complex
m ulti-stage system. The opponent-color theory, in itia ted by Hering,
proposes that the three-color information at the retina is encoded at a
posterior stage into two-color o n -o ff signals [Hurvitch and Jameson
3 See a lso : [Teevan 1961] for a co llectio n o f the early works, [Lettvin 1967], [Rushton 1969b].

1957, Koedenrink 1972]. E.H. Land has suggested futhermore that the
retin al color sen sitive systems (probably three o f them), operate "in
s e t " over the whole visual f ie ld , rather than point-w ise [Land 1964;
Land and McCann 1971]. We w ill dwell on th is particular theory as i t
seems to agree with some experimental resu lts on color contrast
presented in the following section .
Land's experiments would tend to show that color is not determined
point-w ise, according to the local response o f three d ifferen t retin al
receptors, but rather from the complex combination o f the independent
responses o f the three receptor sets over the whole visual f ie ld . This
hypothetical retin al-cerebral system, the retinex3 reduces the role of
the receptor sets to the perception o f ligh tn ess, that is the perception
o f the reflectance characteristics o f the visual scene, in one
wavelength band, independently o f the illum ination factors. The vetinex
mechanism would generate the color sensation from these three retinal
"p ic tu r e s ", at d ifferen t wavelength.
We already indicated in Chapter II how, in achromatic v isio n , the
homomorphic system, modeling neural interaction between neural
receptors, accounts for brightness constancy and brightness contrast,
and thereby performs the separation o f the reflectance factor, that is
to say lightness perception. This is accomplished by logarithmic
transformation which maps the m ultip licative reflectance and
illum ination components into additive components, and by high-pass
f i lte r in g which eliminates the slowly varying illum ination component.
We also showed how Land's retin al model for lightness pevaeption [Land
Ill

and McCann 1971], based on edge detection, could not account for
brightness contrast. But we also indicated th at, although the
homomorphic model describes properly brightness contrast for smooth
stim u li, i t is defective in the case o f edges (Chapter V ), and that some
contour-oriented mechanisms have to be included in the model in order to
generalize i t s v a lid ity . In conclusion, i t seems that an hypothetical
composite system, following logarithmic receptors, combining an edge
detection mechanism, such as Land's retin a l model, and a quasi linear
mechanism of neural interaction , would account properly for lightness
perception, brightness constancy and brightness contrast. Then the
hypothesis o f three independent sets o f receptors is very tempting, in
view o f the many fundamental visual phenomena which can be modeled by
such a system, and considering Land's experiment as w ell as some
experiments on color Mach bands and color contrast.
I I / Three independent inhibitory receptor networks
E arlier observations [R a tliff 1965, pp. 62-63] reported that color
Mach bands were v is ib le only when a brightness gradient is present. In
other words, no Mach bands were perceived on a pattern representing a
transition between two fie ld s o f d ifferen t color, with constant
luminance. Similar negative results [Van der Horst and Bouman 1967]
lead even to suggest that sp atia l inh ibition was lacking in the color
mediating channels; as noted by R a t lif f [1965], this would be in
contradiction with the w ell established facts o f color induction.
However, i t was showed more recently [Jacobson and McKinnon 1969] that
Mach bands e ffe c ts can be produced by saturation gradients. A lso, the
112
more extensive and careful experiment conducted by Green and Fast [1969]
demonstrated that colored Mach bands were in fact v is ib le on chromatic
gradient with constant luminance. Alpern [1964] demonstrated a related
resu lt for color contrast, namely that simultaneous brightness contrast
is at a maximum when color contrast is at a minimum.
The la tte r results support the attractive hypothesis o f three
retin a l inhibitory networks, sen sitive to d ifferen t wavelength, but
independent from one another. In other words, the kind o f neural
interaction we have been describing and modeling in the present
research, would occur independently within each set o f retin al cones.
As w ill be ea sily observed, three such inhibitory networks would account
for a l l the observable color contrast e ffe c ts , including Mach bands.
Experimental measurements o f the frequency characteristics of these
three receptors systems by Mach band increment threshold [Matthews
1967], and by threshold contrast [Van der Horst 1969; Green 1968],
showed sim ilar characteristics for the "red" and "green" mechanisms,
d ifferen t for the "b lu e " mechanism. The "b lu e " system exhibits lower
contrast se n sitiv ity and a wider spread o f sp atia l summation. One
p ossible explanation might be a scarcer density o f "b lu e " cones in the
foveal region.
I l l / Color e ffe c ts on smooth patterns
Assuming the existence o f three independent inhibitory networks, we
experimented with colored patterns such as those used in the achromatic
experiments.
113

Color patterns were created on photographic film by three exposures
through blue, green and red f i l t e r s . I t was possible to produce quite
strik in g colored e ffe c ts , analogous to the achromatic brightness e ffe c ts
(Mach bands, simultaneous color contrast, grid e f fe c t s ) , on sharp as
well as smooth stim uli patterns. Smooth pattern e ffe c ts were
conpensated successfully by processing independently by the same model
used previously (See Chapter I I I and IV) each primary image (blue, green
and red ). these results support quite w ell the notion o f three
independent inhibitory networks, linear for smooth stim u li, and
sen sitive respectively in the blue, green and red regions.
But, a c r it ic a l point in a l l experiment o f th is type is whether the
d ifferen t color mechanisms are actually stimulated in divid ually . In our
p articular case, th is is impossible to assert, as too many factors are
involved in the generation o f the color stim uli on the fin a l
photographic p rin t: spectral characteristics o f the phosphor, spectral
transm itivity o f the f i l t e r s , se n sitiv ity o f the film , spectral
characteristics o f the dyes, chemical interaction during development,
e tc . For th is reason, our experiments must be considered as
prelim inaries. In addition we neglected any suspected difference in the
sp atia l characteristics o f the three mechanisms. A lso, generating
stim uli patterns by a photographic process, i t is d i f f ic u lt to control
parameters such that luminance, saturation and hue, and to relate them
ea sily with the blue, green and red d ig ita l data.
However, even th is crude experiment was in agreement with our
th eoretical assumptions, and verified the data obtained in the
1 1 4

achromatic experiment. Therefore, the prelim inaries appear to be
promising, and such experimentation techniques, implemented on a
real-tim e, color, d ig ita l display should y ie ld a harvest o f interestin g
and more precise r e s u lts .

CHAPTER VII
CONCLUSIONS
As we indicated in the introduction, this computer-aided research
is relevant to the fie ld s o f digital image processing and visual
p s y c h o physios . From the results o f our experiments we can draw some
conclusions in these two domains.
1 / On the side o f psychophysics
This work should have demonstrated what a powerful and v ersatile
aid are d ig ita l computing and displaying equipments, for research in
visual psychophysics. The term digital is important here. Indeed,
some fundamental points o f our demonstration have made l i t t l e use of
complicated computing and simulating procedures which were availab le .
For instance, most o f the simple patterns used in the experiments
(Chapter II I and IV) could have ea sily been generated with some ad hoc
analog hardware driving a cathode ray tube or a te lev isio n scope; such
tools have actually been b u ilt and used for previous studies o f the
modulation properties o f the visual system [Campbell and Green 1965;
Green 1968]. However, the advantages of d ig ita l techniques are clear,
because analog special purpose devices, on one hand, cannot attain the
same precision and quality for image production, and on the other hand,
do not provide the f le x ib i l i t y for producing a large variety o f
p atterns.

We indicate in Appendix C how display devices and photographic
media introduce distortions in the image producing process, and how
compensation procedures are fundamental and necessary; i t is quite
obvious that only d ig ita l methods permit such a precise control o f
picture q u ality , while allowing broad f le x ib i l i t y . I t is also true,
however, that there are lim itations with respect to the production o f
color stim uli via the medium of photographic film , as we noted in the
preceding chapter, and that a real-time'*' display device would improve
the experimental procedures in many respects.
Probably, the more interestin g feature o f th is type o f computer
aided research is f le x ib i l i t y : a w ell developed software system allows
one to experiment with about any imaginable stimulus pattern. A ll
illu str a tio n s in th is th esis , excluding block diagrams, were generated
with a few interactive programs. In an experiment session on the
computer, i t is generally a matter o f minutes to create a pattern,
process i t in various ways, display i t , change the parameters o f the
models, e tc ; i f some new software feature is desired, then i t is a
matter o f hours to modify, improve and expand programs sig n ific a n tly ,
and implement new experimenting ideas.
The computer was used here on one p articular aspect o f visual
perception, but clearly i t s u t i l i ty can be extended to many other areas.
In p articu lar, the computer has been used previously to study stereopsis
with random dot patterns, which would have been laborious, i f not
We mean here a device permitting instantaneous display and observation o f a pattern, lik e on ordinary te le v isio n .
117

im possible, to generate otherwise [Julesz 1971]. The most fundamental
improvement in computer-aided research would probably be real-tim e
production o f the visual stim u li, on a computer-driven TV phosphor,
as has been experimented by R. I . Land [1972]. As is apparent in the
description and discussion o f our experimental design (Appendix A ), the
very interestin g advantage o f real-tim e is the a b ility to control, while
experimenting, the various parameters involved in the visual phenomenon
under investigation . However, experiments such as ours, may require
computationally complex stim uli and good control o f the calibration of
the image. The important question is how much trade o f f must be made
between real-tim e requirements, on one hand, and stimulus complexity and
picture q u altiy , on the other hand. The technical answer to this
question is probably to u t iliz e a d ig ita l video data disk as a refresh
memory o f a high quality TV monitor. Limited in our case to
photographic outputs, and therefore to the study o f steady state visual
phenomena, we were able to make some contributions to the study o f
brightness perception.
We have helped investigating a fundamental point in a l l modeling
approach to brightness contrast phenomena, namely the lin ea rity
hypothesis o f neural interaction . We have showed that lin ea rity is
verified for smooth patterns, and indicated that non-linearity is
probably located in the v ic in ity o f sharp edges and d iscon tin u ities.
We have mentioned ea r lier that d ifferen t approaches can be taken
in modeling brightness perception. In p articu lar, the shunting
inh ibition model [Sperling 1970] and the homomorphic model seem able to

describe adequately brightness constancy and brightness contrast. Both
methods also f a i l to predict correctly the subjective appearance o f
edges and uniform brightness areas. However, i t should be clear that
the homomorphic method o ffers computational sim p lic ity , and the
important advantage o f being testable d irectly by psychophysical
experiments. But a lso , as discussed in Chapter I I , we believe that the
homomorphic model rests on a more profound philosophical b a sis .
Some interestin g points should lead to further studies, namely:
- More precise estimation o f the low frequency characteristics of
neural in h ib ition , with proper attention to factors such as adaptation,
temporal e ffe c ts , contrast and luminance le v e l;
- Attempt to determine, more p recise ly , in which manner, and by
which mechanisms (peripheral and/or central) do edges have such an
important e ffe c t on brightness perception;
-Finer investigation o f color mechanisms.
In a ll such endeavors, d ig ita l display and computing equipments would
most certainly be ideal to o ls .
I I / On the side o f d ig ita l picture processing
These experimental resu lts have some bearing on the f ie ld of
d ig ita l processing o f p ictu res. Certainly, they should lead to further
research on the lin e o f the work o f Dr T.G. Stockham,Jr, on m ultip licative
image processing [Oppenheim et a l . 1968], and the application o f vision
modeling to picture processing [Stockham 1968b, 1972]. The idea i s , in
short, that i t seems more desirable to process pictures d ig ita lly a fter
mapping the available physical in ten sities into a scale o f brightness
119

120
having a better relation with the visual perception domain. The f ir s t
im plication is that, in many cases, i.t is preferable to process the
densities o f pictures ( i .e . the logarithm o f the in ten sities) rather
than th eir in te n s itie s , as results from the approximately logarithmic
brightness se n sitiv ity o f the visual system.
In p articu lar , a precise model o f human brightness perception would
2be welcome in the domain o f picture coding , as i t would provide a
better "m etric" for judging o f the quality o f processed p ictu res, and
for estimating the subjective influence o f such factors as noise.
E arlier concern in human v ision , in connection with bandwith compression
studies, had mainly to do with contrast se n sitiv ity (Weber's law ),
sp atia l resolution and temporal response [Schreiber 1967]. The notion
that most o f the visual information in pictures is conveyed by edges and
contours lead to the synthetic highs (or contour coding) technique
[D.N. Graham 1967]. In th is method, the picture is separated in a
low-pass component and a contour sign al, formed o f edges detected by a
d ifferen tia tin g operator (gradient, lap la cia n ); the low frequency
component is coded by quantization and sampling; edge location and
magnitude are coded, transmitted and u tilize d at the receiver to
generate synthetic highs to be recombined to the low pass component.
The orig in al work was based on additive decomposition o f these two
terms. Stockham showed that better results could be obtained by
m ultip licative decomposition, that is to say applying the coding method
to picture densities rather than in ten sities [Oppenheim et a l . 1968].
Stockham [1969] also showed how the homomorphic model o f brightness
2 . Also termed: bandwith compression, redundancy reduction.

contrast could be incorporated into Roberts' scheme for picture data
compression [Roberts 1962], with an approximated transfer function for
neural in teraction , and resulted in an improvement o f the quality o f the
coded p ictu re ; this property can be interpreted as resu ltin g from a
better redestribution o f the coding deterioration over the perceptual
range o f picture brightness. Hie same author demonstrated [Stockham
1972], that quantization distortion and noise degradation appeared
minimal on pictures processed by the homomorphic system modeling
brightness perception. These various resu lts p lain ly ju s tify studies
such as ours, for estimating precisely the parameters o f a valid visual
model.
However, the lin ea rity o f the neural interaction is a fundamental
asset in the ap p licab ility o f the ideas ju st described. For instance,
d ig ita l bandwith compression methods trade o f f between, on one hand,
p re- and post-transm ission processing requirements, transmission
bandwith, and, on the other hand, picture degradation. I f the visual
model helps toward maintaining picture q u ality , i t ought not burden the
processing stages by computational complexity. In th is respect, linear
models are sa tisfa cto ry , as they rely on the very e ff ic ie n t East Fourier
transform techniques.
While the present research provided precise data for the
hypothetical visual transfer function and indicated evidence o f
lin ea rity (for smooth p attern s), i t also pointed out the large departure
o f the lin ea rity hypothesis from the subjective r e a lity in the case o f
luminance edges and contours. For instance, Figure 39a shows a typical
121

scan lin e o f a d ig ita l p icture, and Figure 39b illu s tr a te s the
subjective brightness predicted by the homomorphic model (th is is only
an approximation, as the lin e was processed in one dimension).
Obviously, the assumption o f lin ea rity introduces inportant d istortion s,
as natural images contain many edges and in ten sity steps, for which the
homomorphic model is in default. Then, when using the visual model, a
trade o f f has to be made between computation speed (minimum for a linear
model) and edge distortion (maximum for a linear model). C learly, the
non-linear summation integral which would probably describe somehow the
visual system in terms o f subjective brightness, i f i t s parameters were
readily measurable (which they are not at the present tim e), would be
computationally very expensive. In other words, one might want to look
for a computationally e ffic ie n t f ir s t order model o f brightness
perception.
For instance, Stockham [1972, Fig. 16] used an approximated and
empirical transfer function, showing less low frequency attenuation than
our experimental data. As a re su lt , brightness contrast is not realized
as w ell, but edge e ffe c ts are less important. The non-linear model
diagramed on Figure 34a, which would be linear in the absence o f edges,
might provide a basis for an alternate approach; but we already noticed
that such a sim plified model fa i ls to account properly for brightness
contrast phenomena for stepwise variation in density o f the inducing
background. S t i l l another approach might be an extention o f the
contour coding technique, in which the density image is f i r s t separated
in a contour component and a smooth low-pass component, and the low-pass
component processed by a linear model o f brightness contrast. However,
122

123
the low-pass component should not be obtained by linear f i lte r in g , which
would defeat one's purpose (since the visual model is a high-pass
f i l t e r ! ) , but rather by some non-linear edges substracting or smoothing
method. An additional problem which must be considered, is that the
notion o f using subjective brightness model in an image coding scheme,
involves also the inverse o f the model; c learly non-linear systems are
p oten tia lly troublesome in that respect.
Another area where understanding o f the properties o f visual
perception could be important, is the processing and coding o f color
p ictu res, a f ie ld s t i l l quite at the infancy stage. Clear and concise
formalism for describing such subjective notions as color brightness and
saturation, and accounting for color contrast and color constancy
phenomena, are obviously needed in order to deal competently with such a
d if f ic u lt notion as the quality o f a color image. Some steps were taken
here toward extending the homomorphic model to color perception.
In conclusion, the fu l l ap p licab ility o f a model for brightness
perception warrants further in terestin g research.
I wish to acknowledge the e ffo rts of Randy Cole, George Randall,
Dale R ussell, Barden Smith and Richard Warnock who provided substantial
software and hardware support. I greatly appreciate the help o f,D r.
William Lee in setting up and conducting a psychophysical experiment.
I further appreciate the support of Michael Milochik, whose precision
photography was essen tia l to th is p roject.
ACKNOWLE DGMENT S

REFERENCES
A lbers, J . , The Interaction o f Colors. New Haven: Yale University Press, 1963.
Alpern, M., "Relation between brightness and color co n tra st," Journal of the Optical Society o f America, v o l. 54, pp. 1491-1492, December 1964.
Bekesy, G. von, "Neural inhibitory units o f the eye and skin.Quantitative description of contrast phenomena," Journal o f the Optical Society o f America, v o l .50, pp. 1060-1070, November 1960.
-----------, Sensory Inhibition. Princeton: Princeton University Press,1967.
-----------, "Mach band type la te ra l inh ibition in d ifferen t sense organs,"Journal o f General Physiology, v o l. 50, pp. 519-532, 1967.
-----------,"Mach- and Hering-type la tera l inhibition in v is io n ," VisionResearch, v o l. 8 , pp. 1483-1499, 1968.
-----------, "Brightness d istribu tion across Mach bands measured with flic k erphotometry, and the lin ea rity o f sensory nervous in tera c tio n ," Journal of the Optical Society o f America, v o l. 58, pp. 1 -8 , January 1968.
-----------, "Compensation method to measure the contrast produced bycontours," Journal o f the Optical Society o f America, v o l. 62, pp. 1247-1251, November 1972.
-----------, "Mach bands measured by a compensation method," Vision Research,v o l. 12, pp. 1485-1497, 1972.
Bergstrom, S .S ., "Neural unit in the perception o f luminance grad ien ts,"Scandinavian Journal o f Psychology, v o l. 8, pp. 102-106, 1967.
-----------, and B. Rubenson, "Contour e ffe c t on a brightness paradox,"Vision Research, v o l. 10, pp. 1057-1064, 1970.
Berman, P.W ., and H.W. Leibowitz, "Some e ffe c ts o f contour on simultaneous brightness c o n tra st," Contemporary Theory and Research in Visual Perception. R.N. Haber e d ., New York: Holt Rinehart and Winston, 1968; also in Journal of Experimental Psychology, v o l. 69, pp. 251-256, 1965.
B lis s , J .C ., and W.C. Macurdy, "Linear models for contrast phenomena," Journal o f the Optical Society o f America, v o l. 51, pp. 1373-1379, December 1961.
126
Bryngdahl, 0 . , "Visual transfer characteristics from Mach band measurements," Kybemetik, v o l. 2, pp. 71-77, June 1964.
-----------, "Characteristics of the visual system: psychophysicalmeasurements o f the response to sp atia l sine-wave stim uli in the mesopic reg io n ," Journal o f the Optical Society o f America, v o l. 54, pp. 1152-1160, September 1964.
-----------, "Regular occurence o f simultaneous brightness contrast in themesopic reg io n ," Kybemetik, v o l. 2, pp. 227-236, June 1965.
Campbell, F .W ., "The human eye as an optical f i l t e r , " Proceedings o f the I .E.E.E., v o l. 56, Neural Studies, pp. 1009-1014, June 1968.
---------, and D.G. Green, "O ptical and retin al factors a ffectin g visualre so lu tio n ," Journal o f Physiology, v o l. 181, pp. 576-593, 1965.
-----------, J. Nachmias and J. Jukes, "Spatial frequency discrimination inhuman v is io n ," Journal o f the Optical Society o f America, v o l. 60, pp. 555-559, April 1970.
Cornsweet, T.N. , Visual Perception. New York: Academic Press, 1970.
Davidson, M .L ., "Perturbation approach to sp atia l brightness interaction in human v is io n ," Journal o f the Optical Society o f America, v o l. 58, pp. 1300-1308, September 1968.
-----------, and J.A. Whiteside, "Human brightness perception near sharpcontours," Journal o f the Optical Society o f America, vo l. 61, pp. 530-536, April 1971.
Dupuis, 0 . , "La perception v is u e l le ," Vision Research, vol. 8, pp. 1507-1520, 1968.
Feigenbaum, E .A ., and J. Feldman e d s ., Computer and Thought. New York: McGraw H i l l , 1963.
Fry, G .A ., "Mechanisms subserving simultaneous brightness co n tra st,"American Journal o f Optometry, v o l. 45, pp. 1 -1 7 , 1948.
-----------, "Retinal image formation: review, summary, and d iscu ssion ,"Journal o f the Optical Society o f America, v o l. 53, pp. 94 -9 7 , January1963.
"The Optical performance o f the human e y e ," Progress in Optics. E. Wolf e d ., v o l. 8, London; North—Holland, 1970.
Furman, G .G ., "Comparison o f models for substractive and shunting la te ra l-in h ib itio n in receptor-neuron f i e ld s , " Kybemetik, v o l. 2, pp. 257-274, October 1965.

127
Gold, B . , C.M. Rader, A.V. Oppenheim and T.G. Stockham, Jr, Digital processing o f signals. New York: McGraw H i l l , 1969.
Goodman, J .W ., Introduction to Fourier Optics. New York: McGraw H i l l ,1968.
Graham, C .H ., e d ., Vision and Visual Perception. New York: John Wiley and Sons, 1965. '
Graham, D .N ., "Image transmission by two-dimensional contour coding," Proceedings o f the I.E.E.E. , v o l. 55, Redundancy Reduction, pp. 336-346, March 1967.
Green, D .G ., "The contrast se n sitiv ity o f the colour mechanisms o f the human e y e ," Journal o f Physiology, v o l. 196, pp. 415-429, 1968.
-----------, and M.B. Fast, "On the appearance o f Mach bands in gradients ofvarying c o lo r ," Vision Research, v o l. 11, pp. 1147-1155, 1971.
Growney, R. and N. W eisstein, "Spatial characteristics of metacontrast , 11 Journal o f the Optical Society o f America, v o l. 62, pp. 690-696, May 1972.
Gubisch, R .W ., "O ptical performance o f the human e y e ," Journal o f the Optical Society o f America, v o l. 57, pp. 407-415, March 1967.
H artline, H .K ., "Visual receptors and retin al in te ra c tio n ," Science, v o l. 164, pp. 270-278, April 1969.
-----------, "In h ibition o f a c tiv ity o f visual receptors by illum inatingnearby retin a l elements in the Limulus e y e ," (abstract) Federation Proceedings, v o l. 8, pp. 69, 1949.
Hurvitch, L .M ., and D. Jameson, The Perception o f Brightness and Darkness. Boston: Allyn and Bacon, 1966.
-----------, "An opponent-process theory o f color v is io n ," PsychologicalReview, v o l. 64, pp. 384-404, 1957.
Jacobson, J .Z . , and G.E. McKinnon, "Coloured Mach bands," Canadian Journal o f Psychology, v o l. 23, pp. 56-65, 1969.
Judd, D .B ., "Hue saturation and lightness o f surface colors with chromatic illu m in ation ," Journal o f the Optical Society o f America, v o l. 30, pp. 2 -32 , January 1940.
J u lesz , B. , Foundations o f Cyclopean Perception. Chicago: University o f Chicago Press, 1971.
Jung, R ., "Neurophysiologie des Konturensechens und graphic," Zukunft der Neurologic, H.G. Bammer e d ., S tu ttgart, 1967.

128
K elly , D.H. , "E ffect o f sharp edges on the v is ib i l i t y o f sinusoidal g ra tin g s ," Journal o f the Optical Society o f America, v o l. 60, pp. 98-103 , January 1970.
Koenderink, J .J . , W.A. van de Grind and M.A. Botunan, "Opponent color coding: a mechanistic model and a new metric for color sp ace ," Kybemetik, v o l. 10, pp. 78-98, February 1972.
Land, E .H ., "The R etinex," American Scientist, v o l. 52, pp. 247-264,1964.
-----------, and J .J . McCann, "Lightness and Retinex th eory ," Journal o f theOptical Society o f America, v o l. 61, pp. 1 -11 , January 1971.
Land, R .I . , "Fast computer displays fa c il ita te perception experiments," (abstract) Journal o f the Optical Society o f America, v o l. 62, pp. 715, May 1972.
-----------, and I .E . Sutherland, "R eal-tim e, color, stereo computerd isp la y ," Applied Optics, v o l. 8, pp. 721-722, 1969.
Leibovic, K .N ., "On the retin a l basis o f visual adaptation," Kybemetik, v o l. 9 , pp. 96-111 , 1971.
Lettvin , J .Y . , "The colors o f colored th in g s ," Quarterly Progress Report, no. 87, pp. 193-229, Research Laboratory o f E lectron ics, M .I .T ., Cambridge, M ass., October 1967.
Levi, L . , "V ision in Communication," Progress in Optics. E. Wolf e d . , v o l. 8 , London: North-Holland, 1970.
Lowry, E .M ., and J .J . De Palma, "Sine-wave response o f the visual system. 1 / The Mach phenomenon," Journal o f the Optical Society o f America, v o l. 51, pp. 740-7546, July 1961.
-----------, "Sine-wave response o f the visual system. I I / Sine-wave andsquare-wave contrast s e n s i t iv it y ," Journal o f the Optical Society o f America, v o l. 52, pp. 328-335, March 1962.
McNichol, E .J ., "Three-pigment color v is io n ," Scientific American, v o l. 211, December 1964.
-----------, "Retinal Mechanisms of color v is io n ," Vision Research, v o l. 4,pp. 119-133, June 1964.
Marimont, R.B. , "Linearity and the Mach phenomenon," Journal o f the Optical Society o f America, v o l. 53, pp. 400-401, March 1963.
-------- "Model for visual response to c o n tra st," Journal o f the OpticalSociety o f America, v o l. 52, pp. 800-806, July 1962.

129
Matthews, M .L ., "Mach-band increment thresholds and the mechanisms o f color v is io n ," Journal o f the Optical Society o f America, v o l. 57, pp. 1033-1036, August 1967.
Meessen, A ., "A simple non-linear theory o f color perception and contrast e f f e c t ," Kybermetik, v o l. 4, pp. 48-54 , 1967.
Michael, C .R ., "Retinal processing o f visual im ages," Scientific' American, v o l. 220, no. 5 , pp. 104-114, May 1969.
O'Brien, V. , "Contour perception, illu s io n and r e a l i t y ," Journal o f the Optical Society o f America, v o l. 48, pp. 112-119, February 1958.
Oppenheim, A .V ., R.W. Schafer and T.G. Stockham, J r ., "Non-linear f i lte r in g o f m ultiplied and convolved s ig n a ls ," Proceedings o f the I .E.E.E. , v o l. 56, pp. 1264-1291, August 1968.
Ohzu, H. and Enoch, J .M ., "O ptical modulation by the iso lated human fo v e a ," Vision Research, v o l. 12, pp. 245-251, 1972.
Polyak, S . , The Vertebrate Visual System. Chicago: The University o f Chicago Press, 1957.
R a t l i f f , F . , Mach Bands: Quantitative Studies on Neural Networks in the Retina. San Francisco: Holden-Day, 1965.
-----------, "Contour and C ontrast," Proceedings o f the AmericanPhilosophical Society, v o l. 115, pp. 150-163, April 1971; also in Scientific American, v o l. 226, no. 6, pp. 90 -110 , June 1972.
-----------, H.K. Hartline and W.H. M ille r , "Sp atial and temporal aspects o fretin al inhibitory in te ra c tio n ," Journal o f the Optical Society o f America, v o l. 53, pp. 110-120, January 1963.
Richards, W ., "One-stage model for color conversion," Journal o f the Optical Society o f America, v o l. 62, pp. 697-698, May 1972.
-----------, and R. Spitzberg, "Spatial frequency channels: many or few ,"(abstract) Journal o f the Optical Society o f America, vol. 62, pp. 1394, November 1972.
-----------, and E.E. Parks, "Model for color conversion," Journal o f theOptical Society o f America, v o l. 61, pp. 971-976, July 1971.
Riggs, L .A ., F. R a t lif f and U.T. Keesey, "Appearance o f Mach bands with a motionless retin al im age," Journal o f the Optical Society o f America, v o l. 51, pp. 702-703, 1961.
—■—■— , F. R a t l i f f , J.C . Cornsweet and T.N. Cornsweet, "The disappearance o f stead ily fixated te s t o b je c ts ," Journal o f the Optical Society o f America, v o l. 43, pp. 495-501, 1953.

130
Roberts, L.G. , "Machine perception o f three-'dimensional s o l id s ," Technical Report 315, M .I.T . Lincoln Laboratory, Cambridge, M ass., May 1963.
— — — , "Picture coding using pseudo-random n o is e ," I.R.E. Transactions on Information Theory, v o l. IT -8 , pp. 145-154, February 1962.
Robson, J .G ., "Sp atial and temporal contrast se n sitiv ity functions o f the visual system ," Journal o f the Optical Society o f America, v o l. 56, pp. 1141-1142, August 1966.
Rushton, W .A ., "Light and dark adaptation o f the r e t in a ," Processing o f Optical Data by Organisms and by Machines, w. Reichardt e d ., New York: Academic Press, 1969.
— ~----- , "Colour perception in man," Processing o f Optical Data byOrganisms and by Machines. W. Reichardt e d ., New York: Academic Press,1969.
Sachs, M .B ., J. Nachmias and J.G. Robson, "Spatial frequency channels in human v is io n ," Journal o f the Optical Society o f America, v o l. 61, pp. 1176-1186, September 1971.
Schreiber, W .F ., "Picture coding," Proceedings o f the I .E.E.E. , vo l. 55, Redundancy Reduction, pp. 320-330, March 1967.
Sekino, W .T ., Uses o f the Interactive Graphic System in Stereoscopic Experiments, Thesis, Computer Science Department, University o f Utah, April 1970.
Sheppard, J .J . , Human Color Perception. New York: American Elsevier Publishing C o., 1968.
Sperling, G ., "Model o f visual adaptation and contrast d etectio n ,"Perception and Psychophysics, v o l. 8 , pp. 143-157, 1970.
Stockham, T .G ., Jr, "The application o f generalized lin ea rity to automatic gain c o n tro l," I.E.E.E. Transactions on Audio and Electroacoustics, v o l. AU-16, pp. 267-270, June 1968.
-----------, "Natural image compression with a quantitative error m odel,"Pertinent Concepts in Computer Graphics. Fairman and Nievergelt e d s ., Urbana: University of I l l in o is Press, 1968; and "Intra-fram e encoding for monochrome images by means o f a psychophysical model based on non-linear f i lte r in g o f m ultiplied s ig n a ls ," Proceedings o f the 1969 Symposium on Picture Bandwith Reduction, New York: Gordon and Breach, 1972.
— ----- , "Image processing in the context o f a visual m odel," Proceedingso f the I .E.E.E., v o l. 60, Picture Processing, pp. 828-842, July 1972.
131
Stromeyer, C .F ., and B. Julesz, "Spatial-frequency masking in v isio n : c r it ic a l bands and spread o f masking," Journal of the Optical Society o f America, v o l. 62, pp. 1221-1232, October 1972.
Takaski, H ., "Von Kries c o e ffic ien t law applied to subjective color change induced by background c o lo r ," Journal o f the Optical Soaiety o f America, v o l. 59, pp. 1370-1376, October 1969.
Teevan, R .C ., and R.C. Birney, e d s ., Color Vision. Princeton: Van Nostran C o., 1961.
Tomita, T . , "E lec tr ic a l response o f single photoreceptors," Proceedings of the I . E . E . E . , v o l. 56, Neural Studies, pp. 1015-1023, June 1968.
Van Der Horst, G .J .C ., "Fourier analysis and color d iscrim ination s,"Journal o f the Optical Soaiety o f America, v o l. 59, pp. 1670-1676, December 1969.
-----------, and M.A. Bouman, "On searching for Mach-band type phenomena incolor v is io n ," Vision Research, v o l. 7, pp. 1027-1029, 1967.
Watanabe, A ., T. Mori, S. Nagata and K. Hiwatashi, "S p atial sine-wave response of the human visual system ," Vision Research, v o l. 8, pp. 1245-1263, 1968.
Werblin, F .S ., "The control o f se n sitiv ity in the r e t in a ," Scientific American, v o l. 228, no. 1 , pp. 70-79, January 1973.
Westheimer, G ., "O ptical and motor factors in the formation of the retin a l im age," Journal o f the Optical Society o f America, v o l. 53, pp. 86 -93 , January 1963.
W hiteside, J .A . , and M.S. Davidson, "Symmetrical appearance o f bright and dark Mach bands from an exponential illum ination gradien t," Journal o f the Optical Society o f America, v o l. 61, pp. 958-961, July 1971.

APPENDIX A
DESCRIPTION OF THE EXPERIMENT
I am very grateful to Dr William Lee, formerly at the Psychology
Department, University of Utah, for helping me in the preparation of
this experiment, conducting the experiment i t s e l f and co llectin g the
data.
1 / The experiment
Ten subjects o f both sexes, with normal v ision , were presented a
visual stimulus consisting of a v e r tic a l, monochromatic, exponentiated
sinusoidal pattern, sustaining a f ie ld o f view o f 8 degree, in a dimly
illuminated environment. As described in Chapter I I I , th is pattern
(Figures 9 to 12) corresponds to the following density d istribu tion :
sin (2 i f x) + a sin (6 i f x ) ,
For d ifferen t frequencies f , and several values o f the scaling factor a
(p o s it if , and in fe rio r or equal to 1 ) . A ll the stim uli presented had
same average density, and therefore same average luminance, and also
same contrast.
Two central bands, whose subjective appearance is influenced by
simultaneous brightness contrast, were indicated by small markers. The
subjects were requested to focus th eir vision at the center o f the
pattern, judge the relative brightness o f the two bands and verbally
report their judgement by one o f the follow ing answers:

133
L ( le ft ) : The band to the l e f t is brighter;
E (equal): The two bands are o f equal brightness.
I t was suggested that the judgement be made at the f i r s t glance.
A to ta l of five sets o f stim uli were presented, corresponding to
R (right): The band to the right is brighter;
the five fundamental frequenciesi
f l = .123 cycles/degree (1 period per picture)
f 2 = .246 cycles/degree (2 periods per picture)
f 3 = .369 cycles/degree (3 periods per picture)
f4 = .492 cycles/degree (4 periods per picture)
f 5 =1.230 cycles/degree (10 periods per picture)
Each set contained ten patterns obtained for ten values o f the
scaling co effic ien t a, from 0 .1 to 1 by steps o f 0.1'*'. For a = 1, the
pattern produces strong brightness contrast (Fig 9 a ); for a = 0 .1 , the
fa s t varying component disappears and the target bands are not v is ib le
anymore (Fig 9 b ). Therefore, these two extreme values o f the parameter
a provide opposite results in the estimation o f the relative brightness
o f the target bands. The purpose o f the experiment was to estimate the
intermediate value o f a for which the subjective brightness o f the
It was noticed that equal steps in the variation o f the parameter a do not seem to resu lt in equal step in the variation o f the subjective relative brightness, and therefore the averaging method used to obtain the data might be questionable. However, this point was not debated further, considering the re la tiv e ly important uncertainties in tr in sic to the subjective judgement i t s e l f . In addition, the technical problems associated with the production o f a large number o f carefu lly calibrated projection slid es restrained us to the option described here. In this respect, computer driven video monitor o f high visual q u ality , would prove to be o f great help for the experimental psychologist.

134
target bands would be comparable. This threshold value is taken to
indicate quantitatively the relative am plification o f the frequencies f
and 3f by the visual system, according to the model described herein.
Each set o f stim uli was presented to every subject four times, the
order of' the set being reversed from one presentation to the next. Thus
the su bjects, organized in five groups, were shown up to
5 * 4 * 20 = 400 stim u li. The groups d iffered by the order in which the
five sets ( f l , f2 f3 f4 f5) were presented.
I I / The results
The sig n ifica n t data o f th is experiment is the value of the
co e ffic ien t a, such that the target bands appear to be o f comparable
brightness. This value, defined as the point o f subjective equality
(PSE), was estimated, for a given subject and a given se t ( i .e . a given
frequency f ) , by averaging on the four presentations. The PSE for one
presentation was considered to be the mean o f the transition values T+
and T -, for which the subjective judgments switched from R to E, and E
to L, respectively . The procedure is explained in the following
example, using the typical data o f Table I :
average of T+ = [T+] = .65
average of T- = [T-] = .425
interval o f uncertainty
IU = [T+] - [T-] = .225
point o f subjective equality
PSE = ( [T + ] + [T - ] ) /2 = .5375

Table II and I I I contain the resu lts obtained thereby from the
experimental data. Averaging of these results over the ten subjects
yield s the following mean and standard deviation (s . d e v .) :
Point o f subjective equality
set f l f 2 f 3 f4 f 5
mean .47 i—1 LO CO .49 .57
s . dev. .13 O i—1 o i—i .15 COo
Interval o f uncertainty
set f l f 2 f 3 f4 f5
mean .14 .26 .23 .29 .30


Subject 1 (gr 1)
Subject 2 (gr 1)
Subject 3 (gr 2)
Subject 4 (gr 2)
Subject 5 (gr 3)
Subject 6 (gr 3)
Subject 7 (gr 4)
Subject 8 (gr 4)
Subject 9 (gr 5)
Subject 10 (gr 5)
TABLE II
POINT OF SUBJECTIVE EQUALITY
Set
f l f 2 f 3 f 4 f 5
.5375 .4563 .4000 .4000 .4813
.5313 .5625 .5500 .5813 .6750
.4563 .3313 .5563 .5875 .5375
.3563 .3875 .2000 .3063 .4688
.4813 .4938 .4563 .4688 .5188
.4688 .5188 .4938 .5438 .6875
.6500 .6063 .5313 .7125 .5750
.4875 .4013 .5375 .6375 .5438
.5875 . 7063 .5813 .6188 .6938
.5188 .6000 .4563 .4438 .4813


139
These experimental data were considered to indicate, as an average
trend, that the point o f subjective equality was about constant over the
range of frequencies studied, equal to approximately 0 .5 0 . The
im plications o f th is resu lt are developed in Chapters I I I and IV.
The somewhat large values o f the intervals o f uncertainty r e fle c t
the variations in the judgments o f each subject for the four
presentations o f the same stimulus pattern. This variation is apparent
on the typical results o f Table I . I t is believed that th is factor
could have been improved by some training o f the observers, otherwise
naive volunteer students. Averaging of the results was accomplished in
order to eliminate some o f the uncertainty.
However, i t is the opinion o f the author, from personnal
experience, that the technique u tilize d here should lead nonetheless to
more precise measurements than other techniques. In other words, i t
seems easier for an observer to compare the relative brightness o f two
target bands, than to estimate the brightness o f a Mach band [I>owry and
De Palma 1961] [Bryngdahl 1964], or compare the contrast o f two gratings
[Davidson 1968]. An important advantage o f the present technique is
that the stimulus is se'if-testab'ie3 that is to say no external,
adjacent or successive reference stimulus need be presented, as is the
case with the other methods.
As we mention in Chapter I I I , a lim itation o f the technique is that
the range o f frequency which can be p ra ctica lly tested is bounded. The
restrictio n s stem from, on the low end, the problems o f f ie ld o f view
III/ Conclusions

140
and isotropy o f the visual system, and on the high end, the confusion of
frin ges. But, as we also indicated, these lim itations are su p e rfic ia l,
since we are mainly testin g brightness contrast mechanisms and since the
band o f frequencies which can possibly be tested (roughly from 0 .1 to 4
cycles/degree) is the fundamental region, as far as contrast phenomena
are concerned.
The main improvement on the experimental design would probably be
the use o f a real-tim e d ig ita l display. For instance, a high quality TV
scope, driven by a d ig ita l video data disk, would allow a very fle x ib le
experimental procedure. The display program could sense an adjustable
potentiometer, so that the observer could control d irectly the relative
brightness o f the two target bands, i . e . the parameter a, and adjust
the pattern for th eir best matching. Such a real-tim e, or nearly
real-tim e, set-up would also allow to use the family o f patterns
described in Chapter IV, in order to te s t various contrast e ffe c ts . The
design actually used in the present experiment required the manufacture
o f numerous calibrated projection s lid e s , and the preparation work
involved prevented us from more extensive experimental stu dies.

APPENDIX B
THE MATHEMATICS OF
TWO-DIMENSIONAL LINEAR SYSTEMS
1 / Circular symmetry
Let S be a two-dimensional linear stationary system, such that
the impulse response (or point spread function) h(x,y) has circular
symmetry, as is the case with a typical d iffractio n lim ited optical
system [Goodman 1968]. The frequency response (or modulation transfer
function, noted MTF) H (u ,v ), where u and v are the rectangular sp atial
frequencies associated with the rectangular coordinates x and y , also
has circular symmetry. This is ea sily demonstrated by a transformation
into polar coordinates o f the Fourier transform equation relatin g h(x,y)
and H (u ,v ); when expressed in polar coordinates, the impulse response
h (r) = h (x ,y ) ,
and the MTF
H(p) = H(u,v) ,
are related by the Hankel transform (for a demonstration o f these
c la ssic a l properties, see for instance [Goodman 1968, p . 1 1 ] ) .
I I / Equivalent one-dimensional system
I f we r e s tr ic t now the inputs I (x ,y) to a two-dimensional linear
stationary system (not necessarily with circular symmetry), to be
dependent cn only one variable x:
I ( x , y ) = 1 } ( x ) ,

0 (x,y) = Ii (x) * h(x,y) ^
— where the symbol * represents the convolution operator— is also
dependent on the variable x only, as we observe by developing the
convolution integral o f equation (1):
+00Ox (x) = 0 (x,y) = I f Ii (x—£) h(5,n) dn. (2)
_CO
Therefore, in th is case, the linear system S’ 2 is equivalent to a
one-dimensional system S with impulse response h^(x ) :
Oj (x) = 11(x) * h j ( x ) .
Equation (2) can be written in the form:+ 0 0 /" + 0 0 n
Oi(x) = I Ii(x-S) 1/ h(?,n) d n ) d 5 # (3)— 00 \ _oo J
which shows that the impulse response h^(x) o f the equivalent system
S’1 i s :+ 0 0
hi(x) = I h(x,y) dy,—00
i . e . the lin e spread function o f system S 2.
142
then the output

APPENDIX C
THE COMPUTER SYSTEM
The d ig ita l computer system u tiliz e d for experimental picture
processing, among other p ro jects , is described in Figure 41. The
graphical output devices are i t s main asset for interactive experiments.
The storage scope is used to display graphical information such as
frequency responses, line-spread functions, inputs and outputs at
various stages o f the model, predicted subjective brightness, e t c . , in
one as w ell as two dimensions (Figure 21) .
The te s t patterns are produced on a high quality cathode ray tube
capable o f a resolution o f at le a st 1024 by 1024 elements, with some
2048 levels o f in ten sity . However, the display is monitored d irectly by
computer program, and therefore does not have real-tim e capability .
Final output must be obtained on photographic film , for black and white
as well as color p ictu res. Polaroid film is used commonly for
preliminary experiments. When more precise control o f the experimental
viewing conditions are desired (Appendix A ), projection transparencies
are used.
An important aspect o f the picture production routine is the
calibration procedure, which guarantees that the fin a l photographic
in te n sitie s correspond very c losely to the d ig ita l data intended to be
displayed. Important d istortions are produced by the CRT phosphor and
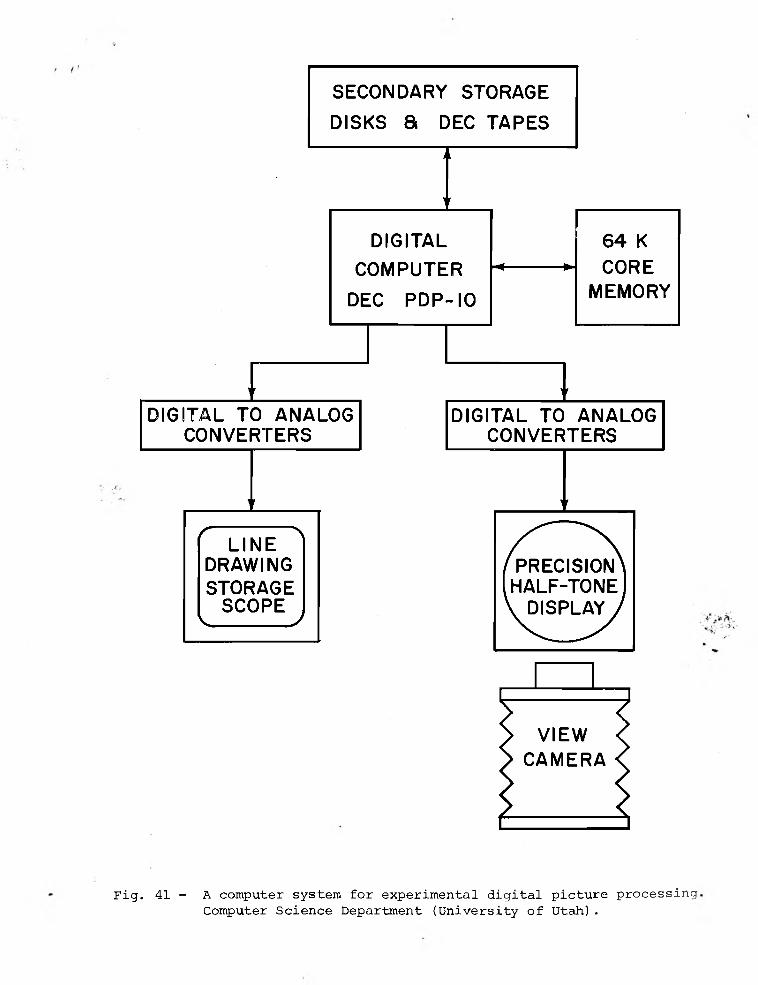
Fig. 41 - A computer system for experimental d ig ita l picture processing Computer Science Department (University o f Utah).

(c)
Fig. 42 - Linear density gray scale used for picture ca lib ra tio n :
(a) compensated for photographic film d isto rtio n ;
(b) uncompensated.
(c) Compensation curve used for Polaroid f ilm, Type 52; compensation is done by d ig ita l table look-up before11 b it D/A conversion.

the photographic fi lm, which do not respond lin ea rly . The phosphor
non-linearity is em pirically estimated as a cube power law. The film
non-linearity is illu stra ted in Figure 42b, showing a linear density
gray scale compensated for phosphor d istortion only. A properly
compensated gray scale is shown in Figure 42a: for th is pattern a
linear relation is v erified between the densitometric measurements and
the logarithm of the corresponding d ig ita l in ten sity . The compensation
is performed d ig ita lly by table look-up, using a compensation curve such
as that of Figure 42c. The compensation curve is obtained from
densitometric measurements of the uncompensated pattern (Figure 42b) .
Although th is system does not allow real-tim e display, i t has
software features allowing interactive and fle x ib le experimentation. I t
can be conceived of as the equivalent of a desk calculator, operating on
waveforms ( i . e . arrays) instead of single re g iste rs , and performing a l l
conceivably useful unary and binary operations, in addition to storage,
input-output, d isplay, and graphical data d efin itio n .