Digital Leaders Remuneration Report 2014
28
DIGITAL LEADERS REMUNERATION REPORT 2014
-
Upload
theupgroup -
Category
Documents
-
view
223 -
download
2
description
Providing insight into digital executives' financial compensation across a range of functions, levels and company types. Design by Jack Hagley www.jackhagley.com
Transcript of Digital Leaders Remuneration Report 2014
DIGITAL LEADERSREMUNERATION
REPORT 2014

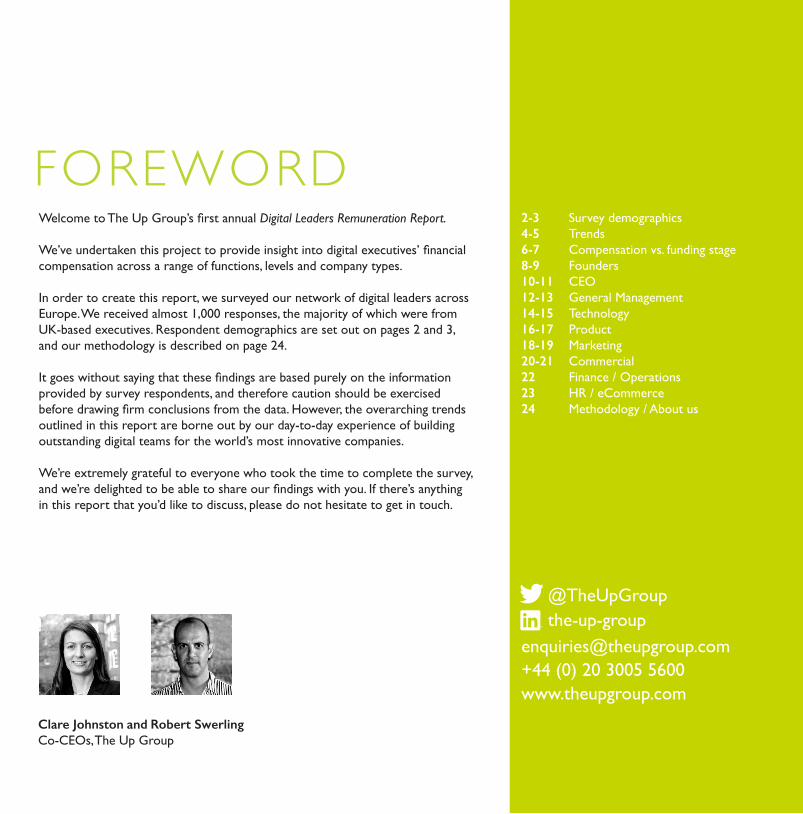
FOREWORDWelcome to The Up Group’s first annual Digital Leaders Remuneration Report.
We’ve undertaken this project to provide insight into digital executives’ financial compensation across a range of functions, levels and company types.
In order to create this report, we surveyed our network of digital leaders across Europe. We received almost 1,000 responses, the majority of which were from UK-based executives. Respondent demographics are set out on pages 2 and 3, and our methodology is described on page 24.
It goes without saying that these findings are based purely on the information provided by survey respondents, and therefore caution should be exercised before drawing firm conclusions from the data. However, the overarching trends outlined in this report are borne out by our day-to-day experience of building outstanding digital teams for the world’s most innovative companies.
We’re extremely grateful to everyone who took the time to complete the survey, and we’re delighted to be able to share our findings with you. If there’s anything in this report that you’d like to discuss, please do not hesitate to get in touch.
2-3 Survey demographics4-5 Trends6-7 Compensation vs. funding stage 8-9 Founders10-11 CEO12-13 General Management14-15 Technology16-17 Product18-19 Marketing20-21 Commercial22 Finance / Operations23 HR / eCommerce24 Methodology / About us
Clare Johnston and Robert SwerlingCo-CEOs, The Up Group
[email protected]+44 (0) 20 3005 5600www.theupgroup.com
@TheUpGroupthe-up-group
DIG
ITA
L LE
AD
ERS
REm
un
ERAT
Ion
REP
oRT
201
4
Head of …
Manager
IndividualContributor
Managing DirectorSenior Director
Director
EVP / SVP / VP
C-Level
Technology
Strategy
Product
Operations
Marketing
Insight / Intelligence
HR
General Management
Finance
eCommerce
Commercial
CEO
Advertising
Commerce
Dating
Energy
Entertainment
Financial Services
FMCG
Hardware
Leisure
Charity/NFP
Other
Search
Social
Software
Travel
1 to 50
51 - 200
201 - 500
501 - 1000
1000 +
Listed / Public
PE-backed
Privately owned
Male
Female
G E N D E R L E V E L F U N C T I O N C O M PA N Y S I Z E C O M PA N Y OW N E R S H I PS E C TO R
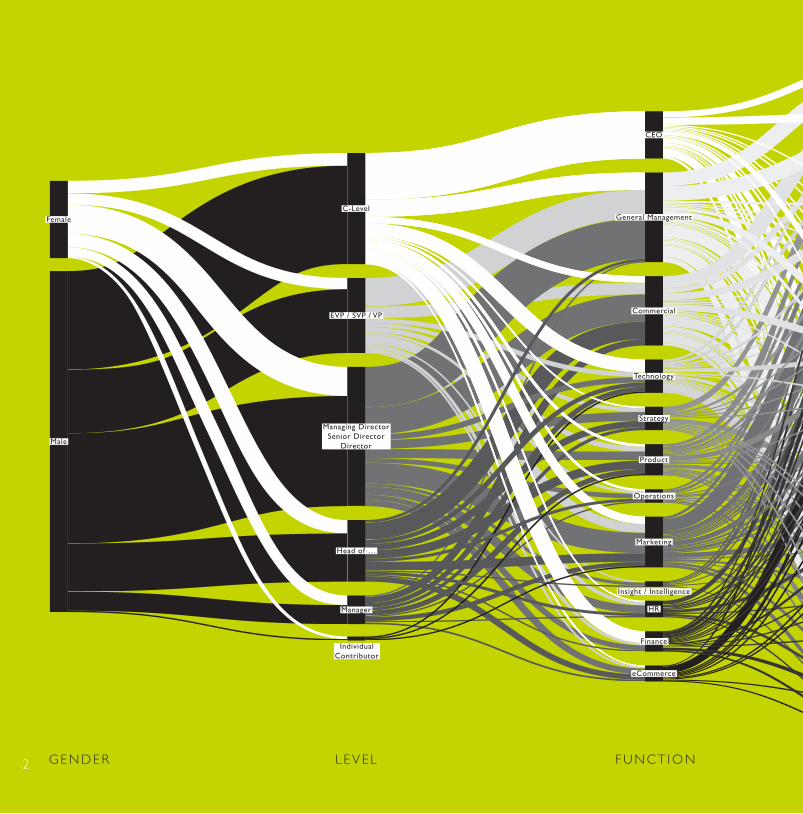
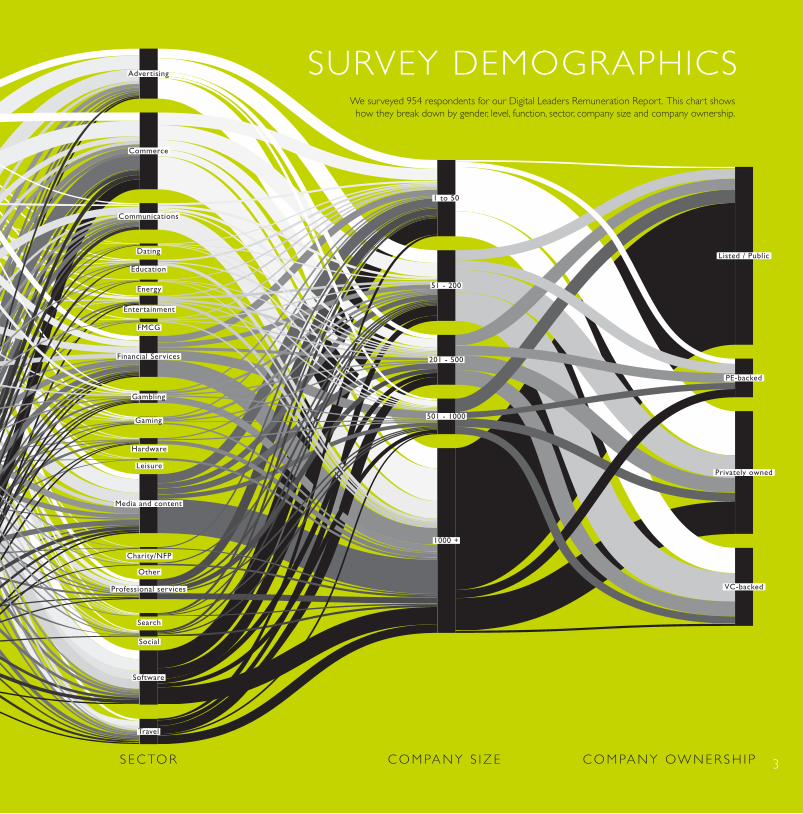
SURVEY DEMOGRAPHICSWe surveyed 954 respondents for our Digital Leaders Remuneration Report. This chart shows how they break down by gender, level, function, sector, company size and company ownership.
Communications
Education
Gambling
Gaming
Media and content
Professional services VC-backed
32
Head of …
Manager
IndividualContributor
Managing DirectorSenior Director
Director
EVP / SVP / VP
C-Level
Technology
Strategy
Product
Operations
Marketing
Insight / Intelligence
HR
General Management
Finance
eCommerce
Commercial
CEO
Advertising
Commerce
Dating
Energy
Entertainment
Financial Services
FMCG
Hardware
Leisure
Charity/NFP
Other
Search
Social
Software
Travel
1 to 50
51 - 200
201 - 500
501 - 1000
1000 +
Listed / Public
PE-backed
Privately owned
Male
Female
G E N D E R L E V E L F U N C T I O N C O M PA N Y S I Z E C O M PA N Y OW N E R S H I PS E C TO R
SURVEY DEMOGRAPHICSWe surveyed 954 respondents for our Digital Leaders Remuneration Report. This chart shows how they break down by gender, level, function, sector, company size and company ownership.
Communications
Education
Gambling
Gaming
Media and content
Professional services VC-backed
32
DIG
ITA
L LE
AD
ERS
REm
un
ERAT
Ion
REP
oRT
201
4
TRENDS
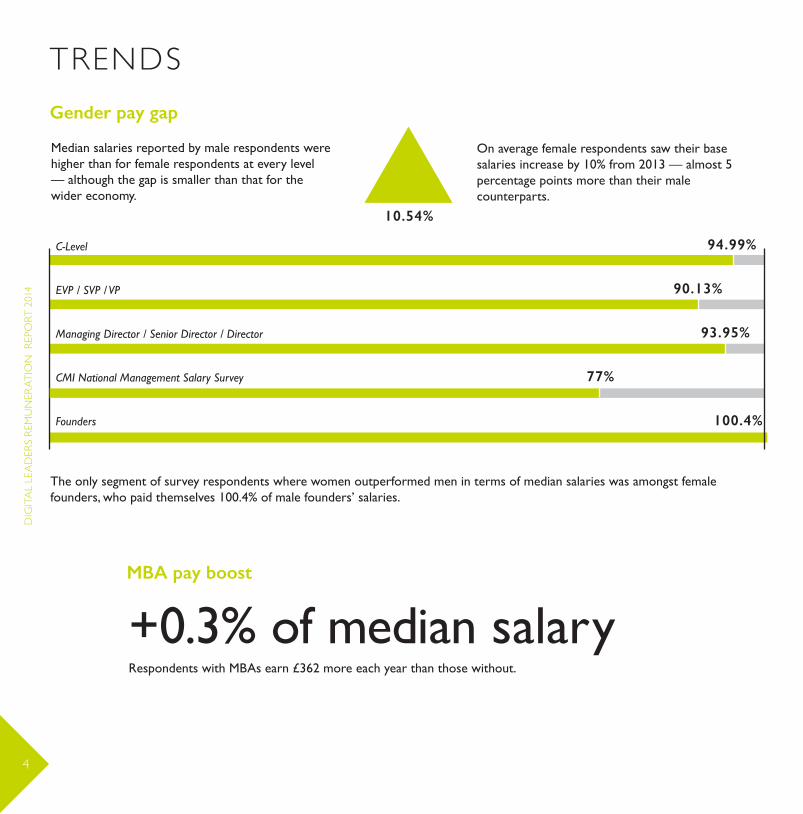
Median salaries reported by male respondents were higher than for female respondents at every level— although the gap is smaller than that for the wider economy.
On average female respondents saw their base salaries increase by 10% from 2013 — almost 5 percentage points more than their male counterparts.
The only segment of survey respondents where women outperformed men in terms of median salaries was amongst female founders, who paid themselves 100.4% of male founders’ salaries.
Respondents with MBAs earn £362 more each year than those without.
Gender pay gap
MBA pay boost
Median male salary
10.54%
+0.3% of median salary
94.99%
90.13%
93.95%
77%
100.4%
C-Level
Managing Director / Senior Director / Director
CMI National Management Salary Survey
Founders
EVP / SVP / VP
54
DIG
ITAL LEA
DERS REm
un
ERATIon
REPoRT 2014
TRENDS
Median salaries reported by male respondents were higher than for female respondents at every level— although the gap is smaller than that for the wider economy.
On average female respondents saw their base salaries increase by 10% from 2013 — almost 5 percentage points more than their male counterparts.
The only segment of survey respondents where women outperformed men in terms of median salaries was amongst female founders, who paid themselves 100.4% of male founders’ salaries.
Respondents with MBAs earn £362 more each year than those without.
Gender pay gap
MBA pay boost
Median male salary
10.54%
+0.3% of median salary
94.99%
90.13%
93.95%
77%
100.4%
C-Level
Managing Director / Senior Director / Director
CMI National Management Salary Survey
Founders
EVP / SVP / VP
TRENDS
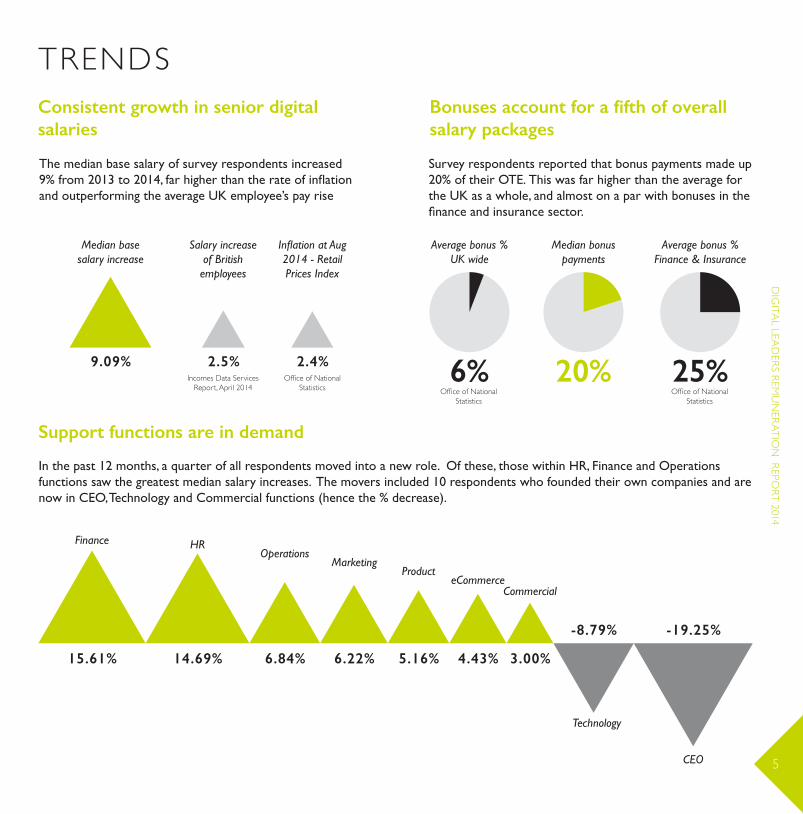
The median base salary of survey respondents increased 9% from 2013 to 2014, far higher than the rate of inflation and outperforming the average UK employee’s pay rise
Survey respondents reported that bonus payments made up 20% of their OTE. This was far higher than the average for the UK as a whole, and almost on a par with bonuses in the finance and insurance sector.
In the past 12 months, a quarter of all respondents moved into a new role. Of these, those within HR, Finance and Operations functions saw the greatest median salary increases. The movers included 10 respondents who founded their own companies and are now in CEO, Technology and Commercial functions (hence the % decrease).
Consistent growth in senior digital salaries
Support functions are in demand
Bonuses account for a fifth of overall salary packages
20% 25%6%
Average bonus %UK wide
Median bonus payments
Average bonus %Finance & Insurance
CEO
CommercialeCommerce
Finance HR
MarketingOperations
Product
Technology
Salary increase of British employees
Median base salary increase
Incomes Data Services Report, April 2014
9.09% 2.5% 2.4%
Inflation at Aug 2014 - Retail Prices Index
Office of National Statistics Office of National
StatisticsOffice of National
Statistics
-19.25%
3.00%4.43%15.61% 14.69% 6.22%6.84% 5.16%
-8.79%
54
PUBLICBase
Bonus
Salary % Change
Equity*
Benefits
Happiness
Previous Company
C-Level
EVP/SVP/VP
MD/Director
C-Level
EVP/SVP/VP
MD/Director
Pension
Healthcare
Company car
Living allowance
Gym
School fees
Life insurance
Other benefits
200,000
155,000
130,000
85,178
100,000
80,066
44,073
56,093
40,033
EVP/SVP/VP
MD
C-Level
86%
83%
41%
6%
19%
4%
62%
10%
PublicPE
Private VC
56%9%
24% 12%
PUBLIC
+11.71%
+3.33%
+8.33%
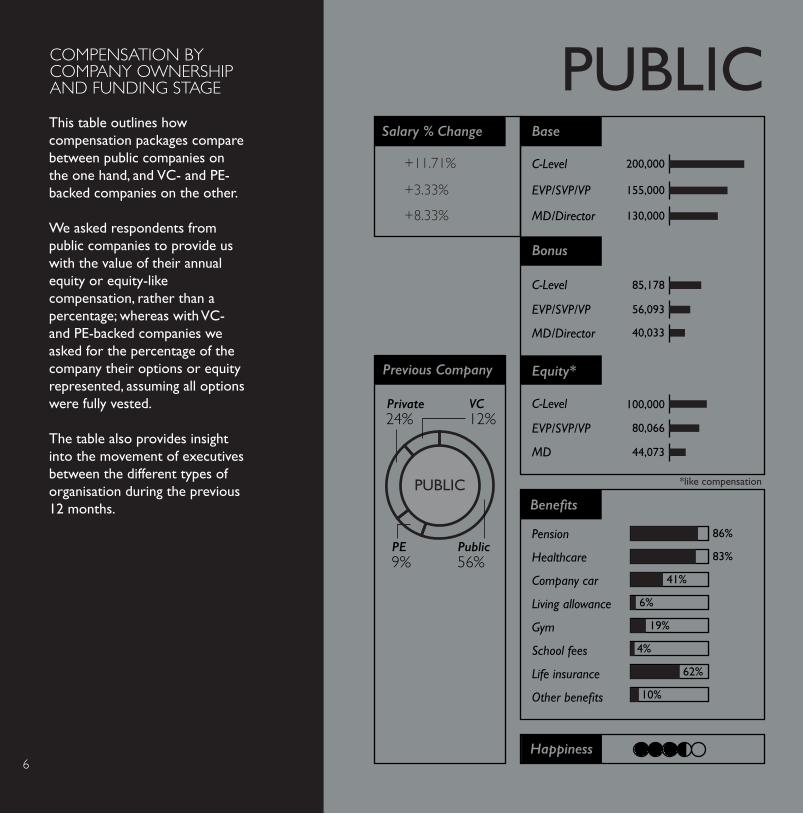
This table outlines how compensation packages compare between public companies on the one hand, and VC- and PE- backed companies on the other.
We asked respondents from public companies to provide us with the value of their annual equity or equity-like compensation, rather than a percentage; whereas with VC- and PE-backed companies we asked for the percentage of the company their options or equity represented, assuming all options were fully vested. The table also provides insight into the movement of executives between the different types of organisation during the previous 12 months.
*like compensation
COMPENSATION BYCOMPANY OWNERSHIPAND FUNDING STAGE
6

Base
Bonus
Series A Series B Series C+ PE Salary % Change
Equity
Benefits
Happiness
Previous Company
120,000 132,500 140,000 180,000
115,668 117,000 130,000 136,000
85,000
EVP/SVP/VP
MD/Director
C-Level 29,000 11,010 30,000 52,000
64,106
25,000
30,000
30,000
22,000
28,731
10,000
10,000
90,272
C-Level
EVP/SVP/VP
MD/Director 120,000 107,696
VC & PE
C-Level 4.5% 2%1.75% 1.7%
Pension
Healthcare
Company car
Living allowance
Gym
School fees
Life insurance
Other benefits
66%
58%
28%
0%
12%
2%
40%
22%
21%
35%
6%
3%
3%
0%
24%
50%
36%
47%
4%
2%
4%
0%
18%
42%
52%
64%
10%
4%
14%
4%
32%
27%
Public
PEPrivate
VC
VC
27%
3%20%
50%
Public
PEPrivate
VC
PE
35%
22%30%
13%
+1.49%
+6.84%
+4%
7
DIG
ITA
L LE
AD
ERS
REm
un
ERAT
Ion
REP
oRT
201
4
FOUNDERS
4.38
1 - 10
11-50
200+
51-200
0
SIZE OF TEAMRATIO
HAPPINESS
MBA
NoYes Studying
EDUCATION
LowerSecondary
School
UpperSecondary
School
BachelorsDegree
Masters PhD /Doctorate
Other Other
Internal moveNew challenge
Greater financial compensation Headhunted by search firm
Change of location Direct approach from company
Greater responsibility Direct approach by former colleague
Change of sector / industry Introduced through network
Desire to work at specific company Founded the company
Redundancy Direct application
HOW THEY MOVEDREASON FOR MOVING
TIME IN ROLE
1-3y 10y+3-5y 5-10y6-12m6m</ 5
Men Women
98
DIG
ITAL LEA
DERS REm
un
ERATIon
REPoRT 2014
FOUNDERS
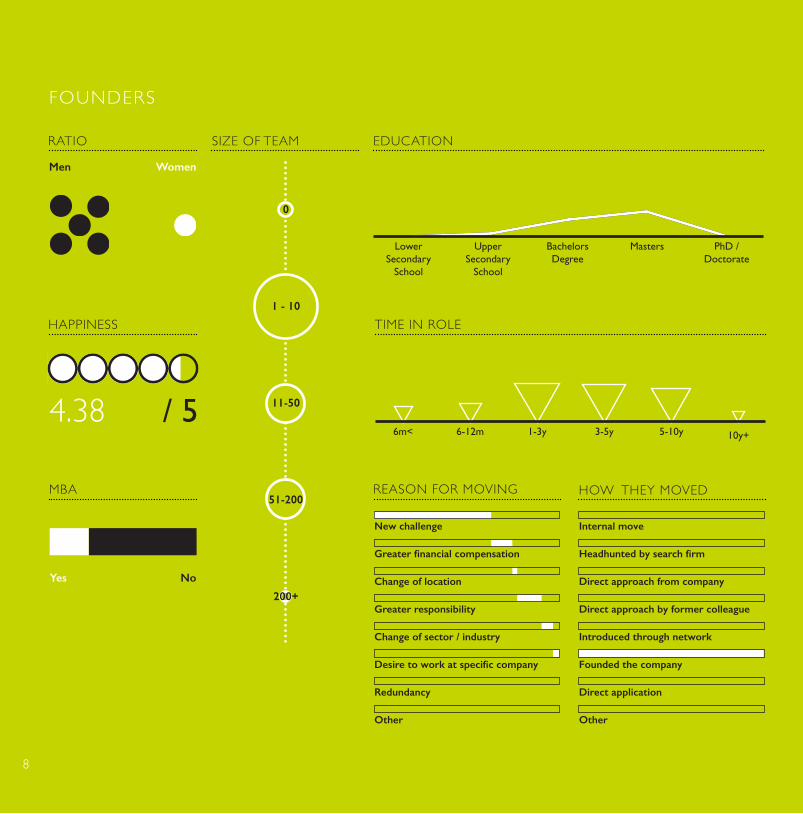
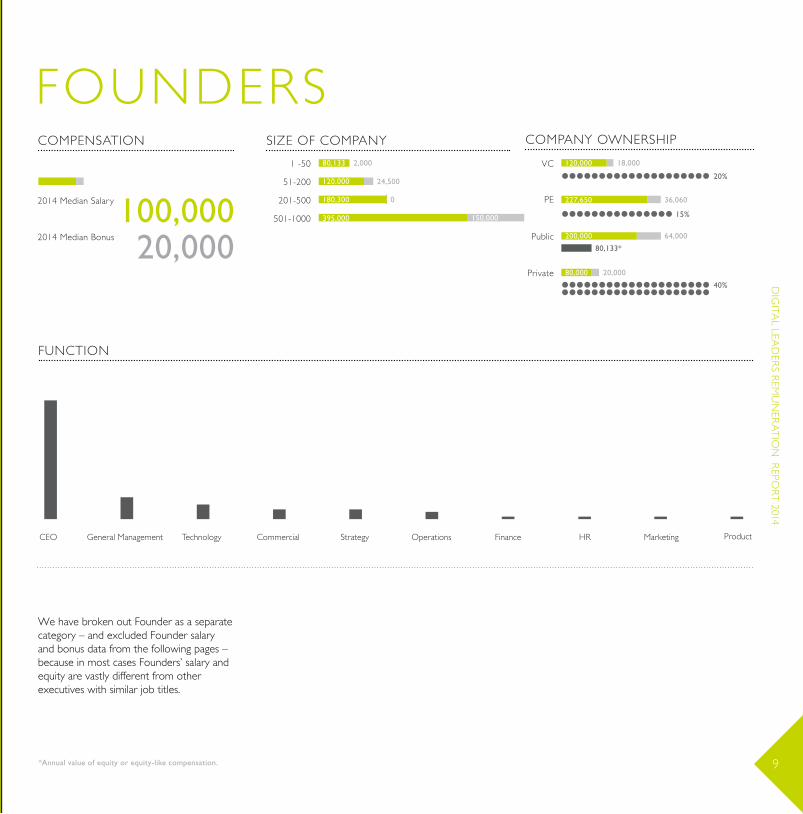
We have broken out Founder as a separate category – and excluded Founder salary and bonus data from the following pages – because in most cases Founders’ salary and equity are vastly different from other executives with similar job titles.
FUNCTION
COMPENSATION SIZE OF COMPANY COMPANY OWNERSHIP1 -50
51-200
201-500
1000 +
501-1000
2014 Median Salary
2014 Median Bonus
VC
PE
Public
Private
20%
15%
80,133*
100,00020,000
80,133
120,000
180,300
395,000
2,000
24,500
0
150,000
120,000 18,000
40%
227,650 36,060
200,000 64,000
80,000 20,000
ProductMarketingHRFinanceOperationsStrategyCommercialTechnologyGeneral ManagementCEO
*Annual value of equity or equity-like compensation. 98
DIG
ITA
L LE
AD
ERS
REm
un
ERAT
Ion
REP
oRT
201
4
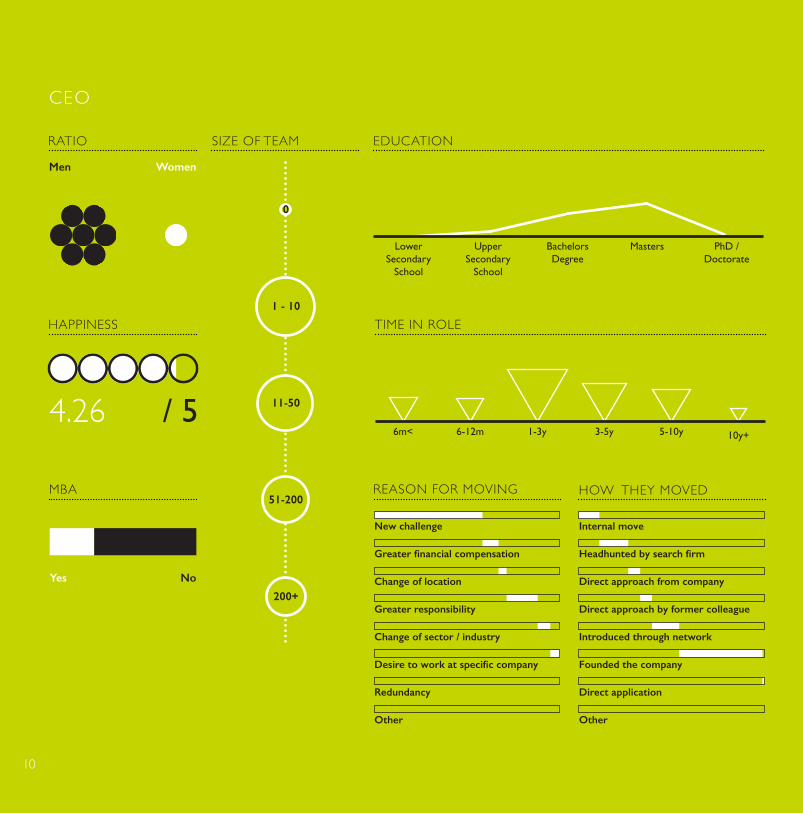
CEO
4.26
1 - 10
11-50
200+
51-200
0
SIZE OF TEAMRATIO
HAPPINESS
MBA
NoYes Studying
EDUCATION
LowerSecondary
School
UpperSecondary
School
BachelorsDegree
Masters PhD /Doctorate
Other Other
Internal moveNew challenge
Greater financial compensation Headhunted by search firm
Change of location Direct approach from company
Greater responsibility Direct approach by former colleague
Change of sector / industry Introduced through network
Desire to work at specific company Founded the company
Redundancy Direct application
HOW THEY MOVEDREASON FOR MOVING
TIME IN ROLE
1-3y 10y+3-5y 5-10y6-12m6m</ 5
Men Women
1110
DIG
ITAL LEA
DERS REm
un
ERATIon
REPoRT 2014
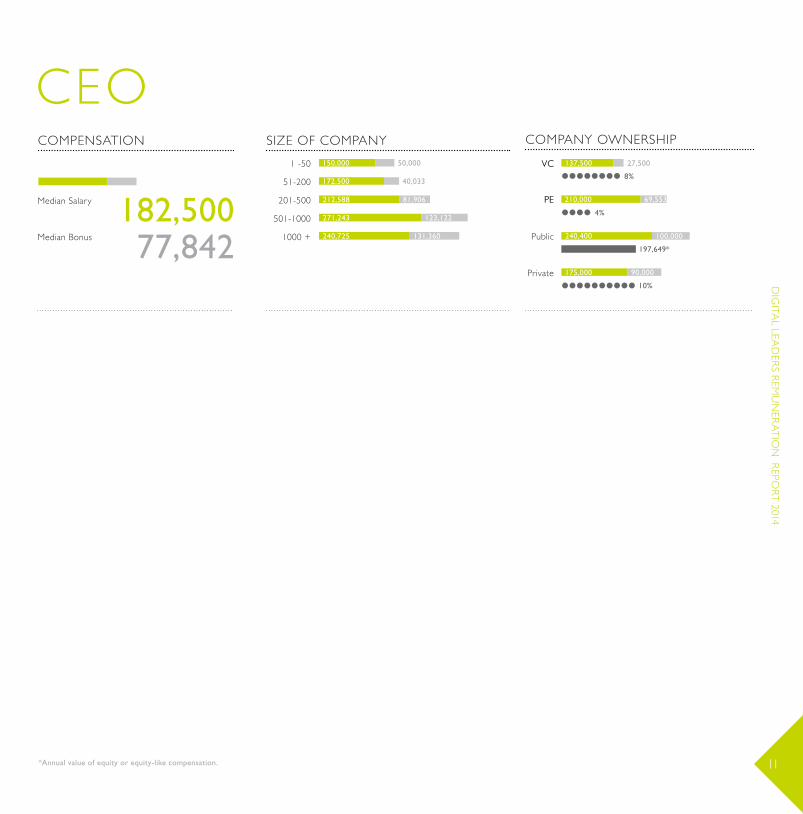
CEOCOMPENSATION SIZE OF COMPANY COMPANY OWNERSHIP
1 -50
51-200
201-500
1000 +
501-1000
Median Salary
Median Bonus
VC
PE
Public
Private
VC
PE182,50077,842
150,000
172,500
212,588
271,243
240,725
50,000
40,033
81,906
123,122
131,360
137,500 27,500
210,000 69,553
240,400 100,000
175,000 90,000
8%
10%
4%
197,649*
*Annual value of equity or equity-like compensation. 1110
DIG
ITA
L LE
AD
ERS
REm
un
ERAT
Ion
REP
oRT
201
4
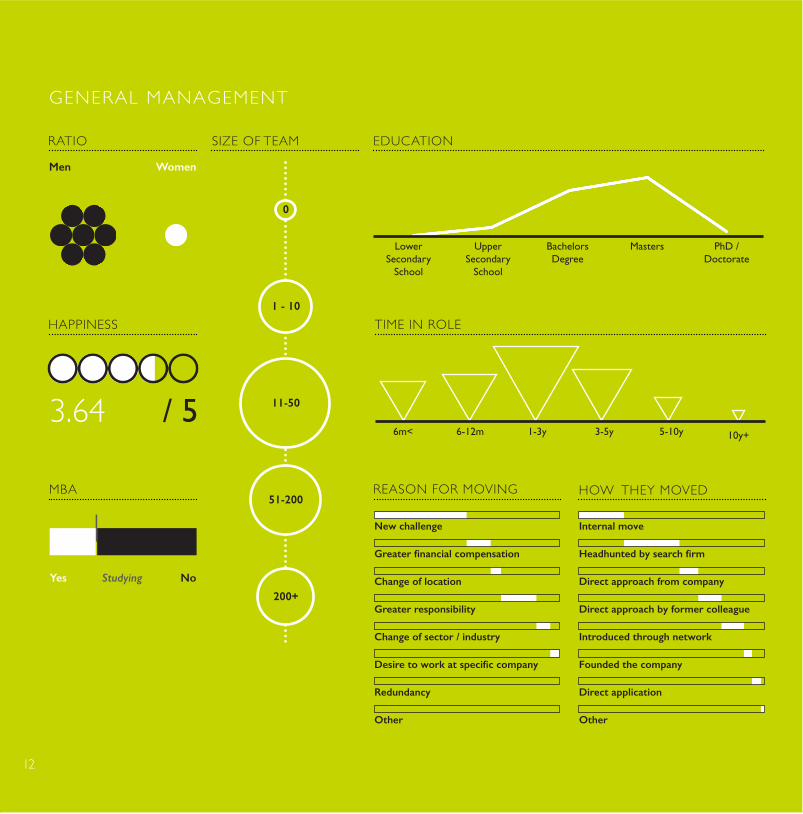
GENERAL MANAGEMENT
3.64
1 - 10
11-50
200+
51-200
0
SIZE OF TEAMRATIO
HAPPINESS
MBA
NoYes Studying
EDUCATION
LowerSecondary
School
UpperSecondary
School
BachelorsDegree
Masters PhD /Doctorate
Other Other
Internal moveNew challenge
Greater financial compensation Headhunted by search firm
Change of location Direct approach from company
Greater responsibility Direct approach by former colleague
Change of sector / industry Introduced through network
Desire to work at specific company Founded the company
Redundancy Direct application
HOW THEY MOVEDREASON FOR MOVING
TIME IN ROLE
1-3y 10y+3-5y 5-10y6-12m6m</ 5
Men Women
1312
DIG
ITAL LEA
DERS REm
un
ERATIon
REPoRT 2014
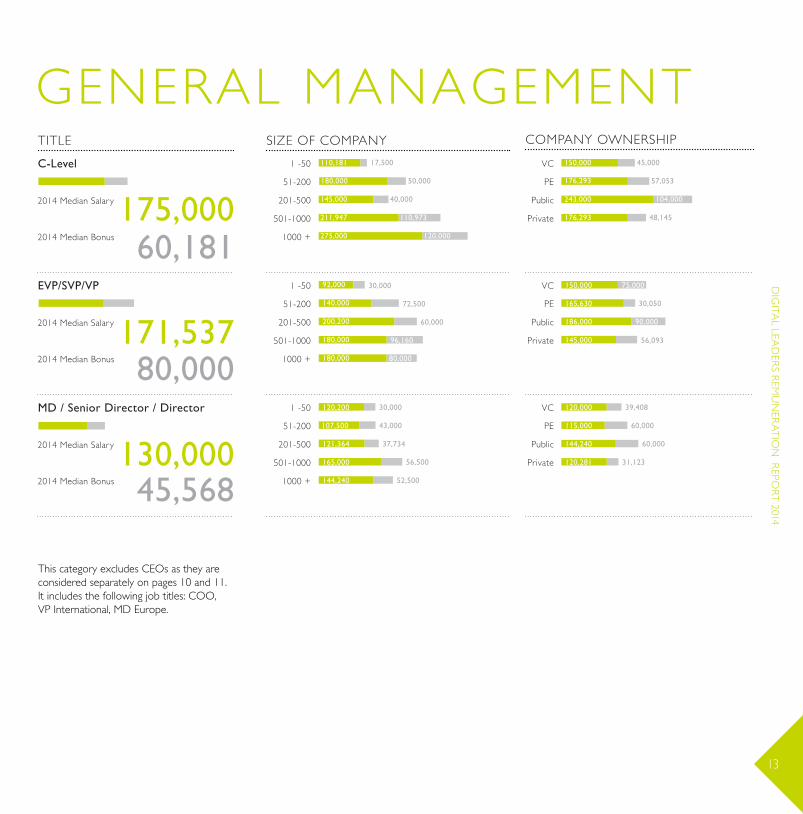
GENERAL MANAGEMENTTITLE SIZE OF COMPANY COMPANY OWNERSHIP
1 -50
51-200
201-500
1000 +
501-1000
2014 Median Salary
2014 Median Bonus
VC
PE
Public
Private
1 -50
51-200
201-500
1000 +
501-1000
2014 Median Salary
2014 Median Bonus
VC
PE
Public
Private
1 -50
51-200
201-500
1000 +
501-1000
2014 Median Salary
2014 Median Bonus
VC
PE
Public
Private
C-Level
EVP/SVP/VP
MD / Senior Director / Director
175,00060,181
171,53780,000
130,00045,568
110,181
180,000
145,000
211,947
275,000
17,500
50,000
40,000
110,973
120,000
150,000 45,000
176,293 57,053
243,000 104,000
176,293 48,145
92,000
140,000
200,200
180,000
180,000
30,000
72,500
60,000
96,160
80,000
150,000 75,000
165,630 30,050
186,000 90,000
145,000 56,093
120,200
107,500
121,364
165,000
144,240
30,000
43,000
37,734
56,500
52,500
120,000 39,408
115,000 60,000
144,240 60,000
120,281 31,123
This category excludes CEOs as they are considered separately on pages 10 and 11. It includes the following job titles: COO,VP International, MD Europe.
1312
DIG
ITA
L LE
AD
ERS
REm
un
ERAT
Ion
REP
oRT
201
4
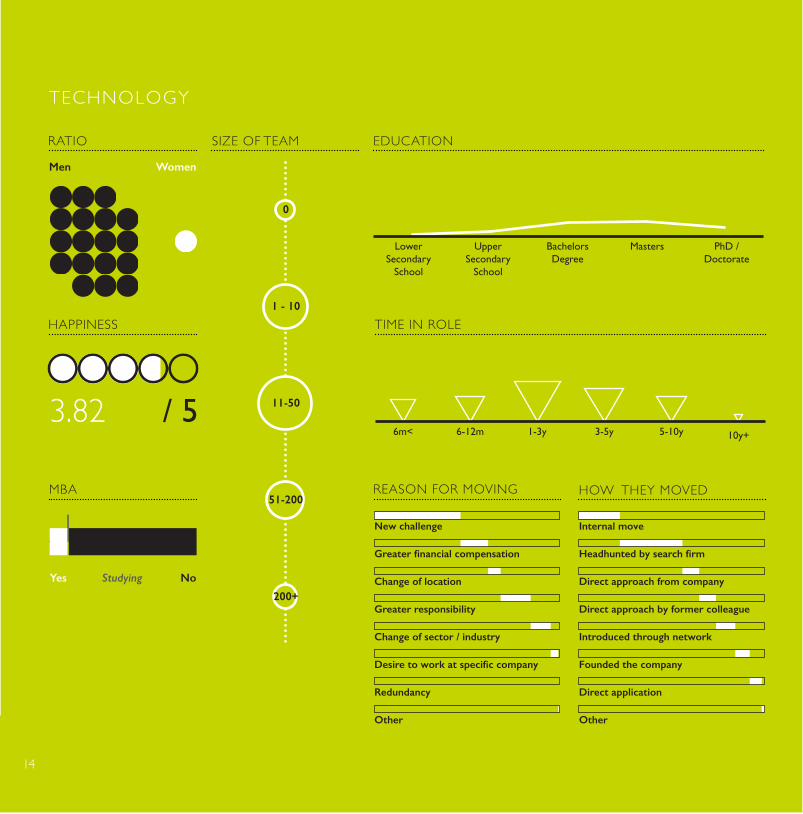
TECHNOLOGY
1 - 10
11-50
200+
51-200
0
SIZE OF TEAMRATIO
HAPPINESS
MBA
NoYes Studying
EDUCATION
LowerSecondary
School
UpperSecondary
School
BachelorsDegree
Masters PhD /Doctorate
Other Other
Internal moveNew challenge
Greater financial compensation Headhunted by search firm
Change of location Direct approach from company
Greater responsibility Direct approach by former colleague
Change of sector / industry Introduced through network
Desire to work at specific company Founded the company
Redundancy Direct application
HOW THEY MOVEDREASON FOR MOVING
TIME IN ROLE
1-3y 10y+3-5y 5-10y6-12m6m</ 5
Men Women
3.82
1514
DIG
ITAL LEA
DERS REm
un
ERATIon
REPoRT 2014
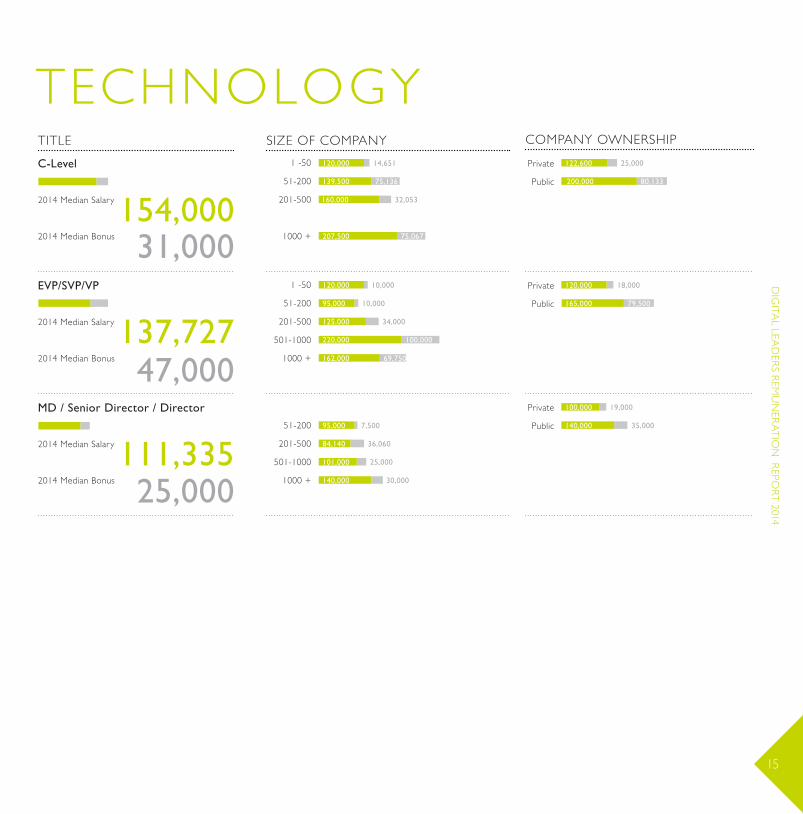
TECHNOLOGYTITLE SIZE OF COMPANY COMPANY OWNERSHIP
1 -50
51-200
201-500
1000 +
501-1000
2014 Median Salary
2014 Median Bonus
Public
Private
1 -50
51-200
201-500
1000 +
501-1000
2014 Median Salary
2014 Median Bonus
Public
Private
1 -50
51-200
201-500
1000 +
501-1000
2014 Median Salary
2014 Median Bonus
Public
Private
C-Level
EVP/SVP/VP
MD / Senior Director / Director
120,000
139,500
160,000
207,500
14,651
75,136
32,053
75,067
122,600 25,000
200,000 80,133
154,00031,000
137,72747,000
111,33525,000
120,000
95,000
125,000
220,000
162,000
10,000
10,000
34,000
100,000
69,750
120,000 18,000
165,000 79,500
95,000
84,140
101,000
140,000
7,500
36,060
25,000
30,000
100,000 19,000
140,000 35,000
1514
DIG
ITA
L LE
AD
ERS
REm
un
ERAT
Ion
REP
oRT
201
4
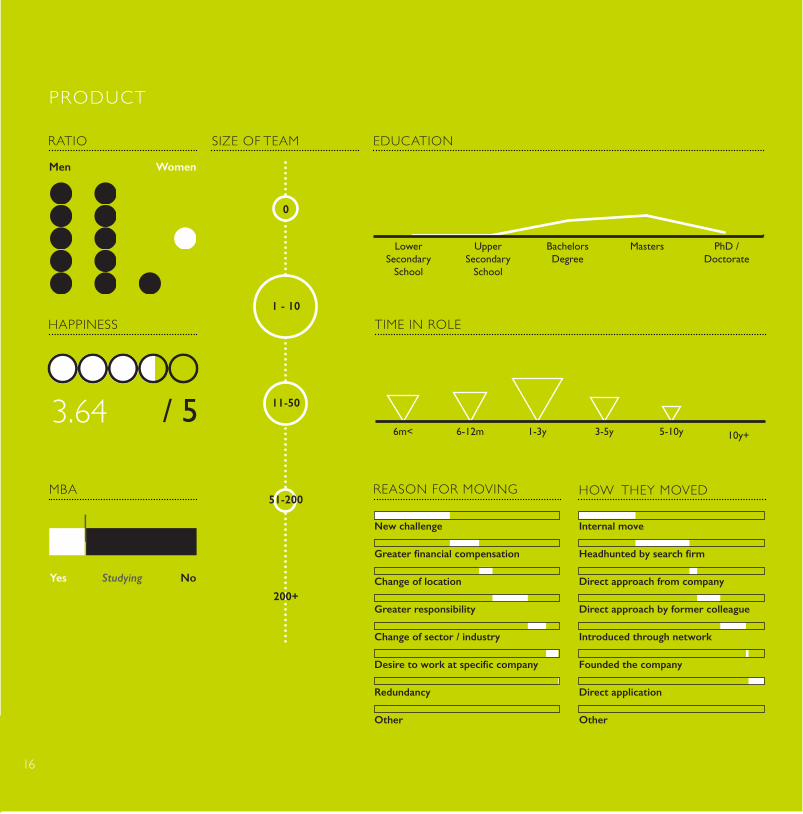
PRODUCT
3.64
1 - 10
11-50
200+
51-200
0
SIZE OF TEAMRATIO
HAPPINESS
MBA
NoYes Studying
EDUCATION
LowerSecondary
School
UpperSecondary
School
BachelorsDegree
Masters PhD /Doctorate
Other Other
Internal moveNew challenge
Greater financial compensation Headhunted by search firm
Change of location Direct approach from company
Greater responsibility Direct approach by former colleague
Change of sector / industry Introduced through network
Desire to work at specific company Founded the company
Redundancy Direct application
HOW THEY MOVEDREASON FOR MOVING
TIME IN ROLE
1-3y 10y+3-5y 5-10y6-12m6m</ 5
Men Women
1716
DIG
ITAL LEA
DERS REm
un
ERATIon
REPoRT 2014
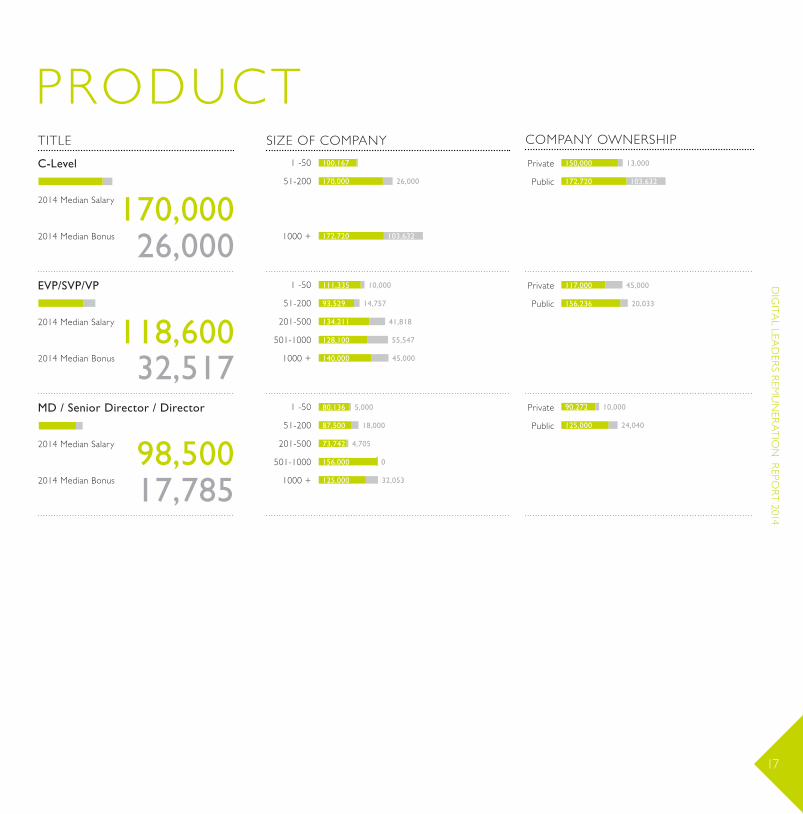
PRODUCTTITLE SIZE OF COMPANY COMPANY OWNERSHIP
1 -50
51-200
201-500
1000 +
501-1000
2014 Median Salary
2014 Median Bonus
Public
Private
1 -50
51-200
201-500
1000 +
501-1000
2014 Median Salary
2014 Median Bonus
Public
Private
1 -50
51-200
201-500
1000 +
501-1000
2014 Median Salary
2014 Median Bonus
Public
Private
C-Level
EVP/SVP/VP
MD / Senior Director / Director
170,00026,000
118,60032,517
98,50017,785
111,335
93,529
134,211
128,100
140,000
10,000
14,757
41,818
55,547
45,000
117,000 45,000
156,236 20,033
80,136
87,500
73,742
156,000
125,000
5,000
18,000
4,705
0
32,053
90,272 10,000
125,000 24,040
150,000 13,000
172,720 103,632
100,167
170,000
172,720
26,000
103,632
1716
DIG
ITA
L LE
AD
ERS
REm
un
ERAT
Ion
REP
oRT
201
4
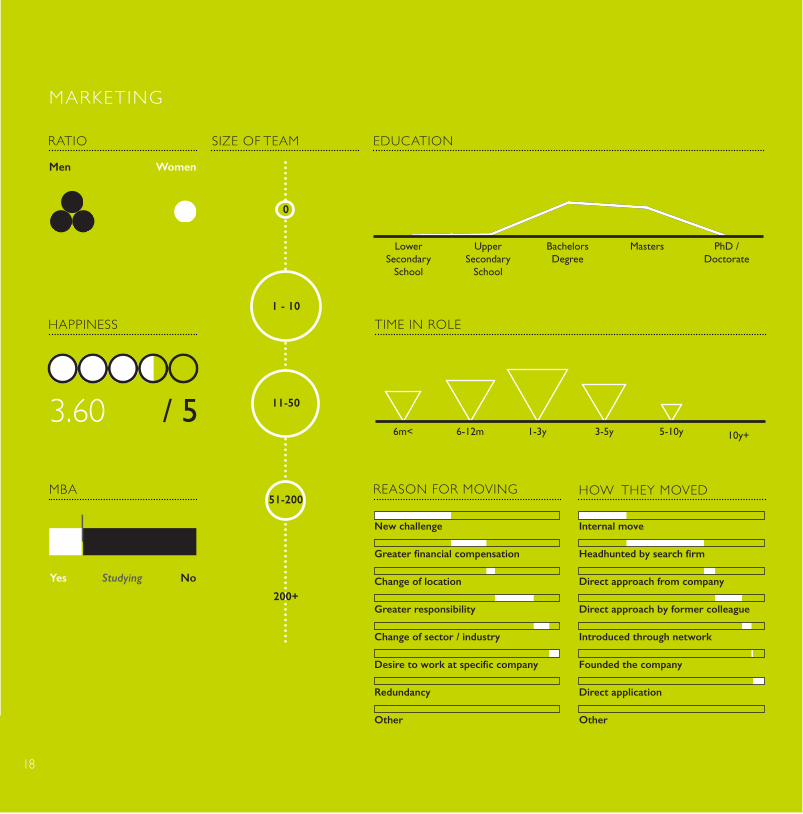
MARKETING
3.60
1 - 10
11-50
200+
51-200
0
SIZE OF TEAMRATIO
HAPPINESS
MBA
NoYes Studying
EDUCATION
LowerSecondary
School
UpperSecondary
School
BachelorsDegree
Masters PhD /Doctorate
Other Other
Internal moveNew challenge
Greater financial compensation Headhunted by search firm
Change of location Direct approach from company
Greater responsibility Direct approach by former colleague
Change of sector / industry Introduced through network
Desire to work at specific company Founded the company
Redundancy Direct application
HOW THEY MOVEDREASON FOR MOVING
TIME IN ROLE
1-3y 10y+3-5y 5-10y6-12m6m</ 5
Men Women
1918
DIG
ITAL LEA
DERS REm
un
ERATIon
REPoRT 2014
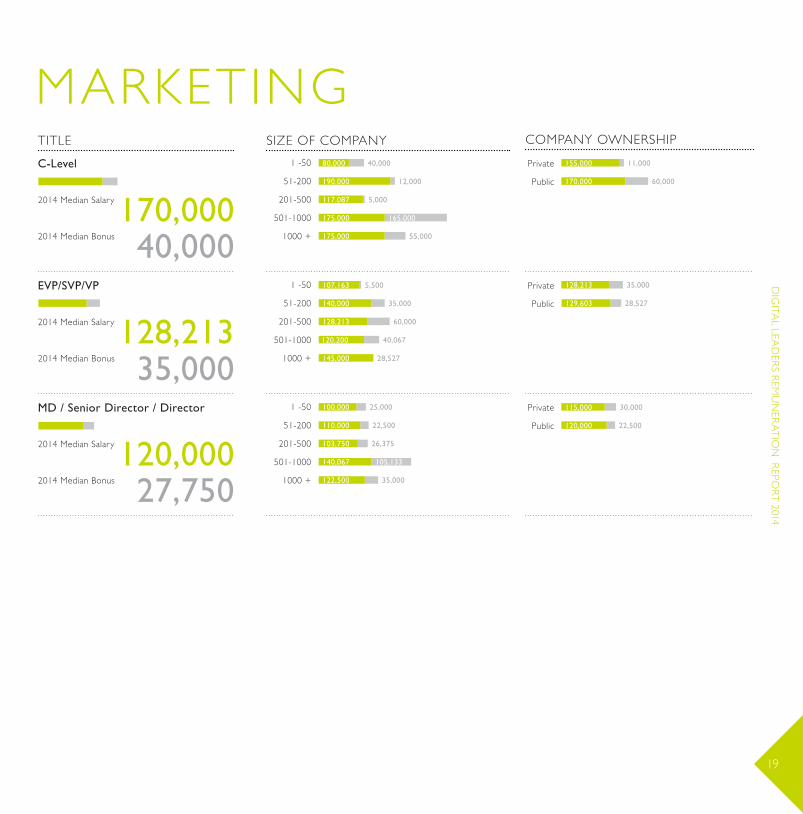
MARKETINGTITLE SIZE OF COMPANY COMPANY OWNERSHIP
1 -50
51-200
201-500
1000 +
501-1000
2014 Median Salary
2014 Median Bonus
Public
Private
1 -50
51-200
201-500
1000 +
501-1000
2014 Median Salary
2014 Median Bonus
Public
Private
1 -50
51-200
201-500
1000 +
501-1000
2014 Median Salary
2014 Median Bonus
Public
Private
C-Level
EVP/SVP/VP
MD / Senior Director / Director
170,00040,000
128,21335,000
120,00027,750
80,000
190,000
117,087
175,000
175,000
40,000
12,000
5,000
165,000
55,000
155,000 11,000
170,000 60,000
107,163
140,000
128,213
120,200
145,000
5,500
35,000
60,000
40,067
28,527
128,213 35,000
129,603 28,527
100,000
110,000
103,750
140,067
122,500
25,000
22,500
26,375
105,133
35,000
115,000 30,000
120,000 22,500
1918
DIG
ITA
L LE
AD
ERS
REm
un
ERAT
Ion
REP
oRT
201
4
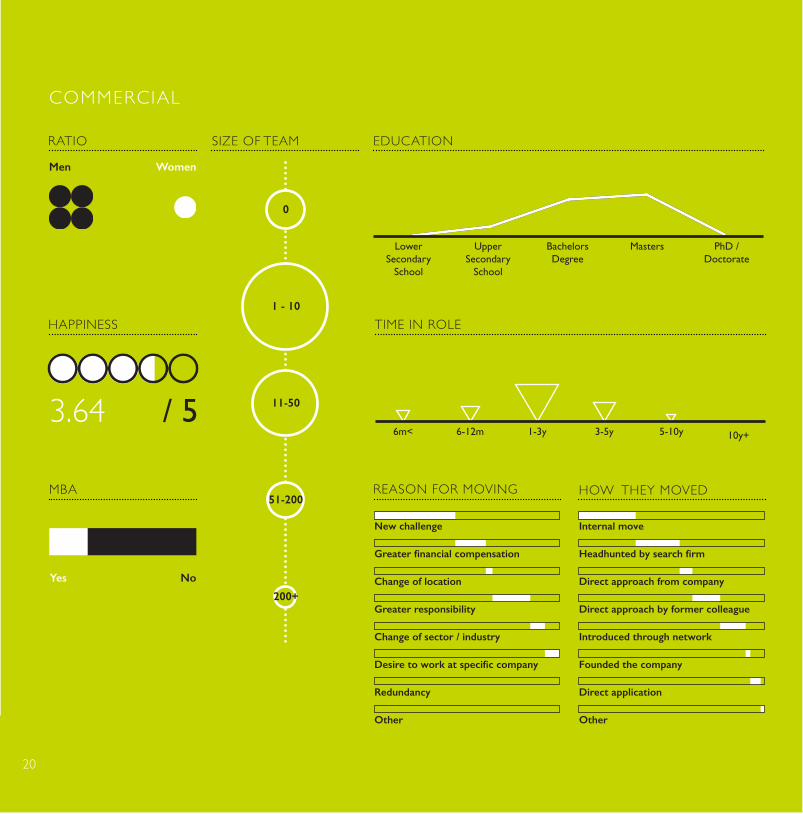
COMMERCIAL
3.64
1 - 10
11-50
200+
51-200
0
SIZE OF TEAMRATIO
HAPPINESS
MBA
NoYes Studying
EDUCATION
LowerSecondary
School
UpperSecondary
School
BachelorsDegree
Masters PhD /Doctorate
Other Other
Internal moveNew challenge
Greater financial compensation Headhunted by search firm
Change of location Direct approach from company
Greater responsibility Direct approach by former colleague
Change of sector / industry Introduced through network
Desire to work at specific company Founded the company
Redundancy Direct application
HOW THEY MOVEDREASON FOR MOVING
TIME IN ROLE
1-3y 10y+3-5y 5-10y6-12m6m</ 5
Men Women
2120
DIG
ITAL LEA
DERS REm
un
ERATIon
REPoRT 2014
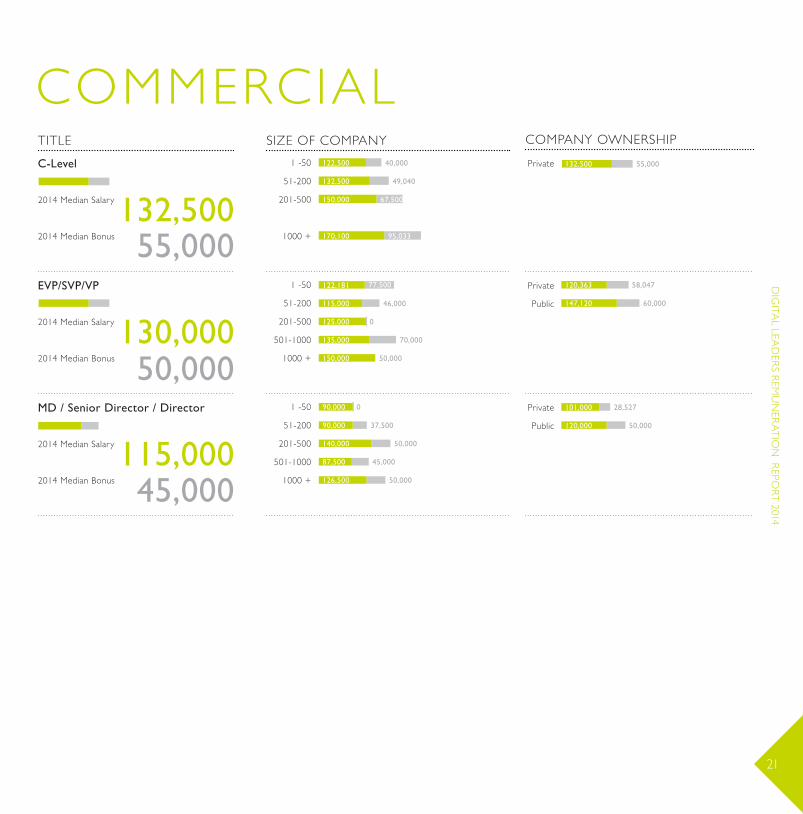
COMMERCIALTITLE SIZE OF COMPANY COMPANY OWNERSHIP
1 -50
51-200
201-500
1000 +
501-1000
2014 Median Salary
2014 Median Bonus
Public
Private
1 -50
51-200
201-500
1000 +
501-1000
2014 Median Salary
2014 Median Bonus
Public
Private
1 -50
51-200
201-500
1000 +
501-1000
2014 Median Salary
2014 Median Bonus
Public
Private
C-Level
EVP/SVP/VP
MD / Senior Director / Director
132,50055,000
130,00050,000
115,00045,000
122,500
132,500
150,000
170,100
40,000
49,040
67,500
95,033
122,181
115,000
125,000
135,000
150,000
77,500
46,000
0
70,000
50,000
120,363 58,047
147,120 60,000
90,000
90,000
140,000
87,500
126,500
0
37,500
50,000
45,000
50,000
101,000 28,527
120,000 50,000
132,500 55,000
2120
DIG
ITA
L LE
AD
ERS
REm
un
ERAT
Ion
REP
oRT
201
4
TITLE SIZE OF COMPANY COMPANY OWNERSHIP1 -50
51-200
201-500
1000 +
501-1000
2014 Median Salary
2014 Median Bonus
Public
Private
1 -50
51-200
201-500
1000 +
501-1000
2014 Median Salary
2014 Median Bonus
Public
Private
1 -50
51-200
201-500
1000 +
501-1000
2014 Median Salary
2014 Median Bonus
Public
Private
C-Level
EVP/SVP/VP
MD / Senior Director / Director
147,50051,000
140,60718,013
100,16716,027
140,000
155,000
50,000
52,000
147,500 51,000
75,000
153,000
96,160
177,500
0
60,000
16,027
40,000
128,213 16,027
155,000 60,000
48,040
105,000
95,250
135,000
14,023
17,000
12,513
17,500
100,000 9,000
135,000 27,500
170,11780,033
137,12033,479
120,00033,000
170,117 80,033
140,233 40,067
200,000 120,000
130,000
115,548
184,620
25,000
34,905
78,527
130,000 25,000
144,240 34,905
133,000
155,000
72,120
116,193
116,093
36,000
32,500
24,040
54,090
27,500
116,093 30,020
122,500 35,000
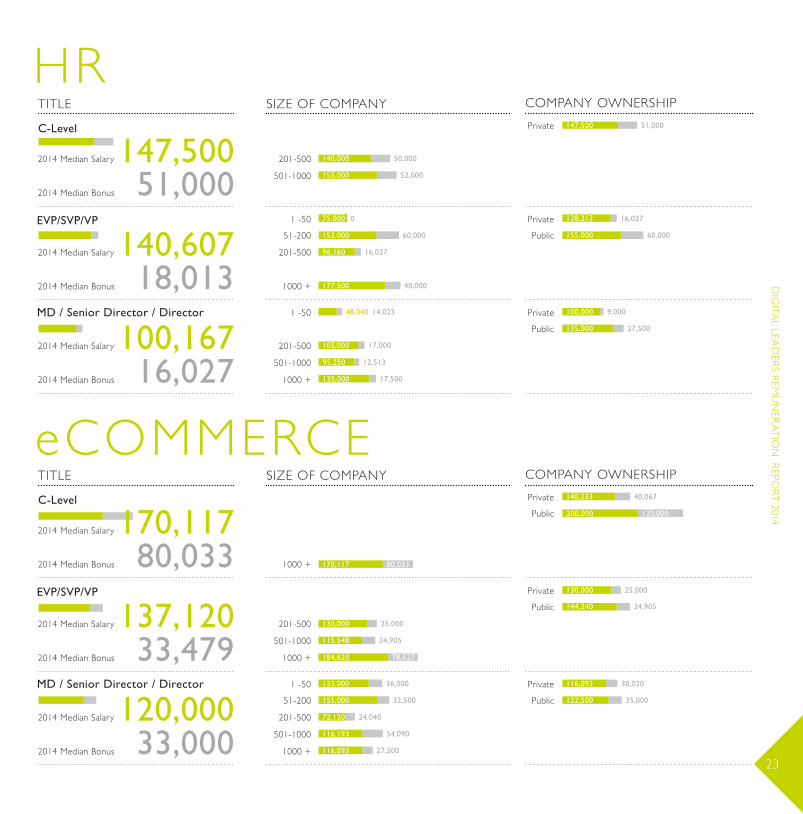
HR
eCOMMERCETITLE SIZE OF COMPANY COMPANY OWNERSHIP
1 -50
51-200
201-500
1000 +
501-1000
2014 Median Salary
2014 Median Bonus
Public
Private
1 -50
51-200
201-500
1000 +
501-1000
2014 Median Salary
2014 Median Bonus
Public
Private
1 -50
51-200
201-500
1000 +
501-1000
2014 Median Salary
2014 Median Bonus
Public
Private
C-Level
EVP/SVP/VP
MD / Senior Director / Director
TITLE SIZE OF COMPANY COMPANY OWNERSHIP1 -50
51-200
201-500
1000 +
501-1000
2014 Median Salary
2014 Median Bonus
Public
Private
1 -50
51-200
201-500
1000 +
501-1000
2014 Median Salary
2014 Median Bonus
Public
Private
1 -50
51-200
201-500
1000 +
501-1000
2014 Median Salary
2014 Median Bonus
Public
Private
C-Level
EVP/SVP/VP
MD / Senior Director / Director
127,50021,219
121,00031,473
107,50022,000
120,000
125,000
132,500
185,000
250,000
0
10,000
19,232
50,000
135,000
125,000 15,000
170,000 50,000
104,173
92,500
108,500
150,000
141,000
104,173
23,036
15,000
60,000
35,000
104,173 24,073
139,731 35,000
86,060 2,805
114,000 24,020
70,000
89,553
102,080
124,549
0
19,904
17,020
28,551
125,00020,000
120,00020,000
107,69623,020
120,000
130,000
10,000
30,000
125,000 20,000
75,000
120,000
120,000
130,000
15,000
15,000
30,000
25,000
120,000 15,000
130,000 25,000
92,000
100,000
140,000
127,113
5,000
20,000
40,000
37,500
107,696 18,500
109,000 37,533
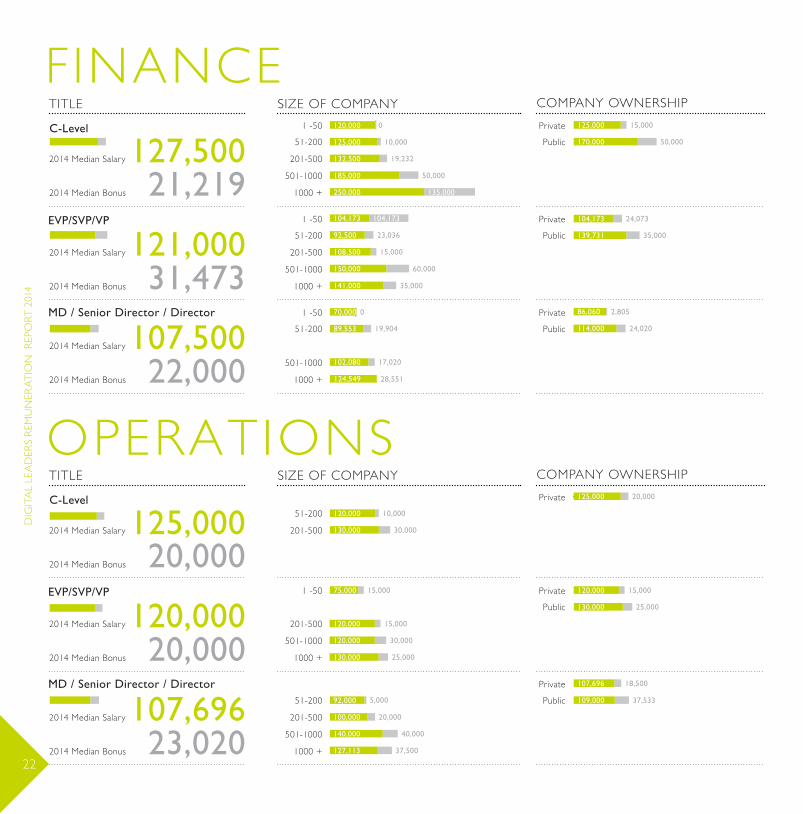
FINANCE
OPERATIONS
2322
DIG
ITAL LEA
DERS REm
un
ERATIon
REPoRT 2014
TITLE SIZE OF COMPANY COMPANY OWNERSHIP1 -50
51-200
201-500
1000 +
501-1000
2014 Median Salary
2014 Median Bonus
Public
Private
1 -50
51-200
201-500
1000 +
501-1000
2014 Median Salary
2014 Median Bonus
Public
Private
1 -50
51-200
201-500
1000 +
501-1000
2014 Median Salary
2014 Median Bonus
Public
Private
C-Level
EVP/SVP/VP
MD / Senior Director / Director
147,50051,000
140,60718,013
100,16716,027
140,000
155,000
50,000
52,000
147,500 51,000
75,000
153,000
96,160
177,500
0
60,000
16,027
40,000
128,213 16,027
155,000 60,000
48,040
105,000
95,250
135,000
14,023
17,000
12,513
17,500
100,000 9,000
135,000 27,500
170,11780,033
137,12033,479
120,00033,000
170,117 80,033
140,233 40,067
200,000 120,000
130,000
115,548
184,620
25,000
34,905
78,527
130,000 25,000
144,240 34,905
133,000
155,000
72,120
116,193
116,093
36,000
32,500
24,040
54,090
27,500
116,093 30,020
122,500 35,000
HR
eCOMMERCETITLE SIZE OF COMPANY COMPANY OWNERSHIP
1 -50
51-200
201-500
1000 +
501-1000
2014 Median Salary
2014 Median Bonus
Public
Private
1 -50
51-200
201-500
1000 +
501-1000
2014 Median Salary
2014 Median Bonus
Public
Private
1 -50
51-200
201-500
1000 +
501-1000
2014 Median Salary
2014 Median Bonus
Public
Private
C-Level
EVP/SVP/VP
MD / Senior Director / Director
TITLE SIZE OF COMPANY COMPANY OWNERSHIP1 -50
51-200
201-500
1000 +
501-1000
2014 Median Salary
2014 Median Bonus
Public
Private
1 -50
51-200
201-500
1000 +
501-1000
2014 Median Salary
2014 Median Bonus
Public
Private
1 -50
51-200
201-500
1000 +
501-1000
2014 Median Salary
2014 Median Bonus
Public
Private
C-Level
EVP/SVP/VP
MD / Senior Director / Director
127,50021,219
121,00031,473
107,50022,000
120,000
125,000
132,500
185,000
250,000
0
10,000
19,232
50,000
135,000
125,000 15,000
170,000 50,000
104,173
92,500
108,500
150,000
141,000
104,173
23,036
15,000
60,000
35,000
104,173 24,073
139,731 35,000
86,060 2,805
114,000 24,020
70,000
89,553
102,080
124,549
0
19,904
17,020
28,551
125,00020,000
120,00020,000
107,69623,020
120,000
130,000
10,000
30,000
125,000 20,000
75,000
120,000
120,000
130,000
15,000
15,000
30,000
25,000
120,000 15,000
130,000 25,000
92,000
100,000
140,000
127,113
5,000
20,000
40,000
37,500
107,696 18,500
109,000 37,533
FINANCE
OPERATIONS
2322
DIG
ITA
L LE
AD
ERS
REm
un
ERAT
Ion
REP
oRT
201
4
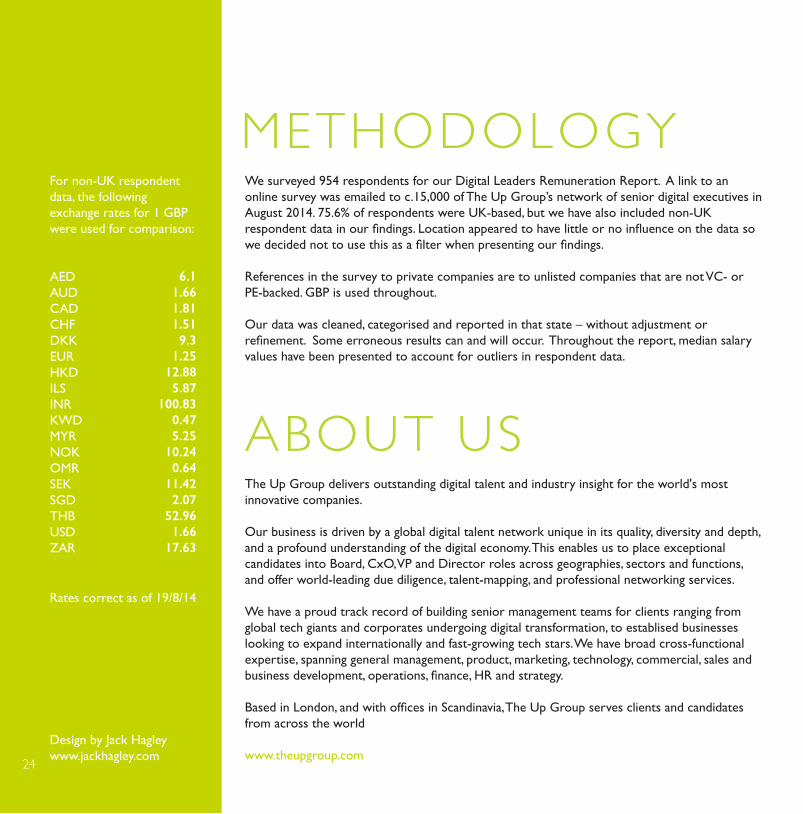
METHODOLOGY
ABOUT US
We surveyed 954 respondents for our Digital Leaders Remuneration Report. A link to an online survey was emailed to c.15,000 of The Up Group’s network of senior digital executives in August 2014. 75.6% of respondents were UK-based, but we have also included non-UK respondent data in our findings. Location appeared to have little or no influence on the data so we decided not to use this as a filter when presenting our findings.
References in the survey to private companies are to unlisted companies that are not VC- or PE-backed. GBP is used throughout.
Our data was cleaned, categorised and reported in that state – without adjustment or refinement. Some erroneous results can and will occur. Throughout the report, median salary values have been presented to account for outliers in respondent data.
The Up Group delivers outstanding digital talent and industry insight for the world's most innovative companies. Our business is driven by a global digital talent network unique in its quality, diversity and depth, and a profound understanding of the digital economy. This enables us to place exceptional candidates into Board, CxO, VP and Director roles across geographies, sectors and functions, and offer world-leading due diligence, talent-mapping, and professional networking services. We have a proud track record of building senior management teams for clients ranging from global tech giants and corporates undergoing digital transformation, to establised businesses looking to expand internationally and fast-growing tech stars. We have broad cross-functional expertise, spanning general management, product, marketing, technology, commercial, sales and business development, operations, finance, HR and strategy. Based in London, and with offices in Scandinavia, The Up Group serves clients and candidates from across the world
www.theupgroup.com
For non-UK respondent data, the following exchange rates for 1 GBP were used for comparison:
Rates correct as of 19/8/14
Design by Jack Hagleywww.jackhagley.com
AEDAUDCADCHFDKKEURHKDILSINRKWDMYRNOKOMRSEKSGDTHBUSDZAR
6.11.661.811.519.3
1.2512.885.87
100.830.475.25
10.240.64
11.422.07
52.961.66
17.63
2524

DIGITAL LEADERSREMUNERATION
REPORT 2014