Digital Instructional Strategies and their Role in ... · PDF fileRunning head: DIGITAL...
38
Running head: DIGITAL STRATEGIES AND OPPORTUNITY TO LEARN 1 Digital Instructional Strategies and their Role in Classroom Learning Jessica Yarbro, MA George Mason University Katherine McKnight, Ph.D. Pearson’s Research & Innovation Network Stephen Elliott, Ph.D. Arizona State University Australian Catholic University Alexander Kurz, Ph.D. Arizona State University Liane Wardlow, Ph.D. Pearson’s Research & Innovation Network Yarbro, J., McKnight, K., Elliott, S.N., Kurz, A., Wardlow, L. (in press). Digital instructional strategies and their role in classroom learning. Journal of Research on Technology in Education Do not distribute without author’s permission ([email protected])
Transcript of Digital Instructional Strategies and their Role in ... · PDF fileRunning head: DIGITAL...

Running head: DIGITAL STRATEGIES AND OPPORTUNITY TO LEARN 1
Digital Instructional Strategies and their Role in Classroom Learning
Jessica Yarbro, MA
George Mason University
Katherine McKnight, Ph.D.
Pearson’s Research & Innovation Network
Stephen Elliott, Ph.D.
Arizona State University
Australian Catholic University
Alexander Kurz, Ph.D.
Arizona State University
Liane Wardlow, Ph.D.
Pearson’s Research & Innovation Network
Yarbro, J., McKnight, K., Elliott, S.N., Kurz, A., Wardlow, L. (in press). Digital instructional
strategies and their role in classroom learning. Journal of Research on Technology in Education
Do not distribute without author’s permission ([email protected])

DIGITAL STRATEGIES AND OPPORTUNITY TO LEARN 2
Digital Instructional Strategies and their Role in Classroom Learning
Abstract
Research that examines technology use in the context of daily classroom practices is needed to
support the effective digital conversion of classrooms. In this study, 65 seventh- through tenth-
grade Mathematics and English Language Arts teachers from six districts across six states logged
information about digital strategies they incorporated into their lessons to teach specific
academic content standards. We describe six major digital instructional strategies and 16 related
instructional tactics that teachers used over the course of a year, and analyze how these strategies
relate to opportunity to learn. We found teachers tended to use technology for a variety of
strategies with varying degrees of frequency. Technology use was usually viewed as central or
essential to instruction. Relationships between technology use and opportunity to learn differed
between specific strategies and by subject. We finish with a discussion of study limitations and
future research needs.
Keywords: digital instructional strategy, digital instructional tactic, opportunity to learn

DIGITAL STRATEGIES AND OPPORTUNITY TO LEARN 3
Technology is frequently touted as a means for transforming, even revolutionizing
teaching and learning. Researchers note that the transformative power of technology occurs
when its use has an impact on learning routines, cognitive processes, problem solving, and
teacher roles (Glassett & Schrum, 2009). Interest in technology has sparked numerous initiatives
aimed at technology integration into teaching and learning (i.e. Digital Promise, 2014) as well as
considerable research in this area. While much of this research focuses on the implementation of
specific technology initiatives such as 1:1 laptops or tablets (e.g. Bebell & O’Dwyer, 2010;
Dunleavy & Dexter 2007), less is known about how teachers use technology on a daily basis and
how technology functions in the context of other classroom practices. Research on how teachers
are actually using technology in the classroom is important for clarifying how technology can
best be used to aid student learning (Mishra & Koehler, 2003). The purpose of this study is to
examine classroom technology use at the teacher level, focusing on the digital strategies teachers
use, how frequently they are using them, and how their technology use is related to opportunity
to learn.
In a set of studies designed to understand how teachers use technology to enhance student
learning, McKnight and colleagues (in press) examined how teachers integrate technology; the
perceived benefits of integrating technology into teaching and learning; and how contextual
factors influence technology integration. Teachers, school and district administrators, and
instructional technology (IT) staff across seven school districts, participated in focus groups,
interviews, and classroom observations. Five themes emerged for how teachers use technology
that informed the present study: (1) increasing access to learning resources; (2) enhancing
communication and feedback between teachers, students and parents; (3) restructuring teacher

DIGITAL STRATEGIES AND OPPORTUNITY TO LEARN 4
time; (4) extending the purpose and audience for student work; and (5) shifting teacher and
student roles. Furthermore, researchers identified an overarching theme that technology
integration must be purposeful, driven by effective pedagogy, and teachers need proper
implementation support and training.
The present study extends the first phase of research by expanding to a larger sample and
examining more specifically and quantitatively how teachers use technology in their classrooms.
Based on the identified themes from the first phase and a review of relevant research, a set of 16
specific digital instructional tactics was developed and reviewed by five State Teachers of the
Year with technology expertise. The tactics were organized within six broader digital
instructional strategies and can be understood as more specific indicators of the strategies. In the
present study, teachers reported their daily instructional practices, incorporating this taxonomy of
technology use, via an online teacher log called My Instructional Learning Opportunities
Guidance System (MyiLOGS; Kurz, Elliott, & Shrago, 2009). With this online teacher log,
teachers recorded their use of digital instructional strategies along with the minutes per class
spent emphasizing different academic standards, cognitive processes, instructional practices, and
grouping formats. Previous studies (prior to the inclusion of the digital strategies taxonomy)
demonstrate that teachers can be trained to use this online teacher log in a reasonable amount of
time, and in ways that are reliable, valid, and consistent with independent observations (Kurz,
Elliott, Kettler, & Yel, 2014).
MyiLOGS is designed to measure opportunity to learn (OTL), a concept used for decades
to describe and measure various instructional inputs and processes associated with intended
student outcomes (Herman, Klein, & Abedi,, 2000; Kurz, 2011; Rowan, Camburn, & Correnti,

DIGITAL STRATEGIES AND OPPORTUNITY TO LEARN 5
2004; Stevens, & Grymes, 1993). To define students’ opportunity to learn intended knowledge
and skills, researchers have focused on three major aspects of a teacher’s enacted curriculum:
time, content, and quality. To provide students with OTL, teachers must spend time teaching
intended content using a variety of instructional approaches. OTL provides a framework to
quantify and understand important aspects of teaching practice that influence students’ access to
the curriculum and subsequent student outcomes (Pullin, 2008; Wang, 1998). Based on a
synthesis of relevant research (Kurz, 2011), OTL is defined as “the degree to which a teacher
dedicates instructional time and content coverage to the intended curriculum objectives
emphasizing higher-order cognitive processes, evidence-based instructional practices, and
alternative grouping formats” (Kurz et al. 2014, p. 27). Measurement within this framework
provides scores based on these five OTL indices (italicized in the prior sentence) that are
grounded in OTL theory and research (Kurz, et al., 2014).
We use OTL as a guiding framework in the present study because the use of digital
instructional strategies represents an important aspect of a teacher’s enacted curriculum
alongside time, content, and quality. The extent to which technology use interacts with these
dimensions of the enacted curriculum, or perhaps represents a fourth dimension, remains an open
empirical question. In fact, Kurz and colleagues note that their definition of OTL may
underrepresent teacher’s use of instructional resources (Kurz et al., 2014); therefore, the
application of OTL to technology use in the present study allows us to examine how technology
relates to well-studied aspects of the enacted curriculum, which are relevant to student learning.
This present study may also help further inform the definition of OTL to better address
technology use.

DIGITAL STRATEGIES AND OPPORTUNITY TO LEARN 6
Though this is the first study, to our knowledge, to specifically examine technology use
in the context of the OTL framework, support for the application of this framework comes from
different avenues of technology research. One aspect of OTL related to instructional quality is
engaging students in higher-order cognitive processes (i.e. analyzing and creating vs. attending
and remembering). Evidence suggests that students develop increased higher-order thinking
skills in technology-enriched classrooms (e.g., Hopson, Simms, & Knezek, 2001), although other
research suggests the effect may be quite nuanced. For example, certain aims of technology use,
specifically those with a constructivist basis where students are required to create, may be more
beneficial in terms of encouraging higher-order thinking skills (Baylor & Ritchie, 2002).
Additionally, technology use may foster more small-group and individual grouping formats
during instruction (e.g. Waxman & Huang, 1996) and thus help contribute to a more learner-
centered environment. The Project Red report (Greaves et al., 2010) suggests that this type of
learner-centered approach may be one of the conditions under which technology use is most
effective at enhancing student learning.
Relatedly, technology may transform instructional practice by facilitating the use of
learner-centered instructional practices. Technology use enhances a variety of constructivist
practices including collaborative learning, problem-based learning, and independent
research/inquiry (Inan, Lowther, Ross, & Strahl, 2010). The SAMR model of technology
integration (Puentedura, 2010) posits that the highest level of technology integration occurs
when technology redefines learning tasks and practices.
There is less evidence linking technology use to the OTL indices of content coverage and
instructional time. Technology use can facilitate more in-depth coverage, which as a result may

DIGITAL STRATEGIES AND OPPORTUNITY TO LEARN 7
mean less breadth of content is covered (Becker, 2000). This aspect of technology use is
relatively well-studied with audience response systems (e.g., Caldwell, 2007), but may not
generalize to all types of technology use. In contrast, some teachers perceive technology use as
facilitating greater content coverage and a faster speed at which content is covered (ClassTech,
2006). There is also mixed evidence regarding the use of technology and the proportion of class
time used for instruction. Teachers report that technology automates certain time-consuming
activities (e.g., administering and collecting assignments) allowing more class time to be used for
instruction (e.g., McKnight et al., in press). However, teachers also cite the time required to
implement technology as a barrier to its use (Bingimlas, 2009). When teachers are unfamiliar
with different technologies, integration may actually make instructional time less efficient as
teachers familiarize themselves with its use, set-up, and/or troubleshooting. Overall, research
suggests that technology use may be relevant to indicators of OTL, and the present study is the
first to explicitly examine these relationships.
The current study extends prior research on technology integration by having teachers log
their specific technology use across a variety of digital strategies and tactics developed from
research with educators working in technology-rich learning environments (McKnight et al., in
press). We examine how technology use relates to other teaching practices within the OTL
framework, specifically the time, content, and quality of classroom instruction. By using an
online teacher log and the OTL framework for capturing specific classroom practices around
technology integration as well as other key OTL indices, the present study can help us move
beyond broad, general perspectives of technology use to context-specific teacher instructional
practices. The present study addresses three questions:

DIGITAL STRATEGIES AND OPPORTUNITY TO LEARN 8
1. Which digital instructional strategies are used in classrooms and how prevalent are they?
2. What are the relationships between use of digital instructional strategies and
opportunities to learn?
3. How do those relationships differ among English Language Arts (ELA) and Mathematics
teachers?
Methods
Participants
Participants were recruited from six districts that volunteered to be part of the study. All
of these districts were part of Digital Promise’s League of Innovative Schools. The opportunity
to participate was open to all teachers within these schools who taught ELA and Mathematics in
grades 7 through 10 (with the exception of one Kindergarten teacher who requested to
participate).
In total, 97 teachers logged 1,779 instructional days through the MyiLOGS software. On
average they logged 19 days (SD = 14), ranging from 1 to 55 days. Teachers taught in six
demographically and geographically distinct districts across the U.S., including the Southwest,
mid-Atlantic, and Northwest. To ensure that logged days were representative of a teacher’s
typical day across the entire year, we required at least 10 logged days for inclusion in analyses,
which reduced the sample from 97 to 65 teachers (67% of the original sample). Sixty-six
teachers had 10 or more logged days of data, but we excluded one Kindergarten teacher due to
the focus on Middle and High School teachers in this study. Prior research using this online
teacher log (Kurz, et al., 2014) indicates that teacher reports based on 10 randomly sampled days

DIGITAL STRATEGIES AND OPPORTUNITY TO LEARN 9
correlates highly (r > 0.8) with their reports from the entire year and that increasing the number
of randomly sampled days did not substantially increase these correlations. The 65 teachers
included in the analyses logged a total of 1,638 days, with an average of 25 days per teacher (SD
= 12). The final sample consisted of 30 ELA teachers and 35 Mathematics teachers, all of whom
taught grades 7 through 10. Of these 65 teachers, 59 (91%) completed an “About Me” survey.
On average, these teachers taught for 12.56 years (SD = 8.76) and had 2.61 years (SD = 3.66)
experience teaching with technology. A majority of teachers were comfortable teaching with
technology (79.7%) and using technology outside of the classroom (91.5%), and 70.7% of
teachers had taught an online class.
Measures and Procedures
MyiLOGS. Data were collected using the online teacher log MyiLOGS. Teachers
reported instructional time used to teach the state-specific academic standards and any custom
objectives not included in the standards. Teachers also accounted for any time that was not
available for instruction due to transitions, class announcements, and so on. The sum of time on
standards, custom objectives, and any non-instructional activities equals the allocated time for
the classroom of focus. Teachers were instructed to complete their logging as soon as possible
after the class period ended (at least by the end of the day). Many teachers decided to log class
periods that were followed by a break or that were at the end of the day, so that they would have
time immediately after the class period to complete the logging.
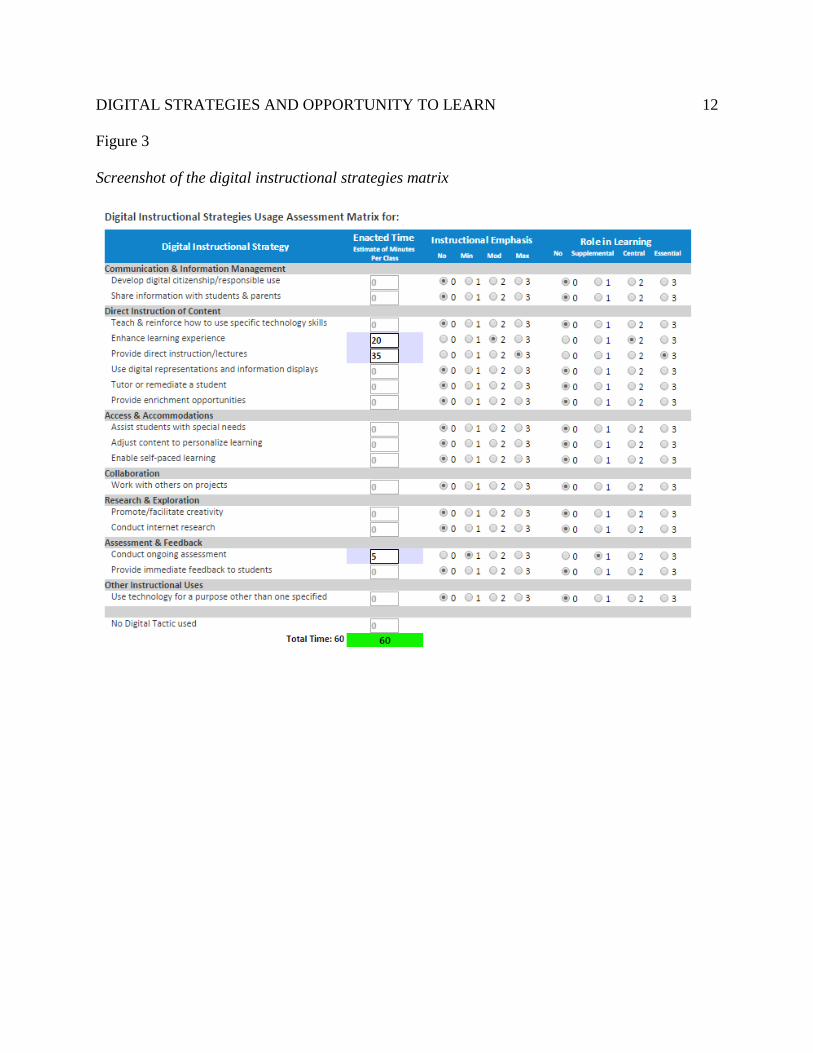
Teachers also reported on instructional elements in three different matrices. Screenshots
of the matrices appear in Figures 1 – 3. First, teachers reported the instructional minutes
allocated to each standard/custom objective as well as how many minutes were spent at each of

DIGITAL STRATEGIES AND OPPORTUNITY TO LEARN 10
five cognitive process levels for student learning, adapted from the revised Bloom’s taxonomy
(see Anderson et al., 2001): Attend, Remember, Understand/Apply, Analyze/Evaluate, and
Create. In the second matrix, teachers reported minutes spent on nine different instructional
practices (see Table 1) as well as the grouping format of these practices (individual, small group,
or whole group). In the third matrix, teachers reported minutes spent using 16 digital
instructional tactics, organized within six strategies, presented in Table 2. We included one
additional strategy that encompasses any “purpose other than one specified in any of the previous
16 instructional tactics.” We report the findings for this “Other Instructional Strategy,” but
refrain from interpreting these results because it is unclear what specific strategies were used.
Teachers also rated the perceived role in learning (RIL; 0 = none to 3 = essential) of each tactic
given the learning task, allowing us to assess the instructional importance irrespective of time
spent on that tactic.
Figure 1
Screenshot of the Cognitive Process Matrix

DIGITAL STRATEGIES AND OPPORTUNITY TO LEARN 11
Figure 2
Screenshot of the instructional practice by grouping format matrix
DIGITAL STRATEGIES AND OPPORTUNITY TO LEARN 12
Figure 3
Screenshot of the digital instructional strategies matrix

DIGITAL STRATEGIES AND OPPORTUNITY TO LEARN 13
Table 1.
MyiLOGS Instructional Practices
Instructional Practice Definition
Provided Direct Instructiona
Teacher presents issue, discusses or models a solution
approach, and engages students with approach in similar
context.
Provided Visual
Representationsa
Teacher uses visual representations to organize
information, communicate attributes, and explain
relationships.
Asked Questionsa Teacher asks questions to engage students and focus
attention on important information.
Elicited Think Alouda Teacher prompts students to think aloud about their
approach to solving a problem.
Provided Guided Feedbacka Teacher provides feedback to students on work quality,
missing elements, and observed strengths.
Provided Reinforcementa
Teacher provides reinforcement contingent on previously
established expectations for effort and/or work
performance.
Assessed Student Knowledgea Teacher uses quizzes, tests, student products, or other
forms of assessment to determine student knowledge.
Other Instructional Practices Any other instructional practices not captured by the
aforementioned key instructional practices.
Used Independent Practice Teacher allows students to work independently to develop
and refine knowledge and skills.
Note. aThis instructional practice has received empirical support across multiple studies
(e.g. Marzano, 2000; Vaughn, Gersten, & Chard, 2000)
DIGITAL STRATEGIES AND OPPORTUNITY TO LEARN 14
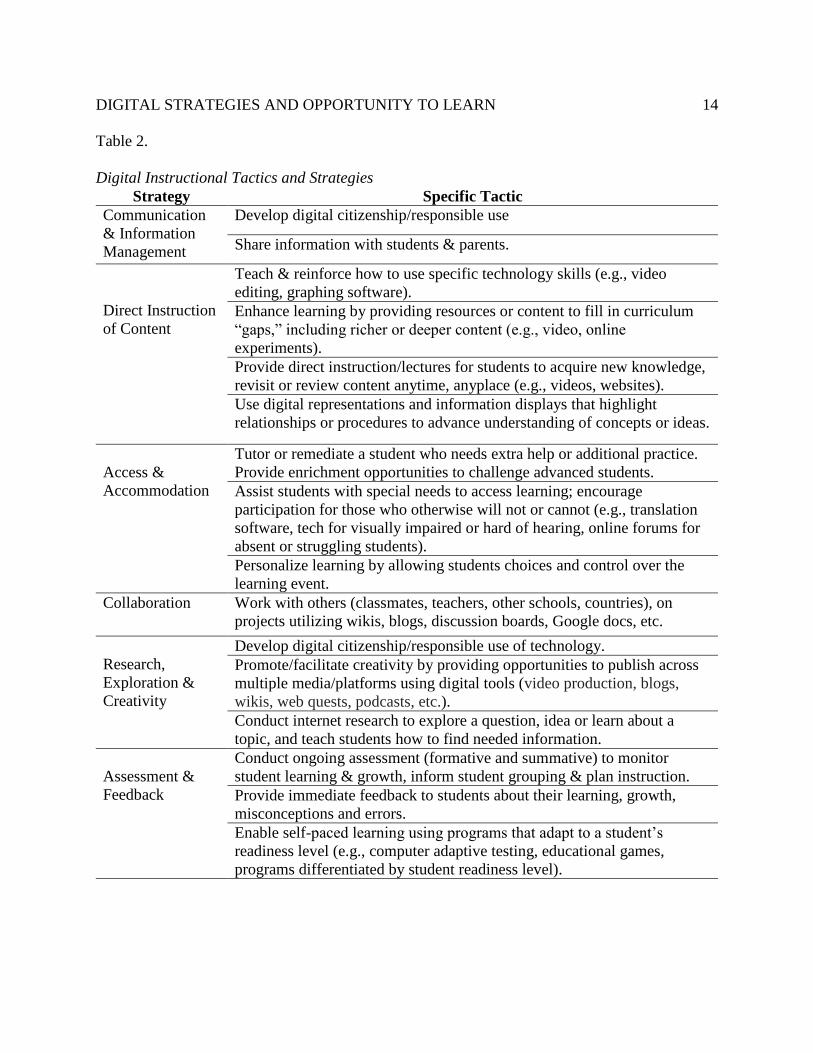
Table 2.
Digital Instructional Tactics and Strategies
Strategy Specific Tactic
Communication
& Information
Management
Develop digital citizenship/responsible use
Share information with students & parents.
Direct Instruction
of Content
Teach & reinforce how to use specific technology skills (e.g., video
editing, graphing software).
Enhance learning by providing resources or content to fill in curriculum
“gaps,” including richer or deeper content (e.g., video, online
experiments).
Provide direct instruction/lectures for students to acquire new knowledge,
revisit or review content anytime, anyplace (e.g., videos, websites).
Use digital representations and information displays that highlight
relationships or procedures to advance understanding of concepts or ideas.
Access &
Accommodation
Tutor or remediate a student who needs extra help or additional practice.
Provide enrichment opportunities to challenge advanced students.
Assist students with special needs to access learning; encourage
participation for those who otherwise will not or cannot (e.g., translation
software, tech for visually impaired or hard of hearing, online forums for
absent or struggling students).
Personalize learning by allowing students choices and control over the
learning event.
Collaboration Work with others (classmates, teachers, other schools, countries), on
projects utilizing wikis, blogs, discussion boards, Google docs, etc.
Research,
Exploration &
Creativity
Develop digital citizenship/responsible use of technology.
Promote/facilitate creativity by providing opportunities to publish across
multiple media/platforms using digital tools (video production, blogs,
wikis, web quests, podcasts, etc.).
Conduct internet research to explore a question, idea or learn about a
topic, and teach students how to find needed information.
Assessment &
Feedback
Conduct ongoing assessment (formative and summative) to monitor
student learning & growth, inform student grouping & plan instruction.
Provide immediate feedback to students about their learning, growth,
misconceptions and errors.
Enable self-paced learning using programs that adapt to a student’s
readiness level (e.g., computer adaptive testing, educational games,
programs differentiated by student readiness level).
Running head: DIGITAL STRATEGIES AND OPPORTUNITY TO LEARN 15
Teachers received at least 3 hours of face-to-face training with research personnel in
using the online teacher log for tracking instructional practices. Training involved tutorial videos,
discussing scenarios, practice sessions, and question and answer sessions. At the end of each
training session, teachers completed a quiz in a group setting to provide feedback on their
comfort and competence with the system. As teachers interacted with the system, they were able
to request further training if they felt it was necessary. Across all schools, fewer than 6 teachers
requested further assistance.
Digital instructional strategy use. We computed several indices of digital instructional
strategy use from the data collected through the online teacher log. We first summed the daily
instructional minutes for each tactic within a given digital strategy to determine the daily total
instructional minutes for each digital strategy. Table 2 shows the digital tactics and their
corresponding strategies.
To determine the percentage of days a given strategy was used for each teacher, we took
the number of days it was used and divided by the total number of days each teacher logged. To
determine the proportion of instructional time each teacher spent using the strategies, we divided
the daily minutes spent on each strategy by the total number of available instructional minutes
logged that day. These scores were then aggregated across the days in which the digital strategy
was used, to generate an average Digital Strategy Use score for each strategy, for each teacher.
To measure the perceived Role in Learning (RIL) for each strategy for each teacher, we
used a two-step aggregation process. First, we aggregated the RIL scores for each tactic across
the days when the tactic was used, taking the average of those scores. We then averaged the RIL
scores across tactics within each strategy. It is important to note that RIL scores were only
DIGITAL STRATEGIES AND OPPORTUNITY TO LEARN 16
considered for tactics that a given teacher actually used. If a tactic was not used, it did not
contribute to the RIL score for a given strategy, for a given teacher.
OTL scores. Based on data reported by the teachers, we calculated scores related to five
OTL indices: Instructional Time (IT), Content Coverage (CC), Cognitive Process (CP),
Instructional Practice (IP), and Grouping Format (GF). The IT score is a percentage based on the
proportion of a teacher’s allocated class time that was used for instruction. The CC score is a
percentage based on the cumulative coverage of the total number of standards for a particular
subject and grade. For the analyses, the cumulative CC percentage was divided by the number of
days logged, to generate an average content coverage per day score. We made this adjustment
since teachers in the present study differed in the number of days logged, which would likely
impact the percentage of standards covered. The three scores for quality (CP, IP, and GF) are
based on the instructional time spent within one of two categories in each quality dimension. The
weighting for each category is either 1.0 or 2.0. Scores of 1.0 indicate an exclusive focus on
lower-order cognitive processes (i.e., attend, remember), generic instructional practices (e.g.,
independent practice), or whole class instruction. Scores of 2.0 indicate an exclusive focus on
higher-order cognitive processes (i.e., understand/apply, analyze/evaluate, create), evidence-
based instructional practices (i.e., direct instruction, visual representations, questions, think
aloud, guided feedback, reinforcement, assessment), or individual/small group instruction. Note
that “other instructional practices” receives a score of 1.0 as well, due to the non-specificity of
that category. Teachers were told to select “other instructional practices” when their practice did
not clearly match any of the available selections (i.e. direct instruction, visual representations).
Some examples of “other instructional practices” identified during training include peer tutoring,

DIGITAL STRATEGIES AND OPPORTUNITY TO LEARN 17
math worksheets, reading with others, and having students take lecture notes. This scoring
protocol is conservative, given that we do not know what practices were used and if there is
evidence to support those practices. This is a natural limitation of the need to make data
collection comprehensive, yet not too burdensome on teachers.
The weighting and use of two categories for all three quality-related scores are based on
three assumptions: (a) teachers address a range of cognitive processes, instructional practices,
and grouping formats during the course of their instruction; (b) different instructional practices
and groupings may be appropriate for different instructional goals and/or different phases in a
lesson or instructional unit; and (c) teachers who emphasize higher-order cognitive processes,
evidence-based instructional practices, and alternative grouping formats during their instruction
generally improve the quality of students’ opportunity to learn valued knowledge and skills.
Although the empirical basis for these assumptions is insufficient to single out specific
processes, practices, or formats, a dichotomous grouping was used for two reasons. First,
teachers are expected to move the cognitive processes required of students beyond recall to
promote a transfer of knowledge (Anderson et al., 2001; Mayer, 2008). Teachers emphasizing
higher-order cognitive processes, therefore, receive scores closer to 2.0. Second, given empirical
support for instructional practices and grouping formats other than whole class, teachers
emphasizing the latter also receive scores closer to 2.0. In understanding the Instructional
Practice (IP) score, it is important to note that instructional practices and grouping formats were
logged independently of digital instructional strategies. For example, a teacher may log the use
of direct instruction with the whole class for 45 minutes. For those 45 minutes, the teacher can
choose one or more digital instructional strategies or none at all. As such, the use of digital

DIGITAL STRATEGIES AND OPPORTUNITY TO LEARN 18
instructional strategies is not considered to be an instructional practice but rather an additional
aspect of instruction that can co-occur with any given instructional practice.
Data Analysis Plan
The first study goal was to provide a descriptive overview of how often teachers use
digital instructional strategies as well as the emphasis they receive in the classroom. We
calculated measures of central tendency (mean) and variability (standard deviation) for all of the
strategies. We also report the correlations among the various indices within each strategy. The
second goal was to examine the relationship between indices of digital instructional strategy use
(Digital Strategy Use and Role in Learning) and the OTL scores to provide initial evidence for
how digital instructional strategy use functions in the context of teacher classroom practices. We
correlated indices of strategy use with OTL scores. Since sample sizes for Mathematics and ELA
teachers are relatively equal (35 and 30 respectively), we were able to split all analyses by
content area to examine if and how digital instructional strategy use differs by subject. Due to
uneven numbers, we did not divide the sample by grade levels.
Across all variables in the correlational analyses, approximately 25% demonstrated
evidence of significant skewness as measured by the D’Agostino-Pearson omnibus test (1970).
To account for the skewness, we conducted Spearman’s rank correlations, a nonparametric or
“distribution-free” test of association.
Results
Digital Strategy Use and Prevalence
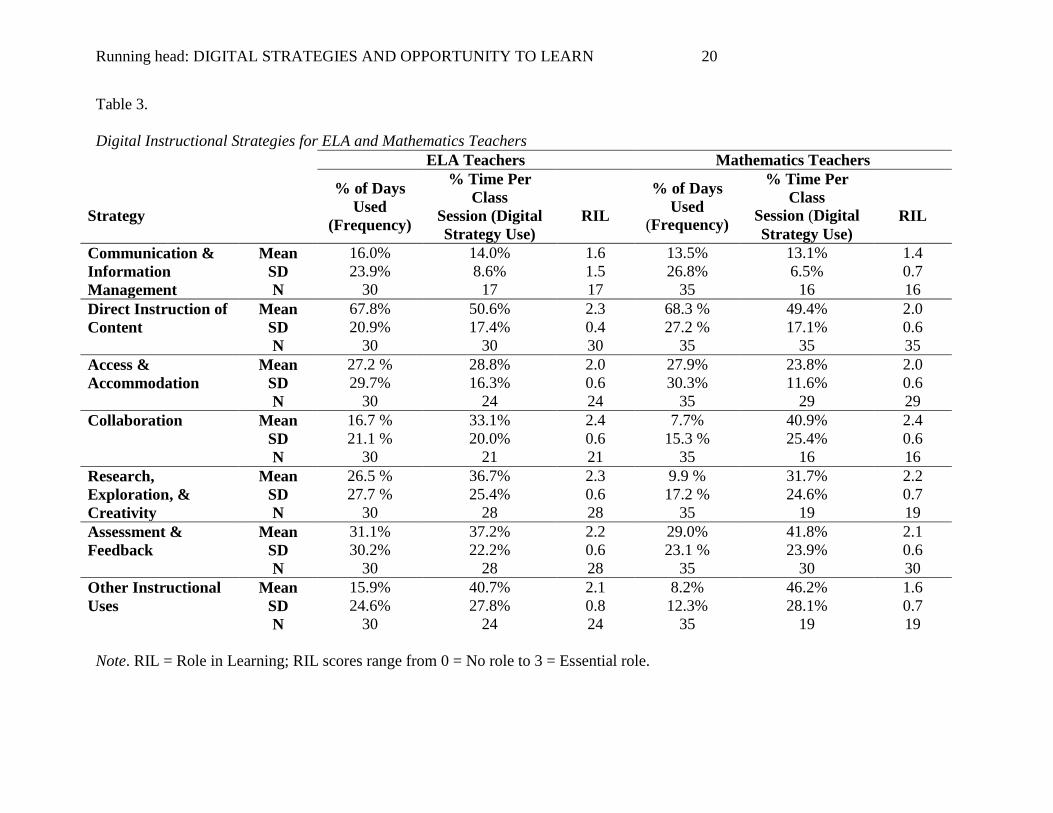
Descriptive statistics for each digital instructional strategy are presented in Table 3.
Results indicate that both Mathematics and ELA teachers reported using technology for Direct

DIGITAL STRATEGIES AND OPPORTUNITY TO LEARN 19
Instruction of Content most often, both in terms of frequency of days (approximately 68%) and
proportion of class time (approximately 50%) on days used. While other strategies are used less
frequently in terms of days, most other strategies (with the exception of Communication &
Information Management, and Access & Accommodation) still constitute a considerable
proportion of class time (mean > 30%), when used. In general, ELA teachers reported using
technology for instruction more frequently than Mathematics teachers: across all tactics, mean
proportion of days used is 18.4% (SD = 7.9%) and 14.3% (SD = 12.0%) for ELA and
Mathematics teachers, respectively.
Additionally, teachers perceived fairly high levels of RIL in their instructional uses of
technology. As Table 3 illustrates, ELA teachers, on average, perceived a moderate or higher
RIL (i.e., scores ≥2) for all strategies excluding Communication & Information Management.
Similarly, Mathematics teachers perceived moderate or higher RIL for all strategies excluding
Communication & Information Management (see Table 3). These descriptive results indicate that
teachers use a wide array of digital strategies, with a preference toward those that are
characterized by direct instruction of content, and that teachers perceive that most digital
strategies used play an important to essential role in students’ learning.
Running head: DIGITAL STRATEGIES AND OPPORTUNITY TO LEARN 20
Table 3.
Digital Instructional Strategies for ELA and Mathematics Teachers
ELA Teachers Mathematics Teachers
Strategy
% of Days
Used
(Frequency)
% Time Per
Class
Session (Digital
Strategy Use)
RIL
% of Days
Used (Frequency)
% Time Per
Class Session (Digital
Strategy Use)
RIL
Communication &
Information
Management
Mean
SD
N
16.0%
23.9%
30
14.0%
8.6%
17
1.6
1.5
17
13.5%
26.8%
35
13.1%
6.5%
16
1.4
0.7
16
Direct Instruction of
Content
Mean
SD
N
67.8%
20.9%
30
50.6%
17.4%
30
2.3
0.4
30
68.3 %
27.2 %
35
49.4%
17.1%
35
2.0
0.6
35
Access &
Accommodation
Mean
SD
N
27.2 %
29.7%
30
28.8%
16.3%
24
2.0
0.6
24
27.9%
30.3%
35
23.8%
11.6%
29
2.0
0.6
29
Collaboration Mean
SD
N
16.7 %
21.1 %
30
33.1%
20.0%
21
2.4
0.6
21
7.7%
15.3 %
35
40.9%
25.4%
16
2.4
0.6
16
Research,
Exploration, &
Creativity
Mean
SD
N
26.5 %
27.7 %
30
36.7%
25.4%
28
2.3
0.6
28
9.9 %
17.2 %
35
31.7%
24.6%
19
2.2
0.7
19
Assessment &
Feedback
Mean
SD
N
31.1%
30.2%
30
37.2%
22.2%
28
2.2
0.6
28
29.0%
23.1 %
35
41.8%
23.9%
30
2.1
0.6
30
Other Instructional
Uses
Mean
SD
N
15.9%
24.6%
30
40.7%
27.8%
24
2.1
0.8
24
8.2%
12.3%
35
46.2%
28.1%
19
1.6
0.7
19
Note. RIL = Role in Learning; RIL scores range from 0 = No role to 3 = Essential role.
DIGITAL STRATEGIES AND OPPORTUNITY TO LEARN 21
Correlations among the indices within each digital instructional strategy are presented in
Table 4. These results provide insight into how the different facets of technology use in the
classroom (i.e., frequency of days used, proportion of class time) are related. Overall, these
relationships were statistically significant only among ELA teachers. For Access &
Accommodation and Research, Exploration, & Creativity, there is an inverse relationship
between the percentage of days a strategy was used and the average proportion of class time it
was used. In other words, ELA teachers who used these digital strategies during more class days
tended to also use them for a smaller proportion of class time. Additionally, for Research,
Exploration, & Creativity, frequency of days used was negatively related to RIL. That is, when
ELA teachers used this digital strategy more often, they tended to rate each use as less essential
to student learning. It may be that the extended use of this strategy was related to ongoing
projects, and therefore teachers viewed the cumulative versus specific daily use as having the
greatest impact on learning.

DIGITAL STRATEGIES AND OPPORTUNITY TO LEARN 22
Table 4.
Spearman Correlations of Usage Indices: ELA and Mathematics Teachers
ELA Teachers Mathematics Teachers
Strategy
% of Days
Used
(Frequency)
% Time Per
Class
Session (Digital
Strategy Use)
RIL
% of Days
Used (Frequency)
% Time Per
Class Session (Digital
Strategy Use)
RIL
Communication &
Information
Management
1
2
3
1.00
-0.41
0.21
-0.41
1.00
-0.15
0.21
-0.15
1.00
1.00
-0.29
0.17
-0.29
1.00
-0.37
0.17
-0.37
1.00
Direct Instruction of
Content
1
2
3
1.00
-0.03
-0.34
-0.03
1.00
-0.06
-0.34
-0.06
1.00
1.00
0.08
0.11
0.08
1.00
0.10
0.11
0.10
1.00
Access &
Accommodation
1
2
3
1.00
-0.49*
-0.07
-0.49*
1.00
0.04
-0.07
0.04
1.00
1.00
0.31
-0.11
0.31
1.00
-0.04
-0.11
-0.04
1.00
Collaboration 1
2
3
1.00
-0.29
0.07
-0.29
1.00
0.29
0.07
0.29
1.00
1.00
-0.34
0.19
-0.34
1.00
0.12
0.19
0.12
1.00
Research,
Exploration, &
Creativity
1
2
3
1.00
-0.44*
-0.41*
-0.44*
1.00
0.36
-0.41*
0.36
1.00
1.00
-0.39
-0.14
-0.39
1.00
0.29
-0.14
0.29
1.00
Assessment &
Feedback
1
2
3
1.00
-0.08
-0.03
-0.08
1.00
0.07
-0.03
0.07
1.00
1.00
-0.35
0.13
-0.35
1.00
0.32
0.13
0.32
1.00
Other Instructional
Uses
1
2
3
1.00
-0.47*
-0.37
-0.47*
1.00
0.28
-0.37
0.28
1.00
1.00
-0.01
0.27
-0.01
1.00
0.47*
0.27
0.47*
1.00
Note. * p< 0.05. RIL = Role in Learning; RIL scores range from 0 = No role to 3 = Essential role.

DIGITAL STRATEGIES AND OPPORTUNITY TO LEARN 23
Relationships between Digital Strategy Use and Opportunities to Learn
ELA teachers. To address the second research question regarding how digital
instructional strategy use functions in the context of opportunities to learn, we correlated the
indices of digital instructional strategy use with the OTL scores. Teachers’ mean OTL scores are
documented in Table 5. Results of the Spearman correlational analyses are presented in Tables 6
and 7 for ELA and Mathematics teachers, respectively.
Table 5.
Descriptive Statistics for OTL Indices
ELA Teachers
(N = 30)
Mathematics Teachers
(N = 35)
OTL Index Mean
(SD)
Mean
(SD)
Cognitive Processes 1.86
(0.11)
1.74
(0.17)
Instructional Processes 1.65
(0.14)
1.70
(0.14)
Grouping Formats 1.40
(0.20)
1.27
(0.20)
Content Standard
Coverage Per Day
0.016
(0.14)
0.013
(0.01)
Instructional Time on
Standards
0.74
(0.20)
0.53
(0.20)
Note: Scores for the Cognitive Processes, Instructional Processes, and Grouping Formats could
range from 1.0 to 2.0, with higher scores representing greater opportunity to learn. The Content
Standard Coverage Per Day represents the average proportion of total content standards a teacher
covered each day. The Instructional Time on Standards represents the average proportion of a
teacher’s allocated class time that was used for instruction.

DIGITAL STRATEGIES AND OPPORTUNITY TO LEARN 24
For ELA teachers, there was a consistent pattern across several strategies (Access &
Accommodation; Research, Exploration, & Creativity; Assessment & Feedback) where teachers
who reported using the strategy for a greater proportion of class time also reported covering
fewer content standards per day. Additionally, reported proportion of class time spent using
technology for Collaboration, and Assessment & Feedback was inversely related to reported use
of the family of “evidence-based” instructional practices listed in the online teacher log.
Teachers who perceived greater RIL when technology was used for Collaboration also reported
less use of “evidence-based” instructional practices. These results should be interpreted in the
context of how use of “evidence-based” instructional practices was scored, as mentioned
previously. It may be that digital instructional strategies, particularly for Collaboration with
technology, did not naturally align with the list of instructional practices in the logging software.
Regarding classroom grouping format, ELA teachers who reported using technology for
Assessment & Feedback for a greater proportion of class time tended to report emphasizing
individual/small group instruction more. Also, teachers who perceived greater RIL for
technology used for Access & Accommodation and Research, Exploration, & Creativity tended
to report emphasizing individual/small group instruction more. Teachers who perceived greater
RIL for technology used for Communication & Information Management, Research,
Exploration, & Creativity, and Assessment & Feedback tended to report spending less class time
covering standards. Overall, among ELA teachers, digital instructional strategy use was
associated with a variety of OTL indices, and these relationship differed by digital instructional
strategy. Potential explanations for these relationships are provided in the Discussion.
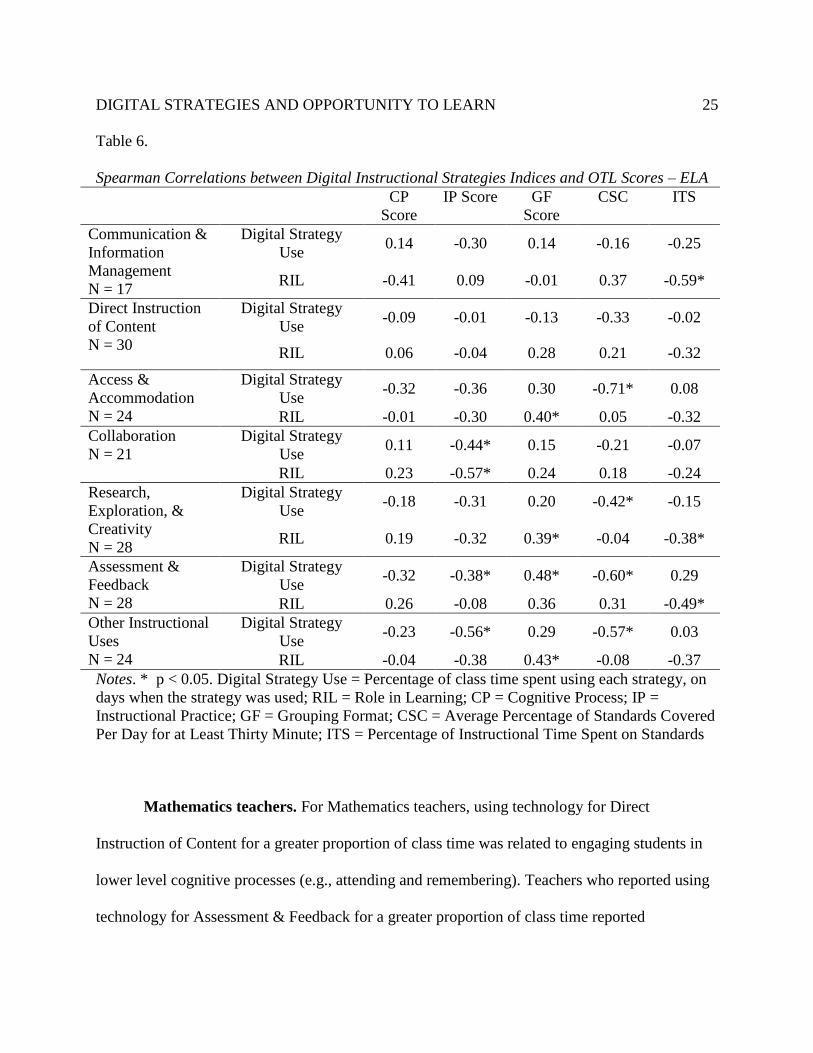
DIGITAL STRATEGIES AND OPPORTUNITY TO LEARN 25
Table 6.
Spearman Correlations between Digital Instructional Strategies Indices and OTL Scores – ELA
CP
Score
IP Score GF
Score
CSC ITS
Communication &
Information
Management
N = 17
Digital Strategy
Use 0.14 -0.30 0.14 -0.16 -0.25
RIL -0.41 0.09 -0.01 0.37 -0.59*
Direct Instruction
of Content
N = 30
Digital Strategy
Use -0.09 -0.01 -0.13 -0.33 -0.02
RIL 0.06 -0.04 0.28 0.21 -0.32
Access &
Accommodation
N = 24
Digital Strategy
Use -0.32 -0.36 0.30 -0.71* 0.08
RIL -0.01 -0.30 0.40* 0.05 -0.32
Collaboration
N = 21
Digital Strategy
Use 0.11 -0.44* 0.15 -0.21 -0.07
RIL 0.23 -0.57* 0.24 0.18 -0.24
Research,
Exploration, &
Creativity
N = 28
Digital Strategy
Use -0.18 -0.31 0.20 -0.42* -0.15
RIL 0.19 -0.32 0.39* -0.04 -0.38*
Assessment &
Feedback
N = 28
Digital Strategy
Use -0.32 -0.38* 0.48* -0.60* 0.29
RIL 0.26 -0.08 0.36 0.31 -0.49*
Other Instructional
Uses
N = 24
Digital Strategy
Use -0.23 -0.56* 0.29 -0.57* 0.03
RIL -0.04 -0.38 0.43* -0.08 -0.37
Notes. * p < 0.05. Digital Strategy Use = Percentage of class time spent using each strategy, on
days when the strategy was used; RIL = Role in Learning; CP = Cognitive Process; IP =
Instructional Practice; GF = Grouping Format; CSC = Average Percentage of Standards Covered
Per Day for at Least Thirty Minute; ITS = Percentage of Instructional Time Spent on Standards
Mathematics teachers. For Mathematics teachers, using technology for Direct
Instruction of Content for a greater proportion of class time was related to engaging students in
lower level cognitive processes (e.g., attending and remembering). Teachers who reported using
technology for Assessment & Feedback for a greater proportion of class time reported

DIGITAL STRATEGIES AND OPPORTUNITY TO LEARN 26
emphasizing “evidence-based” instructional practices less. As noted previously, this finding
should be considered in the context of how the “evidence-based” instructional practice index was
scored. Additionally, perceptions of a greater RIL for technology used for Communication &
Information Management was associated with greater use of individual and/or small group
instruction while perceptions of greater RIL for Access & Accommodation was associated with
more whole group instruction. Perceptions of a greater RIL for technology used for Access &
Accommodation and Assessment & Feedback was also related to covering more content
standards per day. Overall, as with the ELA teachers, Math teachers’ use of digital instructional
strategies was associated with a variety of OTL indices, depending on the digital instructional
strategy. We discuss potential explanations for this finding in the Discussion section.

DIGITAL STRATEGIES AND OPPORTUNITY TO LEARN 27
Table 7.
Spearman Correlations between Digital Instructional Strategies Indices and OTL Scores –
Mathematics
CP
Score
IP Score GF
Score
CSC ITS
Communication &
Information
Management
N = 16
Digital Strategy
Use -0.12 -0.25 -0.19 -0.24 0.36
RIL 0.14 0.09 0.57* 0.19 -0.02
Direct Instruction
of Content
N = 35
Digital Strategy
Use -0.50* 0.25 0.01 -0.30 -0.16
RIL -0.04 0.16 -0.07 0.07 -0.11
Access &
Accommodation
N = 29
Digital Strategy
Use 0.20 -0.20 -0.33 -0.23 0.13
RIL 0.09 0.02 -0.41* 0.44* 0.03
Collaboration
N = 16
Digital Strategy
Use 0.32 -0.46 -0.24 -0.24 0.50
RIL -0.34 -0.18 0.18 0.38 0.15
Research,
Exploration, &
Creativity
N = 19
Digital Strategy
Use 0.05 -0.30 0.34 -0.06 0.22
RIL -0.30 0.04 -0.19 0.14 -0.20
Assessment &
Feedback
N = 30
Digital Strategy
Use 0.27 -0.46* -0.05 -0.14 0.21
RIL 0.29 -0.18 0.04 0.42* 0.06
Other Instructional
Uses
N = 19
Digital Strategy
Use 0.13 -0.34 0.03 -0.30 0.51*
RIL 0.07 -0.03 0.18 -0.52* 0.21
Notes. * p < 0.05. Digital Strategy Use = Percentage of class time spent using each strategy, on
days when the strategy was used; RIL = Role in Learning; CP = Cognitive Process; IP =
Instructional Practice; GF = Grouping Format; CSC = Average Percentage of Standards Covered
Per Day for at Least Thirty Minute; ITS = Percentage of Instructional Time Spent on Standards
Comparison of ELA and Mathematics Teachers
In general, digital strategy use was associated with more OTL indices among ELA
teachers compared with Mathematics teachers. The patterns of relationships between digital
strategy use and OTL indices also differed between ELA and Mathematics teachers. For ELA
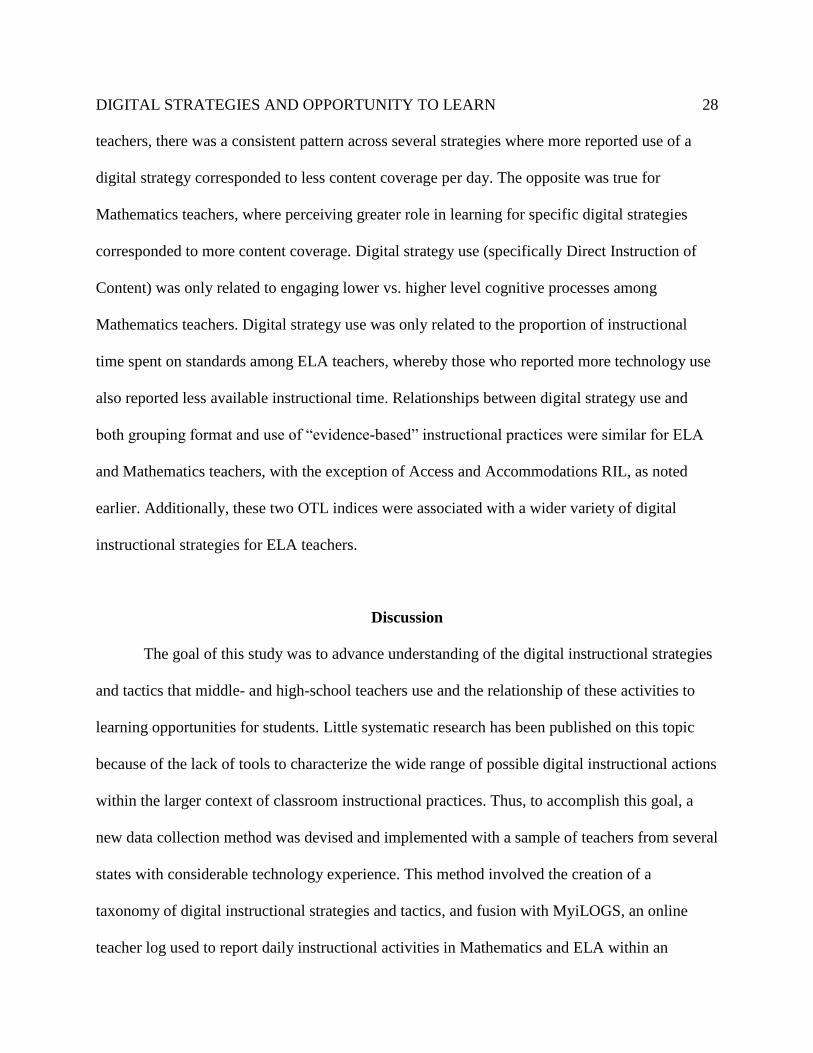
DIGITAL STRATEGIES AND OPPORTUNITY TO LEARN 28
teachers, there was a consistent pattern across several strategies where more reported use of a
digital strategy corresponded to less content coverage per day. The opposite was true for
Mathematics teachers, where perceiving greater role in learning for specific digital strategies
corresponded to more content coverage. Digital strategy use (specifically Direct Instruction of
Content) was only related to engaging lower vs. higher level cognitive processes among
Mathematics teachers. Digital strategy use was only related to the proportion of instructional
time spent on standards among ELA teachers, whereby those who reported more technology use
also reported less available instructional time. Relationships between digital strategy use and
both grouping format and use of “evidence-based” instructional practices were similar for ELA
and Mathematics teachers, with the exception of Access and Accommodations RIL, as noted
earlier. Additionally, these two OTL indices were associated with a wider variety of digital
instructional strategies for ELA teachers.
Discussion
The goal of this study was to advance understanding of the digital instructional strategies
and tactics that middle- and high-school teachers use and the relationship of these activities to
learning opportunities for students. Little systematic research has been published on this topic
because of the lack of tools to characterize the wide range of possible digital instructional actions
within the larger context of classroom instructional practices. Thus, to accomplish this goal, a
new data collection method was devised and implemented with a sample of teachers from several
states with considerable technology experience. This method involved the creation of a
taxonomy of digital instructional strategies and tactics, and fusion with MyiLOGS, an online
teacher log used to report daily instructional activities in Mathematics and ELA within an

DIGITAL STRATEGIES AND OPPORTUNITY TO LEARN 29
opportunity to learn framework. The results of this effort provide initial evidence to answer
fundamental research questions and stimulate a program of future research on the effects of
technology and digital instruction on classroom practices and learning, informing our
understanding and measurement of technological use.
Key Findings
Our initial experience in training the teachers to use the taxonomy to report technology
use within the OTL framework suggests that this approach has promise. Throughout the study,
interactions with teachers about the logging software indicated that they found it easy to use and
intuitively clear. Moreover, results indicate that they used the full spectrum of the taxonomy, and
informal independent classroom observations reflected accurate use in most cases (e.g., 92%
agreement between the observer and the teacher in logging Direct Instruction strategies). Our
results and experiences also suggest some areas for potential refinement of this system to further
improve its ability to accurately capture teacher technology use, which we address below. The
Role in Learning (RIL) ratings were generally high (positive) and also useful for characterizing
the perceptions teachers held about the instructional value of the various digital strategies and
tactics. Coupled with the fact that these digital instructional measures were embedded in a well-
established online teacher logging system for documenting OTL, these results can help advance
the study of instruction in digital learning environments.
From a substantial array of descriptive results, the following findings stood out and have
implications for future research. Of the six digital instruction strategies examined, Direct
Instruction of Content was the most prevalent for both ELA and Mathematics teachers. This
strategy includes four tactics and a wide array of accompanying activities. Four other categories

DIGITAL STRATEGIES AND OPPORTUNITY TO LEARN 30
of digital instructional strategies were reported to be consistently (although less frequently) used
by both Mathematics and ELA teachers: Collaboration; Research, Exploration, & Creativity;
Assessment & Feedback; and Other Instructional Uses. Of these, the Other Instructional Uses
category requires further examination to clarify what instructional activities are actually
occurring. Refinement of this category will help to update the taxonomy to more accurately
reflect teachers’ use of digital instructional practices.
Key remaining findings concerned the relationship between the use of digital strategies,
their perceived RIL, and OTL variables. First, the use of digital strategies in relation to the
percentage of classroom time used for instruction varied between ELA and Mathematics
teachers. Among ELA teachers, use of several digital strategies was associated with using less
class time for instruction, while this relationship was not present among Mathematics teachers.
Perhaps the way technology was used by ELA teachers required extra set-up time or trouble-
shooting which slightly reduced time available for instruction; additionally, ELA teachers may
have used technology to increase the efficiency of some aspects of instruction on days with
limited instructional time. If replicable, this is an interesting finding that deserves deeper
examination to document and explain potential interactions between digital strategies and
content areas, and their relationship with instructional time.
Second, as use of several digital strategies increased, the number of content standards
covered decreased among ELA teachers, while use of two digital strategies was associated with
increased content coverage among Mathematics teachers. One possible explanation is that ELA
teachers utilize technology for teaching standards in greater depth, which decreases the breadth
DIGITAL STRATEGIES AND OPPORTUNITY TO LEARN 31
of coverage. For Math teachers, it may be that they focus on technology as a way to enhance
efficiency in covering more standards.
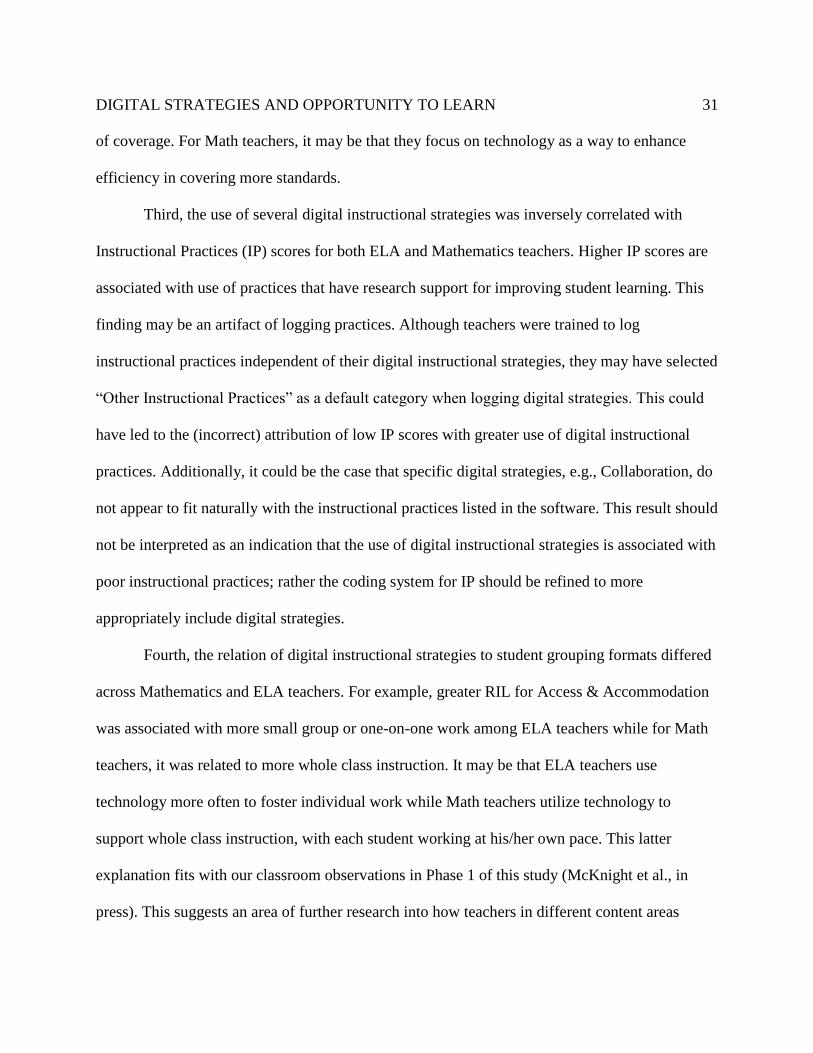
Third, the use of several digital instructional strategies was inversely correlated with
Instructional Practices (IP) scores for both ELA and Mathematics teachers. Higher IP scores are
associated with use of practices that have research support for improving student learning. This
finding may be an artifact of logging practices. Although teachers were trained to log
instructional practices independent of their digital instructional strategies, they may have selected
“Other Instructional Practices” as a default category when logging digital strategies. This could
have led to the (incorrect) attribution of low IP scores with greater use of digital instructional
practices. Additionally, it could be the case that specific digital strategies, e.g., Collaboration, do
not appear to fit naturally with the instructional practices listed in the software. This result should
not be interpreted as an indication that the use of digital instructional strategies is associated with
poor instructional practices; rather the coding system for IP should be refined to more
appropriately include digital strategies.
Fourth, the relation of digital instructional strategies to student grouping formats differed
across Mathematics and ELA teachers. For example, greater RIL for Access & Accommodation
was associated with more small group or one-on-one work among ELA teachers while for Math
teachers, it was related to more whole class instruction. It may be that ELA teachers use
technology more often to foster individual work while Math teachers utilize technology to
support whole class instruction, with each student working at his/her own pace. This latter
explanation fits with our classroom observations in Phase 1 of this study (McKnight et al., in
press). This suggests an area of further research into how teachers in different content areas

DIGITAL STRATEGIES AND OPPORTUNITY TO LEARN 32
leverage digital instructional strategies in different ways that impact classroom grouping
practices.
Finally, in most cases, the types of cognitive processes teachers emphasized did not
appear to be related to specific digital strategy use. Direct Instruction for Mathematics teachers is
the only exception, where greater use of technology was associated with emphasizing lower level
cognitive processes. If this finding is replicable, further investigation as to how Mathematics
teachers are using these tactics is warranted. One potential explanation to explore is whether
Math teachers use technology more often for introducing new methods or practicing procedures,
which may engage cognitive processes such as attending and remembering rather than the
“higher” level processes of understanding, applying, evaluating and creating.
Limitations of the Study
Although this study examined a new way of conceptualizing digital instruction in
Mathematics and ELA classrooms, the generalization of results is limited by several factors.
First, the sample of middle- and high-school teachers who participated in the study were
volunteers interested in instructional technology and employed in schools where technology was
prevalent. It may be that the way teachers in these schools used technology is not representative
of Math and ELA classrooms outside this context. Second, the measurement of digital strategy
use and instructional practice relied on teachers logging their own practices. While this logging
is likely more accurate than general recall of teaching practice, it relies on the teacher’s accurate
understanding of the different digital strategies and the OTL variables. Third, comparisons of
Mathematics and ELA teachers sometimes involved small sample sizes and therefore results
should be regarded as preliminary and hypothesis generating. Lastly, the integration of digital

DIGITAL STRATEGIES AND OPPORTUNITY TO LEARN 33
strategies into the online teacher logging system indicated a potential area of concern regarding
how digital strategies were categorized by the teachers within the instructional practices matrix.
This may limit the application of previous reliability/validity findings to the use of this online
teacher log for measuring digital strategy use, indicating a need to refine the system and conduct
further reliability and validity studies with this new logging system.
Implications for Practice
Given the early stages of this research, specific recommendations for technology use
based on these results is beyond the scope of this paper. Future research (as discussed in the next
section) is needed to specifically link the use of these digital strategies to student learning and
other outcomes. However, our taxonomy of technology use, particularly when integrated into the
MyiLogs system, provides a useful logging tool for teachers’ own professional growth and
development. An important component of the OTL framework is that it can function as
formative assessment for teachers to examine their own instructional practices, on their own or
with a coach or mentor, and possibly help identify areas for improvement or change. Likewise,
our taxonomy of digital instructional strategies can be used by teachers to identify trends in their
technology use and informally assess how students respond to different types of technology use.
Prior research indicates that self-monitoring can help to positively shape teaching practices
(Allinder, Bolling, Oats, & Gagnon, 2000; Kalis, Vannest, & Parker, 2007).
Recommendations for Future Research
The present study results are rich with implications and directions for future research that
have the potential to ultimately influence classroom instruction. First, the development and use
of the new “taxonomy” of six digital instructional strategies and 16 related instructional tactics
DIGITAL STRATEGIES AND OPPORTUNITY TO LEARN 34
provided a useful framework for describing a wide range of instructional activities and thus
should advance more systematic, coordinated research in this area. One avenue for future
research is to jointly examine the use of technology and teaching practices. As noted earlier,
instructional practices, grouping format, and cognitive engagement were logged independently of
digital instructional strategies (i.e. in different matrices). Future research and development could
more directly link these aspects of instruction, for example, by having teachers rate the
instructional practices, group formats, cognitive engagement, and technology use during a
specific period of time. Future research is also needed in linking digital instructional strategy use
with measures of student learning. A number of the findings suggested different uses and
impacts of digital instructional strategies for Mathematics teachers versus ELA teachers. More
research on the interactions between digital strategies and instruction in Mathematics, ELA and
even other subject areas would be useful.
Overall, this descriptive study was designed to address questions fundamental to the
initiation of a program of research on digital instructional strategies and classroom learning. Our
results can now become starting points for replication and extension studies for those interested
in advancing digital instruction research and practices
DIGITAL STRATEGIES AND OPPORTUNITY TO LEARN 35
References
Allinder, R.M., Bolling, R.M., Oats, R.G., & Gognon, W.A. (2000). Effects of teacher self-
monitoring on implementation of curriculum-based measurement and mathematics
computation achievement of students with disabilities. Remedial and Special Education,
21(4), 219-226. doi: 10.1177/074193250002100403
Anderson, L. W., Krathwohl, D. R., Airasian, P. W., Cruikshank, K. A., Mayer, R. E., Pintrich,
P. R., … Wittrock, M. C. (2001). A taxonomy for learning, teaching, and assessing: A
revision of Bloom’s taxonomy of educational objectives. New York, NY: Longman.
Baylor, A.L., & Ritchie, D. (2002). What factors facilitate teacher skill, teacher morale, and
perceived student learning in technology-using classrooms. Computers & Education,
39(4), 395-414. doi:10.1016/S0360-1315(02)00075-1
Bebell, D., & O’Dwyer, L.M. (2010). Educational outcomes and research from 1:1 computing
settings. Journal of Technology, Learning, and Assessment, 9(1), 5-15.
doi: http://dx.doi.org/10.14507/epaa.v8n51.2000
Becker, H.J. (2000). Findings from the teaching, learning, and computing survey: Is Larry Cuban
right? Education Policy Analysis Archives, 8(51), 1-31.
Bingimlas, K.A. (2009). Barriers to successful integration of ICT in teaching and learning
environments: A review of the literature. Eurasia Journal of Mathematics, Science, &
Technology Education, 5(3), 235-245.
Caldwell, J.E. (2007). Clickers in the large classroom: Current research and best-practice tips.
CBE Life Science Education, 6(1), 9-20. doi: 10.1187/cbe.06-12-0205
ClassTech. (2006). ClassTech 2005-2006 assessment conclusions report. Retrieved from

DIGITAL STRATEGIES AND OPPORTUNITY TO LEARN 36
http://www.ncsu.edu/classtech/survey_results/2005-
6/ClassTech_Assessment_Conclusions.pdf
D’Agostino, R.B. (1970). Transformation to Normality of the Null Distribution of G1.
Biometrika, 57(3), 679-681. doi: 10.2307/2334794
Digital Promise (2014). Digital Promise: Accelerating Innovation in Education. Retrieved from
http://www.digitalpromise.org
Dunleavy, M., & Dexter, S. (2007). What added values does a 1:1 student to laptop ratio bring
to technology-supported teaching and learning. Journal of Computer Assisted Learning,
23, 440-452. doi:10.1111/j.1365-277=29.2007.00227.x
Glassett, K., & Schrum, L. (2009). Teacher beliefs and student achievement in technology-rich
classroom environments. International Journal of Technology in Teaching and Learning,
5(2), 138-153.
Greaves, T., Hayes, J., Wilson, L., Gielniak, M., & Peterson, R. (2010). The technology factor:
Nine keys to student achievement and cost-effectiveness. Project Red. Retrieved from
http://pearsonfoundation.org/downloads/ProjectRED_TheTechnolgyFactor.pdf.
Herman, J. L., Klein, D. C., & Abedi, J. (2000). Assessing students’ opportunity to learn:
Teacher and student perspectives. Educational Measurement: Issues and Practice, 19(4),
16–24. doi: 10.1111/j.1745-3992.2000.tb00042.x
Hopson, M.H., Simms, R.L., & Knezek, G.A. (2001). Using a technology-enriched environment
to improve higher-order thinking skills. Journal of Research on Technology in
Education, 34(2), 109-119. doi: 10.1080/15391523.2001.10782338

DIGITAL STRATEGIES AND OPPORTUNITY TO LEARN 37
Inan, F.A., Lowther, D.L., Ross, S.M., & Strahl, D. (2010). Pattern of classroom activities
during students’ use of computers: Relations between instructional strategies and
computer applications. Teaching and Teacher Education, 26(3), 540-546.
doi:10.1016/j.tate.2009.06.017
Kalis , T.M., Vannest, K.J., & Parker, R. (2007) Praise counts: using self-monitoring to increase
effective teaching practices, Preventing School Failure: Alternative Education for
Children and Youth, 51(3), 20-27, doi: 10.3200/PSFL.51.3.20-27
Kurz, A. (2011). Access to what should be taught and will be tested: Students’ opportunity to
learn the intended curriculum. In S. N. Elliott, R. J. Kettler, P. A. Beddow, & A. Kurz
(Eds.), Handbook of accessible achievement tests for all students: Bridging the gaps
between research, practice, and policy (pp. 99-129). New York, NY: Springer.
Kurz, A., Elliott, S.N., Kettler, R.J., & Yel, N. (2014). Assessing students’ opportunities to learn
the intended curriculum using an online teacher log: Initial validity evidence. Educational
Assessment, 19(3), 159-184. doi: 10.1080/10627197.2014.934606.
Kurz, A., Elliott, S. N., & Shrago, J. S. (2009). MyiLOGS: My instructional learning
opportunities guidance system. Nashville, TN: Vanderbilt University.
Marzano, R. J. (2000). A new era of school reform: Going where the research takes us (REL No.
#RJ96006101). Aurora, CO: Mid-continent Research for Education and Learning.
Mayer, R. E. (2008). Learning and instruction (2nd ed.). Upper Saddle River, NJ: Pearson.
McKnight, K., O'Malley, K., Ruzic, R., Horsley, M., Franey, J., & Bassett, K. (in press).
Teaching in a digital age: How educators use technology to improve student
learning. Journal of Research on Technology in Education.

DIGITAL STRATEGIES AND OPPORTUNITY TO LEARN 38
Mishra, P., & Koehler, M. J. (2003). Not ‘‘what’’ but ‘‘how’’: Becoming design-wise about
educational technology. In Y. Zhao (Ed.), What teachers should know about technology:
Perspectives and practices (pp. 99–122). Greenwich, CT: Information Age Publishing
Puentedura, R. (2010). SAMR and TPCK: Intro to advanced practice. Retrieved from
http://hippasus.com/resources/sweden2010/SAMR_TPCK_IntroToAdvancedPractice.pdf
Pullin, D. C. (2008). Assessment, equity, and opportunity to learn. In P. A. Moss, D. C. Pullin, J.
P. Gee, E. H. Haertel, & L. J. Young (Eds.), Assessment, equity, and opportunity to learn.
New York, NY: Cambridge University Press.
Rowan, B., Camburn, E., & Correnti, R. (2004). Using teacher logs to measure the enacted
curriculum: A study of literacy teaching in third-grade classrooms. Elementary School
Journal, 105(1), 75–101. doi: 10.1086/428803
Stevens, F. I., & Grymes, J. (1993). Opportunity to learn: Issues of equity for poor and minority
students (NCES No. 93-232). Washington, DC: National Center for Education Statistics.
Vaughn, S., Gersten, R., & Chard, D. J. (2000). The underlying message in LD intervention
research: Findings from research syntheses. Exceptional Children, 67(1), 99-114.
doi: 10.1177/001440290006700107
Wang, J. (1998). Opportunity to learn: The impacts and policy implications. Educational
Evaluation and Policy Analysis, 20(3), 137–156. doi: 10.3102/01623737020003137
Waxman, H.C., & Huang, S.L. (1996). Classroom instruction differences by level of technology
use in middle school mathematics. Journal of Educational Computing Research, 14(2),
157-169. doi: 10.2190/60LV-PWDJ-2L9P-3TQN