Digital Advertising 2020 - salesforce.com · Facebook and Google Dominate as Video Rises in...
18
Digital Advertising 2020 Insights into a new era of advertising and media buying
Transcript of Digital Advertising 2020 - salesforce.com · Facebook and Google Dominate as Video Rises in...

Digital Advertising 2020Insights into a new era of advertising and media buying

Digital Advertising 2020 / 2Salesforce Research
01.
02.
03.
04.
05.
06.
07.
Advertising and Marketing Are Converging 3
Data – Lots of Data – Is Advertising’s North Star 5
Facebook and Google Dominate as Video Rises in Importance 10
New Metrics Signal Success in a Data-Driven World 12
Last Look: New Tech Means New Ad Space 14
Appendix 15
Methodology 18
Introduction
Digital Advertising 2020/ 2
Consumers and business buyers receive more messages, through more
channels, than ever before. Cutting through the noise requires advertisers
to deliver hyperpersonalized messages that resonate at the individual
level. Now, advertising is undergoing a transformation — the biggest
revolution since the launch of digital ads in the 1990s — driven by data.
To effectively reach audiences and interact with them in a smarter, 1-to-1
manner, advertisers must connect and make sense of a myriad of data
sources. Of course, achieving this requires a shift in dynamics; advertising
and marketing can’t live in vacuums. Technology can’t be an afterthought.
The winners in this new era will coalesce the right teams and technologies
to harness data, more precisely track their efforts, and measure progress
to evolve their strategies at the pace of the consumer.
Dominant channels — and thus budgets — are shifting, too. Increasingly,
advertisers will rely on major platforms under the Google and Facebook
umbrellas to deliver their messages. And success isn’t measured only by
clicks and impressions, but also lifetime customer value.
Based on a global survey of 900 advertising leaders across
North America, Europe, and the Asia-Pacific region, this research
illustrates new priorities, strategies, and tactics that signify the
dawn of a new era in advertising.
Technology Unites Advertisers and Marketers in Creating Personalized Experiences

Digital Advertising 2020 / 3Salesforce Research
01. Advertising and Marketing Are Converging
Advertising is breaking free from its silo after being an autonomous
part of companies for many years.
the majority of advertising and marketing organizations now share common budgets and use the same team to send emails and to build ad campaigns.
North American teams lead the pack in this evolution, but advertisers
across the globe are poised to catch up. Only a small minority of global
advertising teams lack plans to integrate themselves within the broader
marketing organization.
Share brand and/or creative teams
Percentage of advertisers whose advertising and marketing teams do the following
ADVERTISING AND MARKETING TEAMS’ SHARED ACTIVITIES
NORTH AMERICA ASIA-PACIFIC EUROPE
41%54% 36%52%
40%56% 31%55%
37%59% 51% 40%
56% 37%51%40%
34%60% 53% 38%
27%
25%
66%
66%
22%65%
21%73%
74% 20%Collaborate on the evaluation and purchase of technology
Share a common budget
Build budgets together in a single process
Report to a single departmental head responsible for sending email campaigns and purchasing media
Share brand and/or creative teams
TOTAL
35%
34%
58%
57%
31%59%
31%62%
61% 32%Collaborate on the evaluation and purchase of technology
Share a common budget
Build budgets together in a single process
Report to a single departmental head responsible for sending email campaigns and purchasing media
Currently do Plan to do

Digital Advertising 2020 / 4Salesforce Research
Employees of our company
01. Advertising and Marketing Are Converging
Many advertisers are relying less on agencies to do the work; instead
they’re orchestrating their own creative design and campaign plans in-
house. This trend is possibly due to a desire among teams to gain control
over their digital advertising, while also fostering alignment with the rest
of their marketing. At least half of companies rely entirely on internal
staff to optimize ad spend across any given digital channel.
Around one-fifth to one-quarter of companies choose to blend advertising
efforts between employees and outside agencies. The appeal of greater
control is clear enough, but cost and efficiency may factor in, too. While
some companies may prefer to save money by orchestrating advertising
in-house, others are highly resourced companies that choose to staff their
own top-tier in-house team to foster better alignment with marketing.
Distribution of responsibility for various types of advertising between internal employees and outside agencies
DIGITAL AD CAMPAIGN MANAGEMENT
NORTH AMERICA ASIA-PACIFIC EUROPE
TOTAL
Mix of company employees and outside agenciesAn outside agency
24%50% Display 23%
22%52% YouTube and other video 19%
Facebook and Instagram 21%59% 18%
57% 20% Google Search 23%
Display 29%49% 17% 16%55% 27% 25%46% 24%
YouTube and other video 31%46% 15% 18%59% 20% 18%53% 23%
Facebook and Instagram 28%56% 12% 18%59% 22% 16%62% 19%
Google Search 53% 25%21% 62% 16%22% 55% 18%25%
57% rely entirely on internal staff to optimize ad spend for Google Search.
59%rely entirely on internal staff to optimize ad spend for Facebook and Instagram.

Digital Advertising 2020 / 5Salesforce Research
02. Data — Lots of Data — Is Advertising’s North Star
92%
85%
92%
92%
89%
93%
94%
90%
95%
ONLINE DATA (first-party anonymous, second-party, or third-party)
CRM-BASED DATA (email addresses, phone numbers, or other CRM-based data)
DEMOGRAPHIC DATA (personal, location info, or interests)
The number of data sources available to inform digital advertising
continues to grow. Yet, each contributes to a single objective: targeting
the right audience, with the right message, at the right time.
There are three primary categories of data available: customer relationship
management (CRM) data, online data, and demographic data. The
vast majority of advertisers use all three categories, and the number of
individual data sources advertisers use is on the rise.
Last year, advertisers used an average of 5.4 data sources, and next year they’re planning to use an average of 6.2.
Percentage of advertisers using the following types of data
DATA TYPES USED FOR DIGITAL ADVERTISING
Last fiscal year Planned or continued use next fiscal yearCurrent fiscal year
Salesforce Research

Digital Advertising 2020 / 6Salesforce Research
CRM-BASED DATA (email addresses, phone numbers, or other CRM-based data)
92%
92%94%
Email addresses
75%
76%76%
Phone numbers
61%
64%66%
CRM-based data other than email addresses and phone numbers (transactions, postal address, customer service information, etc.)
56%
69%68%
02. Data — Lots of Data — Is Advertising’s North Star
+27%
ANTICIPATED
TWO-YEAR GROWTH*
* Anticipated two-year growth is calculated using the difference of “planned or continued use next fiscal year” and “last fiscal year” divided by “last fiscal year.”
0%
+2%
+5%
+23%
94% of advertisers now use CRM data — such as email addresses, phone numbers, and other brand interactions — to Target advertising.
As platforms — including Google and Facebook — have made it easier to
use known customer data to target advertising, more companies are using
CRM-based data beyond email addresses and phone numbers.
The percentage of companies targeting based on CRM data such as
purchase transactions, postal address, and customer service information
will rise from 56% last year to an estimated 69% next year.
Percentage of advertisers using or planning to use CRM-based data to target digital ads
CRM DATA USAGE
Last fiscal year Planned or continued use next fiscal yearCurrent fiscal year
projected growth in the use of other CRM data beyond email addresses and phone numbers is particularly strong in North America.
See the appendix for regional data cuts.

Digital Advertising 2020 / 7Salesforce Research
+32%
ANTICIPATED
TWO-YEAR GROWTH*
* Anticipated two-year growth is calculated using the difference of “planned or continued use next fiscal year” and “last fiscal year” divided by “last fiscal year.”
+5%
+5%
+26%
+30%
As prospects browse digital properties — including advertisers’ own
websites and those of other companies or publishers — 90% of
advertisers use some type of online data to target their ads. First-party
anonymous data is the most-used type of online data (71%) but with an
anticipated two-year growth rate of only 5%. In the Asia-Pacific region, use
of first-party anonymous data is expected to shrink by 9%.
Second- and third-party partnerships that allow advertisers to tap into data
sources they don’t own, thereby providing new inputs for decision-making
and targeting, will see particularly large growth. Over the next two years,
advertisers’ use of second- and third-party data will grow by 26%
and 30%, respectively.
Percentage of advertisers using or planning to use online data
ONLINE DATA USAGE
Last fiscal year Planned or continued use next fiscal yearCurrent fiscal year
projected growth in the use of second-party data over the next two years across Europe is particularly strong.
See the appendix for regional data cuts.
+47%of advertisers in North America will increase their use of third-party data, the largest increase among regions.
85%
89%90%
ONLINE DATA (first-party anonymous, second-party, or third-party)
67%
50%
45%
70%
64%
58%
71%
63%
52%
First-party anonymous data (devices and cookies collected from your own digital content)
Second-party data (devices and cookies from a direct relationship with another marketer or publisher)
Third-party data (devices and cookies from an aggregator or data broker such as Acxiom, Nielsen, or Neustar)
02. Data — Lots of Data — Is Advertising’s North Star

Digital Advertising 2020 / 8Salesforce Research
+24%
ANTICIPATED
TWO-YEAR GROWTH*
* Anticipated two-year growth is calculated using the difference of “planned or continued use next fiscal year” and “last fiscal year” divided by “last fiscal year.”
+1%
+3%
+14%
+26%
95% of advertisers use demographic data, including personal data, location information, and interests, to target prospects they know almost nothing about.
Use of newer types of data — like mobile-derived location information —
will grow 14% over the next two years. Use of interests-based data (based
on factors like personality and preferences) will see the biggest growth,
expanding by 26% as it becomes more widely available to brands.
Percentage of advertisers using or planning to use online data
DEMOGRAPHIC DATA USAGE
Last fiscal year Planned or continued use next fiscal yearCurrent fiscal year
of European advertisers will increase their use of interests-based data, representing the highest increase among regions.
See the appendix for regional data cuts.
02. Data — Lots of Data — Is Advertising’s North Star
92%
70%
65%
55%
93%
72%
74%
69%
95%
73%
75%
66%
DEMOGRAPHIC DATA (personal, location info, or interests)
Personal data (age, gender, etc.)
Location information (country, state, province, etc.)
Interests-based data (topics or product categories, etc.)

Digital Advertising 2020 / 9Salesforce Research
Used for over 3 years
No planned use/ don’t know
Plan to purchase in next fiscal year
Used for 1–3 years
Used for less than 1 year or currently implementing
20%
38%21%
11%
9%
02. Data — Lots of Data — Is Advertising’s North Star
As brands leverage multiple data sources to target audiences, they’re
increasingly turning to data management platforms (DMPs) to import
that data, find segments to target, and send instructions to networks
and websites. Adoption has reached a tipping point; while just 20% of
companies have been using a DMP for more than three years, an
additional 21% are either currently implementing a DMP or have
done so in the past year.
91% of advertisers have or plan to adopt a data management platform.
Percentage of advertisers who describe their company’s use of DMPs as follows
ADVERTISERS’ DMP USAGE
Digital Advertising 2020/ 9Salesforce Research

Digital Advertising 2020 / 10Salesforce Research
03. Facebook and Google Dominate as Video Rises in Importance
See the appendix for regional data cuts.
The dominance of Facebook and Google in the digital advertising ecosystem shows
no signs of slowing.
Next year, 66% of digital advertising spend will go to Google Search, YouTube,
Facebook, and Instagram — figures that don’t even include additional platforms or
display advertising exchanges owned by their parent companies. This stronghold is
universal; these channels represent 63% of total spend in North America, 67%
in the Asia-Pacific region, and 69% in Europe.
Percentage of ad spend allocated to the following channels
DIGITAL ADVERTISING BUDGETS
Beyond their massive audiences, both Facebook and Google are particularly appealing
to advertisers for their ability to target consumers based on real identities. Display
advertising is still an important part of this mix, though it shrank from 16% to 14% of
digital ad spend.
Not including Facebook, social channels like LinkedIn, Pinterest, Snapchat, and Twitter
account for an additional 11% of planned spend across surveyed regions. But their
collective share of advertising budgets is on the decline.
LAST FISCAL YEAR
27%
28%
14% 15%
16%
28%
30%
12% 15%
15%
11%
31% 14%
16%
28%
YouTube Facebook/InstagramDisplay Other (e.g., LinkedIn, Pinterest, Snapchat, Twitter, etc.)Search (Google + Bing)
CURRENT FISCAL YEAR
NEXT FISCAL YEAR

Digital Advertising 2020 / 11Salesforce Research
03. Facebook and Google Dominate as Video Rises in Importance
Video content is becoming more prevalent across platforms.
Over the past year, 65% of companies increased their video advertising.
This budget boost — and the relative importance of video it suggests —
could help explain why 52% of advertisers choose to maintain control
of their video advertising by producing it in-house.
B2C companies’ year-over-year growth in video advertising (59%) trails
slightly behind B2B companies’ aggressive adoption (65% growth). Why
the surge? B2B advertisers’ use of video could be due to the convergence
of consumer- and business-buyer preferences in media consumption.
As seen on the previous page, YouTube ad spending is inching upward
(15% to 16%) at about the same rate that display ad spending is
creeping downward (15% to 14%).
Change in spending on digital video advertising in the past year
CHANGE IN DIGITAL VIDEO AD SPENDING
Total
21%8%
33%6%
28%8%
9% 31% North America
Asia-Pacific
Europe 57%
58%
57%
57%
Increased substantially (+25% or more)
Increased somewhat (+2% to +24%)
Stayed about the same (±1%)
Decreased somewhat (–2% to –24%)
Decreased significantly (–25% or more)
13%
3%
6%
3%
1%
Digital Advertising 2020/ 11
See the appendix for business type data cuts.

Digital Advertising 2020 / 12Salesforce Research
04. New Metrics Signal Success in a Data-Driven World
Lifetime value of a customer
27%
More data at advertisers’ fingertips means more opportunities to
measure progress. But first, brands need to focus on what their goals are.
Natural variation by industry and region is to be expected, but even within
a single industry, the spectrum of tools and KPIs can be vast. Brands today
vary widely in what they consider most important, with almost equal
weight given to four of the five objectives surveyed. Digital optimization,
however, seems top of mind. The sophistication of advertising metrics
varies across brands.
Percentage of advertisers who say the following metrics are important to optimize their advertising
ADVERTISING SUCCESS METRICS
Impressions or web traffic from digital advertising
19% Brand recognition and lift
18% Closed-won business
15% Last-click attribution
13% Multitouch attribution
8%
Ecommerce sales (web or mobile)
22%
Percentage of advertisers who say the following objectives are most important for their digital advertising spend
DIGITAL ADVERTISING OBJECTIVES
Driving traffic to my digital properties
21% Brand awareness
21% Lead generation
21% Brick-and-mortar sales
18%
While advertising’s priorities are increasingly focused on long-term
customer relationships, the value of impressions and web traffic indicates
that advertisers also remain dedicated to acquiring new business. In the
process, they’re complementing historically simple KPIs such as last-click
attribution with more holistic assessments of customer value.
19% of advertisers cite impressions or web traffic as their next most important success metric.
27%of advertisers cite lifetime value of a customer as their top success metric.

Digital Advertising 2020 / 13Salesforce Research
04. New Metrics Signal Success in a Data-Driven World
Data management platform (DMP)
55%
Advertisers are using a wide variety of methods to measure results.
Traditional tools such as spreadsheets (42%) and website analytics
platforms (50%) are still popular. But more wide-ranging solutions like
DMPs (55%), marketing attribution (47%), and marketing automation
platforms (30%) have gained ground.
More teams are now using DMPs and web analytics than
spreadsheets, indicating a critical turning point for advertisers’
sophistication in assessing performance, measurement, and attribution.
B2B brands are 1.4x more likely than B2C brands to use CRM reports or marketing automation platforms to measure the effectiveness of their advertising spend.
On the other hand, B2B brands are 1.4x less likely than B2C brands
to consider brand recognition an important measure of advertising
success. These results represent some of the more extreme differences
in approaches to advertising between the segments. Yet overall, the
strategies and values of B2B and B2C brands are converging. What
matters in advertising — and what doesn’t — is becoming universal.
Percentage of advertisers using the following technologies to measure digital advertising effectiveness
MEASURING AD EFFECTIVENESS
Website analytics platforms
50% Marketing attribution platform
47% CRM report or dashboard
46% Reporting provided within my advertising platform
44% Spreadsheets
42% In-house/homegrown solution
39% Marketing automation platform
30%
Digital Advertising 2020/ 13Salesforce Research
See page 17 for business type data cuts.

Digital Advertising 2020 / 14Salesforce Research
05. Last Look: New Tech Means New Ad Space
Smart TVs
Voice-activated digital assistants powered by artificial intelligence
Wearable devices
Augmented or virtual reality
New technologies already in our homes (like smart TVs, voice-activated
digital assistants, and wearable devices) and those on the horizon
(like augmented and virtual reality) present advertisers with exciting
opportunities to reach audiences in new ways.
Advertisers expect these NEW technologies will capture more of their audiences’ personal and professional hours.
As such, they have big plans to leverage them in delivering personalized
messages to the right prospects at just the right moment.
Percentage of advertisers using the following technologies to advertise
NEW TECH ADOPTION
Currently use No plans to use in the next 12 monthsPlan to use in the next 12 months
24%44% 29%
24%39% 35%
29%36% 31%
29%32% 36%
Salesforce Research

Digital Advertising 2020 / 15Salesforce Research
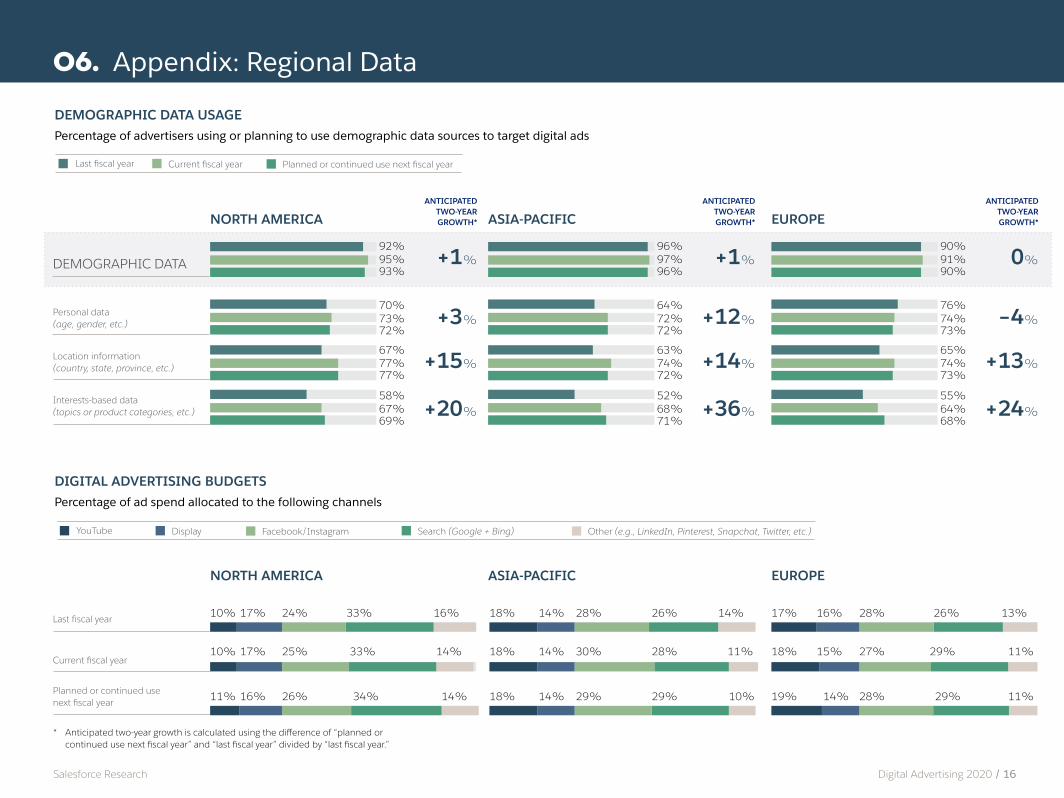
06. Appendix: Regional Data
Percentage of advertisers using or planning to use CRM-based data to target digital ads
CRM DATA USAGELast fiscal year Planned or continued use next fiscal yearCurrent fiscal year
*Anticipated two-year growth is calculated using the difference of “planned or continued use next fiscal year” and “last fiscal year” divided by “last fiscal year.”
** CRM-based data other than email addresses and phone numbers includes transactions, postal address, customer service information, etc.
NORTH AMERICA
CRM-based data other than email addresses and phone numbers**
70%
Phone numbers
62%
CRM-BASED DATA
94%
Email addresses 80%
65%
59%
93%
79%
55%
56%
91%
76%
ANTICIPATED TWO-YEAR GROWTH*
+3%
+5%
+10%
+27%
ASIA-PACIFIC
71%
70%
94%
71%
72%
77%
99%
72%
58%
63%
97%
71%
ANTICIPATED TWO-YEAR GROWTH*
–3%
0%
+11%
+22%
EUROPE
65%
60%
89%
78%
67%
63%
91%
78%
55%
63%
88%
77%
ANTICIPATED TWO-YEAR GROWTH*
+1%
+1%
–4%
+20%
Percentage of advertisers using or planning to use online data sources to target digital ads
ONLINE DATA USAGE***
NORTH AMERICA
Third-party data
55%
Second-party data
61%
ONLINE DATA
88%
First-party anonymous data 72%
46%
61%
88%
71%
37%
49%
81%
59%
ANTICIPATED TWO-YEAR GROWTH*
+9%
+21%
+24%
+47%
ASIA-PACIFIC
67%
69%
94%
67%
62%
73%
96%
70%
58%
56%
95%
73%
ANTICIPATED TWO-YEAR GROWTH*
–1%
–9%
+25%
+16%
EUROPE
51%
61%
85%
72%
49%
57%
85%
73%
38%
46%
78%
68%
ANTICIPATED TWO-YEAR GROWTH*
+8%
+7%
+32%
+34%
*** First-party anonymous data includes devices and cookies collected from your own digital content; second-party data includes devices and cookies from a direct relationship with another marketer or publisher; and third-party data includes devices and cookies from an aggregator or data broker such as Acxiom, Nielsen, or Neustar.
Digital Advertising 2020 / 16Salesforce Research
06. Appendix: Regional Data
Percentage of advertisers using or planning to use demographic data sources to target digital ads
DEMOGRAPHIC DATA USAGE
Last fiscal year Current fiscal year
* Anticipated two-year growth is calculated using the difference of “planned or continued use next fiscal year” and “last fiscal year” divided by “last fiscal year.”
NORTH AMERICA
Interests-based data (topics or product categories, etc.)
69%
Location information (country, state, province, etc.)
77%
DEMOGRAPHIC DATA
93%
Personal data (age, gender, etc.)
72%
67%
77%
95%
73%
58%
67%
92%
70%
ANTICIPATED TWO-YEAR GROWTH*
+1%
+3%
+15%
+20%
ASIA-PACIFIC
71%
72%
96%
72%
68%
74%
97%
72%
52%
63%
96%
64%
ANTICIPATED TWO-YEAR GROWTH*
+1%
+12%
+14%
+36%
EUROPE
68%
73%
90%
73%
64%
74%
91%
74%
55%
65%
90%
76%
ANTICIPATED TWO-YEAR GROWTH*
0%
–4%
+13%
+24%
Percentage of ad spend allocated to the following channels
DIGITAL ADVERTISING BUDGETS
NORTH AMERICA
Last fiscal year 10%
ASIA-PACIFIC EUROPE
Planned or continued use next fiscal year 11%
Current fiscal year
10%
Planned or continued use next fiscal year
YouTube Facebook/InstagramDisplay Other (e.g., LinkedIn, Pinterest, Snapchat, Twitter, etc.)Search (Google + Bing)
17%
16%
17%
24%
26%
25%
33%
34%
33%
16%
14%
14%
18%
18%
18%
14%
14%
14%
28%
29%
30%
26%
29%
28%
14%
10%
11%
17%
19%
18%
16%
14%
15%
28%
28%
27%
26%
29%
29%
13%
11%
11%

Digital Advertising 2020 / 17Salesforce Research
B2B 30%9%
8% 29% B2C
57%
51%
4%
12%
06. Appendix: Business Type Data
Change in spending on digital video advertising in the past year
CHANGE IN DIGITAL VIDEO AD SPENDING
Increased substantially (+25% or more) Stayed about the same (±1%)Increased somewhat (+2% to +24%) Decreased significantly (–25% or more)Decreased somewhat (–2% to –24%)
1%
7% 26% Evenly split between consumers and business buyers 63% 3%
Data management platform (DMP)
57%
Percentage of advertisers using the following technologies to measure digital advertising effectiveness
MEASURING AD EFFECTIVENESS
Website analytics platforms
55% Marketing attribution platform
50% CRM report or dashboard
59% Reporting provided within my advertising platform
54% Spreadsheets
46% In-house/homegrown solution
47% Marketing automation platform
35%
B2B
B2C
EVENLY SPLIT BETWEEN CONSUMERS AND BUSINESS BUYERS
49%
53%
48%
42%
42%
44%
38%
25%
60%
46%
44%
43%
41%
39%
36%
31%
Digital Advertising 2020 / 18Salesforce Research Digital Advertising 2020/ 18Salesforce Research
07. Methodology
Data in this study is based on responses from 900 full-time advertisers,
media buyers, and marketers with titles of manager and above.
Respondents were required to have decision-making responsibility for
advertising and/or media buying at their company, as well as decision-
making authority or influence over their companies’ digital marketing
databases.
Respondents are from companies in North America (United States,
Canada), Europe (France, Germany, the Netherlands, United Kingdom/
Ireland), and the Asia-Pacific region (Japan, Australia/New Zealand). Each
region is represented by a sample size of 300.
The research was conducted online via FocusVision in November 2017.
Respondents for this survey were selected from those who have agreed to
participate in online surveys.
Due to rounding, not all percentage totals in this report equal 100%.