Digging Deeper: Understanding Disaster Recovery in the … · Understanding Disaster Recovery in...
14
Understanding Disaster Recovery in the U.S. and New York State 2012-2017 Digging Deeper:
Transcript of Digging Deeper: Understanding Disaster Recovery in the … · Understanding Disaster Recovery in...
stormrecovery.ny.gov 1
Understanding Disaster Recovery in the U.S. and
New York State
2012-2017
Digging Deeper:
stormrecovery.ny.gov2 stormrecovery.ny.gov 3
6 What is the Community Development Block Grant - Disaster Recovery Program?
4 How Much Federal Aid Came to New York?
14 What is a Floodplain?
10 Long-Term Recovery is a Long-Term Effort
22 Community-Led Construction
16 Managed Retreat in Action
Table of Contents
3 Introduction
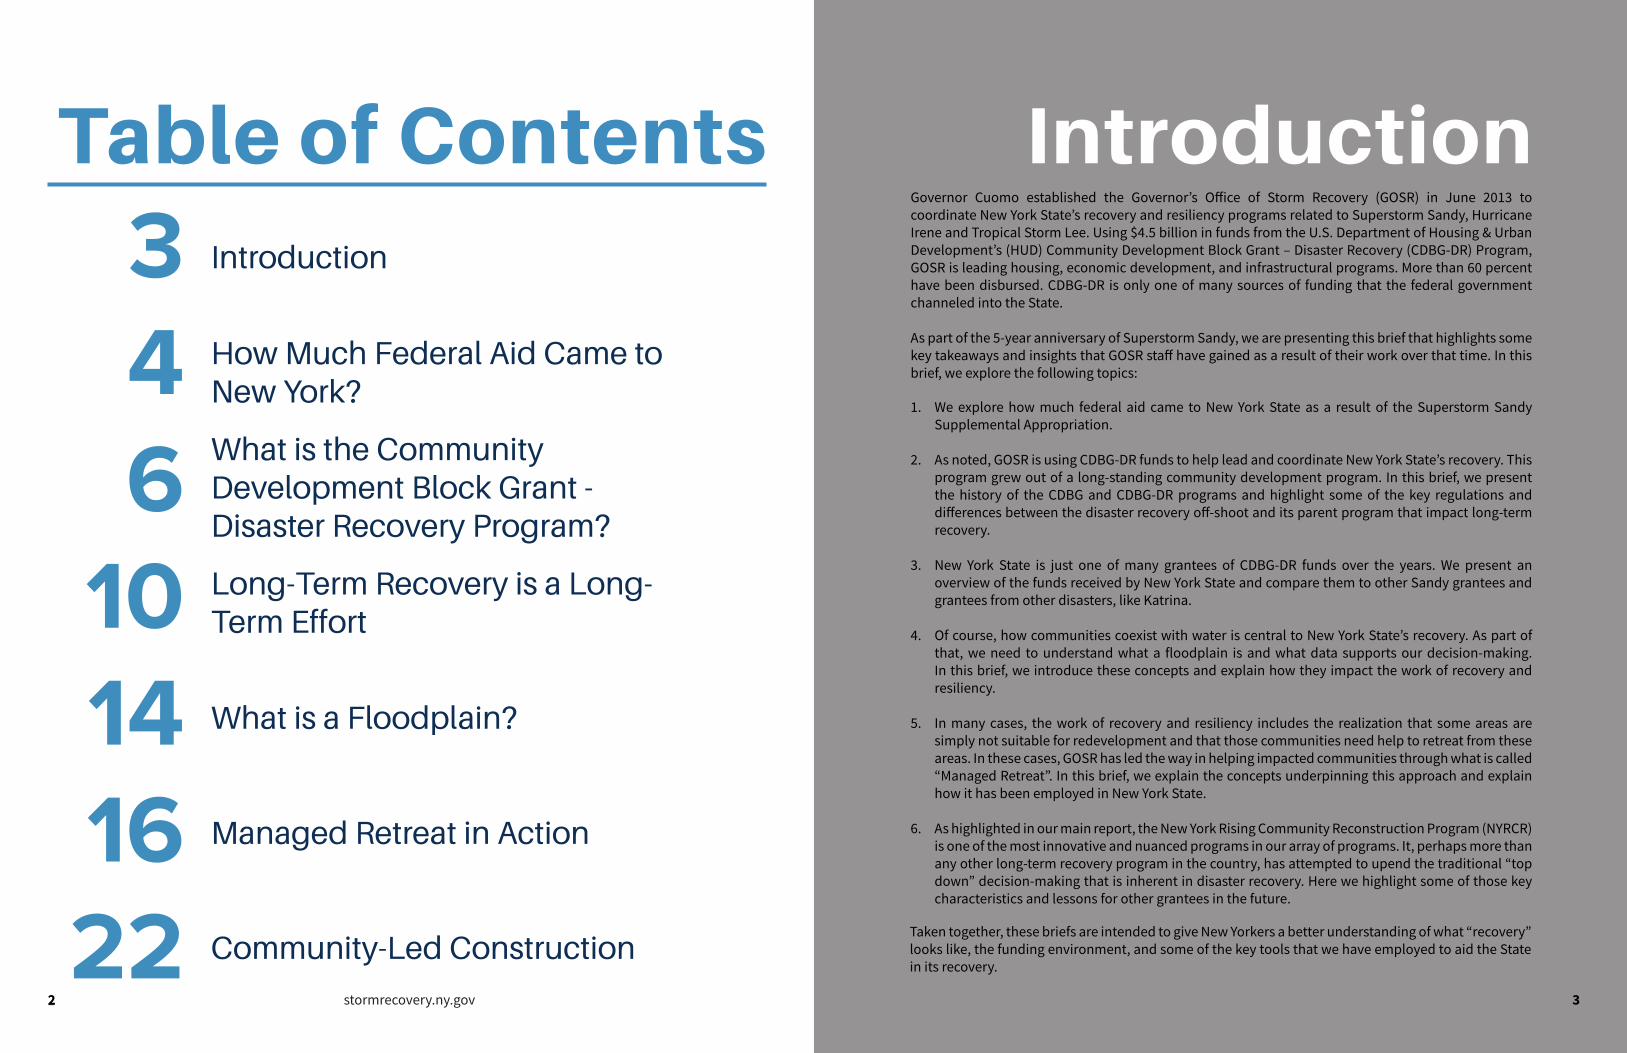
IntroductionGovernor Cuomo established the Governor’s Office of Storm Recovery (GOSR) in June 2013 to coordinate New York State’s recovery and resiliency programs related to Superstorm Sandy, Hurricane Irene and Tropical Storm Lee. Using $4.5 billion in funds from the U.S. Department of Housing & Urban Development’s (HUD) Community Development Block Grant – Disaster Recovery (CDBG-DR) Program, GOSR is leading housing, economic development, and infrastructural programs. More than 60 percent have been disbursed. CDBG-DR is only one of many sources of funding that the federal government channeled into the State.
As part of the 5-year anniversary of Superstorm Sandy, we are presenting this brief that highlights some key takeaways and insights that GOSR staff have gained as a result of their work over that time. In this brief, we explore the following topics:
1. We explore how much federal aid came to New York State as a result of the Superstorm Sandy Supplemental Appropriation.
2. As noted, GOSR is using CDBG-DR funds to help lead and coordinate New York State’s recovery. This program grew out of a long-standing community development program. In this brief, we present the history of the CDBG and CDBG-DR programs and highlight some of the key regulations and differences between the disaster recovery off-shoot and its parent program that impact long-term recovery.
3. New York State is just one of many grantees of CDBG-DR funds over the years. We present an overview of the funds received by New York State and compare them to other Sandy grantees and grantees from other disasters, like Katrina.
4. Of course, how communities coexist with water is central to New York State’s recovery. As part of that, we need to understand what a floodplain is and what data supports our decision-making. In this brief, we introduce these concepts and explain how they impact the work of recovery and resiliency.
5. In many cases, the work of recovery and resiliency includes the realization that some areas are simply not suitable for redevelopment and that those communities need help to retreat from these areas. In these cases, GOSR has led the way in helping impacted communities through what is called “Managed Retreat”. In this brief, we explain the concepts underpinning this approach and explain how it has been employed in New York State.
6. As highlighted in our main report, the New York Rising Community Reconstruction Program (NYRCR) is one of the most innovative and nuanced programs in our array of programs. It, perhaps more than any other long-term recovery program in the country, has attempted to upend the traditional “top down” decision-making that is inherent in disaster recovery. Here we highlight some of those key characteristics and lessons for other grantees in the future.
Taken together, these briefs are intended to give New Yorkers a better understanding of what “recovery” looks like, the funding environment, and some of the key tools that we have employed to aid the State in its recovery.
32
stormrecovery.ny.gov4 stormrecovery.ny.gov 5
Understanding How Much Federal Aid Came to New York State
As noted, the funding that GOSR received from HUD is only a small proportion of the total funds that were directed into the State through an alphabet soup of federal agencies in the aftermath of Superstorm Sandy. The rationale for this brief is to account for as much of those dollars as possible so that we can understand the full picture of recovery and resiliency efforts.
On January 29, 2013, the U.S. Congress enacted Public Law 113-2 (P.L. 113-2), guaranteeing a supplemental appropriation of more than $50 billion for disaster recovery efforts. This “Sandy Supplemental” appropriation was intended to support federal agencies in directing funds to help impacted communities devastated by Superstorm Sandy. Of course, Sandy was not the only federally declared disaster to hit the United States so some funds were also included for states impacted by other disasters in between approval of the Continuing Appropriations Resolution (P.L. 112-175) on September 28, 2012 and January 29, 2013. The Sandy Supplemental appropriated $50.5 billion for 19 Federal agencies, as well as the Offices of the Inspectors General (OIGs) at three of the 19 agencies. Due to sequestration, the supplemental appropriation was subsequently reduced to $47.9 billion. In total, funds were allocated to 41 of the 50 states, the District of Columbia, and the Commonwealth of Puerto Rico. New York State was – by far - the largest recipient, receiving, by our estimates, more than $28 billion of the allocation; approximately 60 percent of the funds allocated under P.L. 113-2. Through this research effort, we have accounted for over 95 percent of the P.L. 113-2 funds allocated to the various Federal agencies and geographies.
Introduction
Damage estimates nationwide from Superstorm Sandy exceeded $65 billion per a December 2014 report published by the U.S. Government Accountability Office. In response to the second most costly natural disaster in U.S. history to that point in time, the Office of Management and Budget (OMB) drafted a letter to then Senate Majority Leader Harry Reid on December 7, 2012 requesting a supplemental appropriation of more than $60 billion for Fiscal Year 2013 (Executive Office of The President: Office of Management and Budget, 2012). By the end of December 2012, the U.S. Senate had approved the $60 billion aid package, with $50.5 billion in aid and $9.7 billion for the National Flood Insurance Program, but the 112th Congress adjourned before the U.S. House of Representative could approve (Congressional Research Service, 2013).
The 113th Congress convened shortly thereafter and enacted a $9.7 billion temporary increase in the borrowing authority for the National Flood Insurance Program through Public Law 113-1 on January 6, 2013 by a vote of 354-67 in the U.S. House of Representations and by a voice vote in the U.S Senate (113th U.S. Congress, 2013). The U.S. House of Representatives approved the $50.5 billion aid package in mid-January 2013 by a vote of 241-180 and returned it to the U.S. Senate for approval (Congressional Research Service, 2013). On January 28, the Senate approved the $50 billion request by a vote of 62-36 and signed it as the Disaster Relief Appropriations Act (DRAA) of 2013 the next day (113th U.S. Congress, 2013). However, the supplemental appropriation was subsequently reduced by 5 percent due to the Budget Control Act of 2011, also known as Public Law 112-25 (112th U.S. Congress, 2011), yielding a total disaster relief appropriation after sequestration of $47.9 billion (Sandy Program Management Office, 2013)
History of the Appropriation
LSC
SI
SSA
GSA
NASA
OIG
DOJ
DOL
DOD
USDA
VA
DOC
EPA
HHS
SBA
DOI
USACE
DHS
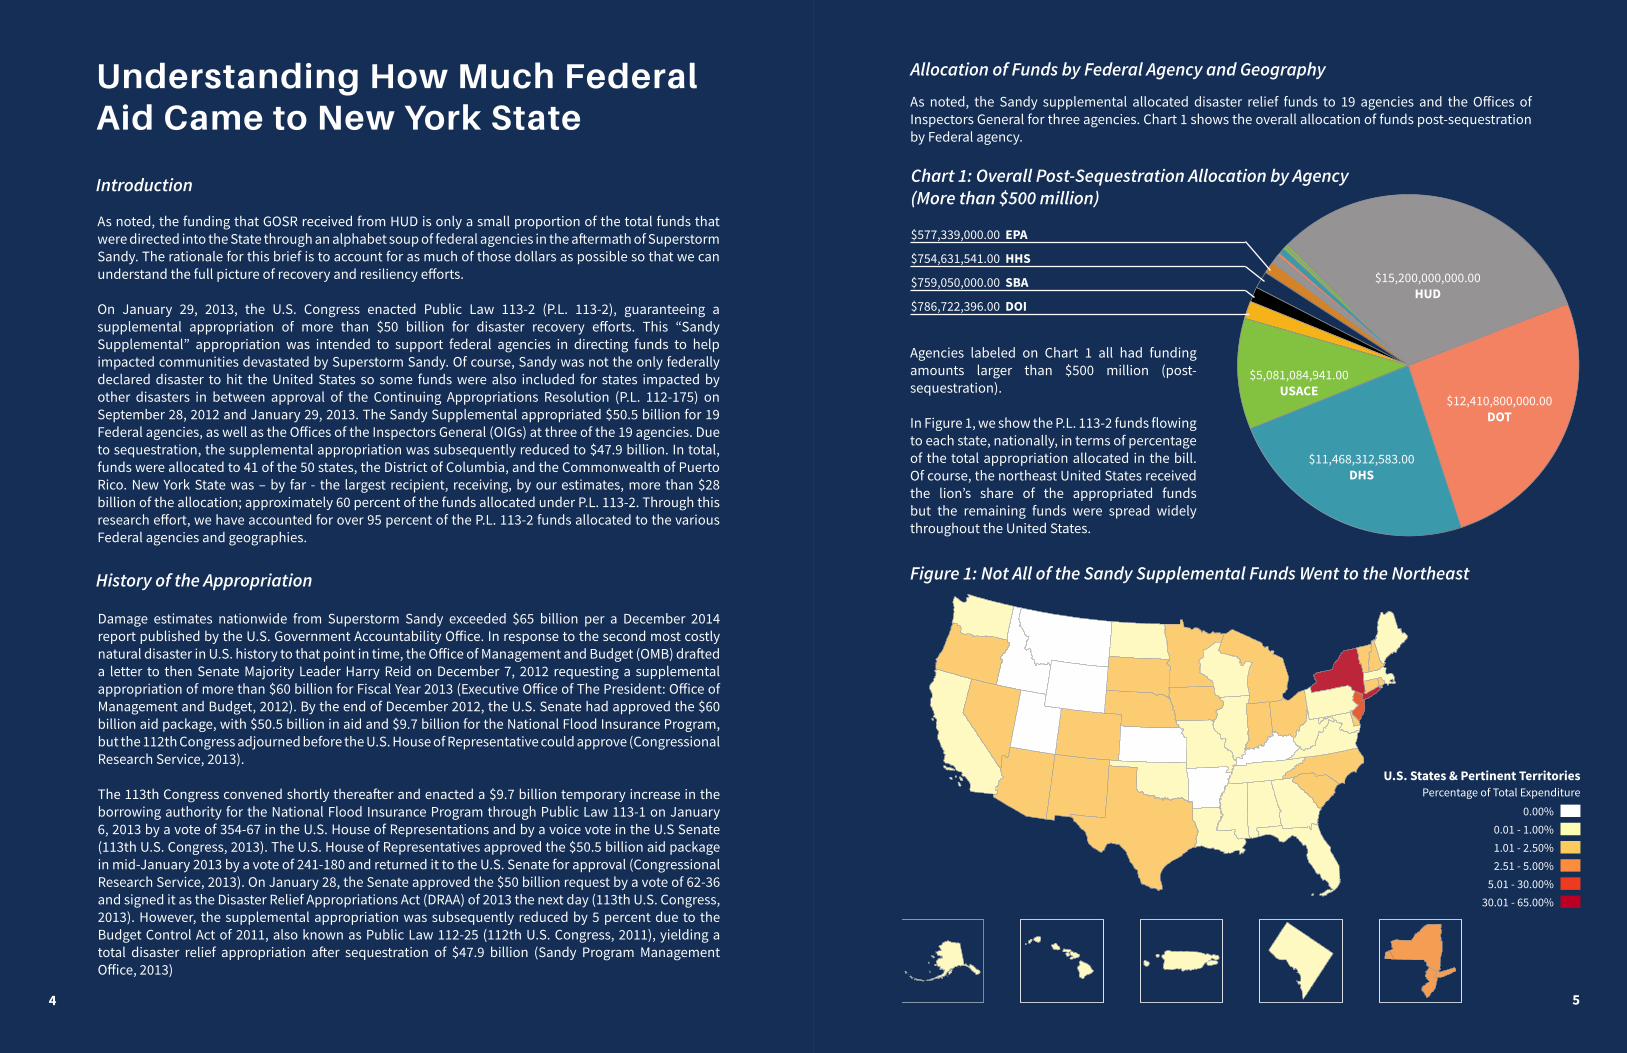
$15,200,000,000.00HUD
$12,410,800,000.00DOT
$11,468,312,583.00DHS
$5,081,084,941.00USACE
$786,722,396.00 DOI
$759,050,000.00 SBA
$754,631,541.00 HHS
$577,339,000.00 EPA
Allocation of Funds by Federal Agency and Geography
As noted, the Sandy supplemental allocated disaster relief funds to 19 agencies and the Offices of Inspectors General for three agencies. Chart 1 shows the overall allocation of funds post-sequestration by Federal agency.
Chart 1: Overall Post-Sequestration Allocation by Agency (More than $500 million)
Agencies labeled on Chart 1 all had funding amounts larger than $500 million (post-sequestration).
In Figure 1, we show the P.L. 113-2 funds flowing to each state, nationally, in terms of percentage of the total appropriation allocated in the bill. Of course, the northeast United States received the lion’s share of the appropriated funds but the remaining funds were spread widely throughout the United States.
Figure 1: Not All of the Sandy Supplemental Funds Went to the Northeast
0.00%0.01 - 1.00%1.01 - 2.50%2.51 - 5.00%
5.01 - 30.00%30.01 - 65.00%
U.S. States & Pertinent TerritoriesPercentage of Total Expenditure
4 5
stormrecovery.ny.gov6 stormrecovery.ny.gov 7
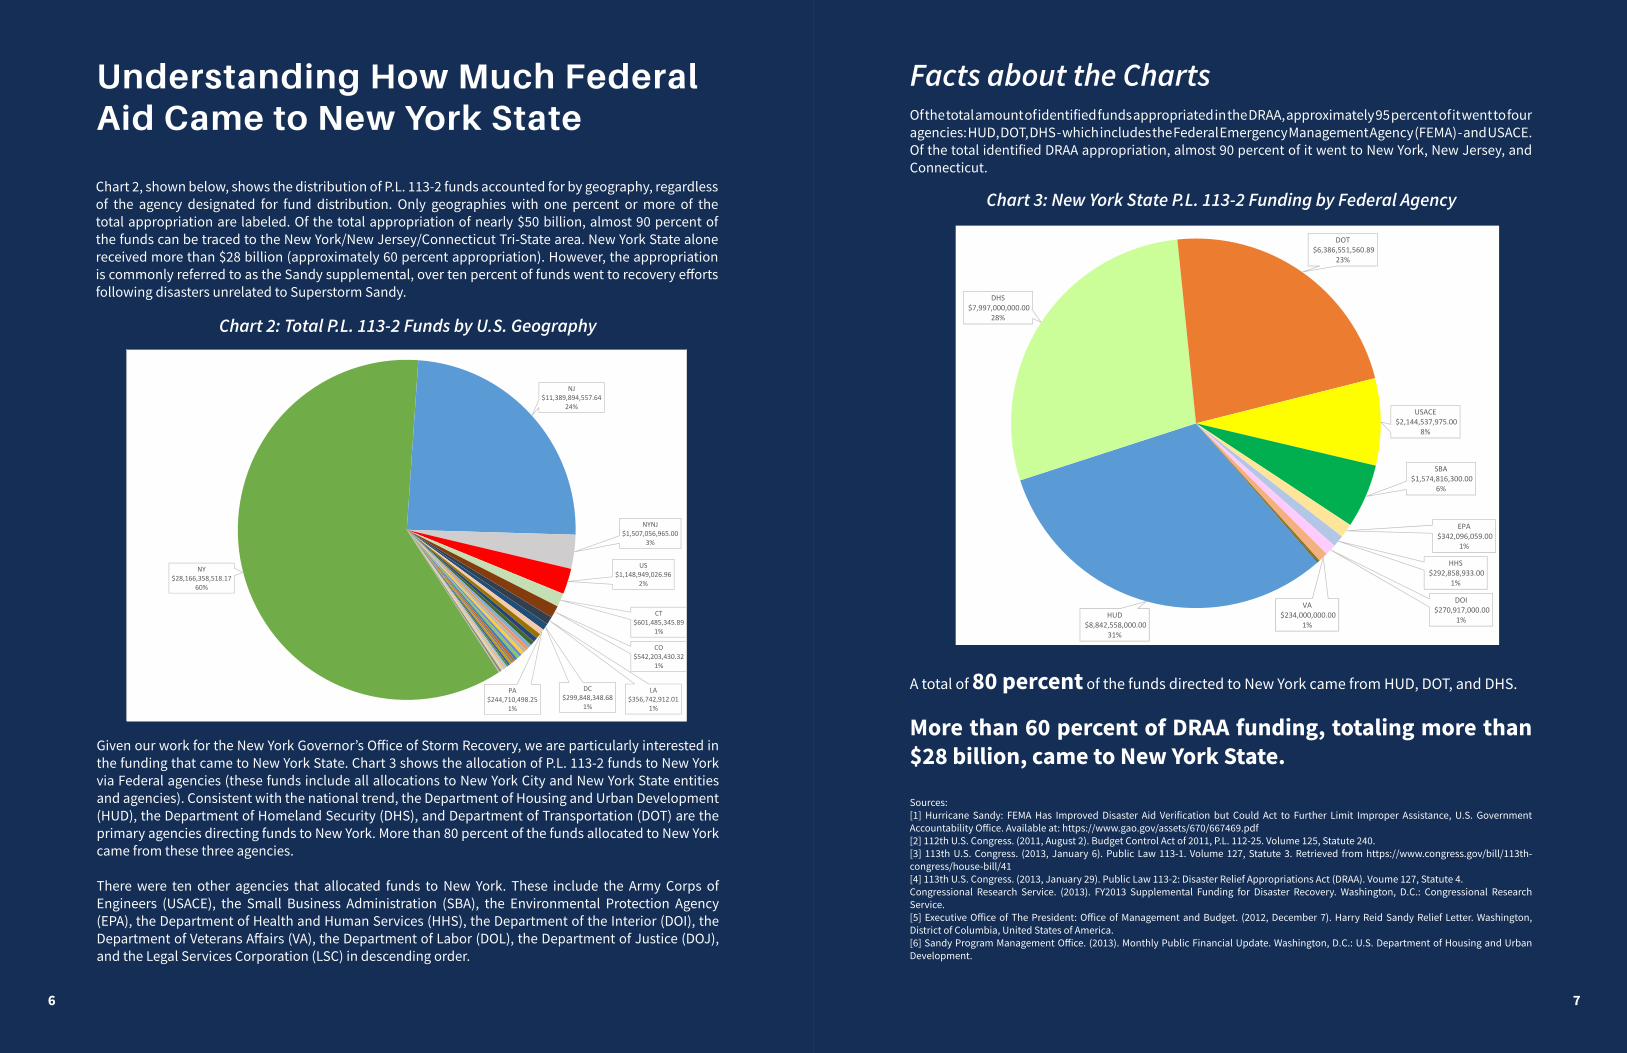
Chart 2, shown below, shows the distribution of P.L. 113-2 funds accounted for by geography, regardless of the agency designated for fund distribution. Only geographies with one percent or more of the total appropriation are labeled. Of the total appropriation of nearly $50 billion, almost 90 percent of the funds can be traced to the New York/New Jersey/Connecticut Tri-State area. New York State alone received more than $28 billion (approximately 60 percent appropriation). However, the appropriation is commonly referred to as the Sandy supplemental, over ten percent of funds went to recovery efforts following disasters unrelated to Superstorm Sandy.
Given our work for the New York Governor’s Office of Storm Recovery, we are particularly interested in the funding that came to New York State. Chart 3 shows the allocation of P.L. 113-2 funds to New York via Federal agencies (these funds include all allocations to New York City and New York State entities and agencies). Consistent with the national trend, the Department of Housing and Urban Development (HUD), the Department of Homeland Security (DHS), and Department of Transportation (DOT) are the primary agencies directing funds to New York. More than 80 percent of the funds allocated to New York came from these three agencies.
There were ten other agencies that allocated funds to New York. These include the Army Corps of Engineers (USACE), the Small Business Administration (SBA), the Environmental Protection Agency (EPA), the Department of Health and Human Services (HHS), the Department of the Interior (DOI), the Department of Veterans Affairs (VA), the Department of Labor (DOL), the Department of Justice (DOJ), and the Legal Services Corporation (LSC) in descending order.
A total of 80 percent of the funds directed to New York came from HUD, DOT, and DHS.
More than 60 percent of DRAA funding, totaling more than $28 billion, came to New York State.
Of the total amount of identified funds appropriated in the DRAA, approximately 95 percent of it went to four agencies: HUD, DOT, DHS - which includes the Federal Emergency Management Agency (FEMA) - and USACE. Of the total identified DRAA appropriation, almost 90 percent of it went to New York, New Jersey, and Connecticut.
Facts about the Charts
Chart 3: New York State P.L. 113-2 Funding by Federal Agency
Chart 2: Total P.L. 113-2 Funds by U.S. Geography
6 7
Sources:[1] Hurricane Sandy: FEMA Has Improved Disaster Aid Verification but Could Act to Further Limit Improper Assistance, U.S. Government Accountability Office. Available at: https://www.gao.gov/assets/670/667469.pdf[2] 112th U.S. Congress. (2011, August 2). Budget Control Act of 2011, P.L. 112-25. Volume 125, Statute 240.[3] 113th U.S. Congress. (2013, January 6). Public Law 113-1. Volume 127, Statute 3. Retrieved from https://www.congress.gov/bill/113th-congress/house-bill/41[4] 113th U.S. Congress. (2013, January 29). Public Law 113-2: Disaster Relief Appropriations Act (DRAA). Voume 127, Statute 4.Congressional Research Service. (2013). FY2013 Supplemental Funding for Disaster Recovery. Washington, D.C.: Congressional Research Service.[5] Executive Office of The President: Office of Management and Budget. (2012, December 7). Harry Reid Sandy Relief Letter. Washington, District of Columbia, United States of America.[6] Sandy Program Management Office. (2013). Monthly Public Financial Update. Washington, D.C.: U.S. Department of Housing and Urban Development.
Understanding How Much Federal Aid Came to New York State
NY$28,166,358,518.17
60%
NJ$11,389,894,557.64
24%
NYNJ$1,507,056,965.00
3%
US$1,148,949,026.96
2%
CT$601,485,345.89
1%
CO$542,203,430.32
1%
LA$356,742,912.01
1%
DC$299,848,348.68
1%
PA$244,710,498.25
1%
HUD$8,842,558,000.00
31%
DHS$7,997,000,000.00
28%
DOT$6,386,551,560.89
23%
USACE$2,144,537,975.00
8%
SBA$1,574,816,300.00
6%
EPA$342,096,059.00
1%
HHS$292,858,933.00
1%
DOI$270,917,000.00
1%
VA$234,000,000.00
1%
stormrecovery.ny.gov8 stormrecovery.ny.gov 9
What is the Community Development Block Grant - Disaster Recovery (CDBG-DR) Program?
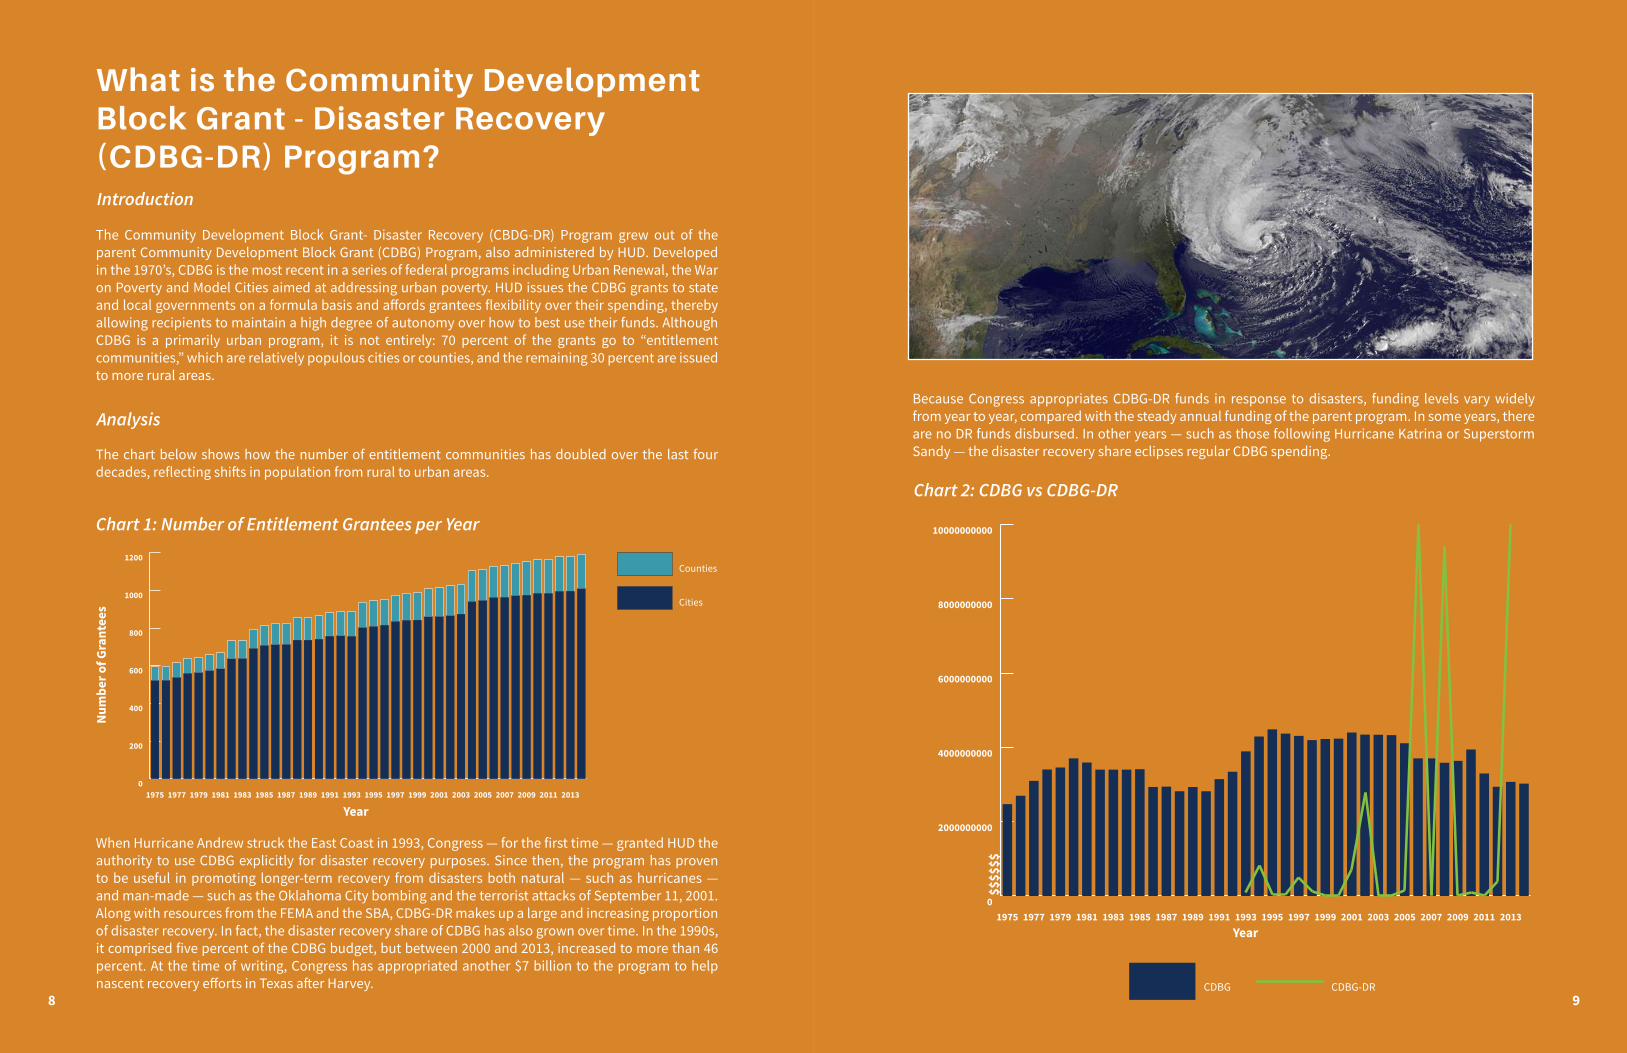
The Community Development Block Grant- Disaster Recovery (CBDG-DR) Program grew out of the parent Community Development Block Grant (CDBG) Program, also administered by HUD. Developed in the 1970’s, CDBG is the most recent in a series of federal programs including Urban Renewal, the War on Poverty and Model Cities aimed at addressing urban poverty. HUD issues the CDBG grants to state and local governments on a formula basis and affords grantees flexibility over their spending, thereby allowing recipients to maintain a high degree of autonomy over how to best use their funds. Although CDBG is a primarily urban program, it is not entirely: 70 percent of the grants go to “entitlement communities,” which are relatively populous cities or counties, and the remaining 30 percent are issued to more rural areas.
Introduction
When Hurricane Andrew struck the East Coast in 1993, Congress — for the first time — granted HUD the authority to use CDBG explicitly for disaster recovery purposes. Since then, the program has proven to be useful in promoting longer-term recovery from disasters both natural — such as hurricanes — and man-made — such as the Oklahoma City bombing and the terrorist attacks of September 11, 2001. Along with resources from the FEMA and the SBA, CDBG-DR makes up a large and increasing proportion of disaster recovery. In fact, the disaster recovery share of CDBG has also grown over time. In the 1990s, it comprised five percent of the CDBG budget, but between 2000 and 2013, increased to more than 46 percent. At the time of writing, Congress has appropriated another $7 billion to the program to help nascent recovery efforts in Texas after Harvey.
Because Congress appropriates CDBG-DR funds in response to disasters, funding levels vary widely from year to year, compared with the steady annual funding of the parent program. In some years, there are no DR funds disbursed. In other years — such as those following Hurricane Katrina or Superstorm Sandy — the disaster recovery share eclipses regular CDBG spending.
0
200
400
600
800
1000
1200Counties
Cities
20132011200920072005200320011999199719951993199119891987198519831981197919771975
Chart 1: Number of Entitlement Grantees per Year
Year
Num
ber o
f Gra
ntee
s
0
2000000000
4000000000
6000000000
8000000000
10000000000
CDBG CDBG-DR
20132011200920072005200320011999199719951993199119891987198519831981197919771975
Chart 2: CDBG vs CDBG-DR
$$$$
$$
Year
98
The chart below shows how the number of entitlement communities has doubled over the last four decades, reflecting shifts in population from rural to urban areas.
Analysis
stormrecovery.ny.gov10 stormrecovery.ny.gov 11
Long-Term Recovery is a Long Term Effort
There is an inherent tension between getting aid to impacted individuals and communities quickly and ensuring that programs are designed to maximize recovery and resiliency. The disbursement of DR funds takes years of planning and administration, but this can only begin once the dollars are in hand.
Introduction
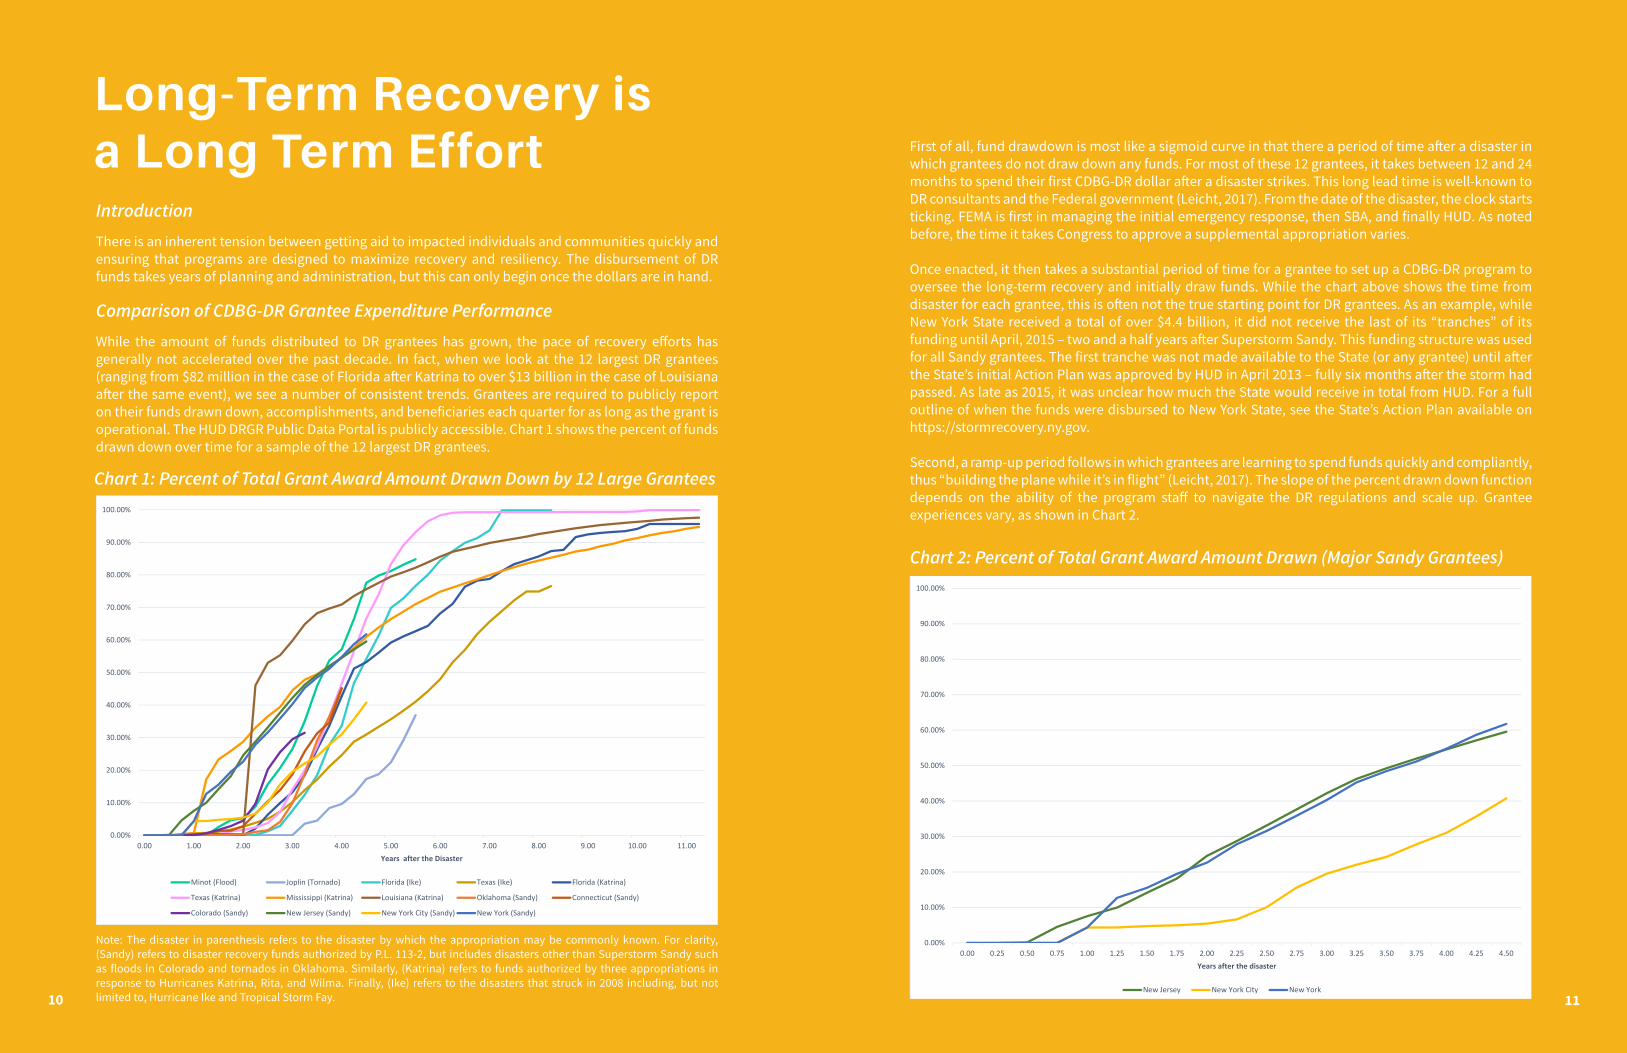
Note: The disaster in parenthesis refers to the disaster by which the appropriation may be commonly known. For clarity, (Sandy) refers to disaster recovery funds authorized by P.L. 113-2, but includes disasters other than Superstorm Sandy such as floods in Colorado and tornados in Oklahoma. Similarly, (Katrina) refers to funds authorized by three appropriations in response to Hurricanes Katrina, Rita, and Wilma. Finally, (Ike) refers to the disasters that struck in 2008 including, but not limited to, Hurricane Ike and Tropical Storm Fay.
While the amount of funds distributed to DR grantees has grown, the pace of recovery efforts has generally not accelerated over the past decade. In fact, when we look at the 12 largest DR grantees (ranging from $82 million in the case of Florida after Katrina to over $13 billion in the case of Louisiana after the same event), we see a number of consistent trends. Grantees are required to publicly report on their funds drawn down, accomplishments, and beneficiaries each quarter for as long as the grant is operational. The HUD DRGR Public Data Portal is publicly accessible. Chart 1 shows the percent of funds drawn down over time for a sample of the 12 largest DR grantees.
Comparison of CDBG-DR Grantee Expenditure Performance
10 11
First of all, fund drawdown is most like a sigmoid curve in that there a period of time after a disaster in which grantees do not draw down any funds. For most of these 12 grantees, it takes between 12 and 24 months to spend their first CDBG-DR dollar after a disaster strikes. This long lead time is well-known to DR consultants and the Federal government (Leicht, 2017). From the date of the disaster, the clock starts ticking. FEMA is first in managing the initial emergency response, then SBA, and finally HUD. As noted before, the time it takes Congress to approve a supplemental appropriation varies.
Once enacted, it then takes a substantial period of time for a grantee to set up a CDBG-DR program to oversee the long-term recovery and initially draw funds. While the chart above shows the time from disaster for each grantee, this is often not the true starting point for DR grantees. As an example, while New York State received a total of over $4.4 billion, it did not receive the last of its “tranches” of its funding until April, 2015 – two and a half years after Superstorm Sandy. This funding structure was used for all Sandy grantees. The first tranche was not made available to the State (or any grantee) until after the State’s initial Action Plan was approved by HUD in April 2013 – fully six months after the storm had passed. As late as 2015, it was unclear how much the State would receive in total from HUD. For a full outline of when the funds were disbursed to New York State, see the State’s Action Plan available on https://stormrecovery.ny.gov.
Second, a ramp-up period follows in which grantees are learning to spend funds quickly and compliantly, thus “building the plane while it’s in flight” (Leicht, 2017). The slope of the percent drawn down function depends on the ability of the program staff to navigate the DR regulations and scale up. Grantee experiences vary, as shown in Chart 2.
Chart 1: Percent of Total Grant Award Amount Drawn Down by 12 Large Grantees
Chart 2: Percent of Total Grant Award Amount Drawn (Major Sandy Grantees)
0.00%
10.00%
20.00%
30.00%
40.00%
50.00%
60.00%
70.00%
80.00%
90.00%
100.00%
0.00 0.25 0.50 0.75 1.00 1.25 1.50 1.75 2.00 2.25 2.50 2.75 3.00 3.25 3.50 3.75 4.00 4.25 4.50Years after the disaster
Percent of Total Grant Award Amount Drawn Down
New Jersey New York City New York
0.00%
10.00%
20.00%
30.00%
40.00%
50.00%
60.00%
70.00%
80.00%
90.00%
100.00%
0.00 1.00 2.00 3.00 4.00 5.00 6.00 7.00 8.00 9.00 10.00 11.00Years after the Disaster
Percent of Total Grant Award Amount Drawn Down
Minot (Flood) Joplin (Tornado) Florida (Ike) Texas (Ike) Florida (Katrina)
Texas (Katrina) Mississippi (Katrina) Louisiana (Katrina) Oklahoma (Sandy) Connecticut (Sandy)
Colorado (Sandy) New Jersey (Sandy) New York City (Sandy) New York (Sandy)
stormrecovery.ny.gov12 stormrecovery.ny.gov 13
Long-Term Recovery is a Long Term Effort
Monitors of federal funds are always interested in the timely distribution of those funds. While CDBG programs have requirements with regard to timely obligation of funds, PL 113-2 explicitly set a two-year time limit on the expenditure of obligated CDBG-DR funds. This requirement recognizes the importance of the swift disbursement of recovery funds in the wake of a disaster; however, long-term disaster recovery often involves large-scale projects that take may many years to plan, implement, and complete.
To accommodate the financing of longer-term projects, DR funds can be obligated over time in “rounds,” but this accounting practice adds a layer of complexity in program design and administration, and can impede transparency in monitoring progress and the efficient use of funds. In addition, it may incentivize grantees to steer away from larger projects with longer time horizons for fear of jeopardizing precious recovery funds.
Timely Distribution of Funds
12 13
Sources:[1] Leicht, H. M. (2017). Rebuild the Plane Now: Recommendations for Improving Government’s Approach to Disaster Recovery and Preparedness. New York: Community Preservation Corporation.[2] HUD DRGR Public Portal accessible via https://drgr.hud.gov/public/index.html.
The three largest DR grantees recovering from Superstorm Sandy – New York, New York City, and New Jersey – all drew down funds within one year of the disaster. However, the ramp-up period shows a different story for these grantees. Whereas New York and New Jersey were able to expend funds at a nearly constant pace following initial expenditure, New York City diverged after its first quarter of spending. Drawdowns for the New York City almost came to a halt between the 12 and 24 month marks after the disaster.
After the 2-year mark, expenditures by New York City resumed and follow a trajectory similar to those of New York and New Jersey. While Chart 2 effectively visualizes the relatively slow pace of recovery in New York City compared to its peers, the chart fails to provide context. Chart 5 shows that New York City’s experience is actually not so different from that of Florida or Texas in their recoveries from Hurricane Ike and perhaps even within a normal range for a DR grantee at the 4-year mark.
The third trend that is clearly visible in Chart 2 is that recovery expenditures have a long tail. The long tail reinforces the fact that a DR recovery is a long-term effort. For instance, although it has been 12 years since Hurricane Katrina struck the Gulf Coast, the DR-funded recovery efforts of Louisiana, Mississippi, and Florida continue to this day.
There are many reasons why a recovery might persist for so long, but none of them make the result any easier to bear for victims of disasters. Speaking from the perspective of a Regional Administrator of the Sandy recovery efforts, Leicht argues that Federal, state, and local recovery agencies have an obligation to improve and expedite the recovery, as well as manage the expectations of the public regarding the disaster recovery timeframe (Leicht, 2017).
stormrecovery.ny.gov14 stormrecovery.ny.gov 15
What is a Floodplain?
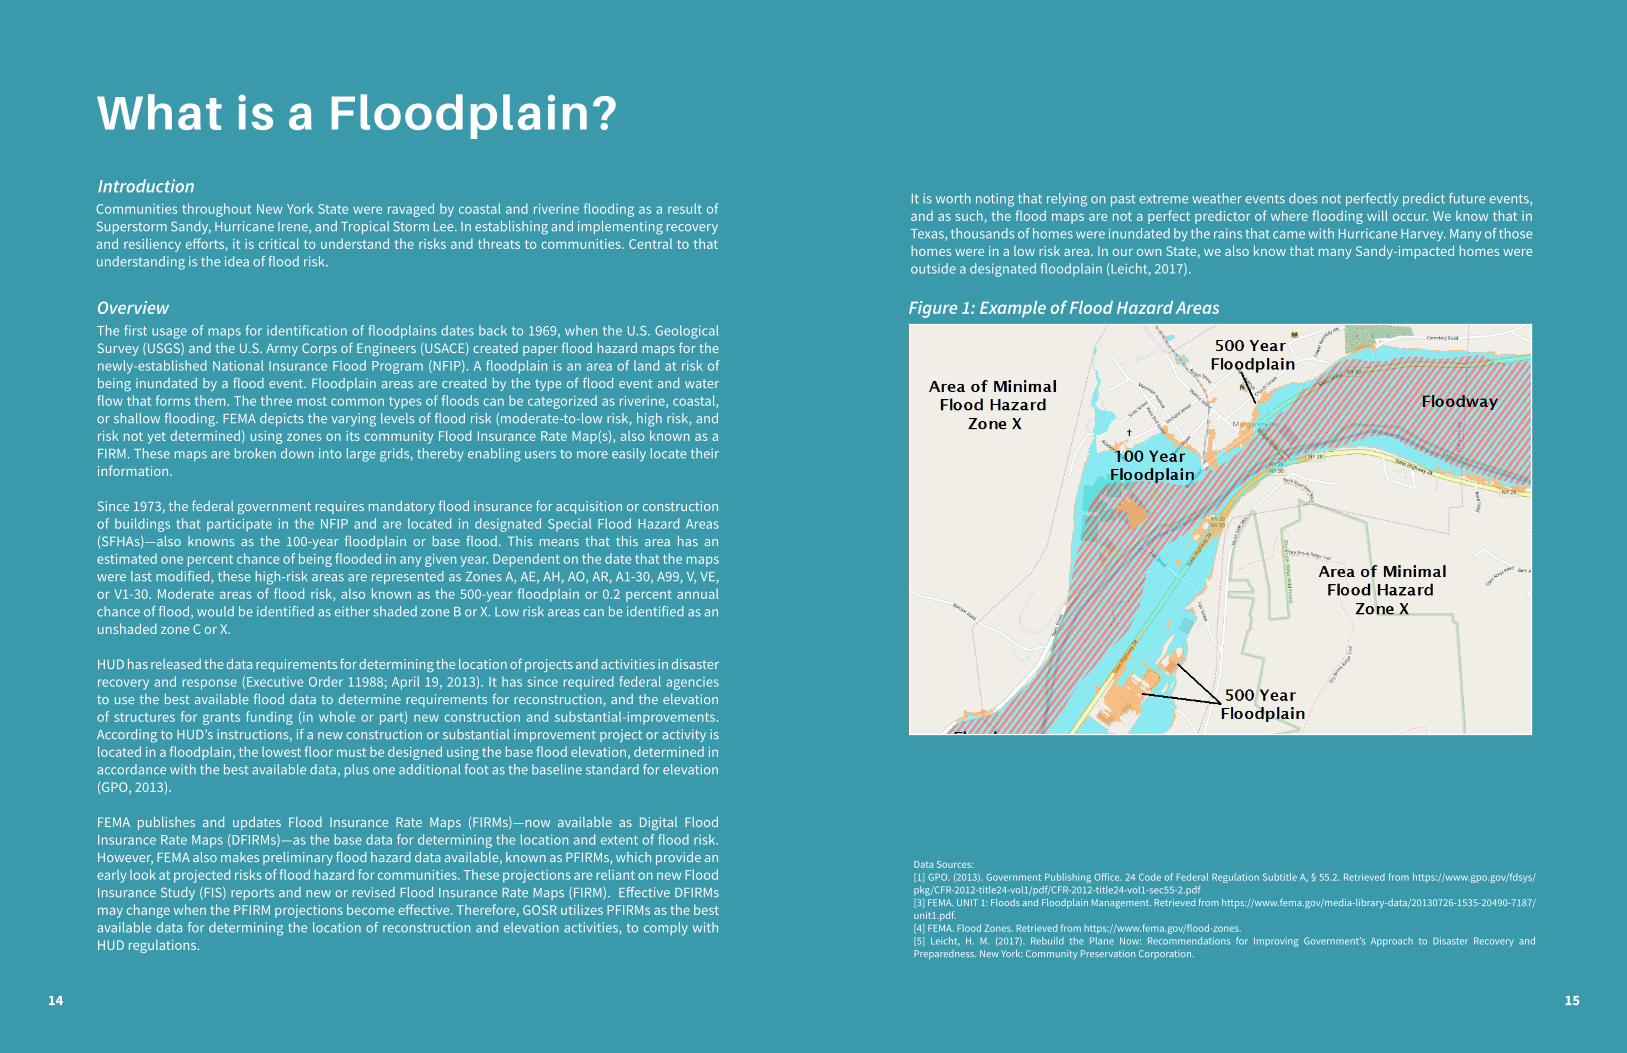
The first usage of maps for identification of floodplains dates back to 1969, when the U.S. Geological Survey (USGS) and the U.S. Army Corps of Engineers (USACE) created paper flood hazard maps for the newly-established National Insurance Flood Program (NFIP). A floodplain is an area of land at risk of being inundated by a flood event. Floodplain areas are created by the type of flood event and water flow that forms them. The three most common types of floods can be categorized as riverine, coastal, or shallow flooding. FEMA depicts the varying levels of flood risk (moderate-to-low risk, high risk, and risk not yet determined) using zones on its community Flood Insurance Rate Map(s), also known as a FIRM. These maps are broken down into large grids, thereby enabling users to more easily locate their information.
Since 1973, the federal government requires mandatory flood insurance for acquisition or construction of buildings that participate in the NFIP and are located in designated Special Flood Hazard Areas (SFHAs)—also knowns as the 100-year floodplain or base flood. This means that this area has an estimated one percent chance of being flooded in any given year. Dependent on the date that the maps were last modified, these high-risk areas are represented as Zones A, AE, AH, AO, AR, A1-30, A99, V, VE, or V1-30. Moderate areas of flood risk, also known as the 500-year floodplain or 0.2 percent annual chance of flood, would be identified as either shaded zone B or X. Low risk areas can be identified as an unshaded zone C or X.
HUD has released the data requirements for determining the location of projects and activities in disaster recovery and response (Executive Order 11988; April 19, 2013). It has since required federal agencies to use the best available flood data to determine requirements for reconstruction, and the elevation of structures for grants funding (in whole or part) new construction and substantial-improvements. According to HUD’s instructions, if a new construction or substantial improvement project or activity is located in a floodplain, the lowest floor must be designed using the base flood elevation, determined in accordance with the best available data, plus one additional foot as the baseline standard for elevation (GPO, 2013).
FEMA publishes and updates Flood Insurance Rate Maps (FIRMs)—now available as Digital Flood Insurance Rate Maps (DFIRMs)—as the base data for determining the location and extent of flood risk. However, FEMA also makes preliminary flood hazard data available, known as PFIRMs, which provide an early look at projected risks of flood hazard for communities. These projections are reliant on new Flood Insurance Study (FIS) reports and new or revised Flood Insurance Rate Maps (FIRM). Effective DFIRMs may change when the PFIRM projections become effective. Therefore, GOSR utilizes PFIRMs as the best available data for determining the location of reconstruction and elevation activities, to comply with HUD regulations.
Overview
14 15
IntroductionCommunities throughout New York State were ravaged by coastal and riverine flooding as a result of Superstorm Sandy, Hurricane Irene, and Tropical Storm Lee. In establishing and implementing recovery and resiliency efforts, it is critical to understand the risks and threats to communities. Central to that understanding is the idea of flood risk.
Figure 1: Example of Flood Hazard Areas
It is worth noting that relying on past extreme weather events does not perfectly predict future events, and as such, the flood maps are not a perfect predictor of where flooding will occur. We know that in Texas, thousands of homes were inundated by the rains that came with Hurricane Harvey. Many of those homes were in a low risk area. In our own State, we also know that many Sandy-impacted homes were outside a designated floodplain (Leicht, 2017).
Data Sources:[1] GPO. (2013). Government Publishing Office. 24 Code of Federal Regulation Subtitle A, § 55.2. Retrieved from https://www.gpo.gov/fdsys/pkg/CFR-2012-title24-vol1/pdf/CFR-2012-title24-vol1-sec55-2.pdf[3] FEMA. UNIT 1: Floods and Floodplain Management. Retrieved from https://www.fema.gov/media-library-data/20130726-1535-20490-7187/unit1.pdf.[4] FEMA. Flood Zones. Retrieved from https://www.fema.gov/flood-zones.[5] Leicht, H. M. (2017). Rebuild the Plane Now: Recommendations for Improving Government’s Approach to Disaster Recovery and Preparedness. New York: Community Preservation Corporation.
stormrecovery.ny.gov16 stormrecovery.ny.gov 17
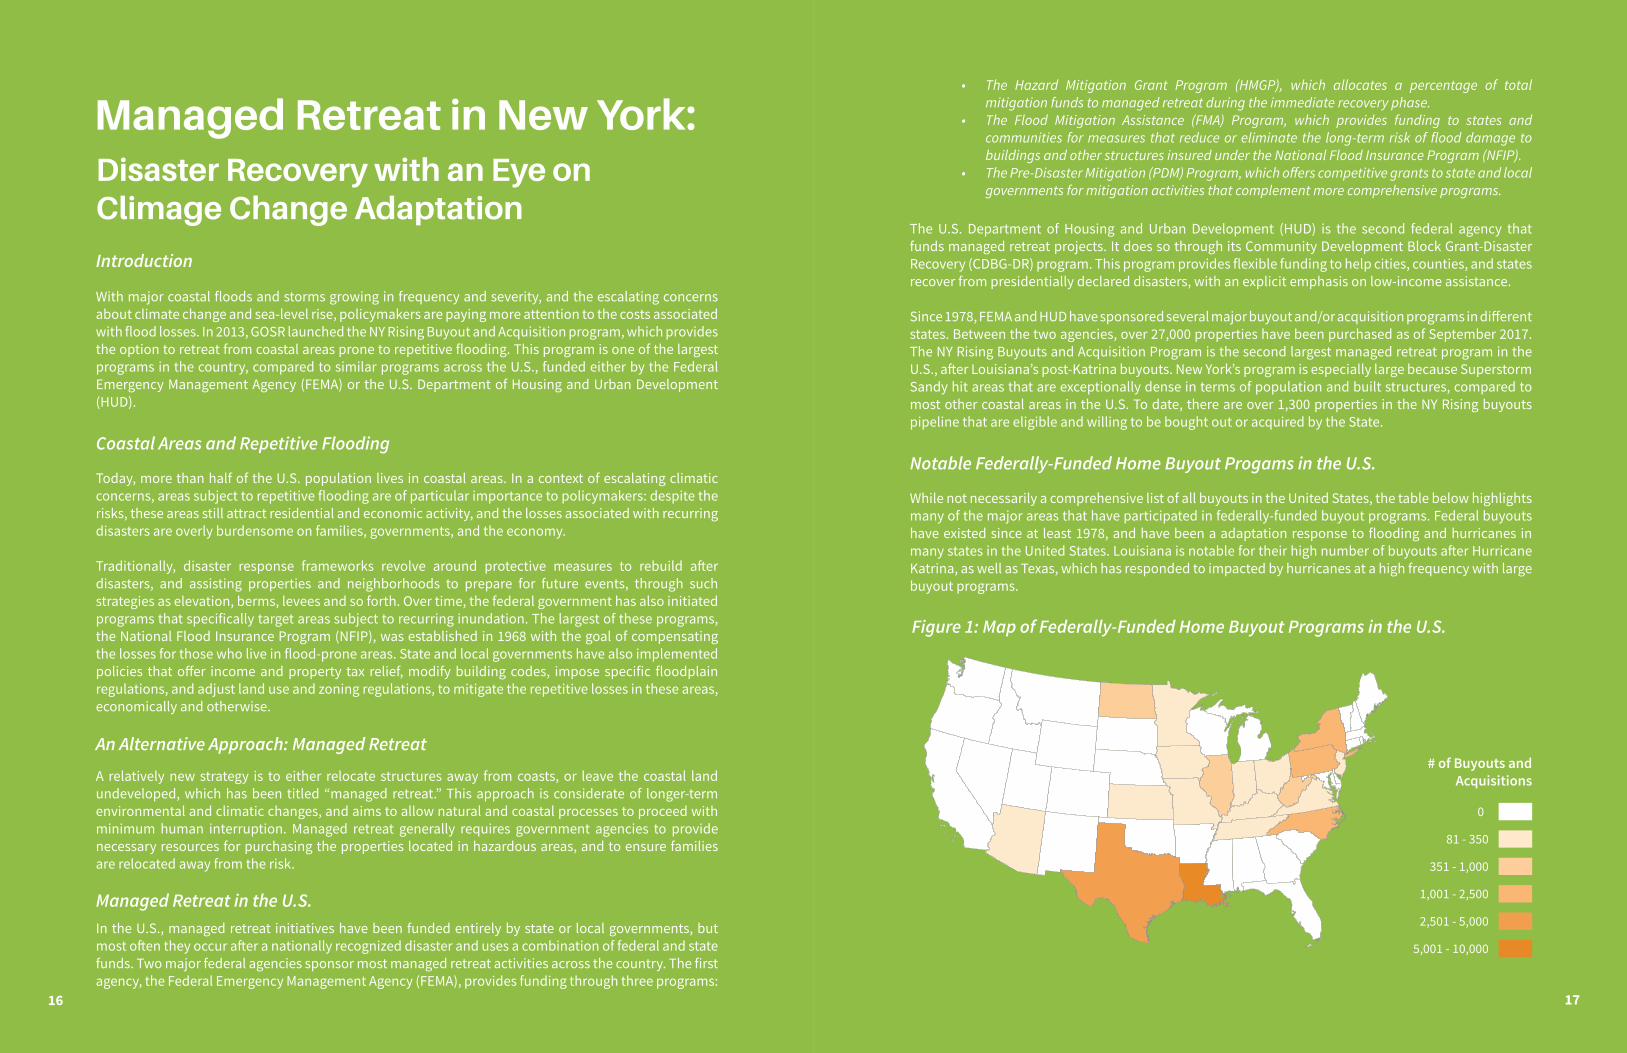
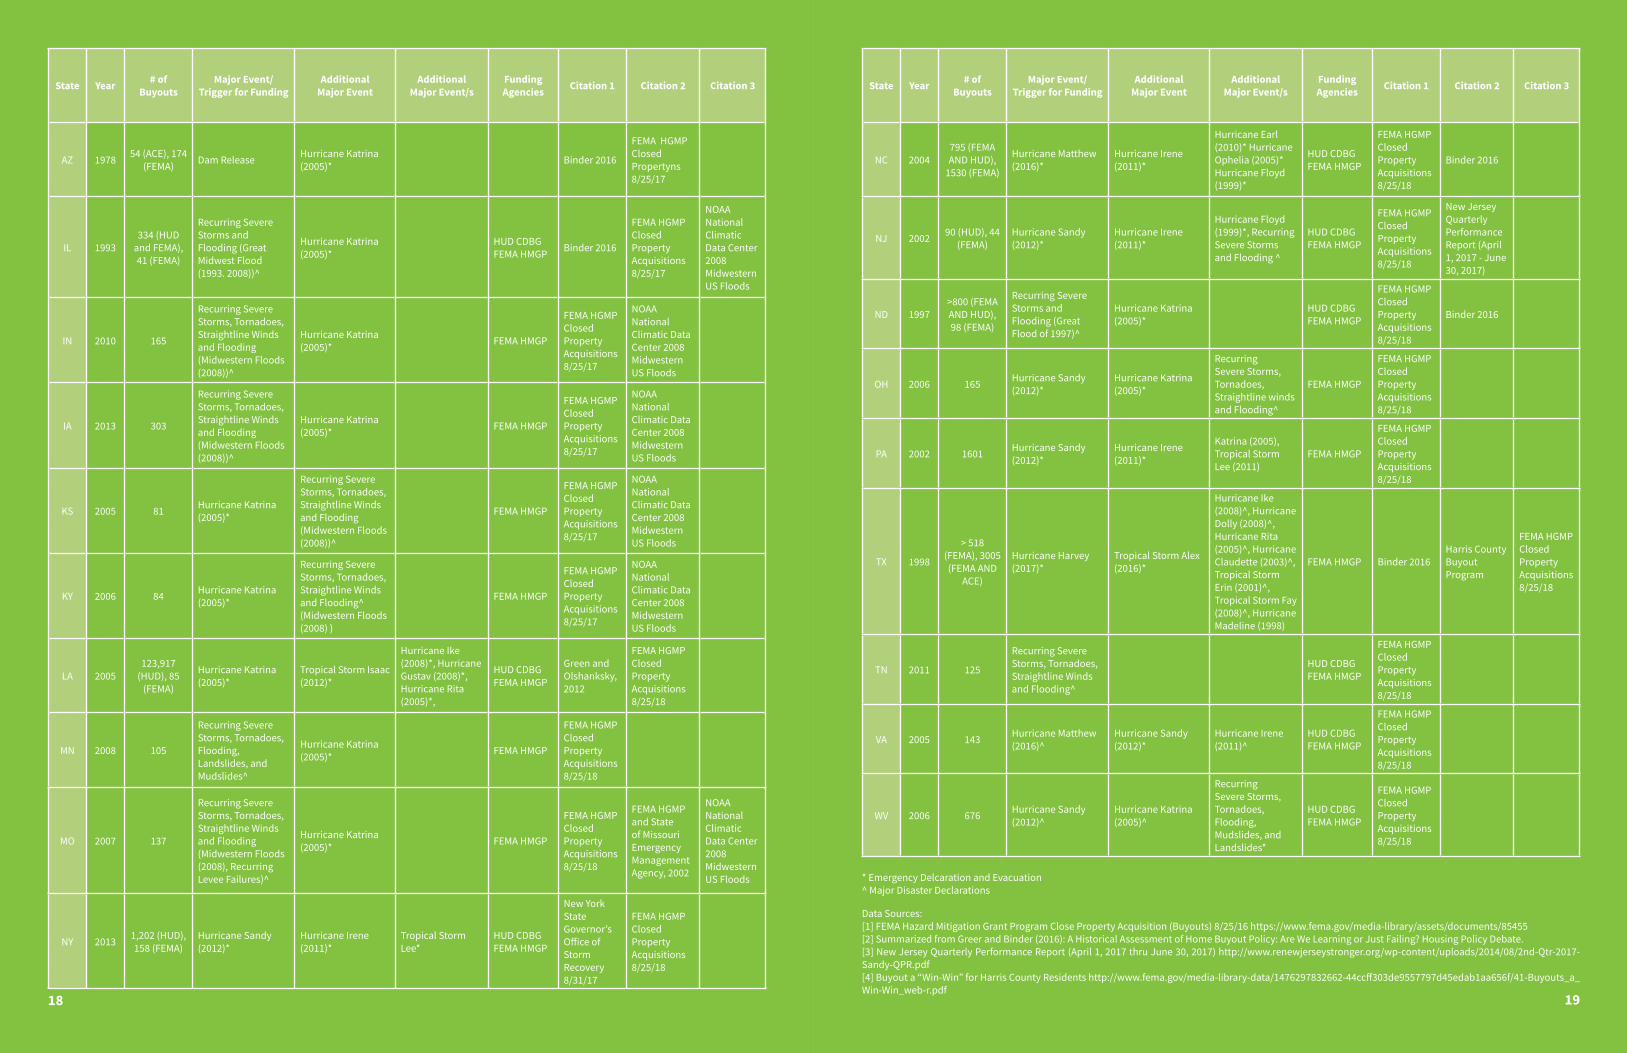
While not necessarily a comprehensive list of all buyouts in the United States, the table below highlights many of the major areas that have participated in federally-funded buyout programs. Federal buyouts have existed since at least 1978, and have been a adaptation response to flooding and hurricanes in many states in the United States. Louisiana is notable for their high number of buyouts after Hurricane Katrina, as well as Texas, which has responded to impacted by hurricanes at a high frequency with large buyout programs.
Notable Federally-Funded Home Buyout Progams in the U.S.
• The Hazard Mitigation Grant Program (HMGP), which allocates a percentage of total mitigation funds to managed retreat during the immediate recovery phase.
• The Flood Mitigation Assistance (FMA) Program, which provides funding to states and communities for measures that reduce or eliminate the long-term risk of flood damage to buildings and other structures insured under the National Flood Insurance Program (NFIP).
• The Pre-Disaster Mitigation (PDM) Program, which offers competitive grants to state and local governments for mitigation activities that complement more comprehensive programs.
The U.S. Department of Housing and Urban Development (HUD) is the second federal agency that funds managed retreat projects. It does so through its Community Development Block Grant-Disaster Recovery (CDBG-DR) program. This program provides flexible funding to help cities, counties, and states recover from presidentially declared disasters, with an explicit emphasis on low-income assistance.
Since 1978, FEMA and HUD have sponsored several major buyout and/or acquisition programs in different states. Between the two agencies, over 27,000 properties have been purchased as of September 2017. The NY Rising Buyouts and Acquisition Program is the second largest managed retreat program in the U.S., after Louisiana’s post-Katrina buyouts. New York’s program is especially large because Superstorm Sandy hit areas that are exceptionally dense in terms of population and built structures, compared to most other coastal areas in the U.S. To date, there are over 1,300 properties in the NY Rising buyouts pipeline that are eligible and willing to be bought out or acquired by the State.
17
Figure 1: Map of Federally-Funded Home Buyout Programs in the U.S.
LegendBuyouts and Acquisitions
81 - 350
351 - 1000
1001 - 2500
2501 - 5000
5001 - 100000 250 500125
Miles
81 - 350
351 - 1,000
1,001 - 2,500
2,501 - 5,000
5,001 - 10,000
0
# of Buyouts and Acquisitions
Managed Retreat in New York:Disaster Recovery with an Eye on Climage Change Adaptation
Today, more than half of the U.S. population lives in coastal areas. In a context of escalating climatic concerns, areas subject to repetitive flooding are of particular importance to policymakers: despite the risks, these areas still attract residential and economic activity, and the losses associated with recurring disasters are overly burdensome on families, governments, and the economy.
Traditionally, disaster response frameworks revolve around protective measures to rebuild after disasters, and assisting properties and neighborhoods to prepare for future events, through such strategies as elevation, berms, levees and so forth. Over time, the federal government has also initiated programs that specifically target areas subject to recurring inundation. The largest of these programs, the National Flood Insurance Program (NFIP), was established in 1968 with the goal of compensating the losses for those who live in flood-prone areas. State and local governments have also implemented policies that offer income and property tax relief, modify building codes, impose specific floodplain regulations, and adjust land use and zoning regulations, to mitigate the repetitive losses in these areas, economically and otherwise.
Coastal Areas and Repetitive Flooding
A relatively new strategy is to either relocate structures away from coasts, or leave the coastal land undeveloped, which has been titled “managed retreat.” This approach is considerate of longer-term environmental and climatic changes, and aims to allow natural and coastal processes to proceed with minimum human interruption. Managed retreat generally requires government agencies to provide necessary resources for purchasing the properties located in hazardous areas, and to ensure families are relocated away from the risk.
An Alternative Approach: Managed Retreat
Managed Retreat in the U.S.In the U.S., managed retreat initiatives have been funded entirely by state or local governments, but most often they occur after a nationally recognized disaster and uses a combination of federal and state funds. Two major federal agencies sponsor most managed retreat activities across the country. The first agency, the Federal Emergency Management Agency (FEMA), provides funding through three programs:
16
With major coastal floods and storms growing in frequency and severity, and the escalating concerns about climate change and sea-level rise, policymakers are paying more attention to the costs associated with flood losses. In 2013, GOSR launched the NY Rising Buyout and Acquisition program, which provides the option to retreat from coastal areas prone to repetitive flooding. This program is one of the largest programs in the country, compared to similar programs across the U.S., funded either by the Federal Emergency Management Agency (FEMA) or the U.S. Department of Housing and Urban Development (HUD).
Introduction
stormrecovery.ny.gov18 stormrecovery.ny.gov 19
State Year # of Buyouts
Major Event/Trigger for Funding
Additional Major Event
Additional Major Event/s
Funding Agencies Citation 1 Citation 2 Citation 3
NC 2004795 (FEMA AND HUD),
1530 (FEMA)
Hurricane Matthew (2016)*
Hurricane Irene (2011)*
Hurricane Earl (2010)* Hurricane Ophelia (2005)* Hurricane Floyd (1999)*
HUD CDBGFEMA HMGP
FEMA HGMP Closed Property Acquisitions 8/25/18
Binder 2016
NJ 2002 90 (HUD), 44 (FEMA)
Hurricane Sandy (2012)*
Hurricane Irene (2011)*
Hurricane Floyd (1999)*, Recurring Severe Storms and Flooding ^
HUD CDBGFEMA HMGP
FEMA HGMP Closed Property Acquisitions 8/25/18
New Jersey Quarterly Performance Report (April 1, 2017 - June 30, 2017)
ND 1997>800 (FEMA AND HUD), 98 (FEMA)
Recurring Severe Storms and Flooding (Great Flood of 1997)^
Hurricane Katrina (2005)*
HUD CDBGFEMA HMGP
FEMA HGMP Closed Property Acquisitions 8/25/18
Binder 2016
OH 2006 165 Hurricane Sandy (2012)*
Hurricane Katrina (2005)*
Recurring Severe Storms, Tornadoes, Straightline winds and Flooding^
FEMA HMGP
FEMA HGMP Closed Property Acquisitions 8/25/18
PA 2002 1601 Hurricane Sandy (2012)*
Hurricane Irene (2011)*
Katrina (2005), Tropical Storm Lee (2011)
FEMA HMGP
FEMA HGMP Closed Property Acquisitions 8/25/18
TX 1998
> 518 (FEMA), 3005 (FEMA AND
ACE)
Hurricane Harvey (2017)*
Tropical Storm Alex (2016)*
Hurricane Ike (2008)^, Hurricane Dolly (2008)^, Hurricane Rita (2005)^, Hurricane Claudette (2003)^, Tropical Storm Erin (2001)^, Tropical Storm Fay (2008)^, Hurricane Madeline (1998)
FEMA HMGP Binder 2016Harris County Buyout Program
FEMA HGMP Closed Property Acquisitions 8/25/18
TN 2011 125
Recurring Severe Storms, Tornadoes, Straightline Winds and Flooding^
HUD CDBGFEMA HMGP
FEMA HGMP Closed Property Acquisitions 8/25/18
VA 2005 143 Hurricane Matthew (2016)^
Hurricane Sandy (2012)*
Hurricane Irene (2011)^
HUD CDBGFEMA HMGP
FEMA HGMP Closed Property Acquisitions 8/25/18
WV 2006 676 Hurricane Sandy (2012)^
Hurricane Katrina (2005)^
Recurring Severe Storms, Tornadoes, Flooding, Mudslides, and Landslides*
HUD CDBG FEMA HMGP
FEMA HGMP Closed Property Acquisitions 8/25/18
19
Data Sources:[1] FEMA Hazard Mitigation Grant Program Close Property Acquisition (Buyouts) 8/25/16 https://www.fema.gov/media-library/assets/documents/85455[2] Summarized from Greer and Binder (2016): A Historical Assessment of Home Buyout Policy: Are We Learning or Just Failing? Housing Policy Debate.[3] New Jersey Quarterly Performance Report (April 1, 2017 thru June 30, 2017) http://www.renewjerseystronger.org/wp-content/uploads/2014/08/2nd-Qtr-2017-Sandy-QPR.pdf[4] Buyout a “Win-Win” for Harris County Residents http://www.fema.gov/media-library-data/1476297832662-44ccff303de9557797d45edab1aa656f/41-Buyouts_a_Win-Win_web-r.pdf
* Emergency Delcaration and Evacuation^ Major Disaster Declarations
State Year # of Buyouts
Major Event/Trigger for Funding
Additional Major Event
Additional Major Event/s
Funding Agencies Citation 1 Citation 2 Citation 3
AZ 1978 54 (ACE), 174 (FEMA) Dam Release Hurricane Katrina
(2005)* Binder 2016
FEMA HGMP Closed Propertyns 8/25/17
IL 1993334 (HUD
and FEMA), 41 (FEMA)
Recurring Severe Storms and Flooding (Great Midwest Flood (1993. 2008))^
Hurricane Katrina (2005)*
HUD CDBGFEMA HMGP Binder 2016
FEMA HGMP Closed Property Acquisitions 8/25/17
NOAA National Climatic Data Center 2008 Midwestern US Floods
IN 2010 165
Recurring Severe Storms, Tornadoes, Straightline Winds and Flooding (Midwestern Floods (2008))^
Hurricane Katrina (2005)* FEMA HMGP
FEMA HGMP Closed Property Acquisitions 8/25/17
NOAA National Climatic Data Center 2008 Midwestern US Floods
IA 2013 303
Recurring Severe Storms, Tornadoes, Straightline Winds and Flooding (Midwestern Floods (2008))^
Hurricane Katrina (2005)* FEMA HMGP
FEMA HGMP Closed Property Acquisitions 8/25/17
NOAA National Climatic Data Center 2008 Midwestern US Floods
KS 2005 81 Hurricane Katrina (2005)*
Recurring Severe Storms, Tornadoes, Straightline Winds and Flooding (Midwestern Floods (2008))^
FEMA HMGP
FEMA HGMP Closed Property Acquisitions 8/25/17
NOAA National Climatic Data Center 2008 Midwestern US Floods
KY 2006 84 Hurricane Katrina (2005)*
Recurring Severe Storms, Tornadoes, Straightline Winds and Flooding^ (Midwestern Floods (2008) )
FEMA HMGP
FEMA HGMP Closed Property Acquisitions 8/25/17
NOAA National Climatic Data Center 2008 Midwestern US Floods
LA 2005123,917
(HUD), 85 (FEMA)
Hurricane Katrina (2005)*
Tropical Storm Isaac (2012)*
Hurricane Ike (2008)*, Hurricane Gustav (2008)*, Hurricane Rita (2005)*,
HUD CDBGFEMA HMGP
Green and Olshanksky, 2012
FEMA HGMP Closed Property Acquisitions 8/25/18
MN 2008 105
Recurring Severe Storms, Tornadoes, Flooding, Landslides, and Mudslides^
Hurricane Katrina (2005)* FEMA HMGP
FEMA HGMP Closed Property Acquisitions 8/25/18
MO 2007 137
Recurring Severe Storms, Tornadoes, Straightline Winds and Flooding (Midwestern Floods (2008), Recurring Levee Failures)^
Hurricane Katrina (2005)* FEMA HMGP
FEMA HGMP Closed Property Acquisitions 8/25/18
FEMA HGMP and State of Missouri Emergency Management Agency, 2002
NOAA National Climatic Data Center 2008 Midwestern US Floods
NY 2013 1,202 (HUD), 158 (FEMA)
Hurricane Sandy (2012)*
Hurricane Irene (2011)*
Tropical Storm Lee*
HUD CDBG FEMA HMGP
New York State Governor’s Office of Storm Recovery 8/31/17
FEMA HGMP Closed Property Acquisitions 8/25/18
18
stormrecovery.ny.gov20 stormrecovery.ny.gov 2121
Figure 3: Map of Oakwood Beach Enhanced Buyout Area
Figure 4: Map of Graham Beach Enhanced Buyout Area
Managed Retreat in New York:
20
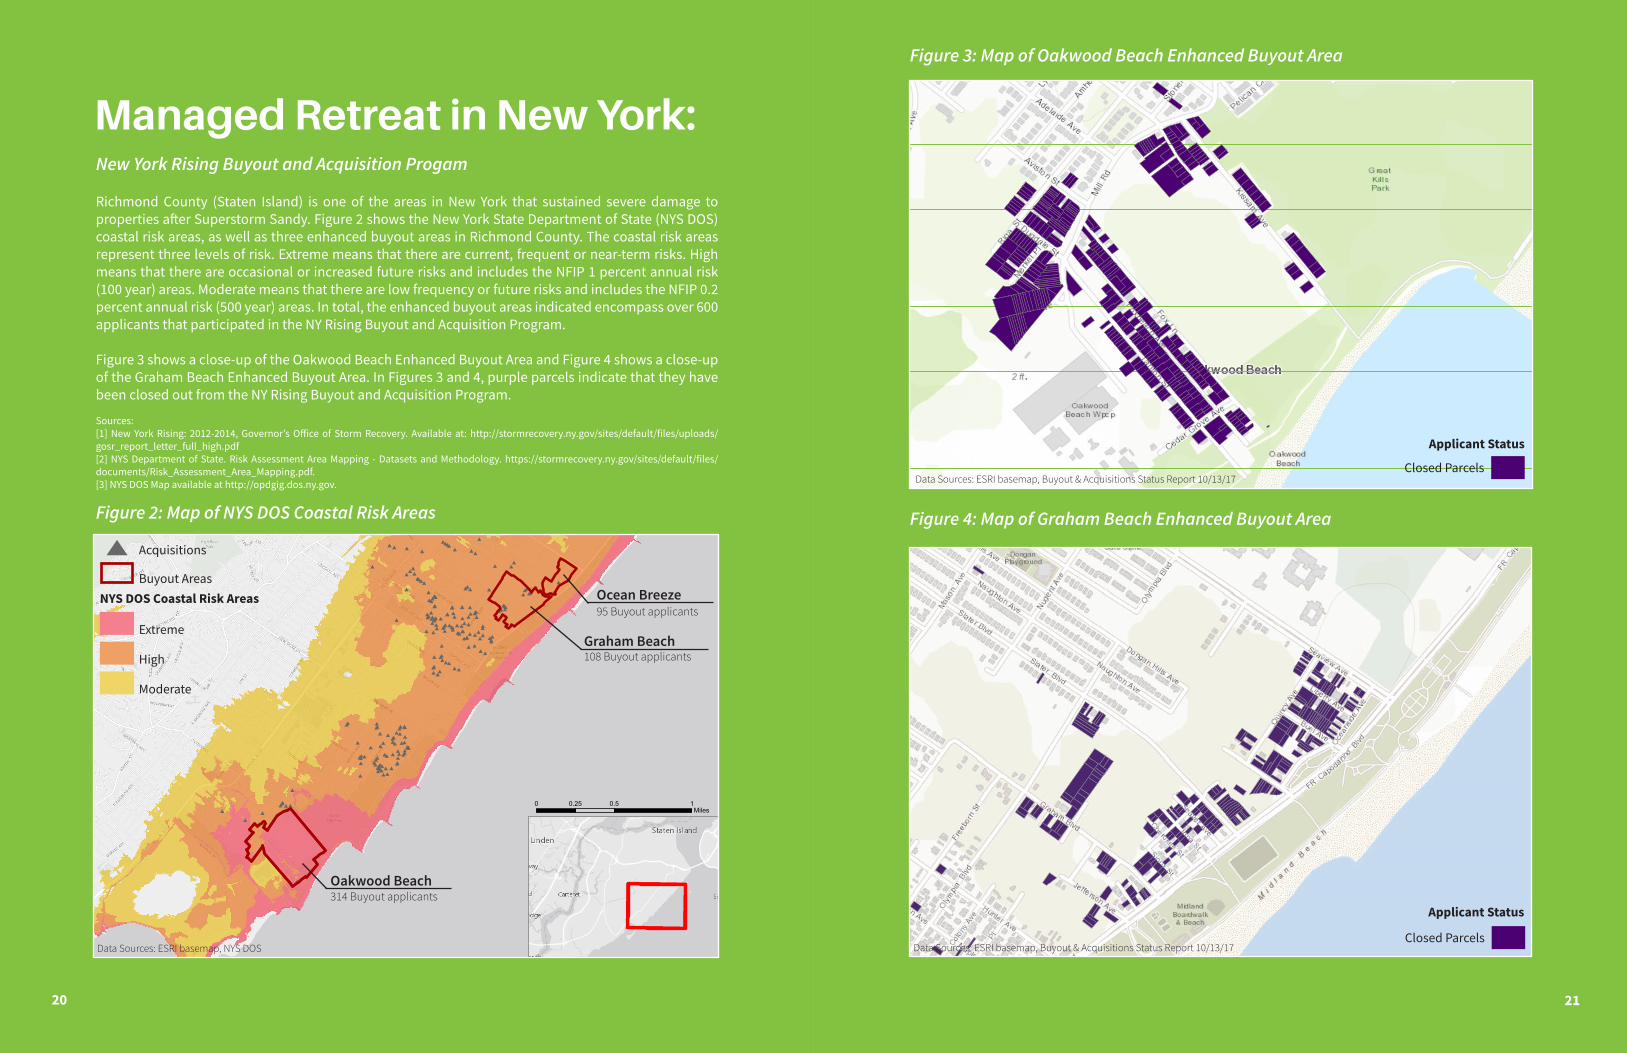
Figure 2: Map of NYS DOS Coastal Risk Areas
Richmond County (Staten Island) is one of the areas in New York that sustained severe damage to properties after Superstorm Sandy. Figure 2 shows the New York State Department of State (NYS DOS) coastal risk areas, as well as three enhanced buyout areas in Richmond County. The coastal risk areas represent three levels of risk. Extreme means that there are current, frequent or near-term risks. High means that there are occasional or increased future risks and includes the NFIP 1 percent annual risk (100 year) areas. Moderate means that there are low frequency or future risks and includes the NFIP 0.2 percent annual risk (500 year) areas. In total, the enhanced buyout areas indicated encompass over 600 applicants that participated in the NY Rising Buyout and Acquisition Program.
Figure 3 shows a close-up of the Oakwood Beach Enhanced Buyout Area and Figure 4 shows a close-up of the Graham Beach Enhanced Buyout Area. In Figures 3 and 4, purple parcels indicate that they have been closed out from the NY Rising Buyout and Acquisition Program.
New York Rising Buyout and Acquisition Progam
Sources:[1] New York Rising: 2012-2014, Governor’s Office of Storm Recovery. Available at: http://stormrecovery.ny.gov/sites/default/files/uploads/gosr_report_letter_full_high.pdf [2] NYS Department of State. Risk Assessment Area Mapping - Datasets and Methodology. https://stormrecovery.ny.gov/sites/default/files/documents/Risk_Assessment_Area_Mapping.pdf.[3] NYS DOS Map available at http://opdgig.dos.ny.gov.
#
## #
#
#
#
#
#
#
#
#
#
#
##
#
#
#
#
#
#
#
#
#
#
#
#
#
#
#
#
##
#
##
#
#
#
#
#
#
#
##
#
#
#
#
#
#
#
#
#
#
#
#
#
##
#
#
#
#
#
#
#
#
#
#
#
#
#
#
#
#
#
#
#
#
#
#
#
##
##
#
#
#
#
#
#
#
#
#
##
#
#
#
##
#
#
#
#
#
#
##
#
#
#
#
#
#
#
#
#
#
#
#
#
#
#
#
#
#
#
#
#
#
#
#
#
#
#
#
##
#
#
#
#
#
###
#
#
#
#
#
##
#
#
#
#
##
#
#
##
#
##
#
#
#
#
#
#
#
#
#
#
##
#
#
#
#
#
#
#
#
#
#
#
#
##
##
###
##
##
####
0 0.5 10.25Miles
Ocean Breeze
Graham Beach
Oakwood Beach
Acquisitions
Extreme
High
Moderate
Buyout AreasNYS DOS Coastal Risk Areas
95 Buyout applicants
108 Buyout applicants
314 Buyout applicants
Closed Parcels
Data Sources: ESRI basemap, NYS DOS
Data Sources: ESRI basemap, Buyout & Acquisitions Status Report 10/13/17
Closed Parcels
Applicant Status
Applicant Status
Data Sources: ESRI basemap, Buyout & Acquisitions Status Report 10/13/17
stormrecovery.ny.gov22 stormrecovery.ny.gov 23
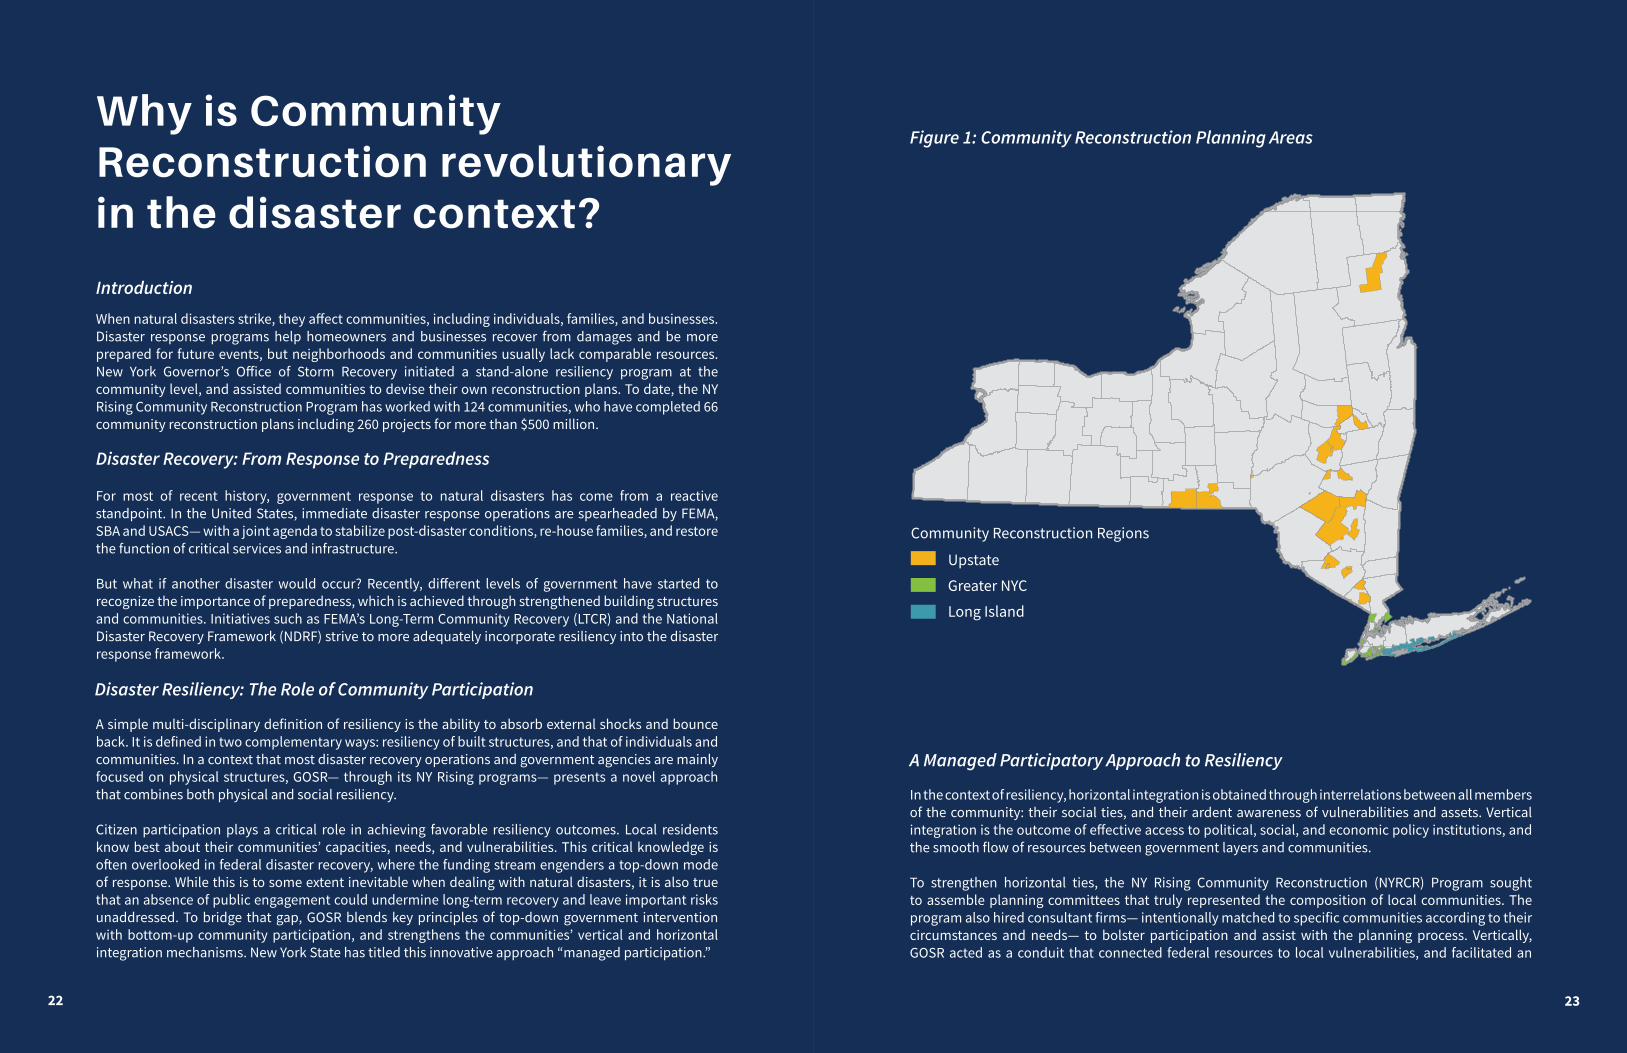
Figure 1: Community Reconstruction Planning Areas
23
Why is Community Reconstruction revolutionary in the disaster context?
For most of recent history, government response to natural disasters has come from a reactive standpoint. In the United States, immediate disaster response operations are spearheaded by FEMA, SBA and USACS— with a joint agenda to stabilize post-disaster conditions, re-house families, and restore the function of critical services and infrastructure.
But what if another disaster would occur? Recently, different levels of government have started to recognize the importance of preparedness, which is achieved through strengthened building structures and communities. Initiatives such as FEMA’s Long-Term Community Recovery (LTCR) and the National Disaster Recovery Framework (NDRF) strive to more adequately incorporate resiliency into the disaster response framework.
Disaster Recovery: From Response to Preparedness
Disaster Resiliency: The Role of Community Participation
A simple multi-disciplinary definition of resiliency is the ability to absorb external shocks and bounce back. It is defined in two complementary ways: resiliency of built structures, and that of individuals and communities. In a context that most disaster recovery operations and government agencies are mainly focused on physical structures, GOSR— through its NY Rising programs— presents a novel approach that combines both physical and social resiliency.
Citizen participation plays a critical role in achieving favorable resiliency outcomes. Local residents know best about their communities’ capacities, needs, and vulnerabilities. This critical knowledge is often overlooked in federal disaster recovery, where the funding stream engenders a top-down mode of response. While this is to some extent inevitable when dealing with natural disasters, it is also true that an absence of public engagement could undermine long-term recovery and leave important risks unaddressed. To bridge that gap, GOSR blends key principles of top-down government intervention with bottom-up community participation, and strengthens the communities’ vertical and horizontal integration mechanisms. New York State has titled this innovative approach “managed participation.”
A Managed Participatory Approach to Resiliency
In the context of resiliency, horizontal integration is obtained through interrelations between all members of the community: their social ties, and their ardent awareness of vulnerabilities and assets. Vertical integration is the outcome of effective access to political, social, and economic policy institutions, and the smooth flow of resources between government layers and communities.
To strengthen horizontal ties, the NY Rising Community Reconstruction (NYRCR) Program sought to assemble planning committees that truly represented the composition of local communities. The program also hired consultant firms— intentionally matched to specific communities according to their circumstances and needs— to bolster participation and assist with the planning process. Vertically, GOSR acted as a conduit that connected federal resources to local vulnerabilities, and facilitated an
22
When natural disasters strike, they affect communities, including individuals, families, and businesses. Disaster response programs help homeowners and businesses recover from damages and be more prepared for future events, but neighborhoods and communities usually lack comparable resources. New York Governor’s Office of Storm Recovery initiated a stand-alone resiliency program at the community level, and assisted communities to devise their own reconstruction plans. To date, the NY Rising Community Reconstruction Program has worked with 124 communities, who have completed 66 community reconstruction plans including 260 projects for more than $500 million.
Introduction
Upstate
Greater NYC
Long Island
Community Reconstruction Regions
stormrecovery.ny.gov24 stormrecovery.ny.gov 2522 23
Sources:[1] A Managed-Participatory Approach to Community Resiliency: A Case Study of New York State’s Response to Extreme Events. The Nelson Rockefeller Institute of Government. May 2016. Albany, NY. Retrieved from http://www.rockinst.org/pdf/disaster_recovery/2016-05-19%20Disaster%20Recovery%20Report.pdf
upward flow of information from the communities to the policymaking level. By engaging the public, GOSR helped communities raise their needs, and instigated active citizen influence on disaster-related policies.
GOSR assisted numerous communities with devising their own reconstruction plans. In those plans, communities propose resiliency projects that best respond to their needs. While many of the approved projects are still being implemented and brought to life, the final plans demonstrate strong participatory output. Taking advantage of local knowledge of risks and capacities, the NYRCR plans are realistic, feasible, and tailored to the available sources of funding. The plans also memorialize successful participatory experiences; the program leaves behind communities that are more empowered and aware of their ability to work together and succeed.
Why is Community Reconstruction revolutionary in the disaster context?
This page Is intentionally left blank.
stormrecovery.ny.gov26
stormrecovery.ny.gov


![Disaster Recovery Center (Disaster Assistance … Library/Disaster Recovery Center...Disaster Recovery Center (Disaster Assistance Center) Standard Operating Guide [Appendix to: ]](https://static.fdocuments.in/doc/165x107/5b0334ba7f8b9a2d518bd9d9/disaster-recovery-center-disaster-assistance-librarydisaster-recovery-centerdisaster.jpg)