
Diffusion Tensor Magnetic Resonance Imaging in Multiple Sclerosis
14
10.1177/1051228405283363 Journal of Neuroimaging Supplement to Vol 15 No 4 Goldberg-Zimring et al: Diffusion Tensor MRI in MS Diffusion Tensor Magnetic Resonance Imaging in Multiple Sclerosis Daniel Goldberg-Zimring, PhD Andrea U. J. Mewes, MD Mahnaz Maddah, MSc Simon K. Warfield, PhD ABSTRACT Multiple sclerosis (MS), a demyelinating disease, occurs princi- pally in the white matter (WM) of the central nervous system. Conventional magnetic resonance imaging (MRI) is sensitive to some, but not all, brain changes associated with MS. Diffusion- weighted imaging (DWI) provides information about water diffu- sion in tissue and diffusion tensor MRI (DT-MRI) about fiber direction, allowing for the identification of WM abnormalities that are not apparent on conventional MRI images. These tech- niques can quantitatively characterize the local microstructure of tissues. MS-associated disease processes lead to regions characterized by an increased amount of water diffusion and a decrease in the anisotropy of diffusion direction. These changes have been found to produce different patterns in MS patients presenting different courses of the disease. Changes in water diffusion may allow examination of the type, appearance, enhancement, and location of lesions not readily visible by other means. Ongoing studies of MS are integrating conventional MRI and DT-MRI measures with connectivity-based regional assessment, aiming to provide a better understanding of the nature and the location of WM lesions. This integration and the development of novel image-processing and visualization tech- niques may improve the understanding of WM architecture and its disruption in MS. This article presents a brief history of DWI, its basic principles and applications in the study of MS, a review of the properties and applications of DT-MRI, and their use in the study of MS. In addition, this article illustrates the methodology for the analysis of DT-MRI in ongoing studies of MS. Key words: Diffusion-weighted imaging, diffusion tensor, DT- MRI, multiple sclerosis, magnetic resonance imaging, diffusivity, lesion, tractography. Goldberg-Zimring D, Mewes AUJ, Maddah M, Warfield SK. Diffusion tensor magnetic resonance imaging in multiple sclerosis. J Neuroimaging 2005;15:68S-81S. DOI: 10.1177/1051228405283363. Multiple sclerosis (MS) is a demyelinating disease occur- ring in the white matter (WM) and gray matter (GM) of the central nervous system. In conventional magnetic res- onance imaging (MRI), MS lesions located in the WM produce a hyperintense signal in both proton density and T2-weighted images, while the hypointense T1-weighted lesions are considered to be chronic. 1 In MS patients, WM may be disrupted in areas not apparent on conventional T2-weighted MRI. Abnormali- ties of normal-appearing WM (NAWM) on T2-weighted MRI have been detected using magnetization transfer imaging (MTI), 2-4 diffusion-weighted imaging (DWI), 5-9 diffusion tensor MRI (DT-MRI), 6,10-13 and magnetic reso- nance spectroscopy (MRS). 14-16 (For separate, detailed dis- cussions of MTI and MRS, please see the accompanying articles in this supplement. 4,16 ) In general, MS patients present an increased amount of water diffusion and a decreased anisotropy of diffusion direction in the region of the lesions, in the surrounding lesion tissue, and in the remote NAWM. These changes are believed to be the result of either damage and removal of highly aligned cellular structures or replacement of axonal fibers with amorphous cells 7-9,17,18 and are appar- ently dependent on the clinical course of the patient. The correlation between WM lesion burden in MRI and clinical outcome measures is significant but not strong. 19 WM lesion burden is typically measured over the entire brain, which may underestimate the signifi- cance of the underlying connectivity of WM and the 68S Copyright © 2005 by the American Society of Neuroimaging Received August 18, 2005, and in revised form Septem- ber 27, 2005. Accepted for publication October 6, 2005. From the Computational Radiology Laboratory, Depart- ment of Radiology, Brigham and Women’s Hospital, Har- vard Medical School, Boston, Massachusetts (DG-Z, AUJM, SKW); the Computer Science and Artificial Intel- ligence Laboratory, Massachusetts Institute of Technol- ogy, Cambridge (MM); and the Computational Radiology Laboratory, Department of Radiology, Chil- dren’s Hospital, Harvard Medical School, Boston, Massa- chusetts (SKW). Address correspondence to Daniel Goldberg-Zimring, PhD, Department of Radiology, Brigham and Women’s Hospital, Harvard Medical School, 75 Francis Street, Boston, MA 02115. E-mail: [email protected].
Transcript of Diffusion Tensor Magnetic Resonance Imaging in Multiple Sclerosis

10.1177/1051228405283363Journal of Neuroimaging Supplement to Vol 15 No 4Goldberg-Zimring et al: Diffusion Tensor MRI in MS
Diffusion Tensor MagneticResonance Imaging inMultiple Sclerosis
Daniel Goldberg-Zimring, PhD
Andrea U. J. Mewes, MD
Mahnaz Maddah, MSc
Simon K. Warfield, PhD
A B S T R A C T
Multiple sclerosis (MS), a demyelinating disease, occurs princi-pally in the white matter (WM) of the central nervous system.Conventional magnetic resonance imaging (MRI) is sensitive tosome, but not all, brain changes associated with MS. Diffusion-weighted imaging (DWI) provides information about water diffu-sion in tissue and diffusion tensor MRI (DT-MRI) about fiberdirection, allowing for the identification of WM abnormalities thatare not apparent on conventional MRI images. These tech-niques can quantitatively characterize the local microstructureof tissues. MS-associated disease processes lead to regionscharacterized by an increased amount of water diffusion and adecrease in the anisotropy of diffusion direction. These changeshave been found to produce different patterns in MS patientspresenting different courses of the disease. Changes in waterdiffusion may allow examination of the type, appearance,enhancement, and location of lesions not readily visible by othermeans. Ongoing studies of MS are integrating conventional MRIand DT-MRI measures with connectivity-based regionalassessment, aiming to provide a better understanding of thenature and the location of WM lesions. This integration and thedevelopment of novel image-processing and visualization tech-niques may improve the understanding of WM architecture andits disruption in MS. This article presents a brief history of DWI,its basic principles and applications in the study of MS, a reviewof the properties and applications of DT-MRI, and their use in thestudy of MS. In addition, this article illustrates the methodologyfor the analysis of DT-MRI in ongoing studies of MS.
Key words: Diffusion-weighted imaging, diffusion tensor, DT-MRI, multiple sclerosis, magnetic resonance imaging,diffusivity, lesion, tractography.
Goldberg-Zimring D, Mewes AUJ,Maddah M, Warfield SK.
Diffusion tensor magnetic resonanceimaging in multiple sclerosis.
J Neuroimaging 2005;15:68S-81S.DOI: 10.1177/1051228405283363.
Multiple sclerosis (MS) is a demyelinating disease occur-ring in the white matter (WM) and gray matter (GM) of
the central nervous system. In conventional magnetic res-onance imaging (MRI), MS lesions located in the WMproduce a hyperintense signal in both proton density andT2-weighted images, while the hypointense T1-weightedlesions are considered to be chronic.1
In MS patients, WM may be disrupted in areas notapparent on conventional T2-weighted MRI. Abnormali-ties of normal-appearing WM (NAWM) on T2-weightedMRI have been detected using magnetization transferimaging (MTI),2-4 diffusion-weighted imaging (DWI),5-9
diffusion tensor MRI (DT-MRI),6,10-13 and magnetic reso-nance spectroscopy (MRS).14-16 (For separate, detailed dis-cussions of MTI and MRS, please see the accompanyingarticles in this supplement.4,16)
In general, MS patients present an increased amountof water diffusion and a decreased anisotropy of diffusiondirection in the region of the lesions, in the surroundinglesion tissue, and in the remote NAWM. These changesare believed to be the result of either damage and removalof highly aligned cellular structures or replacement ofaxonal fibers with amorphous cells7-9,17,18 and are appar-ently dependent on the clinical course of the patient.
The correlation between WM lesion burden in MRIand clinical outcome measures is significant but notstrong.19 WM lesion burden is typically measured overthe entire brain, which may underestimate the signifi-cance of the underlying connectivity of WM and the
68S Copyright © 2005 by the American Society of Neuroimaging
Received August 18, 2005, and in revised form Septem-ber 27, 2005. Accepted for publication October 6, 2005.
From the Computational Radiology Laboratory, Depart-ment of Radiology, Brigham and Women’s Hospital, Har-vard Medical School, Boston, Massachusetts (DG-Z,AUJM, SKW); the Computer Science and Artificial Intel-ligence Laboratory, Massachusetts Institute of Technol-ogy, Cambridge (MM); and the ComputationalRadiology Laboratory, Department of Radiology, Chil-dren’s Hospital, Harvard Medical School, Boston, Massa-chusetts (SKW).
Address correspondence to Daniel Goldberg-Zimring,PhD, Department of Radiology, Brigham and Women’sHospital, Harvard Medical School, 75 Francis Street,Boston, MA 02115. E-mail: [email protected].

cumulative effects on WM damage in functionally elo-quent WM tracts.18,20
Recent advances in DT-MRI and image-processingtechniques are providing the image acquisition and visu-alization technology to enable in vivo assessment of theWM architecture of the human brain. These technologieswill enable future studies of the relationship between WMdisruption, WM connectivity, and clinical measures andwill ultimately lead to improved monitoring of patients,better prediction of the course of the disease, and morerapid assessment of new treatments or therapies. (For sep-arate, detailed discussions of image-processing tech-niques, please see the accompanying article in this supple-ment.21)
This article presents a brief history of DWI and its basicprinciples and applications in the study of MS, followedby a review of the properties and applications of DT-MRIand its use in the study of MS. In addition, it presents aproposed methodology for the analysis of DT-MRI inongoing studies of MS.
Diffusion-Weighted Imaging
Brief History
DWI allows quantitative measurement of the molecularmotion of water. DWI is based on the continuous agita-tion of minute suspended particles, which is a phenome-non known as Brownian movement, named after RobertBrown, who observed the constant movement of pollengrains in 1827.22 Brown suspended some of the pollengrains in water and examined them closely, only to seethem “filled with particles” that were “very evidently inmotion.” He was soon satisfied that the movement “aroseneither from currents in the fluid, nor from its gradualevaporation, but belonged to the particle itself.”22 The ki-netic force in Brownian movement is directly related toparticle size, and the vector of the force that gives rise tothe movement is not consistent, nor does it result in mo-tion in a specific direction. Through his investigation ofBrownian movement (frequently referred to as Brownianmotion), Albert Einstein showed that according to themolecular-kinetic theory of heat, bodies of microscopi-cally visible size suspended in a liquid perform move-ments of such magnitude that they can be easily observedusing a microscope, on account of the molecular mo-tions of heat.23 This theoretical formulation was also inde-pendently derived by Sutherland,24 and it has beenreferred to as the Sutherland-Einstein equation.25 Thisanalysis of Brownian motion led to the formulation of theBoltzmann constant.
Early nuclear magnetic resonance (NMR) efforts toobserve diffusion were performed by Stejskal and Tan-ner.26 They derived the effect of a time-dependent mag-netic gradient on the spin-echo experiment, particularlyin the presence of spin diffusion. In 1986, Le Bihan et al27
developed an MRI technique to observe intravoxel inco-herent motions resulting from the distribution of phasesin a single voxel when appropriate magnetic field gradi-ent pulses are applied. They studied the diffusion coeffi-cients measured on images of water and acetone phan-toms. They also analyzed neurological images fromhealthy controls and patients by estimating the amount ofwater diffusion in tissue by means of the apparent diffu-sion coefficient (ADC) and found differences betweenvarious normal and pathologic tissues. ADC is a scalarmeasure that reflects the amount of apparent diffusivity ina particular direction.28 One of the first and most widelyused clinical applications of DWI is the evaluation ofbrain stroke (ischemia). DWI is the most sensitive methodfor detecting acute ischemia in vivo,29,30 allowing for thedistinction between old and new strokes30,31 and helpingto differentiate early stroke from other focal brainprocesses, which is not possible with conventional MRI.
Basic Principles
The measurement and characterization of water diffusionin tissues is based on the quantification of the random mo-tion of water molecules in tissues. This random motionprovides microscopic in vivo information about tissue ar-chitecture that is not provided by conventional MRI. Inpure water, individual molecules present a constant ran-dom motion in all directions, but in the environment ofbrain tissue, this random motion is restricted in differentways. The main factors affecting water diffusion are thestructural components and temperature of the tissues. Iso-tropic diffusion occurs largely in tissues with incoherentstructures such as those in the brain ventricles and in adultcortical GM, where the apparent diffusion restriction isequal in all directions. Anisotropic diffusion is present intissues such as those in regions of WM fiber tracts, wherewater diffusion has a preferred orientation.5,6
In DWI, a single field gradient pulse is applied duringimage acquisition, providing a quantitative measurementof water diffusion.27 This quantitative measurement of thediffusion in the gradient direction is determined by theamount of attenuation in the signal resulting from the ran-domization of the NMR spin phase caused by the diffu-sion of water molecules. Thus, only diffusion in the direc-tion of the applied gradient can be detected. As thediffusion of water is 3-dimensional (3D), 3 orthogonalmeasures of direction are required to calculate the mean
Goldberg-Zimring et al: Diffusion Tensor MRI in MS 69S
diffusivity (D) for each voxel. The bulk D is the 3D analogof the ADC and is an intrinsic property of the tissues andhas no directional dependence. It has also been calledtrace ADC or mean trace.28
DWI in MS
In the brain’s WM, the mobility of the water is restrictedby structures such as myelinated and unmyelinated axonsthat are oriented along the fiber tracts, and the direction ofhighest diffusivity coincides with the tissue’s fiber tractaxis.32,33 The pathological elements of MS have the poten-tial to alter the permeability or geometry of structural bar-riers to molecular diffusion of water in the brain.7
The first study to use DWI in MS was performed byLarsson et al.34 They studied acute and chronic MSlesions and found diffusion to be higher in acute plaquescompared with chronic plaques, suggesting a probablerelation between the degree of demyelination and theincrease of extracellular water space. Another study per-formed by Droogan et al35 found a higher D and reducedanisotropy in MS lesions as compared with NAWM, withthe highest D values measured in T1-weightedhypointense and enhanced lesions. A slightly higher Dand reduced anisotropy were also found in the WM of theMS patients as compared with healthy controls. How-ever, no differences in D between patients with differentdisease phenotypes were observed, and no correlationswith disability were seen. In a study of lesions presentingdifferent patterns of enhancement (eg, nonenhancement,homogeneously enhanced, and ring enhanced),Roychowdhury et al36 aimed to determine whether the Dpattern corresponded to the MRI findings and whether itaccounted for histopathologic characteristics of differentlesion types. This correspondence was observed, as all 3types of lesions had a higher D than the NAWM. Therewas also a significant difference in the mean D betweenhomogeneously enhanced and ring-enhanced as well asbetween homogeneously enhanced and nonenhancedlesions.
Longitudinal studies have analyzed the changes in diffu-sion properties in NAWM regions and subsequently pre-sented new enhancing lesions, finding an increasing Din the prelesion NAWM37,38 and at the time of lesionenhancement.37 These observations suggested that alter-ations in the tissue integrity, such as edema anddemyelination, occur before the formation of new MSlesions. Werring et al37 also observed an increase in D inmatched contralateral NAWM regions at the time of thefirst noted lesion enhancement, suggesting that structuraldamage is also caused in connected areas of NAWM. Inan additional longitudinal study performed by Caramiaet al,39 D was monitored to identify changes occurring in
the NAWM, the linkage to T2-weighted lesion load, andthe correlation with clinical parameters in early MSpatients with clinically isolated symptoms. At baseline,they did not find any difference in the D between patientsand healthy controls; after 12 months, the D in patientswas significantly higher and correlated with T2-weightedload. For those patients presenting an increase in D abovea confidence interval, disability status also deteriorated.Similarly, Schmierer et al40 observed the changes in D inNAWM in patients with primary-progressive MS (PPMS)over a 1-year period. Serial DWI showed progres-sive changes in the NAWM in patients with PPMS, withan increment of the D associated with an increase of theT1-weighted and T2-weighted lesion load. They alsofound the D in frontal NAWM to be associated withdisability.
In MS, the changes in diffusion are not exclusivelylocated in the WM; they can also be observed in thenormal-appearing GM (NAGM). Cercignani et al41 mea-sured D in both the NAWM and NAGM in MS patientsand found that D in healthy controls was higher in bothNAWM and NAGM than in MS patients. Fabiano et al42
analyzed the changes in D in the thalamus of MS patientsand observed increased water diffusion, which was partlyassociated with clinical course, lesion load, and brain atro-phy. These results suggest that in MS, subtle changes alsooccur in the NAGM.
Diffusion Tensor MRI
Estimation of DT From DT-MRI
DT-MRI, initially proposed by Basser et al,32 differs fromDWI in that in DT-MRI, a tensor describing local waterdiffusion is calculated for each voxel from measurementsof diffusion of at least 6 noncollinear, noncoplanar gradi-ents. The tensors D are then estimated by solving a systemof equations with the form43
ln( ) ln( ) � �S S bg Dgk kT
k= −0 , (1)
where k = 1 . . . n, in which n is the number of gradients. Sk
represents the signal intensities in the presence ofdiffusion-sensitizing gradients, and gk – S0 is the baselinesignal intensity obtained from the absence of a diffusion-sensitizing field gradient.
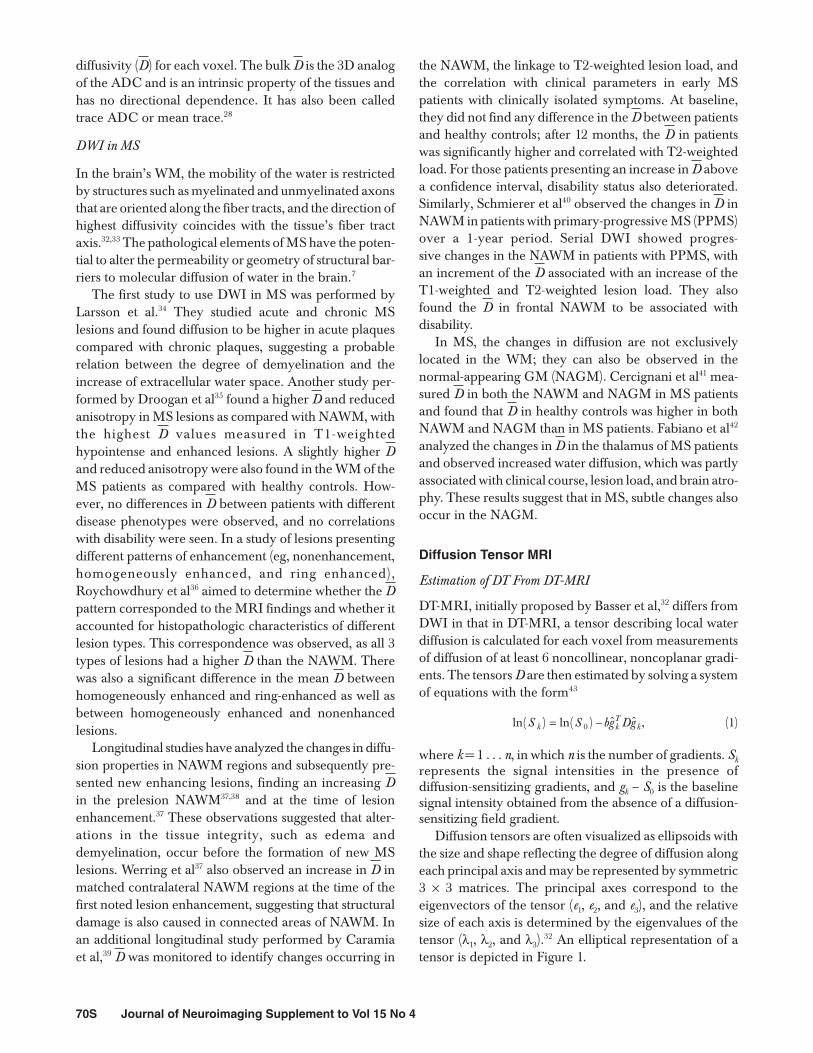
Diffusion tensors are often visualized as ellipsoids withthe size and shape reflecting the degree of diffusion alongeach principal axis and may be represented by symmetric3 × 3 matrices. The principal axes correspond to theeigenvectors of the tensor (e1, e2, and e3), and the relativesize of each axis is determined by the eigenvalues of thetensor (λ1, λ2, and λ3).
32 An elliptical representation of atensor is depicted in Figure 1.
70S Journal of Neuroimaging Supplement to Vol 15 No 4

Tensor Representation
In DT-MRI, a tensor describes the local water diffusionper voxel. In isotropic diffusion, characteristic of the adulthuman brain GM and cerebrospinal fluid, the magnitudeof the diffusion is equal in all directions, and the corre-sponding tensor shape is spherical. Anisotropic diffusion,found in the adult human brain WM, is represented by el-lipsoids with variable magnitude of their axes. The shapecharacteristics of this ellipsoid may be summarized withbasic geometric measures43: (1) linear, when the diffusionis mainly in the direction of the largest eigenvalue (λ1 ⟩⟩ λ2
≈ λ3); (2) planar, when the diffusion is restricted to a planespanned by the 2 eigenvectors of the 2 largest eigenvalues(λ1 ≈ λ2 ⟩⟩ λ3); and (3) spherical, when the diffusion is equalin all directions (λ1 ≈ λ2 ≈ λ3). By using the largesteigenvalues of the tensor, the linear, planar, and sphericalmeasures can be obtained by, respectively,
cl = −λ λλ
1 2
1 (2)
c p = −λ λλ
2 3
1 (3)
c s = λλ
3
1
,(4)
where cl, cp, and cs lie in the range [0 1] and their sum isequal to 1.
Scalar Measurements
The 2 primary measurements derived from DT-MRI andits tensor representation, based on the normalized vari-
ance of the eigenvalues, include (1) the bulk meandiffusivity, a measure of the amount of water diffusion intissue, which is equal to one third of the trace of the diffu-sion tensor:
DTrace D= = + +( )
3 31 2 3λ λ λ
(5)
and (2) the fractional anisotropy (FA), a measure of theanisotropy of diffusion direction,6,11,17,18,44,45 which is repre-sented by
FA =− + − + −
+ +
12
1 22
32
1 32
12
22
32
( ) ( ) ( )λ λ λ λ λ λ
λ λ λ2 . (6)
Tractography
Tensor visualization allows for representation of the infor-mation contained in DT-MRI data. This is the first step forthe construction of fiber tracts.5,46,47 The eigenvector cor-responding to the largest eigenvalue indicates the primaryorientation of the local brain structure; therefore, it is pos-sible to assess a bulk average of the in vivo axonal connec-tivity using DT-MRI.43 The in-plane component of themeasured fiber direction is usually represented by head-less arrows,46-48 with the length of the arrows being pro-portional to the relative anisotropy and orientationindicated by color coding. DT-MRI may be used to delin-eate WM fiber tracts and thus construct 3D tracts, tracesof the pathways representing WM fiber tracts by means ofconnected diffusion tensors.43,49-51 Mori et al52 constructedsuch representations by starting from a seed pixel andstepping along a line in both the retrograde andorthograde directions according to the largesteigenvector at each pixel. Different criteria were definedto determine when and where to terminate the trackingprocedure and hence to identify particular WM pathwaysof interest. The tracking was performed for every pixel in-side the brain, and only those fibers that penetrated previ-ously defined regions of interest were retained. Wakanaet al53 applied the same technique to reconstruct the 3Dtrajectories of 17 prominent WM tracts. These tracts weresuperimposed on coregistered anatomic MR images, andparcellation maps of the WM were created, which werelater coregistered to DT-imaging color maps to assignvisible structures.
Recent work has been carried out in the construction ofintersubject atlases from DT-MRI data. Jones et al54
described spatial averaging of scans from 10 healthyadults and demonstrated success in bringing fiber tractsinto correspondence. Mori et al52 successfully extractedcertain corresponding fiber tracts and then detected a dif-ferent pattern of anisotropy along a certain tract in anadrenoleukodystrophy patient as compared to the
Goldberg-Zimring et al: Diffusion Tensor MRI in MS 71S
Fig 1. Elliptical representation of a tensor, reflecting the de-gree of diffusion along each principal axis and may be repre-sented by symmetrical 3 × 3 matrices. The principal axescorrespond to the eigenvectors of the tensor (e1, e2, and e3),and the relative size of each axis is determined by theeigenvalues of the tensor (λ1, λ2, and λ3).

healthy individuals. The feasibility of selection andextraction of specific tracts from scans has also beenrecently demonstrated,55 as shown also in a study ofpyramidal tracts in MS patients.18 Average DT-MRIatlases have been constructed by aligning the DT-MRIdata using a nonlinear registration approach, which usesall the components of the tensor.56 This enables the topol-ogy and morphology representative of a group of patientsto be modeled by the combination of the intensity aver-age and the shape average derived from the mean ofdeformation fields.57
DT-MRI in MS
The geometry of diffusion tensors can quantitatively char-acterize the local structure in tissues. The density of the fi-bers, the degree of myelination, the average fiber tractdiameter, and the directional similarity of the fibers in thevoxel all affect the shape of the diffusion ellipsoid.43 Inves-tigation of these properties through several ongoing re-search studies may provide a better understanding of thepathologic processes involved in MS.
DT-MRI–derived metrics have been found to show tis-sue damage not only in the area of the T1- and T2-weighted lesion but also in the lesion’s surrounding areaand in remote NAWM and NAGM as a result ofWallerian degeneration. Kealy et al58,59 compared the T2-weighted size of MS lesions with lesion size as defined onFA maps. They found a significantly reduced anisotropyboth inside the T2-weighted lesions and in the immedi-ately adjacent NAWM regions, indicating that the realsize of the lesions is often substantially greater in DT-MRI than what is seen in conventional MRI. Similarly,Guo et al60 found that the anisotropy and the D valueswere more abnormal in the lesions and their periph-ery than in more distant regions. A generally increased Dand a reduced FA, especially in brain regions normallypresenting a high anisotropy, such as the corpus callosum(CC) and the internal capsule,61,62 are common changes inthe DT-MRI parameters in the NAWM of MS patients. Ina more detailed and recent study of the NAWM of the CCof MS patients,63 a significantly reduced FA in the anteriorand posterior midbody subdivisions of the CC was observed.Compared tohealthycontrols, almostnochanges in theFAofthe genu of the CC were found, while the splenium showedan insignificant trend to reduced FA values.
Some studies have investigated the pathologic severityof tissue damage in MS based on the DT-MRI metricsobserved in different types of lesions. Werring et al44
observed the highest diffusion in destructive T1-weightedhypointense lesions, whereas the greatest change in an-isotropy was found in inflammatory contrast-enhancedlesions. Two different studies6,45 found that in nonacute
enhanced T1-weighted hypointense lesions, the FA waslower than that of T1-weighted isointense lesions.However, significantly higher D45 and similar D values6
were also observed when comparing enhancing andnonenhancing MS lesions.
DT-MRI also has been used with the aim of studyingand characterizing the damage caused by MS in its differ-ent stages and phenotypes. A study comparing early-onset MS (mean disease duration <1.5 years) in youngpatients (mean age 14.1 years) with healthy controls withDT-MRI64 found only a slight increase in D of theNAWM. Griffin et al65 analyzed the changes in macro-scopically normal-appearing brain tissue (NABT) in earlyrelapsing-remitting MS (RRMS) patients (mean diseaseduration 1.7 years), finding significant differences in FA,D, and volume ratio between lesions and NAWM. How-ever, they did not find a significant difference in theNAWM and NAGM between patients and healthy con-trols, nor did they find any correlation with clinical out-come measures. To determine whether DT-MRI observ-able disease effects could be detected in early MS (meandisease duration 1.6 years), Rashid et al66 analyzed thechanges in FA, D, and volume ratio in both the NABT andthe whole brain tissue, finding only an increased FA.Studying the normal-appearing CC in RRMS patientshaving a relatively short disease duration of 2.7 years67
revealed that FA and D are more severe in normal-appearing CC regions than in other NAWM regions.These studies suggest that in early-stage disease, thepathological changes are minor or localized in specificbrain structures such as the CC.
Studies comparing DT-MRI–derived measures concurthat the damage caused by MS is higher in more progres-sive forms of the disease. Cercignani et al68 quantifiedtissue damage on T2-weighted lesions and NAWM bymeans of D, FA, and intervoxel coherence (C, which rep-resents the degree of similarity of orientation of adjacentvoxels) from PPMS, RRMS, and secondary-progressiveMS (SPMS) patients. They found that the CC of SPMSpatients had a higher D and a lower FA and C than didpatients with either RRMS or PPMS. SPMS patients alsohad a higher average lesion D than both RRMS andPPMS did. Similar results were obtained by Rovariset al69 for both NAWM and NAGM, with a significantlydifferent D and not significantly different FA when com-paring SPMS to PPMS patients. In another study quanti-fying the extent of GM damage as seen on DT-MRI mapsof RRMS, PPMS, and SPMS patients,70 significant differ-ences were found between controls and patients with onlythe progressive forms of the disease. The authors alsofound some differences between RRMS and SPMSpatients as well as some differences between PPMS and
72S Journal of Neuroimaging Supplement to Vol 15 No 4

SPMS patients, confirming GM damage in MS, which isalso related to disease progression.
Longitudinal studies have also been carried out usingDT-MRI–derived parameters. Cassol et al71 monitoredthe evolution of trace and of FA in the NAWM of MSpatients and found that both trace and FA indicated arecovery after the acute phase in RRMS patients and aprogressive shift toward abnormal values in SPMSpatients. In another study, over a 1-year period,72 tissuechanges beyond the resolution of conventional MRI weredetected in the NAGM of patients with progressive MS.These observations indicated that the damage in the GMdoes not depend only on the T2-weighted lesion load andthe reduction of brain volume and may be an additionalresult of accumulated disability in progressive MS.
The microscopic and more localized analysis of tissuedamage that is possible with DT-MRI, as well as its capa-bility to detect remote damage in normal-appearing tis-sue, is allowing some improvement in the correlation ofMRI studies with clinical disability. Ciccarelli et al11
observed that the FA and D in the cerebral peduncleswere inversely correlated with the Expanded DisabilityStatus Scale (EDSS) and pyramidal functional scores.RRMS patients had a strong correlation between the FAand the EDSS in both supra- and infratentorial NAWM,while in PPMS and SPMS patients, disease duration cor-related strongly with D in infratentorial NAWM and withFA in the cerebral peduncles. In a study of the correlationbetween cognitive impairment in RRMS patients andDT-MRI,17 no correlation between any of the neuropsy-chological test scores and brain volume, average lesionFA, and whole brain tissue FA was found. However, mod-erate correlations were found between neuropsy-chological scores exploring language, attention, andmemory and DT-MRI quantitative metrics such as FAand D histograms of whole brain tissue, NABT, NAWM,and NAGM. This seems to reflect the severity of lan-guage, attention, and memory deficits in RRMS patients.Using an algorithm to identify specific tracts and measuredisease burden within them, Wilson et al18 assessedpyramidal tract damage caused by MS with a measurederived from the relative anisotropy along the tracts.This measurement in the pyramidal tract correlated sig-nificantly with both the EDSS and, to a greater extent,with the pyramidal functional system score (FSS). In asimilar way, Lin et al20 measured the average D (Dav) alongthe pyramidal tract and CC. They found a correla-tion between the pyramidal tract Dav and pyramidalFSS and between CC Dav and the Paced Auditory SerialAddition Test, a neuropsychological test commonly usedon MS patients. They also found that the global, but notthe localized, T2-weighted lesion correlated with Dav of
both the pyramidal tract and CC. The results obtained byWilson et al18 and Lin et al20 show that an increased speci-ficity in monitoring the progression of motor and cogni-tive impairment in MS may be obtained by matching spe-cific WM tracts with specific clinical scoring systems.
Proposed Methodology for the Analysis
of DT-MRI in Ongoing Studies of MS
Image Acquisition
High-resolution MRI was acquired from MS patients andhealthy controls using a 3T Signa System (GE MedicalSystems, Milwaukee, WI). The acquired sets of images in-cluded the following: (1) line scan diffusion images (TR/TE = 93/55 milliseconds, field of view [FOV] = 270 cm,matrix size = 256 × 256) using a b = 1000 s/mm2, 1 base-line and 6 noncollinear and noncoplanar directions, 60contiguous 2-mm-thick axial sections for each direction;(2) MPRAGE3D T1-weighted (TR/TE = 8/3.2 millisec-onds, inversion preparation time = 725 milliseconds,postdelay time = 1400 milliseconds, FOV = 240 cm, ma-trix size = 256 × 256), 124 contiguous 1.3-mm-thicksagittal sections; (3) 3DFSE T2-weighted (TR/TE =4300/8 milliseconds, FOV = 240 cm, matrix size = 256 ×256), 160 contiguous 1-mm-thick sagittal sections; and (4)fluid-attenuated inversion recovery (FLAIR; TR/TE =8000/8 milliseconds, inversion time = 2450 milliseconds,FOV = 240 cm, matrix size = 256 × 256), 80 contiguous1.5-mm-thick sagittal sections.
Alignment of Conventional and DT-MRI
Although the T1-weighted, T2-weighted, and FLAIR im-ages were acquired during the same session, slight headmovements were expected to occur. Therefore, T2-weighted and FLAIR images were aligned with the T1-weighted images using an ITK implementation(www.itk.org) of a rigid registration algorithm based onthe maximization of mutual information.73
Following the rigid registration of conventional MRI,an outline of the intracranial cavity (ICC) masks contain-ing brain parenchyma and cerebrospinal fluid were man-ually obtained from both the DT-MRI baseline and theT1-weighted MRI. These ICC masks were later appliedto the original baseline and T1-weighted sets of images,respectively, to get the segmentation of the ICC. The T1-weighted ICC mask was also used to segment the ICCfrom the T2-weighted and FLAIR images.
The T1-weighted, T2-weighted, and FLAIR ICCswere then registered onto the baseline ICC using an affineregistration algorithm.74 This algorithm computes an opti-mal alignment using a robust least-squares method to esti-
Goldberg-Zimring et al: Diffusion Tensor MRI in MS 73S
mate the rigid body or affine transform that best fits a setof local block match calculations.
Interactive Identification of Particular Fiber Tracts
Raw data were converted to derive DT information usingcustom software and were then loaded into 3D slicer(www.slicer.org). The regions of interest (ROIs) were out-lined by an expert based on information from the FA mapand an additional map, which encodes the direction of thelargest eigenvector. This map is known as a color by ori-entation (CBO) map.52 The FA map was thresholded toidentify regions of anisotropic WM. Based on the CBOmap, which allows ready visualization of changes in fiberorientation, the binary label map was segmented into dif-ferent anatomically defined ROIs. Ambiguities in theCBO map were resolved by seeding single tracts andobserving the trajectory.
Assessment of Disease Burden From DT- and Conventional MRI
The correlation between conventional MRI-derivedmeasures of MS lesion burden and clinical measures ofdisease status has not been strong and may be at least inpart because most MRI-derived measures ignore the dif-ferent functional significance of different regions of theWM. (For an in-depth discussion of the clinical–MRI par-adox, please see the accompanying article in this supple-ment.75) This could be addressed by defining a specific setof regions of WM fiber tracts as observed with DT-MRIand measuring lesion burden from DT- and conventionalMRI that reflect alterations in the WM in those regions.
Several measures are possible, including the minimum(min), maximum (max), and mean ± standard deviation ofthe FA and ADC, as well as for the linear, planar, and cir-cular measurements from (1) inside the lesion, (2) aperipheral ROI surrounding the lesion, and (3) a“healthy” symmetric area corresponding to the mirror-image reflection across the midline. MS lesions can beidentified and segmented by analyzing the previouslyaligned sets of images (eg, conventional MRIs registeredto the DT-MRI baseline) using established methods.76
Beyond single summary measures, distributions ofparameters such as the FA along the fiber tracts containedin anatomically defined ROIs may be determined andmay reflect the resulting disruption caused by MS. Thisanalysis includes the estimation of tracts77 aligned withconventional MRI from which the MS lesions aresegmented.
Quantitative Assessment
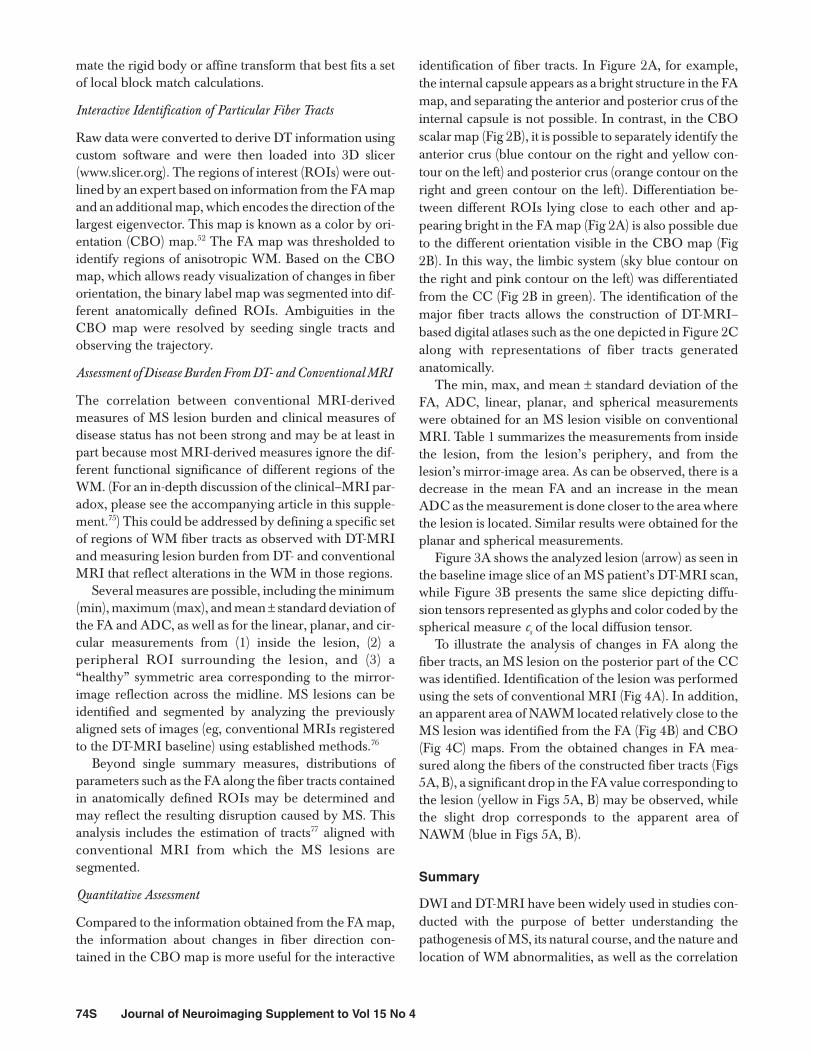
Compared to the information obtained from the FA map,the information about changes in fiber direction con-tained in the CBO map is more useful for the interactive
identification of fiber tracts. In Figure 2A, for example,the internal capsule appears as a bright structure in the FAmap, and separating the anterior and posterior crus of theinternal capsule is not possible. In contrast, in the CBOscalar map (Fig 2B), it is possible to separately identify theanterior crus (blue contour on the right and yellow con-tour on the left) and posterior crus (orange contour on theright and green contour on the left). Differentiation be-tween different ROIs lying close to each other and ap-pearing bright in the FA map (Fig 2A) is also possible dueto the different orientation visible in the CBO map (Fig2B). In this way, the limbic system (sky blue contour onthe right and pink contour on the left) was differentiatedfrom the CC (Fig 2B in green). The identification of themajor fiber tracts allows the construction of DT-MRI–based digital atlases such as the one depicted in Figure 2Calong with representations of fiber tracts generatedanatomically.
The min, max, and mean ± standard deviation of theFA, ADC, linear, planar, and spherical measurementswere obtained for an MS lesion visible on conventionalMRI. Table 1 summarizes the measurements from insidethe lesion, from the lesion’s periphery, and from thelesion’s mirror-image area. As can be observed, there is adecrease in the mean FA and an increase in the meanADC as the measurement is done closer to the area wherethe lesion is located. Similar results were obtained for theplanar and spherical measurements.
Figure 3A shows the analyzed lesion (arrow) as seen inthe baseline image slice of an MS patient’s DT-MRI scan,while Figure 3B presents the same slice depicting diffu-sion tensors represented as glyphs and color coded by thespherical measure cs of the local diffusion tensor.
To illustrate the analysis of changes in FA along thefiber tracts, an MS lesion on the posterior part of the CCwas identified. Identification of the lesion was performedusing the sets of conventional MRI (Fig 4A). In addition,an apparent area of NAWM located relatively close to theMS lesion was identified from the FA (Fig 4B) and CBO(Fig 4C) maps. From the obtained changes in FA mea-sured along the fibers of the constructed fiber tracts (Figs5A, B), a significant drop in the FA value corresponding tothe lesion (yellow in Figs 5A, B) may be observed, whilethe slight drop corresponds to the apparent area ofNAWM (blue in Figs 5A, B).
Summary
DWI and DT-MRI have been widely used in studies con-ducted with the purpose of better understanding thepathogenesis of MS, its natural course, and the nature andlocation of WM abnormalities, as well as the correlation
74S Journal of Neuroimaging Supplement to Vol 15 No 4

between MS lesions and the clinical outcome measures. Itis now known that the FA decreases while the ADC in-creases in the areas affected by MS abnormalities, theNAWM and the NAGM. These changes have been found
to be particularly high in patients presenting a moresevere course of the disease, such as SPMS, than in less se-vere courses, such as early-onset MS and RRMS patients.Changing patterns of DT-MRI measurements depending
Goldberg-Zimring et al: Diffusion Tensor MRI in MS 75S
Fig 2. Axial slice from the diffusion tensor magnetic resonance imaging of a healthy volunteer, shown as a fractional anisotropymap (A) and as a color by orientation (CBO) map (B). In both images, a manually drawn labeled atlas of the major fiber tracts is su-perimposed.The fiber tracts were identified based on the information provided by the CBO map. In this way, the tracts were drawnon every single slice in which they appeared. (C) This figure illustrates white matter fiber tracts in 2 ways. Some white matter fibertracts generated by streamline tractography are visualized as thin lines (blue for fibers associated with the corpus callosum andpeach for fibers generated in the pons and continuing into the medial pedunculi of the cerebellum). In joint analysis of DT-MRI andconventional MRI, it is of interest to associate particular voxels of the conventional MRI with streamline tractography from particu-lar regions and, in doing so, to define volumetric regions of interest. In this figure, several such white matter regions are visualizedas color-coded solid 3-dimensional models.
A B
C

on the type, appearance, and enhancement of MS lesionsand/or their location in different brain structures havealso been found.
The integration of both DT- and conventional MRImeasures together with connectivity-based regionalassessment and the development of novel image analysisand visualization techniques could provide better meansto understand the nature and the location of WM abnor-malities. The relationship between WM disruption, WMconnectivity, and clinical measures will potentially allowclinicians to better correlate fiber tract disruption and MSsymptoms such as cognitive impairment. Furthermore, itwould ultimately lead to improved monitoring ofpatients, better prediction of the course of the disease, andmore rapid assessment of new treatments or therapies.
This work was partially supported by grants NIH-R21MH067054,NIH-P41RR13218, NIH-R01LM007861; National Multiple SclerosisSociety Award No. RG 3478A2/2; Whitaker Foundation ResearchGrant, NSF ITR 0426558; and a research grant from CIMIT. This sup-plement was supported by an educational grant from Teva Neurosci-ence. BioScience Communications contributed to the editorial refine-ment of this article and to the production of this supplement. Authorsmay have accepted honoraria for their supplement contributions.
76S Journal of Neuroimaging Supplement to Vol 15 No 4
Table 1. Minimum, Maximum, and x ± SD for the FA, ADC,Linear, Planar, and Spherical Measurements for anIdentified MS Lesion
Inside the Lesion’s Lesion’sLesion Periphery Mirror Image
FAMin 0.102 0.133 0.120Max 0.585 0.600 0.590x ± SD 0.344 ± 0.092 0.395 ± 0.084 0.385 ± 0.092
ADC (× 10–3 mm2/s)Min 0.840 0.745 0.798Max 1.511 1.280 1.196x ± SD 1.230 ± 0.150 1.023 ± 0.101 1.000 ± 0.070
LinearMin 0.015 0.024 0.001Max 0.278 0.374 0.293x ± SD 0.137 ± 0.057 0.156 ± 0.069 0.132 ± 0.064
PlanarMin 0.008 0.011 0.021Max 0.515 0.661 0.664x ± SD 0.190 ± 0.115 0.243 ± 0.145 0.285 ± 0.132
SphericalMin 0.300 0.223 0.229Max 0.874 0.853 0.847x ± SD 0.644 ± 0.116 0.566 ± 0.120 0.550 ± 0.125
FA = fractional anisotropy, ADC = apparent diffusion coefficient, MS =multiple sclerosis. Measurements were obtained from inside the lesion,the lesion’s periphery, and the lesion’s mirror-image area.
Fig 3. (A) The baseline source of the diffusion tensor magnetic resonance imaging scan of a patient with multiple sclerosis pre-senting with white matter (WM) lesions. (B) Diffusion tensors represented as glyphs and color coded by the degree of isotropy ofthe local diffusion tensor: red where the diffusion is most isotropic and blue where the diffusion is most anisotropic.Note that the WMlesions present an increased isotropic diffusion.Results in Table 1 correspond to the WM lesion on the left hemisphere (arrow).
A B

Goldberg-Zimring et al: Diffusion Tensor MRI in MS 77S
Fig 4. A multiple sclerosis (MS) lesion (yellow) and an apparent area of normal-appearing white matter (NAWM;blue) detectedin the posterior part of the corpus callosum. Different from the MS lesion, which can be observed in conventional magnetic reso-nance images (MRIs) (A) and diffusion tensor (DT)–MRI–derived maps such as fractional anisotropy (B), the NAWM can be ob-served only from DT-MRI–derived color by orientation maps (C).
A B
C

References
1. Truyen L, van Waesberghe JH, van Walderveen MA, et al.Accumulation of hypointense lesions (“black holes”) on T1spin-echo MRI correlated with disease progression in multi-ple sclerosis. Neurology 1996;47:1469-1476.
2. Filippi M, Rocca MA, Martino G, Horsfield MA, Comi G.Magnetization transfer changes in the normal appearingwhite matter precede the appearance of enhancing lesions
in patients with multiple sclerosis. Ann Neurol 1998;43:809-814.
3. Horsfield MA, Barker GJ, Barkhof F, Miller DH, ThompsonAJ, Filippi M. Guidelines for using quantitative magnetiza-tion transfer magnetic resonance imaging for monitoringtreatment of multiple sclerosis. J Magn Reson Imaging2003;17:389-397.
4. Horsfield MA. Magnetization transfer imaging in multiplesclerosis. J Neuroimaging 2005;15(suppl 1):58S-67S.
78S Journal of Neuroimaging Supplement to Vol 15 No 4
Fig 5. (A) Tractography of the posterior part of the corpus callosum, which is disrupted by a multiple sclerosis lesion (yellow)and an apparent area of normal-appearing white matter (NAWM; blue, see also Fig 3). (B) A magnified view of the fibers clearlypassing through the lesion and the NAWM. (C) Changes in fractional anisotropy (FA) measured along the fibers tracts depicted in(A).These changes are represented as the mean (solid line) ± standard deviation (dashed lines).Position from the brain midline isindicated on the abscissa.The significant drop in the FA value corresponds to the lesion (yellow in [A] and [B]), while the slight dropcorresponds to the apparent area of NAWM (blue in [A] and [B]).
–15 –10 –5 0 5 10 150.4
0.5
0.6
0.7
0.8
0.9
1.0
Position along the Tract (mm)
Frac
tiona
l Ani
sotro
py Lesion
A B
C

5. Pierpaoli C, Jezzard P, Basser PJ, Barnett A, Di Chiro G. Dif-fusion tensor MR imaging of the human brain. Radiology1996;201:637-648.
6. Filippi M, Cercignani M, Inglese M, Horsfield MA, Comi G.Diffusion tensor magnetic resonance imaging in multiplesclerosis. Neurology 2001;56:304-311.
7. Filippi M, Inglese M. Overview of diffusion-weighted mag-netic resonance studies in multiple sclerosis. J Neurol Sci2001;186:S37-S43.
8. Horsfield MA. Using diffusion-weighted MRI inmulticenter clinical trials for multiple sclerosis. J Neurol Sci2001;186:S51-S54.
9. Horsfield MA, Jones DK. Applications of diffusion-weighted and diffusion tensor MRI to white matter diseases:a review. NMR Biomed 2002;15:570-577.
10. Filippi M, Iannucci G, Cercignani M, Assunta Rocca M,Pratesi A, Comi G. A quantitative study of water diffusion inmultiple sclerosis lesions and normal-appearing white mat-ter using echo-planar imaging. Arch Neurol 2000;57:1017-1021.
11. Ciccarelli O, Werring DJ, Wheeler-Kingshott CA, et al.Investigation of MS normal-appearing brain using diffusiontensor MRI with clinical correlations. Neurology2001;56:926-933.
12. Tamura H, Takahashi S, Kurihara N, Yamada S, Hatazawa J,Okudera T. Practical visualization of internal structure ofwhite matter for image interpretation: staining a spin-echoT2-weighted image with three echo-planar diffusion-weighted images. AJNR Am J Neuroradiol 2003;24:401-409.
13. Rocca MA, Iannucci G, Rovaris M, Comi G, Filippi M.Occult tissue damage in patients with primary progressivemultiple sclerosis is independent of T2-visible lesions—a dif-fusion tensor MR study. J Neurol 2003;250:456-460.
14. Fu L, Matthews PM, De Stefano N, et al. Imaging axonaldamage of normal-appearing white matter in multiple scle-rosis. Brain 1998;121:103-113.
15. Pelletier D, Nelson SJ, Oh J, et al. MRI lesion volume heter-ogeneity in primary progressive MS in relation with axonaldamage and brain atrophy. J Neurol Neurosurg Psychiatry2003;74:950-952.
16. Narayana PA. Magnetic resonance spectroscopy in themonitoring of multiple sclerosis. J Neuroimaging 2005;15(suppl 1):46S-57S.
17. Rovaris M, Iannucci G, Falautano M, et al. Cognitive dys-function in patients with mildly disabling relapsing-remit-ting multiple sclerosis: an exploratory study with diffusiontensor MR imaging. J Neurol Sci 2002;195:103-109.
18. Wilson M, Tench CR, Morgan PS, Blumhardt LD. Pyrami-dal tract mapping by diffusion tensor magnetic resonanceimaging in multiple sclerosis: improving correlations withdisability. J Neurol Neurosurg Psychiatry 2003;74:203-207.
19. Khouri SJ, Guttmann CRG, Orav EJ, et al. LongitudinalMRI imaging in multiple sclerosis: correlation between dis-ability and lesion burden. Neurology 1994;44:2120-2124.
20. Lin X, Tench CR, Morgan PS, Niepel G, ConstantinescuCS. “Importance sampling” in MS: use of diffusion tensortractography to quantify pathology related to specificimpairment. J Neurol Sci 2005;237:13-19.
21. Liu L, Meier D, Polgar-Turcsanyi M, Karkocha P, Bakshi R,Guttmann CRG. Multiple sclerosis medical image analysisand information management. J Neuroimaging 2005;15(suppl1):103S-117S.
22. Ford BJ. Brownian movement in Clarkia pollen: a reprise ofthe first observations. The Microscope 1992;40:235-241. Avail-able at: http://www.brianjford.com/wbbrowna.htm.Accessed September 27, 2005.
23. Einstein A. Investigations on the theory of the Brownianmovement. Fürth R, ed; Cowper AD, trans-ed. Mineola,NY: Dover; 1956:1-18. Avai lable at : ht tp://lorentz.phl.jhu.edu/AnnusMirabilis/AeReserveArticles/eins_brownian.pdf. Accessed September 27, 2005.
24. Sutherland W. A dynamical theory of diffusion fornonelectrolytes and the molecular mass of albumin. Philo-sophical Magazine 1905;S6:781-785.
25. Pais A. Subtle Is the Lord: The Science and the Life of Albert Ein-stein. New York, NY: Oxford University Press; 1982.
26. Stejskal EO, Tanner JE. Spin diffusion measurements: spinechoes in the presence of a time-dependent field gradient.J Chem Phys 1965;42:288-292.
27. Le Bihan D, Breton E, Lallemand D, Grenier P, Cabanis E,Laval-Jeantet M. MR imaging of intravoxel incoherentmotions: application of diffusion and perfusion in neuro-logic disorders. Radiology 1986;161:401-407.
28. Basser PJ, Jones DK. Diffusion-tensor MRI: theory, experi-mental design and data analysis—a technical review. NMRBiomed 2002;15:456-467.
29. Moseley ME, Cohen Y, Mintorovitch J, et al. Early detec-tion of regional cerebral ischemia in cats: comparison of dif-fusion- and T2-weighted MRI and spectroscopy. Magn ResonMed 1990;14:330-346.
30. Warach S, Chien D, Li W, Ronthal M, Edelman RR. Fastmagnetic resonance diffusion-weighted imaging of acutehuman stroke. Neurology 1992;42:1717-1723.
31. Warach S, Gaa J, Siewert B, Wielopolski P, Edelman RR.Acute human stroke studied by whole brain echo planar dif-fusion-weighted magnetic resonance imaging. Ann Neurol1995;37:231-241.
32. Basser PJ, Mattiello J, LeBihan D. MR diffusion tensor spec-troscopy and imaging. Biophys J 1994;66:259-267.
33. Beaulieu C, Allen PS. Determinants of anisotropic water dif-fusion in nerves. Magn Reson Med 1994;31:394-400.
34. Larsson HBW, Thomsen C, Frederiksen J, Stubgaard M,Henriksen O. In vivo magnetic resonance diffusion mea-surements in the brain of patients with multiple sclerosis.Magn Reson Imaging 1992;10:7-12.
35. Droogan AG, Clark CA, Werring DJ, Barker GJ, McDonaldWI, Miller DH. Comparison of multiple sclerosis clinicalsubgroups using navigated spin echo diffusion-weightedimaging. Magn Reson Imaging 1999;17:653-661.
36. Roychowdhury S, Maldjian JA, Grossman RI. Multiple scle-rosis: comparison of trace apparent diffusion coefficientwith MR enhancement pattern of lesions. AJNR Am JNeuroradiol 2000;21:869-874.
37. Werring DJ, Brassat D, Droogan AG, et al. The pathogenesisof lesion and normal-appearing white matter changes inmultiple sclerosis: a serial diffusion MRI study. Brain2000;123:1667-1676.
38. Rocca MA, Cercignani M, Iannucci G, Comi G, Filippi M.Weekly diffusion-weighted imaging of normal-appearingwhite matter in MS. Neurology 2000;55:882-884.
39. Caramia F, Pantano P, Di Legge S, et al. A longitudinal studyof MR diffusion changes in normal appearing white matterof patients with early multiple sclerosis. Magn Reson Imaging2002;20:383-388.
Goldberg-Zimring et al: Diffusion Tensor MRI in MS 79S

40. Schmierer K, Altmann DR, Kassim N, et al. Progressivechange in primary progressive multiple sclerosis normal-appearing white matter: a serial diffusion magnetic reso-nance imaging study. Mult Scler 2004;10:182-187.
41. Cercignani M, Bozzali M, Iannucci G, Comi G, Filippi M.Magnetization transfer ratio and mean diffusivity of normalappearing white and grey matter from patients with multiplesclerosis. J Neurol Neurosurg Psychiatry 2001;70:311-317.
42. Fabiano AJ, Sharma J, Weinstock-Guttman B, et al.Thalamic involvement in multiple sclerosis: a diffusion-weighted magnetic resonance imaging study. J Neuroimaging2003;13:307-314.
43. Westin CF, Maier SE, Mamata H, Nabavi A, Jolesz FA,Kikinis R. Processing and visualization for diffusion tensorMRI. Med Image Anal 2002;6:93-108.
44. Werring DJ, Clark CA, Barker GJ, Thompson AJ, MillerDH. Diffusion tensor imaging of lesions and normal-appear-ing white matter in multiple sclerosis. Neurology1999;52:1626-1632.
45. Bammer R, Augustin M, Strasser-Fuchs S, et al. Magneticresonance diffusion tensor imaging for characterizing dif-fuse and focal white matter abnormalities in multiple sclero-sis. Magn Reson Med 2000;44:583-591.
46. Peled S, Gudbjartsson H, Westin CF, Kikinis R, Jolesz FA.Magnetic resonance imaging shows orientation and asym-metry of white matter fiber tracts. Brain Res 1998;780:27-33.
47. Westin CF, Maier S, Khidhir B, Everett P, Jolesz F, Kikinis R.Image processing for diffusion tensor magnetic resonanceimaging. Paper presented at: Second International Confer-ence on Medical Image Computing and Computer-AssistedIntervention; September 19-22, 1999; Cambridge, UK.
48. Mamata H, Mamata Y, Westin CF, et al. High-resolutionline scan diffusion tensor MR imaging of white matter fibertract anatomy. AJNR Am J Neuroradiol 2002;23:67-75.
49. Basser PJ, Pajevic S, Pierpaoli C, Duda J, Aldroubi A. Invivo fiber tractography using DT-MRI data. Magn Reson Med2000;44:625-632.
50. Conturo TE, Lori NF, Cull TS, et al. Tracking neuronal fiberpathways in the living human brain. Proc Natl Acad Sci U S A1999;96:10422-10427.
51. Jones DK, Simmons A, Williams SCR, Horsfield MA. Non-invasive assessment of axonal fiber connectivity in thehuman brain via diffusion tensor MRI. Magn Reson Med1999;42:37-41.
52. Mori S, Kaufmann WE, Davatzikos C, et al. Imaging corticalassociation tracts in the human brain using diffusion-tensor-based axonal tracking. Magn Reson Med 2002;47:215-223.
53. Wakana S, Jiang H, Nagae-Poetscher LM, van Zijl PCM,Mori S. Fiber tract-based atlas of human white matter anat-omy. Radiology 2004;230:77-87.
54. Jones DK, Griffin LD, Alexander DC, et al. Spatial normal-ization and averaging of diffusion tensor MRI data sets.Neuroimage 2002;17:592-617.
55. Catani M, Howard RJ, Pajevic S, Jones DK. Virtual in vivointeractive dissection of white matter fasciculi in the humanbrain. Neuroimage 2002;17:77-94.
56. Guimond A, Meunier J, Thirion J-P. Average brain models:a convergence study. Comput Vis Image Underst 1999;77:192-210.
57. Park HJ, Kubicki M, Shenton ME, et al. Spatial normaliza-tion of diffusion tensor MRI using multiple channels.Neuroimage 2003;20:1995-2009.
58. Kealy SM, Kim Y, Whiting WL, Madden DJ, ProvenzaleJM. Determination of multiple sclerosis plaque size with dif-fusion-tensor MR imaging: comparison study with healthyvolunteers. Radiology 2005;236:615-620.
59. Kealy SM, Kim Y, Provenzale JM. Redefinition of multiplesclerosis plaque size using diffusion tensor MRI. AJR Am JRoentgenol 2004;183:497-503.
60. Guo AC, MacFall JR, Provenzale JM. Multiple sclerosis: dif-fusion tensor MR imaging for evaluation of normal-appear-ing white matter. Radiology 2002;222:729-736.
61. Henry RG, Oh J, Nelson SJ, Pelletier D. Directional diffu-sion in relapsing-remitting multiple sclerosis: a possible invivo signature of Wallerian degeneration. J Magn Reson Imag-ing 2003;18:420-426.
62. Coombs BD, Best A, Brown MS, et al. Multiple sclerosispathology in the normal and abnormal appearing whitematter of the corpus callosum by diffusion tensor imaging.Mult Scler 2004;10:392-397.
63. Hasan KM, Gupta RK, Santos RM, Wolinsky JS, NarayanaPA. Diffusion tensor fractional anisotropy of the normal-appearing seven segments of the corpus callosum in healthyadults and relapsing-remitting multiple sclerosis patients.J Magn Reson Imaging 2005;21:735-743.
64. Mezzapesa DM, Rocca MA, Falini A, et al. A preliminarydiffusion tensor and magnetization transfer magnetic reso-nance imaging study of early-onset multiple sclerosis. ArchNeurol 2004;61:366-368.
65. Griffin CM, Chard DT, Ciccarelli O, et al. Diffusion tensorimaging in early relapsing-remitting multiple sclerosis. MultScler 2001;7:290-297.
66. Rashid W, Hadjiprocopis A, Griffin CM, et al. Diffusion ten-sor imaging of early relapsing-remitting multiple sclerosiswith histogram analysis using automated segmentation andbrain volume correction. Mult Scler 2004;10:9-15.
67. Ge Y, Law M, Johnson G, et al. Preferential occult injury ofcorpus callosum in multiple sclerosis measured by diffusiontensor imaging. J Magn Reson Imaging 2004;20:1-7.
68. Cercignani M, Bozzali M, Iannuci G, Comi G, Filippi M.Intra-voxel and inter-voxel coherence in patients with mul-tiple sclerosis assessed using diffusion tensor MRI. J Neurol2002;249:875-883.
69. Rovaris M, Bozzali M, Iannucci G, et al. Assessment of nor-mal-appearing white and gray matter in patients with pri-mary progressive multiple sclerosis: a diffusion-tensor mag-netic resonance imaging study. Arch Neurol 2002;59:1406-1412.
70. Bozzali M, Cercignani M, Sormani MP, Comi G, Filippi M.Quantification of brain gray matter damage in different MSphenotypes by use of diffusion tensor MR imaging. AJNRAm J Neuroradiol 2002;23:985-988.
71. Cassol E, Ranjeva JP, Ibarrola D, et al. Diffusion tensorimaging in multiple sclerosis: a tool for monitoring changesin normal-appearing white matter. Mult Scler 2004;10:188-196.
72. Rovaris M, Iannucci G, Falautano M, et al. Cognitive dys-function in patients with mildly disabling relapsing-remit-ting multiple sclerosis: an exploratory study with diffusiontensor MR imaging. J Neurol Sci 2002;103-109.
73. Viola P, Wells WM. Alignment by maximization of mutualinformation. International Journal of Computer Vision1997;24:137-154.
80S Journal of Neuroimaging Supplement to Vol 15 No 4
74. Ourselin S, Roche A, Subsol G, Pennec X, Ayache N.Reconstructing a 3D structure from serial histological sec-tions. Image and Vision Computing 2000;19:25-31.
75. Zivadinov R, Leist TP. Clinical–magnetic resonance imag-ing correlations in multiple sclerosis. J Neuroimaging2005;15(suppl 1):10S-21S.
76. Warfield S, Dengler J, Zaers J, et al. Automatic identificationof grey matter structures from MRI to improve the segmen-
tation of white matter lesions. J Image Guid Surg 1995;1:326-338.
77. Maddah M, Mewes AUJ, Haker S, Grimson WEL, WarfieldSK. Automated atlas-based clustering of white matter fibertracts from DTMRI. Paper presented at: Eighth Interna-tional Conference on Medical Image Computing and Com-puter-Assisted Intervention; October 26-29, 2005; PalmSprings, CA.
Goldberg-Zimring et al: Diffusion Tensor MRI in MS 81S