Diffraction Methods & Electron Microscopy Lecture 11 · Point spread function (real space)...
59
FYS 4340/9340 course – Autumn 2016 1 Diffraction Methods & Electron Microscopy Sandeep Gorantla FYS 4340/FYS 9340 Lecture 11 CONTRAST TRANSFER FUNCTION in HRTEM
Transcript of Diffraction Methods & Electron Microscopy Lecture 11 · Point spread function (real space)...
FYS 4340/9340 course – Autumn 2016 1
Diffraction Methods & Electron Microscopy
Sandeep Gorantla
FYS 4340/FYS 9340
Lecture 11
CONTRAST TRANSFER FUNCTION in
HRTEM
Resolution in HRTEM

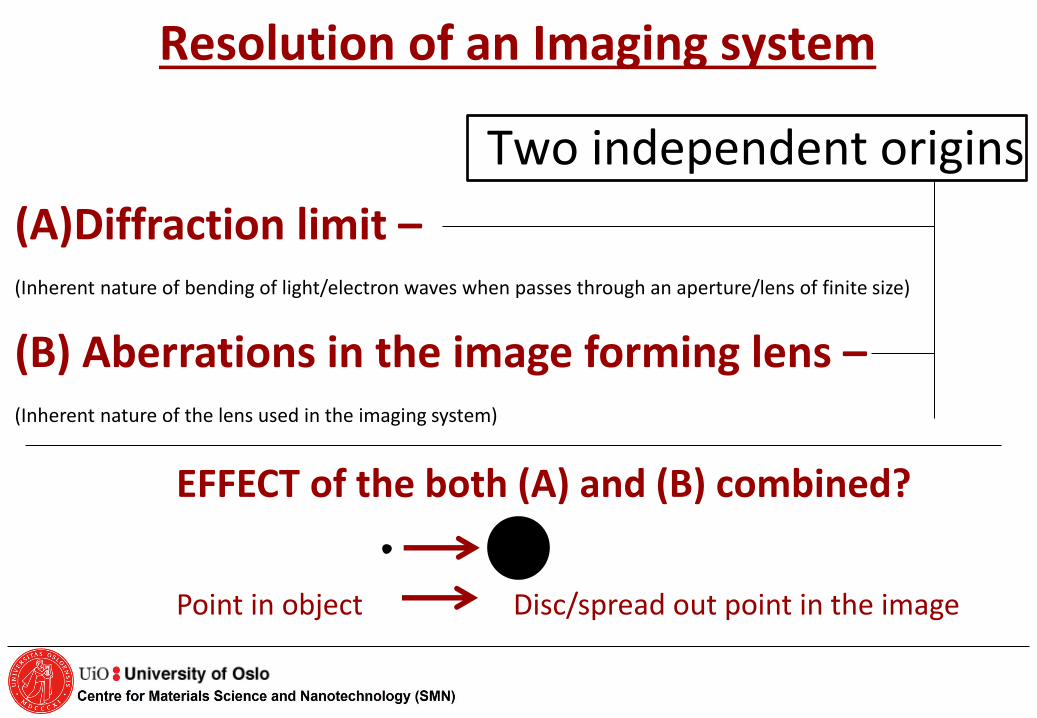
Resolution of an Imaging system
(A)Diffraction limit –
(Inherent nature of bending of light/electron waves when passes through an aperture/lens of finite size)
(B) Aberrations in the image forming lens –
(Inherent nature of the lens used in the imaging system)
Two independent origins
EFFECT of the both (A) and (B) combined? Point in object Disc/spread out point in the image
(A) Diffraction limit
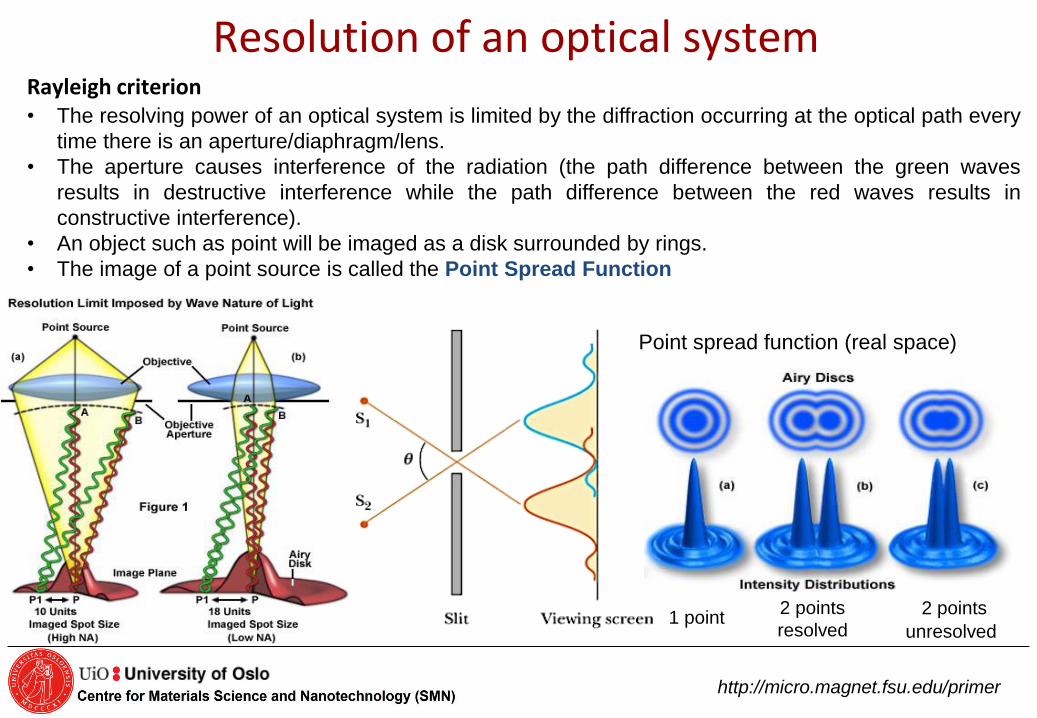
Rayleigh criterion
Resolution of an optical system
http://micro.magnet.fsu.edu/primer
• The resolving power of an optical system is limited by the diffraction occurring at the optical path every
time there is an aperture/diaphragm/lens.
• The aperture causes interference of the radiation (the path difference between the green waves
results in destructive interference while the path difference between the red waves results in
constructive interference).
• An object such as point will be imaged as a disk surrounded by rings.
• The image of a point source is called the Point Spread Function
1 point 2 points
unresolved
2 points
resolved
Point spread function (real space)
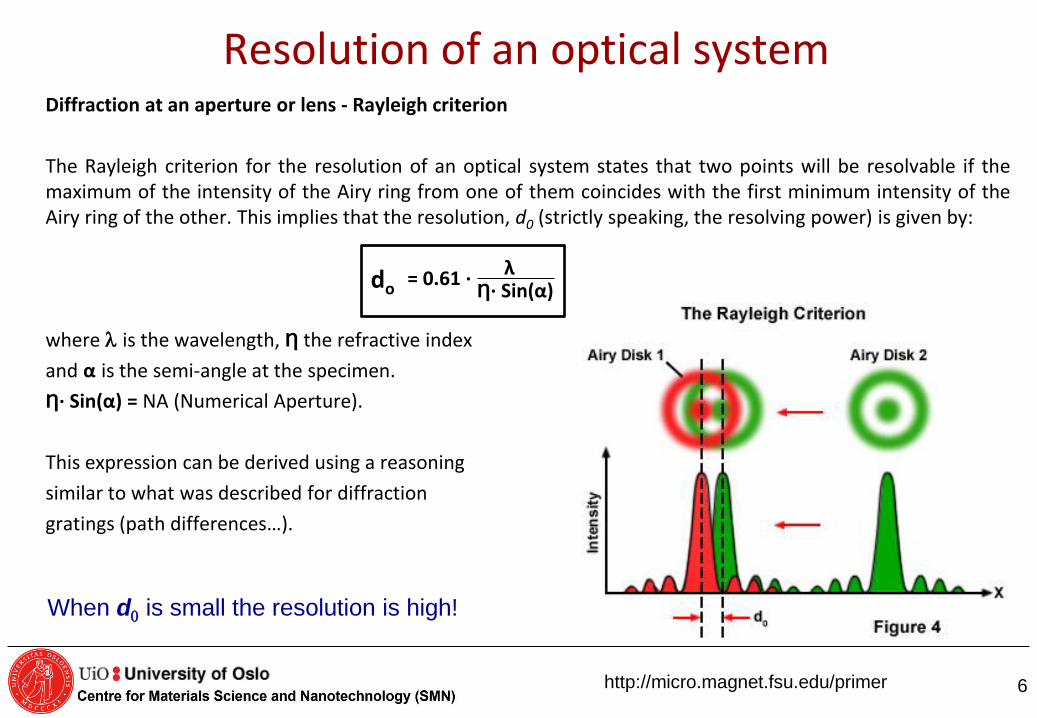
Diffraction at an aperture or lens - Rayleigh criterion
The Rayleigh criterion for the resolution of an optical system states that two points will be resolvable if the maximum of the intensity of the Airy ring from one of them coincides with the first minimum intensity of the Airy ring of the other. This implies that the resolution, d0 (strictly speaking, the resolving power) is given by:
= 0.61 ∙
where l is the wavelength, Ƞ the refractive index
and α is the semi-angle at the specimen.
Ƞ∙ Sin(α) = NA (Numerical Aperture).
This expression can be derived using a reasoning
similar to what was described for diffraction
gratings (path differences…).
Resolution of an optical system
When d0 is small the resolution is high!
6 http://micro.magnet.fsu.edu/primer
λ Ƞ∙ Sin(α) do
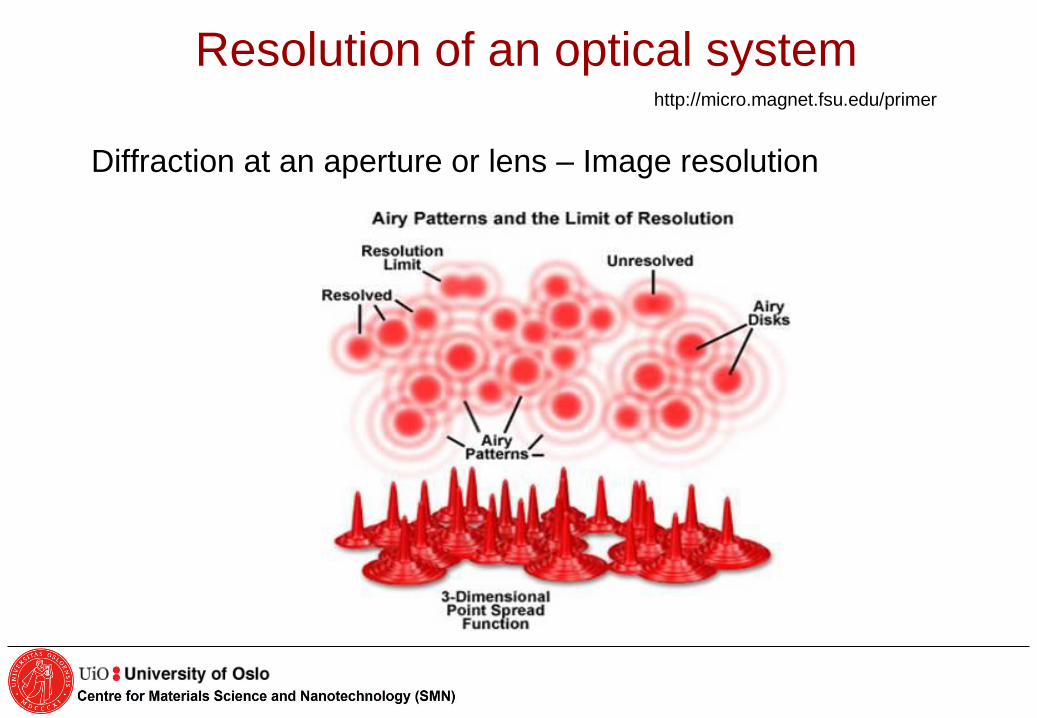
Diffraction at an aperture or lens – Image resolution
Resolution of an optical system http://micro.magnet.fsu.edu/primer
7
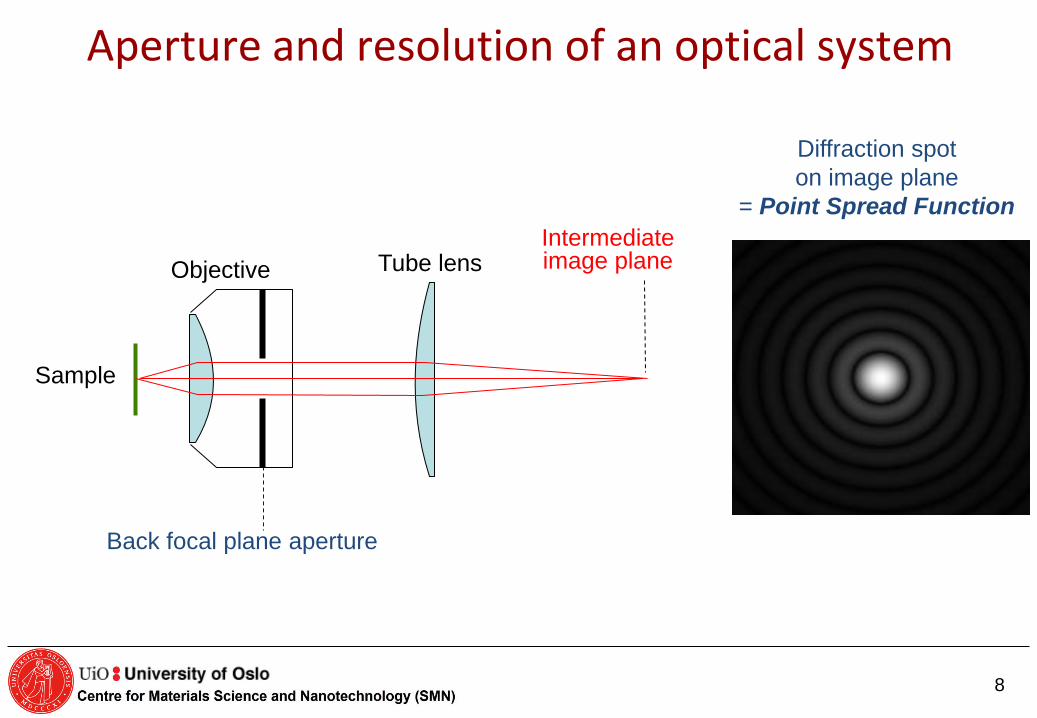
Tube lens
Back focal plane aperture
Intermediate image plane
Sample
Objective
Diffraction spot
on image plane
= Point Spread Function
Aperture and resolution of an optical system
8
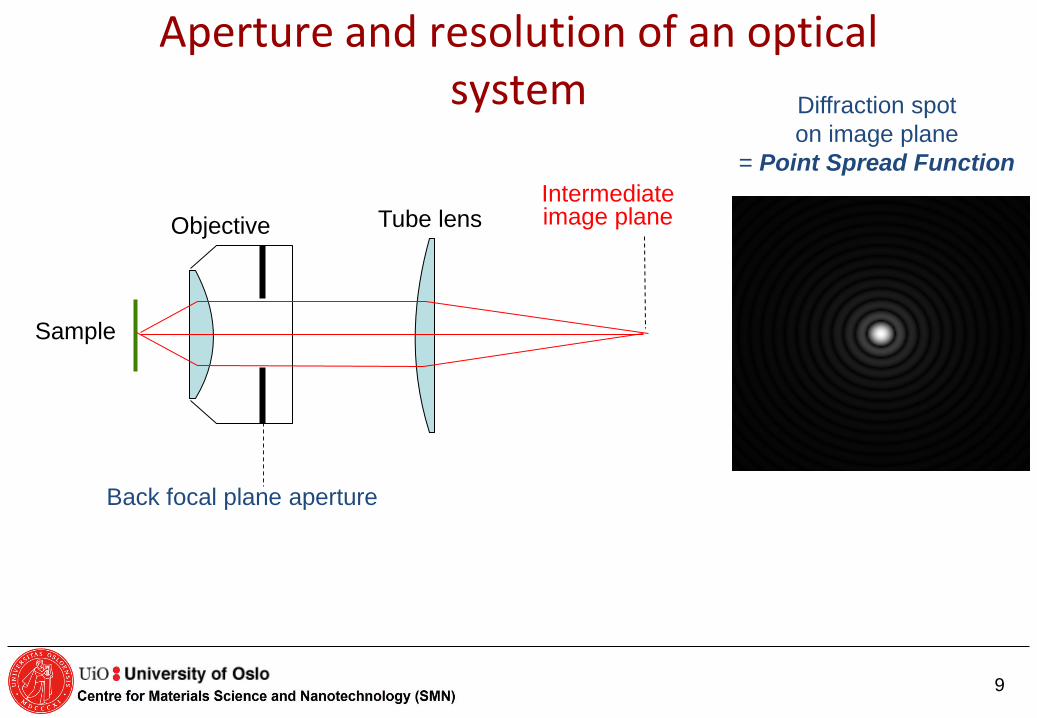
Tube lens
Back focal plane aperture
Intermediate image plane
Sample
Objective
Diffraction spot
on image plane
= Point Spread Function
Aperture and resolution of an optical system
9

Tube lens
Back focal plane aperture
Intermediate image plane
Sample
Objective
Diffraction spot
on image plane
= Point Spread Function
Aperture and resolution of an optical system
10
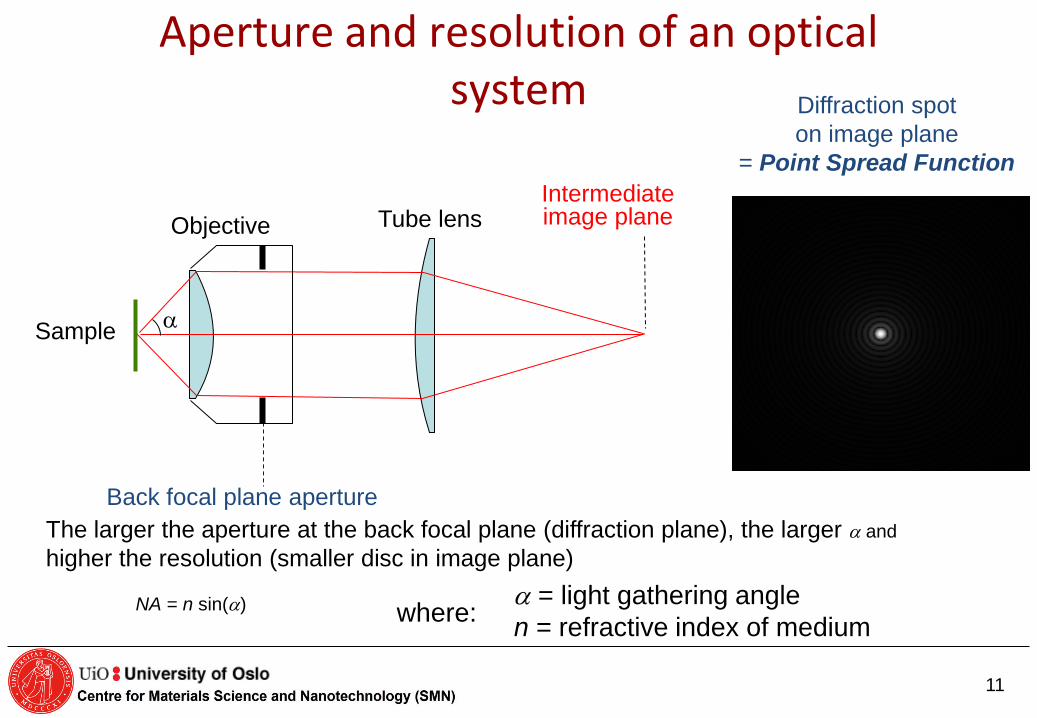
Aperture and resolution of an optical system
The larger the aperture at the back focal plane (diffraction plane), the larger and
higher the resolution (smaller disc in image plane)
Sample
Objective Tube lens
Back focal plane aperture
Intermediate image plane
NA = n sin() = light gathering angle
n = refractive index of medium where:
Diffraction spot
on image plane
= Point Spread Function
11
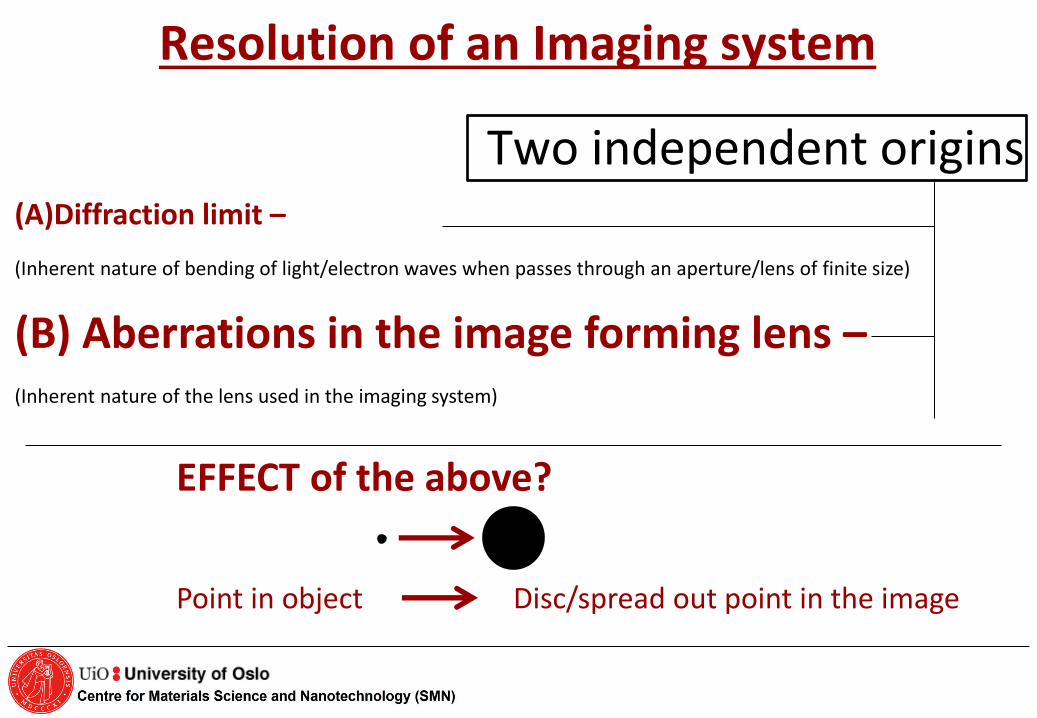
Resolution of an Imaging system
(A)Diffraction limit –
(Inherent nature of bending of light/electron waves when passes through an aperture/lens of finite size)
(B) Aberrations in the image forming lens –
(Inherent nature of the lens used in the imaging system)
Two independent origins
EFFECT of the above? Point in object Disc/spread out point in the image
(B) Aberrations in the electro magnetic lens
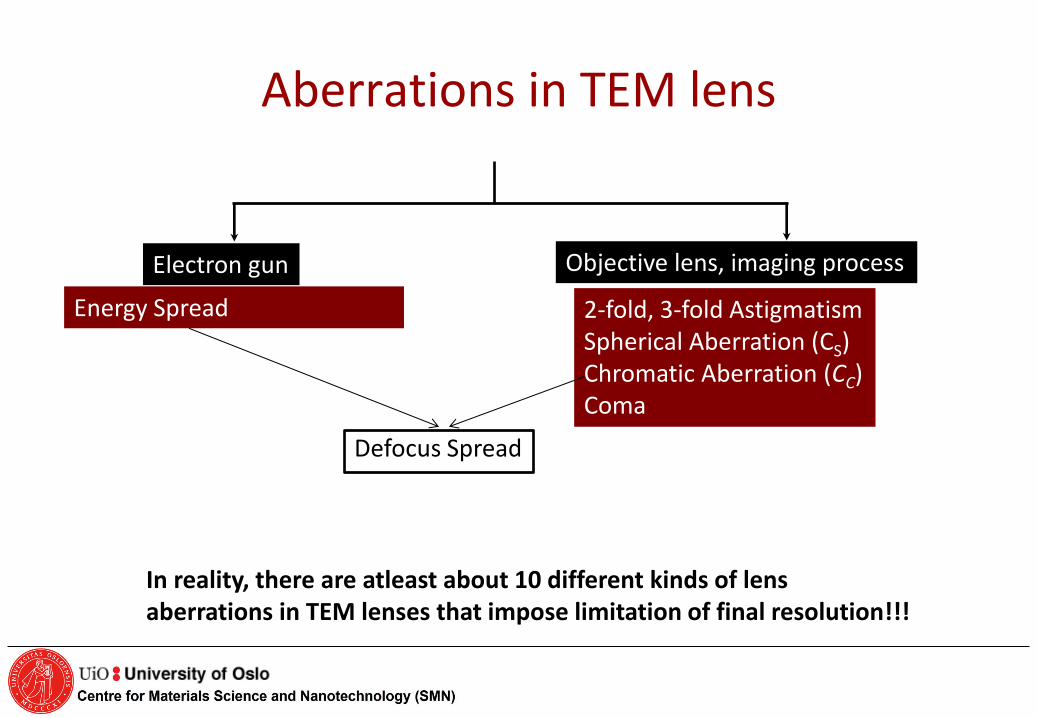
Aberrations in TEM lens
Energy Spread 2-fold, 3-fold Astigmatism Spherical Aberration (CS) Chromatic Aberration (CC) Coma
Electron gun Objective lens, imaging process
Defocus Spread
In reality, there are atleast about 10 different kinds of lens aberrations in TEM lenses that impose limitation of final resolution!!!
FYS 4340/9340 course – Autumn 2016 15
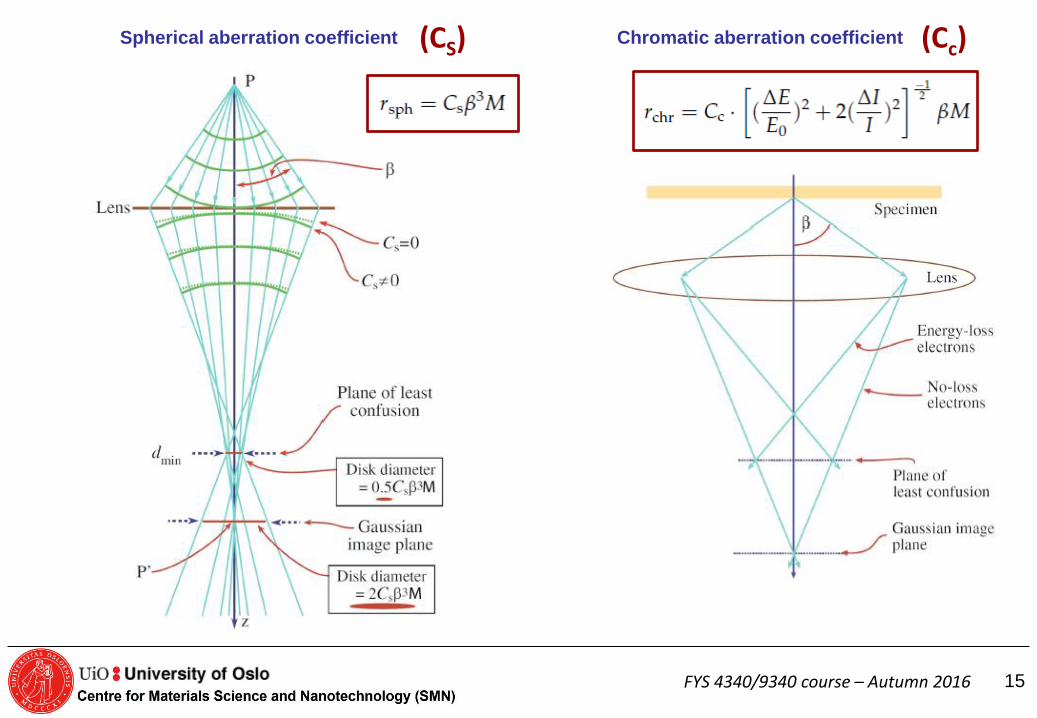
Spherical aberration coefficient Chromatic aberration coefficient (CS) (Cc)
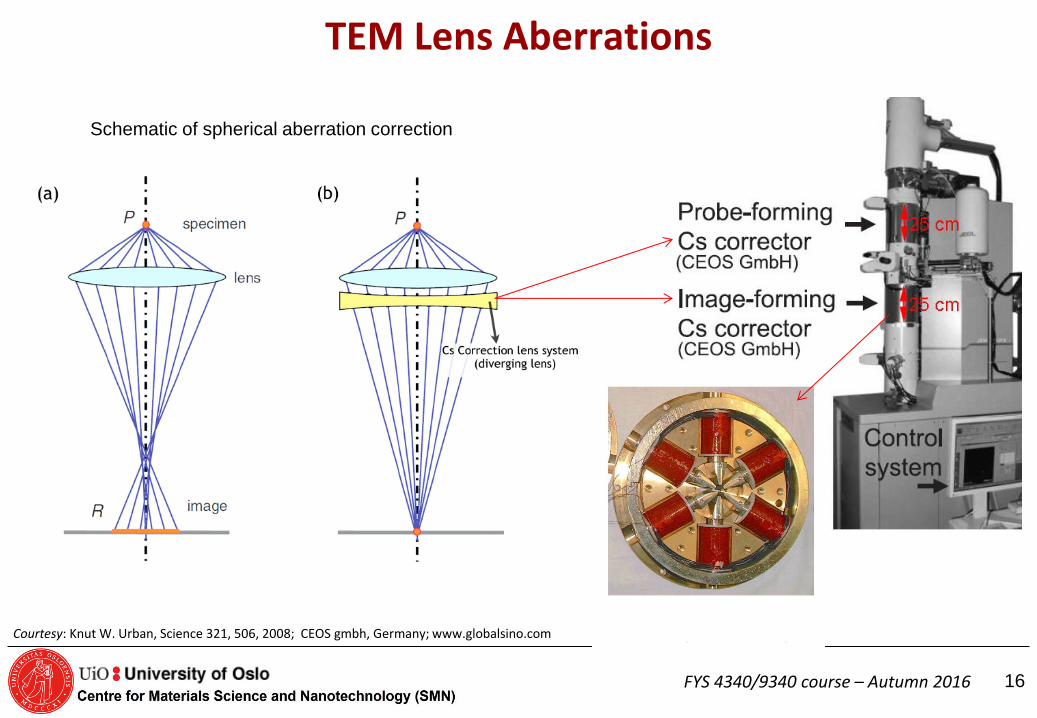
TEM Lens Aberrations
16
Schematic of spherical aberration correction
Courtesy: Knut W. Urban, Science 321, 506, 2008; CEOS gmbh, Germany; www.globalsino.com
FYS 4340/9340 course – Autumn 2016
Resolution of an Imaging system
(A)Diffraction limit –
(Inherent nature of bending of light/electron waves when passes through an aperture/lens of finite size)
(B) Aberrations in the image forming lens –
(Inherent nature of the lens used in the imaging system)
Two independent origins
EFFECT of the both (A) and (B) combined? Point in object Disc/spread out point in the image
FYS 4340/9340 course – Autumn 2016
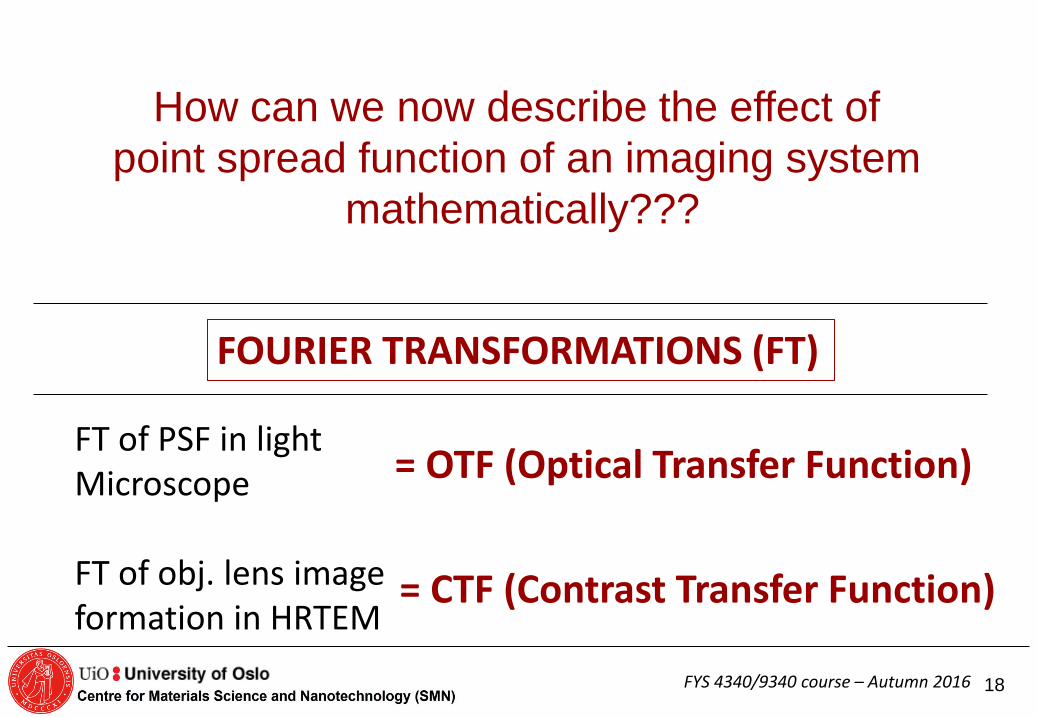
How can we now describe the effect of
point spread function of an imaging system
mathematically???
18
FT of PSF in light Microscope FT of obj. lens image formation in HRTEM
= OTF (Optical Transfer Function)
= CTF (Contrast Transfer Function)
FOURIER TRANSFORMATIONS (FT)
FYS 4340/9340 course – Autumn 2016
New concept:
Contrast Transfer Function (CTF)
19
FYS 4340/9340 course – Autumn 2016
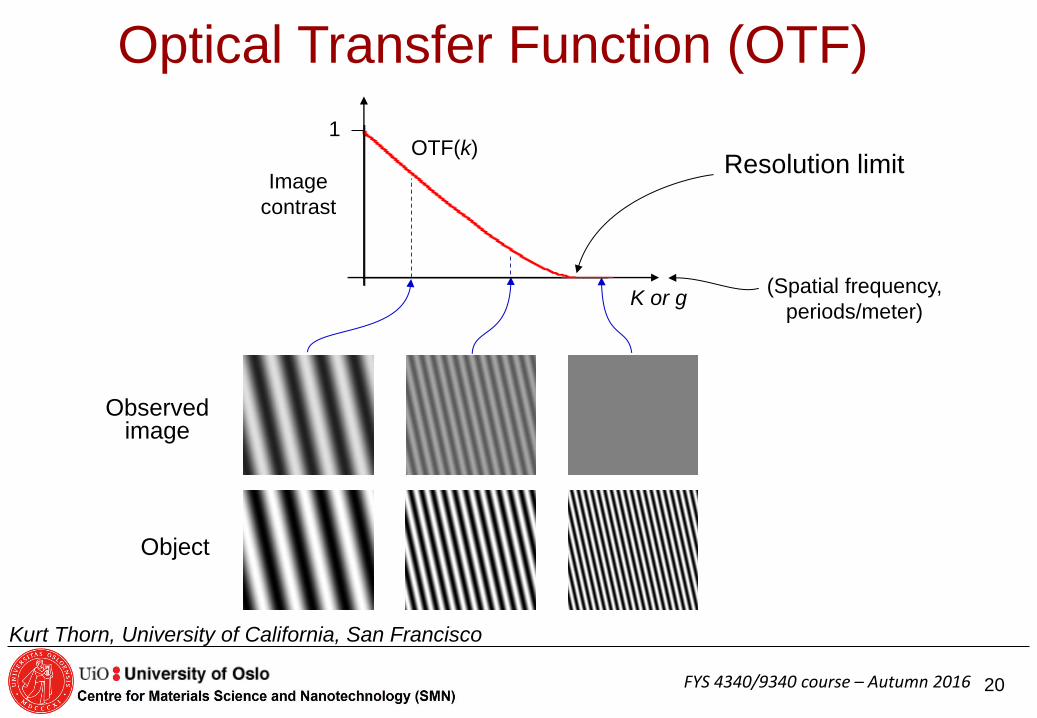
Optical Transfer Function (OTF)
Object
Observed image
(Spatial frequency,
periods/meter) K or g
OTF(k) 1
Image
contrast
Resolution limit
Kurt Thorn, University of California, San Francisco
20
FYS 4340/9340 course – Autumn 2016
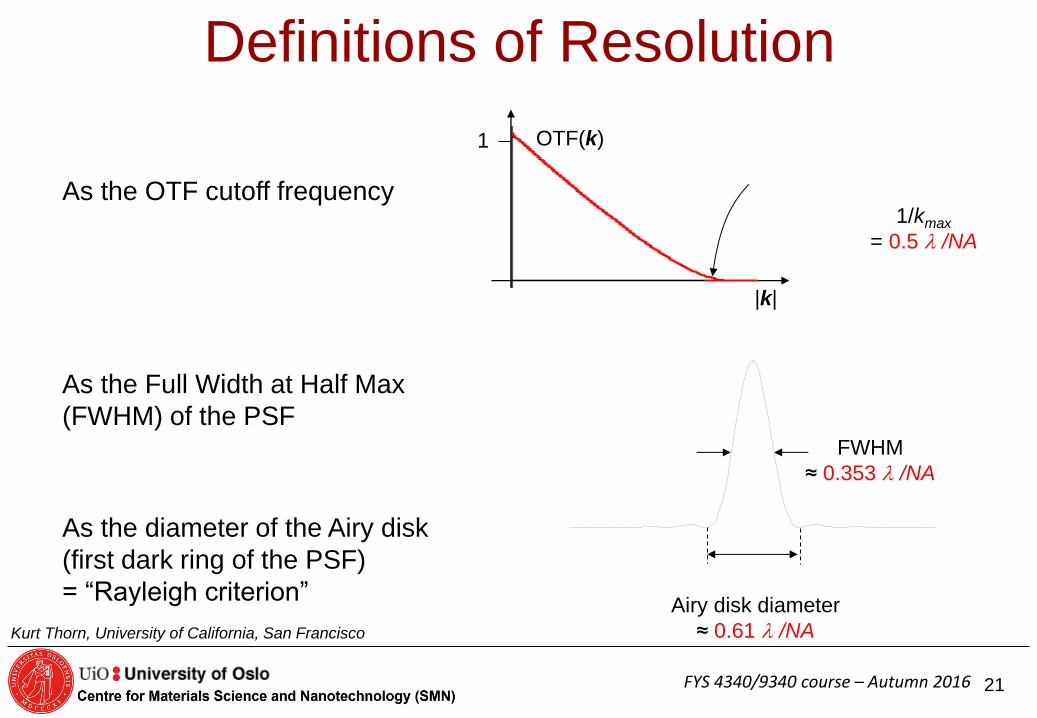
Definitions of Resolution
As the OTF cutoff frequency
As the Full Width at Half Max
(FWHM) of the PSF
As the diameter of the Airy disk
(first dark ring of the PSF)
= “Rayleigh criterion”
Kurt Thorn, University of California, San Francisco
|k|
OTF(k) 1
Airy disk diameter
≈ 0.61 l /NA
FWHM
≈ 0.353 l /NA
1/kmax
= 0.5 l /NA
21
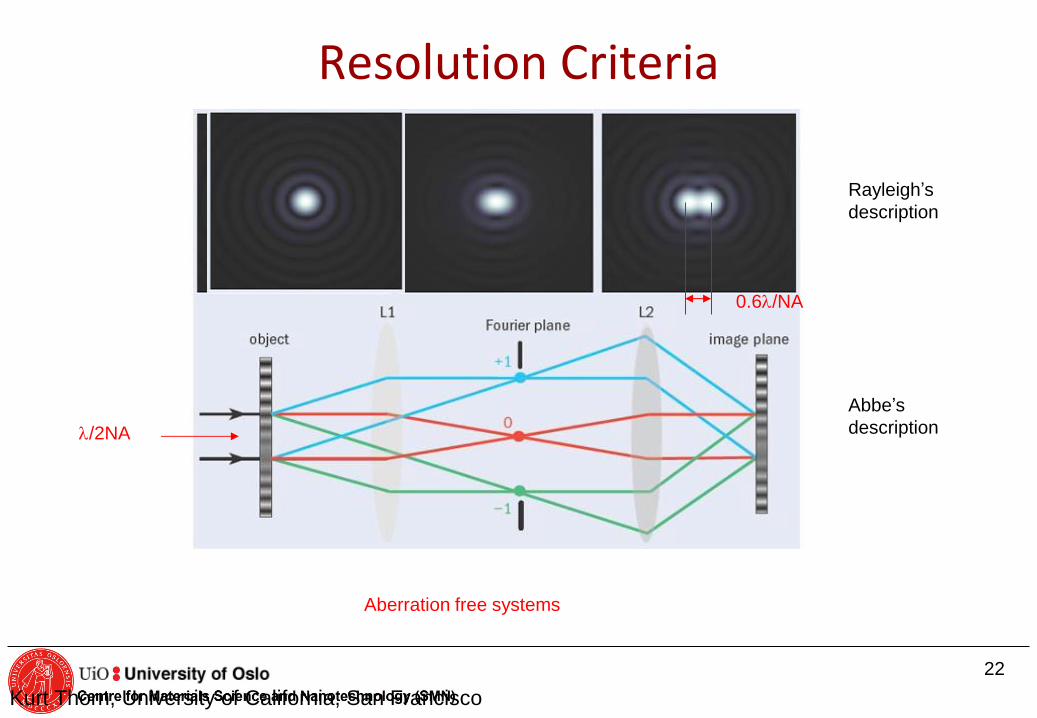
Resolution Criteria
Rayleigh’s
description
Abbe’s
description
0.6l/NA
l/2NA
Aberration free systems
Kurt Thorn, University of California, San Francisco
22
FYS 4340/9340 course – Autumn 2016
Kurt Thorn, University of California, San Francisco
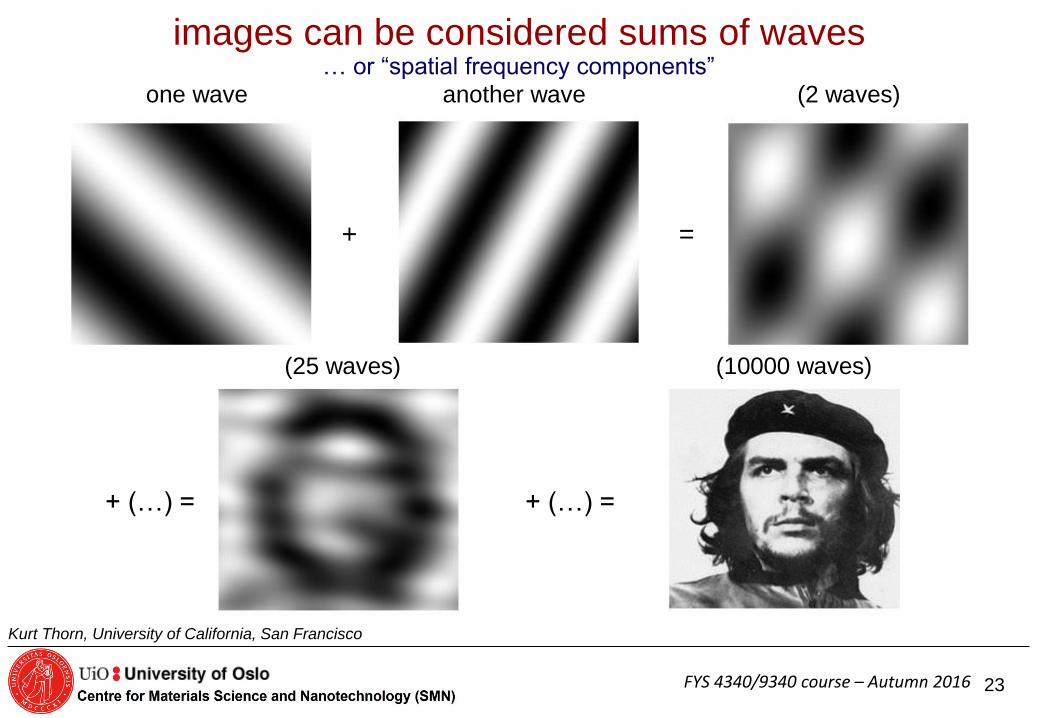
images can be considered sums of waves
another wave one wave (2 waves)
+ =
(10000 waves)
+ (…) =
… or “spatial frequency components”
(25 waves)
+ (…) =
23
FYS 4340/9340 course – Autumn 2016
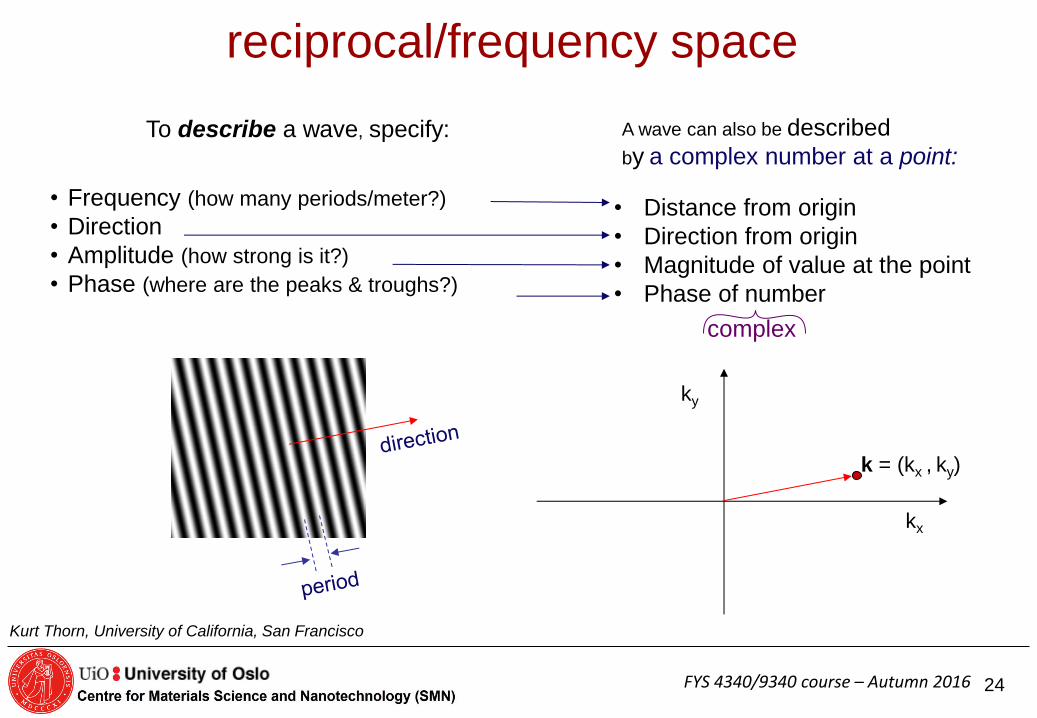
reciprocal/frequency space
• Frequency (how many periods/meter?)
• Direction
• Amplitude (how strong is it?)
• Phase (where are the peaks & troughs?)
To describe a wave, specify:
ky
kx
• Distance from origin
• Direction from origin
• Magnitude of value at the point
• Phase of number
A wave can also be described
by a complex number at a point:
complex
k = (kx , ky)
Kurt Thorn, University of California, San Francisco
24
FYS 4340/9340 course – Autumn 2016
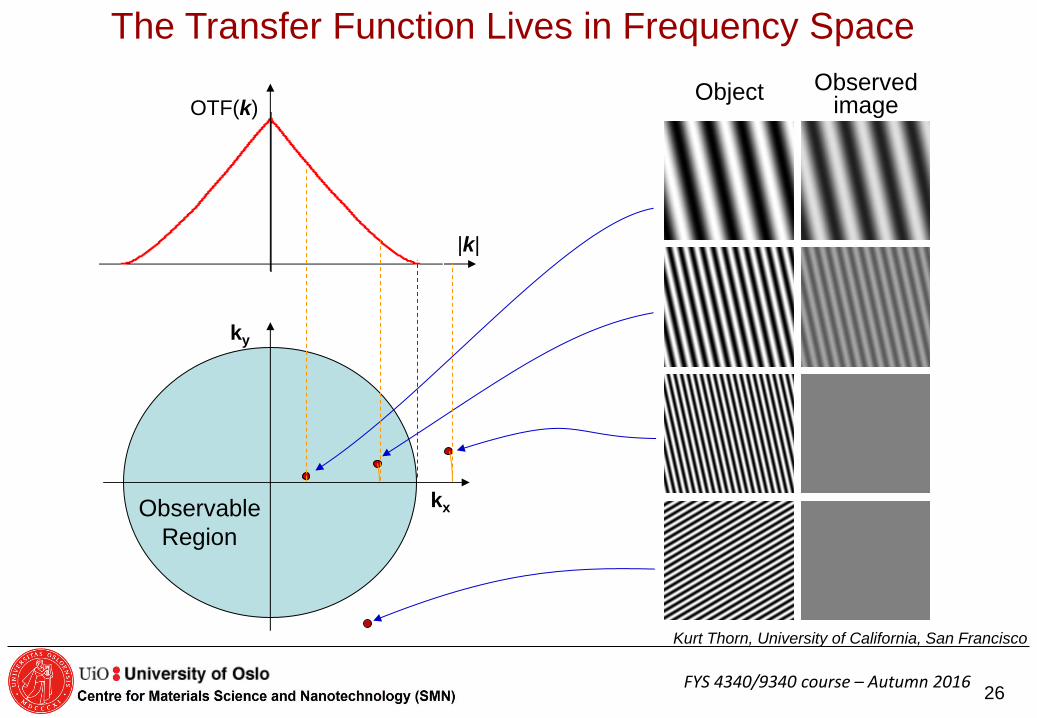
The Transfer Function Lives in Frequency Space
Observable
Region
ky
kx
Object
|k|
OTF(k) Observed
image
Kurt Thorn, University of California, San Francisco
26
FYS 4340/9340 course – Autumn 2016
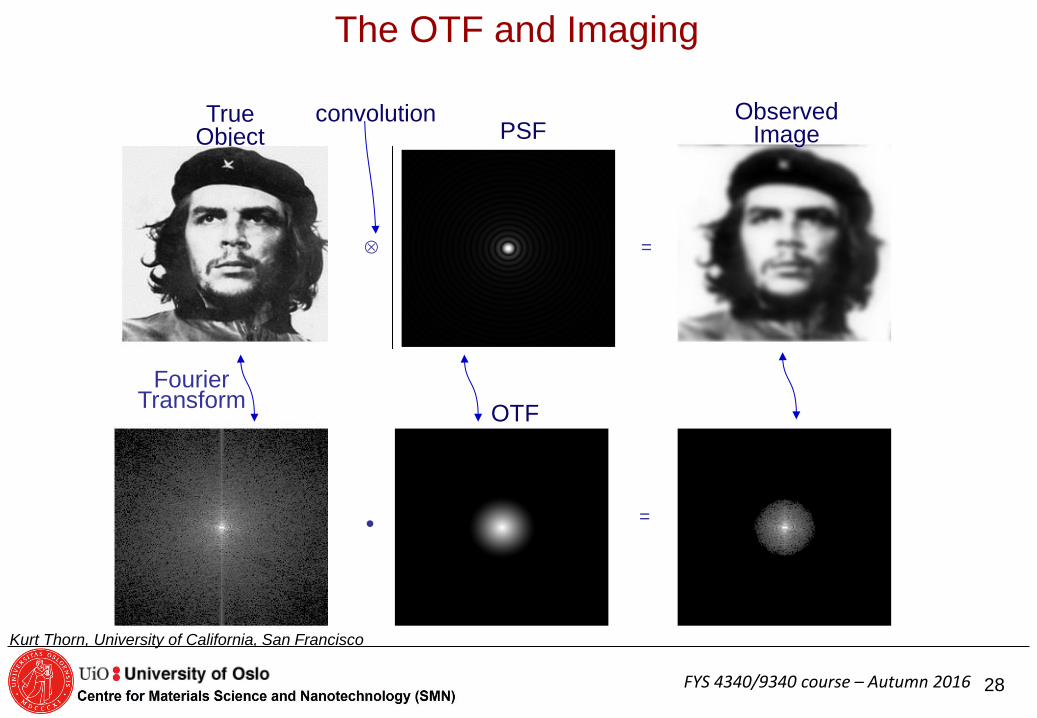
The OTF and Imaging
Fourier Transform
True Object
Observed Image
OTF
=
= ?
convolution PSF
Kurt Thorn, University of California, San Francisco
28
FYS 4340/9340 course – Autumn 2016
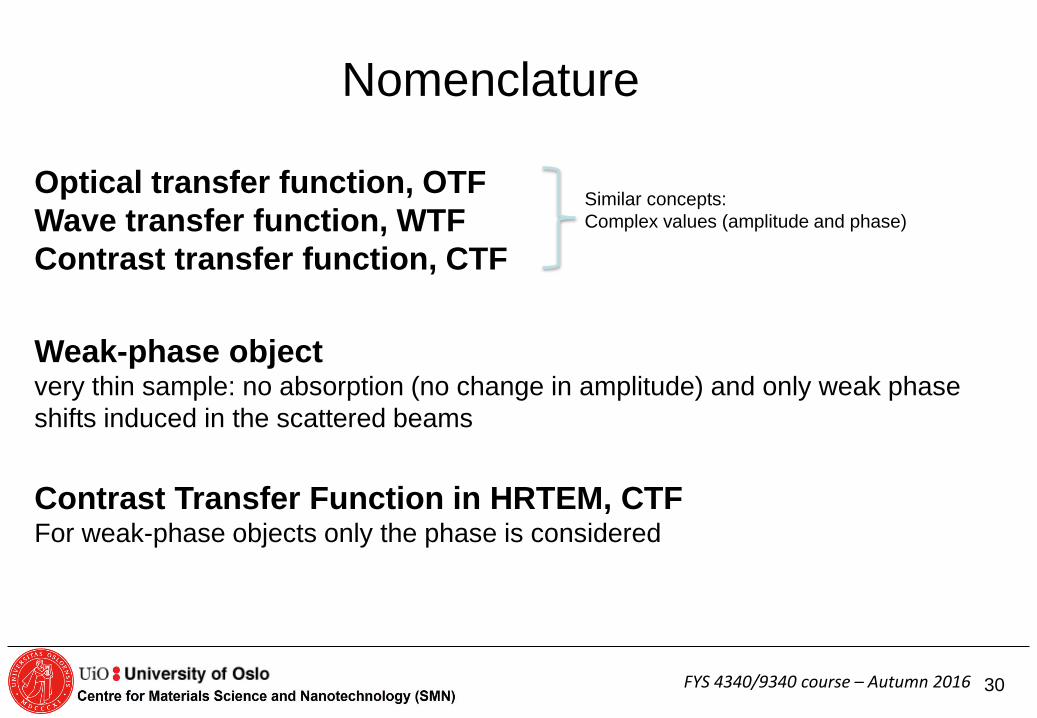
Nomenclature
Optical transfer function, OTF
Wave transfer function, WTF
Contrast transfer function, CTF
Weak-phase object very thin sample: no absorption (no change in amplitude) and only weak phase
shifts induced in the scattered beams
Contrast Transfer Function in HRTEM, CTF For weak-phase objects only the phase is considered
Similar concepts:
Complex values (amplitude and phase)
30
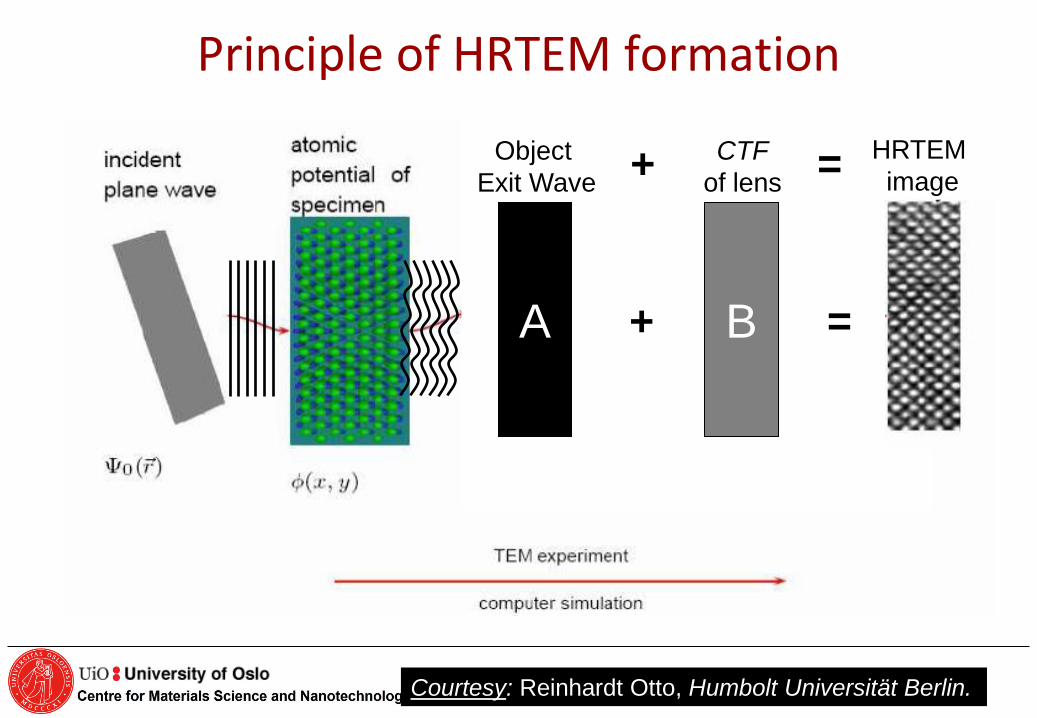
Principle of HRTEM formation
Courtesy: Reinhardt Otto, Humbolt Universität Berlin.
A B
Object
Exit Wave
CTF
of lens
HRTEM
image + =
+ =
FYS 4340/9340 course – Autumn 2016 32
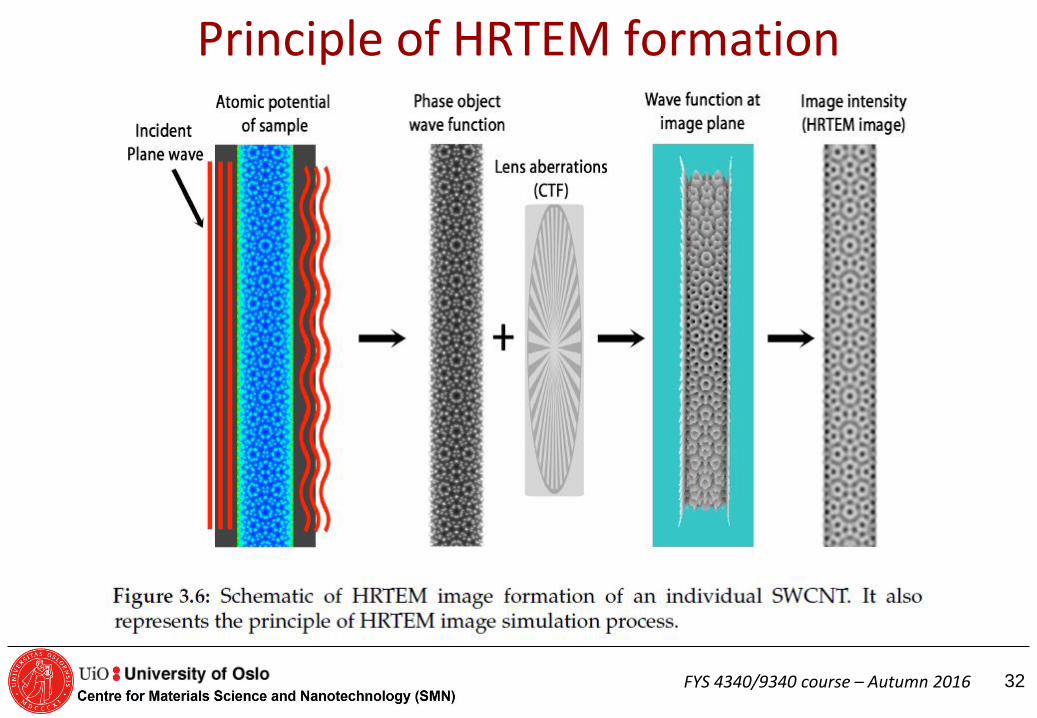
Principle of HRTEM formation
Resolution in HRTEM In optical microscopy, it is possible to define point resolution as the ability to resolve individual point objects. This resolution can be expressed (using the criterion of Rayleigh) as a quantity independent of the nature of the object.
The resolution of an electron microscope is more complex. Image "resolution" is a measure of the spatial frequencies transferred from the image amplitude spectrum (exit-surface wave-function) into the image intensity spectrum (the Fourier transform of the image intensity). This transfer is affected by several factors:
• the phases of the diffracted beams exiting the sample surface,
• additional phase changes imposed by the objective lens defocus and spherical aberration,
• the physical objective aperture,
• coherence effects that can be characterized by the microscope spread-of-focus and incident beam convergence.
For thicker crystals, the frequency-damping action of the coherence effects is complex but for a thin crystal, i.e., one behaving as a weak-phase object (WPO), the damping action can best be described by quasi-coherent imaging theory in terms of envelope functions imposed on the usual phase-contrast transfer function.
The concept of HRTEM resolution is only meaningful for thin objects and, furthermore, one has to distinguish between point resolution and information limit.
O'Keefe, M.A., Ultramicroscopy, 47 (1992) 282-297
33
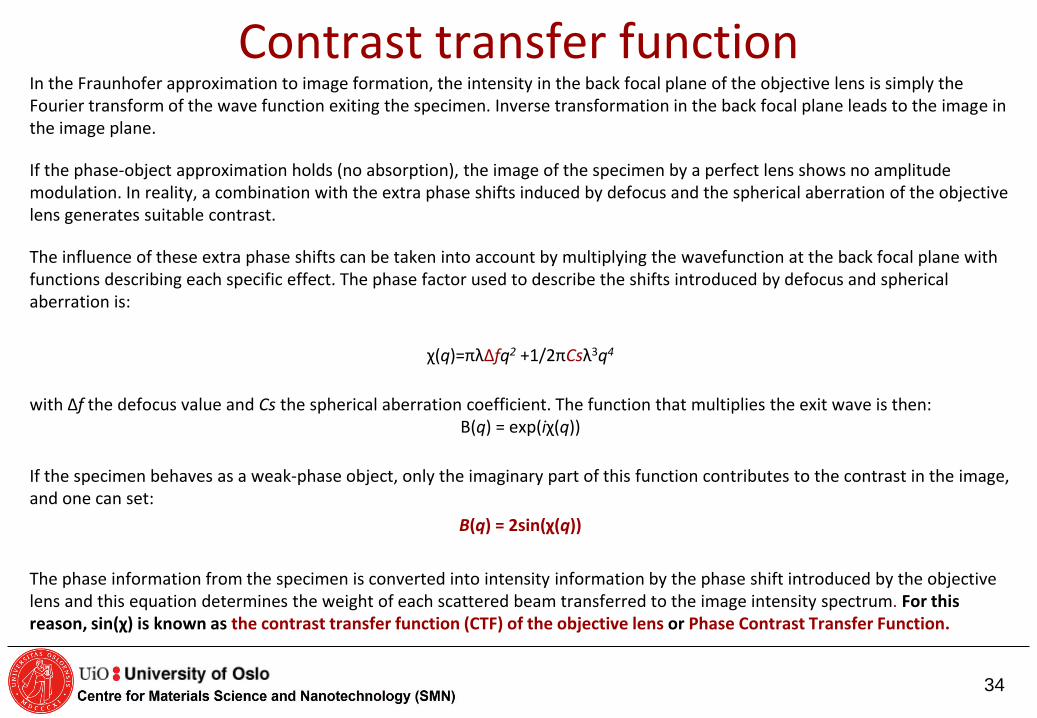
Contrast transfer function In the Fraunhofer approximation to image formation, the intensity in the back focal plane of the objective lens is simply the Fourier transform of the wave function exiting the specimen. Inverse transformation in the back focal plane leads to the image in the image plane.
If the phase-object approximation holds (no absorption), the image of the specimen by a perfect lens shows no amplitude modulation. In reality, a combination with the extra phase shifts induced by defocus and the spherical aberration of the objective lens generates suitable contrast.
The influence of these extra phase shifts can be taken into account by multiplying the wavefunction at the back focal plane with functions describing each specific effect. The phase factor used to describe the shifts introduced by defocus and spherical aberration is:
χ(q)=πλ∆fq2 +1/2πCsλ3q4
with ∆f the defocus value and Cs the spherical aberration coefficient. The function that multiplies the exit wave is then:
B(q) = exp(iχ(q))
If the specimen behaves as a weak-phase object, only the imaginary part of this function contributes to the contrast in the image, and one can set:
B(q) = 2sin(χ(q))
The phase information from the specimen is converted into intensity information by the phase shift introduced by the objective lens and this equation determines the weight of each scattered beam transferred to the image intensity spectrum. For this reason, sin(χ) is known as the contrast transfer function (CTF) of the objective lens or Phase Contrast Transfer Function.
34
FYS 4340/9340 course – Autumn 2016 35
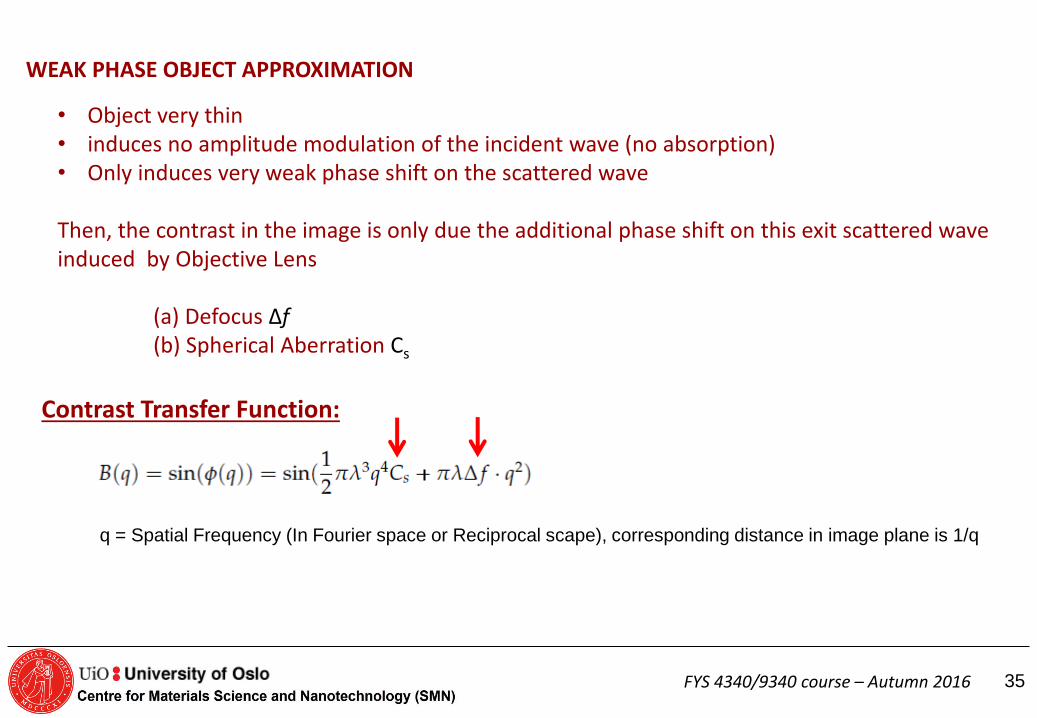
WEAK PHASE OBJECT APPROXIMATION
• Object very thin • induces no amplitude modulation of the incident wave (no absorption) • Only induces very weak phase shift on the scattered wave Then, the contrast in the image is only due the additional phase shift on this exit scattered wave induced by Objective Lens (a) Defocus Δf (b) Spherical Aberration Cs
Contrast Transfer Function:
q = Spatial Frequency (In Fourier space or Reciprocal scape), corresponding distance in image plane is 1/q
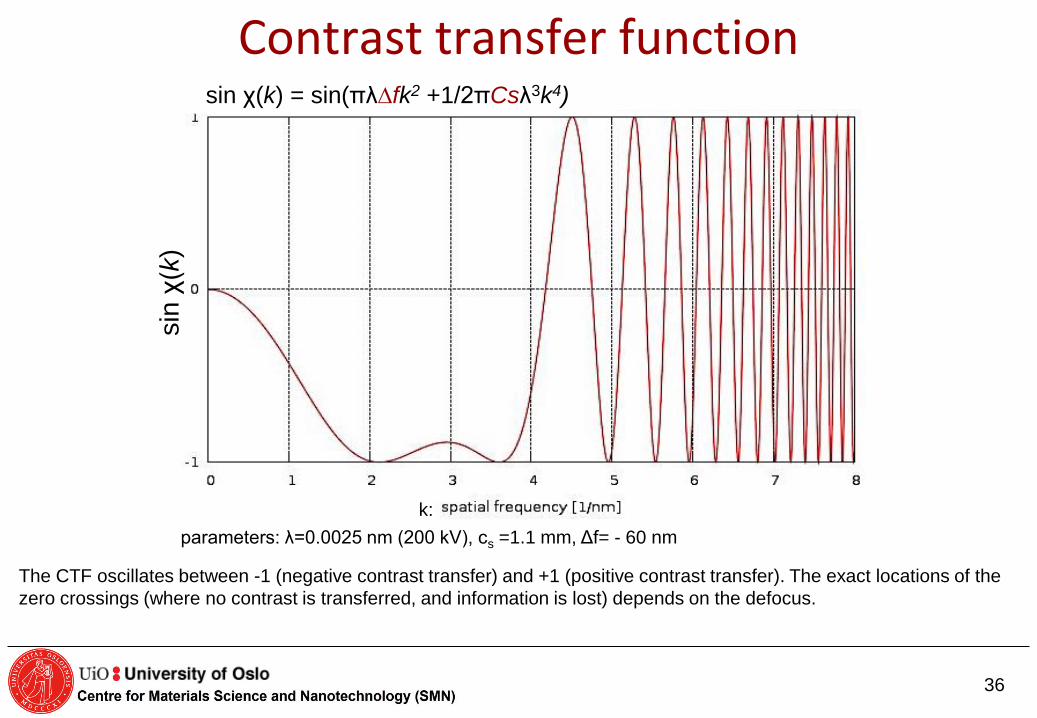
parameters: λ=0.0025 nm (200 kV), cs =1.1 mm, Δf= - 60 nm
k:
sin χ(k) = sin(πλ∆fk2 +1/2πCsλ3k4)
sin
χ(k
)
The CTF oscillates between -1 (negative contrast transfer) and +1 (positive contrast transfer). The exact locations of the
zero crossings (where no contrast is transferred, and information is lost) depends on the defocus.
36
Contrast transfer function
FYS 4340/9340 course – Autumn 2016 37
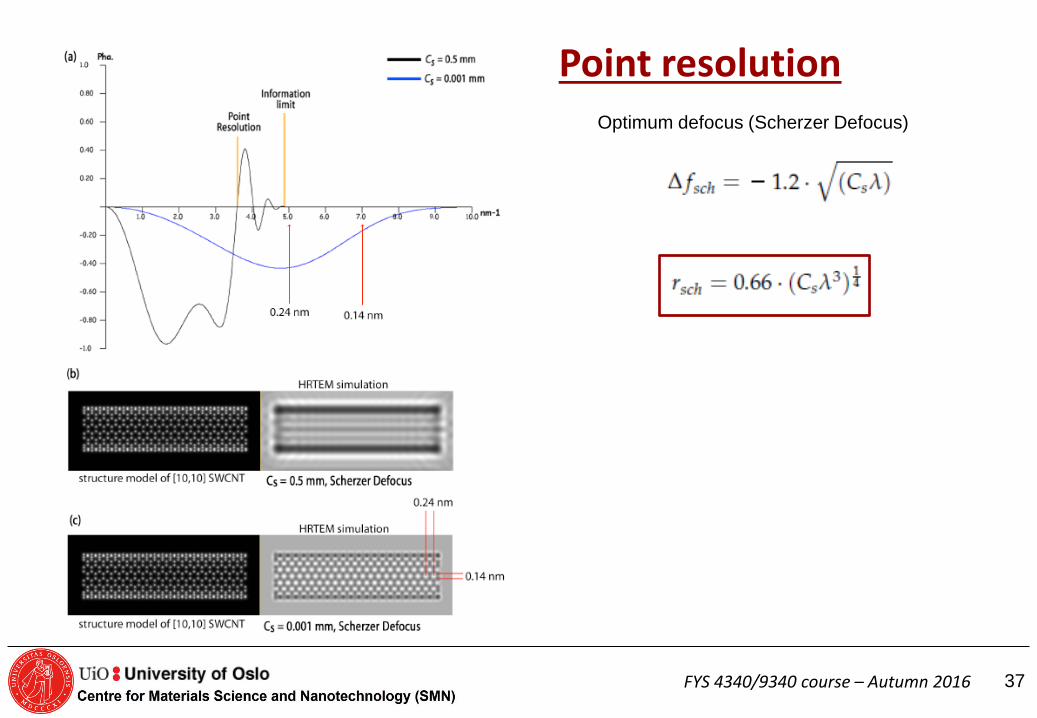
Point resolution Optimum defocus (Scherzer Defocus)
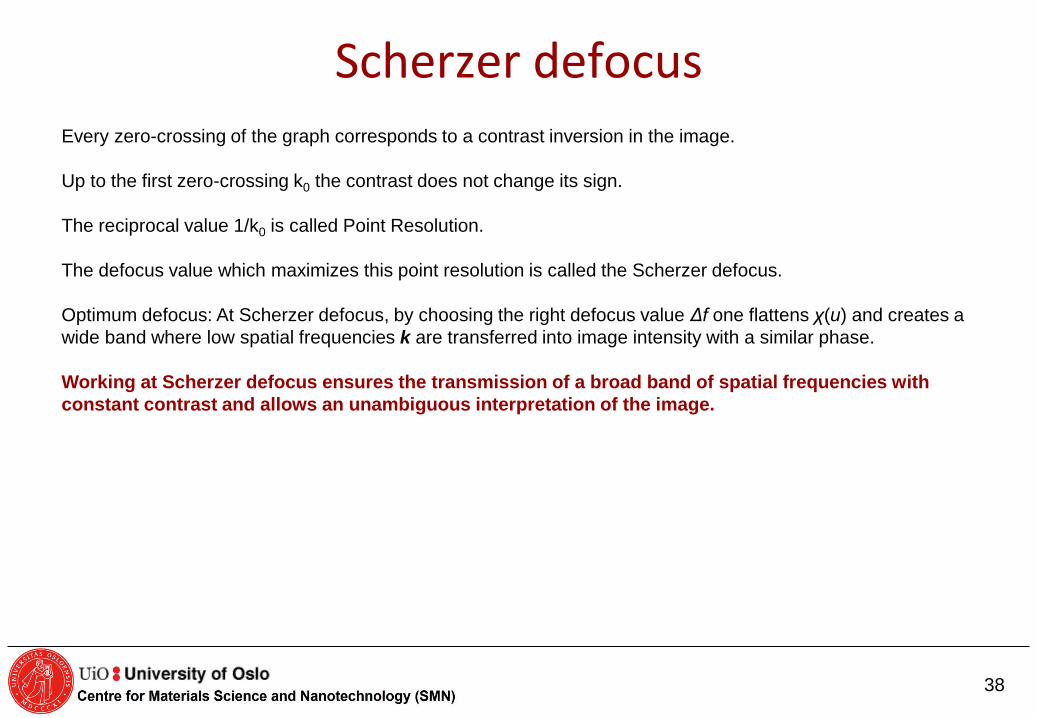
Scherzer defocus Every zero-crossing of the graph corresponds to a contrast inversion in the image.
Up to the first zero-crossing k0 the contrast does not change its sign.
The reciprocal value 1/k0 is called Point Resolution.
The defocus value which maximizes this point resolution is called the Scherzer defocus.
Optimum defocus: At Scherzer defocus, by choosing the right defocus value Δf one flattens χ(u) and creates a
wide band where low spatial frequencies k are transferred into image intensity with a similar phase.
Working at Scherzer defocus ensures the transmission of a broad band of spatial frequencies with
constant contrast and allows an unambiguous interpretation of the image.
38
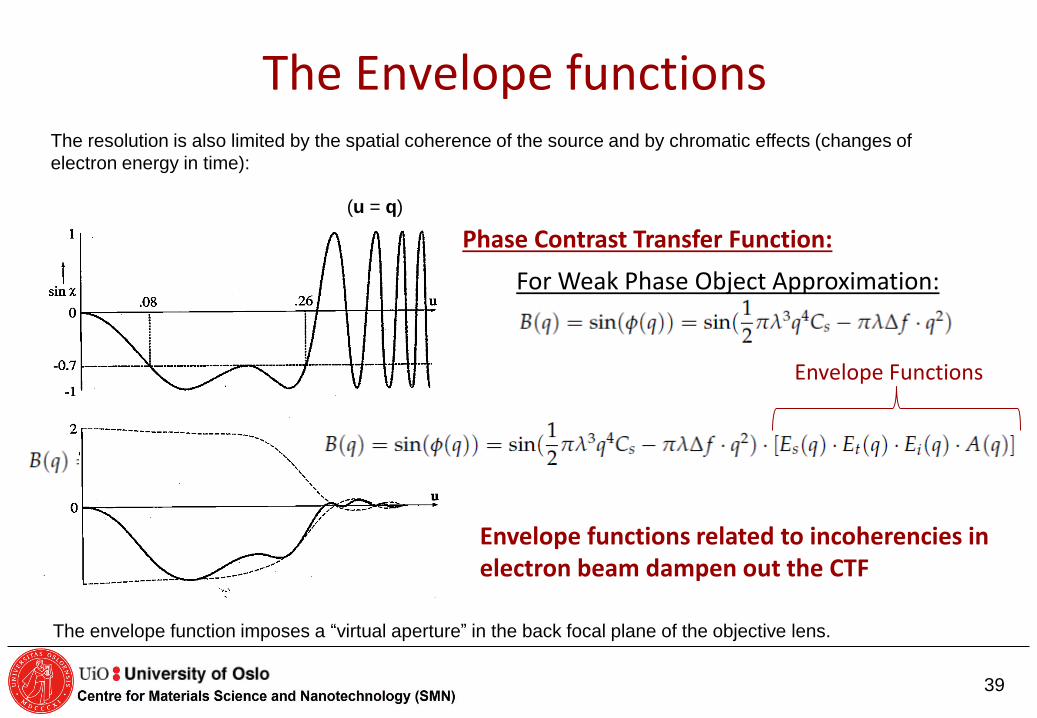
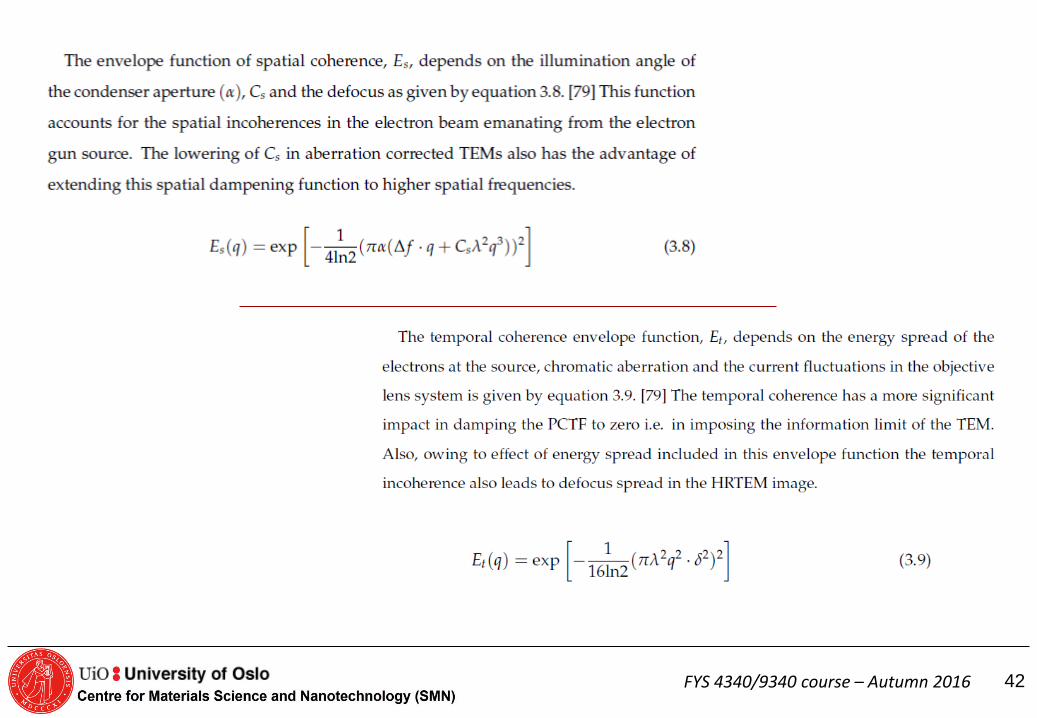
The Envelope functions The resolution is also limited by the spatial coherence of the source and by chromatic effects (changes of
electron energy in time):
The envelope function imposes a “virtual aperture” in the back focal plane of the objective lens.
(u = q)
39
For Weak Phase Object Approximation:
Phase Contrast Transfer Function:
Envelope Functions
Envelope functions related to incoherencies in electron beam dampen out the CTF
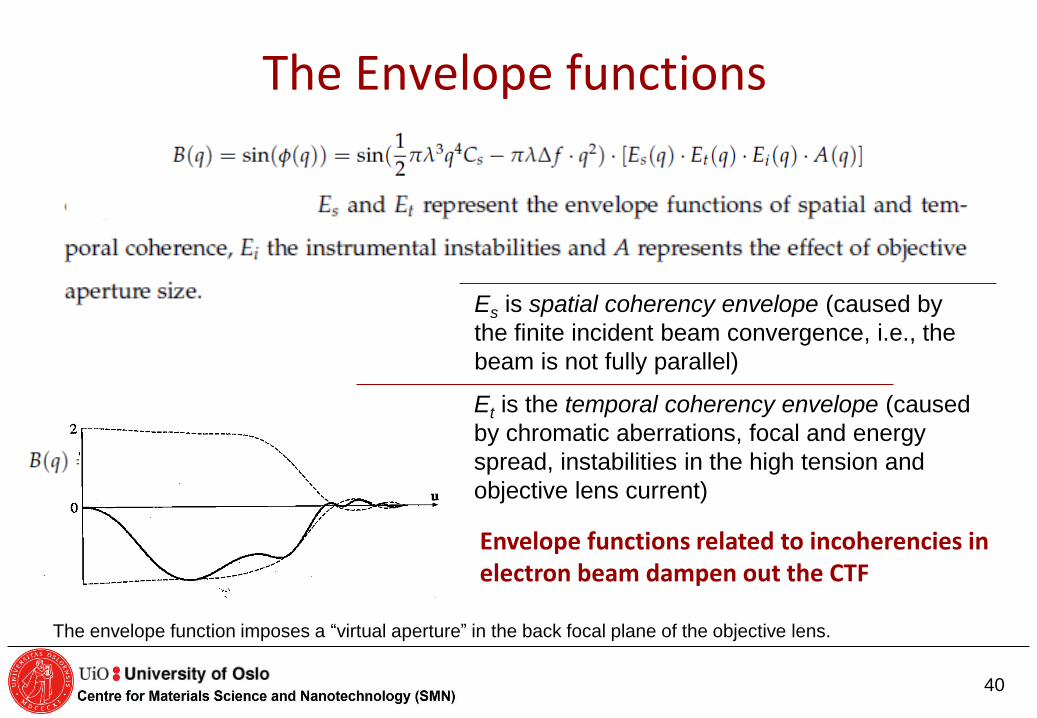
The Envelope functions The resolution is also limited by the spatial coherence of the source and by chromatic effects (changes of
electron energy in time):
The envelope function imposes a “virtual aperture” in the back focal plane of the objective lens.
(u = q)
40
For Weak Phase Object Approximation:
Phase Contrast Transfer Function:
Envelope Functions
Envelope functions related to incoherencies in electron beam dampen out the CTF
Et is the temporal coherency envelope (caused
by chromatic aberrations, focal and energy
spread, instabilities in the high tension and
objective lens current)
Es is spatial coherency envelope (caused by
the finite incident beam convergence, i.e., the
beam is not fully parallel)
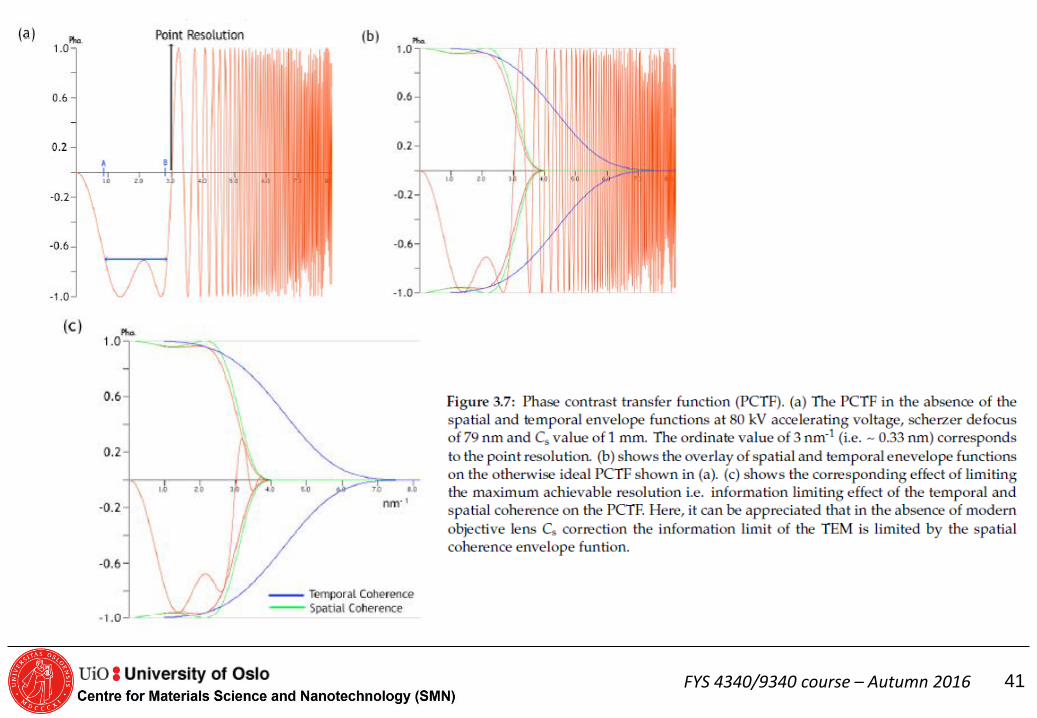
FYS 4340/9340 course – Autumn 2016 41
FYS 4340/9340 course – Autumn 2016 42
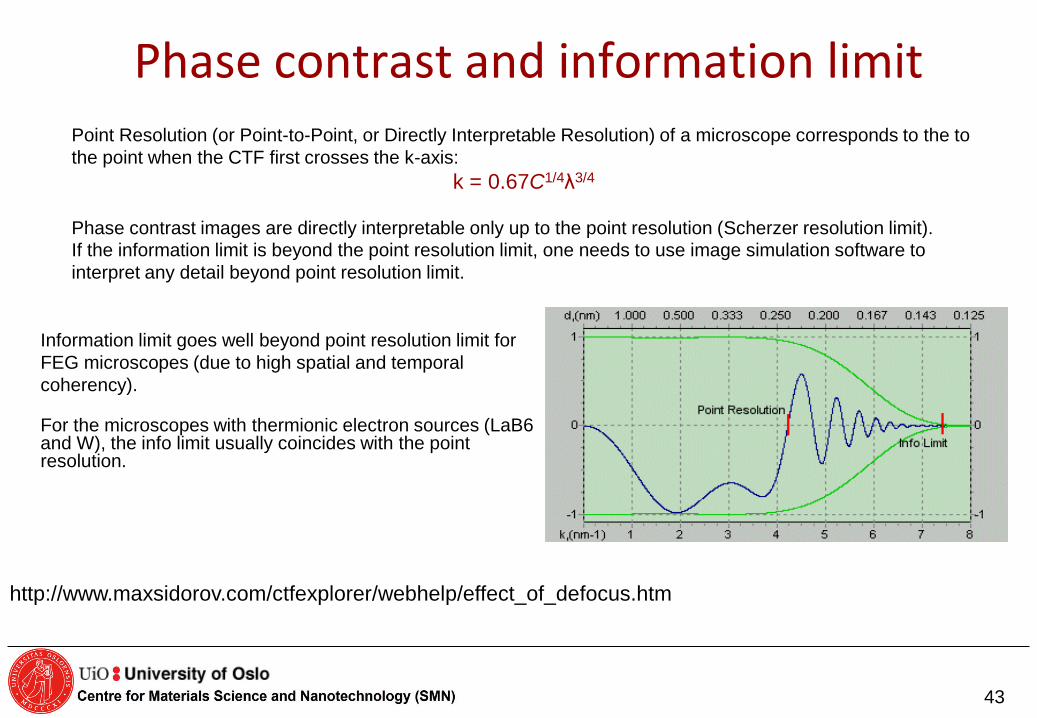
Phase contrast and information limit Point Resolution (or Point-to-Point, or Directly Interpretable Resolution) of a microscope corresponds to the to
the point when the CTF first crosses the k-axis:
k = 0.67C1/4λ3/4
Phase contrast images are directly interpretable only up to the point resolution (Scherzer resolution limit). If the information limit is beyond the point resolution limit, one needs to use image simulation software to
interpret any detail beyond point resolution limit.
http://www.maxsidorov.com/ctfexplorer/webhelp/effect_of_defocus.htm
Information limit goes well beyond point resolution limit for
FEG microscopes (due to high spatial and temporal
coherency).
For the microscopes with thermionic electron sources (LaB6 and W), the info limit usually coincides with the point resolution.
43
• CTF is oscillatory: there are "passbands" where it is NOT equal to zero (good "transmittance") and there
are "gaps" where it IS equal (or very close to) zero (no "transmittance").
• When it is negative, positive phase contrast occurs, meaning that atoms will appear dark on a bright
background.
• When it is positive, negative phase contrast occurs, meaning that atoms will appear bright on a dark
background.
• When it is equal to zero, there is no contrast (information transfer) for this spatial frequency.
• At Scherzer defocus CTF starts at 0 and decreases, then
• CTF stays almost constant and close to -1 (providing a broad band of good transmittance), then
• CTF starts to increase, and
• CTF crosses the u-axis, and then
• CTF repeatedly crosses the u-axis as u increases.
• CTF can continue forever but, in reality, it is modified by envelope functions and eventually dies off.
Important points to notice
44
FYS 4340/9340 course – Autumn 2016 45
Thank you!
Supplementary Information
46
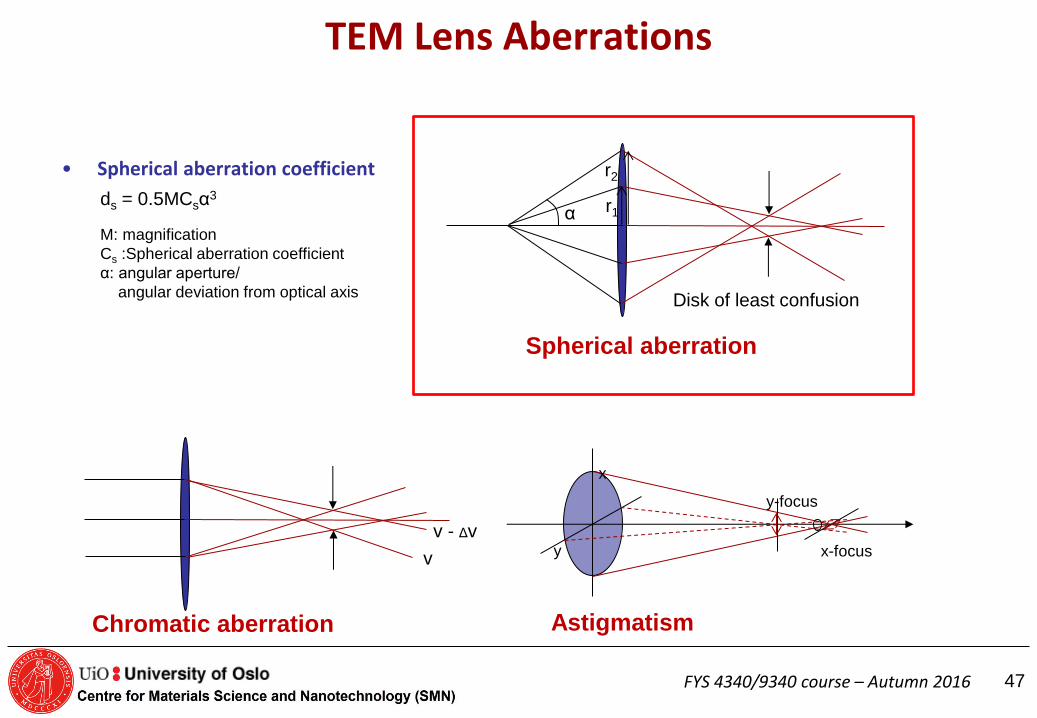
TEM Lens Aberrations
• Spherical aberration coefficient
ds = 0.5MCsα3
M: magnification
Cs :Spherical aberration coefficient
α: angular aperture/
angular deviation from optical axis
r1
r2
Disk of least confusion
α
v
v - Δv
y-focus
x-focus y
x
Spherical aberration
Chromatic aberration Astigmatism
47 FYS 4340/9340 course – Autumn 2016
FYS 4340/9340 course – Autumn 2016 48
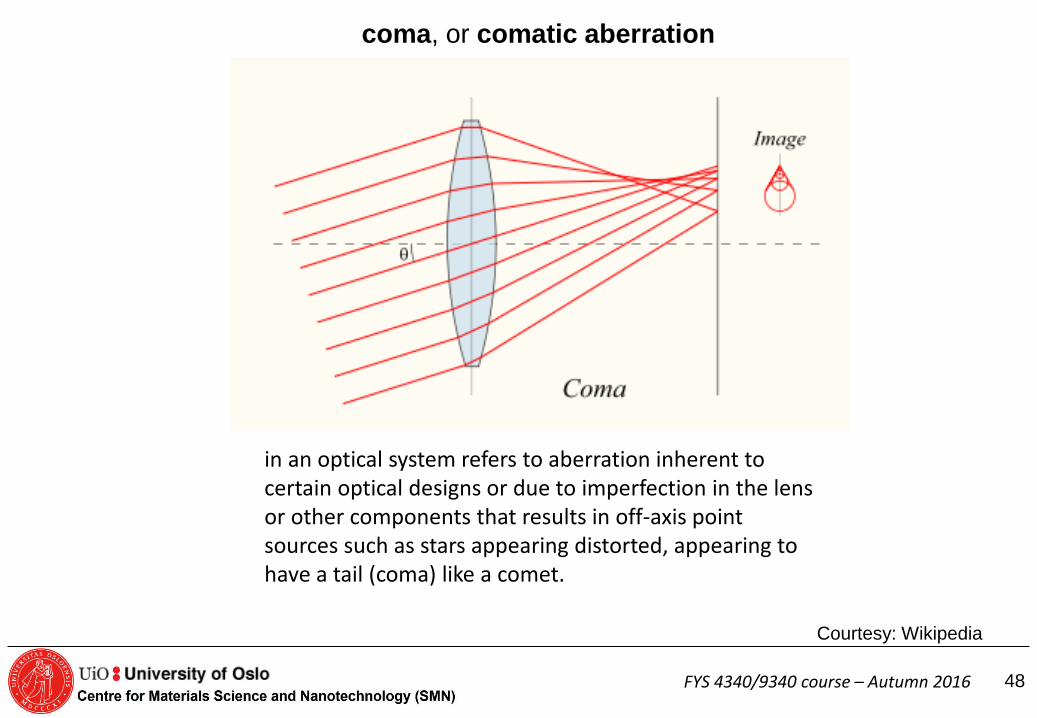
coma, or comatic aberration
in an optical system refers to aberration inherent to certain optical designs or due to imperfection in the lens or other components that results in off-axis point sources such as stars appearing distorted, appearing to have a tail (coma) like a comet.
Courtesy: Wikipedia
FYS 4340/9340 course – Autumn 2016
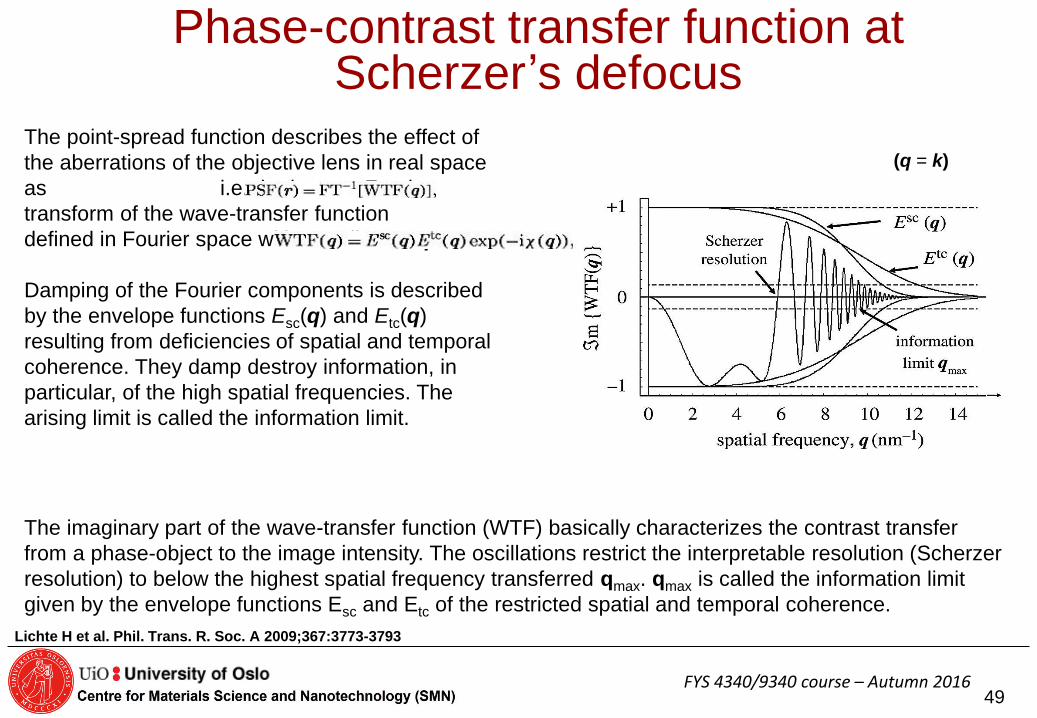
Lichte H et al. Phil. Trans. R. Soc. A 2009;367:3773-3793
(q = k)
The imaginary part of the wave-transfer function (WTF) basically characterizes the contrast transfer
from a phase-object to the image intensity. The oscillations restrict the interpretable resolution (Scherzer
resolution) to below the highest spatial frequency transferred qmax. qmax is called the information limit
given by the envelope functions Esc and Etc of the restricted spatial and temporal coherence.
Phase-contrast transfer function at Scherzer’s defocus
The point-spread function describes the effect of
the aberrations of the objective lens in real space
as i.e. the inverse Fourier
transform of the wave-transfer function
defined in Fourier space with coordinates q.
Damping of the Fourier components is described
by the envelope functions Esc(q) and Etc(q)
resulting from deficiencies of spatial and temporal
coherence. They damp destroy information, in
particular, of the high spatial frequencies. The
arising limit is called the information limit.
49
50
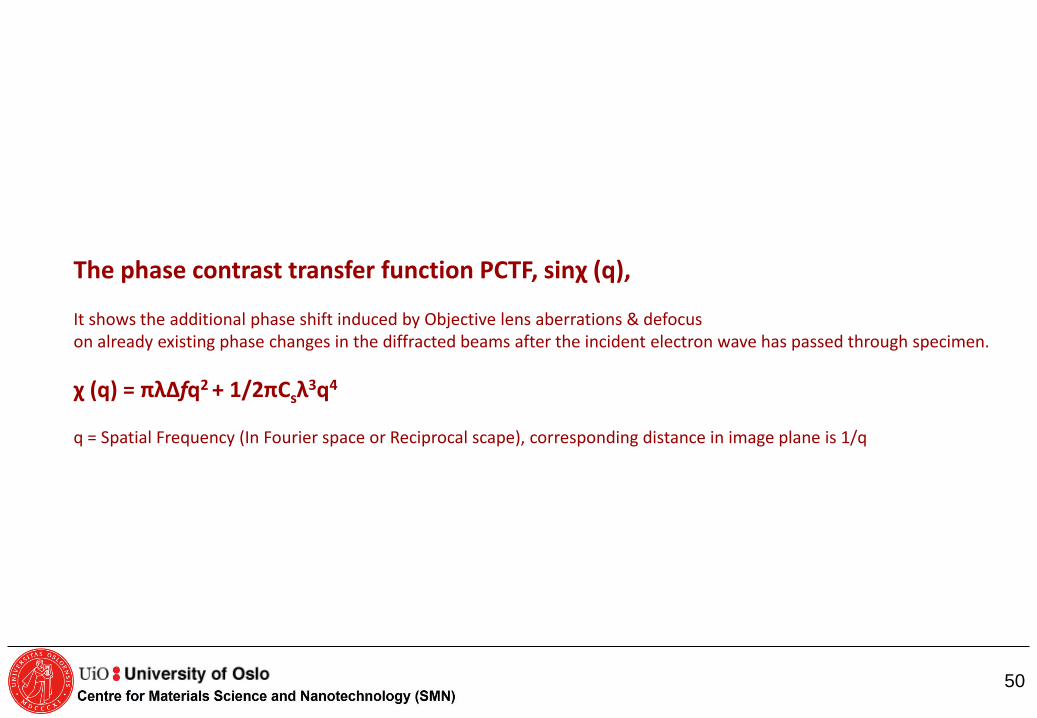
The phase contrast transfer function PCTF, sinχ (q), It shows the additional phase shift induced by Objective lens aberrations & defocus on already existing phase changes in the diffracted beams after the incident electron wave has passed through specimen.
χ (q) = πλΔfq2 + 1/2πCsλ3q4
q = Spatial Frequency (In Fourier space or Reciprocal scape), corresponding distance in image plane is 1/q
Point resolution
Point resolution: related to the finest detail that can be directly interpreted in terms of the specimen structure. Since the CTF depends very sensitively on defocus, and in general shows an oscillatory behavior as a function of k, the contribution of the different scattered beams to the amplitude modulation varies. However, for particular underfocus settings the instrument approaches a perfect phase contrast microscope for a range of k before the first crossover, where the CTF remains at values close to –1. It can then be considered that, to a first approximation, all the beams before the first crossover contribute to the contrast with the same weight, and cause image details that are directly interpretable in terms of the projected potential.
Optimisation of this behaviour through the balance of the effects of spherical aberration vs. defocus leads to the generally accepted optimum defocus1 −1.2(Csλ)1/2. Designating an optimum resolution involves a certain degree of arbitrariness. However, the point where the CTF at optimum defocus reaches the value –0.7 for k = 1.49C−1/ 4λ−3/4 is usually taken to give the optimum (point) resolution (0.67C1/4λ3/4). This means that the considered passband extends over the spatial frequency region within which transfer is greater than 70%. Beams with k larger than the first crossover are still linearly imaged, but with reverse contrast. Images formed by beams transferred with opposite phases cannot be intuitively interpreted.
51
Information limit Information limit: corresponds to the highest spatial frequency still appreciably transmitted to the intensity spectrum. This resolution is related to the finest detail that can actually be seen in the image (which however is only interpretable using image simulation). For a thin specimen, such limit is determined by the cut-off of the transfer function due to spread of focus and beam convergence (usually taken at 1/e2 or at zero).
These damping effects are represented by ED or Etc a temporal coherency envelope (caused by chromatic aberrations, focal and energy spread, instabilities in the high tension and objective lens current), and E or Esc is the spatial coherency envelope (caused by the finite incident beam convergence, i.e., the beam is not fully parallel).
The Information limit goes well beyond point resolution limit for FEG microscopes (due to high spatial and temporal coherency). For the microscopes with thermionic electron sources (LaB6 and W), the info limit usually coincides with the point resolution.
The use of FEG sources minimises the loss of spatial coherence. This helps to increase the information limit resolution in the case of lower voltage ( ≤ 200 kV) instruments, because in these cases the temporal coherence does not usually play a critical role. However the point resolution is relatively poor due to the oscillatory behavior of the CTF. On the other hand, with higher voltage instruments, due to the increased brightness of the source, the damping effects are always dominated by the spread of focus and FEG sources do not contribute to an increased information limit resolution.
52
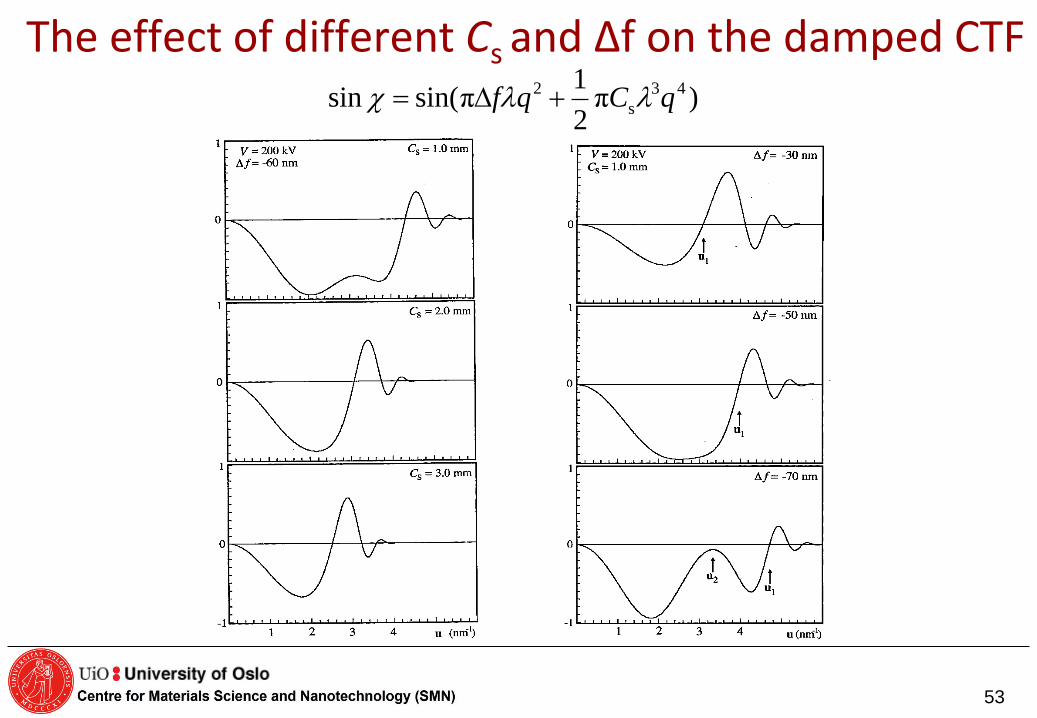
The effect of different Cs and Δf on the damped CTF
)π2
1πsin(sin 43
s
2 qCqf ll D
53
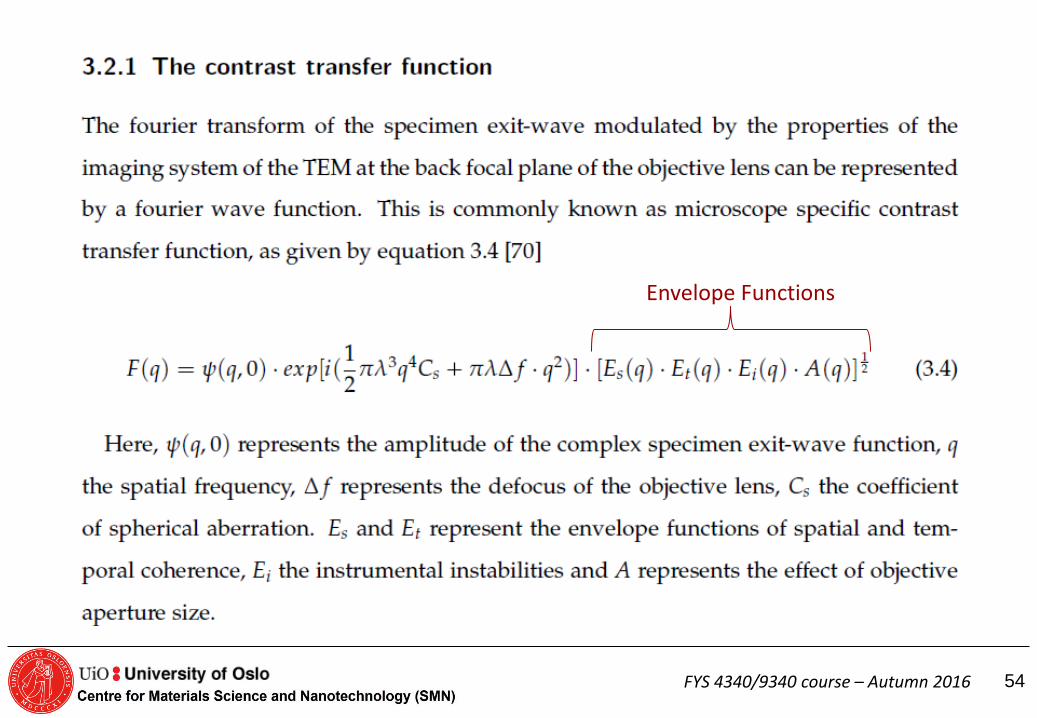
FYS 4340/9340 course – Autumn 2016 54
Envelope Functions
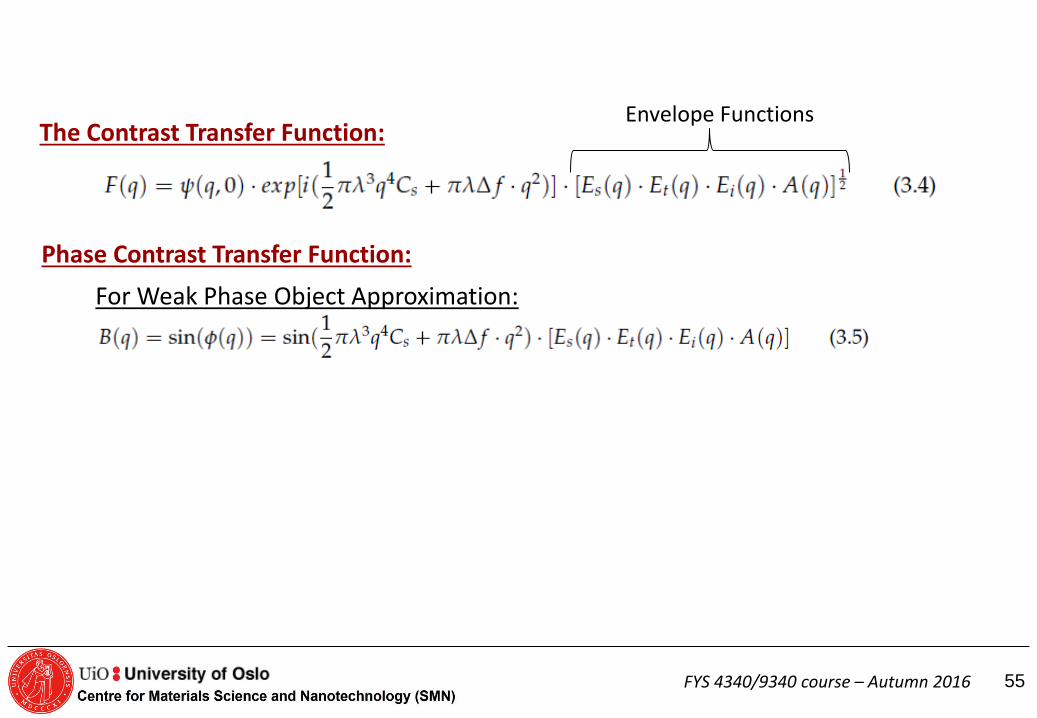
FYS 4340/9340 course – Autumn 2016 55
For Weak Phase Object Approximation:
Phase Contrast Transfer Function:
The Contrast Transfer Function: Envelope Functions
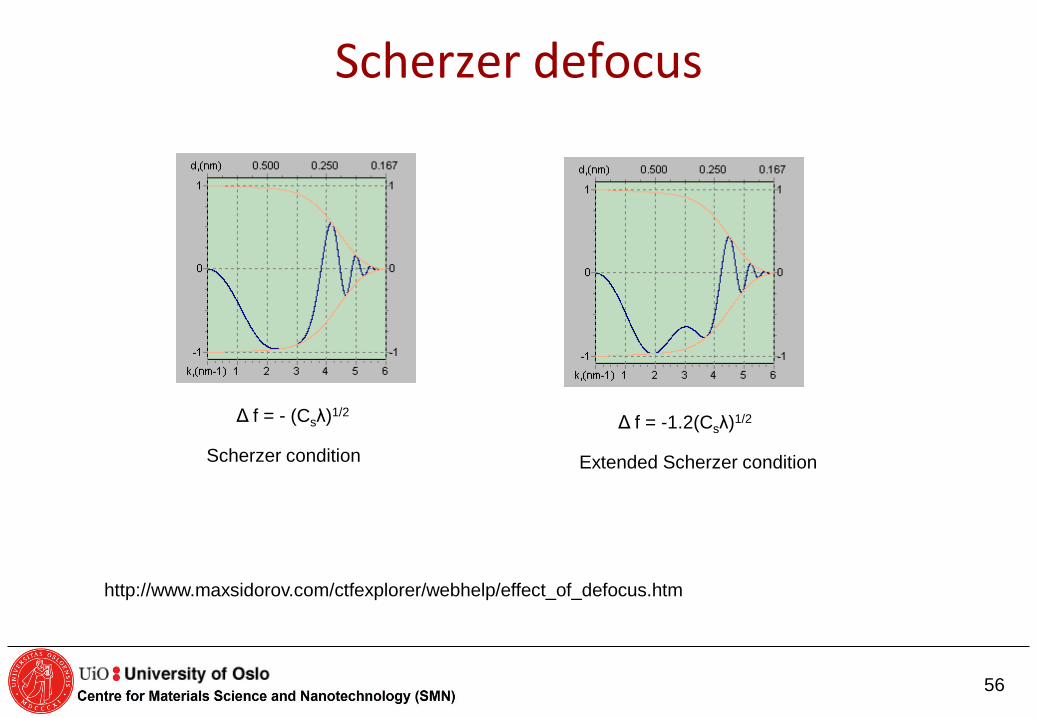
http://www.maxsidorov.com/ctfexplorer/webhelp/effect_of_defocus.htm
Δ f = - (Csλ)1/2 Δ f = -1.2(Csλ)1/2
Scherzer condition Extended Scherzer condition
56
Scherzer defocus
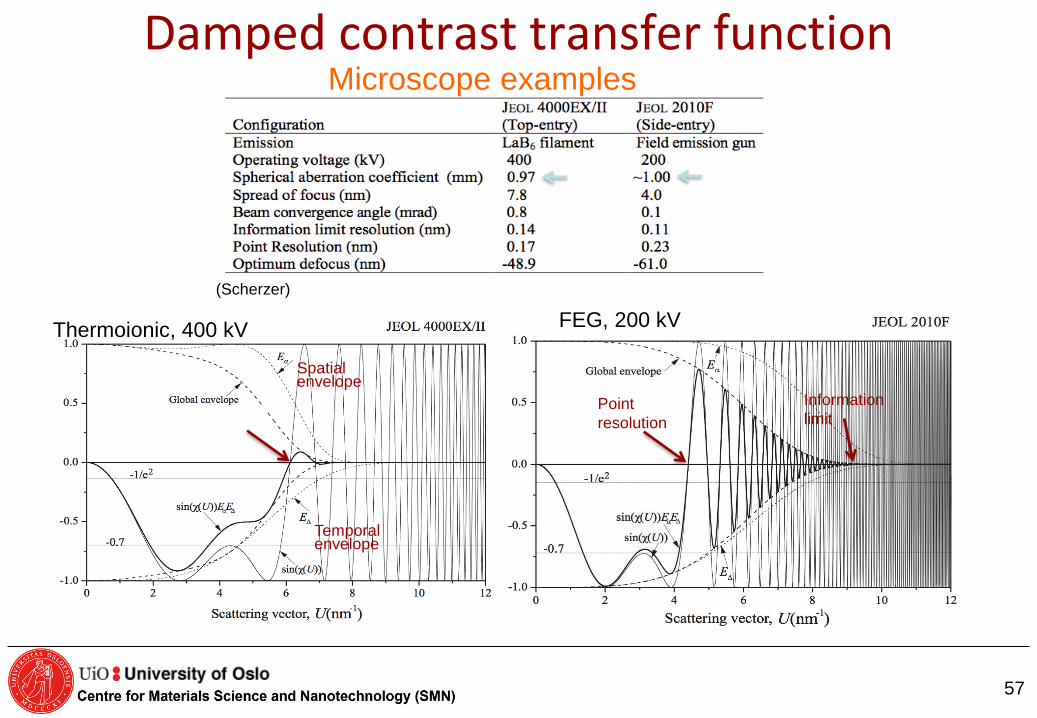
Damped contrast transfer function Microscope examples
Point
resolution
Information
limit
Spatial envelope
Temporal envelope
(Scherzer)
Thermoionic, 400 kV FEG, 200 kV
57
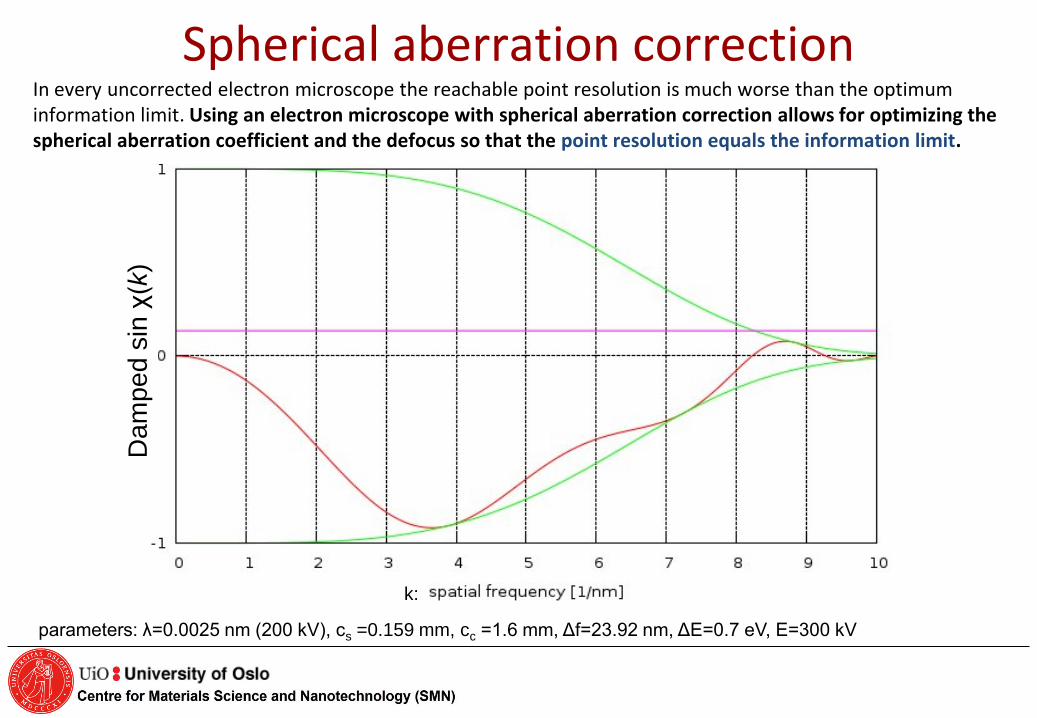
Spherical aberration correction In every uncorrected electron microscope the reachable point resolution is much worse than the optimum information limit. Using an electron microscope with spherical aberration correction allows for optimizing the spherical aberration coefficient and the defocus so that the point resolution equals the information limit.
parameters: λ=0.0025 nm (200 kV), cs =0.159 mm, cc =1.6 mm, Δf=23.92 nm, ΔE=0.7 eV, E=300 kV
Da
mp
ed
sin
χ(k
)
k:
FYS 4340/9340 course – Autumn 2016
HRTEM image simulation
59
HRTEM image simulation
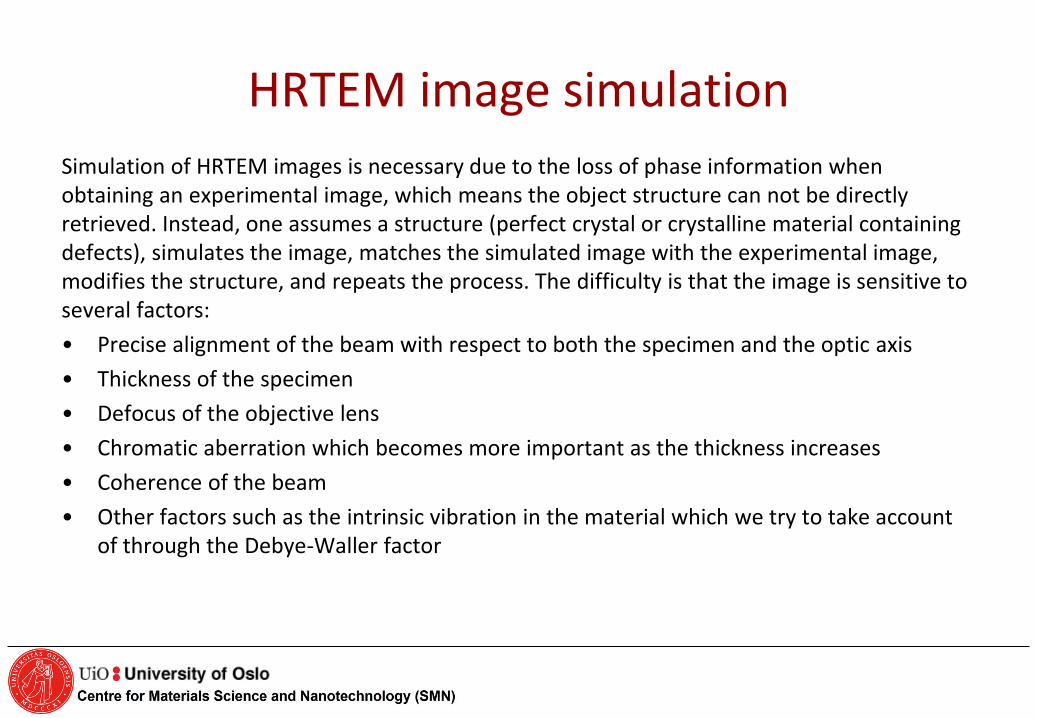
Simulation of HRTEM images is necessary due to the loss of phase information when obtaining an experimental image, which means the object structure can not be directly retrieved. Instead, one assumes a structure (perfect crystal or crystalline material containing defects), simulates the image, matches the simulated image with the experimental image, modifies the structure, and repeats the process. The difficulty is that the image is sensitive to several factors:
• Precise alignment of the beam with respect to both the specimen and the optic axis
• Thickness of the specimen
• Defocus of the objective lens
• Chromatic aberration which becomes more important as the thickness increases
• Coherence of the beam
• Other factors such as the intrinsic vibration in the material which we try to take account of through the Debye-Waller factor
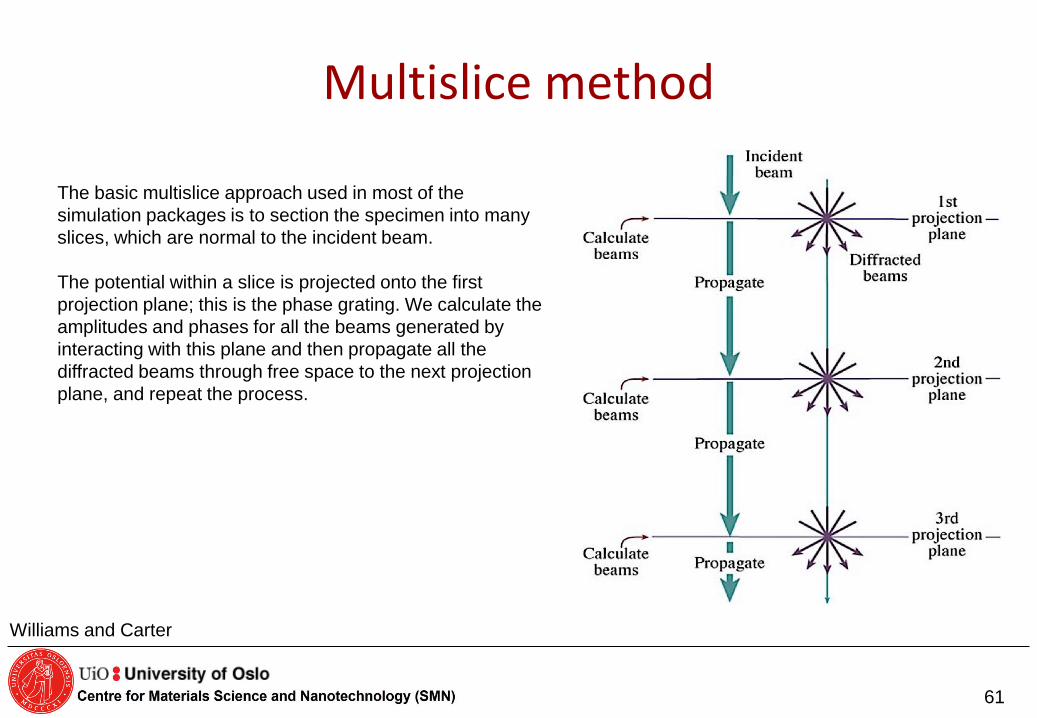
Multislice method
The basic multislice approach used in most of the
simulation packages is to section the specimen into many
slices, which are normal to the incident beam.
The potential within a slice is projected onto the first
projection plane; this is the phase grating. We calculate the
amplitudes and phases for all the beams generated by
interacting with this plane and then propagate all the
diffracted beams through free space to the next projection
plane, and repeat the process.
Williams and Carter
61
END
62