Differential Scanning Calorimetry - UAB is a first order ... Differential Scanning Calorimetry ......
134
Differential Scanning Calorimetry Derrick Dean University of Alabama at Birmingham
Transcript of Differential Scanning Calorimetry - UAB is a first order ... Differential Scanning Calorimetry ......
Differential Scanning Calorimetry
Derrick DeanUniversity of Alabama at Birmingham
2
Agenda
• Brief overview of polymers• DSC Basics• Applications
– Melting transitions, Tm– The glass transition, Tg– Thermal Stability
• Modulated DSC, MDSC• Variations in DSC
• Quality Control• Characterization• Processing• End Use Application
Thermal Analysis Useful For
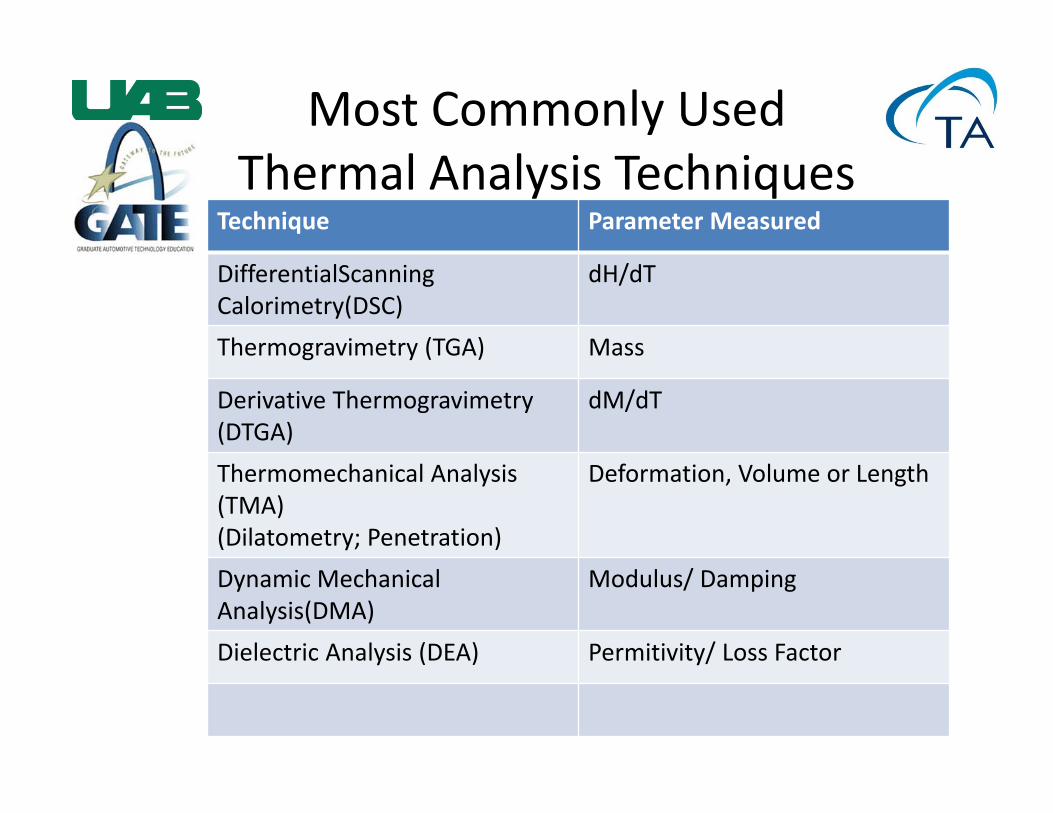
Most Commonly Used Thermal Analysis Techniques
Technique Parameter Measured
DifferentialScanningCalorimetry(DSC)
dH/dT
Thermogravimetry (TGA) Mass
Derivative Thermogravimetry(DTGA)
dM/dT
Thermomechanical Analysis (TMA)(Dilatometry; Penetration)
Deformation, Volume or Length
Dynamic MechanicalAnalysis(DMA)
Modulus/ Damping
Dielectric Analysis (DEA) Permitivity/ Loss Factor
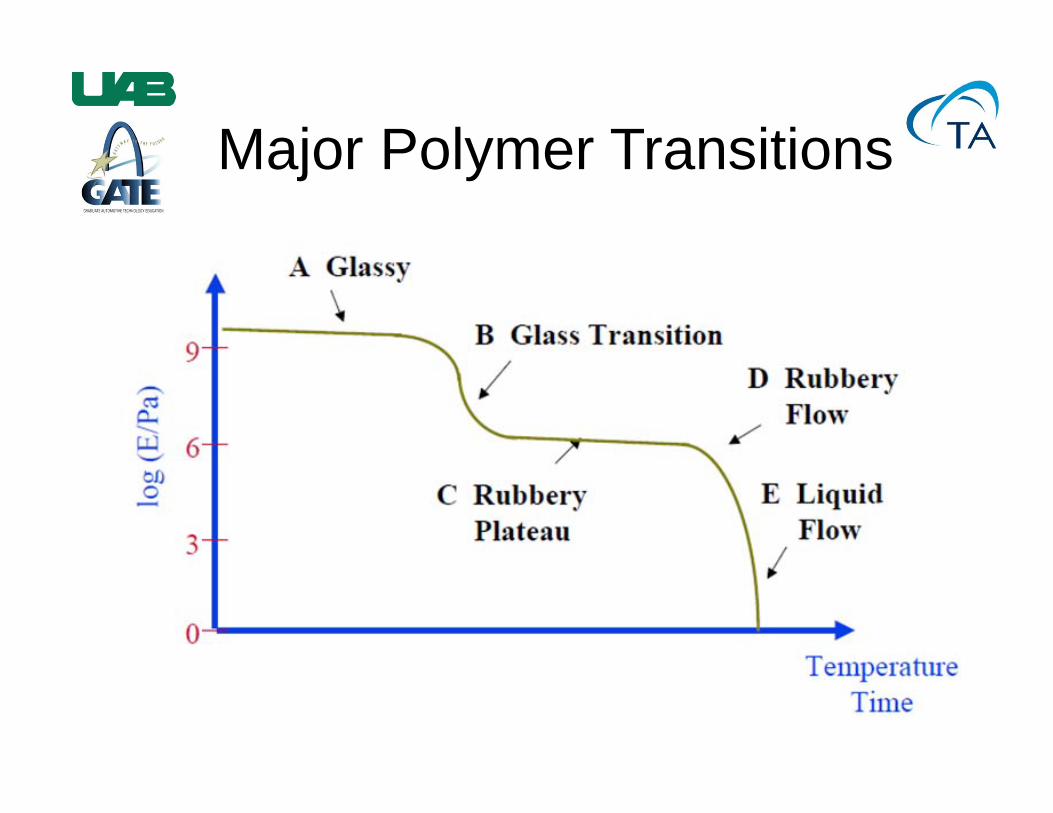
Major Polymer Transitions
• Glass Transition, Tg– Indicates minimum/maximum service temperature
– Very important in amorphous polymers
• Melting temperature, Tm– Defines minimum processing andmaximum service temperature
Two Main Transitions in Thermoplastic Polymers
Transitions and RelaxationsWhy Important?
Range at which properties change Modulus Brittleness Impact strength Wear Permeability Thermal conductivity Strength Dielectric constant Stress‐strain properties Electrical conductivity

Transitions and RelaxationsIf we examine polymer properties with respect to temperature and/or frequencywe find that there is a range over which the properties change(eg., Silly Putty)
Log E
Log
Log E
T
• At high frequencies no motion ‐> unrelaxed• At low frequencies it flows ‐> relaxed
If T is changed instead of , same features result.
Relaxation – significant “sharp” or “steep” change in properties in a relatively narrow temperature or frequency range.
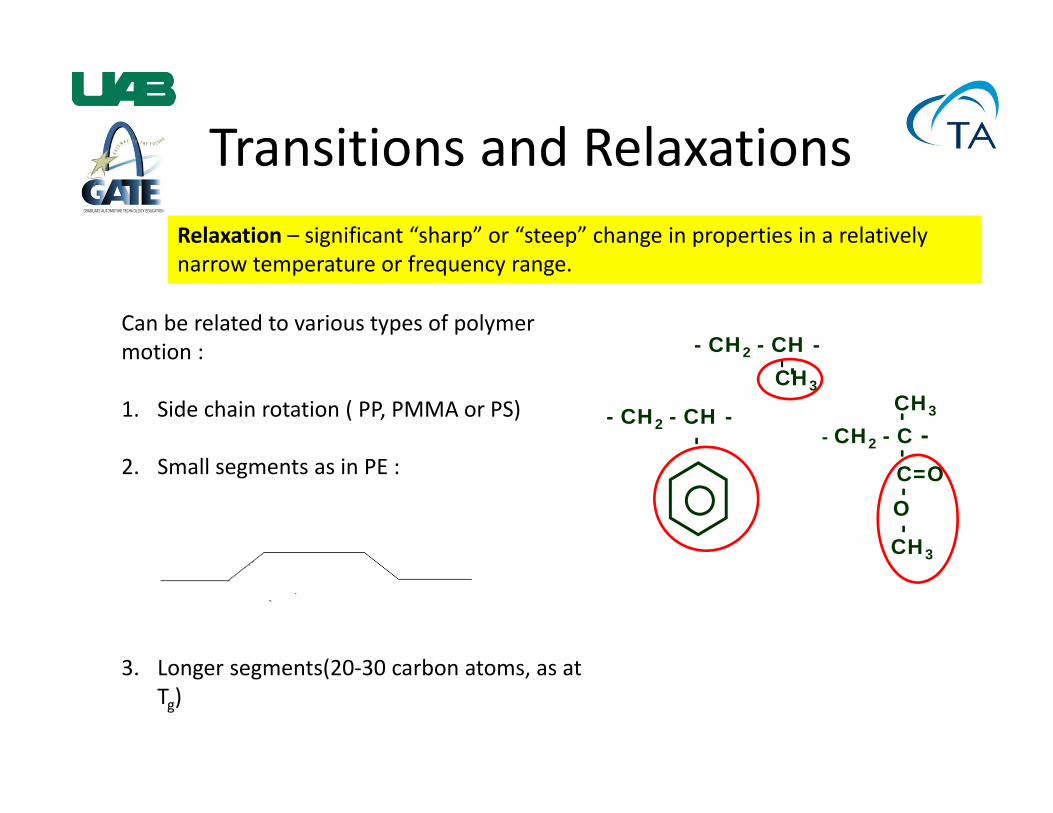
Transitions and RelaxationsRelaxation – significant “sharp” or “steep” change in properties in a relatively narrow temperature or frequency range.
Can be related to various types of polymer motion :
1. Side chain rotation ( PP, PMMA or PS)
2. Small segments as in PE :
3. Longer segments(20‐30 carbon atoms, as at Tg)
‐- CH2 - C -
‐CH3
C=O‐‐
O
CH3
- CH2 - CH -CH3
-
‐
- CH2 - CH -
Transitions and Relaxations
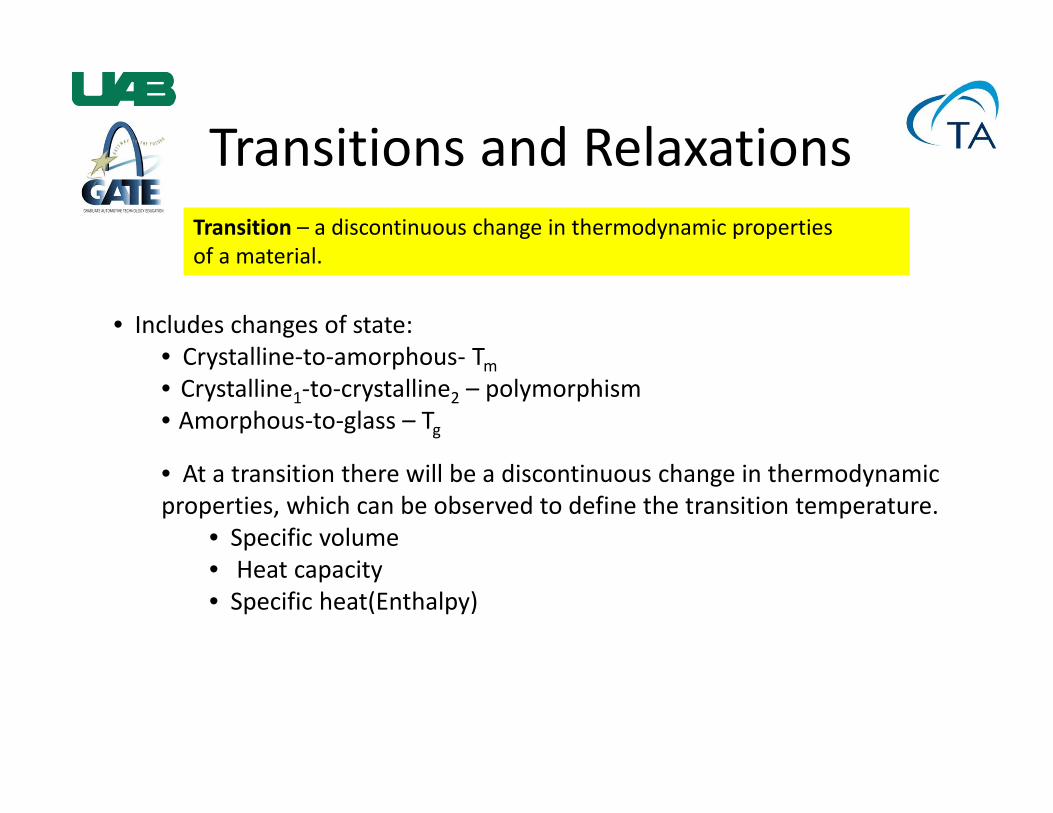
• Includes changes of state:• Crystalline‐to‐amorphous‐ Tm• Crystalline1‐to‐crystalline2 – polymorphism• Amorphous‐to‐glass – Tg
• At a transition there will be a discontinuous change in thermodynamic properties, which can be observed to define the transition temperature.
• Specific volume• Heat capacity• Specific heat(Enthalpy)
Transition – a discontinuous change in thermodynamic propertiesof a material.
Transitions and Relaxations
v
T
Cp
T
T
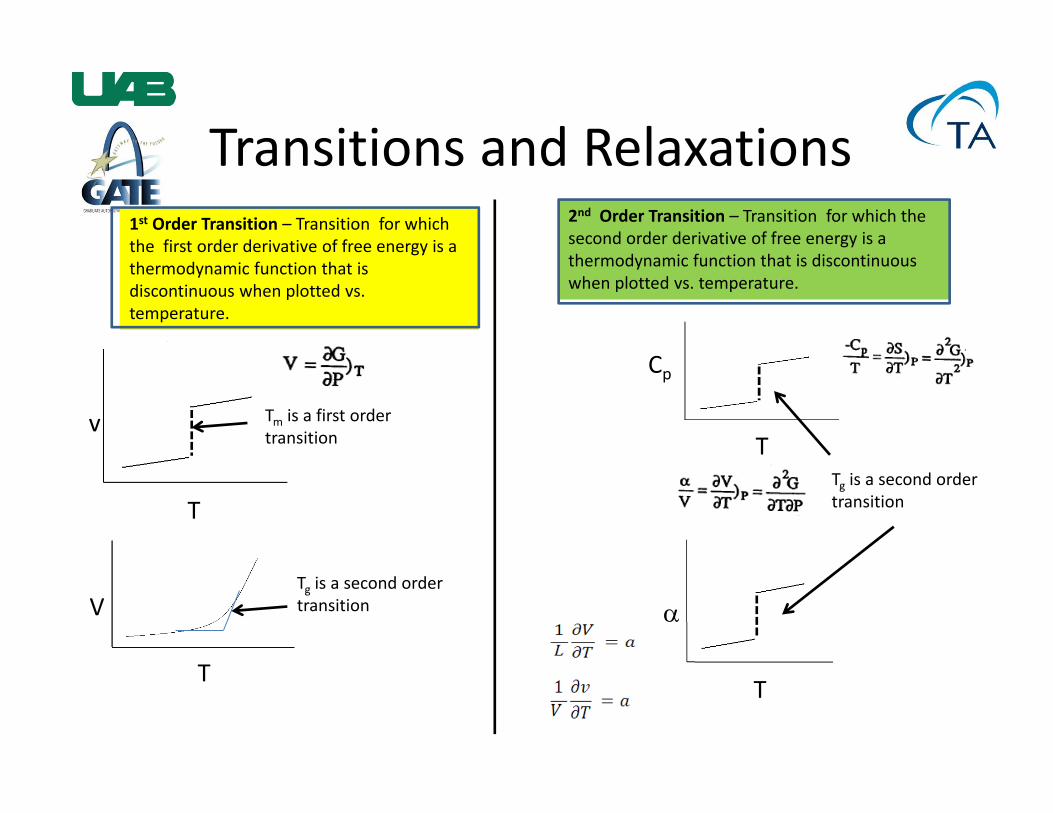
Tm is a first ordertransition
V
T
1st Order Transition – Transition for which the first order derivative of free energy is a thermodynamic function that is discontinuous when plotted vs. temperature.
2nd Order Transition – Transition for which the second order derivative of free energy is a thermodynamic function that is discontinuous when plotted vs. temperature.
Tg is a second ordertransition
Tg is a second ordertransition
Transitions and Relaxations
Change is greatest at Tm and Tg, and less so at lower temperature relaxations. Many polymers become brittle below Tg‐ no means to absorb energy of impact(PS, PMMA) Some remain ductile(PC, PET), because of a large secondary relaxation at T < Tg which can absorb energy and become brittle at much lower T, below the secondary relaxation.
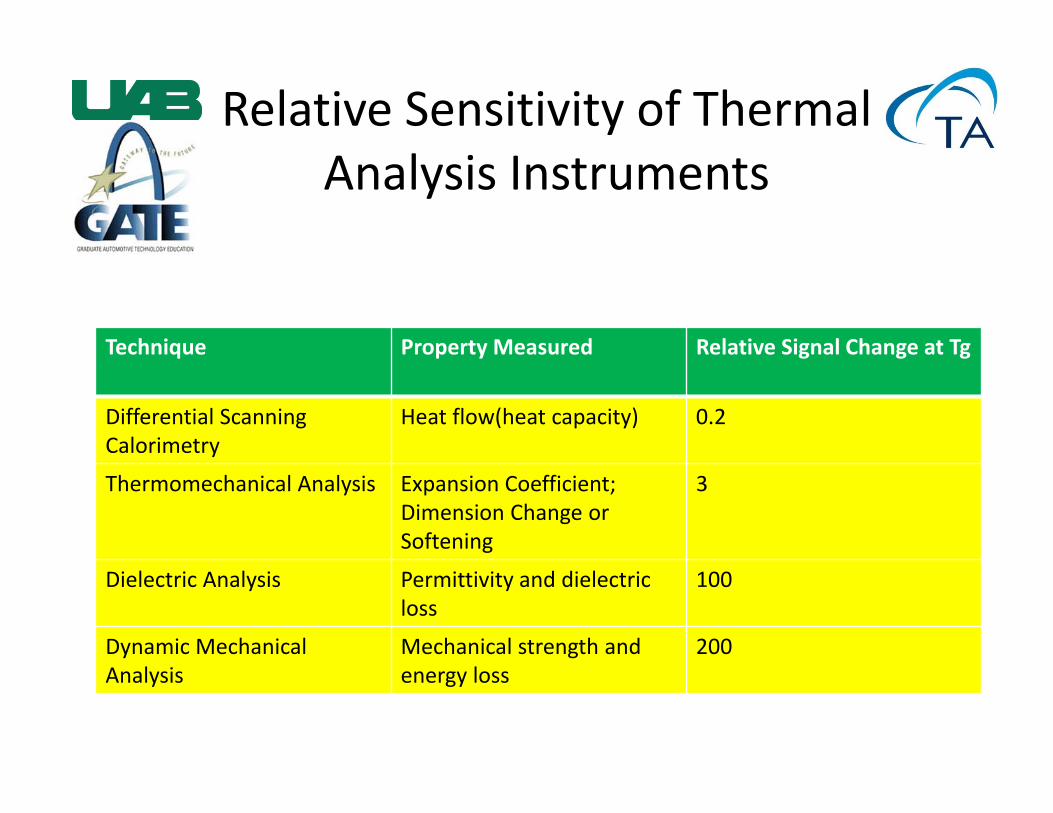
Relative Sensitivity of Thermal Analysis Instruments
Technique Property Measured Relative Signal Change at Tg
Differential Scanning Calorimetry
Heat flow(heat capacity) 0.2
Thermomechanical Analysis Expansion Coefficient; Dimension Change or Softening
3
Dielectric Analysis Permittivity and dielectric loss
100
Dynamic Mechanical Analysis
Mechanical strength and energy loss
200
14
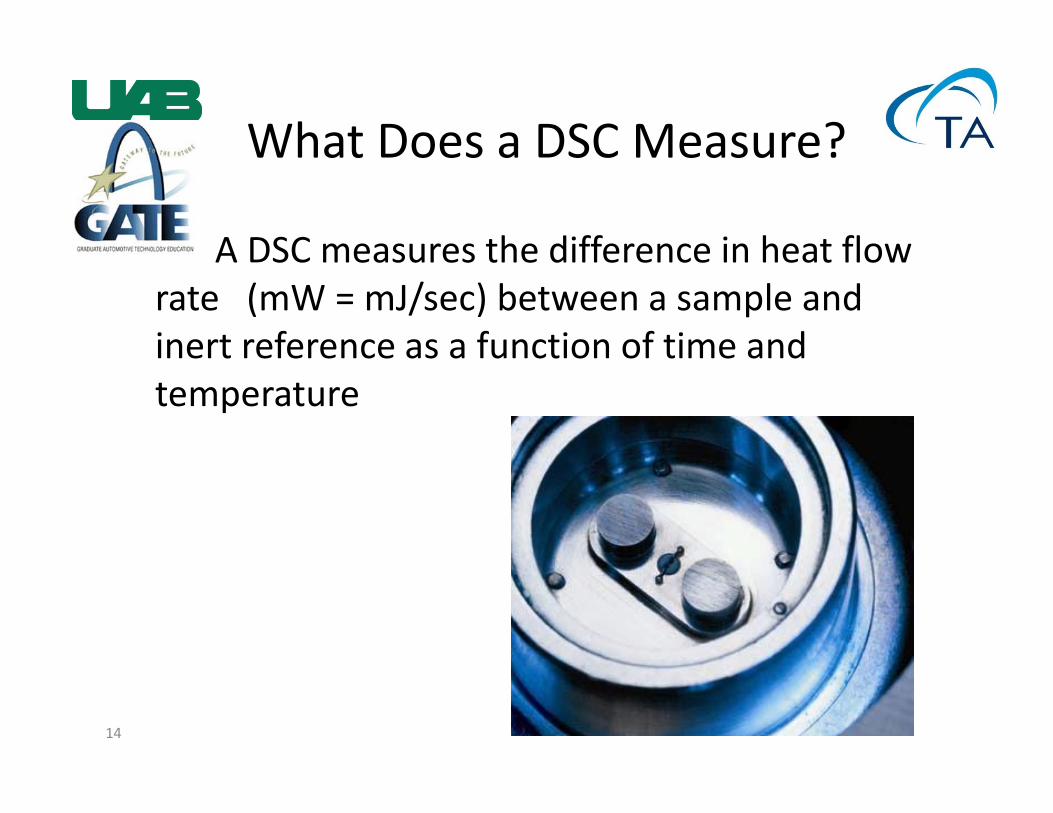
What Does a DSC Measure?
A DSC measures the difference in heat flow rate (mW = mJ/sec) between a sample and inert reference as a function of time and temperature
• Speed of operation• Ease of operation• Small sample size
Popularity of DSC Technique
Information Obtained from DSC
•Glass Transition temperatures• Melting points and boiling points• Crystallization time and temperature• Percent crystallinity• Heats of fusion and reaction• Specific heat• Oxidative stability• Rate of cure• Degree of cure• Reaction kinetics• Purity• Thermal stability
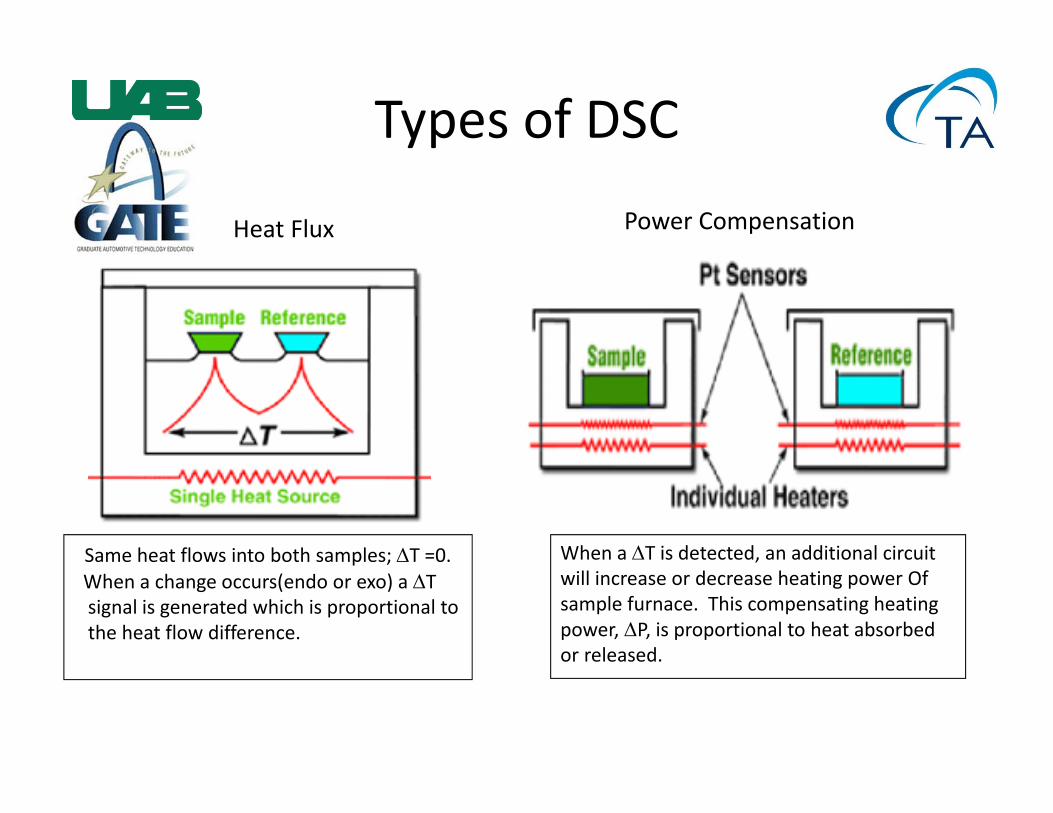
Types of DSC
Heat Flux Power Compensation
Same heat flows into both samples; T =0.When a change occurs(endo or exo) a Tsignal is generated which is proportional tothe heat flow difference.
When a T is detected, an additional circuit will increase or decrease heating power Of sample furnace. This compensating heating power, P, is proportional to heat absorbed or released.
18
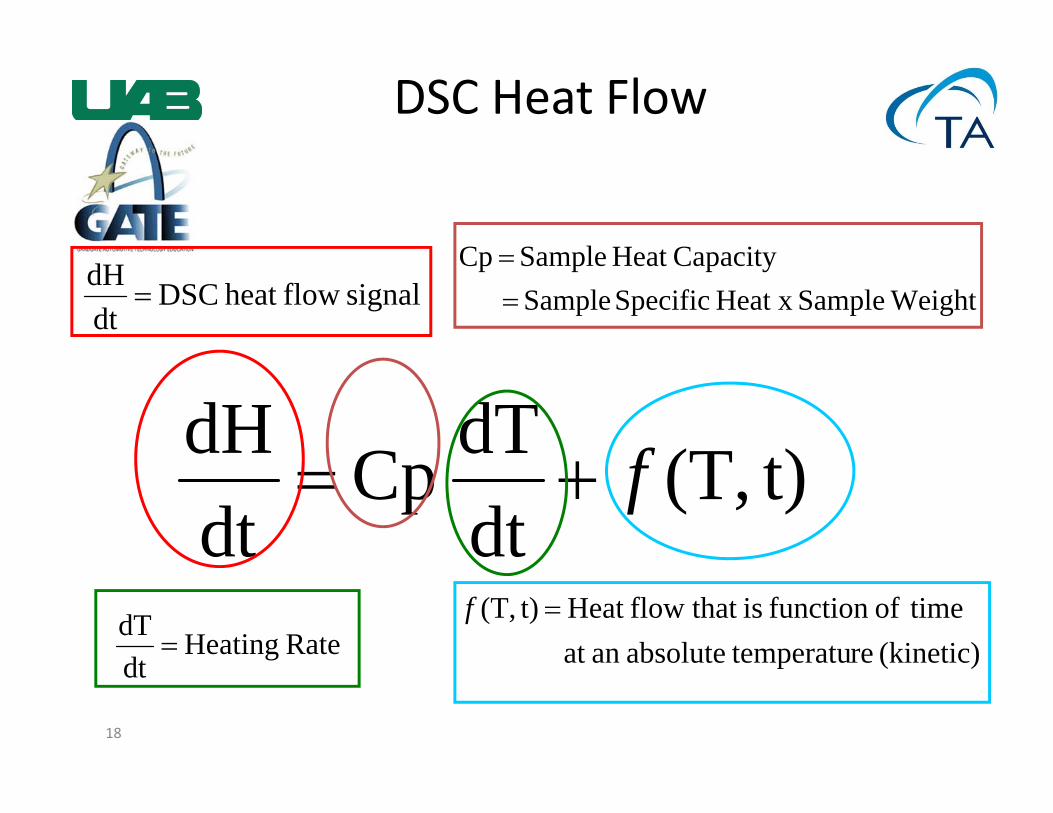
DSC Heat Flow
t)(T,dtdT Cp
dtdH f
signal flowheat DSC dtdH
Weight SampleHeat x Specific Sample CapacityHeat Sample Cp
Rate Heating dtdT
(kinetic) re temperatuabsolutean at timeoffunction is that flowHeat t)(T, f

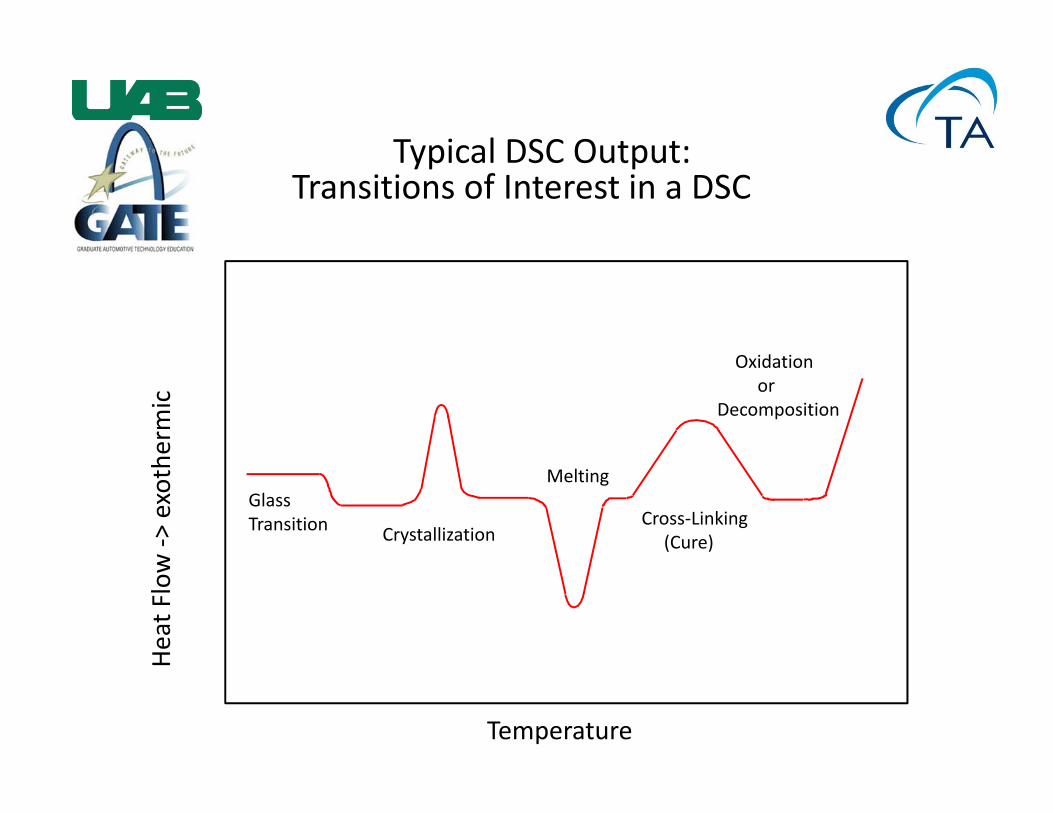
Typical DSC Output: Transitions of Interest in a DSC
Temperature
Heat Flow ‐>
exothermic
GlassTransition Crystallization
Melting
Cross‐Linking(Cure)
Oxidation or
Decomposition
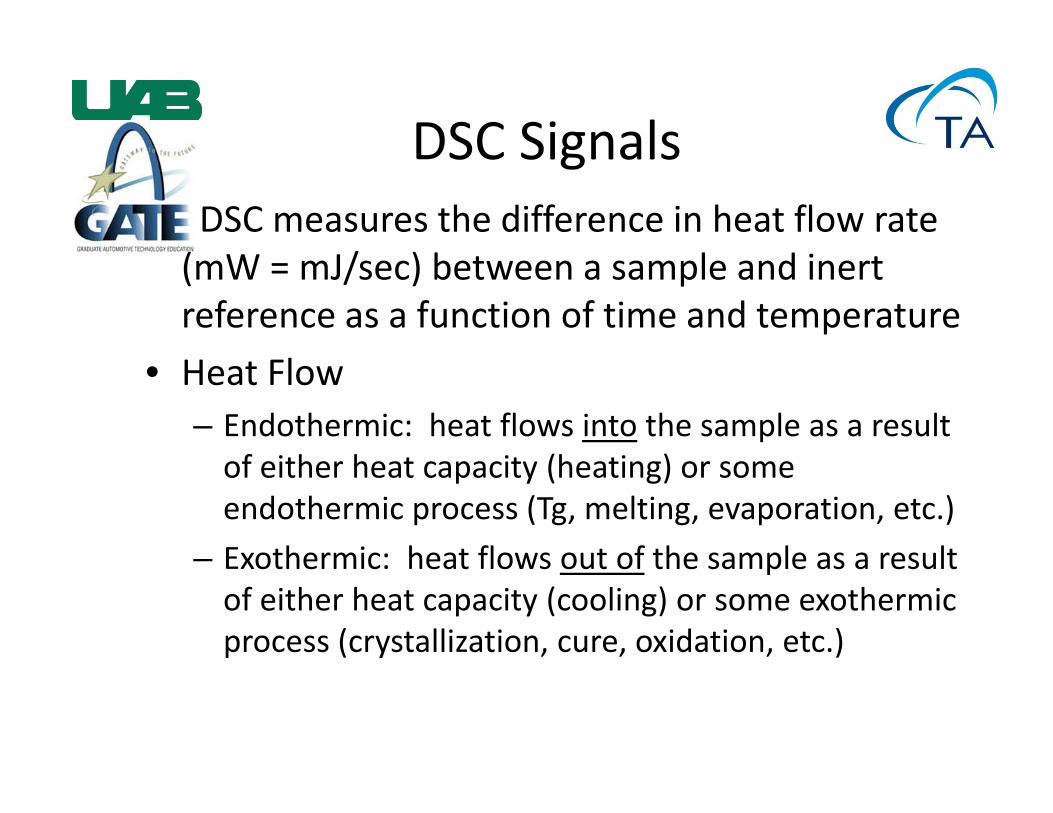
DSC SignalsDSC measures the difference in heat flow rate (mW = mJ/sec) between a sample and inert reference as a function of time and temperature
• Heat Flow– Endothermic: heat flows into the sample as a result of either heat capacity (heating) or some endothermic process (Tg, melting, evaporation, etc.)
– Exothermic: heat flows out of the sample as a result of either heat capacity (cooling) or some exothermic process (crystallization, cure, oxidation, etc.)
21
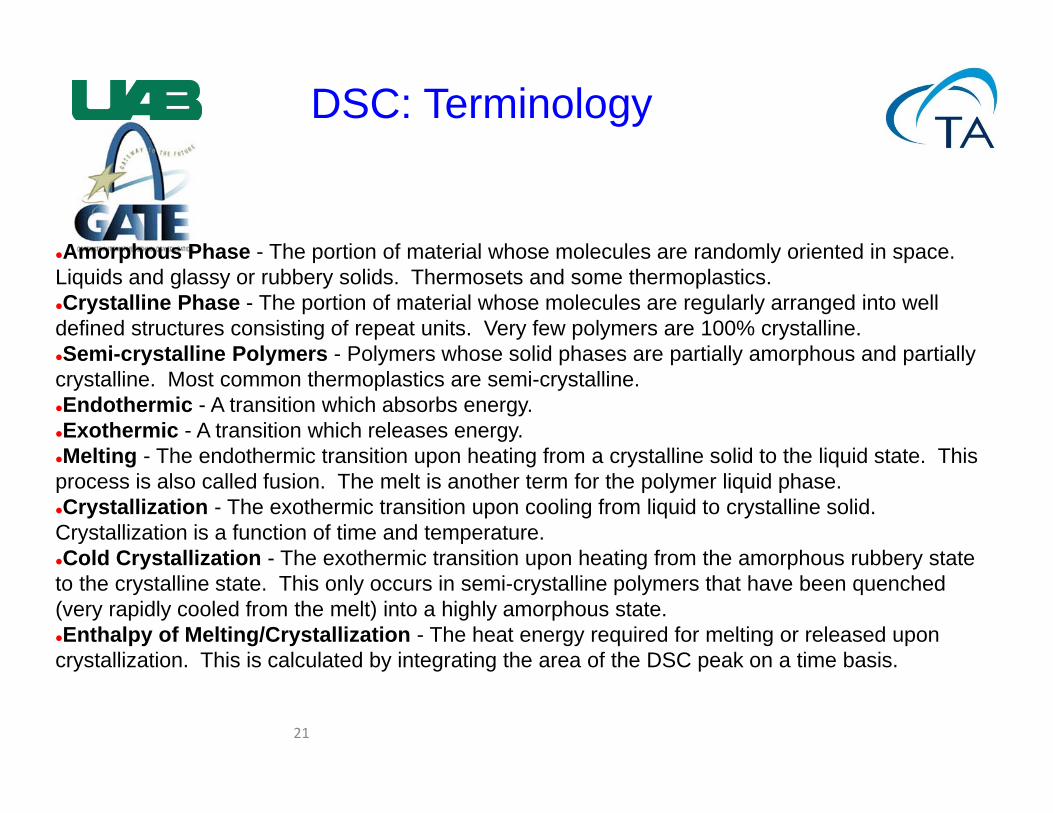
DSC: Terminology
Amorphous Phase - The portion of material whose molecules are randomly oriented in space. Liquids and glassy or rubbery solids. Thermosets and some thermoplastics.Crystalline Phase - The portion of material whose molecules are regularly arranged into well defined structures consisting of repeat units. Very few polymers are 100% crystalline.Semi-crystalline Polymers - Polymers whose solid phases are partially amorphous and partially crystalline. Most common thermoplastics are semi-crystalline.Endothermic - A transition which absorbs energy.Exothermic - A transition which releases energy.Melting - The endothermic transition upon heating from a crystalline solid to the liquid state. This process is also called fusion. The melt is another term for the polymer liquid phase.Crystallization - The exothermic transition upon cooling from liquid to crystalline solid. Crystallization is a function of time and temperature.Cold Crystallization - The exothermic transition upon heating from the amorphous rubbery state to the crystalline state. This only occurs in semi-crystalline polymers that have been quenched (very rapidly cooled from the melt) into a highly amorphous state.Enthalpy of Melting/Crystallization - The heat energy required for melting or released upon crystallization. This is calculated by integrating the area of the DSC peak on a time basis.
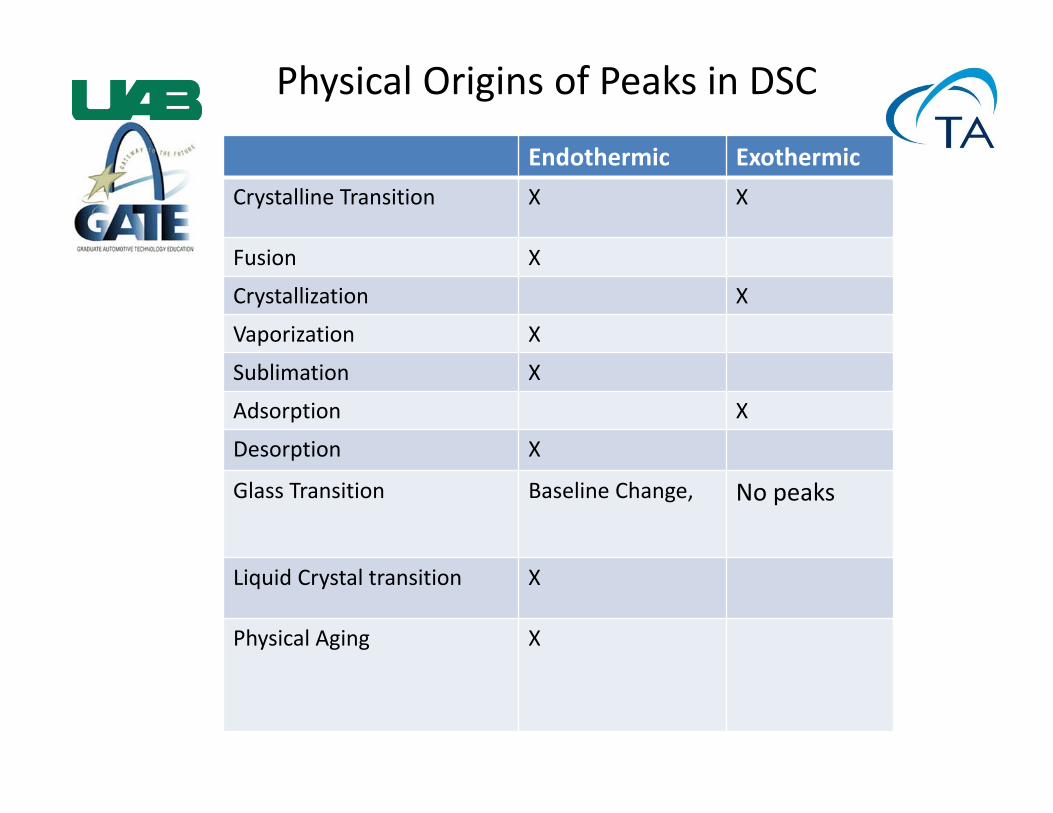
Physical Origins of Peaks in DSC
Endothermic ExothermicCrystalline Transition X X
Fusion X
Crystallization X
Vaporization X
Sublimation X
Adsorption X
Desorption X
Glass Transition Baseline Change, No peaks
Liquid Crystal transition X
Physical Aging X
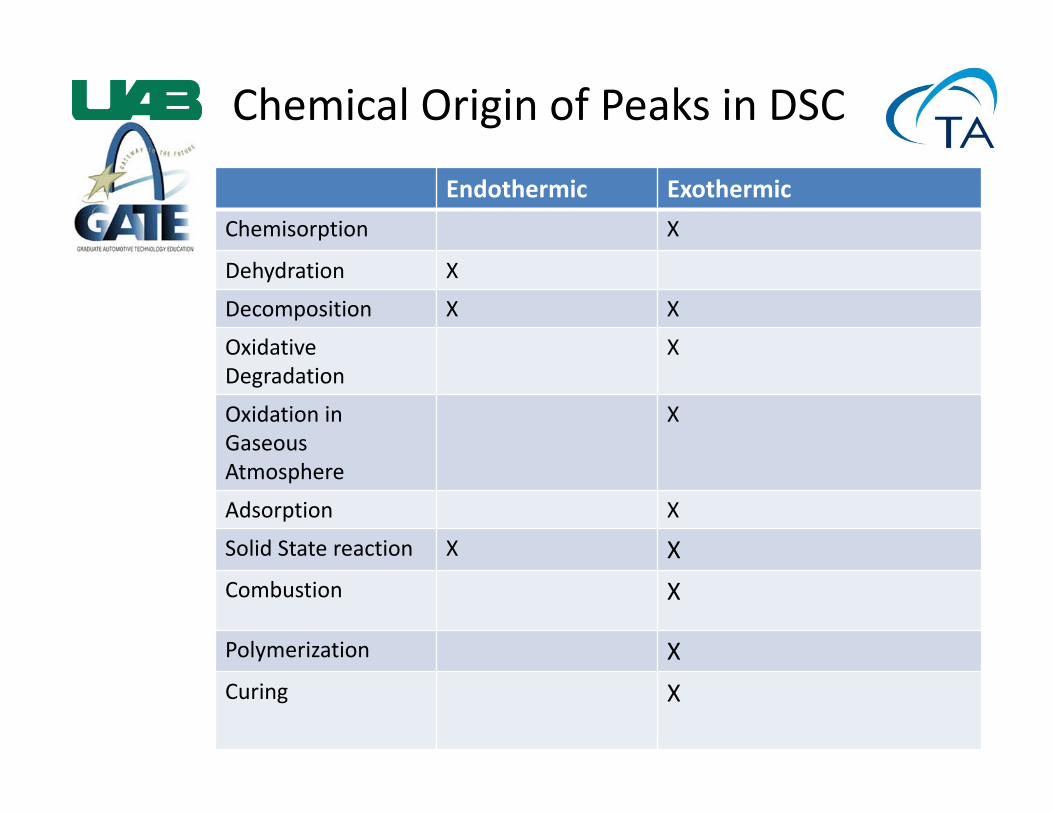
Chemical Origin of Peaks in DSC
Endothermic ExothermicChemisorption X
Dehydration X
Decomposition X X
Oxidative Degradation
X
Oxidation in Gaseous Atmosphere
X
Adsorption X
Solid State reaction X XCombustion X
Polymerization XCuring X
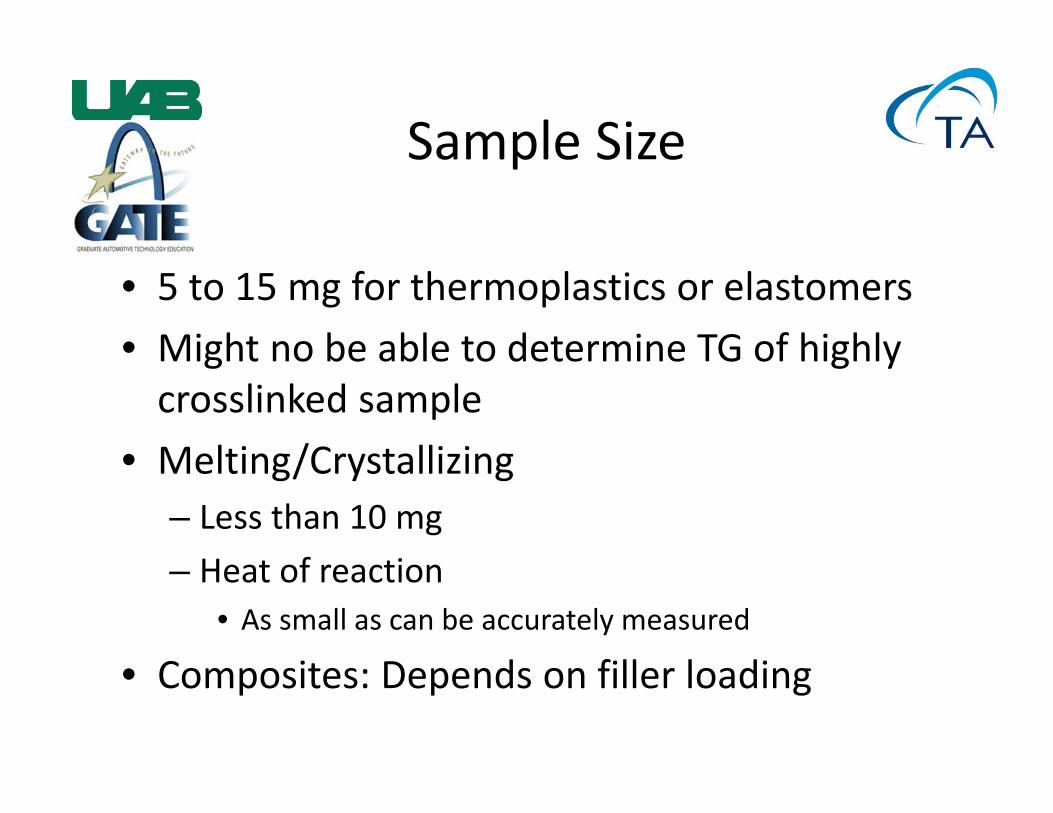
• 5 to 15 mg for thermoplastics or elastomers• Might no be able to determine TG of highly crosslinked sample
• Melting/Crystallizing– Less than 10 mg– Heat of reaction
• As small as can be accurately measured
• Composites: Depends on filler loading
Sample Size
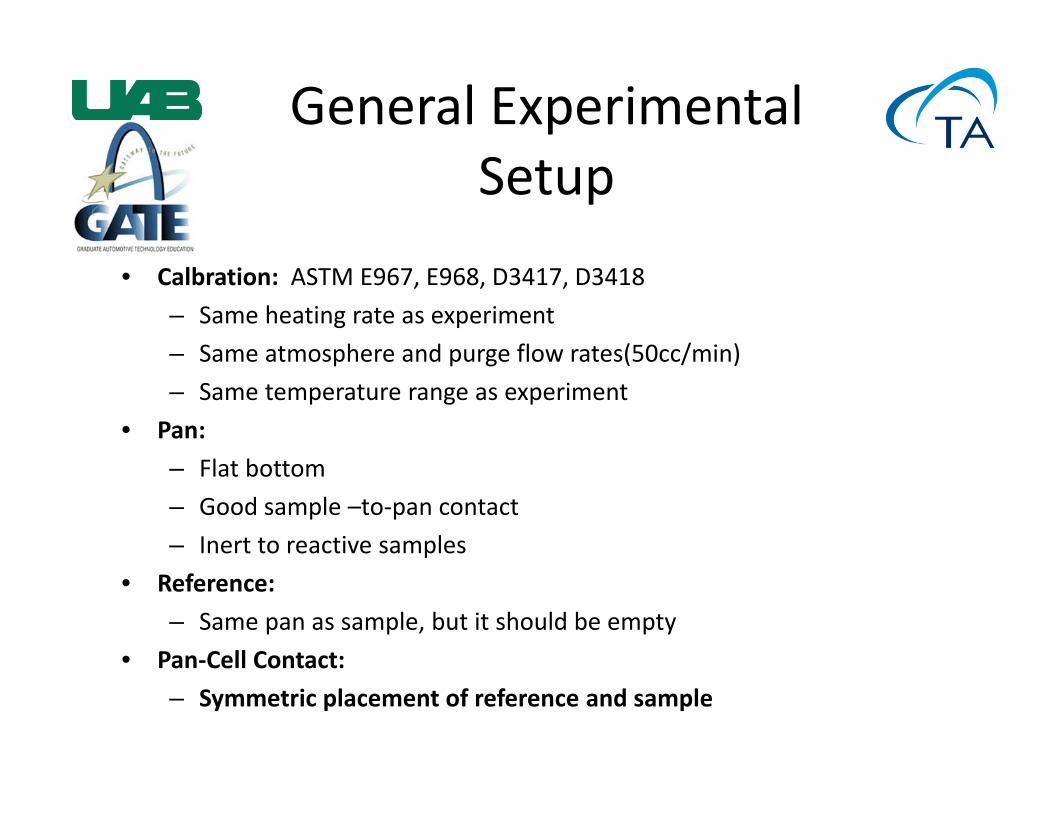
• Calbration: ASTM E967, E968, D3417, D3418– Same heating rate as experiment– Same atmosphere and purge flow rates(50cc/min)– Same temperature range as experiment
• Pan:– Flat bottom– Good sample –to‐pan contact– Inert to reactive samples
• Reference:– Same pan as sample, but it should be empty
• Pan‐Cell Contact:– Symmetric placement of reference and sample
General Experimental Setup
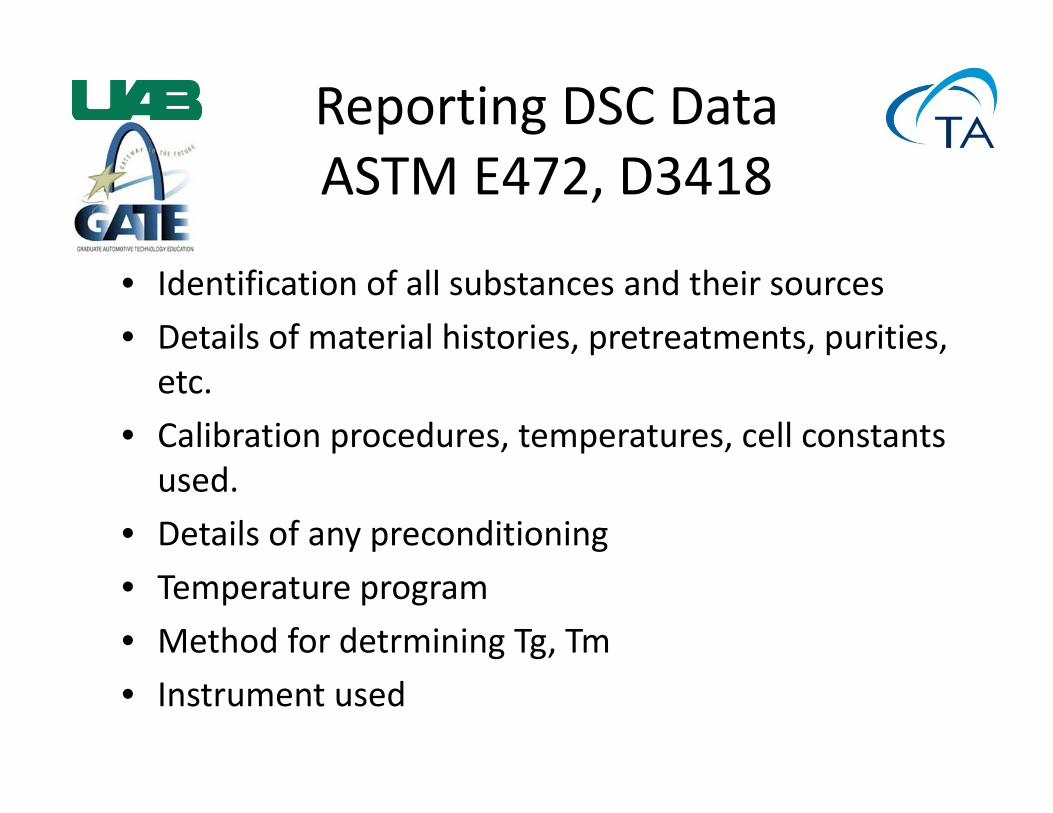
• Identification of all substances and their sources• Details of material histories, pretreatments, purities, etc.
• Calibration procedures, temperatures, cell constants used.
• Details of any preconditioning• Temperature program• Method for detrmining Tg, Tm • Instrument used
Reporting DSC DataASTM E472, D3418
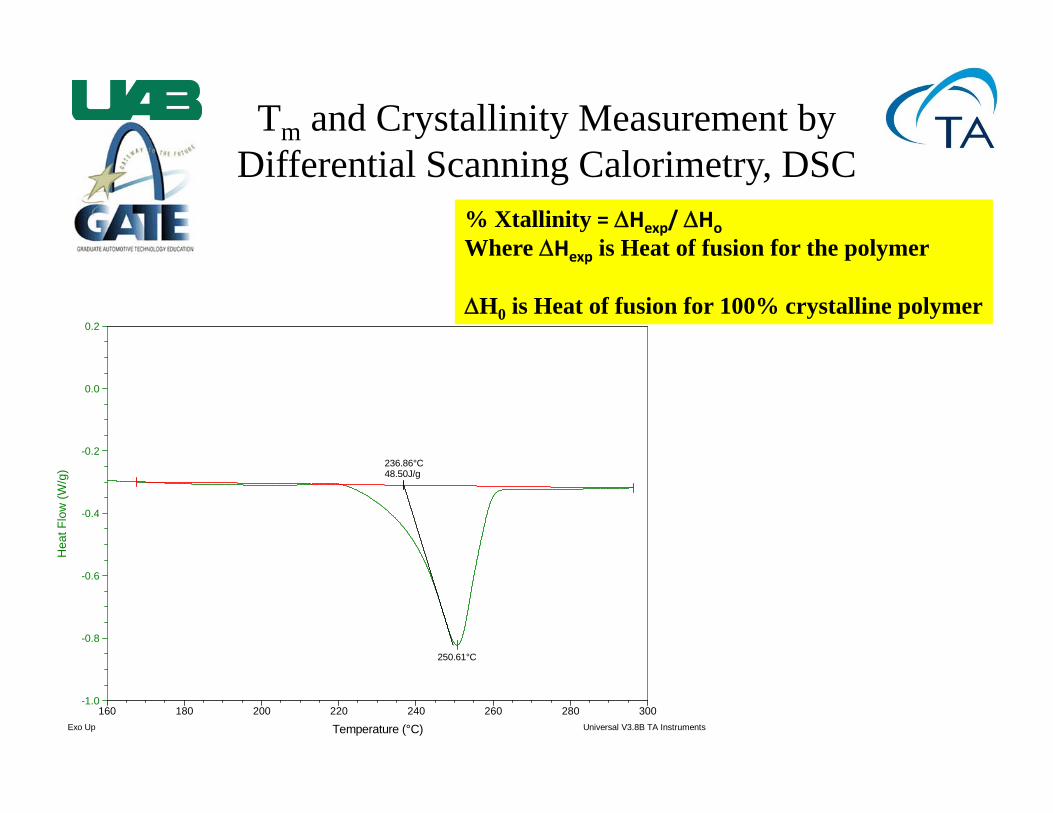
250.61°C
236.86°C48.50J/g
-1.0
-0.8
-0.6
-0.4
-0.2
0.0
0.2
Hea
t Flo
w (W
/g)
160 180 200 220 240 260 280 300
Temperature (°C)Exo Up Universal V3.8B TA Instruments
% Xtallinity = Hexp/ HoWhere Hexp is Heat of fusion for the polymer
H0 is Heat of fusion for 100% crystalline polymer
Tm and Crystallinity Measurement by Differential Scanning Calorimetry, DSC
Melting and Crystallization
• Melting is the endothermic transition from a crystalline solid to a liquid amorphous state
• Crystallization is the exothermic transition from amorphous to crystalline (normally from liquid to solid during cooling)
• Cold‐Crystallization is the exothermic transition during heating from a solid amorphous state to a solid crystalline state.
Typical DSC Output: Transitions of Interest in a DSC
Temperature
Heat Flow ‐>
exothermic
GlassTransition Crystallization
Melting
Cross‐Linking(Cure)
Oxidation or
Decomposition
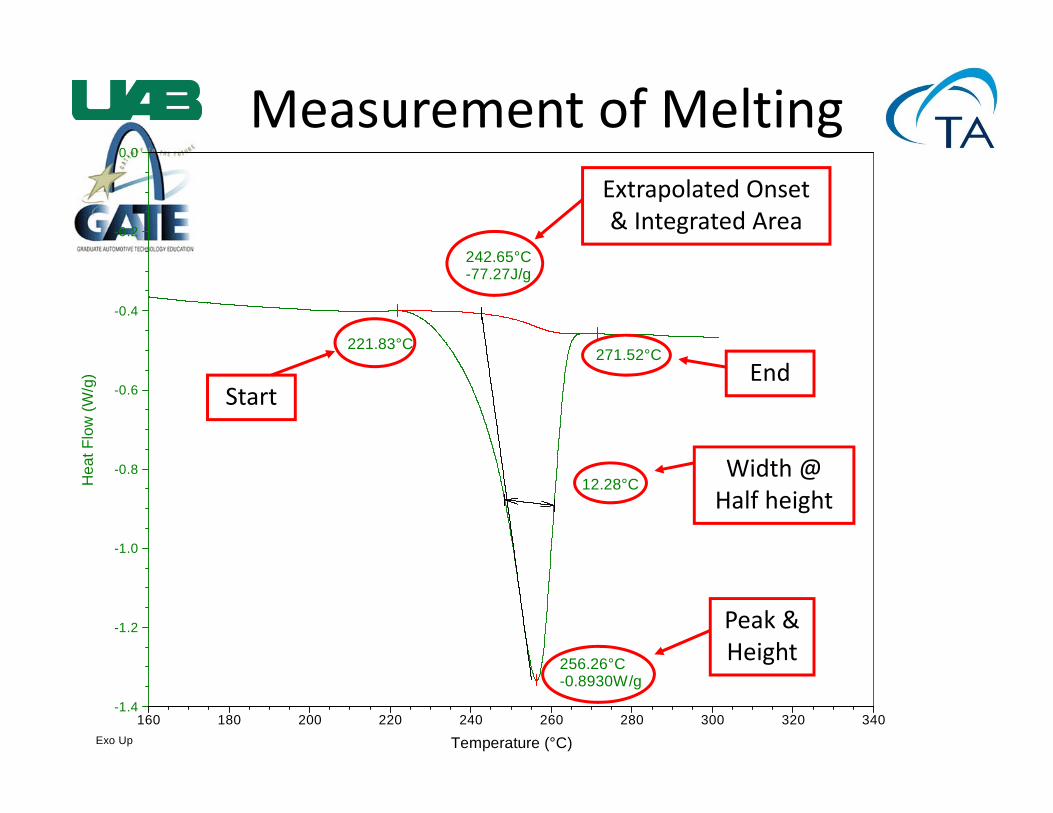
Measurement of Melting
221.83°C271.52°C
256.26°C-0.8930W/g
242.65°C-77.27J/g
12.28°C
-1.4
-1.2
-1.0
-0.8
-0.6
-0.4
-0.2
0.0
Hea
t Flo
w (W
/g)
160 180 200 220 240 260 280 300 320 340
Temperature (°C)Exo Up
StartEnd
Extrapolated Onset & Integrated Area
Width @ Half height
Peak & Height
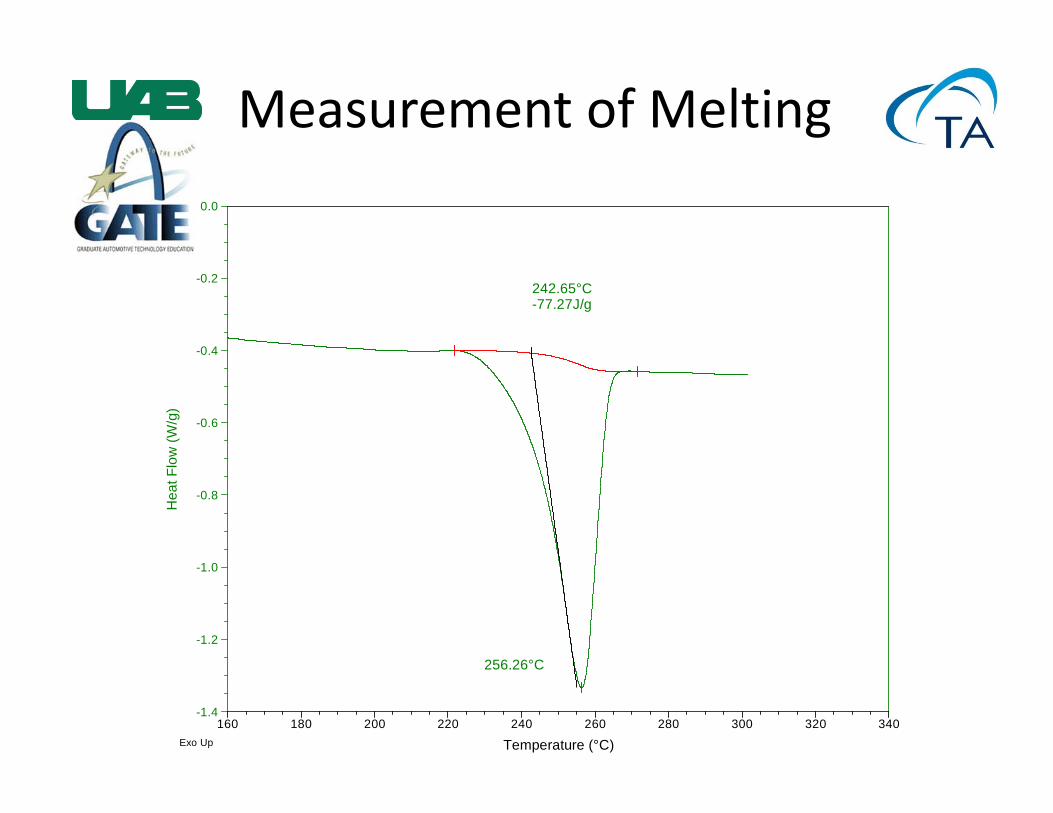
Measurement of Melting
256.26°C
242.65°C-77.27J/g
-1.4
-1.2
-1.0
-0.8
-0.6
-0.4
-0.2
0.0
Hea
t Flo
w (W
/g)
160 180 200 220 240 260 280 300 320 340
Temperature (°C)Exo Up
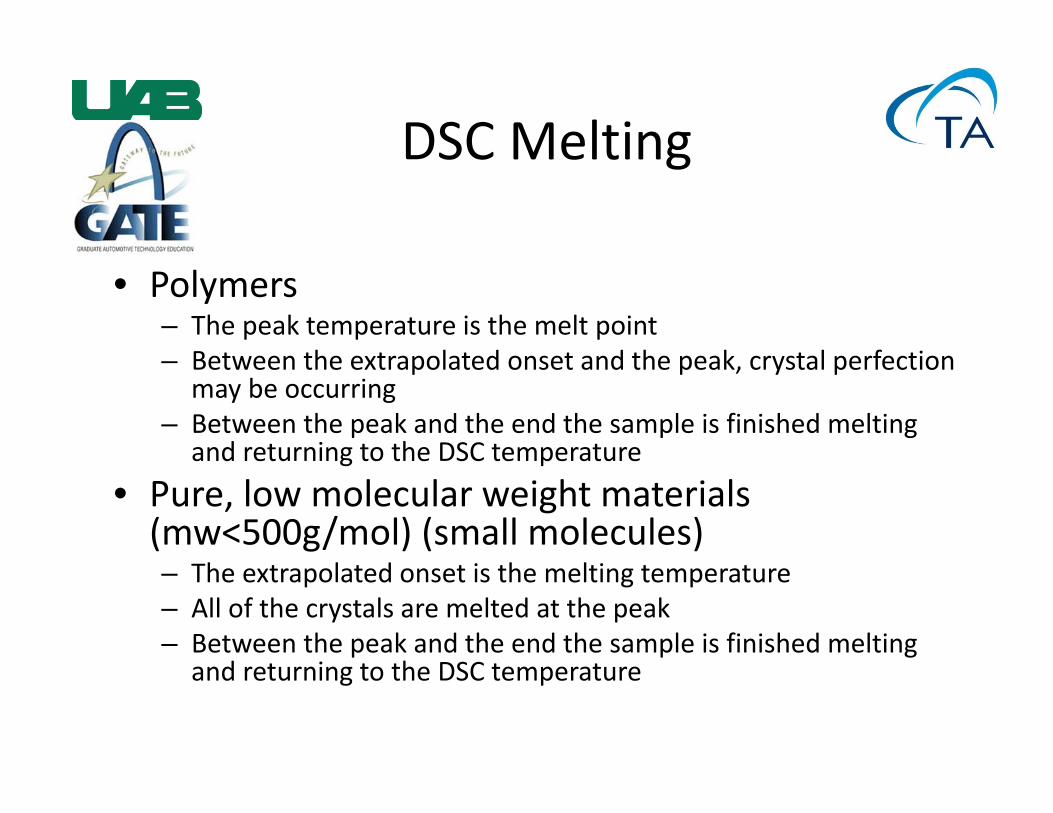
DSC Melting
• Polymers– The peak temperature is the melt point– Between the extrapolated onset and the peak, crystal perfection
may be occurring– Between the peak and the end the sample is finished melting
and returning to the DSC temperature• Pure, low molecular weight materials (mw<500g/mol) (small molecules)– The extrapolated onset is the melting temperature– All of the crystals are melted at the peak– Between the peak and the end the sample is finished melting
and returning to the DSC temperature
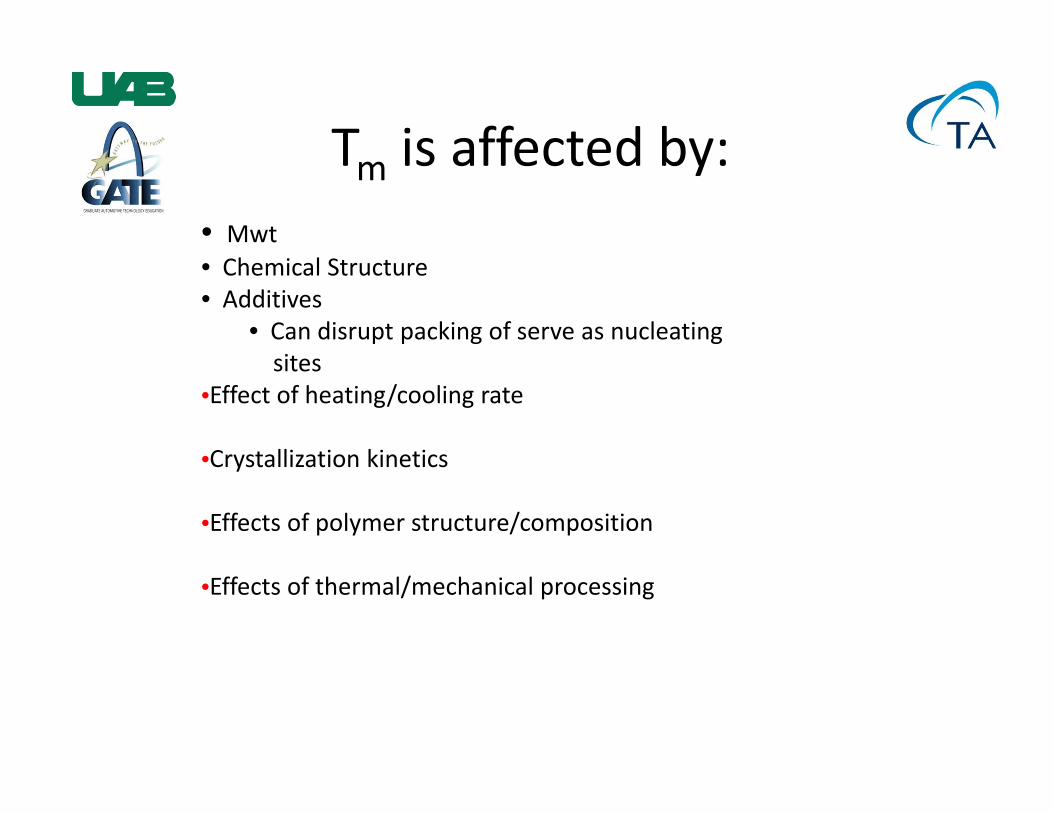
Tm is affected by:• Mwt• Chemical Structure• Additives
• Can disrupt packing of serve as nucleating sites
•Effect of heating/cooling rate
•Crystallization kinetics
•Effects of polymer structure/composition
•Effects of thermal/mechanical processing
34
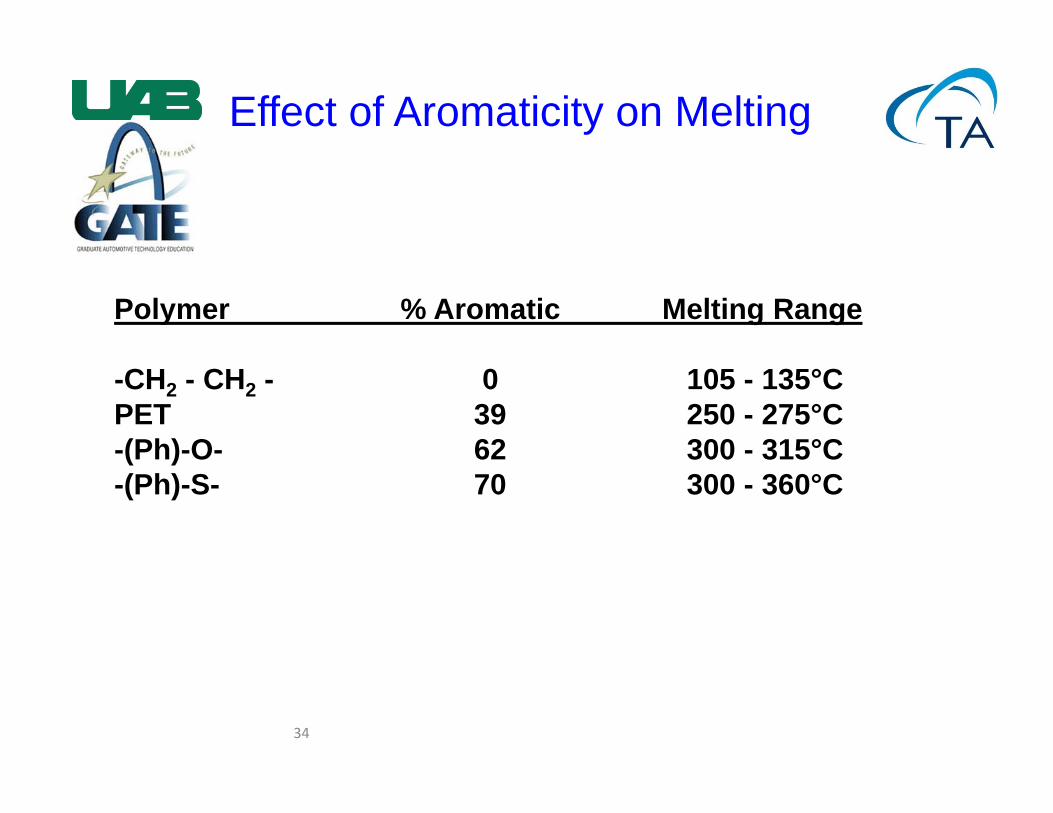
Effect of Aromaticity on Melting
Polymer % Aromatic Melting Range
-CH2 - CH2 - 0 105 - 135°CPET 39 250 - 275°C-(Ph)-O- 62 300 - 315°C-(Ph)-S- 70 300 - 360°C
35
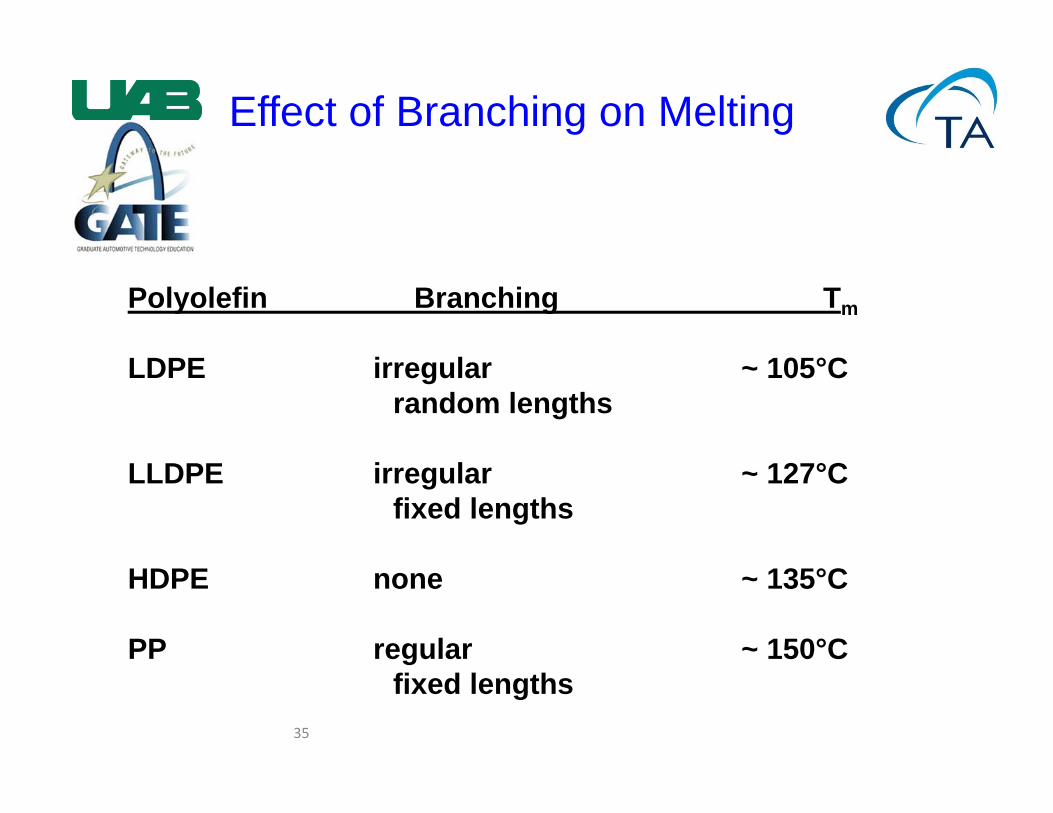
Effect of Branching on Melting
Polyolefin Branching Tm
LDPE irregular ~ 105°Crandom lengths
LLDPE irregular ~ 127°Cfixed lengths
HDPE none ~ 135°C
PP regular ~ 150°Cfixed lengths
36
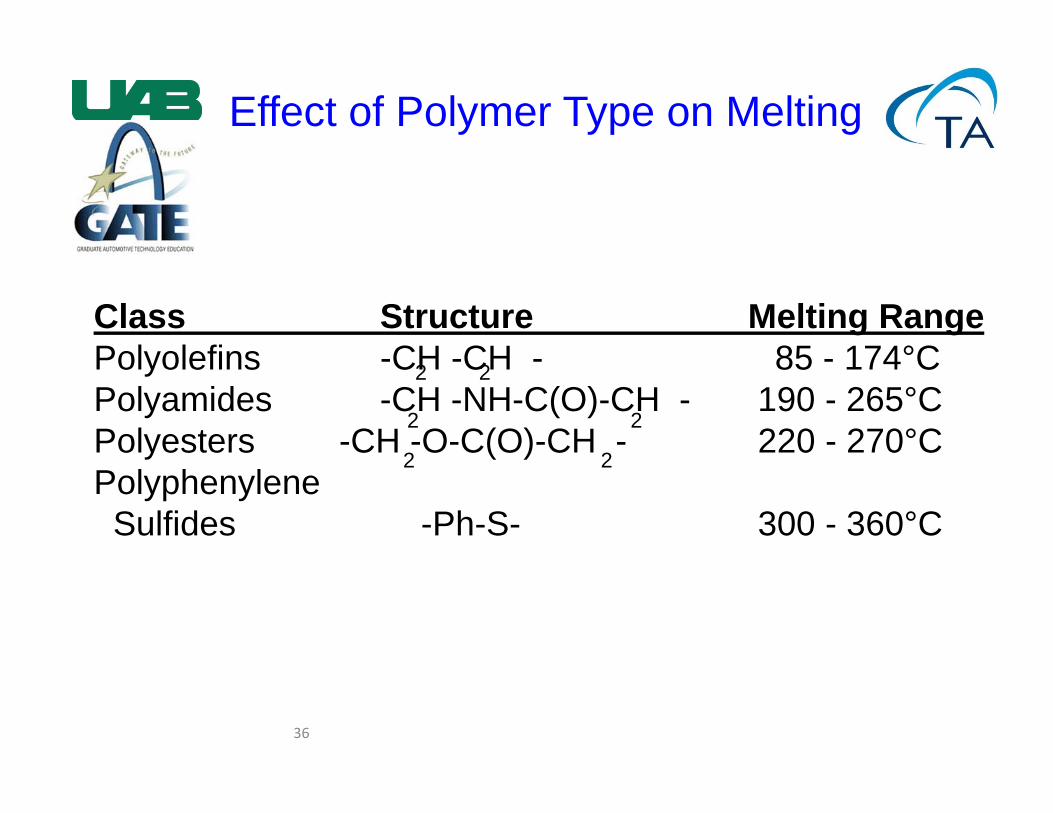
Effect of Polymer Type on Melting
Class Structure Melting RangePolyolefins -CH -CH - 85 - 174°CPolyamides -CH -NH-C(O)-CH - 190 - 265°CPolyesters -CH -O-C(O)-CH - 220 - 270°CPolyphenylene
Sulfides -Ph-S- 300 - 360°C
2 2
2 2
2 2
37
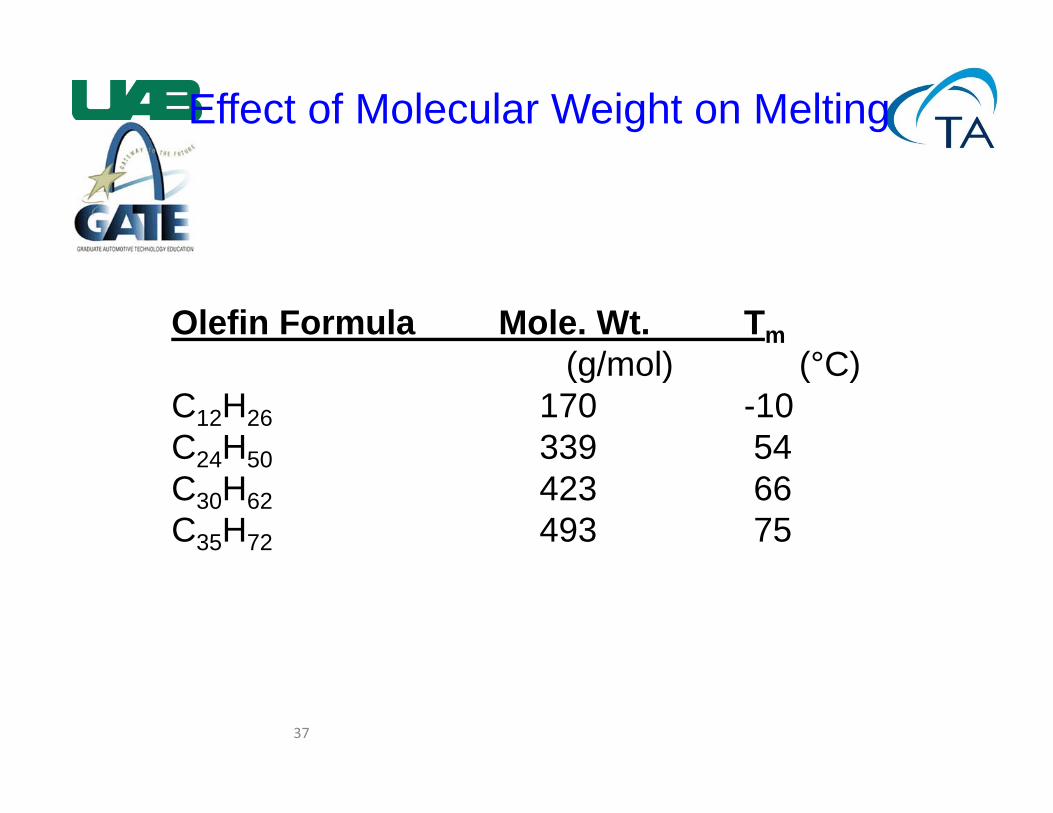
Effect of Molecular Weight on Melting
Olefin Formula Mole. Wt. Tm(g/mol) (°C)
C12H26 170 -10C24H50 339 54C30H62 423 66C35H72 493 75
38
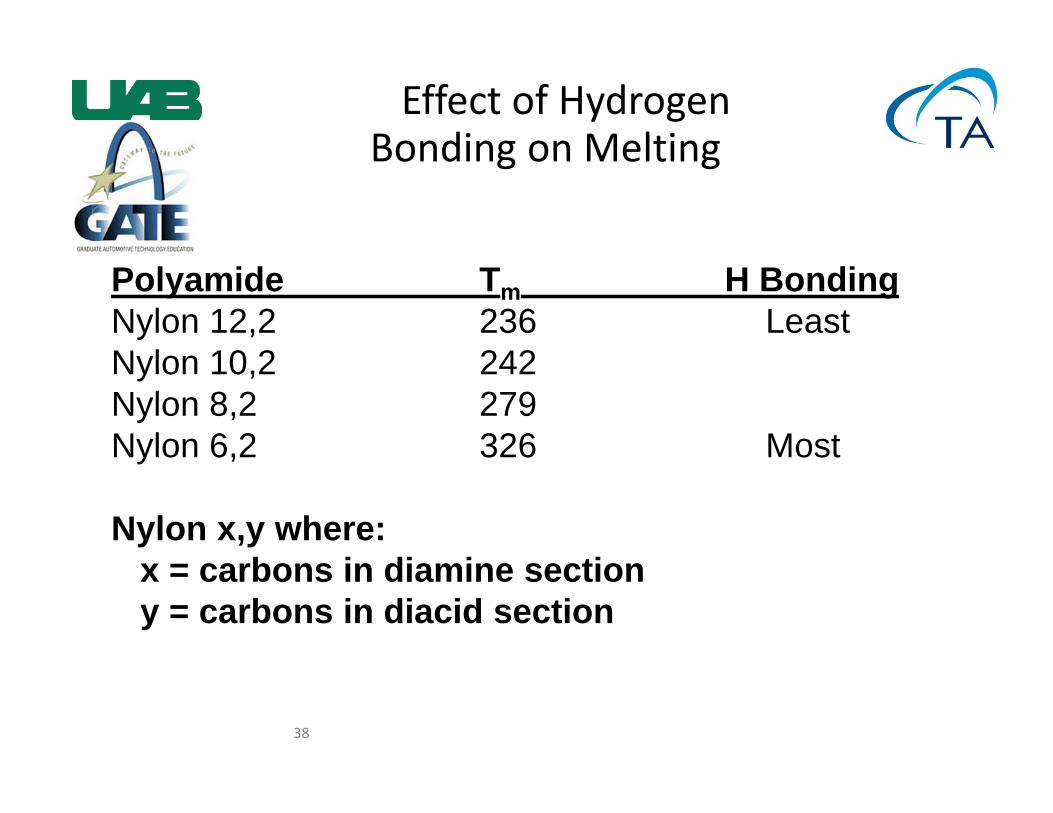
Effect of Hydrogen Bonding on Melting
Polyamide Tm H BondingNylon 12,2 236 LeastNylon 10,2 242Nylon 8,2 279Nylon 6,2 326 Most
Nylon x,y where:x = carbons in diamine sectiony = carbons in diacid section
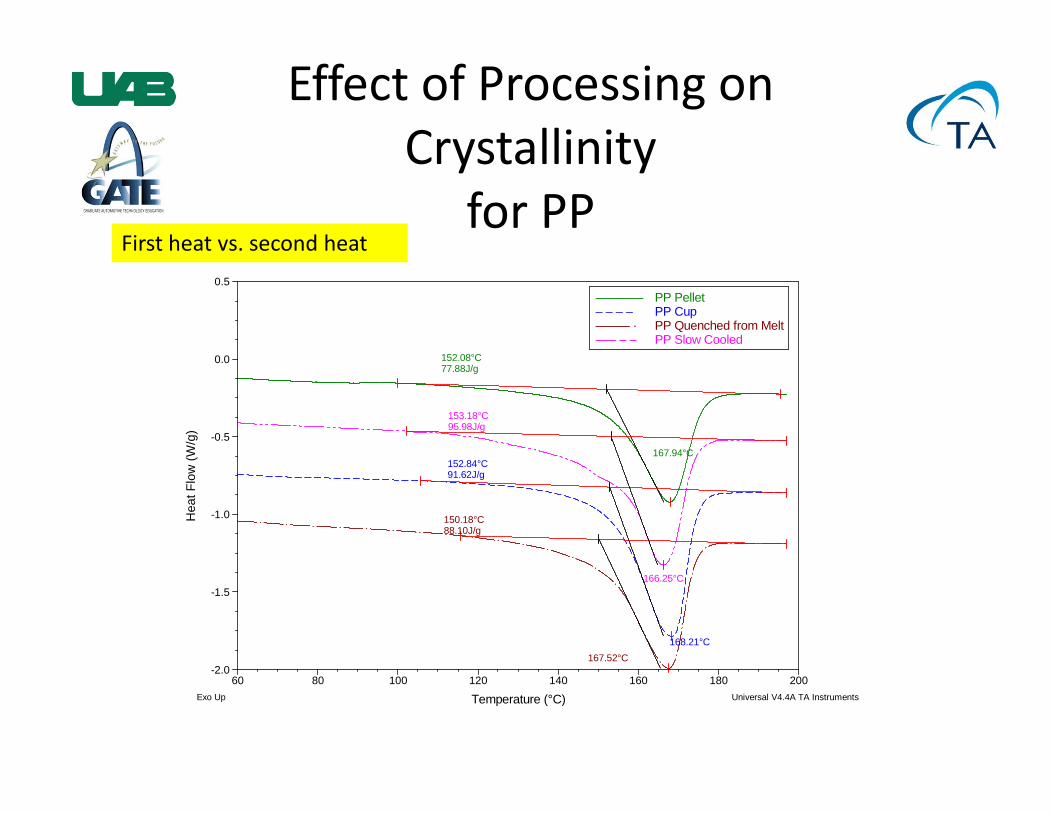
Effect of Processing on Crystallinity
for PP
167.94°C
152.08°C77.88J/g
168.21°C
152.84°C91.62J/g
167.52°C
150.18°C88.10J/g
166.25°C
153.18°C95.98J/g
-2.0
-1.5
-1.0
-0.5
0.0
0.5
Hea
t Flo
w (W
/g)
60 80 100 120 140 160 180 200
Temperature (°C)
PP Pellet––––––– PP Cup– – – – PP Quenched from Melt––––– · PP Slow Cooled––– – –
Exo Up Universal V4.4A TA Instruments
First heat vs. second heat
Observation of Crystallization
•Crystallization is a two step process:NucleationGrowth
•The extrapolated onset is the nucleation temperature
•The peak maximum is the crystallization temperature
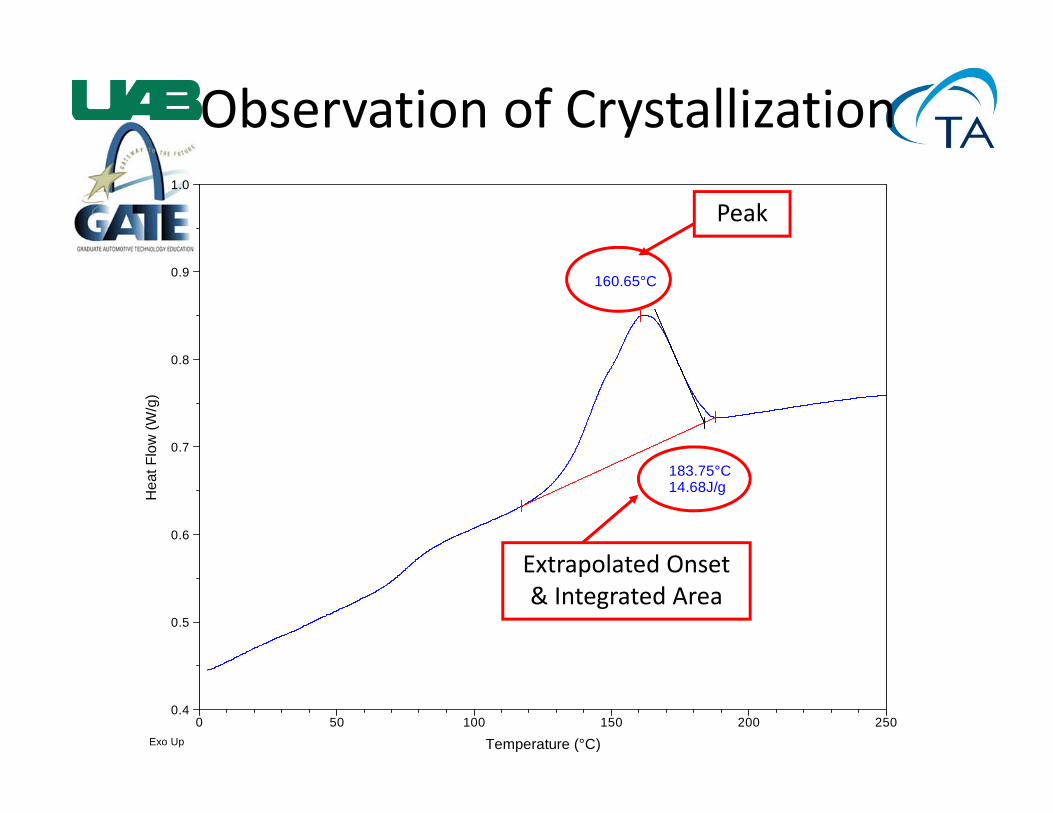
Observation of Crystallization
160.65°C
183.75°C14.68J/g
0.4
0.5
0.6
0.7
0.8
0.9
1.0
Hea
t Flo
w (W
/g)
0 50 100 150 200 250
Temperature (°C)Exo Up
Extrapolated Onset & Integrated Area
Peak
0.0
0.5
1.0
1.5
2.0
Hea
t Flo
w (W
/g)
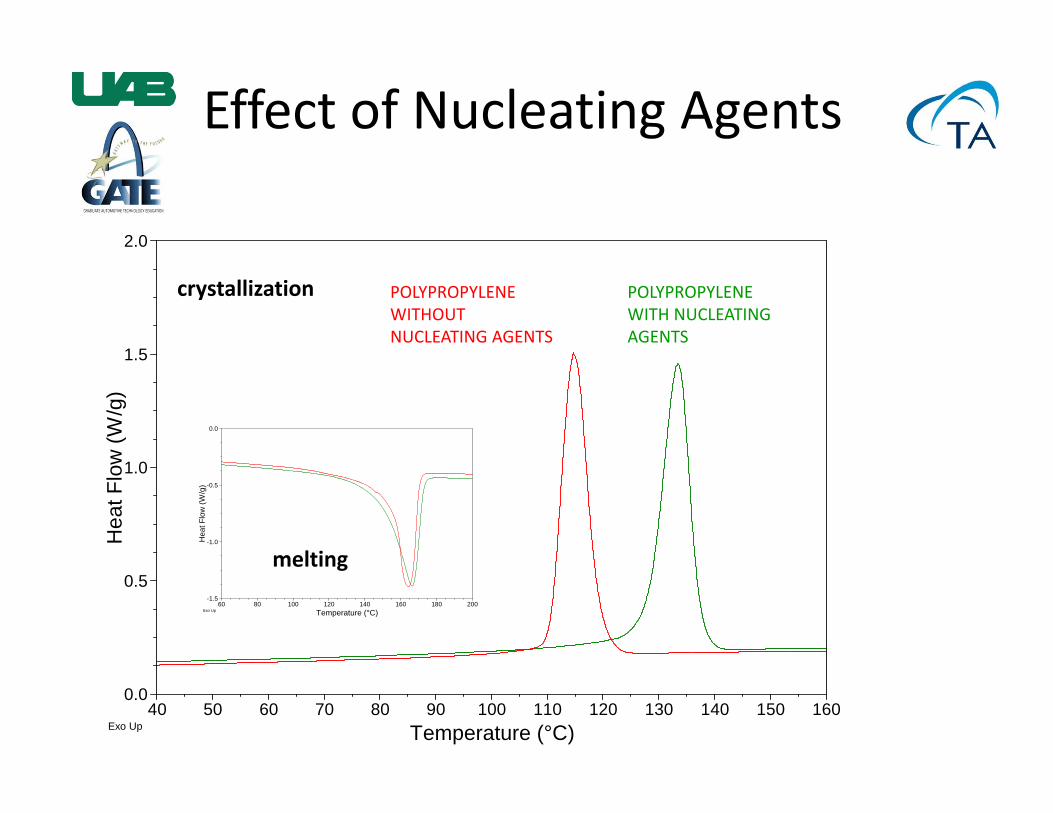
40 50 60 70 80 90 100 110 120 130 140 150 160Temperature (°C)Exo Up
POLYPROPYLENEWITH NUCLEATING AGENTS
POLYPROPYLENEWITHOUT NUCLEATING AGENTS
-1.5
-1.0
-0.5
0.0
Hea
t Flo
w (W
/g)
60 80 100 120 140 160 180 200Temperature (°C)Exo Up
crystallization
melting
Effect of Nucleating Agents
43
DSC: Applications
Effect of heating/cooling rate
Crystallization kinetics
Effects of polymer structure/composition
Effects of thermal/mechanical processing
44
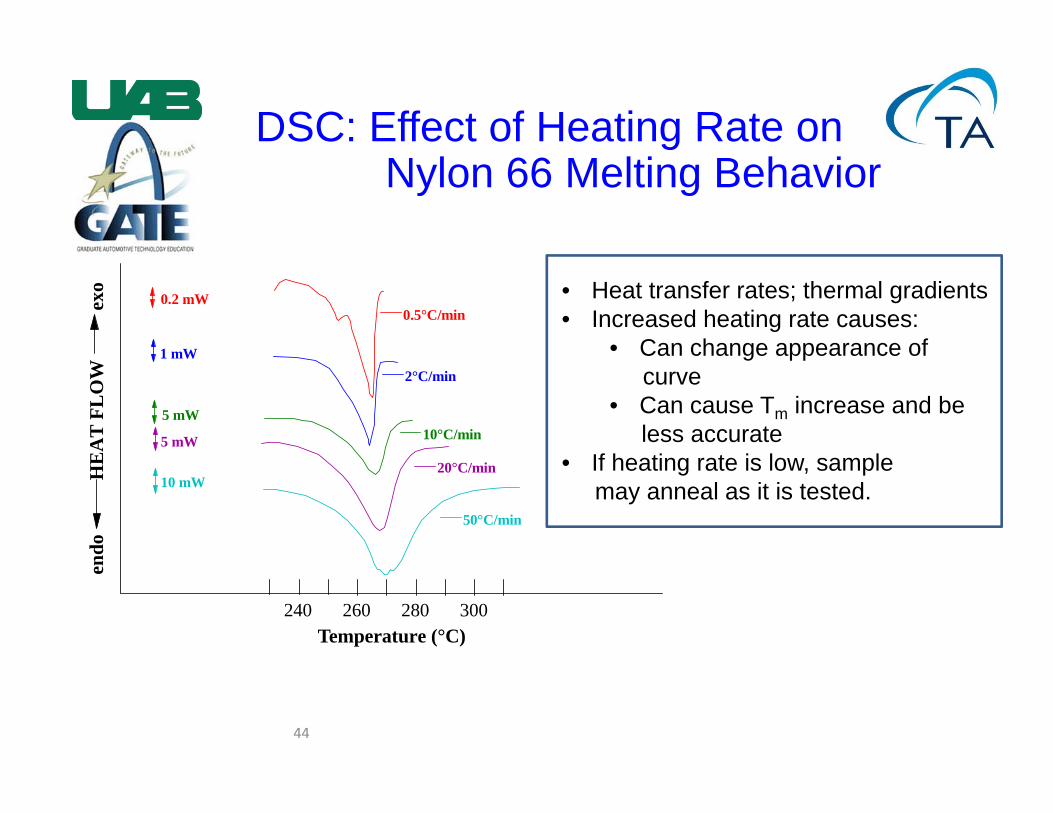
DSC: Effect of Heating Rate onNylon 66 Melting Behavior
1 2 3 4Temperature (°C)
endo
H
EA
T F
LO
W
exo
240 260 280 300
0.2 mW
1 mW
5 mW
5 mW
10 mW
50°C/min
20°C/min
10°C/min
2°C/min
0.5°C/min• Heat transfer rates; thermal gradients• Increased heating rate causes:
• Can change appearance ofcurve
• Can cause Tm increase and beless accurate
• If heating rate is low, sample may anneal as it is tested.
Effect of Sample Mass
46
DSC: Crystallization Kinetics
Two step process Nucleation Crystal growthNucleation may be Natural Induced (using nucleation agents)Thermally influenced process Natural nucleation Crystal growth Modeled by Isothermal Kinetics using the
Autocatalytic Model
47
DSC: Isothermal Crystallization Procedure
Heat to 10°C above Tm
Hold for 5 minutes to remove local order
Cool rapidly to below melt onset (DO NOT OVERSHOOT TEMP)
Hold isothermally
Record time to crystallization peak (t )
48
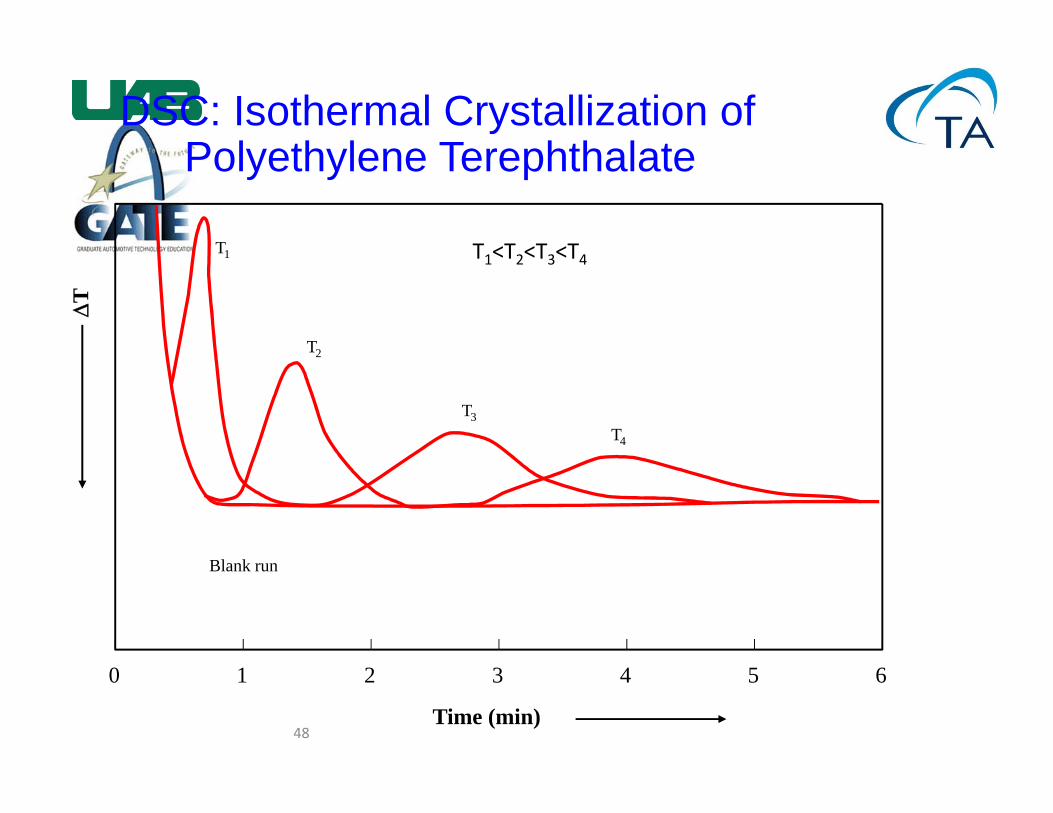
DSC: Isothermal Crystallization ofPolyethylene Terephthalate
0 1 2 3 4 5 6
Time (min)
T
T1
T2
T3T4
Blank run
T1<T2<T3<T4
49
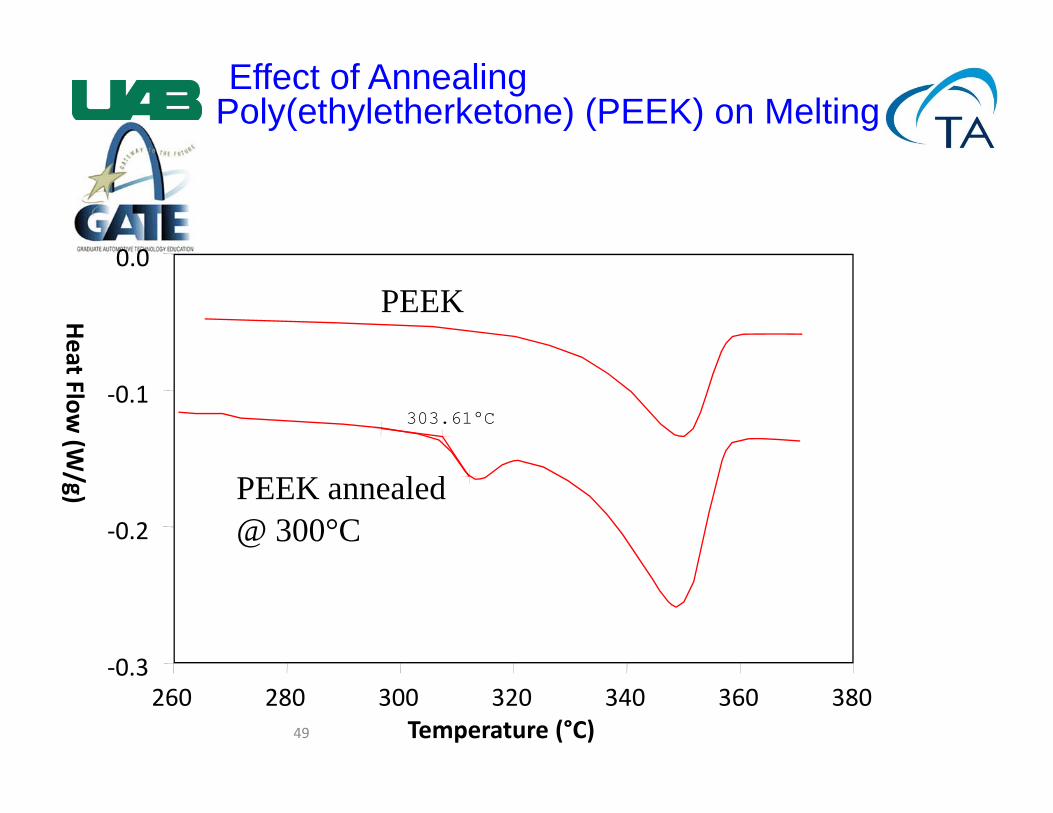
Effect of AnnealingPoly(ethyletherketone) (PEEK) on Melting
Heat Flow
(W/g)
260 280 300 320 340 360 380‐0.3
‐0.2
‐0.1
0.0
Temperature (°C)
PEEK annealed@ 300°C
PEEK
303.61°C
50
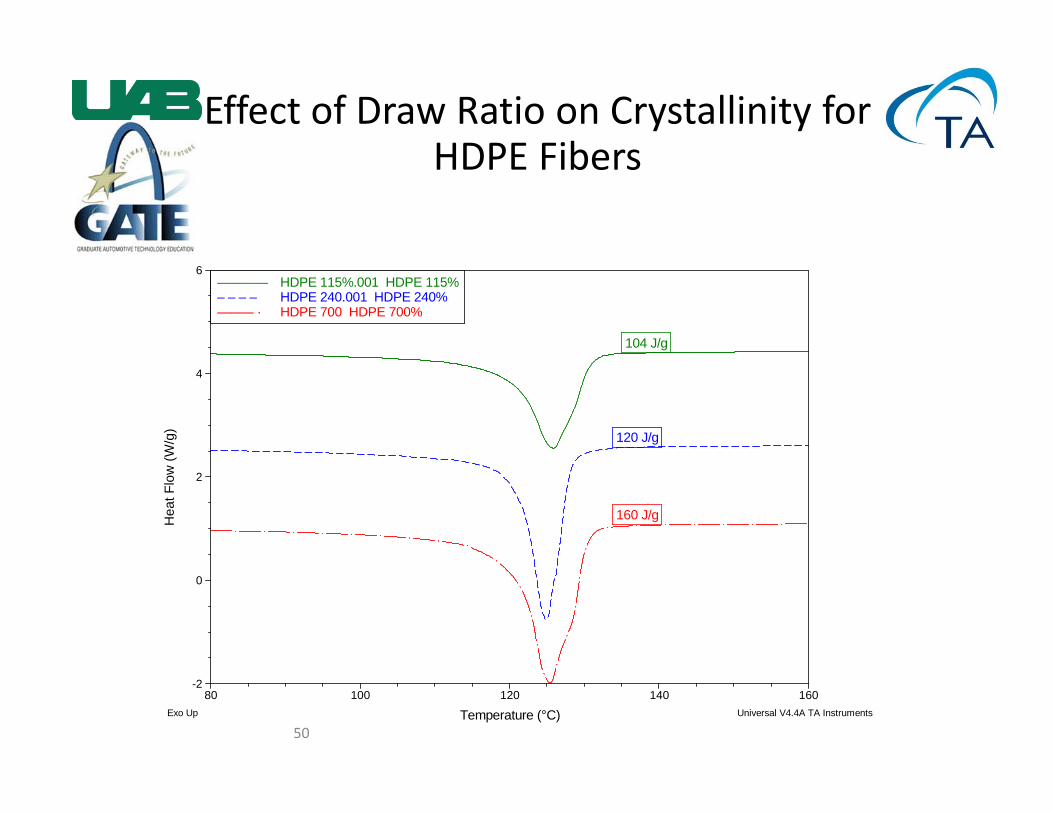
Effect of Draw Ratio on Crystallinity for HDPE Fibers
104 J/g
120 J/g
160 J/g
-2
0
2
4
6
Hea
t Flo
w (W
/g)
80 100 120 140 160
Temperature (°C)
HDPE 115%.001 HDPE 115%––––––– HDPE 240.001 HDPE 240%– – – – HDPE 700 HDPE 700%––––– ·
Exo Up Universal V4.4A TA Instruments
51
Melting and Crystallization -Summary
Melting and crystallization are phase changes from organized solid to amorphous phases and vice-versa.
Melting is a one-step process while crystallization involves nucleation and crystal growth.
The enthalpy of melting can be used to measure crystallinity or filler.
Any process that makes it easier for molecules to be organized will raise the melting temperature.
The Glass Transition Temperature, Tg
• Observed in amorphous thermoplastics but not all semicrystalline thermoplastics
• Observed in thermosets– Exceptions:
• Extremely high crosslink densities• Very rigid backbones
The Glass Transition
• The Glass Transition is 1.) the reversible change of the amorphous region of a polymer from, or to, a viscous or rubbery condition to, or from, a hard and relatively brittle one. 2.) onset of large scale, cooperative motion of the polymer chains.
• The Glass Transition Temperature is a temperature taken to represent the temperature range over which the glass transition takes place
• Detected by DSC as an increase in Cp
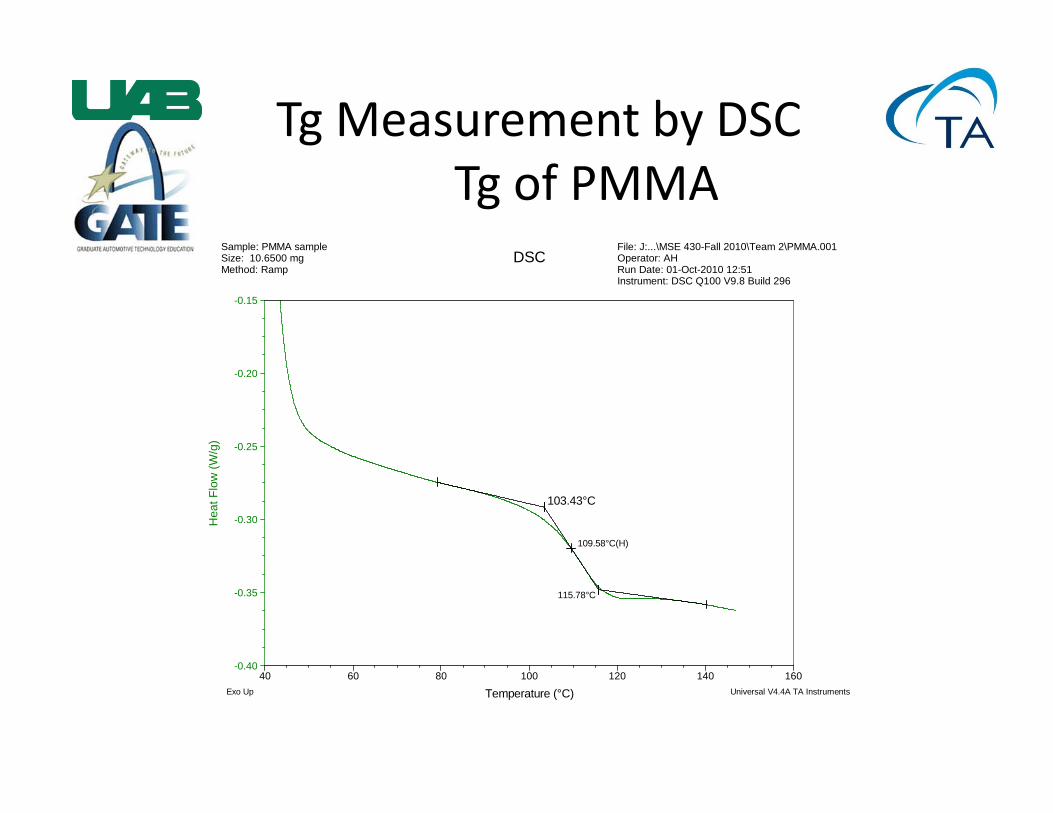
Tg Measurement by DSCTg of PMMA
109.58°C(H)
103.43°C
115.78°C
-0.40
-0.35
-0.30
-0.25
-0.20
-0.15
Hea
t Flo
w (W
/g)
40 60 80 100 120 140 160
Temperature (°C)
Sample: PMMA sampleSize: 10.6500 mgMethod: Ramp
DSCFile: J:...\MSE 430-Fall 2010\Team 2\PMMA.001Operator: AHRun Date: 01-Oct-2010 12:51Instrument: DSC Q100 V9.8 Build 296
Exo Up Universal V4.4A TA Instruments
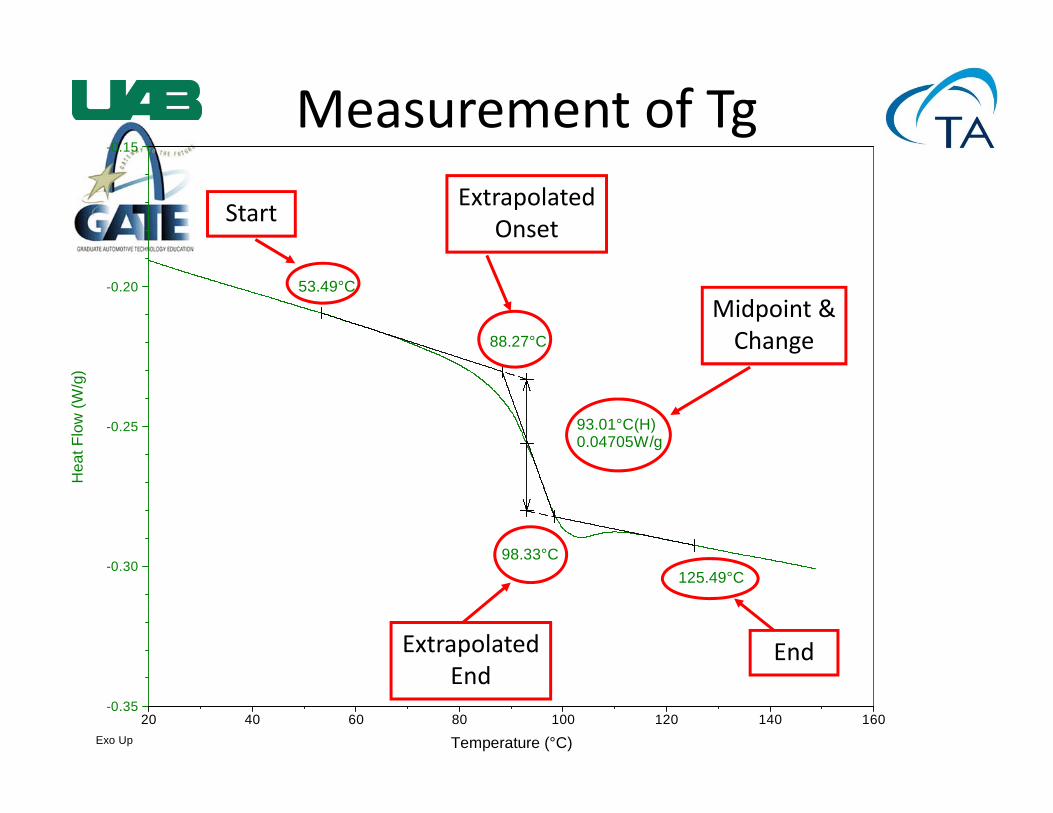
Measurement of Tg
93.01°C(H)0.04705W/g
88.27°C
98.33°C
53.49°C
125.49°C
-0.35
-0.30
-0.25
-0.20
-0.15
Hea
t Flo
w (W
/g)
20 40 60 80 100 120 140 160
Temperature (°C)Exo Up
Start
End
Extrapolated Onset
Extrapolated End
Midpoint & Change
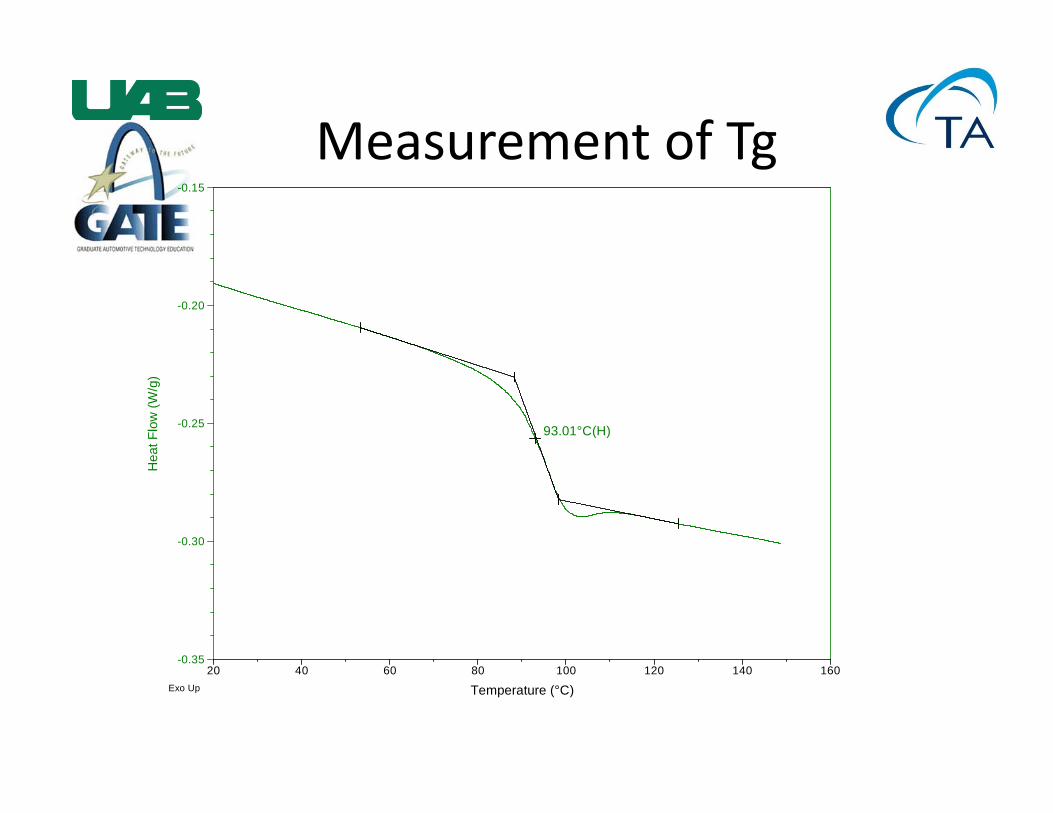
Measurement of Tg
93.01°C(H)
-0.35
-0.30
-0.25
-0.20
-0.15
Hea
t Flo
w (W
/g)
20 40 60 80 100 120 140 160
Temperature (°C)Exo Up
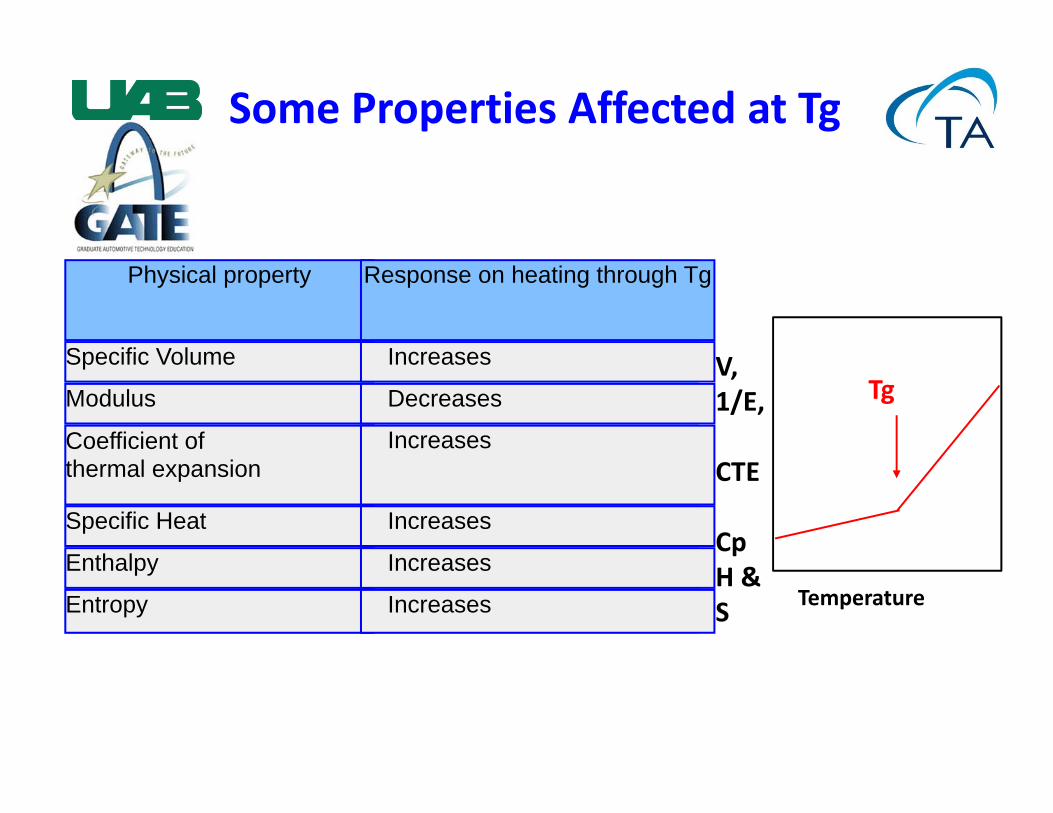
Some Properties Affected at Tg
Physical property Response on heating through Tg
Specific Volume Increases
Modulus Decreases
Coefficient of thermal expansion
Increases
Specific Heat Increases
Enthalpy Increases
Entropy Increases Temperature
V,1/E,
CTE
CpH &S
Tg
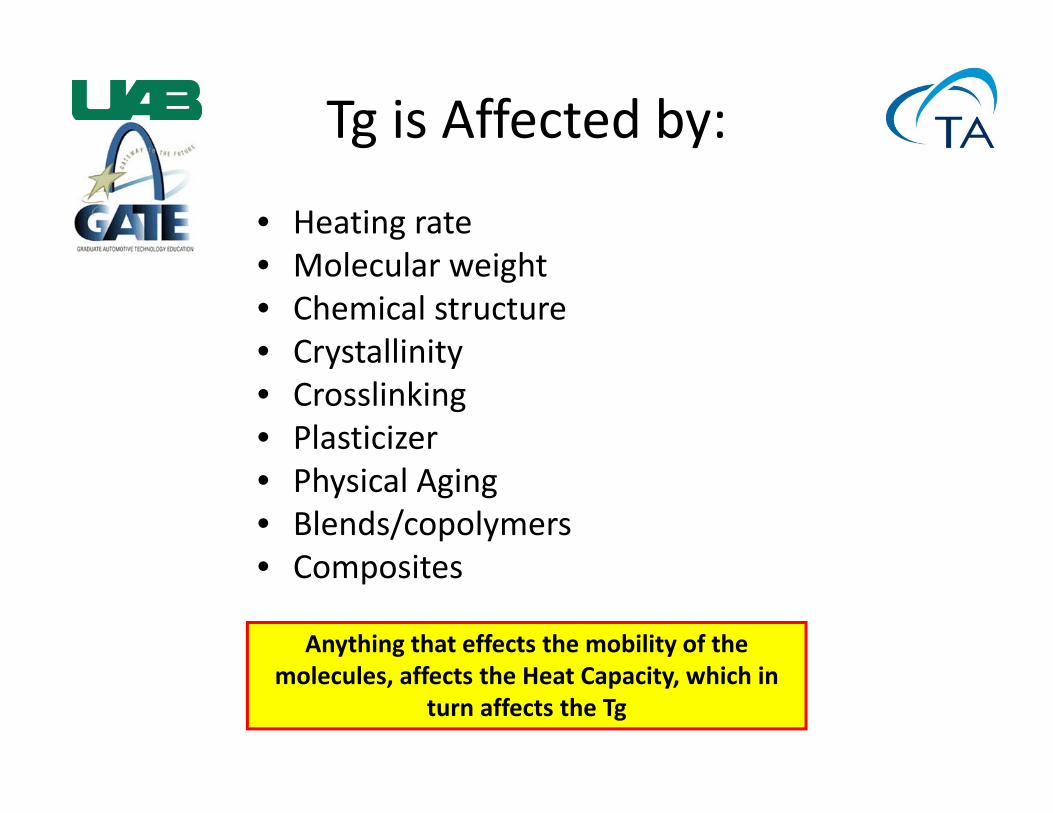
Tg is Affected by:
• Heating rate• Molecular weight• Chemical structure• Crystallinity• Crosslinking• Plasticizer• Physical Aging• Blends/copolymers• Composites
Anything that effects the mobility of the molecules, affects the Heat Capacity, which in
turn affects the Tg
59
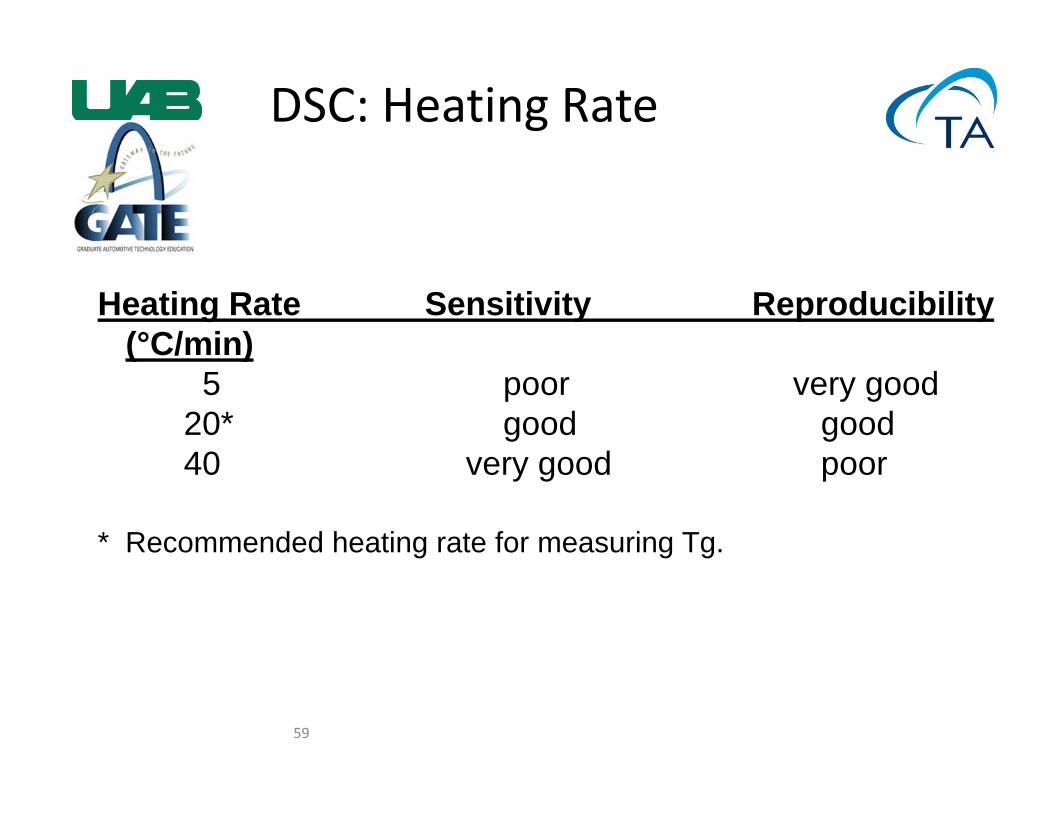
DSC: Heating Rate
Heating Rate Sensitivity Reproducibility(°C/min)
5 poor very good20* good good40 very good poor
* Recommended heating rate for measuring Tg.
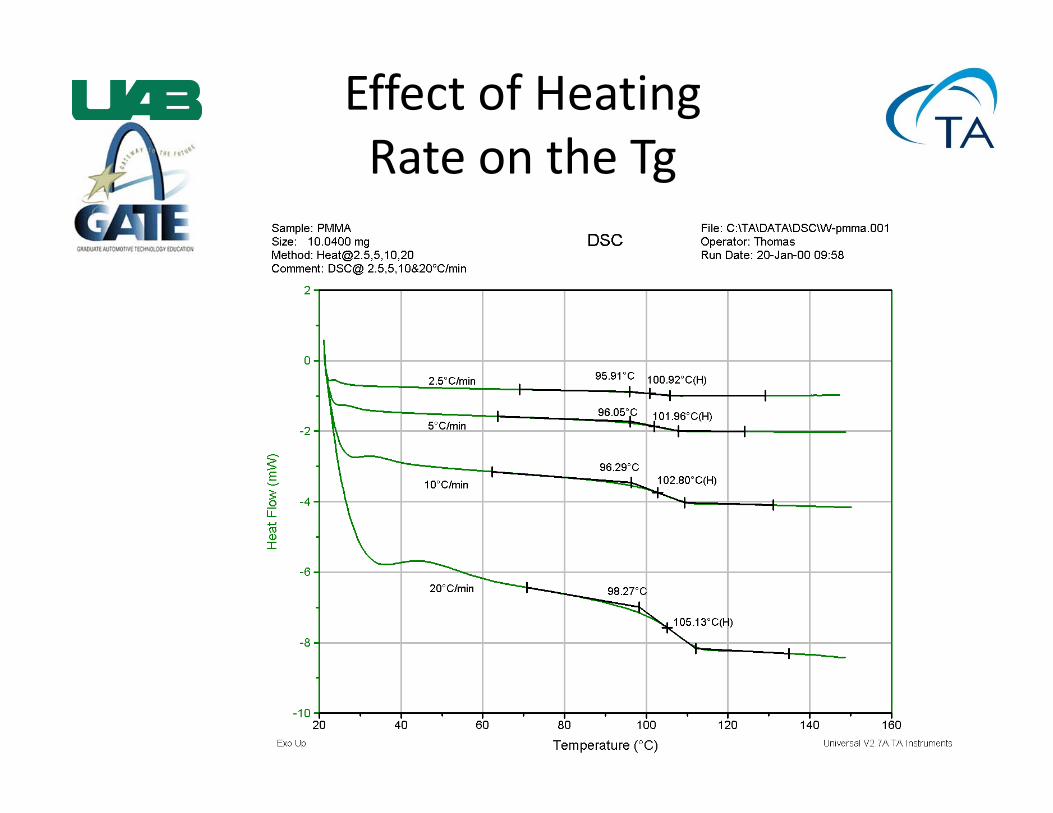
Effect of Heating Rate on the Tg
Optimizing Measurement of Tg
• If Tg is hard to see:– Use larger sample weight– Use higher heating rate– Use MDSC®
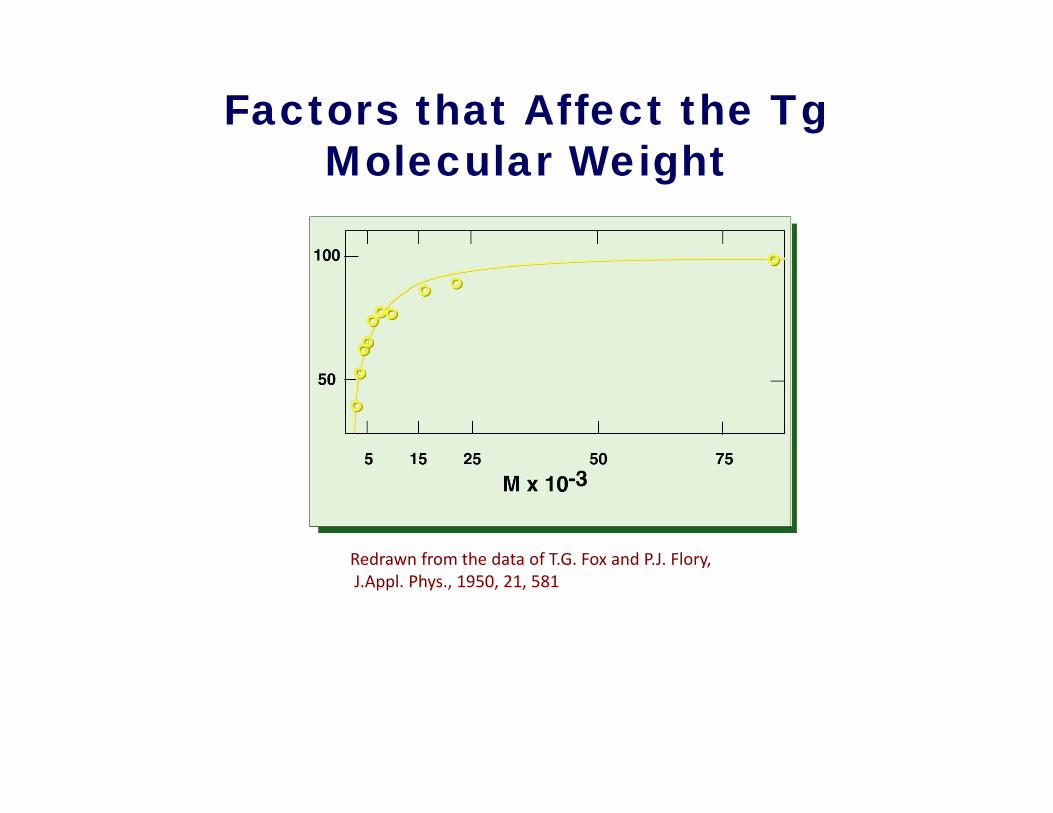
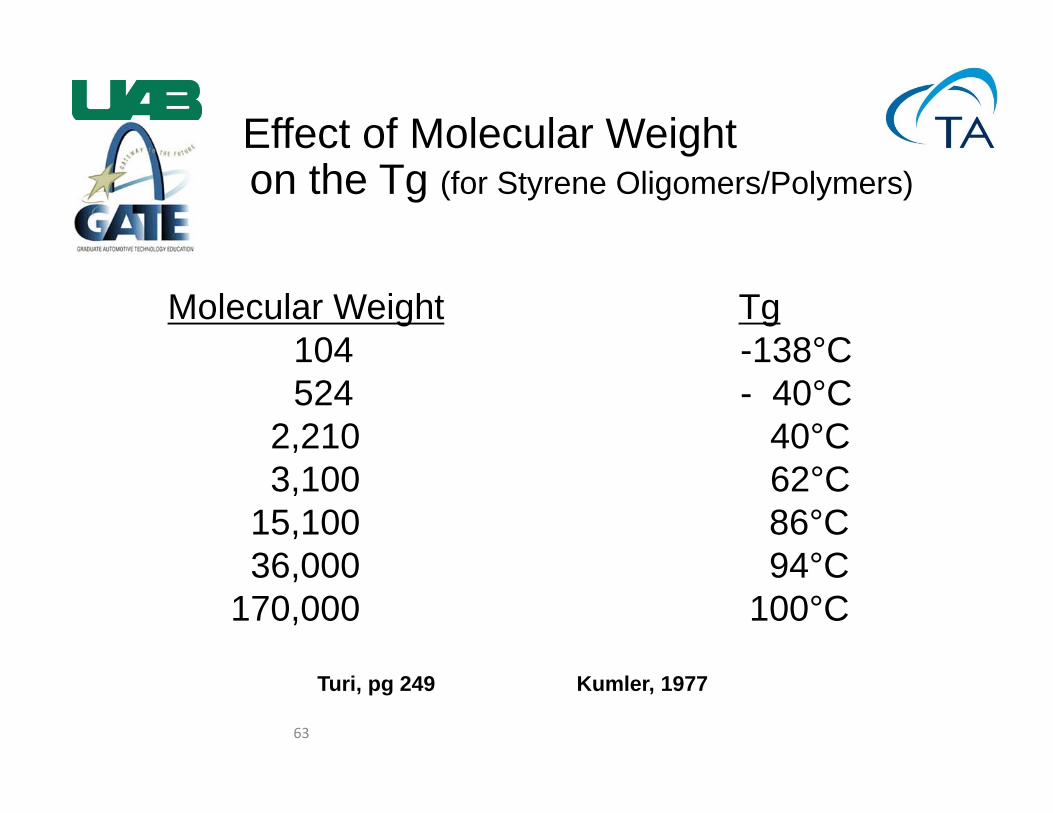
Factors that Affect the Tg Molecular Weight
Redrawn from the data of T.G. Fox and P.J. Flory, J.Appl. Phys., 1950, 21, 581
63
Effect of Molecular Weighton the Tg (for Styrene Oligomers/Polymers)
Molecular Weight Tg104 -138°C524 - 40°C
2,210 40°C3,100 62°C
15,100 86°C36,000 94°C
170,000 100°C
Turi, pg 249 Kumler, 1977
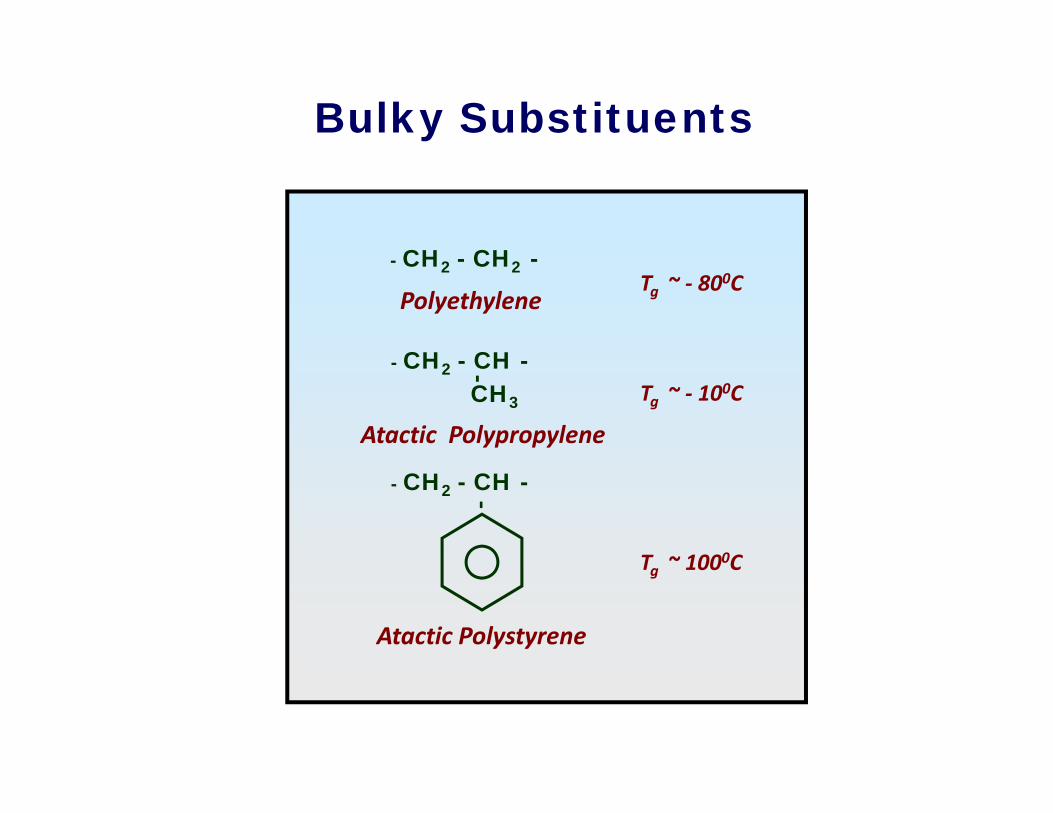
- CH2 - CH2 -Tg ~ ‐ 800C
Tg ~ ‐ 100C
Tg ~ 1000C
Polyethylene
Atactic Polystyrene
- CH2 - CH -CH3
-‐
- CH2 - CH -
Atactic Polypropylene
Bulky Substituents
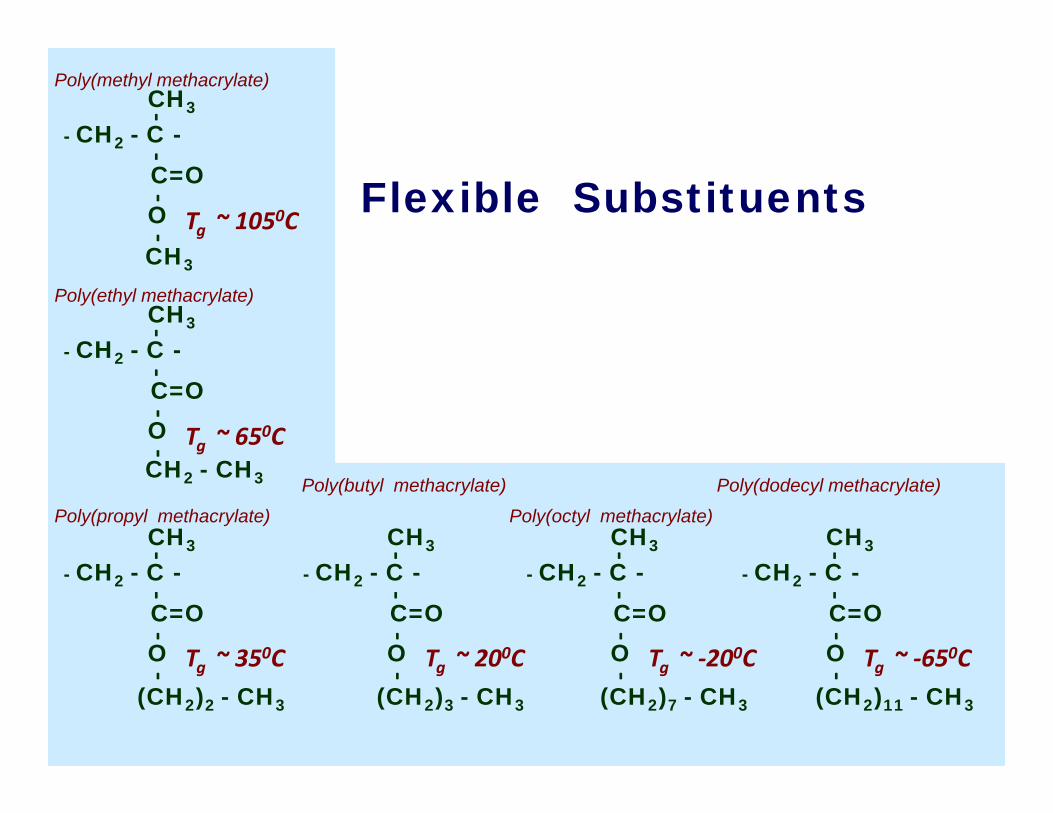
Flexible Substituents‐
- CH2 - C -‐CH3
C=O‐
‐
OCH3
CH2 - CH3
‐
- CH2 - C -
‐CH3
C=O
‐‐
O
‐
- CH2 - C -
‐CH3
C=O
‐‐
O
(CH2)2 - CH3
‐
- CH2 - C -
‐CH3
C=O
‐‐
O
(CH2)3 - CH3
‐
- CH2 - C -
‐CH3
C=O‐
‐O
(CH2)7 - CH3
‐
- CH2 - C -
‐CH3
C=O
‐‐
O
(CH2)11 - CH3
Poly(methyl methacrylate)
Poly(ethyl methacrylate)
Tg ~ 1050C
Poly(propyl methacrylate)Poly(butyl methacrylate)
Poly(octyl methacrylate)Poly(dodecyl methacrylate)
Tg ~ 650C
Tg ~ 350C Tg ~ 200C Tg ~ ‐200C Tg ~ ‐650C
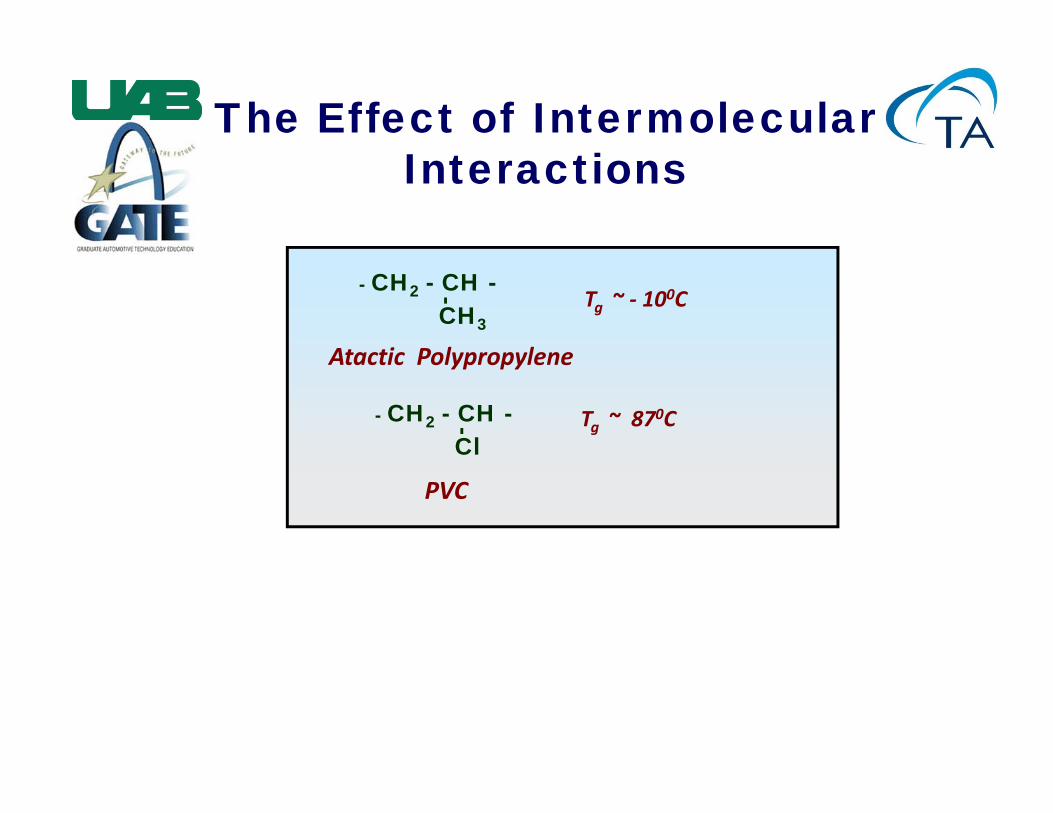
The Effect of Intermolecular Interactions
Tg ~ ‐ 100C- CH2 - CH -
CH3
-
Atactic Polypropylene
Tg ~ 870C- CH2 - CH -Cl
-PVC
67
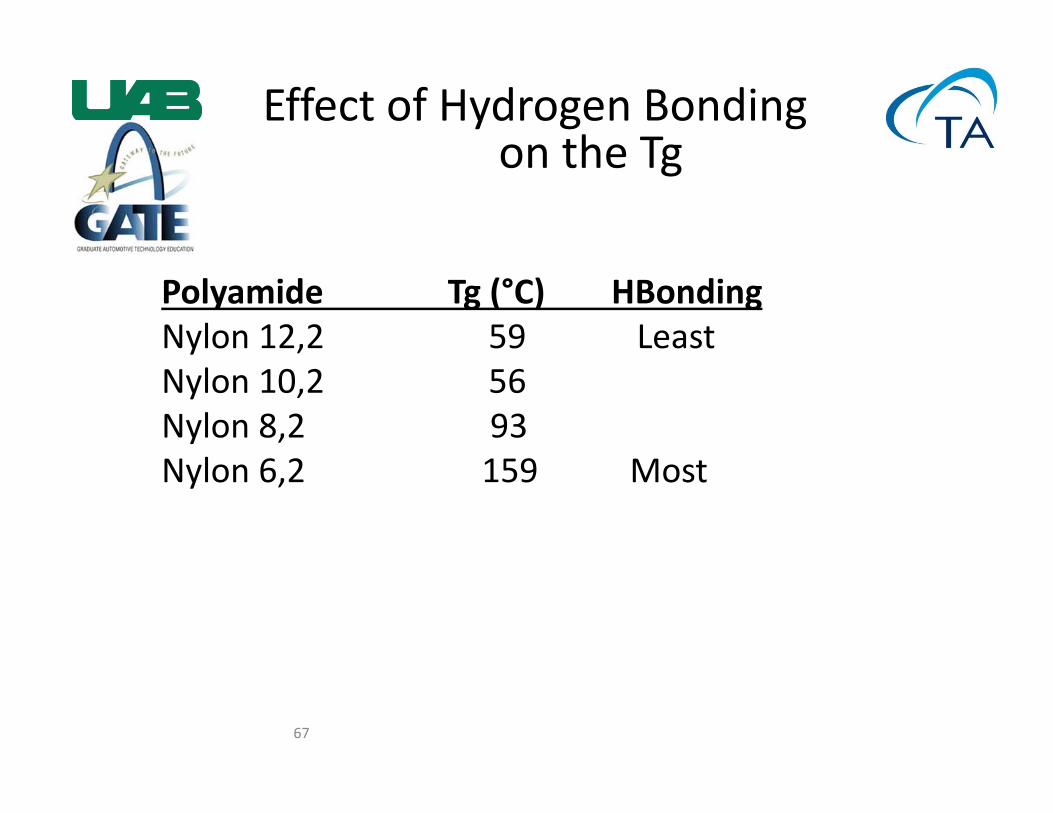
Effect of Hydrogen Bondingon the Tg
Polyamide Tg (°C) HBondingNylon 12,2 59 LeastNylon 10,2 56Nylon 8,2 93Nylon 6,2 159 Most
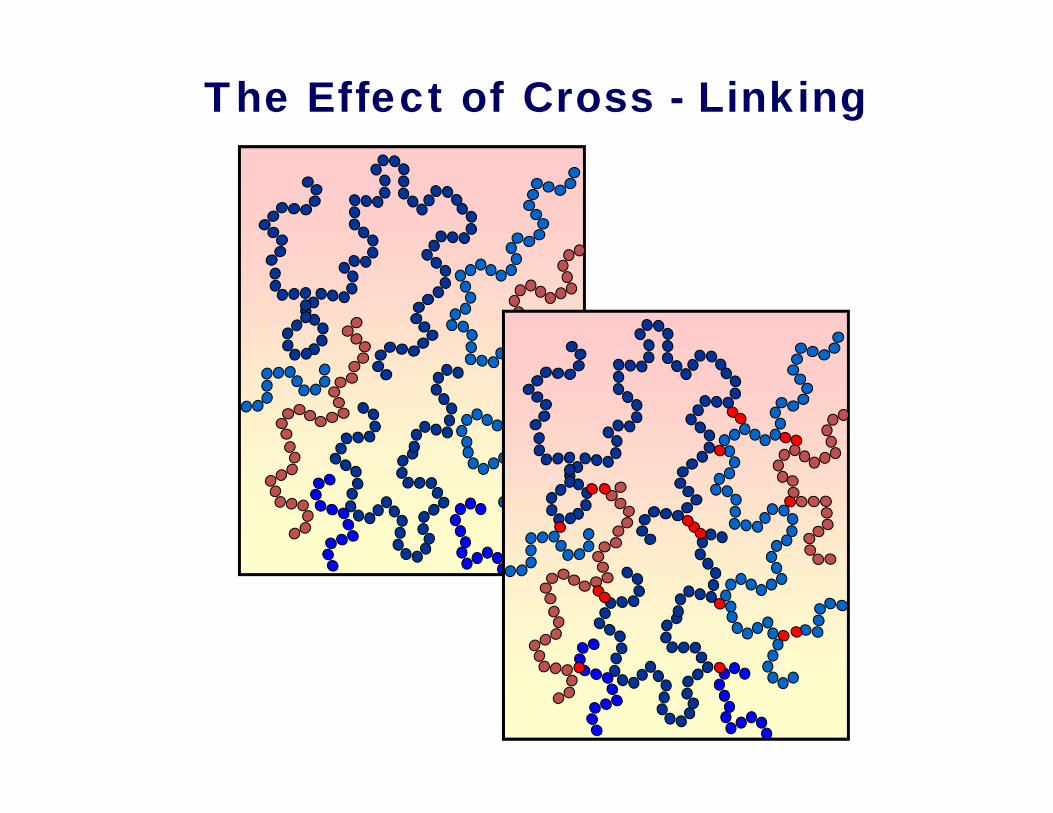
The Effect of Cross - Linking
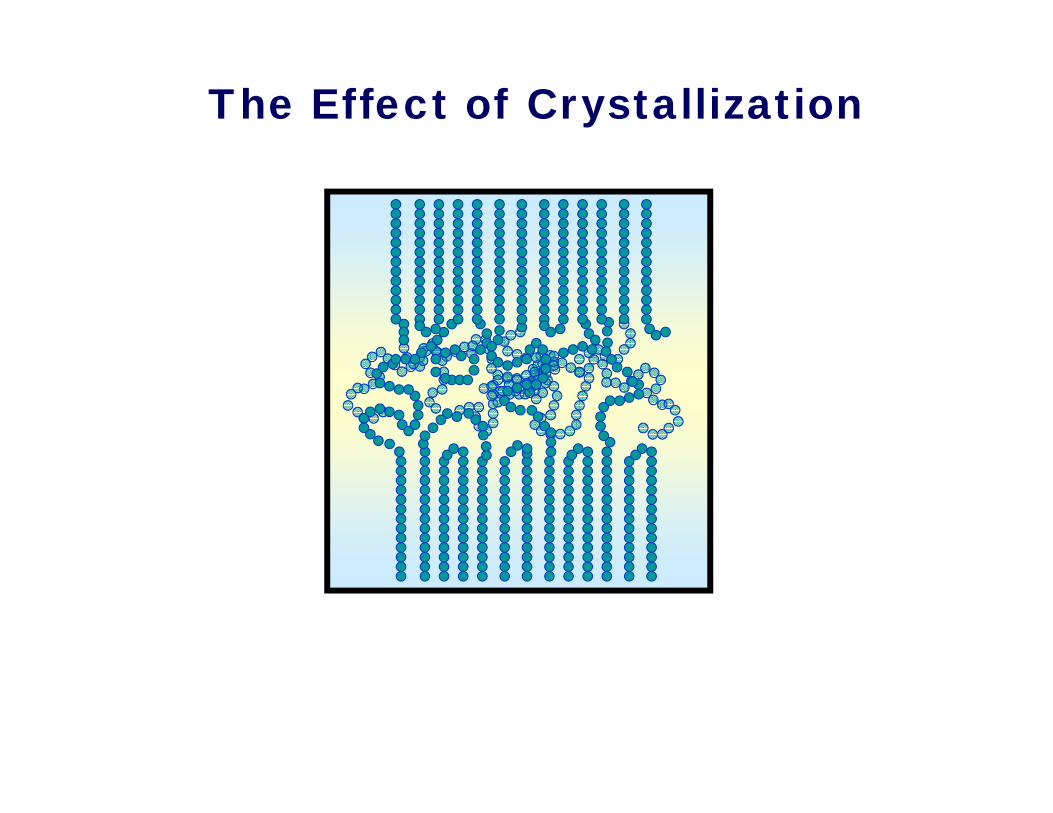
The Effect of Crystallization
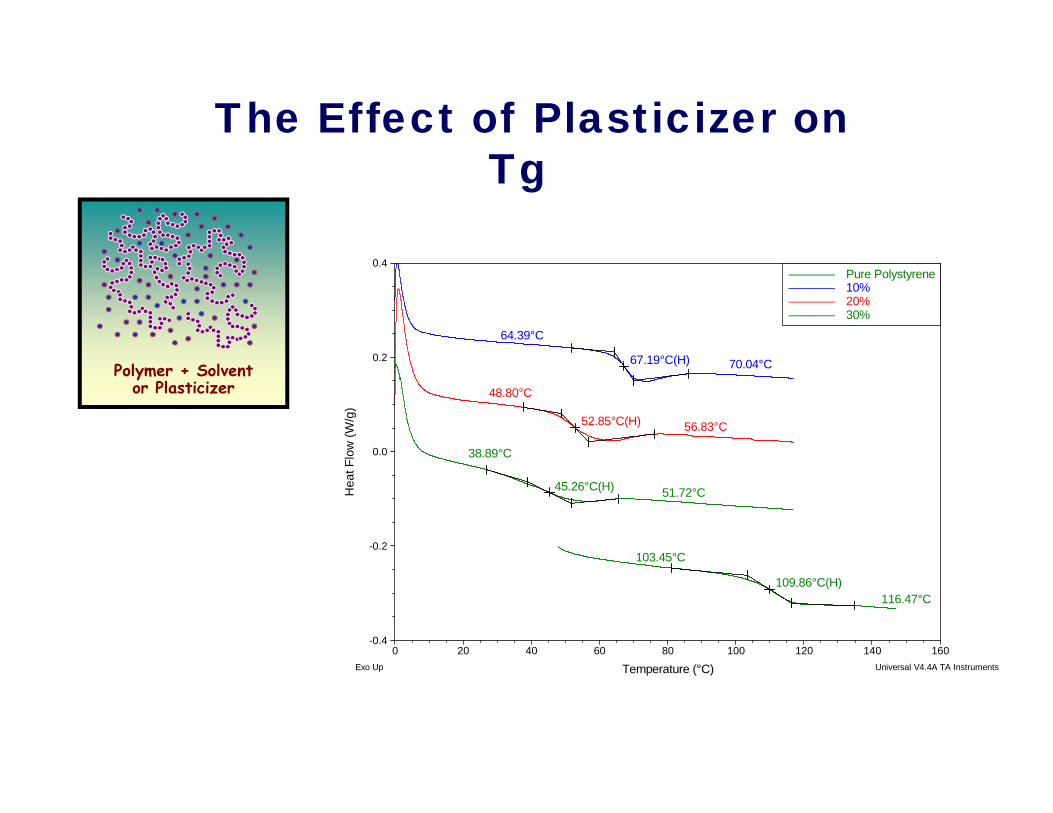
The Effect of Plasticizer on Tg
Polymer + Solventor Plasticizer
109.86°C(H)
103.45°C
116.47°C
67.19°C(H)
64.39°C
70.04°C
52.85°C(H)
48.80°C
56.83°C
45.26°C(H)
38.89°C
51.72°C
-0.4
-0.2
0.0
0.2
0.4
Hea
t Flo
w (W
/g)
0 20 40 60 80 100 120 140 160
Temperature (°C)
Pure Polystyrene––––––– 10%––––––– 20%––––––– 30%–––––––
Exo Up Universal V4.4A TA Instruments
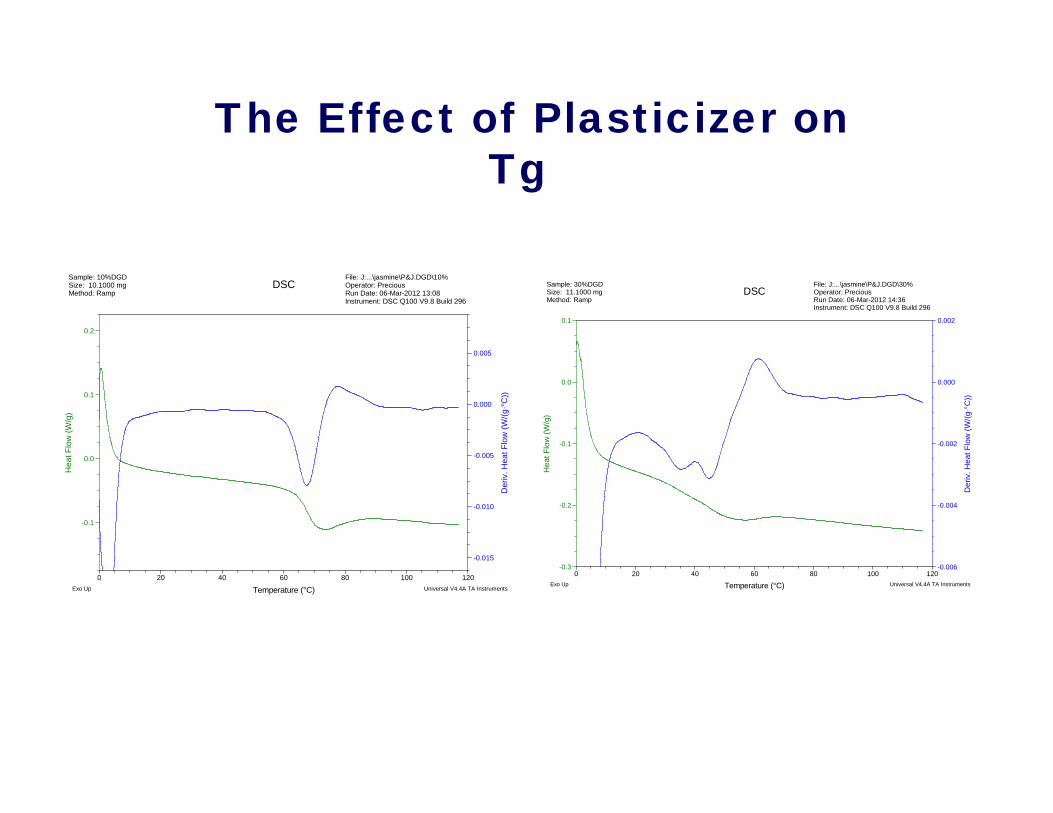
The Effect of Plasticizer on Tg
-0.006
-0.004
-0.002
0.000
0.002
Der
iv. H
eat F
low
(W/(g
·°C
))
-0.3
-0.2
-0.1
0.0
0.1
Hea
t Flo
w (W
/g)
0 20 40 60 80 100 120
Temperature (°C)
Sample: 30%DGDSize: 11.1000 mgMethod: Ramp
DSCFile: J:...\jasmine\P&J.DGD\30%Operator: PreciousRun Date: 06-Mar-2012 14:36Instrument: DSC Q100 V9.8 Build 296
Exo Up Universal V4.4A TA Instruments
-0.015
-0.010
-0.005
0.000
0.005
Der
iv. H
eat F
low
(W/(g
·°C
))
-0.1
0.0
0.1
0.2
Hea
t Flo
w (W
/g)
0 20 40 60 80 100 120
Temperature (°C)
Sample: 10%DGDSize: 10.1000 mgMethod: Ramp
DSCFile: J:...\jasmine\P&J.DGD\10%Operator: PreciousRun Date: 06-Mar-2012 13:08Instrument: DSC Q100 V9.8 Build 296
Exo Up Universal V4.4A TA Instruments
72
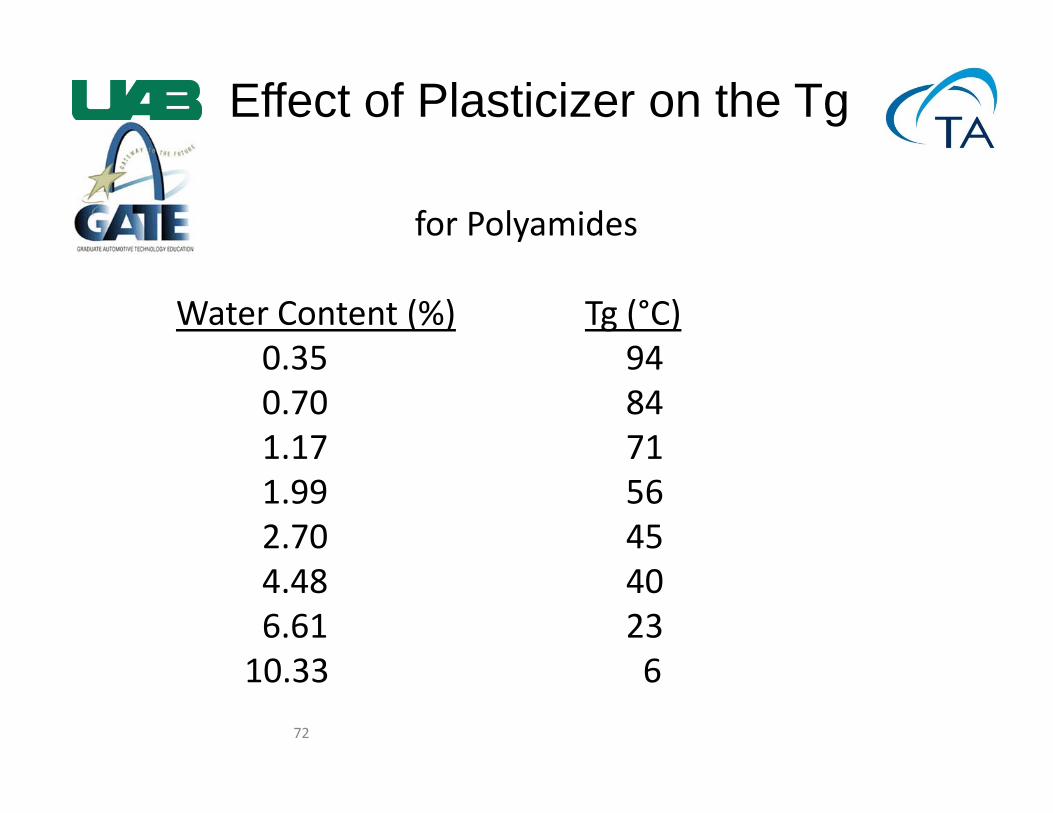
Effect of Plasticizer on the Tg
for Polyamides
Water Content (%) Tg (°C)0.35 940.70 841.17 711.99 562.70 454.48 406.61 2310.33 6
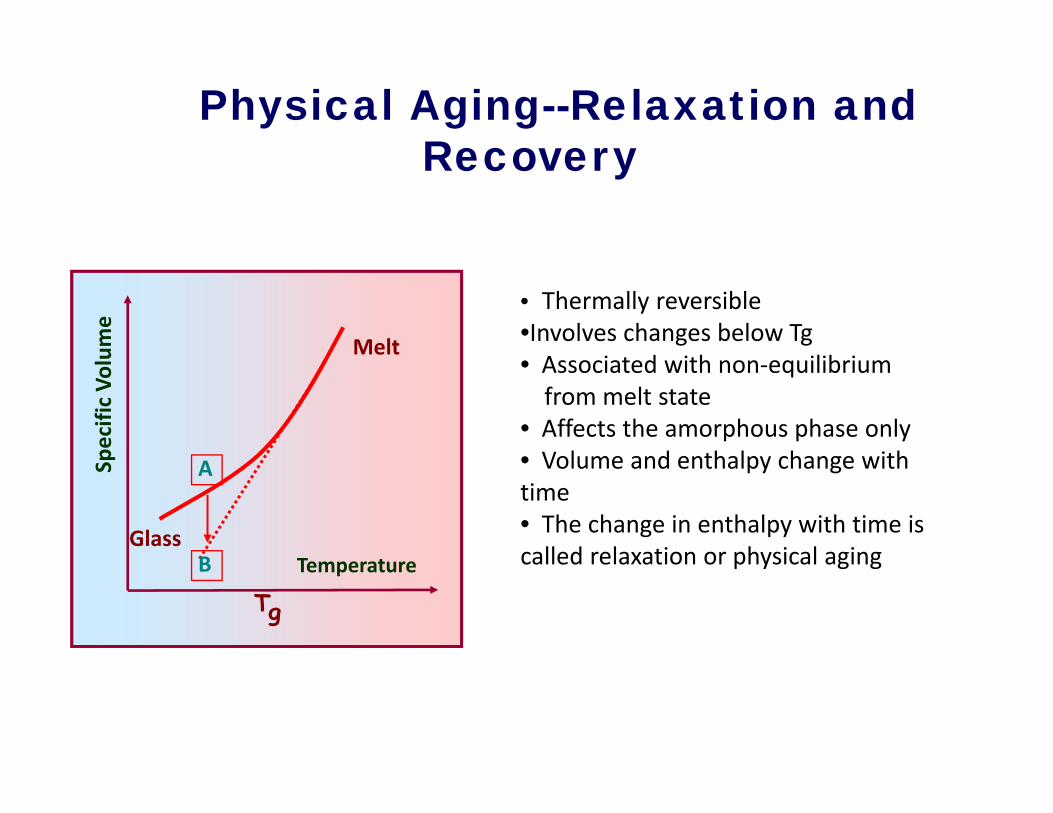
Physical Aging--Relaxation and Recovery
Specific Vo
lume
Tg
A
B Temperature
Melt
Glass
• Thermally reversible•Involves changes below Tg• Associated with non‐equilibrium from melt state
• Affects the amorphous phase only• Volume and enthalpy change with time• The change in enthalpy with time is called relaxation or physical aging
74
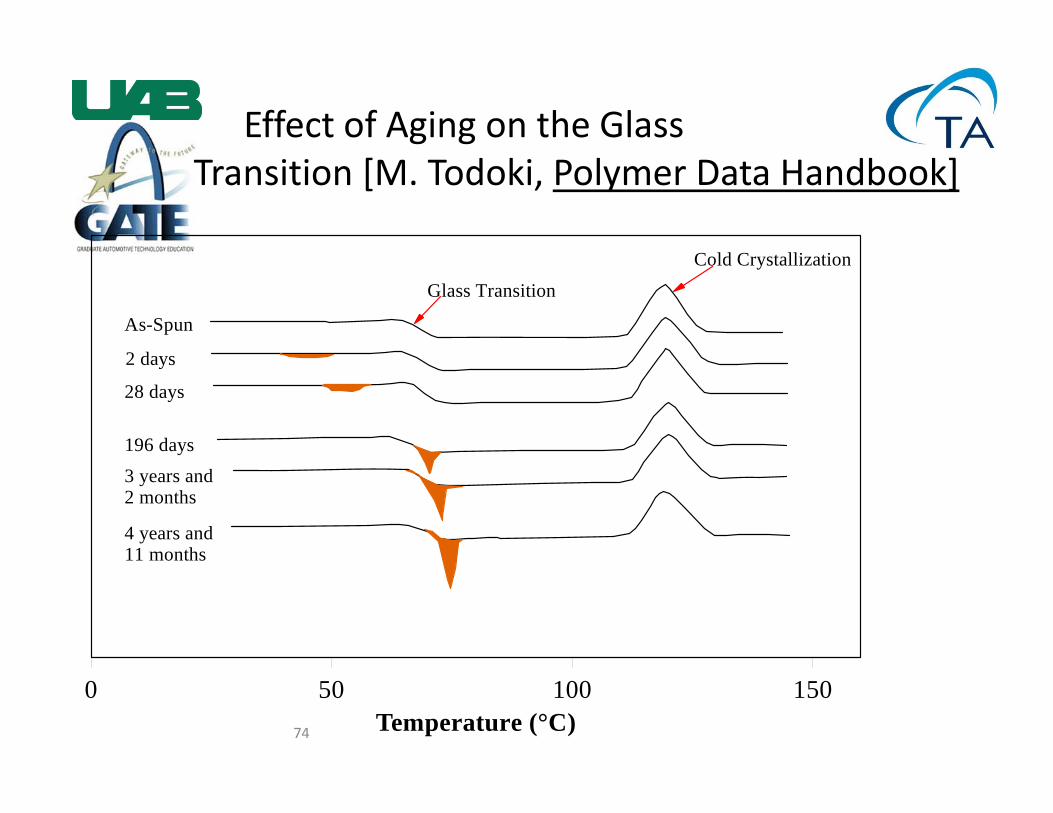
Effect of Aging on the GlassTransition [M. Todoki, Polymer Data Handbook]
0 50 100 150Temperature (°C)
Glass TransitionCold Crystallization
As-Spun
2 days
28 days
196 days3 years and2 months
4 years and11 months
75
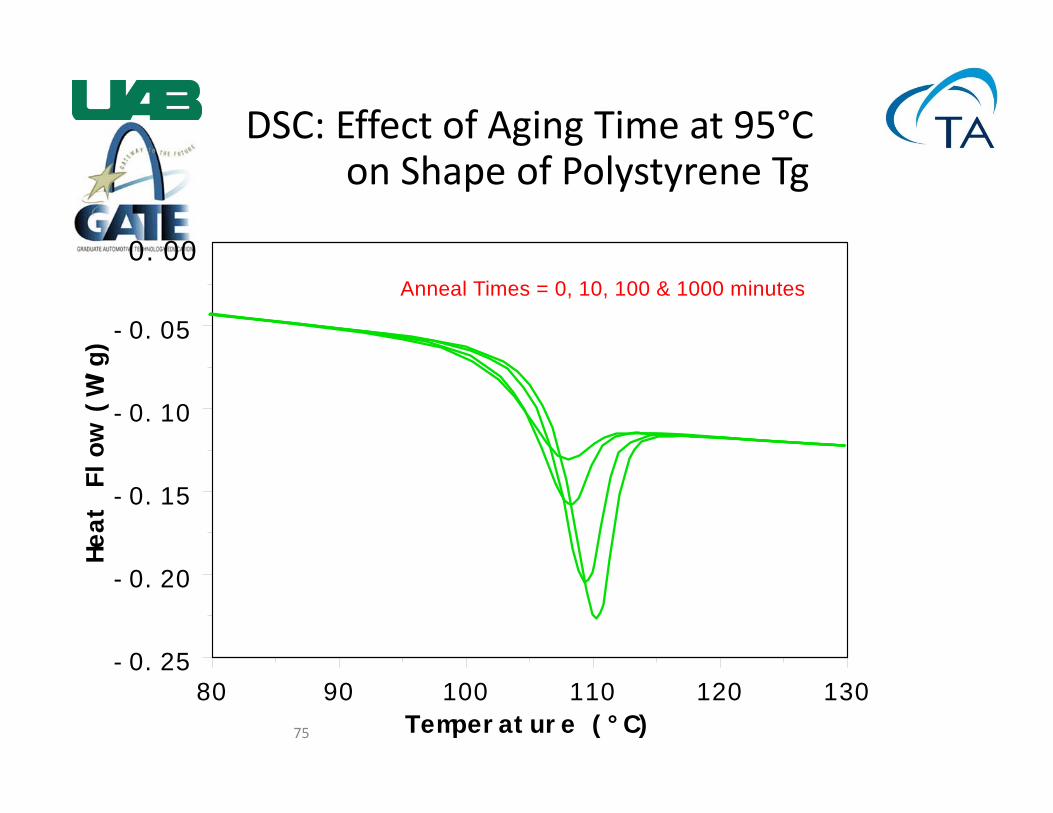
DSC: Effect of Aging Time at 95°Con Shape of Polystyrene Tg
80 90 100 110 120 130- 0. 25
- 0. 20
- 0. 15
- 0. 10
- 0. 05
Temper at ur e ( ° C)
Heat
Flo
w (W
/g)
0. 00Anneal Times = 0, 10, 100 & 1000 minutes
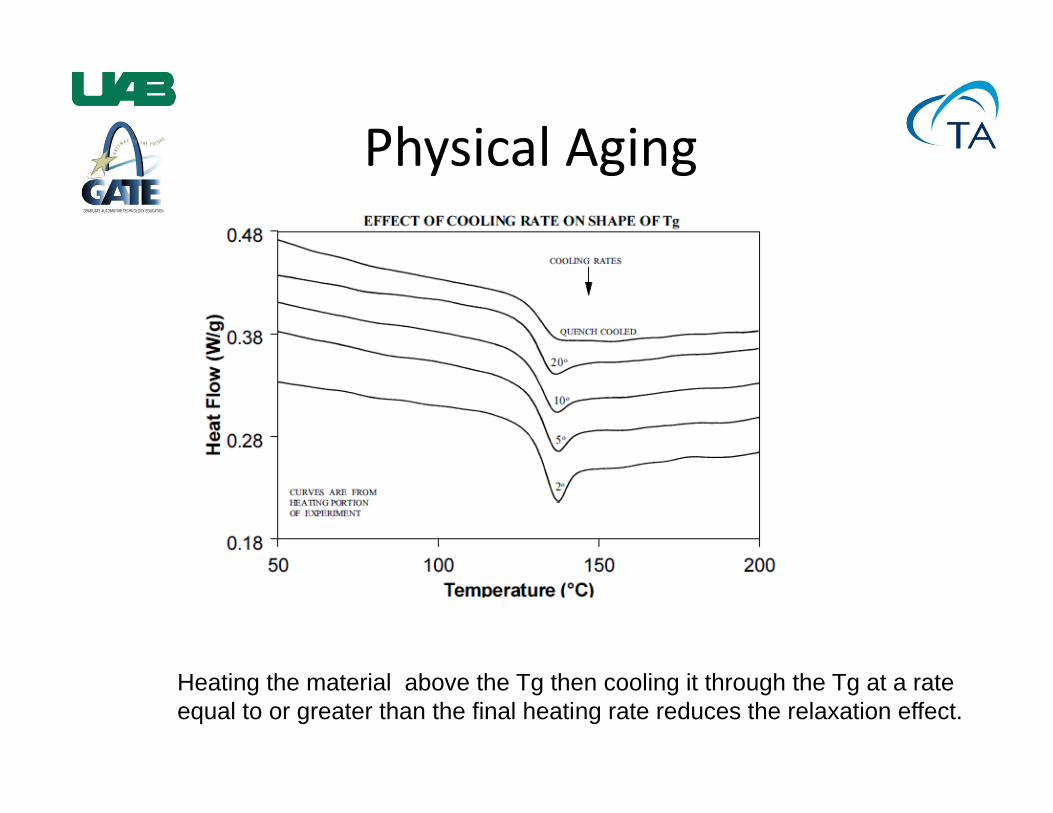
Physical Aging
Heating the material above the Tg then cooling it through the Tg at a rate equal to or greater than the final heating rate reduces the relaxation effect.
Physical AgingEffect on Mechanical
Properties
• General loss of ductility• Modulus increases• Yield strength increases• Impact strength, elongation, fracture energy decrease
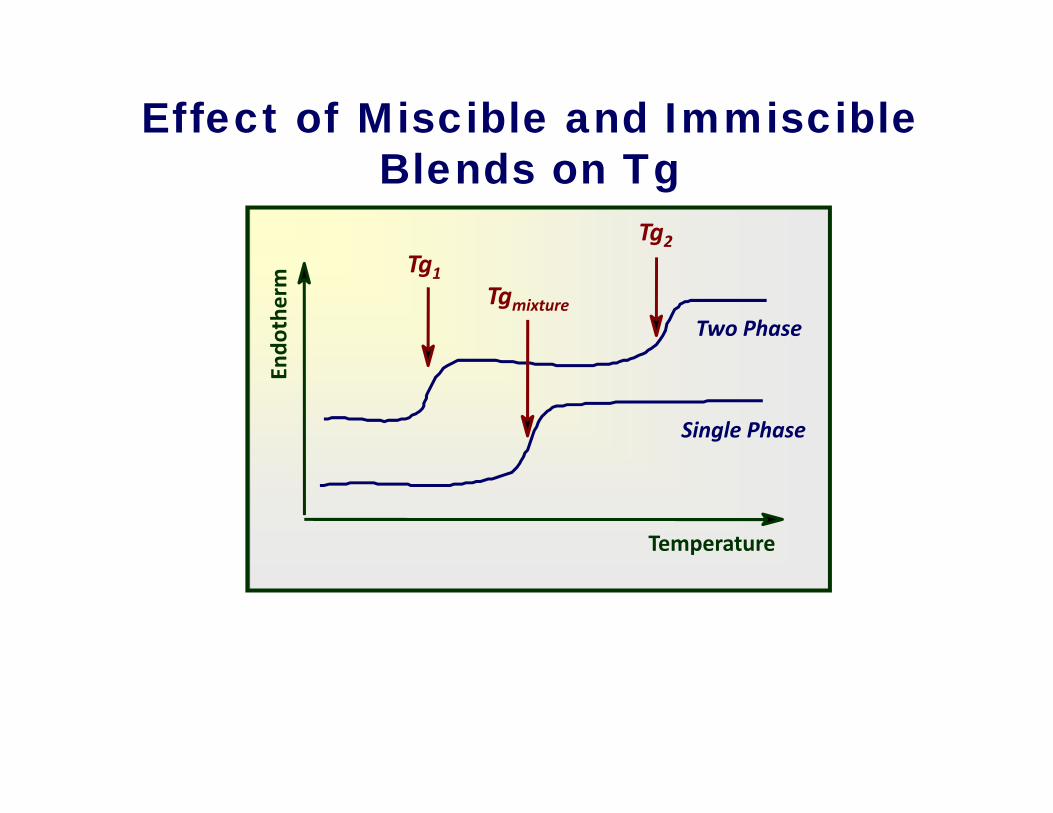
Single Phase
Two Phase
Temperature
Endo
therm
Tg1Tg2
Tgmixture
Effect of Miscible and Immiscible Blends on Tg
Curing of ThermosetsCrosslinking
Thermosetting Polymers• Curing reaction can be followed by
monitoring a wide variety of physical properties including:– Heat of reaction– Heat capacity– Viscosity– Modulus– Others
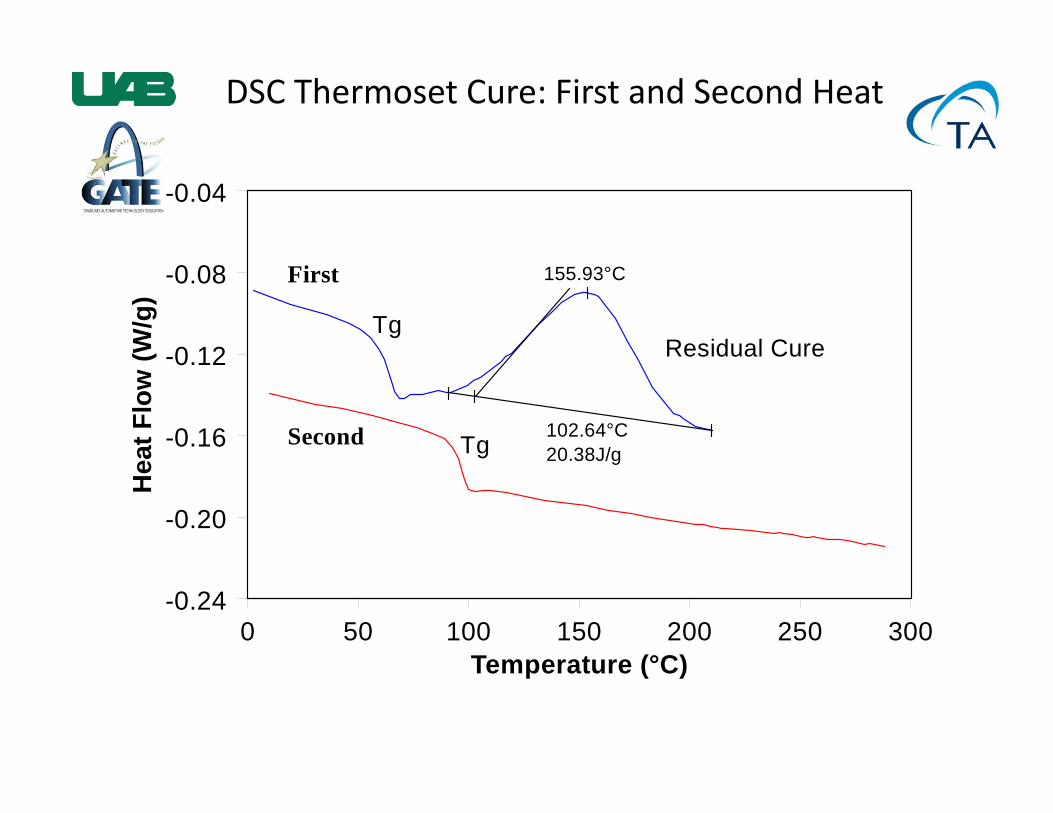
DSC Thermoset Cure: First and Second Heat
0 50 100 150 200 250 300-0.24
-0.20
-0.16
-0.12
-0.08
-0.04
Temperature (°C)
Hea
t Flo
w (W
/g)
Tg
Tg
155.93°C
102.64°C20.38J/g
Residual Cure
First
Second
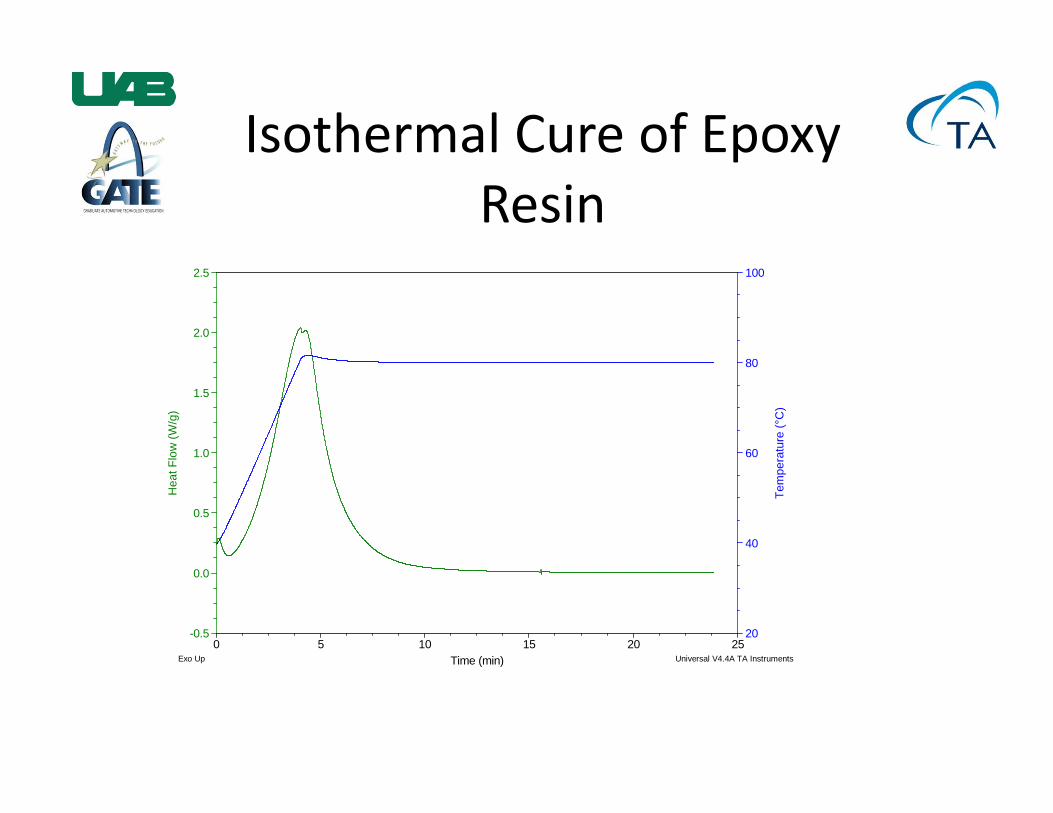
Isothermal Cure of Epoxy Resin
20
40
60
80
100
Tem
pera
ture
(°C
)
-0.5
0.0
0.5
1.0
1.5
2.0
2.5
Hea
t Flo
w (W
/g)
0 5 10 15 20 25Time (min)
Exo Up Universal V4.4A TA Instruments
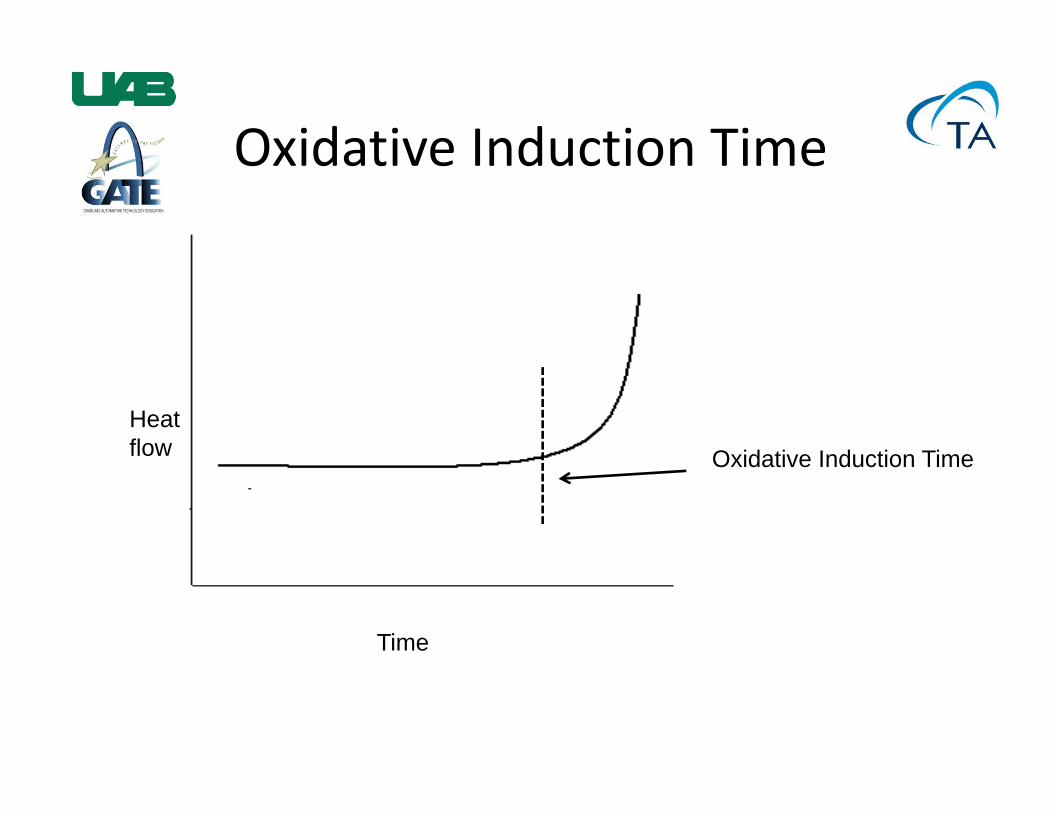
Oxidative Induction Time
Oxidative Induction Time
Heatflow
Time
MDSC Theory
85
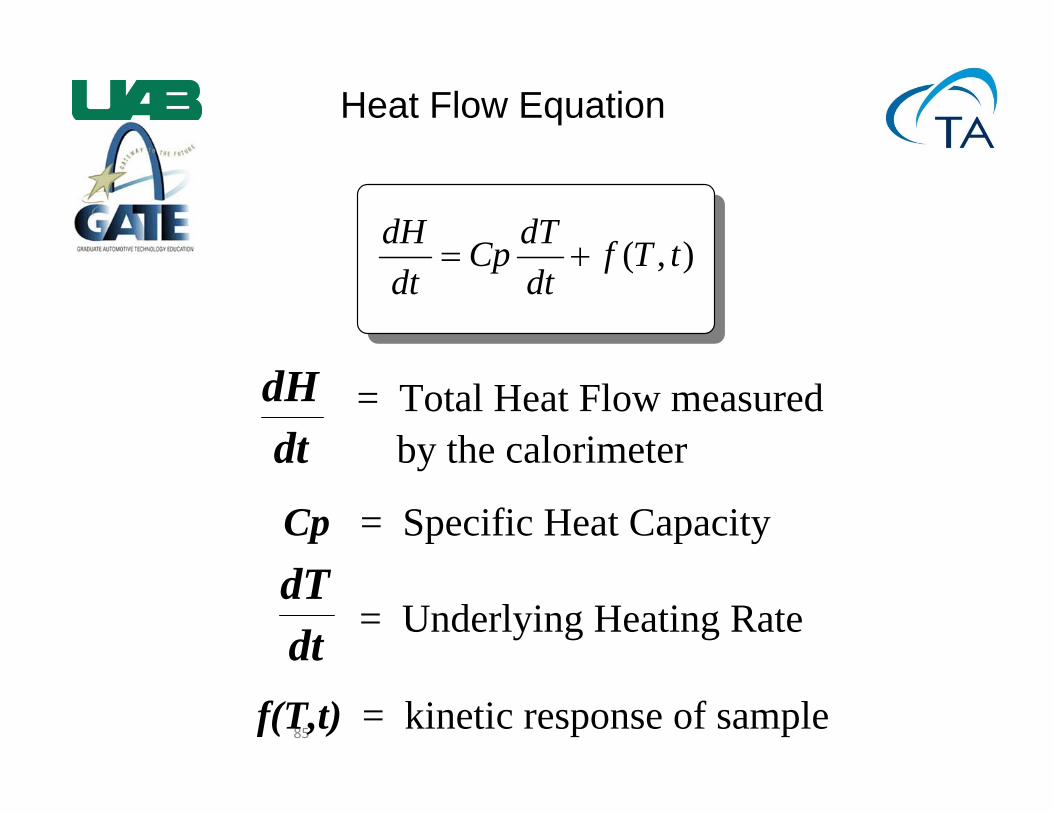
Heat Flow Equation
),( tTfdtdTCp
dtdH
dHdt
= Total Heat Flow measured by the calorimeter
Cp = Specific Heat Capacity dTdt = Underlying Heating Rate
f(T,t) = kinetic response of sample
86
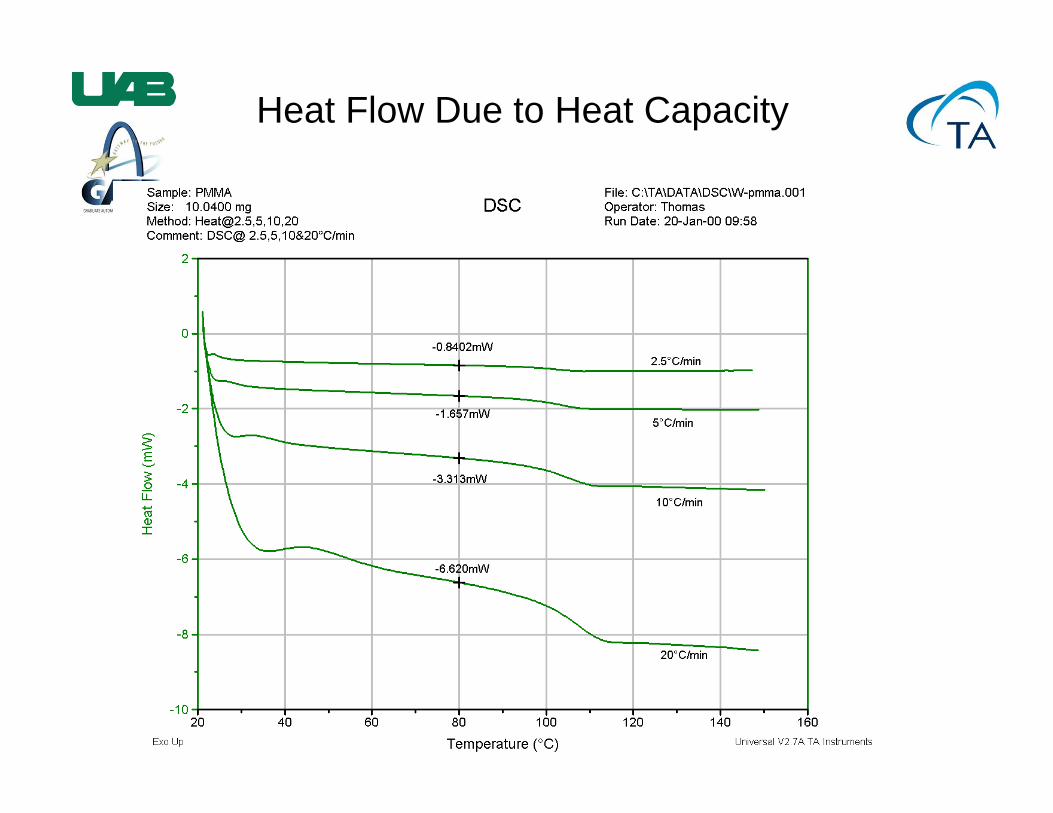
Heat Flow Due to Heat Capacity
87
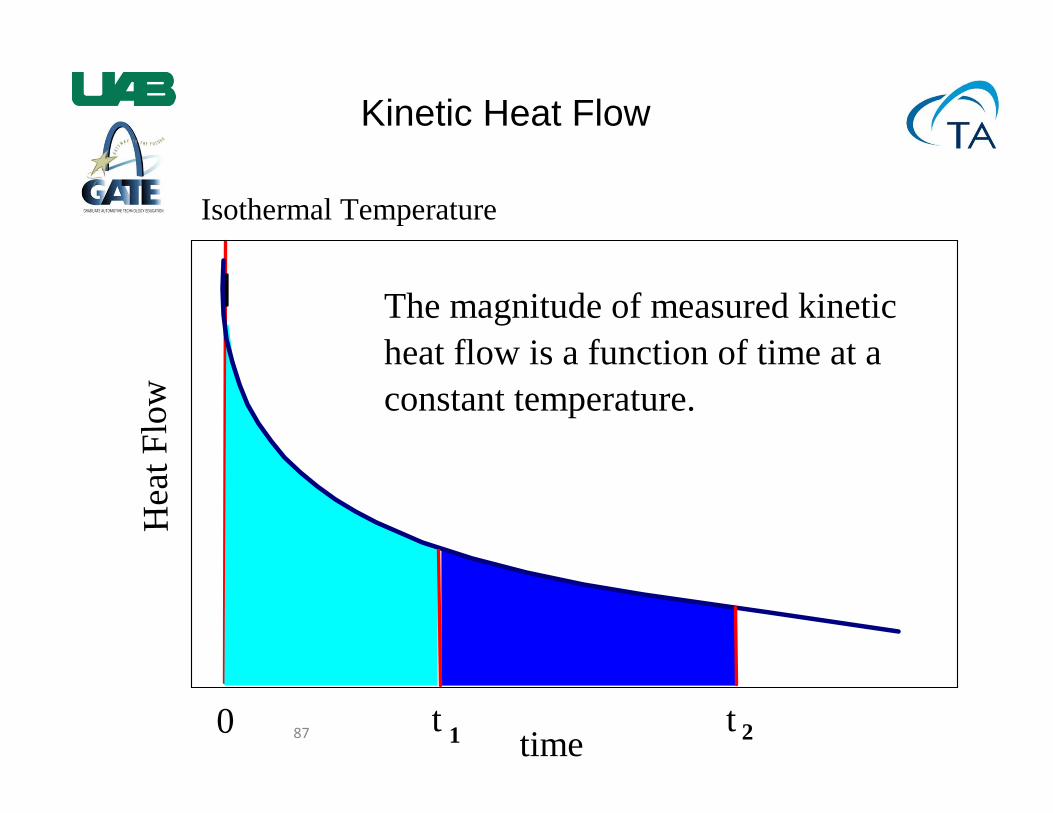
Kinetic Heat Flow
time0 t t1 2
Hea
t Flo
w
The magnitude of measured kineticheat flow is a function of time at aconstant temperature.
Isothermal Temperature
88
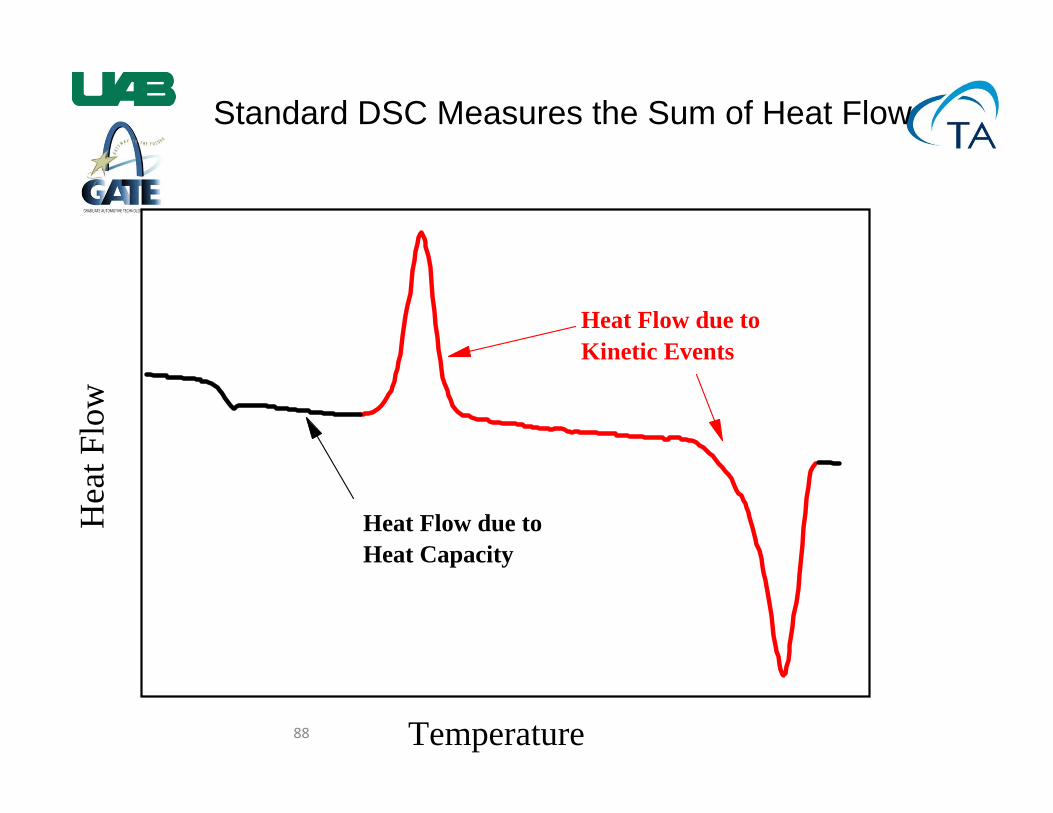
Standard DSC Measures the Sum of Heat Flow
Temperature
Hea
t Flo
w
Heat Flow due toHeat Capacity
Heat Flow due toKinetic Events
89
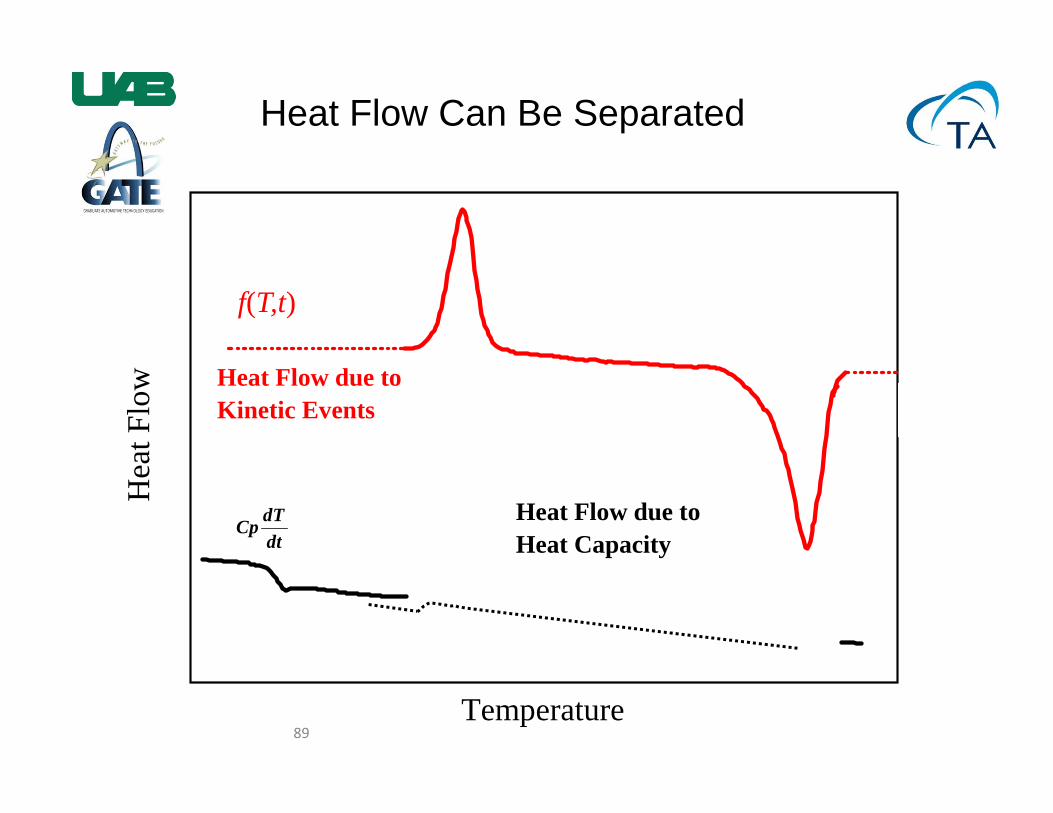
Heat Flow Can Be Separated
Heat Flow due toHeat Capacity
Heat Flow due toKinetic Events
f(T,t)
Cp dTdt
Temperature
Hea
t Flo
w
90
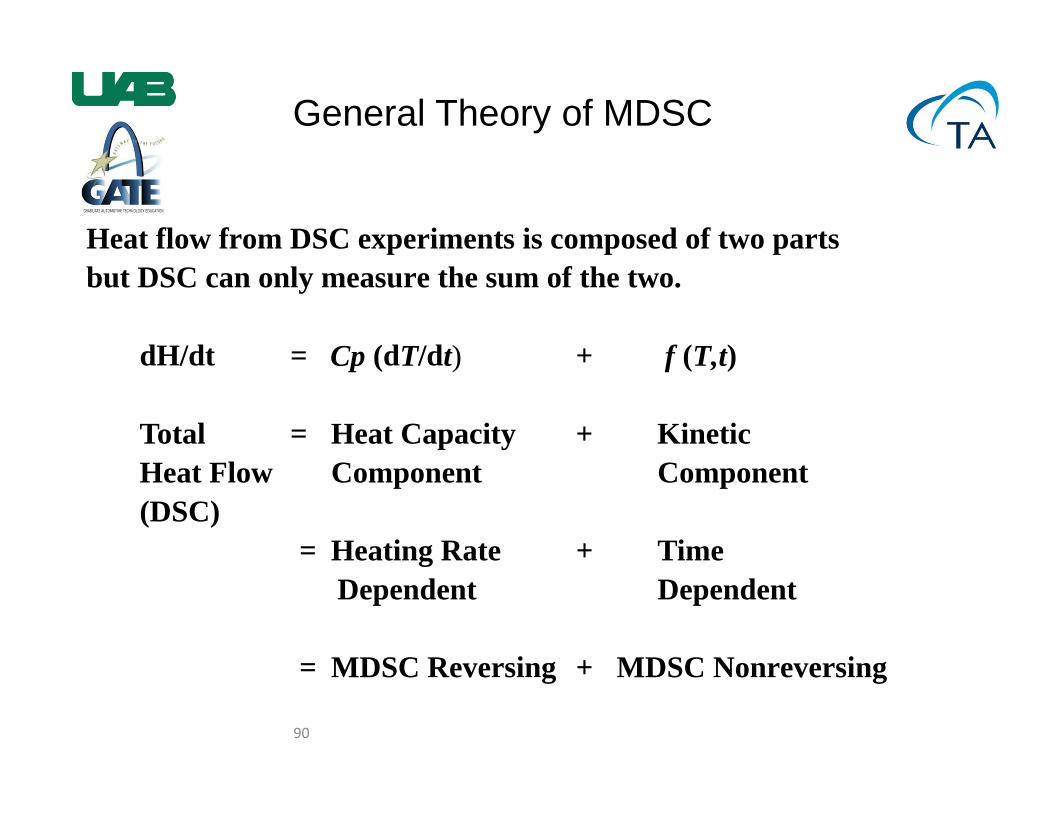
General Theory of MDSC
Heat flow from DSC experiments is composed of two partsbut DSC can only measure the sum of the two.
dH/dt = Cp (dT/dt) + f (T,t)
Total = Heat Capacity + KineticHeat Flow Component Component(DSC) = Heating Rate + Time Dependent Dependent
= MDSC Reversing + MDSC Nonreversing
91
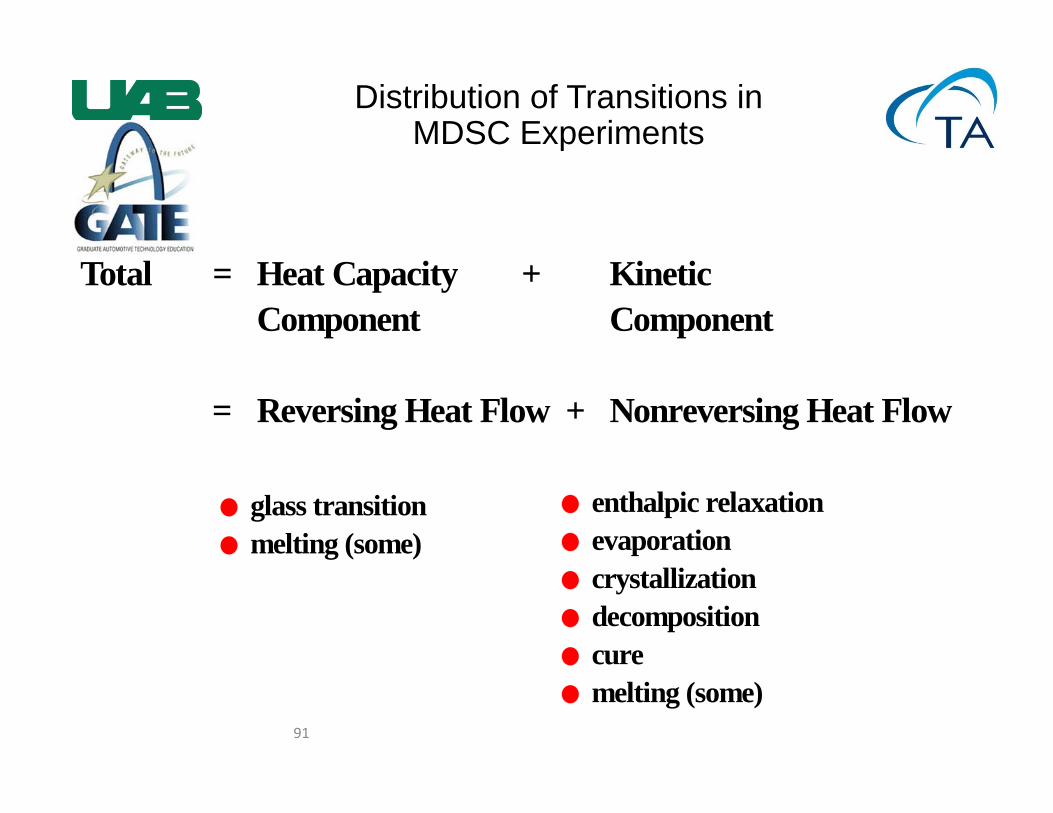
Distribution of Transitions in MDSC Experiments
Total = Heat Capacity + KineticComponent Component
= Reversing Heat Flow + Nonreversing Heat Flow
glass transition melting (some)
enthalpic relaxationevaporationcrystallizationdecompositioncuremelting (some)
92
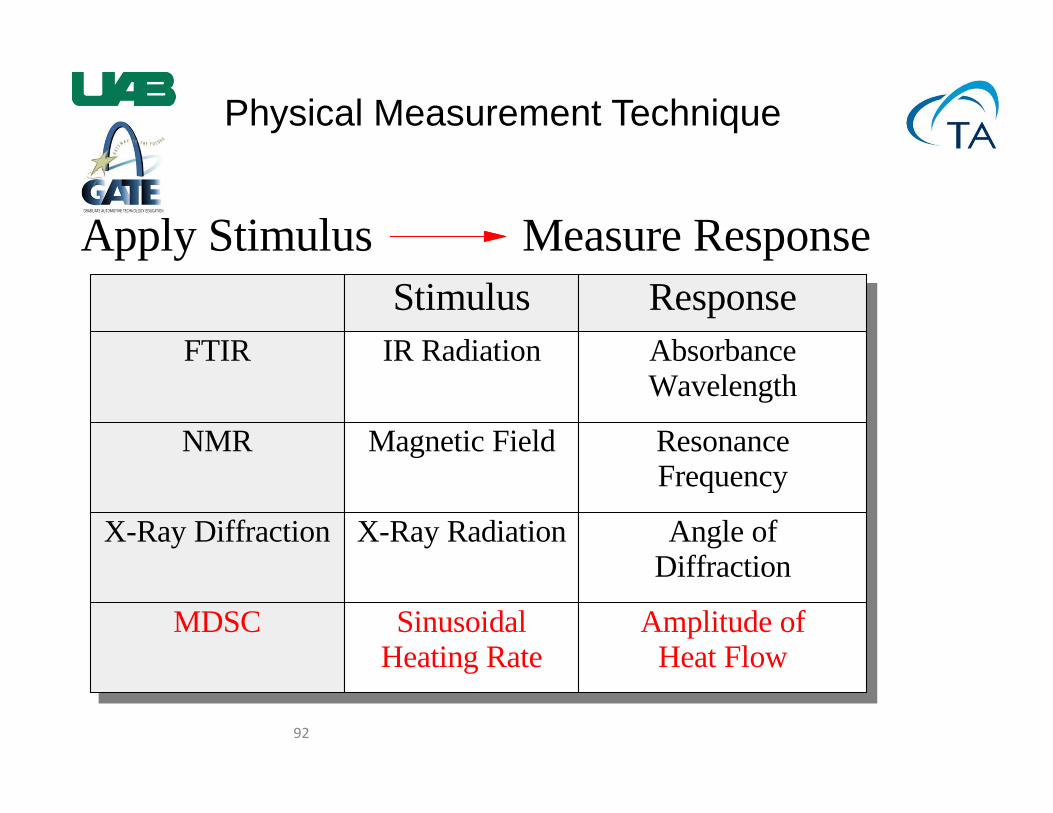
Physical Measurement Technique
Apply Stimulus Measure ResponseStimulus Response
FTIR IR Radiation AbsorbanceWavelength
NMR Magnetic Field ResonanceFrequency
X-Ray Diffraction X-Ray Radiation Angle ofDiffraction
MDSC SinusoidalHeating Rate
Amplitude ofHeat Flow
93
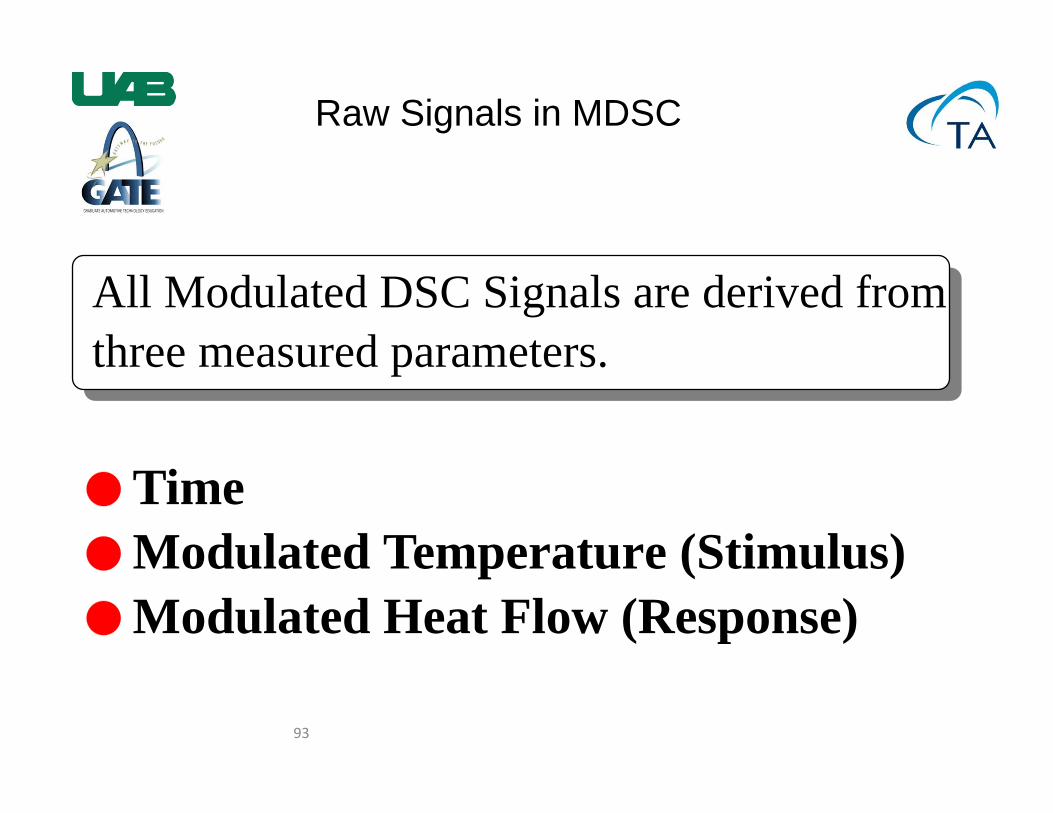
Raw Signals in MDSC
TimeModulated Temperature (Stimulus)Modulated Heat Flow (Response)
All Modulated DSC Signals are derived fromthree measured parameters.
94
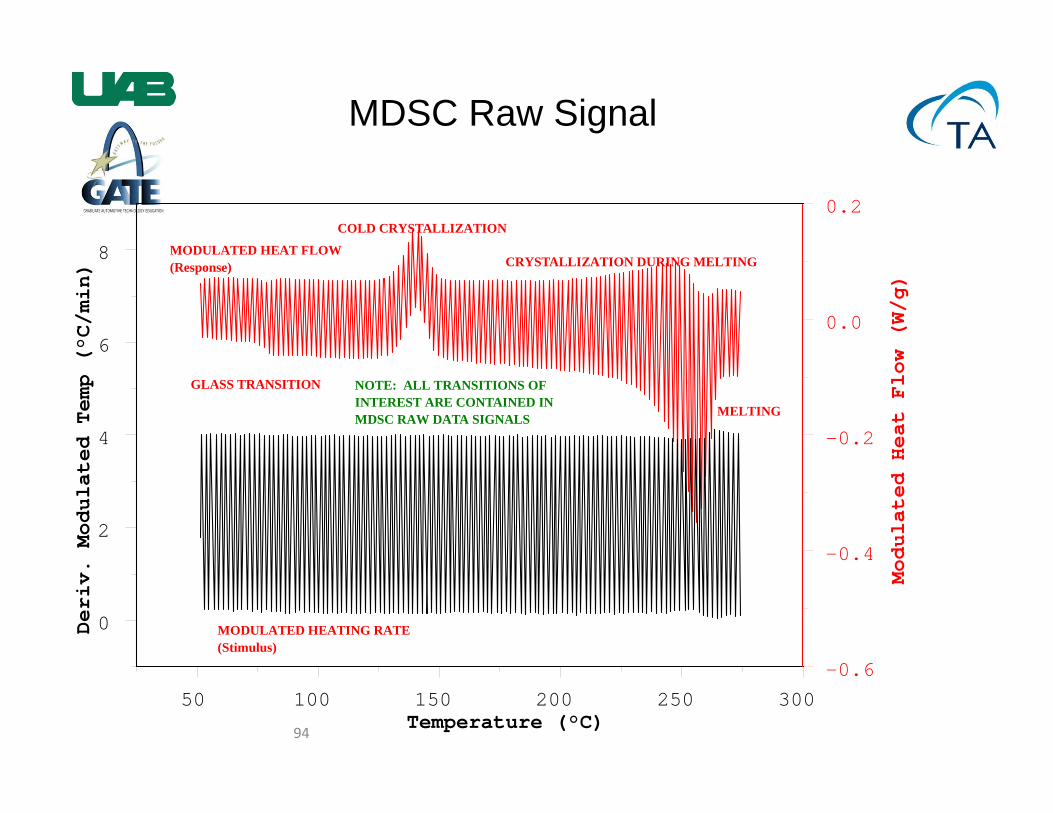
MDSC Raw Signal
MODULATED HEAT FLOW(Response) CRYSTALLIZATION DURING MELTING
MELTING
GLASS TRANSITION
COLD CRYSTALLIZATION
NOTE: ALL TRANSITIONS OFINTEREST ARE CONTAINED INMDSC RAW DATA SIGNALS
MODULATED HEATING RATE(Stimulus)
50 100 150 200 250 300
0
2
4
6
8
-0.6
-0.4
-0.2
0.0
0.2
Temperature (°C)
Deriv. Modulated Temp (°C/min)
Modulated Heat Flow (W/g)
95
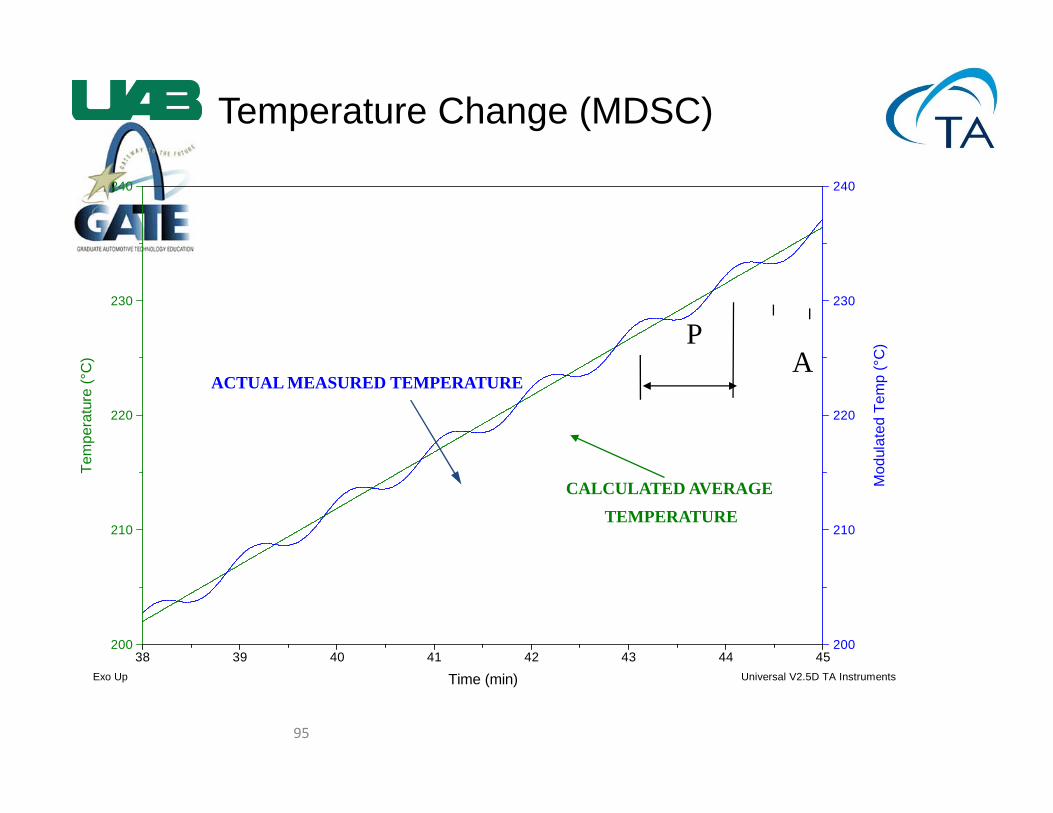
Temperature Change (MDSC)
200
210
220
230
240
Mod
ulat
ed T
emp
(°C
)
200
210
220
230
240
Tem
pera
ture
(°C
)
38 39 40 41 42 43 44 45
Time (min)
Exo Up Universal V2.5D TA Instruments
ACTUAL MEASURED TEMPERATURE
CALCULATED AVERAGETEMPERATURE
PA
96
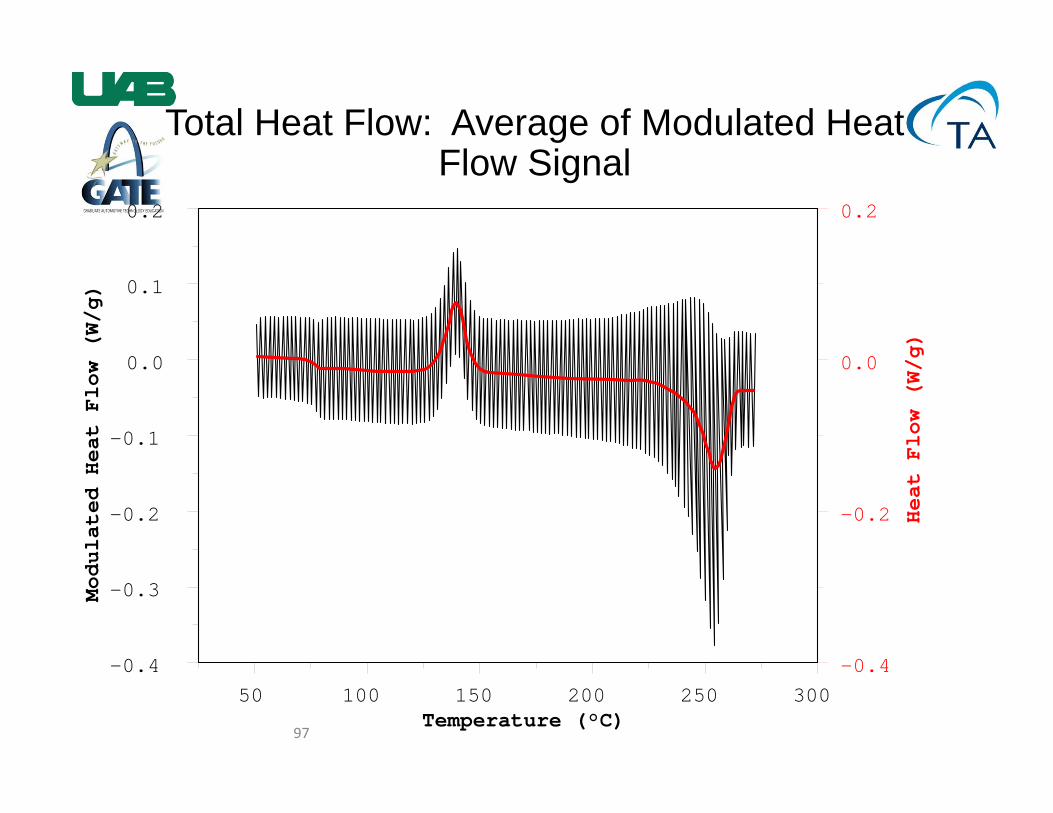
MDSC Signals: Total Heat Flow
The average value of the modulated heat flow signal. This signal is qualitatively and quantitatively equivalent to the heat flow signal from conventional DSC at the same average heating rate.
Definition: The sum of all thermal events in the sample
Calculation: Fourier Transformation analysis of the modulated heat flow signal is used to continuously calculate its average value
97
Total Heat Flow: Average of Modulated Heat Flow Signal
50 100 150 200 250 300-0.4
-0.3
-0.2
-0.1
0.0
0.1
0.2
-0.4
-0.2
0.0
0.2
Temperature (°C)
Modulated Heat Flow (W/g)
Heat Flow (W/g)
98
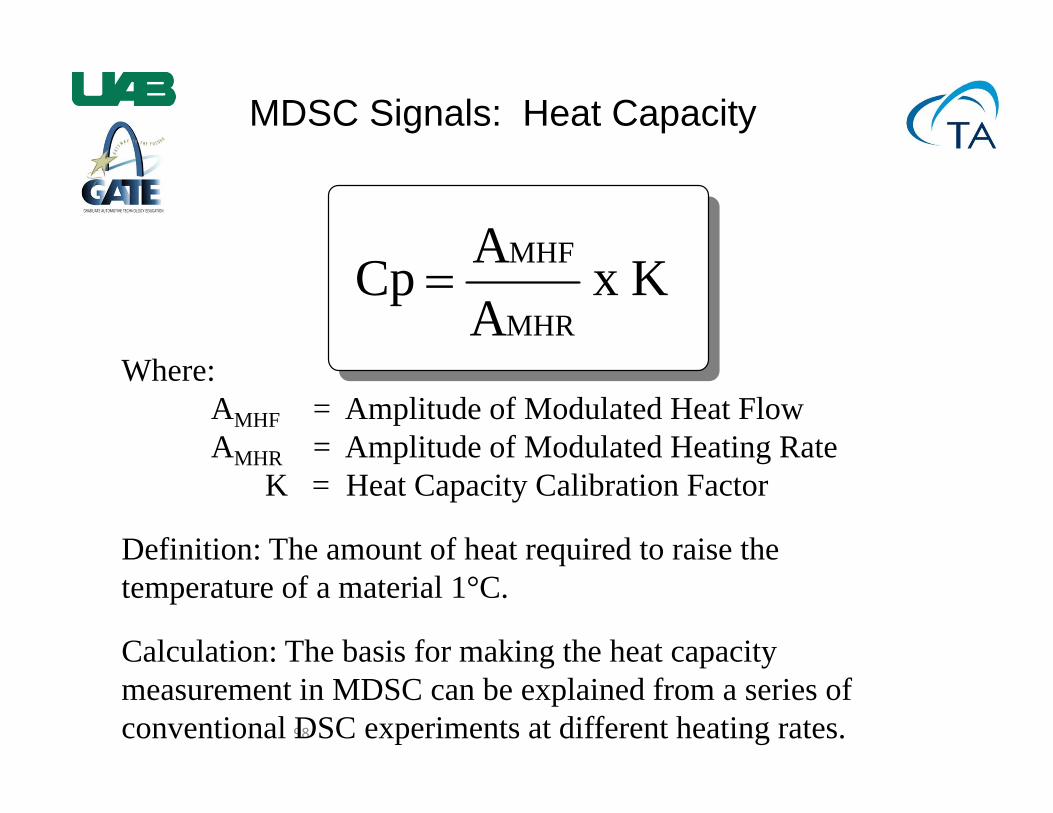
MDSC Signals: Heat Capacity
Where:AMHF = Amplitude of Modulated Heat FlowAMHR = Amplitude of Modulated Heating Rate
K = Heat Capacity Calibration Factor
Definition: The amount of heat required to raise the temperature of a material 1°C.
Calculation: The basis for making the heat capacity measurement in MDSC can be explained from a series of conventional DSC experiments at different heating rates.
K x AA Cp
MHR
MHF
99
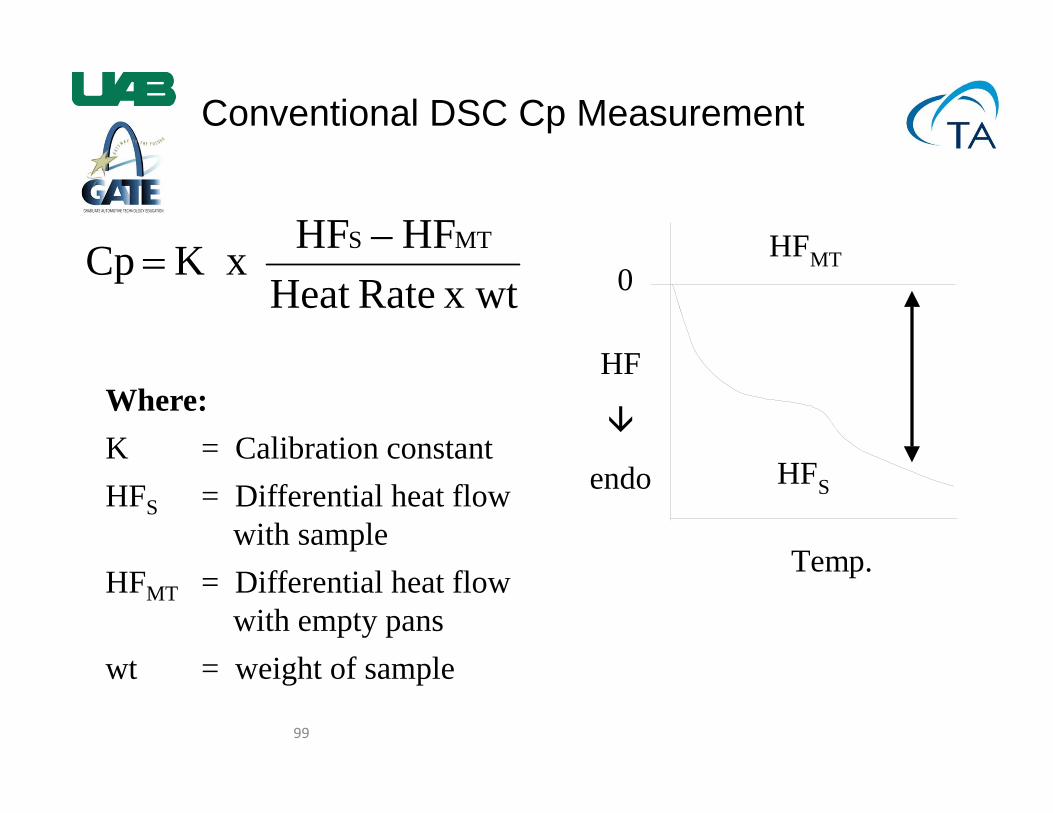
Conventional DSC Cp Measurement
x wtRateHeat HF– HFK x Cp MTS
HF
endo
0HFMT
HFS
Temp.
Where:K = Calibration constantHFS = Differential heat flow
with sampleHFMT = Differential heat flow
with empty panswt = weight of sample
100
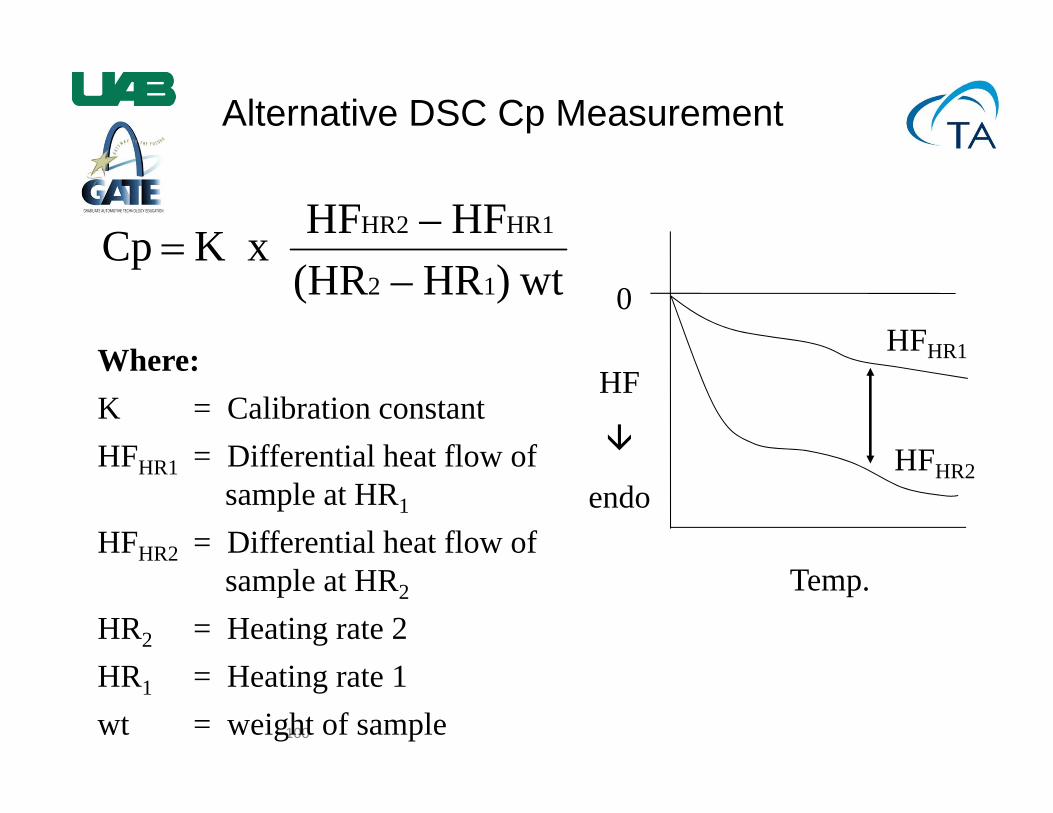
Alternative DSC Cp Measurement
HF
endo
0HFHR1
HFHR2
Temp.
wt)HR– (HRHF– HFK x Cp
12
HR1HR2
Where:K = Calibration constantHFHR1 = Differential heat flow of
sample at HR1
HFHR2 = Differential heat flow of sample at HR2
HR2 = Heating rate 2 HR1 = Heating rate 1wt = weight of sample
101
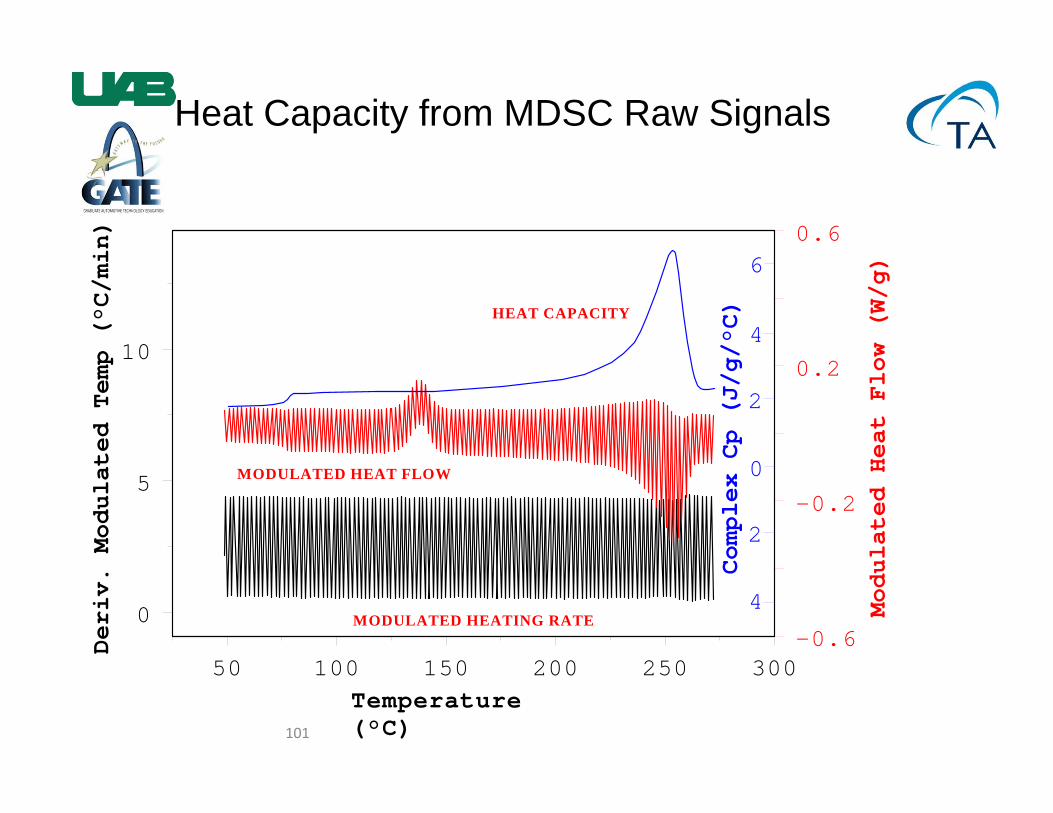
Heat Capacity from MDSC Raw Signals
50 100 150 200 250 300
0
5
10
-0.6
-0.2
0.2
0.6
Temperature (°C)
Deriv. Modulated Temp (°C/min)
Modulated Heat Flow (W/g)
4
2
0
2
4
6
Complex Cp (J/g/°C)HEAT CAPACITY
MODULATED HEAT FLOW
MODULATED HEATING RATE
102
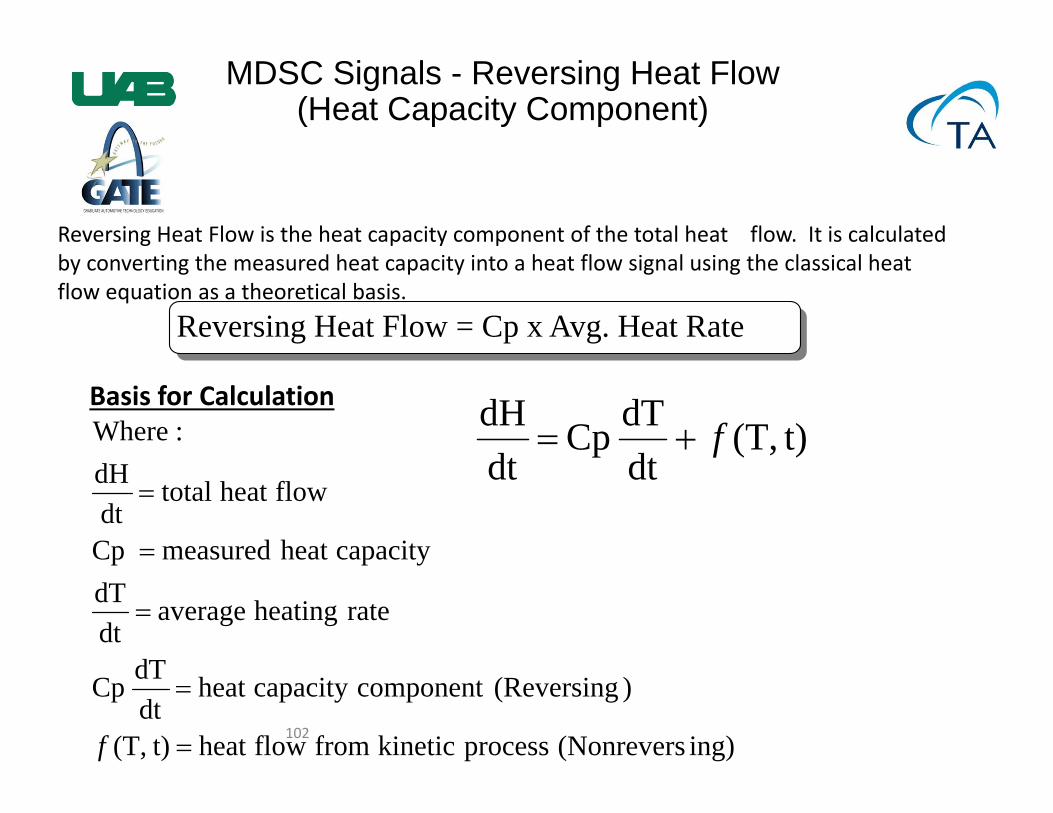
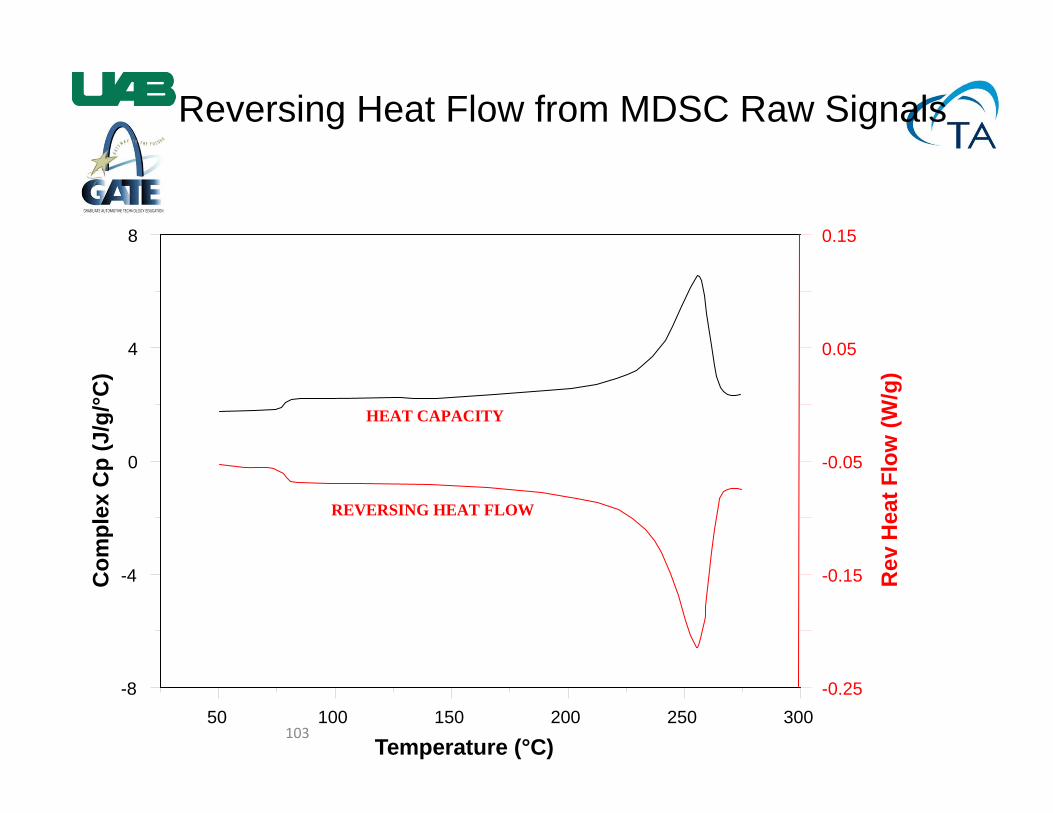
MDSC Signals - Reversing Heat Flow (Heat Capacity Component)
Reversing Heat Flow is the heat capacity component of the total heat flow. It is calculated by converting the measured heat capacity into a heat flow signal using the classical heat flow equation as a theoretical basis.
Reversing Heat Flow = Cp x Avg. Heat Rate
t)(T, dtdT Cp
dtdH f
Basis for Calculation
ing)(Nonrevers process kinetic from flowheat t)(T,
)(Reversingcomponent capacity heat dtdT Cp
rate heating average dtdT
capacityheat measured Cp
flowheat total dtdH
:Where
f
103
Reversing Heat Flow from MDSC Raw Signals
50 100 150 200 250 300-8
-4
0
4
8
-0.25
-0.15
-0.05
0.05
0.15
Temperature (°C)
Com
plex
Cp
(J/g
/°C)
Rev
Hea
t Flo
w (W
/g)
HEAT CAPACITY
REVERSING HEAT FLOW
104
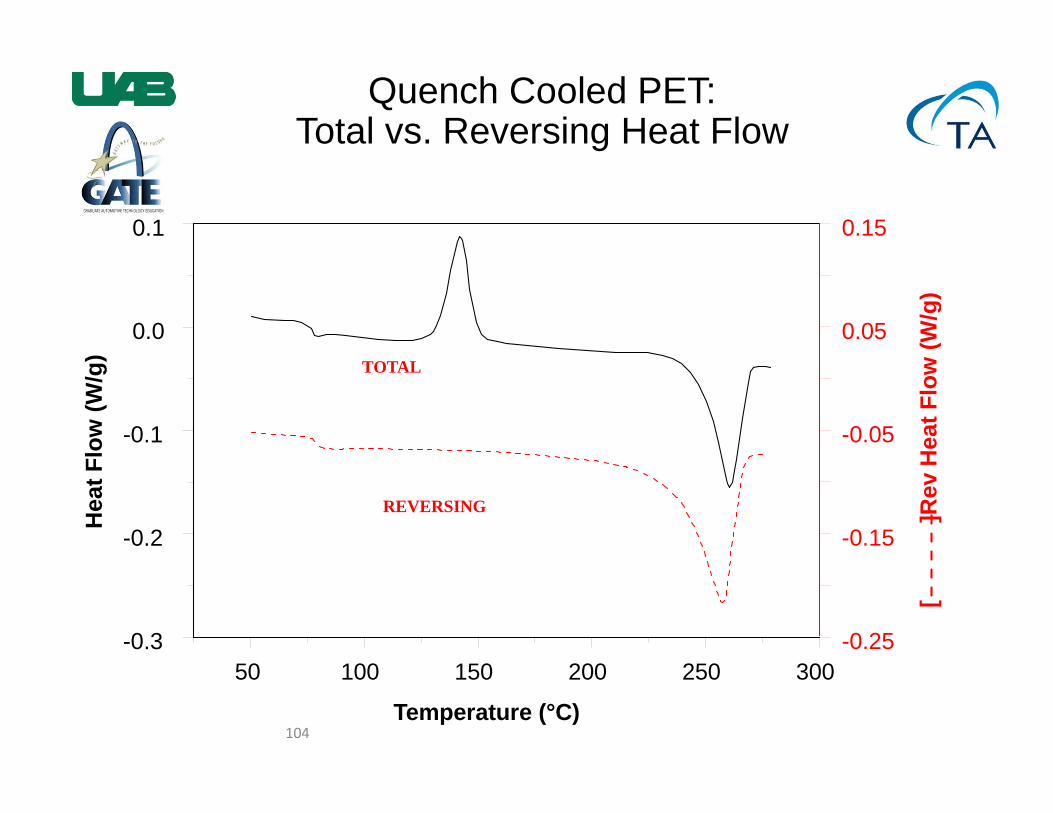
Quench Cooled PET: Total vs. Reversing Heat Flow
50 100 150 200 250 300-0.3
-0.2
-0.1
0.0
0.1
-0.25
-0.15
-0.05
0.05
0.15
Temperature (°C)
Hea
t Flo
w (W
/g)
[
]Rev
Hea
t Flo
w (W
/g)
TOTAL
REVERSING
105
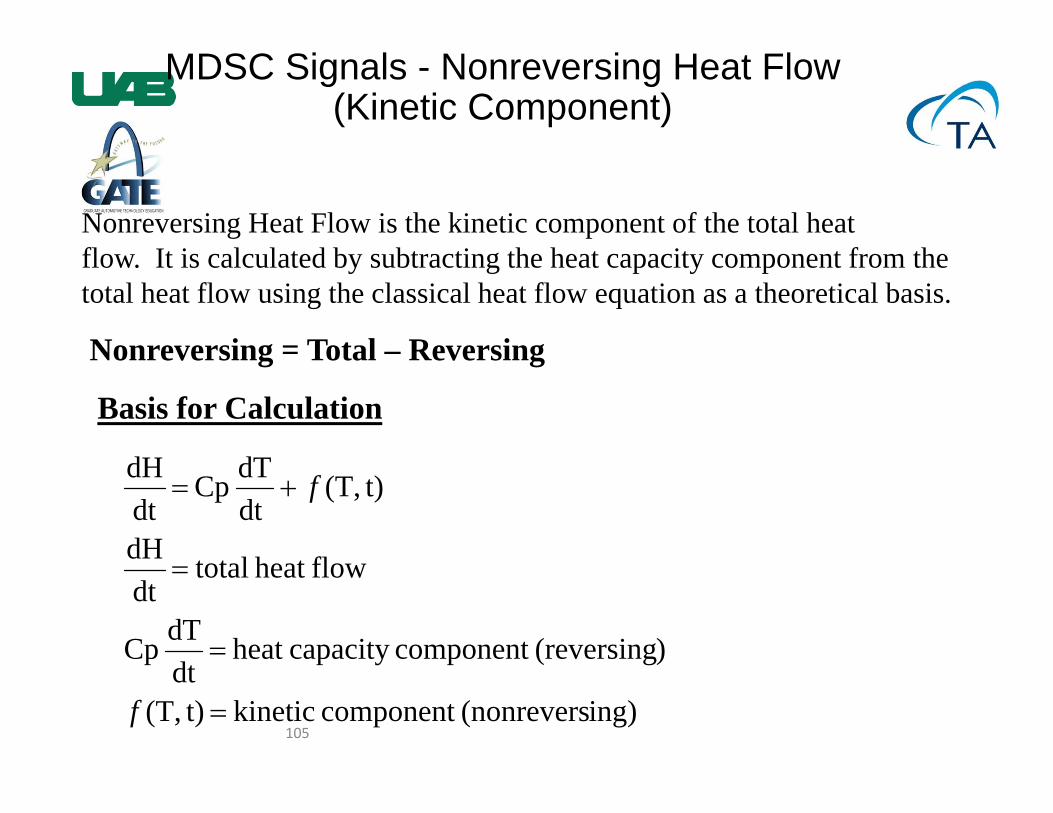
MDSC Signals - Nonreversing Heat Flow (Kinetic Component)
Nonreversing Heat Flow is the kinetic component of the total heat flow. It is calculated by subtracting the heat capacity component from the total heat flow using the classical heat flow equation as a theoretical basis.
Nonreversing = Total – Reversing
Basis for Calculation
ing)(nonreverscomponent kinetic t)(T,
)(reversingcomponent capacity heat dtdT Cp
flowheat total dtdH
t)(T, dt dT Cp
dtdH
f
f
106
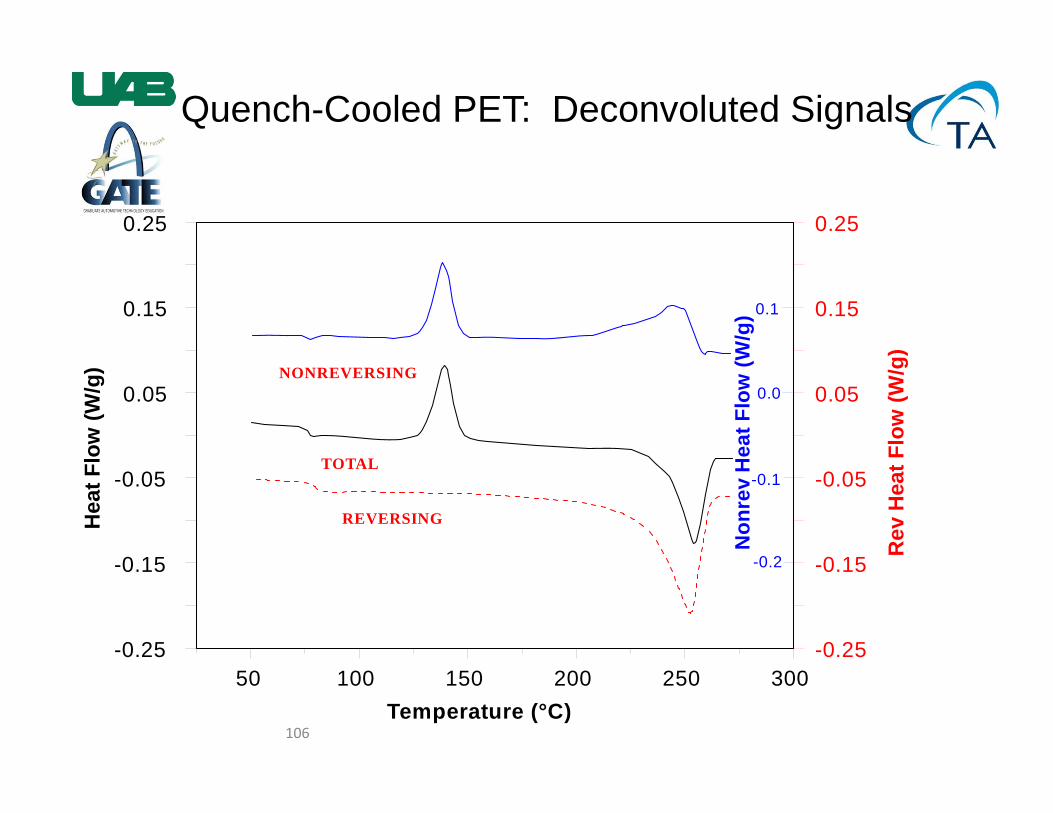
Quench-Cooled PET: Deconvoluted Signals
50 100 150 200 250 300-0.25
-0.15
-0.05
0.05
0.15
0.25
-0.25
-0.15
-0.05
0.05
0.15
0.25
Temperature (°C)
Hea
t Flo
w (W
/g)
Rev
Hea
t Flo
w (W
/g)
-0.2
-0.1
0.0
0.1
Non
rev
Hea
t Flo
w (W
/g)
NONREVERSING
TOTAL
REVERSING
107
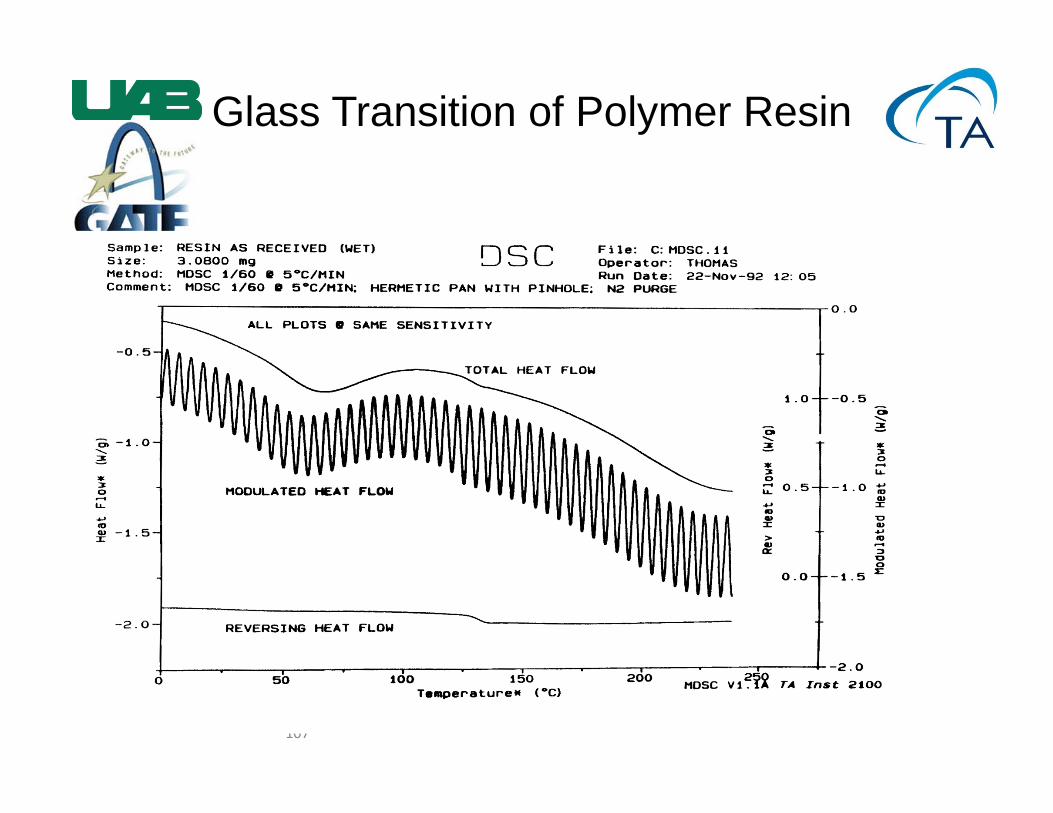
Glass Transition of Polymer Resin
108
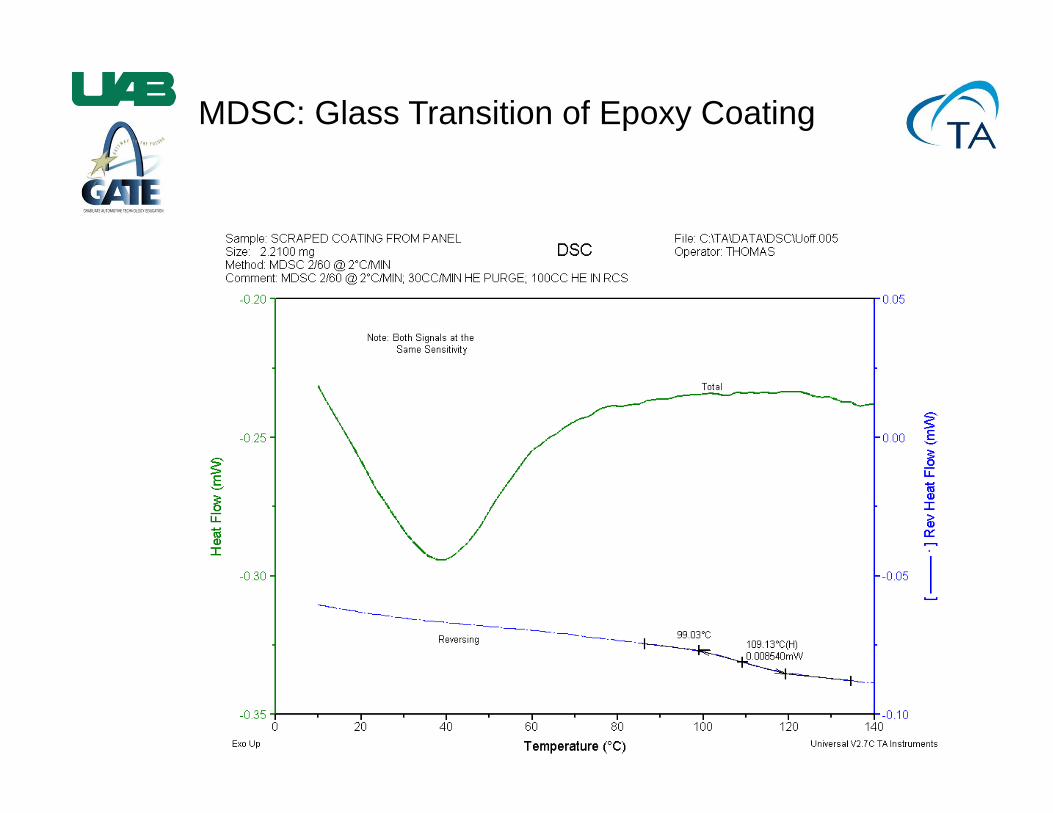
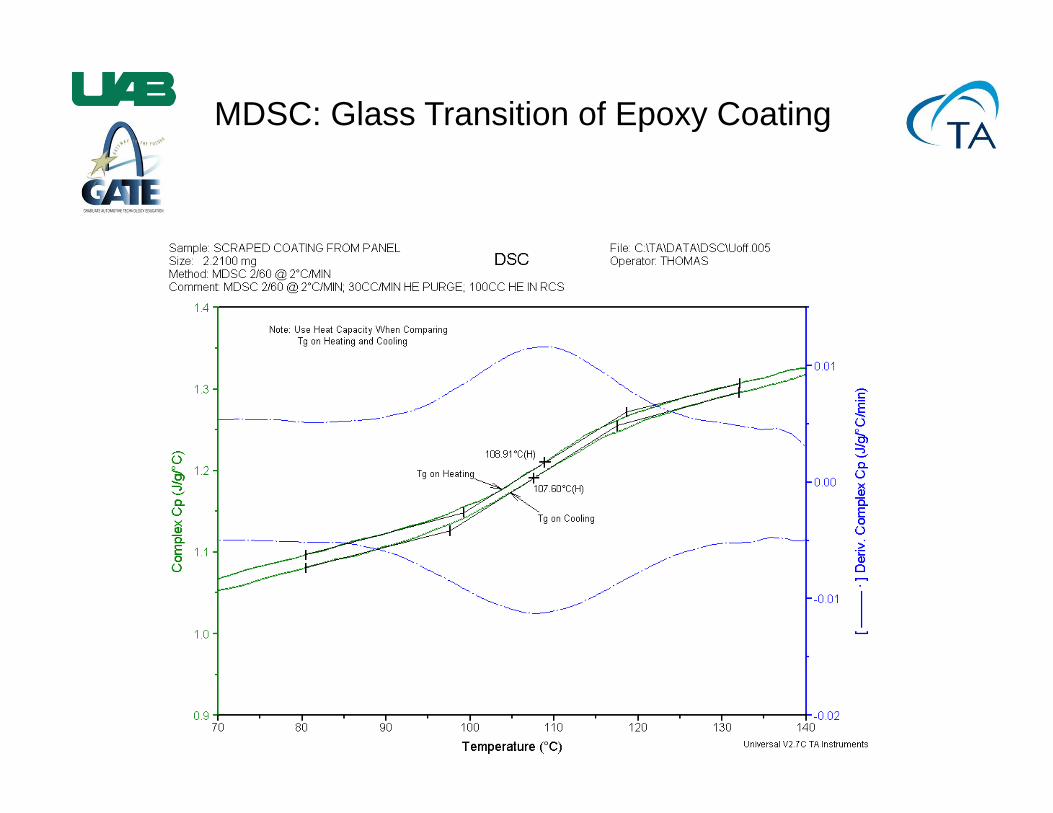
MDSC: Glass Transition of Epoxy Coating
109
MDSC: Glass Transition of Epoxy Coating
110
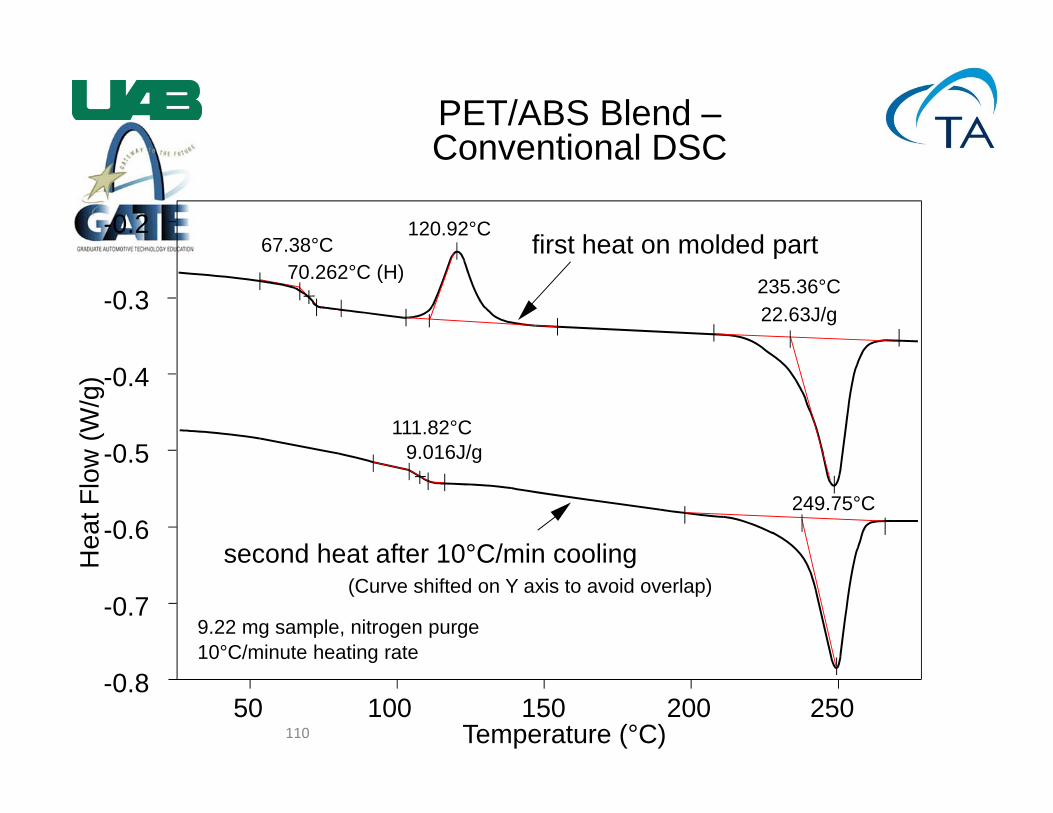
PET/ABS Blend –Conventional DSC
-0.2
-0.3
-0.4
-0.5
-0.6
-0.7
-0.8
Temperature (°C)50 100 150 200 250
Hea
t Flo
w (W
/g)
first heat on molded part
(Curve shifted on Y axis to avoid overlap)second heat after 10°C/min cooling
120.92°C67.38°C
70.262°C (H)235.36°C
111.82°C9.016J/g
22.63J/g
249.75°C
9.22 mg sample, nitrogen purge 10°C/minute heating rate
111
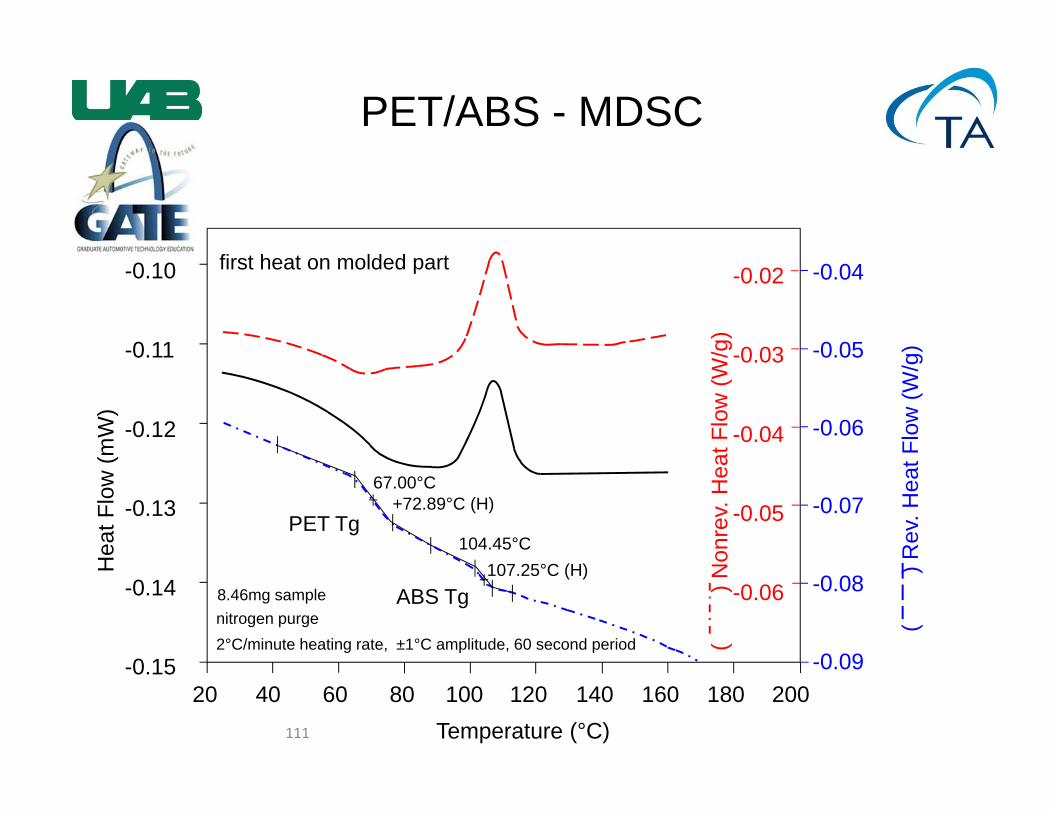
PET/ABS - MDSC
8.46mg sample nitrogen purge 2°C/minute heating rate, ±1°C amplitude, 60 second period
first heat on molded part
PET Tg
ABS Tg
-0.10
-0.11
-0.12
-0.13
-0.14
-0.15
Temperature (°C)40 60 100 120 140
Hea
t Flo
w (m
W)
20 80 160
-0.02
-0.03
-0.04
-0.05
-0.06
-0.04
-0.05
-0.06
-0.07
-0.08
-0.09
(
) N
onre
v. H
eat F
low
(W/g
)
(
) R
ev. H
eat F
low
(W/g
)
67.00°C+72.89°C (H)
104.45°C107.25°C (H)
180 200
112
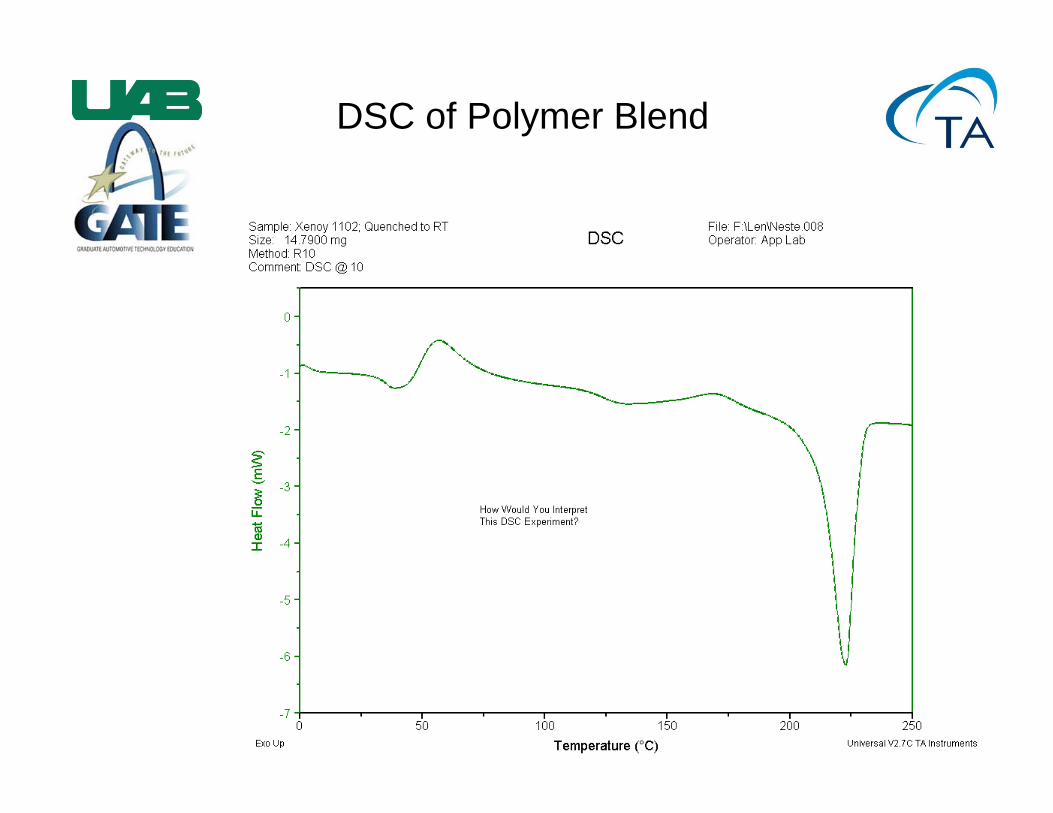
DSC of Polymer Blend
113
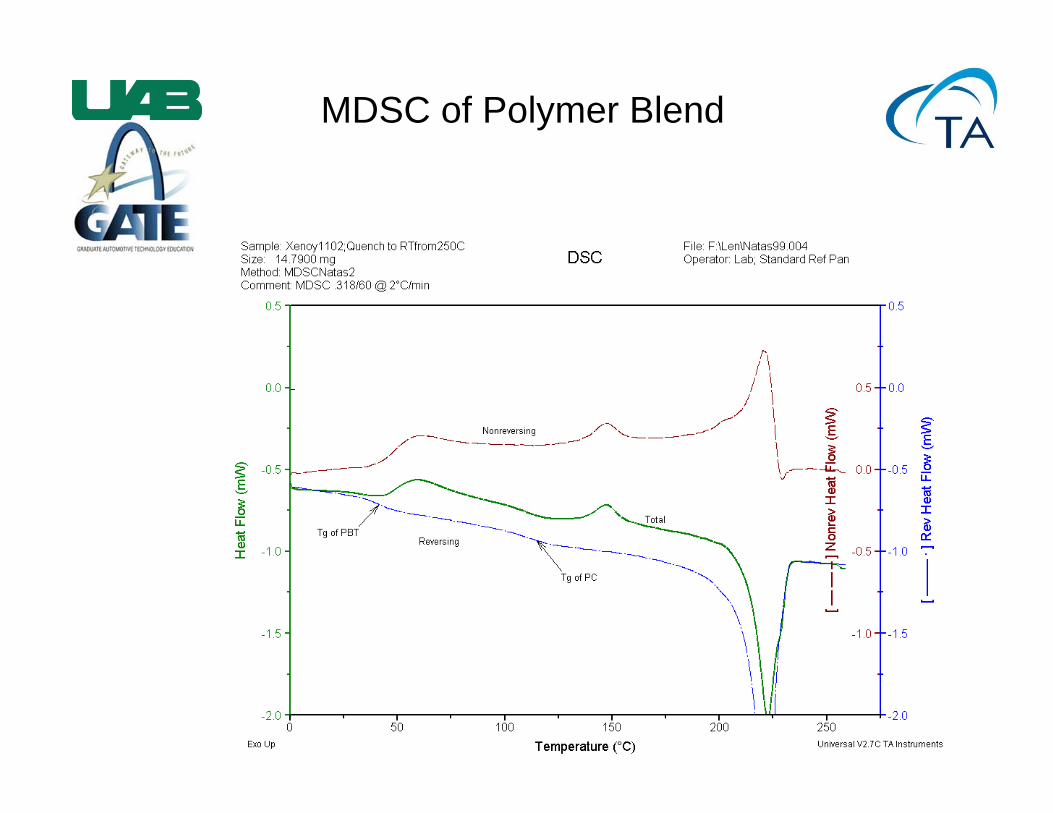
MDSC of Polymer Blend
114
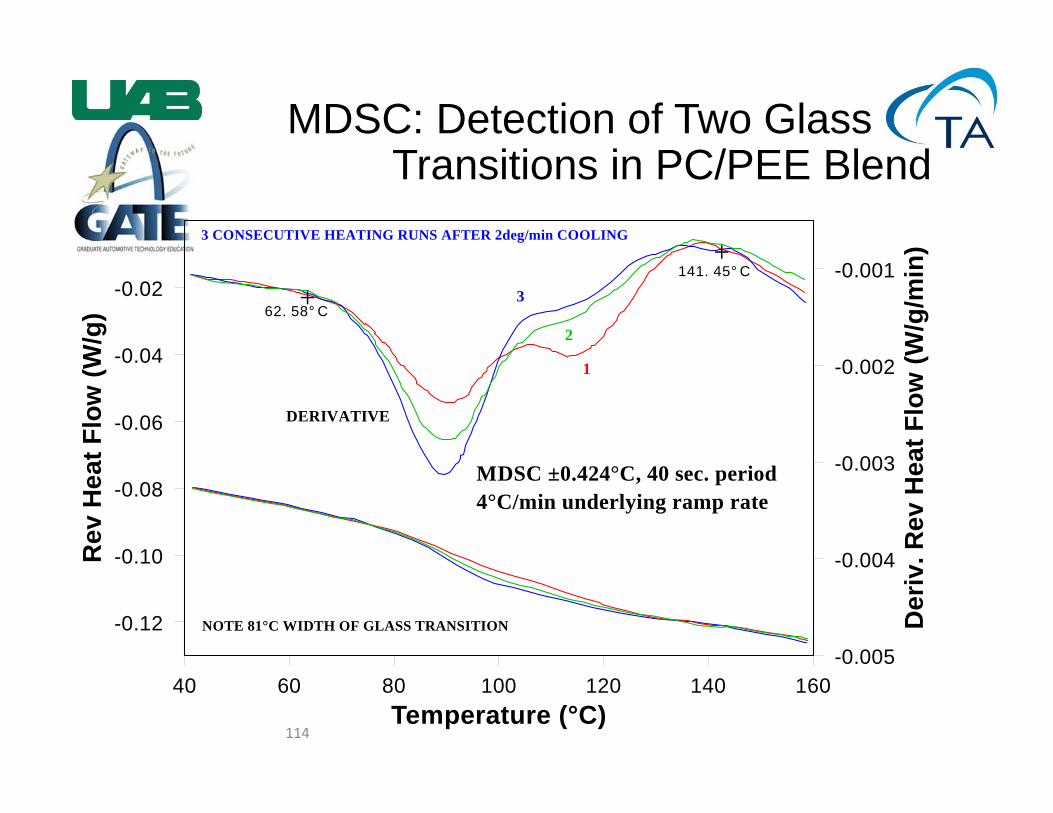
MDSC: Detection of Two GlassTransitions in PC/PEE Blend
40 60 80 100 120 140 160
-0.12
-0.10
-0.08
-0.06
-0.04
-0.02
-0.005
-0.004
-0.003
-0.002
-0.001
Temperature (°C)
Rev
Hea
t Flo
w (W
/g)
Der
iv. R
ev H
eat F
low
(W/g
/min
)3 CONSECUTIVE HEATING RUNS AFTER 2deg/min COOLING
DERIVATIVE
NOTE 81°C WIDTH OF GLASS TRANSITION
3
2
1
62. 58° C
141. 45° C
MDSC ±0.424°C, 40 sec. period4°C/min underlying ramp rate
++
115
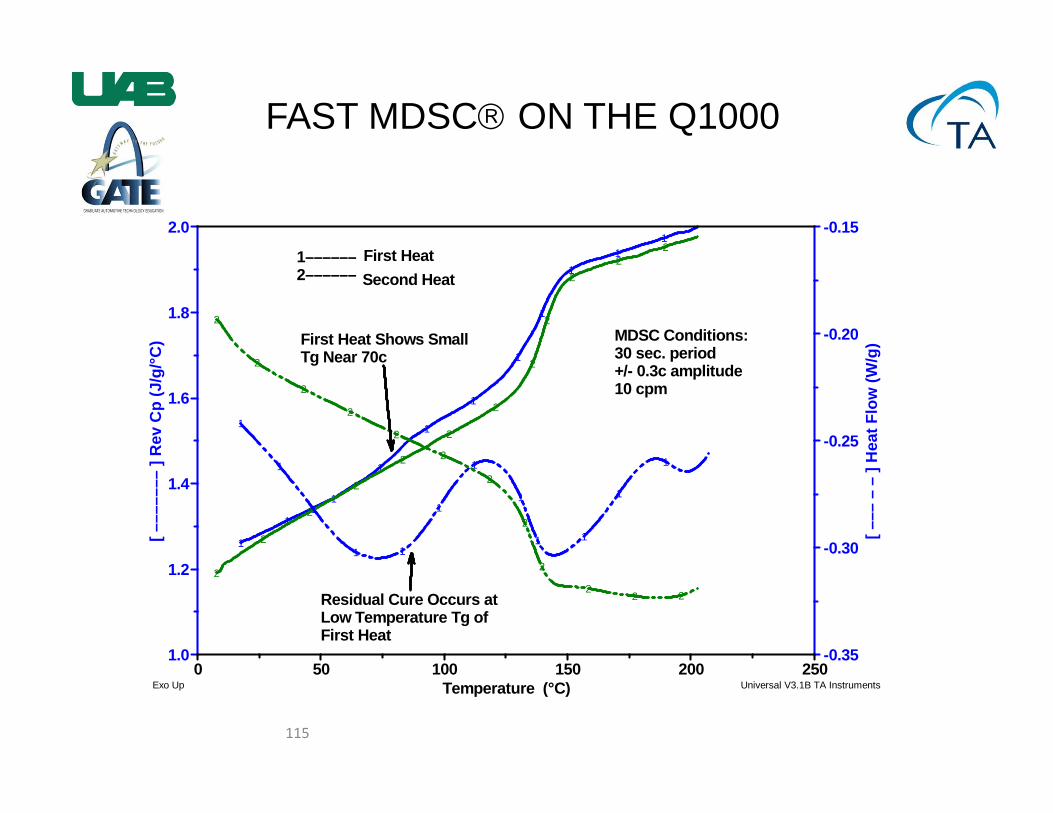
FAST MDSC ON THE Q1000
1
1
1
1
1
1
1
1
11
1
2
2
2
2
2
2
2
2
2
22
2
1
1
1
1 1
1
1
1
1 1
1
1
2
2
2
2
2
2
2
2
2
22 2
First HeatSecond Heat
First Heat Shows SmallTg Near 70c
Residual Cure Occurs at Low Temperature Tg of First Heat
MDSC Conditions:30 sec. period+/- 0.3c amplitude10 cpm
-0.35
-0.30
-0.25
-0.20
-0.15
[ –––
– –
] H
eat F
low
(W/g
)
1.0
1.2
1.4
1.6
1.8
2.0
[ –––
––––
] R
ev C
p (J
/g/°C
)
0 50 100 150 200 250Temperature (°C)
1––––––2––––––
Exo Up Universal V3.1B TA Instruments
116
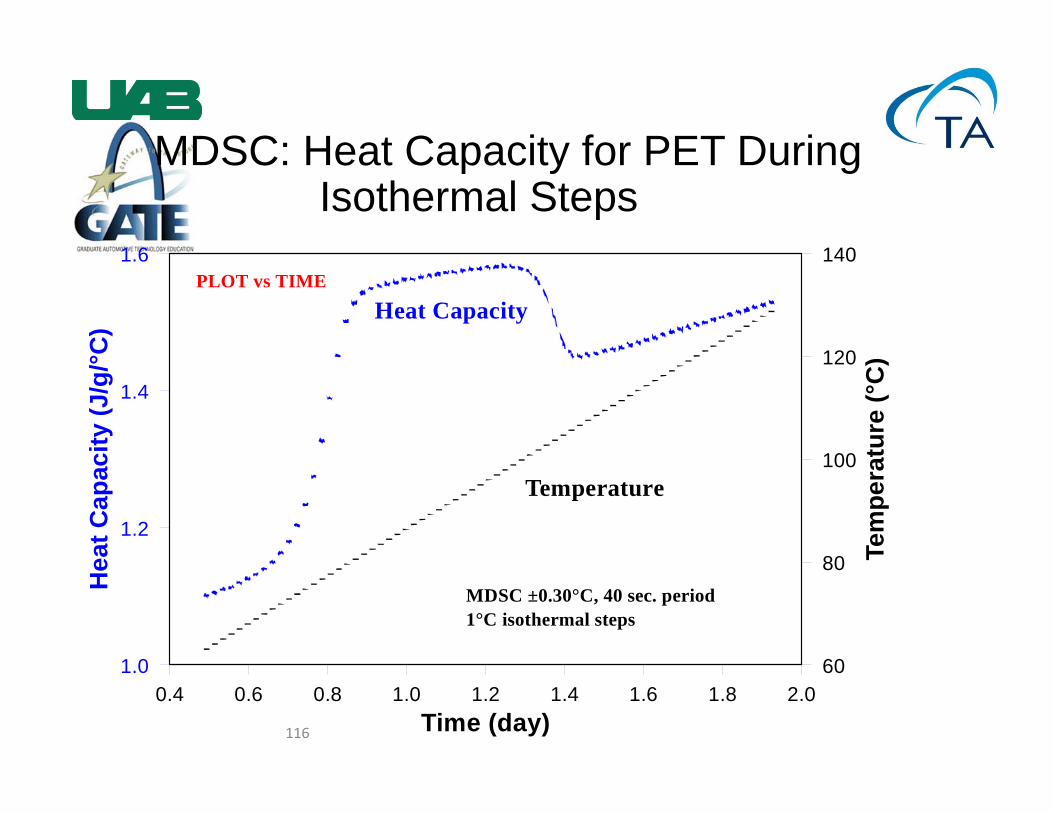
MDSC: Heat Capacity for PET DuringIsothermal Steps
0.4 0.6 0.8 1.0 1.2 1.4 1.6 1.8 2.01.0
1.2
1.4
1.6
60
80
100
120
140
Time (day)
Hea
t Cap
acity
(J/g
/°C)
Tem
pera
ture
(°C
)
PLOT vs TIME
Heat Capacity
Temperature
MDSC ±0.30°C, 40 sec. period1°C isothermal steps
117
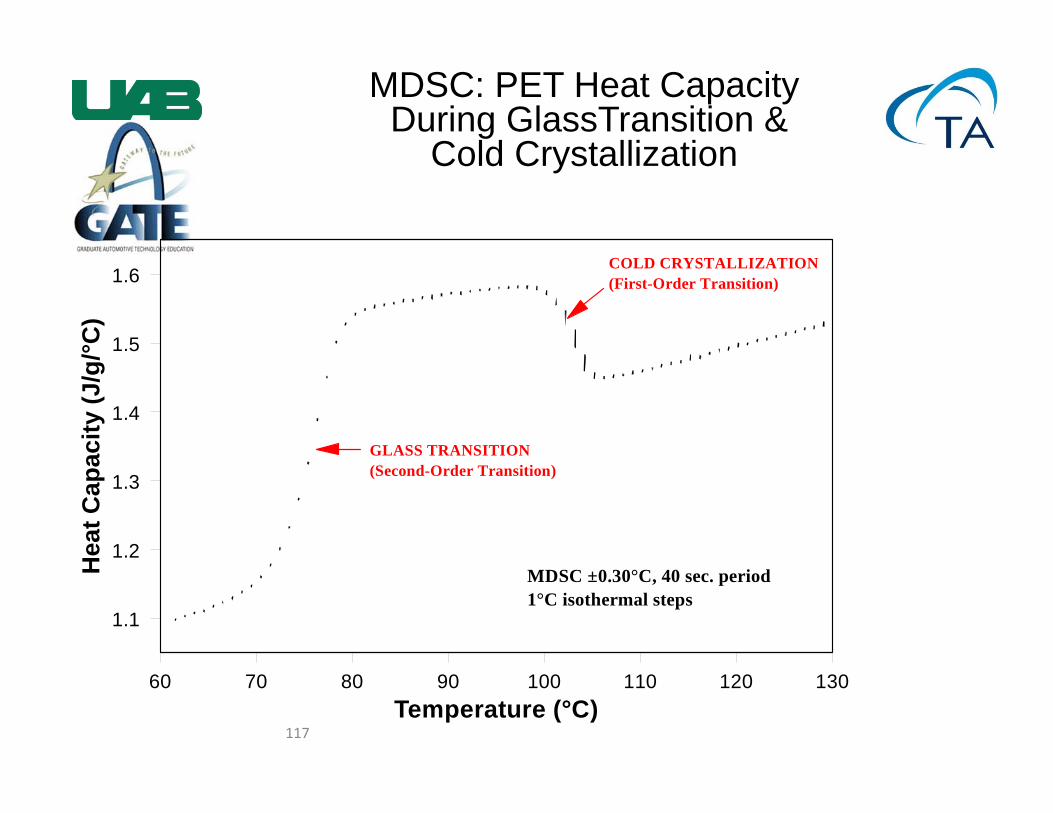
MDSC: PET Heat CapacityDuring GlassTransition &
Cold Crystallization
60 70 80 90 100 110 120 130
1.1
1.2
1.3
1.4
1.5
1.6
Temperature (°C)
Hea
t Cap
acity
(J/g
/°C)
COLD CRYSTALLIZATION(First-Order Transition)
GLASS TRANSITION(Second-Order Transition)
MDSC ±0.30°C, 40 sec. period1°C isothermal steps
118
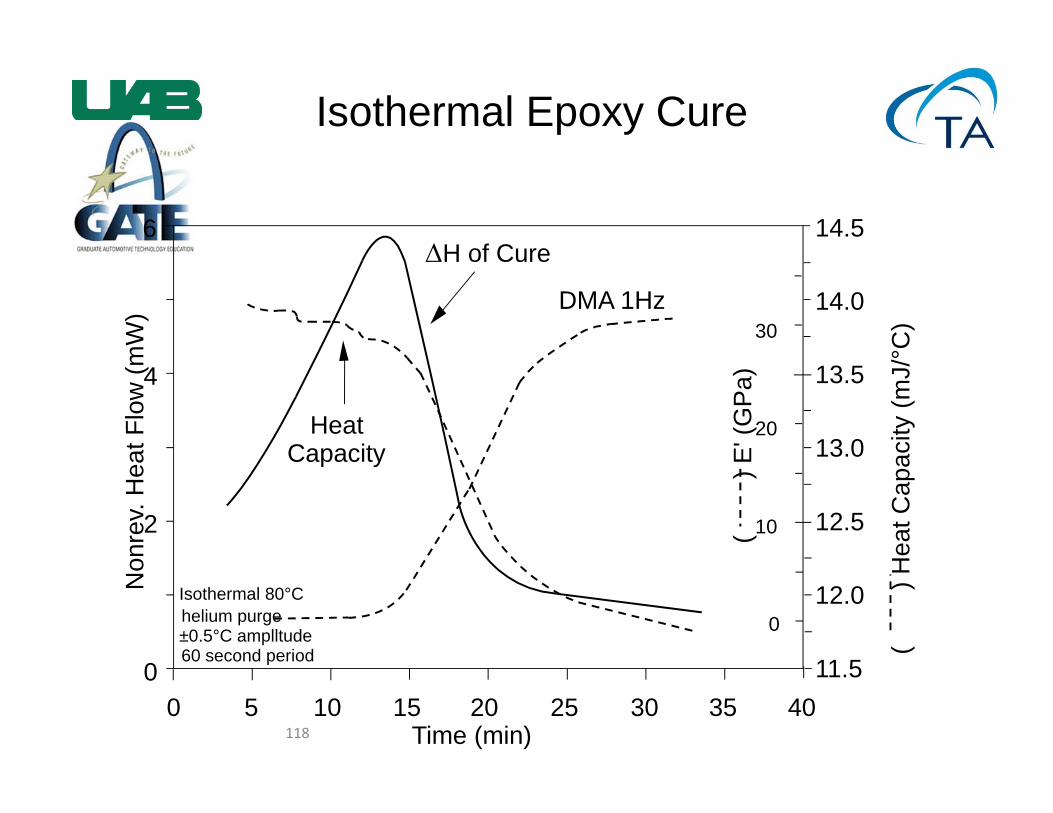
Isothermal Epoxy Cure
H of Cure6
4
2
0
Time (min)5 10 20 25 30
Non
rev.
Hea
t Flo
w (m
W)
Heat Capacity
Isothermal 80°C helium purge ±0.5°C amplltude 60 second period
DMA 1Hz
0 15 35 40
30
20
10
0
(
) H
eat C
apac
ity (m
J/°C
)
14.5
14.0
13.5
13.0
12.5
12.0
11.5
(
) E
' (G
Pa)
119
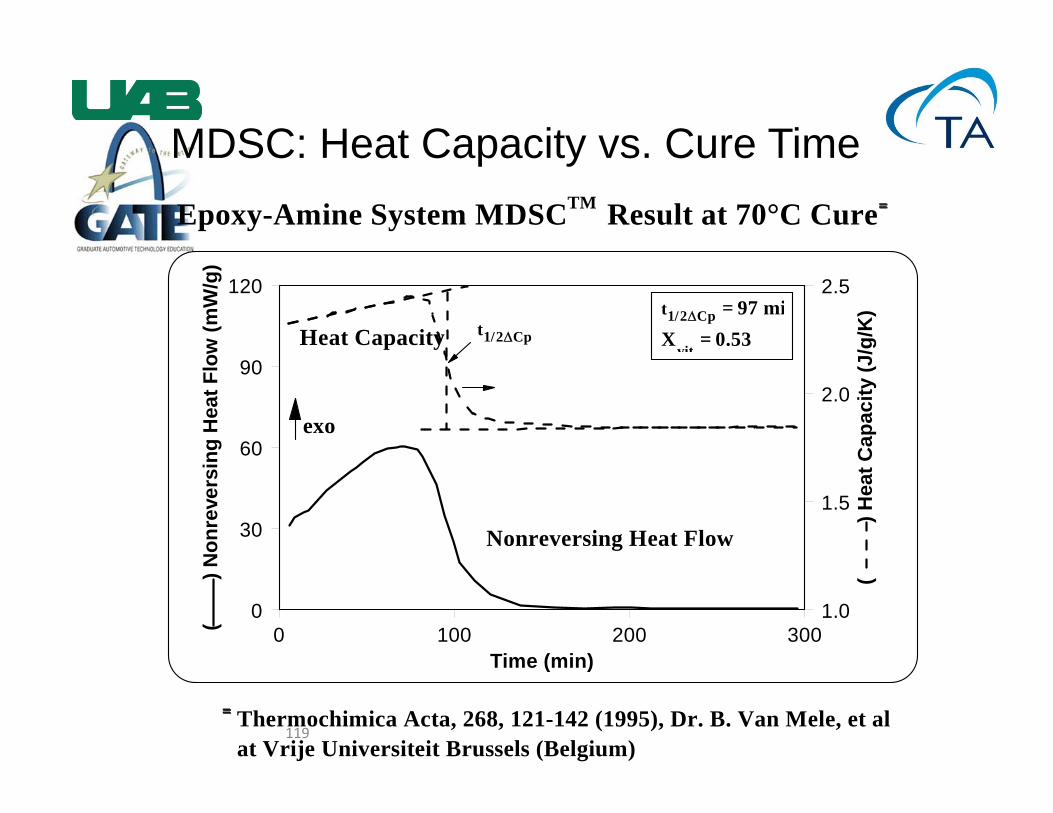
MDSC: Heat Capacity vs. Cure TimeTM =Epoxy-Amine System MDSC Result at 70°C Cure
Thermochimica Acta, 268, 121-142 (1995), Dr. B. Van Mele, et alat Vrije Universiteit Brussels (Belgium)
=
0 100 200 3000
30
60
90
120
1.0
1.5
2.0
2.5
Time (min)
(
) N
onre
vers
ing
Hea
t Flo
w (m
W/g
)
(
)
Hea
t Cap
acity
(J/g
/K)
exo
t1/2 Cp
t1/2 Cp
vit
= 97 miX = 0.53
Nonreversing Heat Flow
Heat Capacity
120
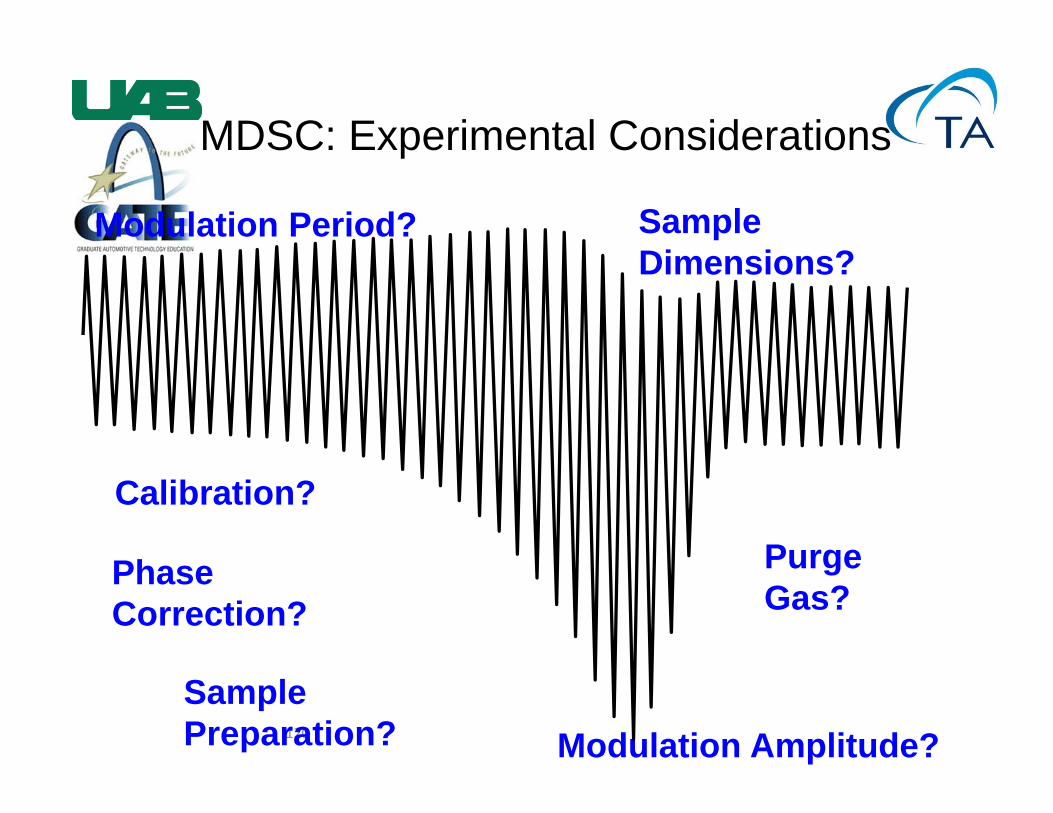
MDSC: Experimental Considerations
Modulation Period?
Modulation Amplitude?
Sample Dimensions?
Purge Gas?
Sample Preparation?
Phase Correction?
Calibration?
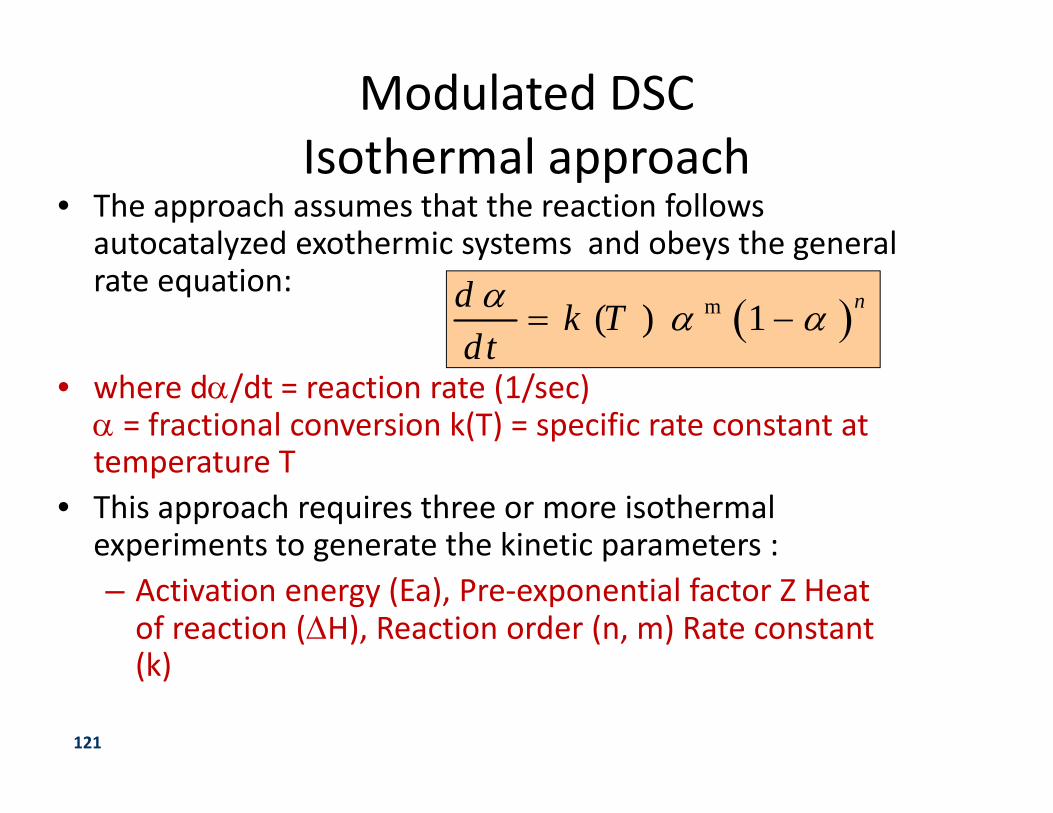
Modulated DSCIsothermal approach
• The approach assumes that the reaction follows autocatalyzed exothermic systems and obeys the general rate equation:
• where d/dt = reaction rate (1/sec) = fractional conversion k(T) = specific rate constant at temperature T
• This approach requires three or more isothermal experiments to generate the kinetic parameters : – Activation energy (Ea), Pre‐exponential factor Z Heat of reaction (H), Reaction order (n, m) Rate constant (k)
m( ) 1 nd k Tdt
121
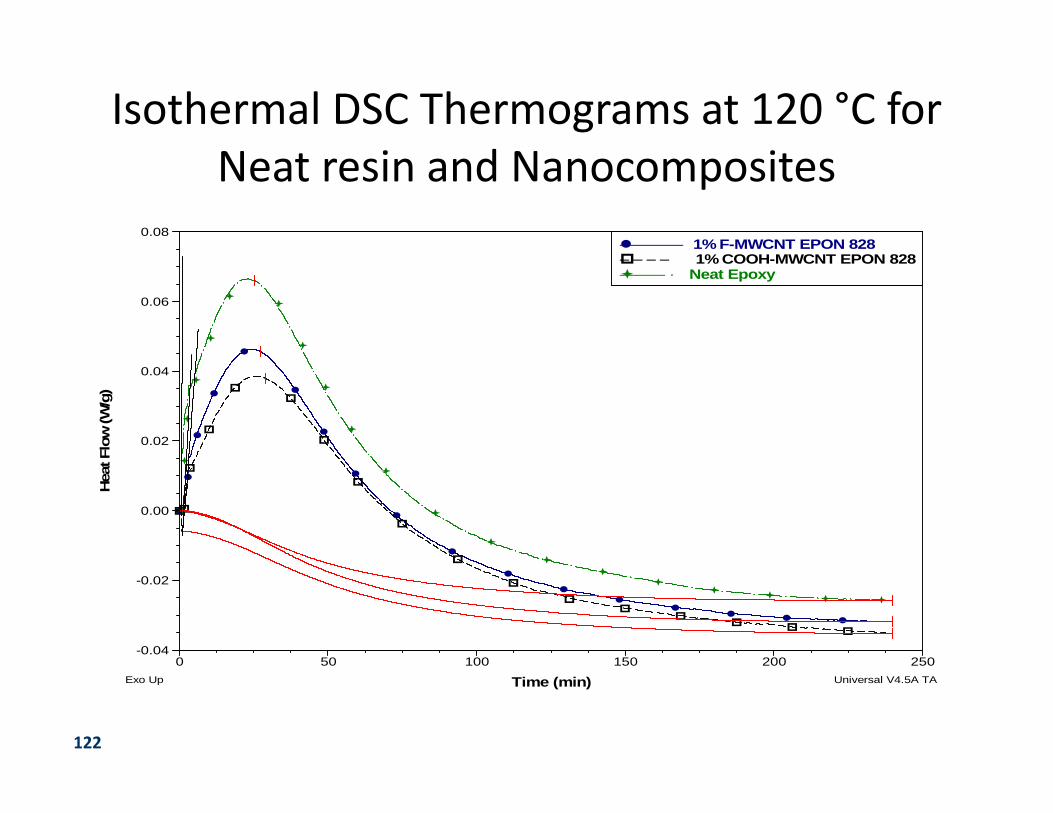
Isothermal DSC Thermograms at 120 °C for Neat resin and Nanocomposites
-0.04
-0.02
0.00
0.02
0.04
0.06
0.08
Hea
t Flo
w (W
/g)
0 50 100 150 200 250
Time (min)
1% F-MWCNT EPON 828––––––– 1% COOH-MWCNT EPON 828– – – – Neat Epoxy––––– ·
Exo Up Universal V4.5A TA I
122
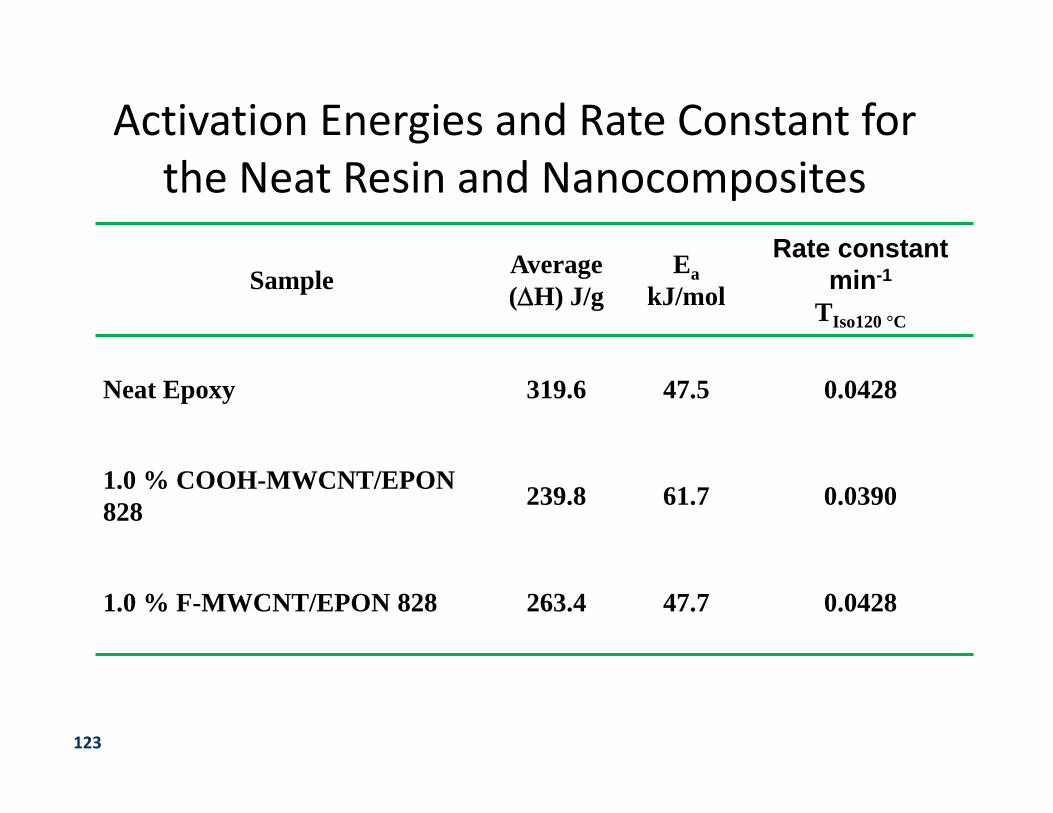
Activation Energies and Rate Constant for the Neat Resin and Nanocomposites
Sample Average (H) J/g
EakJ/mol
Rate constant min-1
TIso120 °C
Neat Epoxy 319.6 47.5 0.0428
1.0 % COOH-MWCNT/EPON 828 239.8 61.7 0.0390
1.0 % F-MWCNT/EPON 828 263.4 47.7 0.0428
123
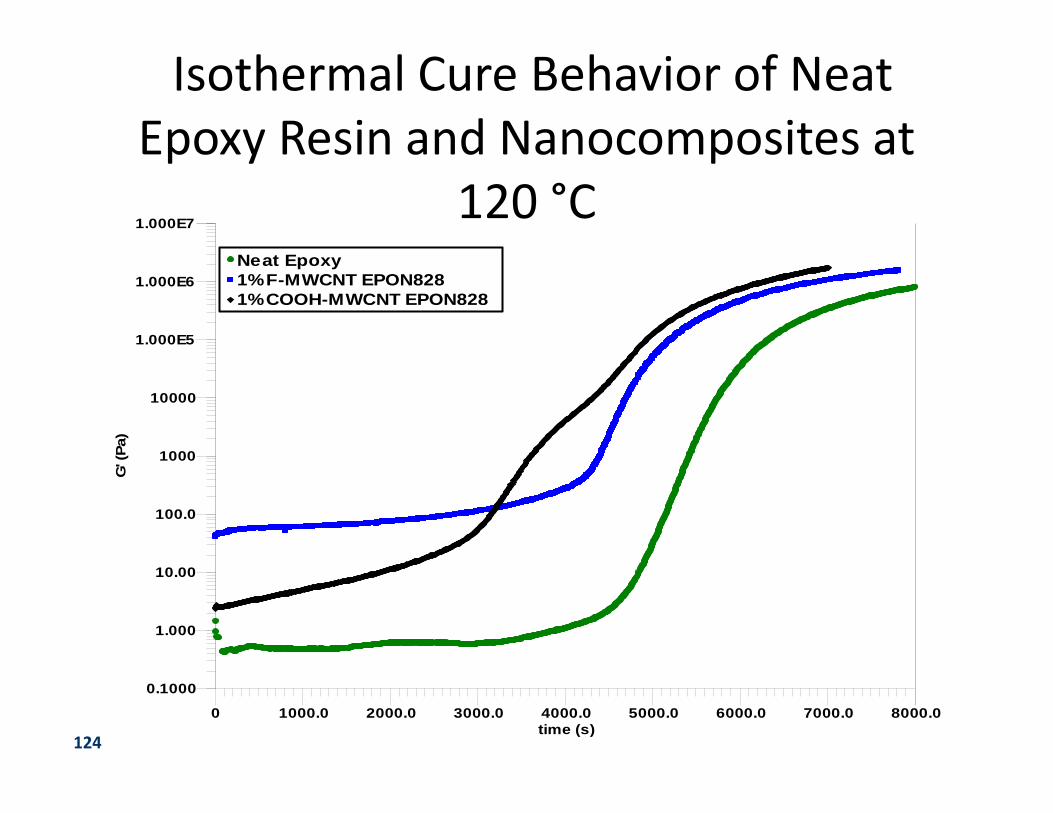
Isothermal Cure Behavior of Neat Epoxy Resin and Nanocomposites at
120 °C
0 1000.0 2000.0 3000.0 4000.0 5000.0 6000.0 7000.0 8000.0time (s)
0.1000
1.000
10.00
100.0
1000
10000
1.000E5
1.000E6
1.000E7
G' (
Pa)
Neat Epoxy1% F-MWCNT EPON8281% COOH-MWCNT EPON828
124
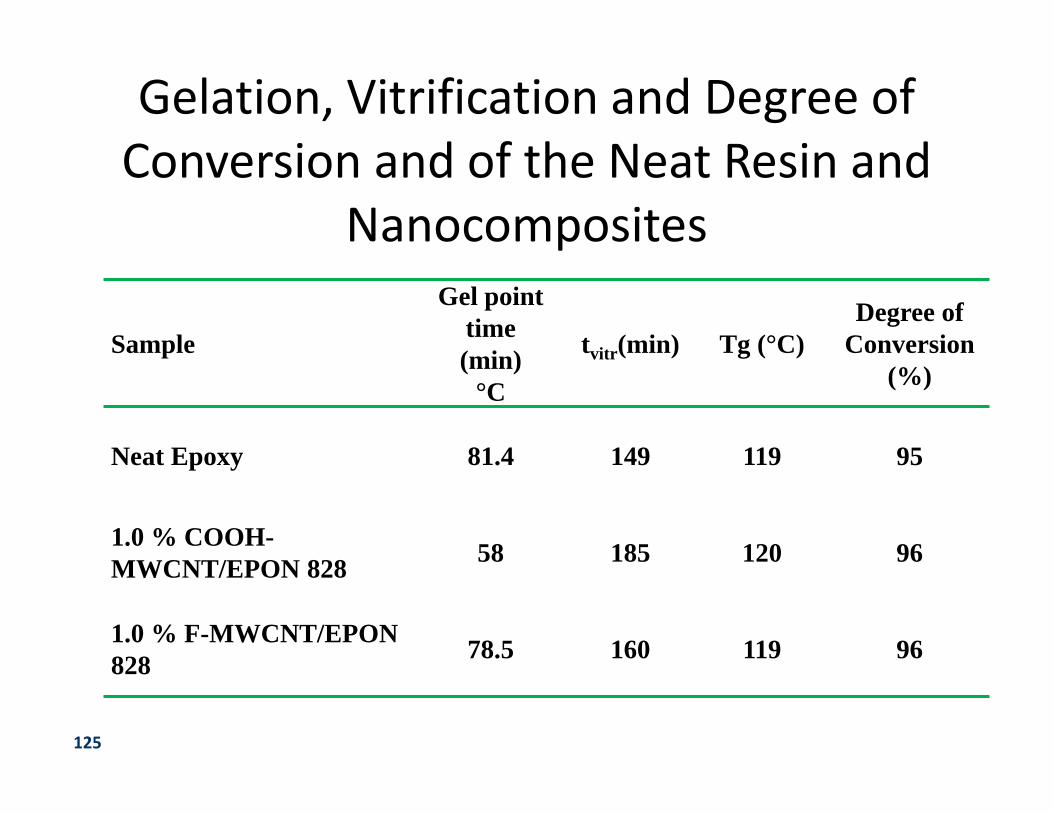
Gelation, Vitrification and Degree of Conversion and of the Neat Resin and
Nanocomposites
Sample
Gel point time (min)
°C
tvitr(min) Tg (°C)Degree of
Conversion (%)
Neat Epoxy 81.4 149 119 95
1.0 % COOH-MWCNT/EPON 828 58 185 120 96
1.0 % F-MWCNT/EPON 828 78.5 160 119 96
125
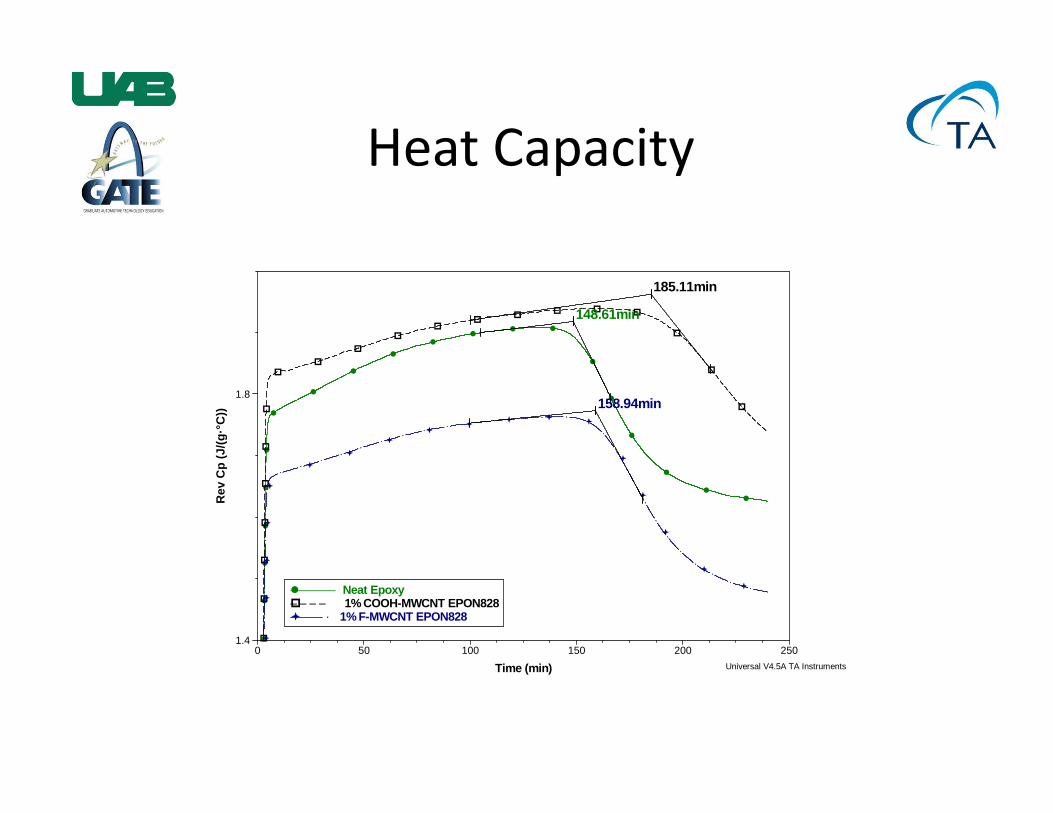
Heat Capacity
148.61min
185.11min
158.94min
1.4
1.8
Rev
Cp
(J/(g
·°C
))
0 50 100 150 200 250
Time (min)
Neat Epoxy––––––– 1% COOH-MWCNT EPON828– – – – 1% F-MWCNT EPON828––––– ·
Universal V4.5A TA Instruments
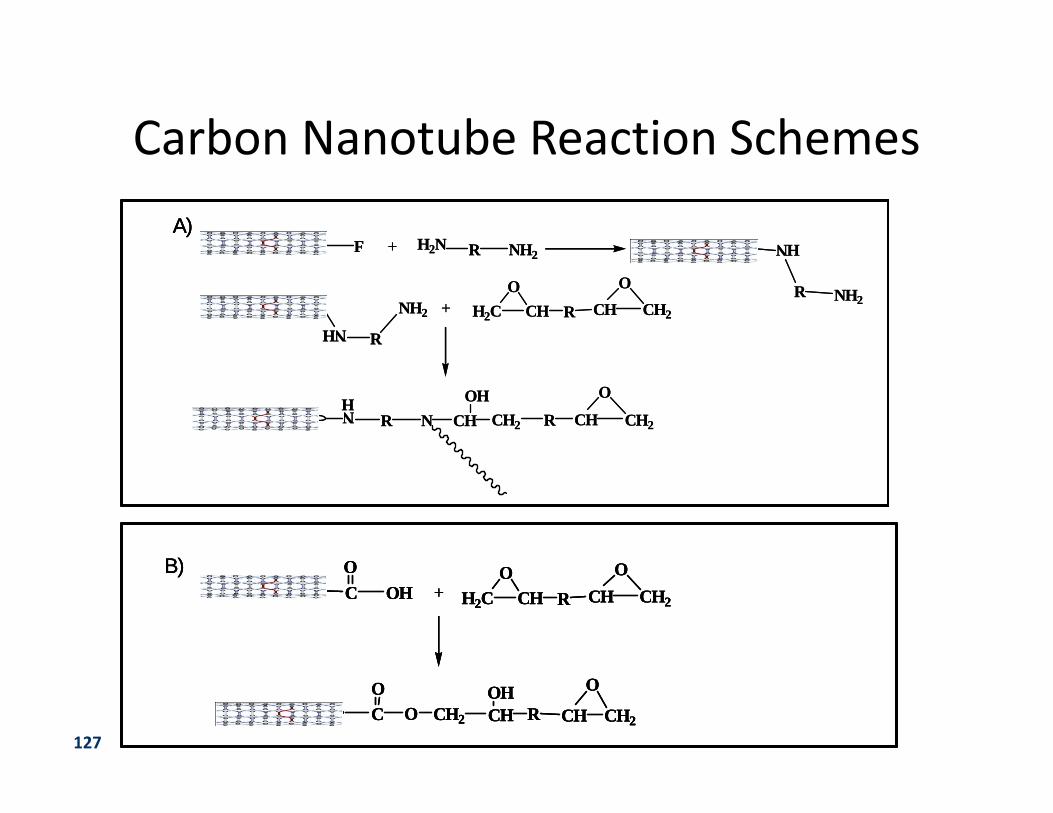
Carbon Nanotube Reaction Schemes
F H2N R NH2
HN
R NH2
+
NH
R
NH2 + CH RH2CO
CH CH2
O
NH
R N CH2 RCHOH
CH CH2
O
A)
B)CO
CO
O CH2 CHOH
R
OH + CH RH2CO
CH CH2
O
CH CH2
O
F H2N R NH2
HN
R NH2
+
NH
R
NH2 + CH RH2CO
CH CH2
O
NH
R N CH2 RCHOH
CH CH2
O
A)
B)CO
CO
O CH2 CHOH
R
OH + CH RH2CO
CH CH2
O
CH CH2
O
A)
B)CO
CO
O CH2 CHOH
R
OH + CH RH2CO
CH CH2
O
CH CH2
O
127
128
MDSC: Sample Preparation
Thin, Low Mass SamplesMinimize Thermal GradientsAllow for Faster Periods, Larger Modulation Amplitudes
Thicker, Heavier SamplesMinimize Baseline CurvatureImprove Sensitivity

129
Low, Consistent Mass Best Choice for MDSC Measurements Solids, Powders, Films Volatility may be an issue
MDSC: Sample Pans Standard Crimped
130
MDSC: Sample Pans Standard Hermetic
Use for liquid/volatile samples Higher Mass, Less Sensitivity Use Heat Sink Compound
131
NitrogenEconomicalWide Operating RangeProvides Good Sensitivity
HeliumHigher Thermal ConductivityFacilitates Wider Range of Modulation
ConditionsReduces Baseline Curvature
MDSC: Purge Gas
132
MDSC: Purge GasFlow Rates
Use Purge Gas Flow Rate of 50 mL/min. (N2) & 25 ml/min (He)
Faster rates increase noise Slower rates decrease sensitivity, increase baseline curvature
Flow Purge Gas through Vacuum Portat 50 mL/min.
Improves response of furnace Facilitates wider range of modulation
parameters
133
MDSC: Heat Capacity Calibration
Provides for Accurate Heat Capacity MeasurementsUse Either Sapphire Disc (wide temperature range) or HDPE (polymer melt)Choose one‐point or average valuesEffects of Experimental Conditions
Variations in DSC
• Pressure DSC• Photo DSC


![Differential scanning calorimetry [dsc]](https://static.fdocuments.in/doc/165x107/58f9b1b1760da3da068bc34a/differential-scanning-calorimetry-dsc-58f9c49a6e874.jpg)