Differential Global Positioning System applied - Almazan Ingenieros
12
High Precision Bathymetry Using Differential Global Positioning System to the Evolution Model of the Torremolinos Beach Univ. Prof. Dr. Ing. José Luis Almazán Gárate 1 , Dr. Ing. José Raúl García Montes 1 , Univ. Prof. Dra. M. Carmen Palomino Monzón 1 , Univ. Prof. Dr. Ing. Günter Hein 2. The Spanish coastal system plays a very important role in its economy, especially considering its relation with tourism income. Due to this, the coastal manager has to analyze and be able to predict the evolution of the coastal system as environmental and human agents act over it. The main goal in coastal engineering is to be able to make a model of a portion of the coast. That is, given an initial shore status, be capable of accurately forecasting its final condition after a given period of time. At present, there are numerous models with different spatial and time scales, more or less accurately fulfilling this objective. Above all, the growing computing power of computers is allowing higher levels of precision to be reached in final results. Nevertheless, the bathymetric data acquisition system, which constitutes the main data source in any coastal model, has less accuracy than the most advanced computer programs are able to compute. Better accuracy in bathymetric data, both in the initial status input stage and in the model calibration stage, improves final results, keeping them closer to reality and thus almost using the models full capabilities. 1. Scope. Nowadays, the techniques that the differential GPS offers, opens new horizons to a greater number of techniques and scientific applications. Solving the age old problem of the seafarer, precision positioning in the sea. In addition, these techniques open new fields in hydrography, oceanography and in all areas that require geographically referenced data acquisition of the sea. 2. Raising out the investigation. In Spain, because of tourism, the beaches are an economic and environmental resource of first order. Because of this, the idea of studying the evolution of a beach using precise bathymetric models emerged. This was obtained by making use of two GPS stations, one fixed on land (reference station) and the other in motion on a boat (rover station) with a digital echo sounder on board. In this way, when the echo sounder and the GPS antenna are located on the same vertical the effect of the tide and swell are eliminated as the sea bed is then absolutely referenced to the ellipsoid (Figure 1), according to the following formula: A = H - P – D 3. Development of the bathymetric data acquisition system. The bathymetry system used, named SIBAP, was developed at the Universität der Bendeswehr München and the Universidad Politécnica de Madrid. The main researchers of this development were Univ. Prof. Dr. Ing. Günter Hein and the Univ. Prof. Dr. Ing. José Luis Almazán. This system has the aim of making very highly accurate bathymetry surveys on all types of water surfaces, integrating the signals received from the GPS constellation satellites and from a digital echo sounder. The SIBAP implementation was carried out with success in 1995 (Figure 2) and consists of the drawing together of the different types of equipment and software applications. 3.1. Rover station. The rover station consists of a boat (the one used in the tests was a Calypso 700 with a 7m length and a 2.5m beam) on which the following equipment was set up: - GPS PCI Card - GPS anntena - Anti-multipath filter - Cable contact between antenna and card - Digital echosounder - Transducer - Cable contact between transducer and echosounder - Stainless steel mast for connecting the GPS antenna and the echosounder transducer - Two Radio FM equipment - Hardware and software for the data acquisition and telemetry emission - Stable stand-alone system of electric supply (1) Escuela Técnica Superior de Caminos, Canales y Puertos. Universidad Politécnica de Madrid, Spain. (2) Universität der Bendeswehr München, Germany.
Transcript of Differential Global Positioning System applied - Almazan Ingenieros

High Precision Bathymetry Using Differential Global Positioning System to the Evolution Model of the Torremolinos Beach Univ. Prof. Dr. Ing. José Luis Almazán Gárate1 , Dr. Ing. José Raúl García Montes1, Univ. Prof. Dra. M. Carmen Palomino Monzón1, Univ. Prof. Dr. Ing. Günter Hein2.
The Spanish coastal system plays a very important role in its economy, especially considering its relation with tourism income. Due to this, the coastal manager has to analyze and be able to predict the evolution of the coastal system as environmental and human agents act over it. The main goal in coastal engineering is to be able to make a model of a portion of the coast. That is, given an initial shore status, be capable of accurately forecasting its final condition after a given period of time. At present, there are numerous models with different spatial and time scales, more or less accurately fulfilling this objective. Above all, the growing computing power of computers is allowing higher levels of precision to be reached in final results. Nevertheless, the bathymetric data acquisition system, which constitutes the main data source in any coastal model, has less accuracy than the most advanced computer programs are able to compute. Better accuracy in bathymetric data, both in the initial status input stage and in the model calibration stage, improves final results, keeping them closer to reality and thus almost using the models full capabilities. 1. Scope. Nowadays, the techniques that the differential GPS offers, opens new horizons to a greater number of techniques and scientific applications. Solving the age old problem of the seafarer, precision positioning in the sea. In addition, these techniques open new fields in hydrography, oceanography and in all areas that require geographically referenced data acquisition of the sea. 2. Raising out the investigation. In Spain, because of tourism, the beaches are an economic and environmental resource of first order. Because of this, the idea of studying the evolution of a beach using precise bathymetric models emerged. This was obtained by making use of two GPS stations, one fixed on land (reference station) and the other in motion on a boat (rover station) with a digital echo sounder on board. In this way, when the echo sounder and the GPS antenna are located on the same vertical the effect of the tide and swell are eliminated as the sea bed is then absolutely referenced to the ellipsoid (Figure 1), according to the following formula:
A = H - P – D
3. Development of the bathymetric data
acquisition system. The bathymetry system used, named SIBAP, was developed at the Universität der Bendeswehr München and the Universidad Politécnica de
Madrid. The main researchers of this development were Univ. Prof. Dr. Ing. Günter Hein and the Univ. Prof. Dr. Ing. José Luis Almazán. This system has the aim of making very highly accurate bathymetry surveys on all types of water surfaces, integrating the signals received from the GPS constellation satellites and from a digital echo sounder.
The SIBAP implementation was carried out with success in 1995 (Figure 2) and consists of the drawing together of the different types of equipment and software applications.
3.1. Rover station. The rover station consists of a boat (the one used in the tests was a Calypso 700 with a 7m length and a 2.5m beam) on which the following equipment was set up:
- GPS PCI Card - GPS anntena - Anti-multipath filter - Cable contact between antenna and card - Digital echosounder - Transducer - Cable contact between transducer and
echosounder - Stainless steel mast for connecting the GPS
antenna and the echosounder transducer - Two Radio FM equipment - Hardware and software for the data
acquisition and telemetry emission - Stable stand-alone system of electric supply
(1) Escuela Técnica Superior de Caminos, Canales y Puertos. Universidad Politécnica de Madrid, Spain. (2) Universität der Bendeswehr München, Germany.

3.2. Reference station. The reference station is a twin to the rover station removing the echo sounder, the transducer and adding a topographic tripod for setting up the antenna.
3.3. Needed software. For the data acquisition from the echosounder and the GPS, and for doing the differential correction of the rover satation positions, the following software was used:
a) Novatel Winsat. A commercial program used
in GPS position data management and acquisition from the rover station and the reference station.
b) Echo application. A module developed by a team from the Universität der Bendeswehr München that works with the commercial program Microcalc Origin and that is used in the rover station for the synchronize recording of the echo sounder data and GPS measuring time, as well as for a shipping plan pre-established by accurate GPS data obtained in real time, thanks to the differential corrections that arrive by radio to the reference station.
c) Dif-Gps Program. This MS-DOS application, developed by the team of the Universität der Bendeswehr München, carries out the post-process of the differential correction of the position signals searched by the rover station.
3.4. Methodology for carring out bathymetry
with SIBAP. The methodology for carrying out bathymetry within this investigation has been the following:
- Choosing the location and the positioning of the reference station just on top of a high precision geodesic vertex of the Spanish national geodesic network. In Spain, the possibility of finding a high precision geodesic vertex in the nearness of the place to survey is very high. The precision of this place that we obtained was less than one centimeter.
- Carrying out the shipping plan of the area to survey. This plan is later followed during shipping thanks to the differential corrections in real time that arrives by radio from the reference station.
- Carrying out the survey on the selected surface.
- Data post-process in which the differential correction is carried out with the Dif-Gps software and possible record errors.
- Merging the position DGPS records of the antenna (x,y,z,t) with the records of depth measurements from the echo sounder (d,t), from the common parameter GPS time (t). As the distance between the echo sounder, transducer and the GPS antenna is fixed (both elements are fixed on the mast), a position file (x,y,h) of the sea bed is obtained refered to the ellipsoid, independent of the swell, tide and other large waves.
- Obtaining a 3D Digital Model of the survey land. This task is done with a commercial interpolation tool that permits the visualization, operation and exportation of a 3D Model of the sea bed.
4. SIBAP System Accuracy. Once the system was implemented, a series of tests were made, both in a static and in a dynamic way for evaluating the system accuracy.
Figure 1. SIBAP Independence from swell, tide and large waves

Figure 2. SIBAP system Implementation
4.1. GPS accuracy test in a satatic way. Both stations were situated in a static way for making these test, one of them on a geodesic vertex. Both records were processed on Dif-Gps to carry out differential corrections. The results are shown in figure 3. 4.1.1. GPS Latitude and Longitude Records. In both records we can appreciate how, from the starting of the GPS reception equipment, there is a period of coupling in the system for approximately the first 200 seconds. During this time, the positions of all visible satellites end joining up. At the end of this joining we can appreciate how the error is better than 5*10-8 grades WGS84. 4.1.2. GPS altitude Record. We can appreciate in GPS altitude record that it becomes stabilized during the first 200 seconds of reception, having the signal stabilized from that point. In the stable zone the error is better than 1 cm referenced over the WGS84 ellipsoide. 4.1.3. Conclusion. When we transfer those data errors over the WGS84 ellipsoide to the test area we can conclude that the errors are better than:
- Latitude: 0.5 cm - Longitude: 0.5 cm - Altitude: 1 cm
4.2. Test in a dinamic way. After this static test were done a series of dinamic tests, placing the equipment set on the ship and on a reference station. 4.2.1 Depths echosounder records. In the depth echosounder record (Figure 4) we can observe two types of errors. On the one hand there are places where the measurement is less than the real one. This is because of the existance of floating elements, fishes, plastic bags... On the other hand there are errors because of the measurement become out of the echosounder measurement range. In the case of the figure the echosounder was formed for measuring more than 1.5 meters depth. These errors are treated during the post-process. Extending this record we can observe how the accuracy of the measurements is the one given by the 10 cm. echosounder resolution. 4.2.2. GPS antenna altitude record. In the case of the GPS antenna altitude, we observe in the record a fluctuation caused by the movement of the water surface and by the dinamic effects caused by the movement of the ship (Figure 5). 4.2.3. Signal Integration. During the post-process, depth records measured by the echosounder are correlated with the antenna altitude records by the common parameter GPS time, coming up with the results shown in Fig. 6.

Figure 3.
Figure 4. Figure 5.
Figure 6.

Benalmádena yach harbour
Guadalhorce river
La Carihuela beach
Figure 7
In this graphic we can observe how vertical fluctuations are similar than measured by the GPS antenna, so this fluctuation, caused by the movement of the water surface and by the dinamic effects, are reflected in both records. By the equation shown before we achieve sea bed altitude over the reference ellipsoid. On the other hand, the latitude and longitude records give the position on the ground of each altitude record. 4.2.4. Conclusion. In this way we have measured data each 0.3 seconds up to 30 knots shipping speed. There are investigation programs in progress which emerged from our investigation to record swell and large waves with the same philosophy. 5. Description of area to be modelized. During the investigation, systematic surveys were carried out on the same place with the purpose of eveluating the bathymetric system developed for modelling beaches. In this way, the beach selected was La Carihuela, in Málaga, Spain. 5.1. Situation. The Carihuela beach is placed in the inlet of Málaga, and it´s open to the southeast swells coming from the Mediterranean Sea (Figure 8). Geomorphologically, the beach is placed between the Guadalhorce river´s mouth to the East and Benalmadena yachting harbour to the West (Figure 7).
Málaga
La Carihuela beach
Figure 8. 5.2. Marine climate. For swell characterization was anlyzed, scalar buoy data since 1984, directional buoy data since 1997, and visual data since 1950. The record of the greatest storm recorded by a scalar buoy are shown in fogure 9. Wave height vs period, measured by this buoy, are shown in figure 10. The compass rose obtained from the directional data is shown in Fig. 11.
Figure 9. Sea climate given from the scalar data.

Figure 10. Wave height vs period.
Figure 11. Wave rose from the directional buoy.
Figure 12. Tide levels.
5.3. Deposit Characterization. During the investigation series of granulometric samples were carried out to calibrate the model. The result of this sampling suggests that there exist sands with an average diameter (D50) 2.50 mm.
5.4. Tides. The tide levels incorporated to the model were obtained in the yachting harbour of Benalmadena with differential GPS equipment. Levels considered are shown in Figure 12. 6. The way the investigation is set out. Once the system was developed and a beach is selected, the investigation was started as a way to prove the SIBAP suitable for modelling the evolution of beaches. In this way we proceed, chronologically, in the following order: - Making bathymetric campaigns and obtaining
digital model for the different periods. - Quantify the evolution of the beaches from the
measured data. - Choosing a last generation numeric model of
beach dynamics. - Model implementation and load of contour
conditions (swell, tides, granulometry) in this numeric model.
- Obtaining the evolution of the beach by the numeric model.
- Comparing results between evolution obtained by direct comparison of measurement and by the results of the numeric model.
- Planning future investigation lines.
The bathymetric campaigns were planned, as for its temporal distribution, in two scales. On the one hand, we planned to study a long-term evolution, carring out for this purpose two bathymetric campaigns in the same season of two diferent years as spaced as possible. December 1995 and December 1999 were choosen. On the other hand, for studing the short-term beach evolution we planned to carry out several bathymetries during a year, choosing for this purpose February 1999 and August 1999, and again December 1999. With this plan was possible to carry out the following evolution analisis: - from December 1995 to December 1999. - from February 1999 to August 1999. - from August 1999 to December 1999. 7. Bathymetric campaigns results. The Digital Models resulting from the four bathymetric campaigns carried out are shown in Figure 13, and the evolution analisis between them are shown in Figure 14.

December 1995 February 1999
August 1999 December 1999
Figure 13. Bathymetric results.

VOLUMES:
Burial: 509,338 m3
Erosion: -18,144 m3
Net: 491,194 m3 (burial)
AREAS:
Plane positive area : 827,975 m2
Plane negative area: 118,275 m2
Curve positive area: 828,000 m2
Curve negative area: 118,278 m2
Evolution December 1995 – December 1999
VOLUMES:
Burial : 160,964 m3
Erosion: -541,066 m3
Net: -380,102 m3 (erosion)
AREAS:
Plane positive area: 511,549 m2
Plane negative area: 1,673,450 m2
Curve positive area: 511,592 m2
Curve negative area: 1,673,500 m2
Evolution February 1999 – August 1999
VOLUMES:
Burial: 355,247 m3
Erosion: -137,789 m3
Net: 217,458 m3 m3 (burial)
AREAS:
Plane positive area: 1,248,580 m2
Plane negative area: 467,669 m2
Curve positive area: 1,248,610 m2
Curve negative area: 467,695 m2
Evolution August 1999 – December 1999
Figure 14.

Initial profile with the final profile.
Net vertical burials and erosions.
Figure 18. Short-term evolution. 19th Profile.
Figure 19. Longshore transportation curve. 19 th Profile.

8. Model implementation. The model selected for this investigation was MIKE-21/LITTPACK from the Danish Hydraulic Institute.
In a similar way to the analysis of the evolution of the beach made from the Digitals Models obtained, we did with the numerical model two studies, a long-term study and a short-term study.
Figure 15.
The short-term study consists of subduing 26 selected profiles from December´s 1995 bathymetry to a storm of 27 hours corresponding to the greatest storm recorded during the investigation period. In Figure 15 we can appreciate the ground plan of the profiles, and the implemented storm in the model in Figure 16.
Figure 16.
On the other hand, the long-term study consisted of the annual longshore transport rate evaluation in the 26 selected profiles for the climate of the average year. The implemented swell in the model corresponds to the frecuency tables represented in Figure 17, extracted from the records of the directional buoy.
365,500366,000
366,500367,000
365,500366,000
366,500367,000
44 ,, 00 55 11 ,, 5000 00 4,052,000 4,052,500 4, 053, 000 4,053,500
44 ,, 00 55 11 ,, 5000 00 4, 052, 000 4,052,500 4,053, 000 4,053,500
1
11
2
12
3
13
4
14
5
15
6
16
7
17
8
18
9
19
10
2021
2223
2425
26
Figure 17.
9. Result obtained by the numeric model. For each profile, the result obtained in the short-term modelization consit on:
- Bathymetric initial and final profile. - Net vertical burials and erosions. - Variation of each wave height when incising
on the profile. These results for 19th profile are shown in Figure 18. As for the long-term modelization, for the 19th profile, the longshore transport curve is represented in Figure 19.
10. Preliminary conclusions. The main conclusions extracted from this investigation are the following: a) Regarding to the high precission bathymetric
system developed:
- The developed SIBAP is an effective mechanism for carring out high precision bathymetry, making records independent of swell and tide.
- The SIBAP is a suitable tool to act as input of numerical models, and to calibrate them because the result of SIBAP is a digital model of the sea bottom.
- The SIBAP is an useful tool for controlling the dredging and pouring of marine works.
- The system can not only be used in beaches, but also in any submerged surface.
b) With regard to the bathymetry and the study
of the evolution at the Carihuela beach: - Most burials are produced at the west side
of the beach and most erosions at the east,
confirming that the yachting harbour of Benalmadena acts as a support to this beach.
- The erosion grows when we approach to the coast line.
- From the short-term analysis of the digital models we can say that exist strong seasonal tilts.
- From the long-term analysis of the digitals models we can say that, during four years, it has produced a generalizated burial in along the hole beach. This justifies frequent artificial sand contributions in this beach to preserve the wide of the dry beach.
- There is a coherence between the direct comparation of the digitals models and the outputs of the model.
- The closing depth is at –7 with medium swell and at –10 with extreme swell.
- The net longshore transport is produced to the west.
- The net longshore transport is higher in the western profiles than in the eastern ones, thing that confirms the support effect of the yachting harbour of Benalmadena.
11. Improvement of the SIBAP system. The improvements introduced during the development of the investigation are as follows: a) Using double frecuency GPSs.
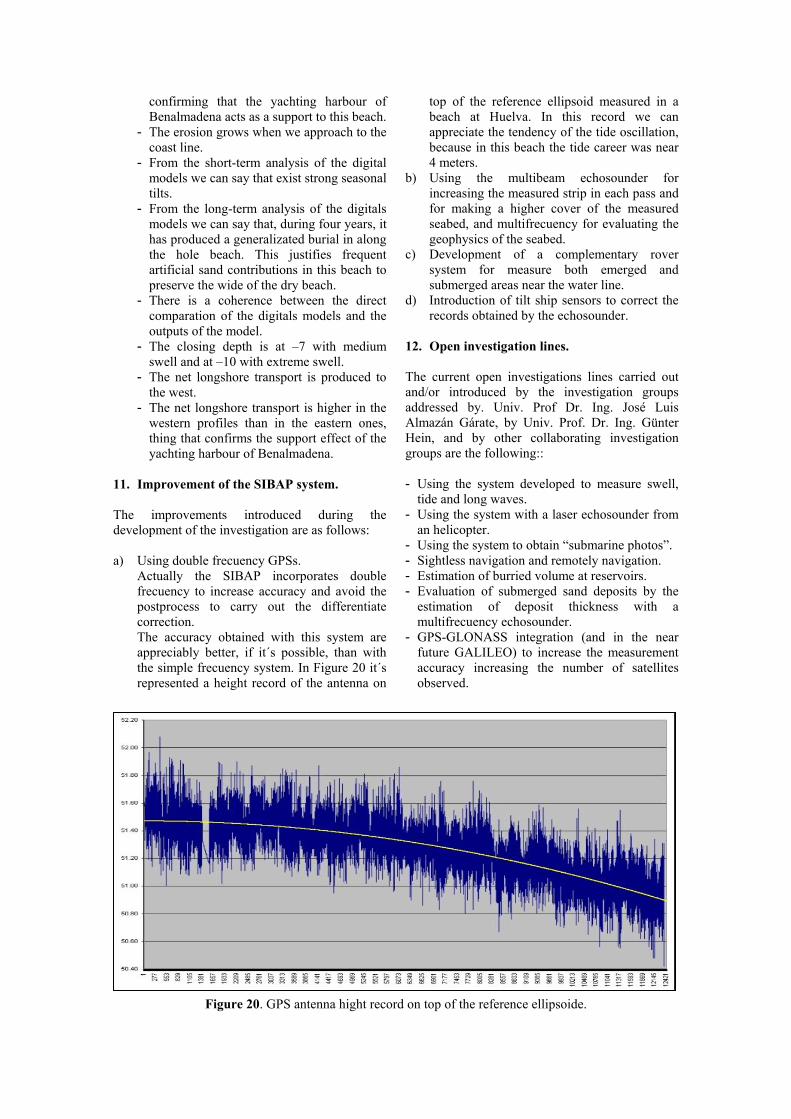
Actually the SIBAP incorporates double frecuency to increase accuracy and avoid the postprocess to carry out the differentiate correction. The accuracy obtained with this system are appreciably better, if it´s possible, than with the simple frecuency system. In Figure 20 it´s represented a height record of the antenna on
top of the reference ellipsoid measured in a beach at Huelva. In this record we can appreciate the tendency of the tide oscillation, because in this beach the tide career was near 4 meters.
b) Using the multibeam echosounder for increasing the measured strip in each pass and for making a higher cover of the measured seabed, and multifrecuency for evaluating the geophysics of the seabed.
c) Development of a complementary rover system for measure both emerged and submerged areas near the water line.
d) Introduction of tilt ship sensors to correct the records obtained by the echosounder.
12. Open investigation lines. The current open investigations lines carried out and/or introduced by the investigation groups addressed by. Univ. Prof Dr. Ing. José Luis Almazán Gárate, by Univ. Prof. Dr. Ing. Günter Hein, and by other collaborating investigation groups are the following::
- Using the system developed to measure swell,
tide and long waves. - Using the system with a laser echosounder from
an helicopter. - Using the system to obtain “submarine photos”. - Sightless navigation and remotely navigation. - Estimation of burried volume at reservoirs. - Evaluation of submerged sand deposits by the
estimation of deposit thickness with a multifrecuency echosounder.
- GPS-GLONASS integration (and in the near future GALILEO) to increase the measurement accuracy increasing the number of satellites observed.
Figure 20. GPS antenna hight record on top of the reference ellipsoide.

13. References. 1. Bagnold, R. A., Experiments on a gravity-
free dispersion of large solid spheres in a Newtonian fluid under shear. Proc. Roy. Soc. London (A)225:49-63, 1954.
2. Bomford,G. : “Geodesy”, Tirad Edition. Oxford University Press 1971.
3. Bossler, J.D, C.C. Goad, P.L. Bender.: “Using the Global Positioning System”. Bulletin Geodesique, 54, 1980.
4. Caturla, J.L.: “Sistema de posicionamiento global (GPS)”.MOPU 1988.
5. Caturla, J.L.:” Determinación de puntos de Laplace”.Madrid. Inst. Geográfico Nacional, 1978.
6. Dalda Mouron,A., Rossignoli Just, J.L., Boyero Delgado, F., ”Proyección Universal Transversa Mercator”. Volúmenes I y II. Servicio Geográfico del Ejercito. Madrid. 1976.
7. Dalda Mouron,A., Rossignoli Just, J.L.,”La Proyección Universal Transversa Mercator (UTM) y su correspondiente cuadrícula (CUIM) en la Cartografía Militar”. Servicio Geográfico del Ejercito. Madrid. 1975.
8. Dragomir, V. Y otros: “Theory of the earth’s shape”. Editions Elvesier, 1982.
9. Engelund, F. y FredsØe, J., A sediment transport model for straight alluvial channels. Nordic Hydrology 7:293-306, 1976.
10. Ferrer Torio, R., A. Núñez-García, B. Piña, J.L. Valbuena, I. Martinez: “Sistema de Posicionamiento Global (GPS)”. Universidad de Cantabria. Curso de Verano, Laredo 1991.
11. FredsØe, J., Mean current velocity distribution in combined waves and current. Progress Report No. 53, Inst. of Hydrodynamics and Hydraulic Engineering, ISVA, Techn. Univ. Denmark, pp. 21-26, 1981.
12. FredsØe, J., Turbulent boundary layers in wave-current motion. J. Hydraulic Eng., ASCE, 110(HY8):1103-1120, 1984.
13. Guy, H. P., Simons, D.B. y Richardson, E. V., Summary of alluvial channel data for flume experiments, 1956-1961. U. S. Geological Survey Profesional Paper, 462-I, 1966.
14. Hein, G, B. Eissfeller: “The basic equations of carrier phase measurements to the Global Positioning System including general orbit modeling, Schrifttenreihe University Studiengang Munchen, num. 19, 1986.
15. Hein, G.W.(1986): “Integrated geodesy: State-of-the art 1986 reference text” en: Sünkel, H.(ed.), Lectures Series in Earth Sciences, Vol. 7, Mathematical and Numerical Techniques in Physical Geodesy, New York.
16. Hein, G.W., Leick, A. and Lambert, S. (1988). “Integrated processing of GPS and gravity
data”. Journal of Surveying Engineering, 115(1): 15-33.
17. Iribarren Cavanilles, R., Corrientes y transportes de arenas originados por el oleaje, Revista de Obras Públicas. Madrid, 1947
18. Komar, P. D. e Inman, D. L., Longshore Sand Transport on Beaches, Journal of Geophysical Research, Vol. 75, No. 30, pp. 5914-5927, Oct. 20, 1970.
19. Lambeck, K.: “The relation some Geodetic Datums and Satellite Coordinate Systems. Bulletin Geodesique, 1975.
20. Leik, A.:”GPS satellite surveying”. J. Wiley and Sons. New York. 1990.
21. Longuet-Higgins, M. S. y Stewart, R. W., Radiation stress in water waves, a physical discussion with applications, Deep Sea Research, 11, pp.529-562, 1964.
22. Lundgren, H., Turbulent currents in the presence of waves. Proc. 13th Int. Conf. Coast. Eng., Vancouver, Canadá, 623-634, 1972.
23. Luque, R. F., Erosion and transport of bed-load sediment. Delft University of Technology, Diss., 1974.
24. Meland, N. y Normann, J. O., Transport velocities of single particles in bed-load motion. Geografiska Annaler, Vol. 48, Serie A.(4):165-132, 1966.
25. Prandtl, L., Über die ausgebildete Turbulenz. Verhandlungen des II Internationalen Kongresses für Technische Mechanik, Zürich 1926, Füssli 1927, pp. 62-75.
26. Prandtl, L., Über Flussigkeitsbewegung bei sehr kleiner Reibung, Verh. III Int. Math.-Kongr.,Heidelb, 1904.
27. Remendi, B.W.: “Using the Global Positioning Systema (GPS) phase observable for relative geodesy: Modeling, processing and results”. Ph.D.Dissertation, the university of Texas at Austin. Texas, 1984.
28. Torge Wolfgang: “Geodesia”.Editorial Diana, 1983.
29. Valbuena Durán, J.L., A. Núñez-García : “Sistema GPS. Topografía y cartografía, vol. III, Parte I, núm. 43, Parte II, núm. 44.
30. Vanicek, P., E.J. Krakiwsky: “The Geodesy: the concepts”. North-Holland, Amsterdam 1986.
31. Wells, D. y otros: “Guide to GPS positioning”. Canadian GPS Associates. Fredericton, N.B. 1986.
32. Wilson, K. C., Bed-load transport at high shear stress. Proc. ASCE, J. Hydr. Div., 92(HY6):49-59, 1966.
33. Zyserman, J. y FredØe, J., Data análisis of bed concentration of suspended sediment. Accepted for publication in Journal of Hydraulic Engineering, ASCE, 1994.