Different strategies for screening and prevention of type ... · Different strategies for screening...
29
Different strategies for screening and prevention of type 2 diabetes in adults: cost effectiveness analysis Author(s): Gillies CL (Gillies, Clare L.), Lambert PC (Lambert, Paul C.), Abrams KR (Abrams, Keith R.), Sutton AJ (Sutton, Alex J.), Cooper NJ (Cooper, Nicola J.), Hsu RT (Hsu, Ron T.), Davies MJ (Davies, Melanie J.), Khunti K (Khunti, Kamlesh) Source: BRITISH MEDICAL JOURNAL Volume: 336 Issue: 7654 Pages: 1180-+ Published: MAY 24 2008 Different strategies for screening and prevention of type 2 diabetes in adults: cost effectiveness analysis Clare L Gillies[A1] Lecturer in medical statistics Paul C Lambert[A1] senior lecturer in medical statistics Keith R Abrams[A1] professor of medical statistics Alex J Sutton[A1] reader in medical statistics Nicola J Cooper[A1] MRC training fellow in health services research Ron T Hsu[A1] Senior clinical teaching fellow in epidemiology and public health Melanie J Davies[A2] professor of diabetes medicine Kamlesh Khunti[A3] professor of primary care diabetes and vascular medicine A1 Centre for Biostatistics and Genetic Epidemiology, Department of Health Sciences, University of Leicester, Leicester LE1 7RH A2 Department of Cardiovascular Sciences, University of Leicester A3 Division of General Practice and Primary Health Care, Department of Health Sciences, University of Leicester Correspondence to: C L Gillies [email protected] Accepted: 25 March 2008
Transcript of Different strategies for screening and prevention of type ... · Different strategies for screening...

Different strategies for screening and prevention of type 2 diabetes in adults: cost effectiveness analysis Author(s): Gillies CL (Gillies, Clare L.), Lambert PC (Lambert, Paul C.), Abrams KR (Abrams, Keith R.), Sutton AJ (Sutton, Alex J.), Cooper NJ (Cooper, Nicola J.), Hsu RT (Hsu, Ron T.), Davies MJ (Davies, Melanie J.), Khunti K (Khunti, Kamlesh) Source: BRITISH MEDICAL JOURNAL Volume: 336 Issue: 7654 Pages: 1180-+ Published: MAY 24 2008 Different strategies for screening and prevention of type 2 diabetes in adults: cost effectiveness analysis Clare L Gillies[A1] Lecturer in medical statistics Paul C Lambert[A1] senior lecturer in medical statistics Keith R Abrams[A1] professor of medical statistics Alex J Sutton[A1] reader in medical statistics Nicola J Cooper[A1] MRC training fellow in health services research Ron T Hsu[A1] Senior clinical teaching fellow in epidemiology and public health Melanie J Davies[A2] professor of diabetes medicine Kamlesh Khunti[A3] professor of primary care diabetes and vascular medicine A1 Centre for Biostatistics and Genetic Epidemiology, Department of Health Sciences,
University of Leicester, Leicester LE1 7RH A2 Department of Cardiovascular Sciences, University of Leicester A3 Division of General Practice and Primary Health Care, Department of Health Sciences,
University of Leicester Correspondence to: C L Gillies [email protected] Accepted: 25 March 2008

Abstract Objective To compare four potential screening strategies, and subsequent interventions, for the prevention and treatment of type 2 diabetes: (a) screening for type 2 diabetes to enable early detection and treatment, (b) screening for type 2 diabetes and impaired glucose tolerance, intervening with lifestyle interventions in those with a diagnosis of impaired glucose tolerance to delay or prevent diabetes, (c) as for (b) but with pharmacological interventions, and (d) no screening. Design Cost effectiveness analysis based on development and evaluation of probabilistic, comprehensive economic decision analytic model, from screening to death. Setting A hypothetical population, aged 45 at time of screening, with above average risk of diabetes. Data sources Published clinical trials and epidemiological studies retrieved from electronic bibliographic databases; supplementary data obtained from the Department of Health statistics for England and Wales, the screening those at risk (STAR) study, and the Leicester division of the ADDITION study. Methods A hybrid decision tree/Markov model was developed to simulate the long term effects of each screening strategy, in terms of both clinical and cost effectiveness outcomes. The base case model assumed a 50 year time horizon with discounting of both costs and benefits at 3.5%. Sensitivity analyses were carried out to investigate assumptions of the model and to identify which model inputs had most impact on the results. Results Estimated costs for each quality adjusted life year (QALY) gained (discounted at 3.5% a year for both costs and benefits) were £14<thin>150 for screening for type 2 diabetes, £6242 for screening for diabetes and impaired glucose tolerance followed by lifestyle interventions, and £7023 for screening for diabetes and impaired glucose tolerance followed by pharmacological interventions, all compared with no screening. At a willingness-to-pay threshold of £20<thin>000 the probability of the intervention being cost effective was 49%, 93%, and 85% for each of the active screening strategies respectively. Conclusions Screening for type 2 diabetes and impaired glucose tolerance, with appropriate intervention for those with impaired glucose tolerance, in an above average risk population aged 45, seems to be cost effective. The cost effectiveness of a policy of screening for diabetes alone, which offered no intervention to those with impaired glucose tolerance, is still uncertain. .

Introduction
In 2000, an estimated 171 million people worldwide had diabetes and numbers are projected
to double by 2030.[1] Life expectancy in people with diabetes might be shortened by as much
as 15 years,[2]] Currently there is no systematic or structured screening policy for type 2
diabetes in the United Kingdom, though some general guidance has recently been issued by
the National Screening Committee.[3] One approach to screening would be to screen only for
type 2 diabetes, which will allow for early diagnosis and treatment. This might be important
as early detection and treatment could prevent future associated microvascular and
macrovascular complications. An estimated 50% of people with diabetes are currently
undiagnosed,[4] and at presentation around 20-30% have already developed
complications.[5] An alternative screening approach would be to lower the threshold of the
screening test and to screen for impaired glucose tolerance and type 2 diabetes together. As
well as allowing for earlier diagnosis of type 2 diabetes, interventions can be administered to
those identified with impaired glucose tolerance to attempt to delay the onset of type 2
diabetes. A recent systematic review and meta-analysis of intervention trials for prevention of
type 2 diabetes[6] found both lifestyle and pharmacological interventions significantly
reduced the risk of type 2 diabetes in people with impaired glucose tolerance.
As no definitive trials have examined the effectiveness of screening for type 2 diabetes or
impaired glucose tolerance,[7] [8] assessment of such policies has so far been conducted
through simulation studies. Several decision models have been compiled that have assessed
either the clinical and cost effectiveness of interventions to prevent type 2 diabetes[9-16] or
strategies for screening and early detection of diabetes.[7] [17-20] Previous models of
screening for type 2 diabetes alone have generally assessed the impact of early treatment on
cardiovascular events, though some additionally included microvascular events such as
retinopathy. Overall most of the models produced favourable results for screening, but cost
effectiveness varied with age group screened and the population targeted for screening. Only
two studies reported costs for a UK setting,[7] [19] one of which had a limited time horizon
of five years.[19] Both of these studies concluded there was still uncertainty concerning the
cost effectiveness of screening for diabetes.
Of the eight models assessing cost effectiveness of interventions for prevention of
diabetes, only three included costs of identifying individuals with impaired glucose
tolerance.[10] [12] [16] The time horizon over which the models were run ranged from just
three years after the intervention up to the expected lifetime of the population. Models used

data from various sources from published trials, epidemiological studies, and national
statistics. In general data were limited to a few sources. All models compared a strategy of
interventions against no interventions, rather than screening for impaired glucose tolerance
followed by interventions, compared with no screening. All but one model simulated
populations where all individuals had impaired glucose tolerance at the start of the model and
the end state was development of diabetes, or death, hence only a limited section of the
disease pathway was modelled. Also the models did not take into account that screening for
impaired glucose tolerance will at the same time allow individuals with undiagnosed diabetes
to be identified, thus allowing for early treatment and possibly reducing rates of
complications. Hence, while these studies offer an assessment of the cost effectiveness of
interventions for prevention of diabetes, none assessed the impact of screening followed by
interventions on the whole disease pathway. In 2007 Waugh et al assessed screening or
intervention strategies for type 2 diabetes in a thorough review of previous decision
models.[7]
We compared three active screening strategies: (a) a one-off screening for type 2 diabetes;
(b) screening for impaired glucose tolerance and type 2 diabetes and intervening with
lifestyle interventions in those with impaired glucose tolerance; and (c) as for (b) but with
pharmacological interventions. We compared these three active screening strategies against a
fourth strategy of no screening (current practice). The full pathway from screening, to
interventions and treatment for type 2 diabetes, all the way through to death, was modelled.
This model directly compares the two alternative approaches of screening for type 2 diabetes
alone or screening for impaired glucose tolerance and type 2 diabetes together. When
modelling the effectiveness of interventions, we used all data from relevant randomised
controlled trials [6] and included uncertainty around model inputs when appropriate. By
carrying out several sensitivity analyses we investigated the essential elements that affect the
cost and clinical effectiveness of different screening policies.

Methods
The hybrid model consists of a decision tree and a Markov model (fig 1)[f1]. The decision
tree comprises three main arms, representing no screening, screening for undiagnosed type 2
diabetes, and screening for impaired glucose tolerance and undiagnosed diabetes, with either
lifestyle or pharmacological interventions applied in those with impaired glucose tolerance.
Individuals who have already been identified as having type 2 diabetes are excluded from the
screening process. The decision tree uses prevalence of impaired glucose tolerance and
undiagnosed type 2 diabetes and estimates sensitivity and specificity of a screening test to
determine how many individuals from the population start in each state of the Markov model.
The Markov model consists of seven states: normal glucose tolerance, undiagnosed impaired
glucose tolerance, diagnosed impaired glucose tolerance, death, and three states for people
with diabetes (undiagnosed, diagnosed clinically, or diagnosed through screening, either from
a screening test or because they are diagnosed with impaired glucose tolerance initially and
hence enter a surveillance programme). We ran four Markov models simultaneously, one for
each of the screening strategies. Whether type 2 diabetes and impaired glucose tolerance are
diagnosed or undiagnosed determines whether the patients receive relevant treatments or
interventions, and they are modelled accordingly in terms of transition rates to other states.
For example, individuals identified with impaired glucose tolerance receive an intervention
and the estimated intervention effect slows their progression to development of diabetes.
Each model cycle represents one year and the model is run for a time horizon of 50 years.
Table 1 summarised all the model inputs[t1]. When more than one estimate was available for
a parameter, we pooled estimates using a Bayesian random effects meta-analysis within the
comprehensive decision model. Model results include both clinical and cost effectiveness
outcomes, with cost per quality adjusted life year (QALY) being the primary outcome. We
investigated both an undiscounted model and a model with costs and benefits discounted at
3.5% annually, as recommended by the National Institute for Health and Clinical
Excellence.[21]
Figure - gilc531475.f1
Fig 1 Decision model comparing no screening, screening for type 2 diabetes, and screening
for impaired glucose tolerance and diabetes, and intervening to delay or prevent type 2
diabetes with either lifestyle or pharmacological interventions
Table - gilc531475.t1

The hybrid model was implemented within WinBUGS using a Bayesian comprehensive
decision modelling approach.[22] We adopted this approach because of its flexibility in terms
of statistical modelling and it enabled us to include and propagate all uncertainty in
parameters throughout the model.[22] We assumed non-informative prior distributions for all
model parameters. Model parameters were estimated by using Markov chain Monte Carlo
simulation methods.[23] Results are based on a sample of 20<thin>000 simulations,
following a “burn in” of 10<thin>000, and we assessed convergence of the Markov chain by
visually inspecting trace plots and by running multiple chains with different initial
values.[23] We have reported the results from the decision model with 95% credibility
intervals, which are analogous to confidence intervals.
Data for the decision tree
The base case scenario for the model was a one-off screening for a population aged 45, in
whom type 2 diabetes had not previously been diagnosed. Data for the decision tree—that is,
test sensitivity and specificity and prevalence of impaired glucose tolerance and type 2
diabetes—were taken from the screening those at risk (STAR) study.[24] For this study,
individuals aged 40-75 (white) or 25-75 (non-white) from 15 general practices in
Leicestershire who had at least one recognised risk factor for type 2 diabetes were invited for
screening. Risk factors included a known history of coronary heart disease, hypertension,
dyslipidaemia, cerebrovascular disease, a first degree relative with type 2 diabetes, and a
body mass index (BMI) >25. Therefore the screening data included in the primary model
were from a population considered to be “at risk” of type 2 diabetes. For the base case model
we used data only from white patients, though we used the data on South Asians for
sensitivity analyses to assess results for different ethnic groups.
Transition rates and HbA1c concentrations
To estimate annual transition rates we used several sources, including epidemiological
studies and clinical trials.[25-36] To estimate the annual transition rate from undiagnosed to
clinically diagnosed diabetes, we used the estimated average time people have diabetes
before being diagnosed.[37] We estimated the effects of interventions on the transition from
impaired glucose tolerance to diabetes using studies identified in a recent meta-analysis of
lifestyle and pharmacological intervention trials.[6] Death rates were taken from Department
of Health statistics for England and Wales for 2000 and were increased for people with
diabetes compared with those without.[38] For the three diabetic states (undiagnosed,
clinically diagnosed, and screen detected) death rates varied depending on predicted HbA1c

(haemoglobin A1c) concentrations.[39] HbA1c was predicted to be highest in people with
undiagnosed diabetes, as they are yet to receive any interventions, and was estimated by
using HbA1c concentrations at entry to the UK prospective diabetes study[40] before
treatment began. We expected HbA1c concentrations to be the best controlled in people with
diabetes detected by screening because of early detection, and estimated levels using the 10
year average from the intensively treated group in the UK prospective diabetes study.[41] For
people with clinically diagnosed diabetes, we used the HbA1c concentrations of the group
receiving conventional treatment in the UK prospective diabetes study.[41]
Quality of life variables
For the states of normal glucose tolerance, undiagnosed impaired glucose tolerance, and
diagnosed impaired glucose tolerance, we assumed the utility value to be that of full health
and set at 1. We calculated utilities for those with undiagnosed and screen detected diabetes
from EQ-5D data, using data on individual patients made available by the Leicester arm of
the ADDITION study.[42] The data were of a screen detected sample population with type 2
diabetes at baseline. For people with clinically diagnosed diabetes, utilities were taken from
those reported by the UK prospective diabetes study as this comprised a clinically detected
sample.[43] The utility for undiagnosed diabetes was kept constant for the whole duration
spent in this state as we assumed that if complications developed, which reduced the quality
of life, then a diagnosis would be made. For the states of clinically and screen detected
diabetes we needed to account for the fact that duration of diabetes would lead to an
increased number of complications and hence a reduction in the utility value. This was done
by using reported complication rates, modelled for duration of diabetes and adjusted for
estimated HbA1c concentrations in each group and their estimated effect on utility values.[43]
[44] Hence, utilities decreased for each year of duration of diabetes, to reflect increasing
incidence of complications. Because of a higher predicted HbA1c concentration, the utility
value was lower at diagnosis and decreased marginally more rapidly in individuals clinically
diagnosed compared with those who were screen detected.
Economic variables
We estimated costs from various sources. Screening costs included the costs of an initial
screening test of fasting plasma glucose and a confirmatory oral glucose tolerance test in
those who tested positive. We estimated the cost of nurse time of 5 minutes for the screening
test and 25 minutes for the oral glucose tolerance test.[45] People with undiagnosed diabetes
incur costs before diagnosis because of increased visits to the general practitioner and
prescriptions,[46] with a reported average of three additional visits the year before diagnosis
and an average of 1.4 additional visits in the two to five years before diagnosis. An estimation
of these costs were included.[45] For lifestyle interventions we included dietician costs and
costs of twice weekly group exercise sessions, as detailed in a previous study.[9] Costs of
pharmacological interventions were based on 250 mg of metformin three times a day, the
standard dose used by most intervention studies. For people with diagnosed diabetes, we took
average annual costs of anti-diabetic treatment, implementation of treatment, and costs of
complications from the UK prospective diabetes study.[47] For the people with diabetes
detected at screening, in whom we would expect costs of complications to be lower, we used
costs from the intensively treated arm of the UK prospective diabetes study. For those with
clinically diagnosed diabetes, which represents how individuals are diagnosed currently, we
used the reported costs of the conventionally treated group. All costs are reported in 2006 UK
£, standardised using inflation indices.[45]
Sensitivity analyses and model extensions
We carried out sensitivity analyses using a range of values of prevalence of disease, as
well as compliance levels to both screening and interventions. Changing prevalence allows us
to assess the effectiveness of the screening strategies for different “at risk” populations. The
effects of compliance to both screening and interventions were also important as we assumed
100% compliance to both in the base case model, which could never be achieved in practice.
To evaluate the robustness of the model we also carried out sensitivity analyses on model
inputs, particularly those that were estimated from only one or two sources or were thought to
be important drivers in the model. These were sensitivities of screening tests, costs of
interventions, costs of diabetes, effectiveness of interventions, previous distributions on the
standard deviations between studies of the four meta-analyses run within the model, and the
time horizon the model was run for.
For the base case scenario we considered only a one-off screening at age 45. The model
was extended further to assess the impact of having one or two additional screenings, at age
50 and 60. This was done by applying the test sensitivities from the STAR study to the
numbers in the states of undiagnosed impaired glucose tolerance and type 2 diabetes at the
corresponding model cycle and moving the individuals to the relevant diagnosed state.
Though the base case model used prevalences and test sensitivities and specificities of a
white population, the effect of screening a South Asian or a mixed race population is also
relevant in the UK. South Asians are thought to have a greater risk of type 2 diabetes, with a

greater prevalence of impaired glucose tolerance and a higher transition rate to type 2
diabetes. We extended this model with data from the STAR study and estimated the transition
rate from impaired glucose tolerance to type 2 diabetes from the Indian diabetes prevention
programme.[48]
Results
Table 2 shows clinical and cost effectiveness outcomes for an undiscounted model and a
model discounted for both costs and benefits at 3.5% a year[t2]. Discounted costs for each
QALY gained, compared with no screening, were £14<thin>150 for type 2 diabetes
screening, £6242 for screening for diabetes and impaired glucose tolerance with lifestyle
interventions, and £7023 for screening for both diabetes and impaired glucose tolerance with
pharmacological interventions. Costs were lower in the undiscounted model: £8681, £2863,
and £3429 for every QALY gained, respectively. At a willingness to pay threshold of
£20<thin>000 per QALY the probability of each strategy being cost effective was 49% for
screening for type 2 diabetes only, 93% for screening for both diabetes and impaired glucose
tolerance and lifestyle interventions, and 85% for screening for both diabetes and impaired
glucose tolerance and pharmacological intervention. Cost effectiveness acceptability curves,
showing probability of cost effectiveness over a range of willingness to pay thresholds, are
presented in figure 2.
Table - gilc531475.t2
gilc531475.f2 Fig 2 Cost effectiveness acceptability curves for each of the three active screening strategies
compared to no screening (discounted estimates).
Discounted QALYs gained compared with no screening were 0.03 (−0.02 to 0.09) for
diabetes screening, 0.09 (0.03 to 0.17) for screening and lifestyle interventions, and 0.07
(0.01 to 0.15) for screening with pharmacological interventions. Both the intervention
strategies showed potential benefits in terms of average years spent without diabetes and
cases of diabetes prevented. Although clinical effects seem small, it must be remembered
they are average gains across a population, in which only 17% had either impaired glucose
tolerance or undiagnosed type 2 diabetes at the time of screening.
Tables 3[t3] and 4[t4] show the results of the more important sensitivity analyses
(undiscounted). Increasing the prevalence of impaired glucose tolerance and type 2 diabetes
decreased the QALYs and increased total costs of each screening strategy. The comparisons
of the three active screening/intervention strategies compared with no screening remained
fairly constant in terms of costs per QALY and probability of cost effectiveness (table 3).[t3]
When we lowered compliance with screening, the impact on results was also minimal (table
4).[t4] Reducing compliance with interventions, however, had a greater impact in that the
total costs and cost per QALY gained increased for both the screening/intervention strategies.
The probability that these strategies were cost effective compared with no screening still
remained high, with an estimated probability of 88% for screening with lifestyle interventions
and 84% for screening with pharmacological interventions at the willingness to pay threshold
of £20<thin>000.
Table - gilc531475.t3
Table - gilc531475.t4
Other sensitivity analyses did not change the results enough to alter the conclusions of the
model. Increasing the costs of both lifestyle and pharmacological interventions by a factor of
10 reduced the probabilities of cost effectiveness of their respective screening strategies to
73% and 93%, at the willingness to pay threshold of £20<thin>000. Increasing the costs of
diabetes by a factor of two reduced the probability of cost effectiveness to 49% for screening
for type 2 diabetes only, 93% for screening with lifestyle interventions, and 85% for
screening with pharmacological interventions at the same threshold. As we increased the time
horizon the model was run for, the probability of the three active screening strategies being
cost effective compared with no screening increased. This is because the benefits of screening
or interventions are not all immediate and most occur in later years of the model, when type 2
diabetes is either delayed or complications are reduced through early diagnosis and treatment.
The intervention strategies became cost effective when we considered a time horizon of at
least 30 years (probability of being cost effective of 0.97 for lifestyle and 0.91 for
pharmacological interventions at the willingness to pay threshold of £20<thin>000). Overall,
the model’s conclusions were robust to changes made to the sensitivity analyses, giving
strength to the conclusions.
Tables 5 and 6 give the results of the model extensions as undiscounted estimates[t5][t6].
Increasing the number of screenings of the population increased both total costs and QALYs,
which resulted in minimal increases in the cost per QALY for each of the three active
strategies (table 5).[t5] When we ran the model for a South Asian cohort, results for QALYs
were lower because of a higher prevalence of type 2 diabetes at the start of the model and an
increased rate of transition to diabetes (table 6).[t6] Neither increasing the number of screens
or considering different ethnic cohorts led to a change in the overall model conclusions, in

that both the strategies involving interventions for prevention of diabetes seem to be cost
effective compared with no screening in an “at risk” population.
Table - gilc531475.t5
Table - gilc531475.t6
Discussion
Screening for impaired glucose tolerance in people at risk of diabetes and intervening with
either lifestyle or pharmacological interventions is a cost effective health policy. Although
screening for type 2 diabetes alone gave a relatively low predicted incremental cost per
QALY of £14<thin>150, because of uncertainty in the model the probability of this strategy
being cost effective was only 49% at the willingness to pay threshold of £20<thin>000. (this
deleted sentence was suggested by one of the reviewers but after further discussion with
colleagues we would like it removed)
Strengths and weaknesses Previous studies have compared the cost and clinical effectiveness of intervening in people
with impaired glucose individuals to delay onset of type 2 diabetes.[9-16] Results were all
favourable in terms of cost and clinical effectiveness but as the models were designed to
assess the effectiveness of interventions rather than screening and intervening, none of the
models included a state of undiagnosed diabetes and assumed management of diabetes started
as soon as the disease developed. Our model considered the whole screening and intervention
pathway from screening to death and a comparison of different approaches to diabetes
screening and prevention.
Differences in clinical outcomes between the no screening strategy and the three active
screening strategies were small, partly because they were reported as an average for a
screened population with mixed glucose tolerance. Also microvascular and macrovascular
outcomes were not measured individually in this model, which might show benefits from the
early detection or delay of type 2 diabetes.
Our model makes several assumptions. No transition was allowed from normal glucose
tolerance to diabetes without first passing through impaired glucose tolerance. This is
because it is clinically unlikely that an individual would change from normal glucose
tolerance to diabetes within a year, which is one model cycle. No transition was allowed from
diabetes back to impaired glucose tolerance or from impaired to normal glucose tolerance.
This is clinically accurate because once an individual has a diagnosis of type 2 diabetes, even
if their glucose tolerance improves, they are still clinically defined as having diabetes. Also
once an individual has had impaired glucose tolerance, even if their glucose tolerance
improves their future risk of diabetes is probably more similar to that in individuals with
impaired glucose tolerance rather than those who have always had normal glucose tolerance.
Another assumption was that the HbA1c concentration of those with diabetes who were
clinically diagnosed would be similar to the 10 year average of an intensively treated group
of people with diabetes from the UK prospective diabetes study.[41] This assumption was
made in the absence of long term clinical data on individuals whose diabetes was detected by
screening. Although 10 year averages of HbA1c concentrations were used for people with
diabetes, when we ran our model for longer time horizons the HbA1c concentrations were
potentially underestimated, which means complication rates and their effects on utilities and
mortality might also be moderately underestimated. Further data are needed on how HbA1c
concentration could be expected to increase over time to allow more accurate modelling.
Screening costs incorporated within the model included only costs of the test and the
nurse’s time, therefore representing the costs of opportunistic screening. We did not include
further costs of establishing systematic screening, such as the identification of eligible
patients, the issuing of invitations to screening, and the chasing up of non-attenders. In
practice, these additional costs would be small for each individual screened, particularly if
screening was incorporated into current health checks. When modelling costs of treatment
and complications associated with diabetes, we used the average yearly costs taken from the
UK prospective diabetes study. As costs would be expected to start off low and then increase,
this means that costs of diabetes might be initially overestimated when an individual is
diagnosed and eventually underestimated by this model. In addition, as average costs were
used, we did not account for issues of competing risks of complications associated with
diabetes. Unfortunately, yearly data on costs of diabetes, or how the occurrence of
complications impacted on the probability of other complications occurring, were not
available to enable us to model costs more accurately. The issue of competing risks arises not
just for costs but also for the annual probabilities of complications. Ideally, we need data on
individual patients to enable the correlation structure in both the probabilities and costs to be
appropriately accounted for.
As we ran the model for a time horizon of 50 years, the screened population (aged 45 at
the start) aged with each cycle of the model, thus, when possible, we incorporated time
dependent model parameters. For some parameters, such as the treatment intervention effects,
however, we assumed that the effect was constant over time. Additionally, although
compliance was high in the intervention trials from which estimates of their effectiveness

were obtained, it is still to be determined whether compliance could be maintained outside a
trial setting. Therefore long term compliance with interventions is an important consideration.
Sensitivity analyses of compliance with interventions found that even with compliance rates
as low as 50%, the screening strategies involving either lifestyle or pharmacological
interventions were still cost effective when compared with a strategy of no screening.
Conclusions A policy of a one-off screening for type 2 diabetes and impaired glucose tolerance, with
appropriate intervention for those identified with impaired glucose tolerance, seems to be cost
effective in an “at risk” population. Changing compliance with screening or interventions or
increasing the number of screenings did not change the conclusions of the model. Given the
uncertainty in the results presented here, particularly for the assessment of screening for type
2 diabetes, , further research is needed on the long term clinical effects of early diagnosis.
Furthermore, to model the two strategies that involved interventions more accurately, we
require additional information on long term compliance with interventions and their potential
harms and benefits.
What is already known on this topic
In people with impaired glucose tolerance interventions are clinically and cost effective Screening for type 2 diabetes to allow early detection might be cost effective in certain groups What this study adds
Modelling the whole screening and intervention pathway from screening to death shows that screening for type 2 diabetes and impaired glucose tolerance, followed by interventions, seems to be cost effective compared with no screening Uncertainty still exists concerning the cost effectiveness of screening for type 2 diabetes alone Screening populations with a higher prevalence of glucose intolerance might result in better clinical outcomes, although cost effectiveness seems unaffected
We thank the STAR study, in particular Jenny Tringham, and the Leicester arm of the ADDITION study, for providing the data on individual patients that were used for the analyses. We also thank Philip Clarke for advice on the UKPDS outcomes model.
Contributors: CLG performed the data extraction and analyses, wrote the first draft of the article, and is guarantor. KRA and PCL gave detailed advice at all stages of the analyses. All authors contributed to the writing of the paper and gave substantial advice and input into the study. KRA and KK had the initial idea for this project.

Funding: CLG is funded jointly by the UK Medical Research Council and the Economic and Social Research Council, under an interdisciplinary postgraduate research studentship in the social and medical sciences. NJC is funded by a Medical Research Council training fellowship in health services research.
Competing interests: MJD and KK have received sponsorship for attending conferences and small honoraria and funding for research from pharmaceutical companies that manufacture hypoglycaemic and anti-obesity drugs. KRA has also received funding for research from pharmaceutical companies that manufacture hypoglycaemic and anti-obesity drugs and has acted as a paid consultant to consultancy companies who undertake work for the healthcare industry generally.
Ethical approval: Not required.
Provenance and peer review: Not commissioned; externally peer reviewed.

References 1 Wild S, Roglic G, Green A, Sicree R, King H. Global prevalence of diabetes: estimates
for the year 2000 and projections for 2030. Diabetes Care 2004;27:1047-53.
2 Donnelly R, Emslie-Smith AM, Gardner ID, Morris AD. ABC of arterial and venous
vascular disease: Vascular complications of diabetes. BMJ 2000;320:1062-6.
3 UK National Screening Committee. Handbook for vascular risk assessment, risk
reduction and risk management. Leicester: University of Leicester, 2008.
4 King H, Aubert RE, Herman WH. Global burden of diabetes, 1995-2025: prevalence
numerical estimates, and projections. Diabetes Care 1998;21:1414-31.
5 DECODE study group, European Diabetes Epidemiology Group. Glucose tolerance and
mortality: comparison of WHO and American Diabetes Association diagnostic criteria.
Diabetes epidemiology: collaborative analysis of diagnostic criteria in Europe. Lancet
1999;354:617-21.
6 Gillies CL, Abrams KR, Lambert PC, Cooper NJ, Sutton AJ, Hsu RT, Khunti K.
Pharmacological and lifestyle interventions to prevent or delay type 2 diabetes in
people with impaired glucose tolerance. BMJ 2007;334:299-302.
7 Waugh N, Scotland G, McNamee P, Gillett M, Brennan A, Goyder E, et al. Screening
for type 2 diabetes: literature review and economic modelling. Health Technol Assess
2007;11:1-125.
8 Davies MJ, Tringham JR, Troughton J, Khunti KK. Prevention of type 2 diabetes
mellitus. A review of the evidence and its application in a UK setting. Diabet Med
2004;21:403-14.
9 Avenell A, Broom J, Brown TJ, Poobalan A, Aucott L, Stearns SC, et al. Systematic
review of the long-term effects and economic consequences of treatments for obesity
and implications for health improvement. Health Technol Assess 2004;8:1-182.
10 Caro JJ, Getsios D, Caros I, Klittich WS, O’Brien JA. Economic evaluation of
therapeutic interventions to prevent type 2 diabetes in Canada. Diabet Med
2004;21:1229-36.
11 Eddy DM, Schlessinger L, Kahn R. Clinical outcomes and cost-effectiveness of
strategies for managing people at high risk for diabetes. Ann Intern Med 2005;143:251-
64.

12 Herman WH, Hoerger TJ, Brandle M, Hicks K, Sorensen S, Zhang P, et al. The cost-
effectiveness of lifestyle modification or metformin in preventing type 2 diabetes in
adults with impaired glucose tolerance. Ann Intern Med 2005;142:323-32.
13 Icks A, Rathmann W, Haastert B, Gandjour A, Holle R, John J, et al. Clinical and cost-
effectiveness of primary prevention of type 2 diabetes in a “real world” routing
healthcare setting: model based on the KORA Survey 2000. Diabet Med 2007;24:473-
80.
14 Jacobs-van der Bruggen MAM, Bos G, Bemelmans WJ, Hoogenveen RT, Vijgen SM,
Baan CA. Lifestyle interventions are cost-effective in people with different levels of
diabetes risk. Diabetes Care 2007;30:128-34.
15 Palmer AJ, Roze S, Valentine WJ, Spinas GA, Shaw JE, Zimmet PZ. Intensive
lifestyle changes or metformin in patients with impaired glucose tolerance: modeling
the long-term health economic implications of the diabetes prevention program in
Australia, France, Germany, Switzerland, and the United Kingdom. Clin Ther
2004;26:304-21.
16 Segal L, Dalton AC, Richardson J. Cost-effectiveness of the primary prevention of
non-insulin dependent diabetes mellitus. Health Promot Int 1998;13:197-209.
17 CDC Diabetes Cost-Effectiveness Study Group. The cost-effectiveness of screening
for type 2 diabetes. JAMA 1998;280:1757-63.
18 Chen THH, Yen MF, Tung TH. A computer simulated model for cost-effectiveness
analysis of mass screening for type 2 diabetes mellitus. Diabetes Res Clin Pract
2001;54:S37-42.
19 Glumer C, Yuyun M, Griffin S, Farewell D, Spiegelhalter D, Kinmouth AL, et al.
What determines the cost-effectiveness of diabetes screening? Diabetologia
2006;49:1536-44.
20 Hoerger TJ, Harris R, Hicks KA, Donahue K, Sorensen S, Engelgau M. Screening for
type 2 diabetes mellitus: a cost-effectiveness analysis. Ann Intern Med 2004;140:756-
58.
21 National Institute for Clinical Excellence. Guide to the methods of technology
appraisal. London: NICE, 2004.
22 Cooper NJ, Sutton AJ, Abrams KR, Turner D, Wailoo A. Comprehensive decision
analytical modelling in economic evaluation: a Bayesian approach. Health Econ
2004;13:203-26.

23 Spiegelhalter DJ, Thomas A, Best NG, Gilks W. BUGS: Bayesian inference using
Gibbs sampling, version 1.4.1. Cambridge: MRC Biostatistics Unit, 2003.
24 Davies MJ, Tringham JR, Jarvis J, Skinner TC, Farooqi AM, Khunti K. Systematic
screening for type 2 diabetes mellitus: results of a large population based study
targeting those with conventional risk factors. Diabet Med 2005;22(suppl 2):99.
25 Bonora E, Kiechl S, Willeit J, Oberhollenzer F, Egger G, Meigs JB, et al. Population-
based incidence rates and risk factors for type 2 diabetes in white individuals: the
Bruneck study. Diabetes 2004;53:1782-9.
26 Chiasson JL, Josse RG, Gomis R, Hanefeld M, Karasik A, Laakso M. Acarbose for
prevention of type 2 diabetes mellitus: the STOP-NIDDM randomised trial. Lancet
2002;359:2072-7.
27 De Vegt F, Dekker JM, Jager A, Hienkens E, Kostense PJ, Stehouwer CD, et al.
Relation of impaired fasting and postload glucose with incident type 2 diabetes in a
Dutch population: the Hoorn study. JAMA 2001;285:2109-13.
28 Edelstein SL, Knowler WC, Bain RP, Andres R, Barrett-Connor EL, Dowse GK, et al.
Predictors of progression from impaired glucose tolerance to NIDDM: an analysis of
six prospective studies. Diabetes 1997;46:701-10.
29 Eriksson J, Lindstrom J, Valle T, Aunola S, Hamalainen H, Ilanne- Parikka P, et al.
Prevention of type II diabetes in subjects with impaired glucose tolerance: the diabetes
prevention study (DPS) in Finland. Study design and 1-year interim report on the
feasibility of the lifestyle intervention programme. Diabetologia 1999;42:793-801.
30 Eriksson JG, Lehtovirta M, Ehrnstrom B, Salmela S, Groop L. Long-term beneficial
effects of glipizide treatment on glucose tolerance in subjects with impaired glucose
tolerance. J Intern Med 2006;259:553-60.
31 Jarrett RJ, Keen H, Fuller JH, McCartney M. Worsening to diabetes in men with
impaired glucose tolerance (“borderline diabetes”). Diabetologia 1979;16:25-30.
32 Knowler WC, Barrett-Connor E, Fowler SE, Hamman RF, Lachin JM, Walker EA, et
al. Reduction in the incidence of type 2 diabetes with lifestyle intervention or
metformin. N Engl J Med 2002;346:393-403.
33 Meigs JB, Muller DC, Nathan DM, Blake DR, Andres R, Baltimore Longitudinal
Study. The natural history of progression from normal glucose tolerance to type 2
diabetes in the Baltimore longitudinal study of aging. Diabetes 2003;52:1475-84.

34 Rasmussen SS, Glumer C, Sandbaek A, Lauritzen T, Borch-Johnsen K. Progression
from impaired fasting glucose and impaired glucose tolerance to diabetes in a high-risk
screening programme in general practice: the ADDITION study, Denmark.
Diabetologia 2006;50:293-7.
35 Wareham NJ, Byrne CD, Williams R, Day NE, Hales CN. Fasting proinsulin
concentrations predict the development of type 2 diabetes. Diabetes Care
1999;22:262-70.
36 Wein P, Beischer N, Harris C, Permezel M. A trial of simple versus intensified dietary
modification for prevention of progression to diabetes mellitus in women with
impaired glucose tolerance. Aust N Z J Obstet Gynaecol 1999;39:162-6.
37 Harris MI, Klein R, Welborn TA, Knuiman MW, Harris MI, Klein R, et al. Onset of
NIDDM occurs at least 4-7 yr before clinical diagnosis. Diabetes Care 1992;15:815-9.
38 DECODE Study Group, European Diabetes Epidemiology Group. Glucose tolerance
and mortality: comparison of WHO and American Diabetes Association diagnostic
criteria. Diabetes epidemiology: collaborative analysis of diagnostic criteria in Europe.
Lancet 1999;354:617-21.
39 Rossing P, Hougaard P, Borch-Johnsen K, Parving HH, Rossing P, Hougaard P, et al.
Predictors of mortality in insulin dependent diabetes: 10 year observational follow up
study. BMJ 1996;313:779-84.
40 Turner RC, Holman RR, Mathews DR, Oakes SF, Bassett PA, Stratton IM, et al. Study
design, progress and performance (UKPDS VIII). Diabetologia 1991;34:877-90.
41 UK Prospective Diabetes Study (UKPDS) Group. Intensive blood-glucose control with
sulphonylureas or insulin compared with conventional treatment and risk of
complications in patients with type 2 diabetes (UKPDS 33). Lancet 1998;352:837-53.
42 Srinivasan BT, Davies MJ, Webb D, Healey E, Farooqi A, Hiles S, et al. Baseline
charactersitics and risk of progression from prediabetes to type 2 diabetes in a
multiethnic, population based screening. Diabetic Med 2007;24(suppl 1):51.
43 Clarke P, Gray A, Holman R. Estimating utility values for health states of type 2
diabetic patients using the EQ-5D (UKPDS 62). Med Decis Making 2002;4:340-9.
44 Clarke PM, Gray AM, Briggs A, Farmer AJ, Fenn P, Stevens RJ, et al. A model to
estimate the lifetime health outcomes of patients with type 2 diabetes: the United
Kingdom prospective diabetes study (UKPDS) outcomes model (UKPDS 68).
Diabetologia 2004;47:1747-59.
45 Curtis L, Netten A. Unit costs of health and social care. Canterbury: Personal Social
Services Research Unit, University of Kent, 2006.
46 Gulliford MC, Charlton J, Latinovic R. Increased utilization of primary care 5 years
before diagnosis of type 2 diabetes. Diabetes Care 2005;28:47-52.
47 Clarke PM, Gray AM, Briggs A, Stevens RJ, Matthews DR, Holman RR. Cost-utility
analyses of intensive blood glucose and tight blood pressure control in type 2 diabetes.
Diabetologia 2004;48:868-77.
48 Ramachandran A, Snehalatha C, Mary S, Mukesh B, Bhaskar AD, Vijay V. The Indian
diabetes prevention programme shows that lifestyle modification and metformin
prevent type 2 diabetes in Asian Indian subjects with impaired glucose tolerance
(IDPP-1). Diabetologia 2006;49:289-97.


Table 1 Estimates used to determine parameters for decision model Parameter Distribution Value (SE) Source(s)
Data for decision tree Prevalences Dirichlet Normal glucose tolerance 83%; impaired glucose tolerance 12%;
type 2 diabetes 5% STAR study24
Screening test efficiency Multi-nominal For type 2 diabetes: sensitivity 89.5%, specificity 91.3%; for impaired glucose tolerance and type 2 diabetes: sensitivity 59.4%, specificity 88.0%
STAR study24
Transition rates (per 100 person years) Normal to impaired glucose tolerance: <65 years Log normal 1.66 (0.08) ≥65 years Log normal 2.49 (0.11) Baltimore study33
Impaired glucose tolerance to type 2 diabetes
Log normal 1.96 (0.25) 12 studies25-36
Time spent with undetected diabetes (years)
Log normal 1.65 (0.68) Harris37
Mortality rates (per 100 person years) 45-54 years — 0.32 DoH statistics (2000) 55-64 years — 0.84 65-74 years — 2.36 75-84 years — 6.09 ≥85 years — 15.68 Increased risk of death with diabetes (hazard ratio)
Log normal 0.756 (0.087) DECODE38
Increased risk of death for 1% increase in HbA1c (hazard ratio)
Log normal 0.104 (0.039) Rossing39
Intervention effects on risk of developing type 2 diabetes (hazard ratio) Lifestyle v standard treatment Log normal −0.646 (0.099) 12 studies6
Anti-diabetic drugs v placebo Log normal −0.425 (0.141) 9 studies6
HbA1c Undiagnosed diabetes Normal 9.0% (0.056) UKPDS40
Screen detected diabetes Normal 7.0% (0.028) UKPDS41
Clinically detected diabetes Normal 7.9% (0.042) UKPDS41
Utilities Undiagnosed diabetes Normal 0.788 (0.020)† ADDITION34
Screen detected diabetes Normal 0.788 (0.020)‡ ADDITION34
Clinically detected diabetes Normal 0.771 (0.035)‡ UKPDS43 44,
Costs* Screening tests:

FPG test — £0.40/person NHS (2006) OGTT test — £1.30/person Nurse cost — £26/hour Curtis45
Metformin intervention — £16.10/year NHS (2006) Lifestyle intervention: Year 1 — £398/year Subsequent years — £280/year Avenell9
Undiagnosed diabetes: Year before diagnosis — £114/year Years 2-5 before diagnosis — £22/year Gulliford,46 Curtis45
Diagnosed diabetes: Screen detected Normal £2490 (53.3)/year Clinically detected Normal £2756 (63.1)/year UKPDS47
FPG=fasting plasma glucose; OGTT=oral glucose tolerance test. *Costs are standardised to 2006.48 †Constant for all time spent with undetected type 2 diabetes. ‡Starting utility, which was then decreased for each year spent with diabetes due to predicted increases in complications, based on UKPDS data44, 45 .

Table 2 Clinical and cost outcomes from the decision model, where prevalence of impaired glucose tolerance was 15% and type 2 diabetes 7.5%, and sensitivity and specificity of screening tests was 85% and 80%, respectively. Figures are mean values per person (95% credible intervals) for no screening and mean difference from or compared with no screening (95% credible intervals) for all other strategies
Screening for diabetes and impaired glucose tolerance
No screening Screening for diabetes
only Lifestyle interventions Pharmacological
interventions
Undiscounted Total life years 30.34 (27.75 to 32.86) 0.06 (0.02 to 0.12) 0.15 (0.08 to 0.22) 0.13 (0.06 to 0.20) QALYs 28.06 (23.49 to 32.01) 0.07 (−0.03 to 0.18) 0.22 (0.08 to 0.36) 0.17 (0.03 to 0.32) Years spent without diabetes 20.85 (10.36 to 29.45) — 0.33 (0.21 to 0.43) 0.20 (0.10 to 0.37) Lifetime risk of diabetes (%) 64.55 (18.02 to 91.83) — −0.98 (−0.50 to −1.42) −0.54 (−0.21 to −1.17) Total cost 17 290 (5746 to 39580) 730 (−9 to 2341) 610 (−373 to 2693) 579 (−428 to 2658) Cost per life year gained — 11 460 4179 4768 Cost per QALY gained — 8681 2863 3429 Cost per case prevented — — 62 810 105 000 Probability of cost effectiveness at a willingness to pay threshold per QALY (%): £20 000 68.1 98.6 94.7 £30 000 76.5 99.6 97.3
Discounted at 3.5% a year for both costs and benefits Total life years 18.19 (17.25 to 18.98) 0.02 (−0.01 to 0.05) 0.05 (0.03 to 0.08) 0.05 (0.02 to 0.07) QALYs 17.13 (15.02 to 18.49) 0.03 (−0.02 to 0.09) 0.09 (0.03 to 0.17) 0.07 (0.01 to 0.15) Years spent diabetes free 13.69 (7.99 to 17.08) — 0.17 (0.11 to 0.23) 0.11 (0.06 to 0.19) Total cost 7636 (2636 to 19 370) 587 (61 to 1525) 580 (−103 to 1760) 528 (−163 to 1719) Cost per life year gained — 23 710 10 900 11 690 Cost per QALY gained — 14 150 6242 7023 Probability of cost effectiveness at a willingness to pay threshold per QALY (%): £20 000 48.6 93.0 85.0 £30 000 60.8 97.4 91.6

Table 3 Results (undiscounted) of sensitivity analyses for varying prevalence rates of impaired glucose tolerance, normal glucose tolerance, and type 2 diabetes
Screening for type 2 diabetes and impaired glucose tolerance
Prevalence* No screening Screening for type 2
diabetes only Lifestyle interventions Pharmacological interventions
QALY 83/12/5 28.06 (23.49 to 32.01) 28.12 (23.58 to 32.08) 28.26 (23.74 to 32.23) 28.22 (23.69 to 32.18) 70/20/10 28.26 (24.72 to 31.18) 28.26 (24.79 to 31.14) 28.47 (25.02 to 31.34) 28.41 (24.96 to 31.29) 10/60/30 23.75 (21.82 to 25.58) 24.16 (22.40 to 25.85) 24.91 (23.15 to 26.55) 24.67 (22.89 to 26.35)
Total cost (£) 83/12/5 17 290 (5746 to 39 580) 18 040 (7083 to 39 970) 17 910 (7124 to 39 740) 17 900 (7061 to 39 710) 70/20/10 21 320 (9132 to 41 270) 22 780 (12 470 to 41 840) 22 620 (12 650 to 41 370) 22 560 (12 540 to 41 420) 10/60/30 38 440 (19 740 to 49 690) 42 580 (32 660 to 51 190) 41 980 (33 990 to 49 980) 41 830 (33 530 to 50 090)
Cost per QALY gained (£) 83/12/5 — 8681 2863 3429 70/20/10 — 8617 3203 3809 10/60/30 — 8464 3148 3781
Probability (%) of being cost effective at a willingness to pay threshold of £20 000/£30 000 per QALY 83/12/5 — 68/76 99/100 95/97 70/20/10 — 68/76 98/99 93/96 10/60/30 — 68/76 98/99 93/96
*Impaired glucose tolerance/normal glucose tolerance/type 2 diabetes.
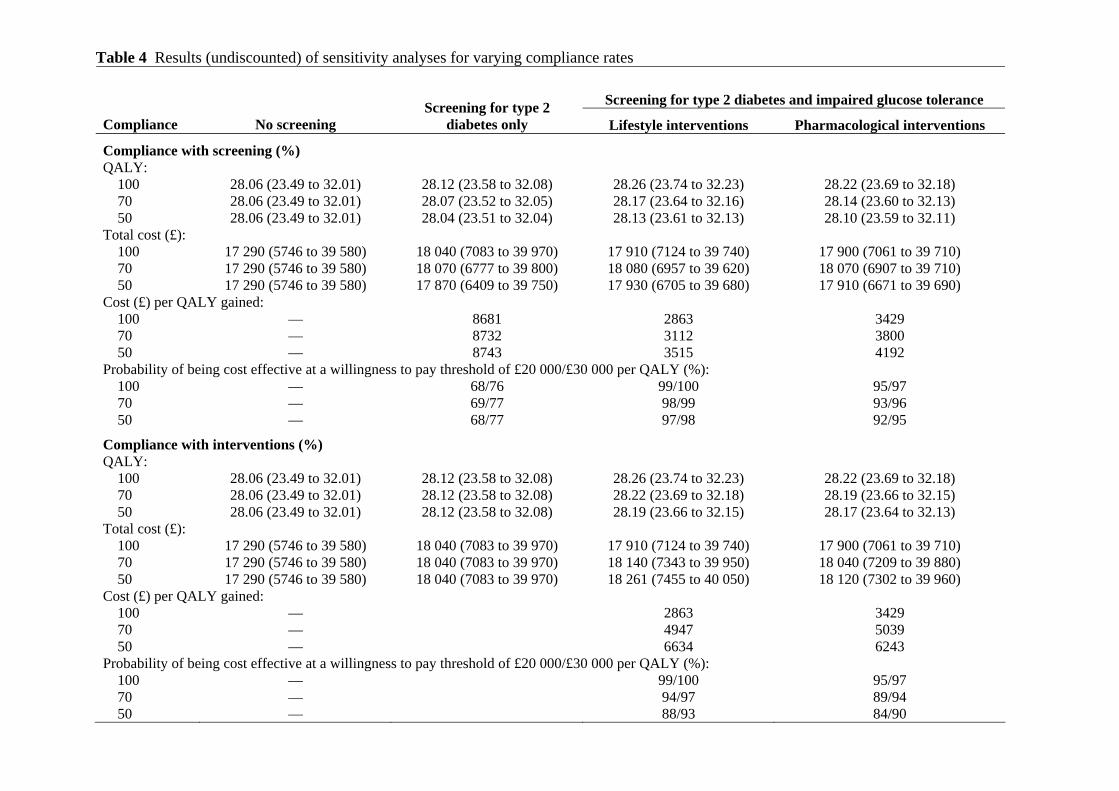
Table 4 Results (undiscounted) of sensitivity analyses for varying compliance rates
Screening for type 2 diabetes and impaired glucose tolerance
Compliance No screening Screening for type 2
diabetes only Lifestyle interventions Pharmacological interventions
Compliance with screening (%) QALY: 100 28.06 (23.49 to 32.01) 28.12 (23.58 to 32.08) 28.26 (23.74 to 32.23) 28.22 (23.69 to 32.18) 70 28.06 (23.49 to 32.01) 28.07 (23.52 to 32.05) 28.17 (23.64 to 32.16) 28.14 (23.60 to 32.13) 50 28.06 (23.49 to 32.01) 28.04 (23.51 to 32.04) 28.13 (23.61 to 32.13) 28.10 (23.59 to 32.11) Total cost (£): 100 17 290 (5746 to 39 580) 18 040 (7083 to 39 970) 17 910 (7124 to 39 740) 17 900 (7061 to 39 710) 70 17 290 (5746 to 39 580) 18 070 (6777 to 39 800) 18 080 (6957 to 39 620) 18 070 (6907 to 39 710) 50 17 290 (5746 to 39 580) 17 870 (6409 to 39 750) 17 930 (6705 to 39 680) 17 910 (6671 to 39 690) Cost (£) per QALY gained: 100 — 8681 2863 3429 70 — 8732 3112 3800 50 — 8743 3515 4192 Probability of being cost effective at a willingness to pay threshold of £20 000/£30 000 per QALY (%): 100 — 68/76 99/100 95/97 70 — 69/77 98/99 93/96 50 — 68/77 97/98 92/95
Compliance with interventions (%) QALY: 100 28.06 (23.49 to 32.01) 28.12 (23.58 to 32.08) 28.26 (23.74 to 32.23) 28.22 (23.69 to 32.18) 70 28.06 (23.49 to 32.01) 28.12 (23.58 to 32.08) 28.22 (23.69 to 32.18) 28.19 (23.66 to 32.15) 50 28.06 (23.49 to 32.01) 28.12 (23.58 to 32.08) 28.19 (23.66 to 32.15) 28.17 (23.64 to 32.13) Total cost (£): 100 17 290 (5746 to 39 580) 18 040 (7083 to 39 970) 17 910 (7124 to 39 740) 17 900 (7061 to 39 710) 70 17 290 (5746 to 39 580) 18 040 (7083 to 39 970) 18 140 (7343 to 39 950) 18 040 (7209 to 39 880) 50 17 290 (5746 to 39 580) 18 040 (7083 to 39 970) 18 261 (7455 to 40 050) 18 120 (7302 to 39 960) Cost (£) per QALY gained: 100 — 2863 3429 70 — 4947 5039 50 — 6634 6243 Probability of being cost effective at a willingness to pay threshold of £20 000/£30 000 per QALY (%): 100 — 99/100 95/97 70 — 94/97 89/94 50 — 88/93 84/90
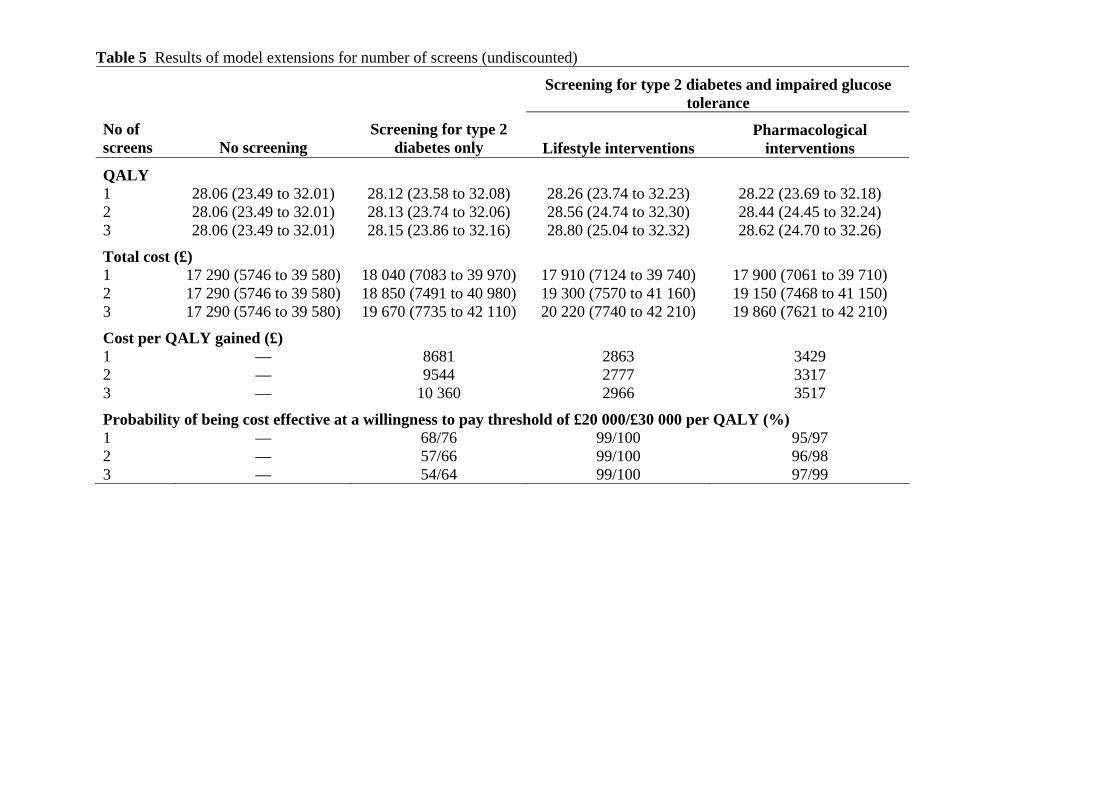
Table 5 Results of model extensions for number of screens (undiscounted)
Screening for type 2 diabetes and impaired glucose tolerance
No of screens No screening
Screening for type 2 diabetes only Lifestyle interventions
Pharmacological interventions
QALY 1 28.06 (23.49 to 32.01) 28.12 (23.58 to 32.08) 28.26 (23.74 to 32.23) 28.22 (23.69 to 32.18) 2 28.06 (23.49 to 32.01) 28.13 (23.74 to 32.06) 28.56 (24.74 to 32.30) 28.44 (24.45 to 32.24) 3 28.06 (23.49 to 32.01) 28.15 (23.86 to 32.16) 28.80 (25.04 to 32.32) 28.62 (24.70 to 32.26)
Total cost (£) 1 17 290 (5746 to 39 580) 18 040 (7083 to 39 970) 17 910 (7124 to 39 740) 17 900 (7061 to 39 710) 2 17 290 (5746 to 39 580) 18 850 (7491 to 40 980) 19 300 (7570 to 41 160) 19 150 (7468 to 41 150) 3 17 290 (5746 to 39 580) 19 670 (7735 to 42 110) 20 220 (7740 to 42 210) 19 860 (7621 to 42 210)
Cost per QALY gained (£) 1 — 8681 2863 3429 2 — 9544 2777 3317 3 — 10 360 2966 3517
Probability of being cost effective at a willingness to pay threshold of £20 000/£30 000 per QALY (%) 1 — 68/76 99/100 95/97 2 — 57/66 99/100 96/98 3 — 54/64 99/100 97/99

Table 6 Results of model extensions for different ethnic groups (undiscounted)
Screening for type 2 diabetes and impaired glucose tolerance
Ethnic group No screening
Screening for type 2 diabetes only Lifestyle interventions
Pharmacological interventions
QALY White 28.06 (23.49 to 32.01) 28.12 (23.58 to 32.08) 28.26 (23.74 to 32.23) 28.22 (23.69 to 32.18) South Asian 25.24 (20.65 to 30.79) 25.35 (20.83 to 30.91) 25.47 (20.96 to 31.02) 25.43 (20.92 to 30.98) Mixed* 27.10 (23.79 to 30.31) 27.18 (23.88 to 30.39) 27.32 (24.02 to 30.53) 27.27 (23.99 to 30.53)
Total cost (£) White 17 290 (5746 to 39 580) 18 040 (7083 to 39 970) 17 910 (7124 to 39 740) 17 900 (7061 to 39 710) South Asian 28 250 (10 170 to 55 120) 29 390 (12 270 to 55 490) 29 420 (12 500 to 55 220) 29 480 (12 550 to 55 270) Mixed* 22 145 (8345 to 41 657) 23 051 (9820 to 42 131) 22 973 (9809 to 41 962) 22 976 (11 885 to 42 006)
Cost per QALY gained (£) White — 8681 2863 3429 South Asian — 8168 4657 5643 Mixed* — 8523 3555 4497
Probability of being cost effective at a willingness to pay threshold of £20 000/£30 000 per QALY (%) White — 68/76 99/100 95/97 South Asian — 68/75 89/94 83/88 Mixed* — 69/77 98/99 96/98
*Modelled as 30% South Asian and 70% white.

PROOFPROOFFilename
Section
Author name
Tech. Ed. Fig widthOnline First?
gilc531475.f1
R
Gillies
BS 111Yes
Positive
Negative
Screened forimpaired glucose
tolerance anddiabetes
Screeningresult
Truestatus
Decision treePrevalences are required for each arm, along with sensitivities and specificities of given
screening test. Decision tree determines starting numbers in each Markov state
Markov modelIncidence rates required for each transition, adjusted for intervention and treatment effects.
Four Markov models will be run, one for each screening/intervention strategy
Treatment orintervention
applied
Type 2 diabetes (screen detected)
Impaired glucose tolerance (diagnosed)
Normal glucose tolerance
Normal glucosetolerance
Death
Type 2 diabetes (undiagnosed)
Impaired glucose tolerance (undiagnosed)
Impaired glucosetolerance (undiagnosed)
Impaired glucosetolerance (diagnosed)
Type 2 diabetes(undiagnosed)
Type 2 diabetes(clinically detected)
Type 2 diabetes(screen detected)
Normal glucose tolerance
Yes
Yes
No
No
No
No
Positive
Not screened
Negative
Screened fordiabetes
Type 2 diabetes (screen detected)
Impaired glucose tolerance (undiagnosed)
Normal glucose tolerance
Type 2 diabetes (undiagnosed)
Impaired glucose tolerance (undiagnosed)
Normal glucose tolerance
Yes
No
No
Type 2 diabetes (undiagnosed)
Impaired glucose tolerance (undiagnosed)
Normal glucose tolerance
No
No
No
No
No
No