
Different responses of spontaneous and stimulus‐related ...
10
Different responses of spontaneous and stimulus-related alpha activity to ambient luminance changes Alessandro Benedetto, 1,2 Diego Lozano-Soldevilla 3,4 and Rufin VanRullen 3,4 1 Department of Translational Research on New Technologies in Medicines and Surgery, University of Pisa, Pisa, Italy 2 Department of Neuroscience, Psychology, Pharmacology and Child Health, University of Florence, Florence, Italy 3 Centre National de la Recherche Scientifique (CNRS), Unit e Mixte de Recherche 5549, Facult e de M edecine Purpan, Toulouse, France 4 Centre de Recherche Cerveau et Cognition, Universit e Paul Sabatier, Place du Dr. Baylac, 31052 Toulouse, France Keywords: alpha, ambient luminance, brain oscillations, critical flicker frequency, echo function, impulse response function Abstract Alpha oscillations are particularly important in determining our percepts and have been implicated in fundamental brain functions. Oscillatory activity can be spontaneous or stimulus-related. Furthermore, stimulus-related responses can be phase- or non- phase-locked to the stimulus. Non-phase-locked (induced) activity can be identified as the average amplitude changes in response to a stimulation, while phase-locked activity can be measured via reverse-correlation techniques (echo function). How- ever, the mechanisms and the functional roles of these oscillations are far from clear. Here, we investigated the effect of ambient luminance changes, known to dramatically modulate neural oscillations, on spontaneous and stimulus-related alpha. We investi- gated the effect of ambient luminance on EEG alpha during spontaneous human brain activity at rest (experiment 1) and during visual stimulation (experiment 2). Results show that spontaneous alpha amplitude increased by decreasing ambient luminance, while alpha frequency remained unaffected. In the second experiment, we found that under low-luminance viewing, the stimulus- related alpha amplitude was lower, and its frequency was slightly faster. These effects were evident in the phase-locked part of the alpha response (echo function), but weaker or absent in the induced (non-phase-locked) alpha responses. Finally, we explored the possible behavioural correlates of these modulations in a monocular critical flicker frequency task (experiment 3), finding that dark adaptation in the left eye decreased the temporal threshold of the right eye. Overall, we found that ambient lumi- nance changes impact differently on spontaneous and stimulus-related alpha expression. We suggest that stimulus-related alpha activity is crucial in determining human temporal segmentation abilities. Introduction The human brain can be conceived as a dynamical system where billions of neurons synchronize their activity to generate a coherent and stable representation of the world. Neuronal oscillations play a special role in this synchronization, and in particular, alpha oscilla- tions (8–13 Hz) are known to shape perception (VanRullen & Koch, 2003; VanRullen, 2016). Alpha amplitude and phase are related to stimulus processing and cortical excitability (Nunn & Osselton, 1974; Linkenkaer-Hansen et al., 2004; Hanslmayr et al., 2005; Romei et al., 2008; Busch et al., 2009), as well as cognitive and memory functions (Klimesch et al., 1993; Klimesch, 1999; Bonne- fond & Jensen, 2012). Furthermore, alpha rhythm peak frequency is linked to visual temporal resolution (Varela et al., 1981; Cecere et al., 2015; Samaha & Postle, 2015; Milton & Pleydell-Pearce, 2016). These independent functions suggest that the alpha rhythm nests partial independent oscillators which serve different processes. A first attempt to disentangle these differences is to investigate the alpha basic oscillatory mechanisms. A common conception is that cortical oscillatory activity comprises both spontaneous and stimu- lus-related components, possibly reflecting semi-independent func- tions (David et al., 2006). The spontaneous activity reflects ongoing oscillatory mechanisms, while the stimulus-related activity reflects oscillatory mechanisms sensitive to stimulation. Furthermore, stimu- lus-related activity can be decomposed in an ‘induced’ response and an ‘evoked’ response. The ‘induced’ response is characterized by stimulus-related changes in oscillatory amplitude, which are not nec- essarily phase-locked to the stimulus (i.e. their latency vary trial-by- trial), and these amplitude modulations tend to disappear in the time-domain averaged data. In contrast, the ‘evoked’ activity reflects Correspondence: Rufin VanRullen, 4 Centre de Recherche Cerveau et Cognition, as above. E-mail: rufi[email protected] Received 12 June 2017, revised 28 November 2017, accepted 28 November 2017 Edited by John Foxe Reviewed by Joram Van Driel, University of Amsterdam, Netherlands [assisted by Ing- mar de Vries]; and Bradley Postle, University of Wisconsin-Madison, USA The associated peer review process communications can be found in the online version of this article. © 2017 Federation of European Neuroscience Societies and John Wiley & Sons Ltd European Journal of Neuroscience, Vol. 48, pp. 2599–2608, 2018 doi:10.1111/ejn.13791
Transcript of Different responses of spontaneous and stimulus‐related ...

Different responses of spontaneous and stimulus-relatedalpha activity to ambient luminance changes
Alessandro Benedetto,1,2 Diego Lozano-Soldevilla3,4 and Rufin VanRullen3,41Department of Translational Research on New Technologies in Medicines and Surgery, University of Pisa, Pisa, Italy2Department of Neuroscience, Psychology, Pharmacology and Child Health, University of Florence, Florence, Italy3Centre National de la Recherche Scientifique (CNRS), Unit�e Mixte de Recherche 5549, Facult�e de M�edecine Purpan, Toulouse,France4Centre de Recherche Cerveau et Cognition, Universit�e Paul Sabatier, Place du Dr. Baylac, 31052 Toulouse, France
Keywords: alpha, ambient luminance, brain oscillations, critical flicker frequency, echo function, impulse response function
Abstract
Alpha oscillations are particularly important in determining our percepts and have been implicated in fundamental brain functions.Oscillatory activity can be spontaneous or stimulus-related. Furthermore, stimulus-related responses can be phase- or non-phase-locked to the stimulus. Non-phase-locked (induced) activity can be identified as the average amplitude changes inresponse to a stimulation, while phase-locked activity can be measured via reverse-correlation techniques (echo function). How-ever, the mechanisms and the functional roles of these oscillations are far from clear. Here, we investigated the effect of ambientluminance changes, known to dramatically modulate neural oscillations, on spontaneous and stimulus-related alpha. We investi-gated the effect of ambient luminance on EEG alpha during spontaneous human brain activity at rest (experiment 1) and duringvisual stimulation (experiment 2). Results show that spontaneous alpha amplitude increased by decreasing ambient luminance,while alpha frequency remained unaffected. In the second experiment, we found that under low-luminance viewing, the stimulus-related alpha amplitude was lower, and its frequency was slightly faster. These effects were evident in the phase-locked part ofthe alpha response (echo function), but weaker or absent in the induced (non-phase-locked) alpha responses. Finally, weexplored the possible behavioural correlates of these modulations in a monocular critical flicker frequency task (experiment 3),finding that dark adaptation in the left eye decreased the temporal threshold of the right eye. Overall, we found that ambient lumi-nance changes impact differently on spontaneous and stimulus-related alpha expression. We suggest that stimulus-related alphaactivity is crucial in determining human temporal segmentation abilities.
Introduction
The human brain can be conceived as a dynamical system wherebillions of neurons synchronize their activity to generate a coherentand stable representation of the world. Neuronal oscillations play aspecial role in this synchronization, and in particular, alpha oscilla-tions (8–13 Hz) are known to shape perception (VanRullen & Koch,2003; VanRullen, 2016). Alpha amplitude and phase are related tostimulus processing and cortical excitability (Nunn & Osselton,1974; Linkenkaer-Hansen et al., 2004; Hanslmayr et al., 2005;
Romei et al., 2008; Busch et al., 2009), as well as cognitive andmemory functions (Klimesch et al., 1993; Klimesch, 1999; Bonne-fond & Jensen, 2012). Furthermore, alpha rhythm peak frequency islinked to visual temporal resolution (Varela et al., 1981; Cecereet al., 2015; Samaha & Postle, 2015; Milton & Pleydell-Pearce,2016). These independent functions suggest that the alpha rhythmnests partial independent oscillators which serve different processes.A first attempt to disentangle these differences is to investigate thealpha basic oscillatory mechanisms. A common conception is thatcortical oscillatory activity comprises both spontaneous and stimu-lus-related components, possibly reflecting semi-independent func-tions (David et al., 2006). The spontaneous activity reflects ongoingoscillatory mechanisms, while the stimulus-related activity reflectsoscillatory mechanisms sensitive to stimulation. Furthermore, stimu-lus-related activity can be decomposed in an ‘induced’ response andan ‘evoked’ response. The ‘induced’ response is characterized bystimulus-related changes in oscillatory amplitude, which are not nec-essarily phase-locked to the stimulus (i.e. their latency vary trial-by-trial), and these amplitude modulations tend to disappear in thetime-domain averaged data. In contrast, the ‘evoked’ activity reflects
Correspondence: Rufin VanRullen, 4Centre de Recherche Cerveau et Cognition, asabove.E-mail: [email protected]
Received 12 June 2017, revised 28 November 2017, accepted 28 November 2017
Edited by John Foxe
Reviewed by Joram Van Driel, University of Amsterdam, Netherlands [assisted by Ing-mar de Vries]; and Bradley Postle, University of Wisconsin-Madison, USA
The associated peer review process communications can be found in the online versionof this article.
© 2017 Federation of European Neuroscience Societies and John Wiley & Sons Ltd
European Journal of Neuroscience, Vol. 48, pp. 2599–2608, 2018 doi:10.1111/ejn.13791

only the phase-locked EEG activity synchronized with the stimulusonset. Recently, by applying a reverse-correlation technique betweena random luminance sequence and the corresponding EEGresponses, the electroencephalogram ‘impulse response function’ (orecho function) of the visual system has been modelled (VanRullen& Macdonald, 2012). Crucially, the echo function reflects the stimu-lus-related phase-locked activity of the EEG signal, by measuringhow much the EEG response correlates with the visual stimulation,over time. The amplitude and the frequency of the echo function arecorrelated with the spontaneous resting alpha (VanRullen & Mac-donald, 2012). At the same time, it has been shown that attentionalallocation is inversely correlated with spontaneous alpha amplitude(Sauseng et al., 2005), and it correlates positively with the echofunction amplitude (VanRullen & Macdonald, 2012). Together,these findings suggest that the two rhythms reflect partially indepen-dent functions; however, the nature of these differences is stillunclear.To clarify the functional differences between spontaneous and
stimulus-related brain rhythms, we experimentally manipulated neu-ronal oscillations by modulating luminance viewing conditions. Infact, luminance viewing conditions are known to influence visualand cognitive abilities (Vandewalle et al., 2009; Barbur & Stock-man, 2010). The latency and integration time of visual processing –from retinal to higher processing sites – progressively increases atlow-luminance (Kammer et al., 1999), as well as the alpha ampli-tude (Min et al., 2013; Brodoehl et al., 2015), and the frequency ofbehavioural visual oscillations (Benedetto et al., 2016). Moreover,brief dark exposure produces adaptive changes in cortical excitabil-ity (Huang et al., 2015).In experiment 1, we investigated the effect of ambient luminance
on the spontaneous alpha activity recorded at rest. In experiment 2,we extended this investigation to stimulus-related brain activity,looking at possible luminance modulations over phase-locked (echo)and non-phase-locked EEG activity. Visual temporal segmentationabilities are known to correlate with brain rhythms, and in particular,are reported to be tightly linked with alpha frequency (Samaha &Postle, 2015). Thus, in experiment 3, we explored some functionalcorrelates of the luminance-based modulations of brain oscillationsby estimating an index of temporal segmentation abilities (monocu-lar critical flicker frequency, CFF) under different contralateral lumi-nance viewing conditions.
Material and methods
All experiments were conducted in a quiet, dark room (mean ambi-ent luminance < 0.01 cd/m2). For experiment 1 and 2, electrophysi-ological activity was continuously recorded at 1024 Hz using a 64channel ActiveTwo Biosemi system. Horizontal and vertical eyemovements were recorded by three additional electrodes: one belowthe left eye and two at bilateral outer canthi. After giving writteninformed consent, 16, 12 and 13 subjects took part in experiments1, 2 and 3, respectively (including two authors). A total of 21 partic-ipants were recorded (10 women, mean age and standard deviation:30 � 4). The three groups of participants were practically overlap-ping: six participants performed both experiments 1 and 2, eight par-ticipated in experiments 1 and 3, and five in experiments 2 and 3.All had normal or corrected-to-normal vision. Two subjects fromexperiment 1 did not show alpha activity and were thus discardedfrom further analyses. The main goal of this study was to comparethe effect of different luminance viewing condition over spontaneousand stimulus-related EEG alpha activities. For this reason, werestricted our analysis to the electrode POz that is known to convey
the strongest stimulus-related response (VanRullen & Macdonald,2012; Chang et al., 2017) as well as showing a strong alpha activityat rest. For experiments 1 and 2, stimuli were generated using theMATLAB Psychophysics toolbox (Brainard, 1997) and displayed at57 cm on a gamma-corrected CRT monitor (640 9 480 pixels,160 Hz). For experiment 3, stimuli were presented using Python(Peirce, 2007) on a gamma-corrected CRT monitor (800 9 600 pix-els, 60 Hz) and a white LED controlled by Arduino Uno seriallyconnected to the PC (1 15 200 baud rate) (Teikari et al., 2012).Response in experiment 3 was recorded via a potentiometer drivenby Arduino Uno. Data were analysed with EEGLAB (Delorme &Makeig, 2004), FieldTrip (Oostenveld et al., 2011) and custom Mat-lab code. The low-luminance viewing condition was achieved byapplying a neutral density filter (NDF) in front of the monitor(NDF: 2.5 LU, experiments 1 and 2), or in front of the left eye(NDF: 1.5 LU, experiment 3). All experiments were approved bythe Centre National de la Recherche Scientifique ethical committee.
Experiment 1: spontaneous alpha activity
The experimental procedure is shown in Fig. 1A. We recordedblocks of 1 min of EEG activity while participants (N = 14) main-tained fixation on a dot presented on a grey screen (resting state,with eyes open). To maintain alertness, after each resting period,participants performed a reaction time (RT) task to a visual targetpresented above a movie shown in the screen centre (active task,2 min long). The experiment consisted of three consecutive sessions.In the first and the third session, five resting blocks of 1 min persession were recorded for each participant over 13 min, under high-luminance viewing conditions (mean luminance of 51.8 cd/m2). Thesecond session was performed under low-luminance viewing condi-tion, achieved by positioning a neutral density filter (NDF, 2.5 LU)in front of the monitor. Fourteen minutes of resting were collectedper participant over 40 min.The EEG was re-referenced to the common average and band-
passed filtered (1–256 Hz, 4th order Butterworth IIR filter). Each 1-min recording was split in 5 s epochs (from 5 to 60 s). Artefactswere detected and removed in two steps: first, we visually inspectedthe epochs and those with gross muscular artefacts were rejected.Subsequently, we applied ICA to remove artefacts (Jung et al.,2000). We standardized the EEG responses according to the globalstandard deviation of each participant, across conditions. For eachparticipant and condition, we investigated from POz two mainindices: the individual alpha amplitude (spontaneous IAA) and theindividual alpha frequency (spontaneous IAF). To compute thespontaneous IAA, we first defined the alpha range as the frequencyband between 8 and 13 Hz. Next, we computed for each epoch thealpha spectrum using a Fourier transform. The spontaneous IAAwas defined for both high- and low-luminance condition, as themean of the alpha spectra across epochs. To determine the sponta-neous IAF, we computed the mean amplitude spectrum of the alphaband (8–13 Hz), using a Fast Fourier transform. We averaged thealpha spectra across all epochs and defined spontaneous IAF as thecentre of mass (or spectral centroid) of the mean alpha spectrum(Klimesch et al., 1993).
Experiment 2: stimulus-related alpha activity
White-noise visual luminance sequences were displayed within adisc of 3.5° radius presented in the vertical meridian centred at 7.5°above the fovea on a black background. Each randomly generatedluminance sequence (6.25 s) was tailored to have equal amplitude at
© 2017 Federation of European Neuroscience Societies and John Wiley & Sons LtdEuropean Journal of Neuroscience, 48, 2599–2608
2600 A. Benedetto et al.
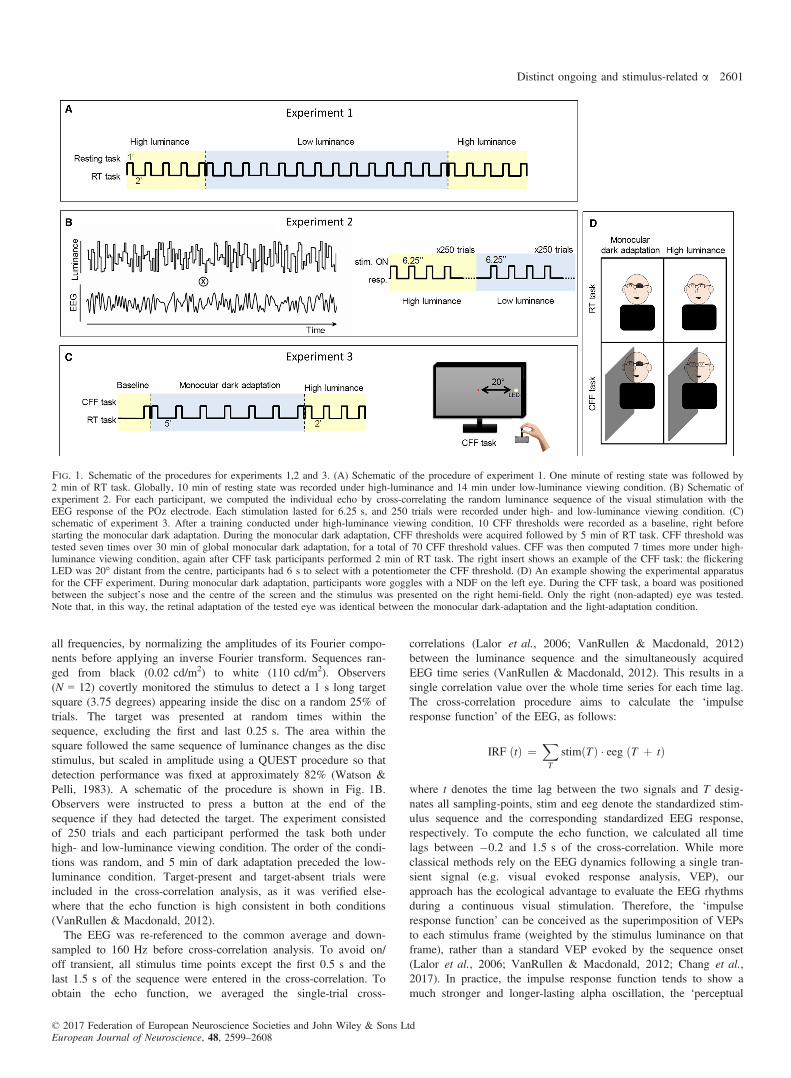
all frequencies, by normalizing the amplitudes of its Fourier compo-nents before applying an inverse Fourier transform. Sequences ran-ged from black (0.02 cd/m2) to white (110 cd/m2). Observers(N = 12) covertly monitored the stimulus to detect a 1 s long targetsquare (3.75 degrees) appearing inside the disc on a random 25% oftrials. The target was presented at random times within thesequence, excluding the first and last 0.25 s. The area within thesquare followed the same sequence of luminance changes as the discstimulus, but scaled in amplitude using a QUEST procedure so thatdetection performance was fixed at approximately 82% (Watson &Pelli, 1983). A schematic of the procedure is shown in Fig. 1B.Observers were instructed to press a button at the end of thesequence if they had detected the target. The experiment consistedof 250 trials and each participant performed the task both underhigh- and low-luminance viewing condition. The order of the condi-tions was random, and 5 min of dark adaptation preceded the low-luminance condition. Target-present and target-absent trials wereincluded in the cross-correlation analysis, as it was verified else-where that the echo function is high consistent in both conditions(VanRullen & Macdonald, 2012).The EEG was re-referenced to the common average and down-
sampled to 160 Hz before cross-correlation analysis. To avoid on/off transient, all stimulus time points except the first 0.5 s and thelast 1.5 s of the sequence were entered in the cross-correlation. Toobtain the echo function, we averaged the single-trial cross-
correlations (Lalor et al., 2006; VanRullen & Macdonald, 2012)between the luminance sequence and the simultaneously acquiredEEG time series (VanRullen & Macdonald, 2012). This results in asingle correlation value over the whole time series for each time lag.The cross-correlation procedure aims to calculate the ‘impulseresponse function’ of the EEG, as follows:
IRF ðtÞ ¼X
T
stimðTÞ � eeg ðT þ tÞ
where t denotes the time lag between the two signals and T desig-nates all sampling-points, stim and eeg denote the standardized stim-ulus sequence and the corresponding standardized EEG response,respectively. To compute the echo function, we calculated all timelags between �0.2 and 1.5 s of the cross-correlation. While moreclassical methods rely on the EEG dynamics following a single tran-sient signal (e.g. visual evoked response analysis, VEP), ourapproach has the ecological advantage to evaluate the EEG rhythmsduring a continuous visual stimulation. Therefore, the ‘impulseresponse function’ can be conceived as the superimposition of VEPsto each stimulus frame (weighted by the stimulus luminance on thatframe), rather than a standard VEP evoked by the sequence onset(Lalor et al., 2006; VanRullen & Macdonald, 2012; Chang et al.,2017). In practice, the impulse response function tends to show amuch stronger and longer-lasting alpha oscillation, the ‘perceptual
Fig. 1. Schematic of the procedures for experiments 1,2 and 3. (A) Schematic of the procedure of experiment 1. One minute of resting state was followed by2 min of RT task. Globally, 10 min of resting state was recorded under high-luminance and 14 min under low-luminance viewing condition. (B) Schematic ofexperiment 2. For each participant, we computed the individual echo by cross-correlating the random luminance sequence of the visual stimulation with theEEG response of the POz electrode. Each stimulation lasted for 6.25 s, and 250 trials were recorded under high- and low-luminance viewing condition. (C)schematic of experiment 3. After a training conducted under high-luminance viewing condition, 10 CFF thresholds were recorded as a baseline, right beforestarting the monocular dark adaptation. During the monocular dark adaptation, CFF thresholds were acquired followed by 5 min of RT task. CFF threshold wastested seven times over 30 min of global monocular dark adaptation, for a total of 70 CFF threshold values. CFF was then computed 7 times more under high-luminance viewing condition, again after CFF task participants performed 2 min of RT task. The right insert shows an example of the CFF task: the flickeringLED was 20° distant from the centre, participants had 6 s to select with a potentiometer the CFF threshold. (D) An example showing the experimental apparatusfor the CFF experiment. During monocular dark adaptation, participants wore goggles with a NDF on the left eye. During the CFF task, a board was positionedbetween the subject’s nose and the centre of the screen and the stimulus was presented on the right hemi-field. Only the right (non-adapted) eye was tested.Note that, in this way, the retinal adaptation of the tested eye was identical between the monocular dark-adaptation and the light-adaptation condition.
© 2017 Federation of European Neuroscience Societies and John Wiley & Sons LtdEuropean Journal of Neuroscience, 48, 2599–2608
Distinct ongoing and stimulus-related a 2601

echo’ (VanRullen & Macdonald, 2012), which makes it more suit-able than a VEP for studying evoked (phase-locked) alpha oscilla-tions.The literature on the echo function consistently shows that before
0.25 s, the echo overlaps with the early broadband part of the IRF,similar to a VEP (_Ilhan & VanRullen, 2012; VanRullen & Macdon-ald, 2012). In other words, cross-correlation lags before 0.25 sreveal a broadband ERP (0–30 Hz) that is not specific to alphaoscillations. Accordingly, we defined our temporal window of inter-est with lags between 0.25 and 1 s. Individual alpha amplitude(echo IAA) and individual alpha frequency (echo IAF) were com-puted at the electrode POz within these lags (VanRullen & Macdon-ald, 2012; Chang et al., 2017). The echo IAA was defined, for bothhigh- and low-luminance condition, as the mean of the alpha ampli-tude spectrum computed using the Fourier transform, obtained fromaveraging all the echoes across trials. To determine the echo IAF,we computed the alpha spectrum of the averaged echoes, via a FastFourier transform. The echo IAF was defined as the centre of massof the mean echo function spectrum. To increase frequency resolu-tion of the echo IAF, the signal was zero-padded (30 s).In addition, we investigated the phase difference between the two
conditions. We selected a time window of 300 ms between 0.25 and0.55 from stimulus onset, where the alpha amplitude was maximalfor both conditions (see Fig. 4B). For each participant, the echo waspreviously bandpass filtered �1 Hz around its IAF (ideal bandpass), instantaneous analytic phase was obtained by taking the angleof the Hilbert-transform of echo functions within the window ofinterest.Finally, we also investigated the activity induced by the stimula-
tion. To investigate the induced EEG response, we computed theinduced IAA and induced IAF for the EEG data over the entirestimulation sequence duration, excluding the first 0.5 s and the last1.5 s of each stimulus sequence to avoid on/off artefact (e.g. ERPs).Even though the EEG signal is phase-locked to the onset of theluminance sequence, it bears no phase relation to each individualframe, as the frames happen continually and with random lumi-nance. Therefore, analyses of the induced response involved averag-ing the EEG response in the frequency domain following an FFT(as for the spontaneous responses), and not in the temporal domain(as for the echoes). Induced IAA was computed as spontaneousIAA in experiment 1. The EEG responses were standardized accord-ing to the global standard deviation of each participant, across bothconditions. We computed for each trial the alpha amplitude spec-trum via a Fourier transform. The induced IAA was defined for bothhigh- and low-luminance condition, as the mean of the averagedalpha spectra. Moreover, we averaged the alpha spectra (8–13 Hz)across trials to compute the centre of mass of the mean alpha spec-trum (induced IAF). Before computing the Fourier transform, thesignal was zero-padded to increase frequency resolution (30 s).
Experiment 3: critical flicker frequency
A schematic of the experiment 3 is shown in Fig. 1C and D. Thestimulus was a white LED flickering (square wave from 70 to20 Hz, 65 cd/m2) 20° right to the centre, and it was visible only bythe right eye thanks to a board positioned between the subject’snose (head fixed on a chin-rest) and the centre of the screen segre-gating the visual field of the two eyes. We asked subjects (N = 13)to adjust the frequency of the flicker with a potentiometer, untilreaching the critical flicker frequency (CFF), that is the minimumfrequency at which the light is perceived as steady instead of flicker-ing. To investigate the role of luminance viewing in determining
CFF, participants performed the task while the contralateral left eyewas dark-adapted (dark-adapted condition, DA) or light-adapted(light-adapted condition, LA) with a steady light. In this way, weassured an identical retinal adaptation of the tested eye (right eye),but different cortical excitability states for the two conditions (LA,DA). After a training, the baseline monocular CFF was computedfor each individual subject (10 trials). After the baseline recording,the left eye of the participants was patched with a NDF (1.5 LU,DA condition). A monocular CFF session recording was presentedevery 5 min. About 10 trials were acquired for each testing session;each trial lasted for 6 s during which subjects were required toadjust the flickering frequency, and the starting flickering frequencywas fixed at 70 Hz. The filter was removed from the left eye in thesubsequent light-adaptation condition (LA), and four sessions of 10trials each were recorded every 2 min from the patching removal.For this condition, six subjects additionally performed three moresessions (seven sessions). To maintain alertness, after each CFF ses-sion, the board was removed, and participants performed a reactiontime task to a black blob presented beside a movie shown in thescreen centre (2.5 9 2 deg). The RT task interleaved the CFF ses-sions and lasted for 5 and 2 min under DA and LA condition,respectively. Only data from CFF were analysed. A linear mixed-effect model analysis was conducted on the logarithm of the CFF,with subject variability modelled as a random effect, and condition(baseline, dark adaptation and light adaptation) or session as fixedeffects (model: CFF ~ condition/session + (condition/session|sub-ject)). The associated method ‘ANOVA’ returns the F-statistics andP-values for the fixed effect terms (where the degrees of freedomare assumed to be constant and equal to n-k, where n is the numberof observations and k is the number of fixed effect). For the analysison the effect of session, we contrasted each experimental sessionwith the baseline.
Results
Experiment 1: Spontaneous alpha activity
We analysed the effect of ambient luminance on resting EEG alphafor 14 participants at the POz electrode. The amplitude spectrumwas computed for both high- and low-luminance recordings(Fig. 2A). Figure 2B and D show the spontaneous IAA for the twoconditions. A two-tailed paired t-test showed that alpha amplitudewas higher at low-luminance compared to high-luminance viewingconditions (t13 = �2.36, P = 0.034). Similarly, we compared thespontaneous IAF for the two luminance conditions (Fig. 2C and E).No differences were found in spontaneous IAF for high- and low-luminance conditions (t13 = 0.17, P = 0.8).
Experiment 2: Stimulus-related alpha activity
For each participant (N = 12), we computed the echo function athigh- and low-luminance for the POz electrode (two representativesubjects are shown in Fig. 4A). Figure 3A shows the mean spectrum�1 SEM of the echo EEG, for both viewing conditions. We com-pared the echo IAA for the two luminance conditions with a two-tailed t-test, and we found that alpha amplitude was higher at high-luminance compared with low-luminance (t11 = 4.63, P < 0.001.See Fig. 3B and D). Thus, we investigated the effect of luminanceon echo IAF (Fig. 3C and E) and we found a significant shift ofabout 0.15 Hz towards higher frequencies at low-luminance com-pared with high-luminance (t11 = �2.41, P = 0.034). Takentogether, these results show that the echo function response is
© 2017 Federation of European Neuroscience Societies and John Wiley & Sons LtdEuropean Journal of Neuroscience, 48, 2599–2608
2602 A. Benedetto et al.

consistently modulated by luminance viewing condition, along bothamplitude and frequency dimensions.Thus, we investigated the luminance viewing condition effect on
the phase of the echo function. We found a strong phase oppositionbetween the echoes recorded at high- and low-luminance, maximallyexpressed at POz (Fig. 4C). To have a meaningful phase estimation,the analysis was restricted to a time window of 300 ms around thetime of the maximal stimulus-related alpha activity, from 0.25 to0.55 s (Fig. 4B). During the maximal amplitude of the echo func-tion, we confirmed a strong phase opposition (3.15 � 0.26 rad). Toverify that the phase difference was not uniformly distributed acrossall phases, we performed a Rayleigh test on the phase differencesconfirming the presence of a non-uniform phase distribution centredaround p (i.e. phase opposition, P < 0.001). Next, we asked whetherthe phase shift could be driven by a fixed physiological neuraldelay, known to be caused by luminance differences (Kammeret al., 1999). We investigated the correlation between the echo IAFsand the phase difference under different luminance viewing(Fig. 4D). A constant time delay (i.e. irrespective of the frequencyof the echo IAFs) would result in a positive correlation, while aconstant phase delay would result in a null correlation. We revealeda strong positive correlation between phase differences and echoIAFs (Pearson’s r = 0.57; P = 0.003). Additionally, we ran a partialcorrelation analysis to rule out the contribution of the different
conditions. This analysis confirmed the presence of a genuine posi-tive correlation (Pearson’s r = 0.59; P = 0.003). Taken together,these results suggest that luminance changes produced a shift in thephase of the echo function, but this shift is mainly driven by a con-stant neural delay. Note that, it was possible to perform a linearregression on circular phase data, because the measured phase dif-ferences were all comprised between p/2 and 3p/2, so there was no‘wraparound’ issue around 0 or 2p. The phase lags, when expressedin ms (taking into account the echo IAF for each subject/condition),were clustered around 46 � 10 ms, a value consistent with the pre-viously reported physiological delay of about 15 ms for each log-unit attenuation of luminance (Julesz & White, 1969; Williams &Lit, 1983), predicting here a neural delay around 40 ms.Additionally, we also investigated the induced alpha spectrum
obtained during the stimulation. Fig. 5A shows the main results ofthese analyses for high- and low-luminance conditions. We evalu-ated the correlation between echo IAA and the induced IAA(Fig. 5B). We found a positive correlation between the two indexes(Pearson’s r = 0.54; P = 0.005). The partial correlation analysis,controlling for the viewing conditions, revealed a clear positivetrend between the two indexes (Pearson’s r = 0.36; P = 0.08). Thesame comparison was run for the IAF (Fig. 5C) and revealed a sig-nificant positive correlation (Pearson’s r = 0.44; P = 0.029), con-firmed also by the partial correlation analysis (Pearson’s r = 0.45;
Fig. 2. Experiment 1: spontaneous alpha activity IAA and IAF. Main results from experiment 1. (A) Group-mean spontaneous EEG amplitude (�SEM) athigh- and low-luminance (in yellow and blue, respectively) for the electrode POz. (B) IAA group mean and SEM at high- and low-luminance. (C) IAF groupmean and SEM at high- and low-luminance. (D) IAA for single subject (dots) and group-mean (star) and for both luminance conditions. Most of the pointscluster above the equality line (dashed line) confirming a IAA difference for the two luminance conditions. (E) Scatter plot of the IAF computed at high- andlow-luminance for each participant (dots) and group mean (star). The points are distributed around the equality line (dashed line), confirming no differences inIAF for the two conditions. Asterisks (in B and C) mark the statistical significance (n.s. > 0.05 > * > 0.01).
© 2017 Federation of European Neuroscience Societies and John Wiley & Sons LtdEuropean Journal of Neuroscience, 48, 2599–2608
Distinct ongoing and stimulus-related a 2603

P = 0.029). Taken together, these results suggest that echo andinduced activity are well correlated (as expected given the intimateconnection between these two indexes), but also show some crucialdifferences in their response to luminance changes. In fact, similarlyto what was found for the phase-locked (echo) alpha, results showeda decrease in induced IAA for the low-luminance condition(t11 = 3.97; P = 0.002. Figure 5D). However, this difference wasmuch reduced, compared to the one found for the echo function.Interestingly, no difference was found regarding the induced IAF(t11 = �0.33; P = 0.74. Figure 5E). Note that, we also replicatedour analysis of the induced response (as in Fig. 5) after subtractingthe trial-averaged ERP from each trial. Consistently with the factthat the induced response has almost no phase-locked componentsafter 500 ms from stimulus onset, this subtraction did not alter theresults (control analysis is not reported in the manuscript).
Experiment 3: critical flicker frequency
We next investigated on 13 participants the potential perceptual conse-quences of the luminance-induced alpha modulations in a monocularCFF task that is suggested to be linked with EEG alpha expression(Chyatte, 1958; Kooi et al., 1958; May et al., 2014). A linear mixed-effect model on the CFF timecourse showed a significant effect of timesession (fixed effect ‘time session’ with ‘subject’ as random effect.F14,1725 = 4.4208, P < 0.001. See Fig. 6A). Contrasts between sessionand baseline revealed that the CFF in the first session of the binocularlight adaptation was the only threshold significantly different from the
baseline (P = 0.047). We next investigated the global effect of monoc-ular dark adaptation on CFF. Figure 6B shows the group-mean CFFshifts between the two conditions. The test between monocular dark-adaptation and binocular light-adaptation conditions revealed a signifi-cant difference between conditions (fixed effect ‘condition’, randomeffect ‘subject’. F2,1737 = 14.592, P < 0.001), indicating that CFF wasconsistently higher during DA compared to LA, by about 2 Hz. No dif-ferences were present between DA and baseline or LA and baseline(P > 0.05). To verify whether this difference was mainly driven by thefirst session recorded after DA (i.e. the one showing the strongesteffect), we replicated the same analysis after excluding this session.Again, the test revealed a significant difference between conditions(fixed effect ‘condition’, random effect ‘subject’. F2,1607 = 8.414,P < 0.001). Figure 6C shows an analysis run on single subjects (in-cluding the first LA session in the analysis), additionally tested with abootstrap t-test (10 000 repetitions with replacement, n = 40). Aboutnine subjects showed a statistically significant difference in CFFbetween monocular dark-adaptation and binocular light-adaptation con-ditions (P < 0.01), while four participants showed a trend in the samedirection without reaching significance (P > 0.05).
Discussion
We evaluated the influence of ambient luminance changes on thealpha dynamic characteristics. First, we investigated the effect of lumi-nance changes on the spontaneous alpha rhythm recorded during rest-ing with eyes open (experiment 1). In line with the existing literature
Fig. 3. Experiment 2: echo function IAA and IAF. (A) Group-mean echo function spectrum and SEM at high- and low-luminance (yellow and blue lines,respectively) for the POz electrode. (B) Bar plot of the echo IAA (�1 SEM) at high- and low-luminance. (C) Bar plot of the echo IAF (�1 SEM) at high- andlow-luminance. (D) Scatter plot of the echo IAA at high- and low-luminance. The points cluster below the equality line (dashed line), indicating a difference inecho IAA for the two conditions. The star indicates the group-mean IAA. (E) Scatter plot of the echo IAF across single subjects for the two luminance condi-tions. The cloud of dots scatters above the equality line, indicating that the echo IAF was higher at low-luminance. The star indicates the group-mean IAF.Asterisks (in B and C) mark the statistical significance (0.05 > * > 0.01, 0.001 > ***).
© 2017 Federation of European Neuroscience Societies and John Wiley & Sons LtdEuropean Journal of Neuroscience, 48, 2599–2608
2604 A. Benedetto et al.

(Min et al., 2013), we found that ambient luminance alters the spectralamplitude in the alpha range during resting. We found a spontaneousIAA enhancement at low-luminance compared to high-luminance,particularly visible in the upper-alpha band. Traditionally, this alphaamplitude enhancement is interpreted as a consequence of the meta-bolic deactivation of the underlying cortex at low luminance (Moos-mann et al., 2003; Brodoehl et al., 2015), reflected in a strongoccipital alpha synchronization in the EEG. Interestingly, luminancechanges produced no effects on the spontaneous IAF.Next, we investigated the stimulus-related alpha (experiment 2).
Contrary to the spontaneous alpha rhythm at rest, the phase-lockedalpha amplitude (echo IAA) was strongly attenuated in the low-luminance viewing condition. Furthermore, we found that the alpha
frequency of the phase-locked alpha (echo IAF) shifted towardshigher frequencies at low-luminance compared to high-luminanceviewing. The alpha amplitude modulation might reflect a reducedcapability of the visual system to synchronize its responses to thestimuli, due to a degradation of the signal-to-noise ratio at low lumi-nance. The frequency shift might reveal a basic adaptive strategy tobalance the reduced inflow of good quality visual information underlow luminance, with an oversampling of the visual inputs. In otherwords, when the visual inputs are reliable (i.e. under high-luminanceviewing) the system facilitates the retention of the sensory represen-tation over time; conversely, when the visual inputs are degraded(i.e. under low-luminance viewing), the system underweights its sen-sory representations and updates them more quickly, that is at a
Fig. 4. Experiment 2: echo function phase analysis. Example of echoes for two representative subjects (A) at high- and low-luminance (yellow and blue line,respectively). (B) Alpha amplitude envelope for both high-and low-luminance echoes. Dashed lines mark the temporal window of interest for the phase analysisin panels C, D, (between 0.25 and 0.55 s). (C) Group-mean phase difference (�1 SEM) between the two echo function conditions. Dashed lines mark the tem-poral window of interest for the phase analysis (shown in B). The top panel shows the grand-mean topographic representation of phase differences averagedover the temporal window of interest. Colour code represents phase differences in radians. Topography was masked (grey transparency) by the averaged ampli-tude of echo functions. (D) Scatter plot for echo phase difference as a function of echo IAF. The red line reports the linear regression model, showing a positivecorrelation between the two variables (P = 0.003), indicating the presence of a constant time delay between conditions. Dashed line shows the mean phase dif-ference.
© 2017 Federation of European Neuroscience Societies and John Wiley & Sons LtdEuropean Journal of Neuroscience, 48, 2599–2608
Distinct ongoing and stimulus-related a 2605
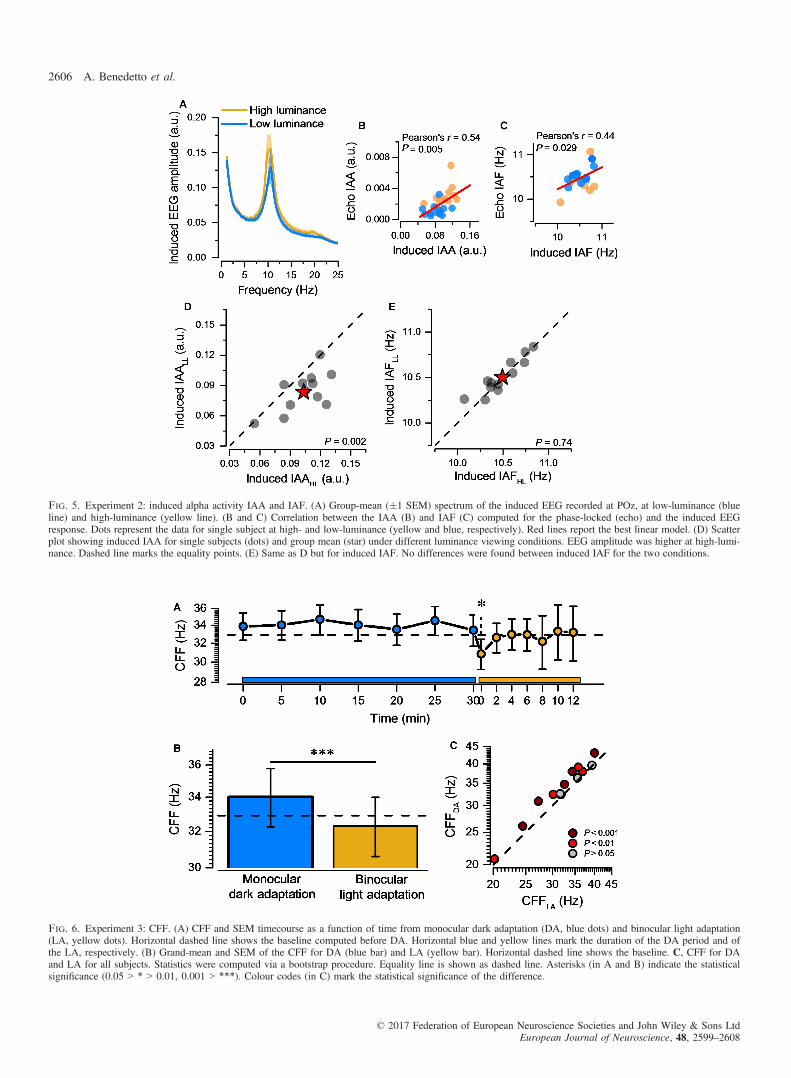
Fig. 5. Experiment 2: induced alpha activity IAA and IAF. (A) Group-mean (�1 SEM) spectrum of the induced EEG recorded at POz, at low-luminance (blueline) and high-luminance (yellow line). (B and C) Correlation between the IAA (B) and IAF (C) computed for the phase-locked (echo) and the induced EEGresponse. Dots represent the data for single subject at high- and low-luminance (yellow and blue, respectively). Red lines report the best linear model. (D) Scatterplot showing induced IAA for single subjects (dots) and group mean (star) under different luminance viewing conditions. EEG amplitude was higher at high-lumi-nance. Dashed line marks the equality points. (E) Same as D but for induced IAF. No differences were found between induced IAF for the two conditions.
Fig. 6. Experiment 3: CFF. (A) CFF and SEM timecourse as a function of time from monocular dark adaptation (DA, blue dots) and binocular light adaptation(LA, yellow dots). Horizontal dashed line shows the baseline computed before DA. Horizontal blue and yellow lines mark the duration of the DA period and ofthe LA, respectively. (B) Grand-mean and SEM of the CFF for DA (blue bar) and LA (yellow bar). Horizontal dashed line shows the baseline. C, CFF for DAand LA for all subjects. Statistics were computed via a bootstrap procedure. Equality line is shown as dashed line. Asterisks (in A and B) indicate the statisticalsignificance (0.05 > * > 0.01, 0.001 > ***). Colour codes (in C) mark the statistical significance of the difference.
© 2017 Federation of European Neuroscience Societies and John Wiley & Sons LtdEuropean Journal of Neuroscience, 48, 2599–2608
2606 A. Benedetto et al.

faster frequency. Additionally, we found a consistent phase opposi-tion between the echo functions at high- and low-luminance. It isknown that at low-luminance visual processing is slowed down anddelayed by about 15 ms for each log-unit attenuation of luminance(Julesz & White, 1969; Williams & Lit, 1983; Kammer et al.,1999), resulting in a constant delay of about 40 ms, in our experi-ment. A similar constant temporal delay in neural processing wouldgenerate a smaller phase difference for slower alpha frequencies andlarger for faster alpha frequencies, resulting in a positive correlationbetween echo IAFs and IAF phase difference. As a matter of fact,we found a positive correlation between the phase difference andthe echo IAFs, suggesting that the phase shift reported here ismainly driven by a constant neural delay.Finally, we investigated the alpha activity induced by visual stim-
ulation in experiment 2 (induced activity, see methods for details).We found that induced and echo IAFs are strongly correlated forboth high- and low-luminance conditions. Differently from whatshown here from echo IAF, induced IAF did not change acrossluminance viewing condition, while induced IAA slightly increasedat high-luminance viewing. These results contrast with that from theecho function and confirm that the echo and the induced alpha pos-sess peculiar and partially independent properties.Having found that luminance differences produce a dissociation
between spontaneous and stimulus-related alpha activity, we investi-gated possible behavioural functions linked with these different oscil-latory responses. The critical flicker frequency (CFF) is an index ofvisual temporal segmentation abilities, revealing basic aspects of ourvisual temporal resolution. It has been suggested that CFF and alphaactivities might correlate (Chyatte, 1958; Kooi et al., 1958; Mayet al., 2014); however, the majority of the reported effects are shownfor clinical populations (Karp et al., 1962; May et al., 2014), rely onsomatosensory tasks (May et al., 2014), or their results have beenquestioned (Dondero et al., 1956; Karp et al., 1962). Recent findingshave shown that the alpha frequency is crucial in determining our tem-poral segmentation abilities (Varela et al., 1981; Cecere et al., 2015;Samaha & Postle, 2015; Milton & Pleydell-Pearce, 2016), suggestinga possible link between CFF and alpha oscillations. According to thisevidence and our reported findings, we investigated here the effects ofluminance viewing condition on CFF, to determine influences ofspontaneous and phase-locked alpha activity over our visual temporalresolution. It is known that CFF is modulated by both retinal and cen-tral visual processes (Wells et al., 2001) and that binocular light adap-tation modulates the critical flicker frequency: it decreases during darkadaptation and increases in the course of light adaptation (Fedorov &Mkrticheva, 1938). Moreover, 3 h of monocular light-deprivation areknown to produce a decrease in the CFF for the non-occluded eye(Allen, 1923). Interestingly, it has also been shown that the light adap-tation of one eye can modulate the CFF of the other eye in an oppositeway (Lipkin, 1962). In his experiment, Lipkin adapted one eye with asteady light and tested the non-adapted eye. He found that an adaptingluminance on one eye progressively reduced the CFF on the contralat-eral eye. Here, we adopted a similar procedure: we dark-adapted theleft eye of the subjects for 30 min by applying a NDF patch, whiletesting the non-deprived right eye (dark adaptation, DA). Next, weremoved the patch and continued testing the right eye for 12 min(light adaptation, LA). Note that, in this way, we kept constant theretinal adaptation of the tested eye, while manipulating only theextraretinal light adaptation. In agreement with Lipkin (1962), weshowed that only 30 min of monocular dark adaptation induced a fastand transient decrease in contralateral CFF threshold that graduallydisappeared after about 12 min from adaptation. Much evidence
suggests that this phenomenon could be considered as a plasticityresponse of the primary visual cortex to luminance changes.Recently, it has been shown that dark exposure reduces tonic
inhibition in visual cortex (Huang et al., 2015) and that monoculardeprivation alters early components of visual evoked potentials aswell as producing a GABA concentration decrement in the primaryvisual cortex of adult humans (Lunghi et al., 2015a,b). Interestingly,GABA is suggested to play a key role in generating and maintainingalpha oscillations (Klimesch et al., 2007; Jensen & Mazaheri, 2010),and pharmacological GABA enhancers can reduce spontaneousalpha amplitude (Lozano-Soldevilla et al., 2014). Here, we showthat phase-locked alpha – but not spontaneous alpha activity – fitsnicely this evidence: echo alpha amplitude decreases at low-lumi-nance, while spontaneous alpha amplitude increases. Moreover, wealso found that our visual temporal resolution (once factored out theretinal contribution) matches the dynamics of phase-locked alphafrequency: it is higher under low-luminance viewing condition com-pared to high-luminance.To sum up, we show here that the luminance viewing condition
strongly impacts over our alpha expression, affecting in a peculiarway spontaneous and induced activity, as well as the EEG visualimpulse response function (echo function). Moreover, we speculatethat the visual impulse response function changes across differentluminance conditions reflect an important plasticity phenomenonimpacting brain rhythms: the visual cortex modulates its impulseresponse function depending on the luminance viewing condition,and these modulations impact on very low-level stages of visualprocessing, such as flicker perception. However, future experimentswould be needed to provide more concrete evidence for this hypoth-esis.
Conflict of interest
The authors declare no competing financial interests.
Acknowledgements
This work was supported by the European Research Council ConsolidatorGrant 614244 (P-CYCLES) to R.V., by the ERC-FP7 ECSPLAIN (grant no.338866) and by Tuscany Region Pegaso Scholarship 2013 to A.B. We thankDr. Tam Ho for proofreading the manuscript.
Author contributions
A.B. and R.V. conceived the study and designed the methodology;A.B. and D.L-S. performed the experiment; all authors performedthe analyses of the experimental data and wrote the article.
Data accessibility
The article’s supporting data and materials will be accessible on10.6084/m9.figshare.5688796
Abbreviations
CFF, critical flicker frequency; DA, dark adaptation; IAA, individual alphaamplitude; IAF, individual alpha frequency; LA, light adaptation; NDF, neu-tral density filter.
References
Allen, F. (1923) On reflex visual sensations*. J. Opt. Soc. Am., 7, 583.
© 2017 Federation of European Neuroscience Societies and John Wiley & Sons LtdEuropean Journal of Neuroscience, 48, 2599–2608
Distinct ongoing and stimulus-related a 2607

Barbur, J.L. & Stockman, A. (2010) Photopic, mesopic and scotopic visionand changes in visual performance. In Dartt, D.A, (Ed), Encyclopedia ofthe Eye. Academic Press, Oxford, pp. 323–331.
Benedetto, A., Spinelli, D. & Morrone, M.C. (2016) Rhythmic modulation ofvisual contrast discrimination triggered by action. P. Roy. Soc. B-Biol.Sci., 283, 3536–3544.
Bonnefond, M. & Jensen, O. (2012) Alpha oscillations serve to protect work-ing memory maintenance against anticipated distracters. Curr. Biol., 22,1969–1974.
Brainard, D.H. (1997) The psychophysics toolbox. Spatial Vision, 10, 433–436.
Brodoehl, S., Klingner, C.M. & Witte, O.W. (2015) Eye closure enhancesdark night perceptions. Sci. Rep., 5, 10515.
Busch, N.A., Dubois, J. & VanRullen, R. (2009) The phase of ongoing EEGoscillations predicts visual perception. J. Neurosci., 29, 7869–7876.
Cecere, R., Rees, G. & Romei, V. (2015) Individual differences in alpha fre-quency drive crossmodal illusory perception. Curr. Biol., 25, 231–235.
Chang, A.Y.-C., Schwartzman, D.J., VanRullen, R., Kanai, R. & Seth, A.K.(2017) Visual perceptual echo reflects learning of regularities in rapidluminance sequences. J. Neurosci., 37, 8486–8497.
Chyatte, C. (1958) A note on the relationship of alpha index to critical flickerfrequency. Electroen. Clin. Neuro., 10, 553–554.
David, O., Kilner, J.M. & Friston, K.J. (2006) Mechanisms of evoked andinduced responses in MEG/EEG. NeuroImage, 31, 1580–1591.
Delorme, A. & Makeig, S. (2004) EEGLAB: an open source toolbox foranalysis of single-trial EEG dynamics including independent componentanalysis. J. Neurosci. Meth., 134, 9–21.
Dondero, A., Hofstaetter, P.R. & O’Connor, P. (1956) Critical flicker fre-quency and cortical alpha. Electroen. Clin. Neuro., 8, 465–466.
Fedorov, N.T. & Mkrticheva, L. (1938) Mechanism of light flicker fusionduring the course of dark and light adaptation. Nature, 142, 750–751.
Hanslmayr, S., Klimesch, W., Sauseng, P., Gruber, W.R., Doppelmayr, M.,Freunberger, R. & Pecherstorfer, T. (2005) Visual discrimination perfor-mance is related to decreased alpha amplitude but increased phase locking.Neurosci. Lett., 375, 64–68.
Huang, S., Hokenson, K., Bandyopadhyay, S., Russek, S.J. & Kirkwood, A.(2015) Brief dark exposure reduces tonic inhibition in visual cortex. J.Neurosci., 35, 15916–15920.
Jensen, O. & Mazaheri, A. (2010) Shaping functional architecture by oscilla-tory alpha activity: gating by inhibition. Front. Hum. Neurosci., 4, 186.
Julesz, B. & White, B. (1969) Short term visual memory and the pulfrichphenomenon. Nature, 222, 639–641.
Jung, T., Makeig, S., Humphries, C., Lee, T., McKeown, M.J., Iragui, V. &Sejnowsi, T.J. (2000) Removing electroencephalographic artifacts by blindsource separation. Psychophysiology, 37, 163–178.
Kammer, T., Lehr, L. & Kirschfeld, K. (1999) Cortical visual processing istemporally dispersed by luminance in human subjects. Neurosci. Lett.,263, 133–136.
Karp, E., Pollack, M. & Fink, M. (1962) Critical flicker frequency and EEGalpha: a reliability study. Electroen. Clin. Neuro., 14, 60–63.
Klimesch, W. (1999) EEG alpha and theta oscillations reflect cognitive andmemory performance: a review and analysis. Brain Res. Rev., 29, 169–195.
Klimesch, W., Schimke, H. & Pfurtscheller, G. (1993) Alpha frequency, cog-nitive load and memory performance. Brain Topogr., 5, 241–251.
Klimesch, W., Sauseng, P. & Hanslmayr, S. (2007) EEG alpha oscillations:the inhibition–timing hypothesis. Brain Res. Rev., 53, 63–88.
Kooi, K., Boswell, R. & Thomas, M. (1958) Critical flicker frequency andEEG findings in patients with brain damage. Neurology, 8, 764–768.
Lalor, E.C., Pearlmutter, B.A., Reilly, R.B., McDarby, G. & Foxe, J.J.(2006) The VESPA: a method for the rapid estimation of a visual evokedpotential. NeuroImage, 32, 1549–1561.
Linkenkaer-Hansen, K., Nikulin, V.V., Palva, S., Ilmoniemi, R.J. & Palva,J.M. (2004) Prestimulus oscillations enhance psychophysical performancein humans. J. Neurosci., 24, 10186–10190.
Lipkin, B. (1962) Monocular flicker discrimination as a function of the lumi-nance and area of contralateral steady light I luminance. J. Opt. Soc. Am.,52, 1287–1295.
Lozano-Soldevilla, D., ter Huurne, N., Cools, R. & Jensen, O. (2014)GABAergic modulation of visual gamma and alpha oscillations and itsconsequences for working memory performance. Curr. Biol., 24, 2878–2887.
Lunghi, C., Berchicci, M., Morrone, M.C. & Di Russo, F. (2015a) Short-term monocular deprivation alters early components of visual evokedpotentials. J. Physiol., 593, 4361–4372.
Lunghi, C., Emir, U.E., Morrone, M.C. & Bridge, H. (2015b) Short-termmonocular deprivation alters GABA in the adult human visual cortex.Curr. Biol., 25, 1496–1501.
May, E.S., Butz, M., Kahlbrock, N., Brenner, M., Hoogenboom, N., Kirch-eis, G., H€aussinger, D. & Schnitzler, A. (2014) Hepatic encephalopathy isassociated with slowed and delayed stimulus-associated somatosensoryalpha activity. Clin. Neurophysiol., 125, 2427–2435.
Milton, A. & Pleydell-Pearce, C.W. (2016) The phase of pre-stimulus alphaoscillations influences the visual perception of stimulus timing. NeuroI-mage, 133, 53–61.
Min, B.-K., Jung, Y.-C., Kim, E. & Park, J.Y. (2013) Bright illuminationreduces parietal EEG alpha activity during a sustained attention task. BrainRes., 1538, 83–92.
Moosmann, M., Ritter, P., Krastel, I., Brink, A., Thees, S., Blankenburg, F.,Taskin, B., Obrig, H. et al. (2003) Correlates of alpha rhythm in func-tional magnetic resonance imaging and near infrared spectroscopy. NeuroI-mage, 20, 145–158.
Nunn, C.M.H. & Osselton, J.W. (1974) The influence of the EEG alpharhythm on the perception of visual stimuli. Psychophysiology, 11, 294–303.
Oostenveld, R., Fries, P., Maris, E. & Schoffelen, J.-M. (2011) FieldTrip:open source software for advanced analysis of MEG, EEG, andinvasive electrophysiological data. Comput. Intel. Neurosc., 2011,156869.
Peirce, J.W. (2007) PsychoPy—psychophysics software in Python. J. Neu-rosci. Meth., 162, 8–13.
Romei, V., Rihs, T., Brodbeck, V. & Thut, G. (2008) Resting electroen-cephalogram alpha-power over posterior sites indexes baseline visual cor-tex excitability. NeuroReport, 19, 203–208.
Samaha, J. & Postle, B.R. (2015) The speed of alpha-band oscillationspredicts the temporal resolution of visual perception. Curr. Biol., 25,2985–2990.
Sauseng, P., Klimesch, W., Stadler, W., Schabus, M., Doppelmayr, M.,Hanslmayr, S., Gruber, W.R. & Birbaumer, N. (2005) A shift of visualspatial attention is selectively associated with human EEG alpha activity.Eur. J. Neurosci., 22, 2917–2926.
Teikari, P., Najjar, R.P., Malkki, H., Knoblauch, K., Dumortier, D., Gronfier,C. & Cooper, H.M. (2012) An inexpensive Arduino-based LED stimulatorsystem for vision research. J. Neurosci. Meth., 211, 227–236.
Vandewalle, G., Maquet, P. & Dijk, D.-J. (2009) Light as a modulator ofcognitive brain function. Trends Cogn. Sci., 13, 429–438.
VanRullen, R. (2016) Perceptual cycles. Trends Cogn. Sci., 20, 723–735._Ilhan, B. & VanRullen, R. (2012) No counterpart of visual perceptual echoesin the auditory system. PLoS One, 7, e49287.
VanRullen, R. & Koch, C. (2003) Is perception discrete or continuous?Trends Cogn. Sci., 7, 207–213.
VanRullen, R. & Macdonald, J.S.P. (2012) Perceptual echoes at 10 Hz in thehuman brain. Curr. Biol., 22, 995–999.
Varela, F.J., Toro, A., Roy John, E. & Schwartz, E.L. (1981)Perceptual framing and cortical alpha rhythm. Neuropsychologia, 19,675–686.
Watson, A.B. & Pelli, D.G. (1983) QUEST: a Bayesian adaptive psychomet-ric method. Percept. Psychophys., 33, 113–120.
Wells, E.F., Bernstein, G.M., Scott, B.W., Bennett, P.J. & Mendelson, J.R.(2001) Critical flicker frequency responses in visual cortex. Exp. BrainRes., 139, 106–110.
Williams, J.M. & Lit, A. (1983) Luminance-dependent visual latency for theHess effect, the Pulfrich effect, and simple reaction time. Vision. Res., 23,171–179.
© 2017 Federation of European Neuroscience Societies and John Wiley & Sons LtdEuropean Journal of Neuroscience, 48, 2599–2608
2608 A. Benedetto et al.