Different Expressions of Specific Transcription Factors of ...
12
Basic and Clinical 458 November, December 2018, Volume 9, Number 6 Research Paper: Different Expressions of Specific Transcription Factors of Th1 ( T-bet ) and Th2 cells ( GATA-3 ) by Peripheral Blood Mononuclear Cells From Patients With Multiple Sclerosis Zahra Etesam 1,2 , Maryam Nemati 2,3 , Mohammad-Amin Ebrahimizadeh 2 , Hossain-Ali Ebrahimi 1 , Hossain Hajghani 2 , Tahereh Khalili 4 , Abdollah Jafarzadeh 5,6* 1. Neurology Research Center, Kerman University of Medical Sciences, Kerman, Iran. 2. Department of Immunology, Faculty of Medicine, Kerman University of Medical Sciences, Kerman, Iran. 3. Department of Hematology and Laboratory Sciences, School of Para-Medical, Kerman University of Medical Sciences, Kerman, Iran. 4. Department of Biochemistry, Faculty of Medicine, Kerman University of Medical Sciences, Kerman, Iran. 5. Molecular Medicine Research Center, Rafsanjan University of Medical Sciences, Rafsanjan, Iran. 6. Department of Immunology, School of Medical, Rafsanjan University of Medical Sciences, Rafsanjan, Iran. * Corresponding Author: Abdollah Jafarzadeh, PhD. Address: Department of Immunology, School of Medical, Rafsanjan University of Medical Sciences, Rafsanjan, Iran. Tel: +98 (34) 34339042 E-mail: [email protected] Introduction: Multiple Sclerosis (MS) is an inflammatory disorder caused by self-reactive Th1 lymphocytes, while Th2 cells may confer protection. The Th1 and Th2 cell differentiation are regulated by specific transcription factors, especially T-bet and GATA-3, respectively. This investigation aimed to measure the T-bet and GATA-3 expression by Peripheral Blood Mononuclear Cells (PBMCs) obtained from MS patients after specific and non-specific in vitro stimulation. Methods: The PBMCs were separated from 22 patients with MS and 20 healthy individuals. They were cultured at 37°C for 24 h in the absence of a stimulator or in the presence of Myelin oligodendrocyte Glycoprotein (MOG) or Phytohemagglutinin (PHA) at a concentration of 10 μg/mL. Then the T-bet and GATA-3 expression was measured by real time-PCR. Results: The T-bet expression was enhanced, while the GATA-3 expression diminished. Therefore the expression of T-bet/GATA-3 ratio diminished in not-stimulated, MOG-stimulated and PHA-stimulated PBMCs from MS patients compared with equal cultures from the healthy individuals (P<0.01, P<0.01 and P<0.01, for T-bet; P<0.03, P<0.01 and P<0.02, for GATA-3; P<0.01, P<0.001 and P<0.01 for T-bet/GATA-3 ratio, respectively). The not-stimulated, MOG- stimulated, and PHA-stimulated PBMCs from men with MS expressed higher amounts of GATA-3 than equal cells from MS women (P<0.05, P<0.05 and P<0.01, respectively). Conclusion: These results probably indicate an imbalance in Th1/Th2 cells in the level of transcription factors with a tendency toward Th1 cells in MS. The clinical utilization of the transcription factors as novel biomarkers of MS should be evaluated in further studies. Article info: Received: 10 March 2017 First Revision: 20 April 2017 Accepted: 20 July 2018 Available Online: 01 November 2018 Keywords: Multiple Sclerosis, Th1, Th2, T-bet, GATA-3 Citation: Etesam, Z., Nemati, M., Ebrahimizadeh, M. A., Ebrahimi, H. A., Hajghani, H., Khalili, T., et al. (2018). Different Expressions of Specific Transcription Factors of Th1 (T-bet) and Th2 cells (GATA-3) by Peripheral Blood Mononuclear Cells From Patients With Multiple Sclerosis. Basic and Clinical Neuroscience, 9(6), 458-469. http://dx.doi.org/10.32598/bcn.9.6.458 : http://dx.doi.org/10.32598/bcn.9.6.458 Use your device to scan and read the arcle online Funding: See Page 468 A B S T R A C T
Transcript of Different Expressions of Specific Transcription Factors of ...

Basic and Clinical
458
November, December 2018, Volume 9, Number 6
Research Paper: Different Expressions of Specific Transcription Factors of Th1 (T-bet) and Th2 cells (GATA-3) by Peripheral Blood Mononuclear Cells From Patients With Multiple SclerosisZahra Etesam1,2, Maryam Nemati2,3, Mohammad-Amin Ebrahimizadeh2, Hossain-Ali Ebrahimi1, Hossain Hajghani2, Tahereh Khalili4, Abdollah Jafarzadeh5,6*
1. Neurology Research Center, Kerman University of Medical Sciences, Kerman, Iran.2. Department of Immunology, Faculty of Medicine, Kerman University of Medical Sciences, Kerman, Iran.3. Department of Hematology and Laboratory Sciences, School of Para-Medical, Kerman University of Medical Sciences, Kerman, Iran.4. Department of Biochemistry, Faculty of Medicine, Kerman University of Medical Sciences, Kerman, Iran.5. Molecular Medicine Research Center, Rafsanjan University of Medical Sciences, Rafsanjan, Iran.6. Department of Immunology, School of Medical, Rafsanjan University of Medical Sciences, Rafsanjan, Iran.
* Corresponding Author: Abdollah Jafarzadeh, PhD.Address: Department of Immunology, School of Medical, Rafsanjan University of Medical Sciences, Rafsanjan, Iran.Tel: +98 (34) 34339042E-mail: [email protected]
Introduction: Multiple Sclerosis (MS) is an inflammatory disorder caused by self-reactive Th1 lymphocytes, while Th2 cells may confer protection. The Th1 and Th2 cell differentiation are regulated by specific transcription factors, especially T-bet and GATA-3, respectively. This investigation aimed to measure the T-bet and GATA-3 expression by Peripheral Blood Mononuclear Cells (PBMCs) obtained from MS patients after specific and non-specific in vitro stimulation.
Methods: The PBMCs were separated from 22 patients with MS and 20 healthy individuals. They were cultured at 37°C for 24 h in the absence of a stimulator or in the presence of Myelin oligodendrocyte Glycoprotein (MOG) or Phytohemagglutinin (PHA) at a concentration of 10 μg/mL. Then the T-bet and GATA-3 expression was measured by real time-PCR.
Results: The T-bet expression was enhanced, while the GATA-3 expression diminished. Therefore the expression of T-bet/GATA-3 ratio diminished in not-stimulated, MOG-stimulated and PHA-stimulated PBMCs from MS patients compared with equal cultures from the healthy individuals (P<0.01, P<0.01 and P<0.01, for T-bet; P<0.03, P<0.01 and P<0.02, for GATA-3; P<0.01, P<0.001 and P<0.01 for T-bet/GATA-3 ratio, respectively). The not-stimulated, MOG-stimulated, and PHA-stimulated PBMCs from men with MS expressed higher amounts of GATA-3 than equal cells from MS women (P<0.05, P<0.05 and P<0.01, respectively).
Conclusion: These results probably indicate an imbalance in Th1/Th2 cells in the level of transcription factors with a tendency toward Th1 cells in MS. The clinical utilization of the transcription factors as novel biomarkers of MS should be evaluated in further studies.
Article info:Received: 10 March 2017First Revision: 20 April 2017Accepted: 20 July 2018Available Online: 01 November 2018
Keywords:Multiple Sclerosis, Th1, Th2, T-bet, GATA-3
Citation: Etesam, Z., Nemati, M., Ebrahimizadeh, M. A., Ebrahimi, H. A., Hajghani, H., Khalili, T., et al. (2018). Different Expressions of Specific Transcription Factors of Th1 (T-bet) and Th2 cells (GATA-3) by Peripheral Blood Mononuclear Cells From Patients With Multiple Sclerosis. Basic and Clinical Neuroscience, 9(6), 458-469. http://dx.doi.org/10.32598/bcn.9.6.458
: : http://dx.doi.org/10.32598/bcn.9.6.458
Use your device to scan and read the article online
Funding: See Page 468
A B S T R A C T

Basic and Clinical
459
November, December 2018, Volume 9, Number 6
Etesam, Z., et al. (2018). Th1- and Th2-related major transcription factors in MS. BCN, 9(6), 458-469.
1. Introduction
ultiple Sclerosis (MS) results in the de-myelination of neurons within the brain and spinal cord due to inflammatory and autoimmune reactions (Mahad Trapp & Lassmann, 2015). Its prevalence is re-
ported as 57.5 per 100000 people in Kerman City, Iran (Ebrahimi & Sedighi, 2013). The MS-related pathologi-cal events are mainly attributed to the activation of au-toreactive CD4+ T helper (Th) cells (Kostic, Stojanovic, Marjanovic, Zivkovic, & Cvetanovic, 2015). Function-ally, the effector CD4+ T-cells are classified into sev-eral subgroups such as Th1, Th2, Th17, or regulatory T (Treg) cells differentiated from naive T-cells after anti-genic recognition in the presence of particular cytokines (Raphael, Nalawade, Eagar, & Forsthuber, 2015).
The Interferon (IFN)-γ-secreting Th1 cells and Inter-leukin (IL)-17-producing Th17 cells are involved in the MS- and experimental autoimmune encephalomyelitis (EAE)-related pathological events (Etesam et al., 2016; Jafarzadeh et al., 2015a; Raphael et al., 2015). Treg cell-related cytokines (Transforming growth factor β, IL-10, and IL-35) are associated with a reduction of Central Ner-vous System (CNS) inflammation and improvement of MS and EAE symptoms (Jafarzadeh et al., 2017; Jafar-zadeh et al., 2015b; Raphael et al., 2015). The contradic-tory roles were attributed to Th2 cells, which secrete high amounts of IL-4, IL-5, and IL-13 (Raphael et al., 2015).
Elevated amounts of CCL20 (a Th17-linked chemo-kine) and diminished amounts of CCL22 (a Th2/Treg-linked chemokine) were observed in patients with MS (Jafarzadeh et al., 2014a; Jafarzadeh et al., 2014b). El-
Highlights
1. Multiple Sclerosis (MS) is an inflammatory disorder caused by self-reactive Th1 lymphocytes, while Th2 cells may confer protection.
2. The Th1 and Th2 cell differentiation are regulated by specific transcription factors, especially T-bet and GATA-3, respectively.
3. We measured the T-bet and GATA-3 expression by Peripheral Blood Mononuclear Cells (PBMCs) obtained from MS patients.
4. The T-bet expression was enhanced, while the GATA-3 expression weakened.
5. The expression of T-bet/GATA-3 ratio was lower in not-stimulated, MOG-stimulated and PHA-stimulated PBMCs from MS patients compared with equal cultures from the healthy individuals.
6. The not-stimulated, MOG-stimulated, and PHA-stimulated PBMCs from men with MS expressed higher amounts of GATA-3 than the same cells from MS women.
7. These results probably indicate an imbalance in Th1/Th2 cells in the level of transcription factors with a tendency toward Th1 cells in MS.
Plain Language Summary
Multiple Sclerosis (MS) is an inflammatory disorder caused by self-reactive Th1 lymphocytes, while Th2 cells may con-fer protection. This research aimed to measure the T-bet and GATA-3 expression by Peripheral Blood Mononuclear Cells (PBMCs) obtained from MS patients. The PBMCs were separated from 22 patients with MS and 20 healthy individuals. The T-bet expression was enhanced, while the GATA-3 expression weakened. Therefore the expression of T-bet/GATA-3 ratio diminished in not-stimulated, MOG-stimulated and PHA-stimulated PBMCs from MS patients compared with equal cultures from the healthy individuals. The not-stimulated, MOG-stimulated, and PHA-stimulated PBMCs from men with MS expressed higher amounts of GATA-3 than equal cells from MS women. These results probably indicate an imbalance in Th1/Th2 cells in the level of transcription factors with a tendency toward Th1 cells in MS. The clinical implication of the transcription factors as novel biomarkers of MS should be evaluated in further studies.
M
Basic and Clinical
460
November, December 2018, Volume 9, Number 6
evated expression of IL-33 (a Th2-linked cytokine) was also observed in MS and EAE diseases (Jafarzadeh et al., 2016; Jafarzadeh et al., 2014c).
The specific cellular transcription factors of T-bet and GATA-3 control the effector Th1 and Th2 cell differentia-tion from naïve T-lymphocytes, respectively (Zhang et al., 2014b). IFN-γ and IL-12 cause Th1 cell differentia-tion via activating STAT-1 (signal transducer and activa-tor of transcription-1) and STAT-4 (Zhang et al., 2014b). Both STAT-1 and STAT-4 cause T-bet (T box expressed in T-cells) expression, which operate as a Th1 cell-relat-ed major transcription factor. T-bet induces IFN-γ pro-duction, which also reinforces the Th1 cell polarization (Zhang et al., 2014b). IFN-γ-producing Th1 cells medi-ate the cellular immunity that performs a major role in defense against intracellular pathogens and is also in-volved in the pathological process of some autoimmune disorders (Zhang et al., 2014a).
IL-4 (initially synthesized by mast cells and basophils) induces Th2 cell differentiation via activating STAT-6 (Na et al., 2016). STAT-6 causes the GATA-3 (GATA binding protein 3) expression, which operates as a Th2 cell-related major transcription factor (Na et al., 2016). GATA-3 induces the IL-4, IL-5, and IL-13 production providing a self-reinforcing feedback loop (Zhang et al., 2014b). Th2 cells mediate the humoral immune respons-es, which play a crucial role in defending extracellular infectious agents and are also involved in the pathogen-esis of a number of autoimmune diseases (Na, Cho, & Chung, 2016; Zhang et al., 2014a).
It is noteworthy that the Th1/Th2 cells functionally an-tagonize each other. For instance, the T-bet production is suppressed by STAT-6, whereas GATA-3 synthesis is directly inhibited by T-bet (Evans & Jenner, 2013). The development of a number of immunopathological responses are attributed to the imbalance between Th1 and Th2 cell activation (Zhang et al., 2014a). The deter-mination of the T-bet/GATA-3 ratio may be more reliable than the assessment of a single Th1 or Th2 cell-linked parameter regarding the determination of Th1/Th2 cell balance (Lin et al., 2015). Thus, studying the Th1/Th2 cell balance at the level of their transcription factors re-veals more important information.
There are a number of reports on the patients with MS or on EAE models concerning the determination of some transcription factors (Edstrom et al., 2011; Martinez et al., 2014); however, there are no data about the assessment of these elements in PBMCs from patients with MS fol-lowing specific and non-specific stimulations. Thus, the
current study aimed at determining the gene expression of T-bet and GATA-3 and their ratio by PBMCs obtained from newly-diagnosed patients with MS following the in vitro stimulation with Myelin Oligodendrocyte Glyco-protein (MOG), Phytohemagglutinin (PHA), or without stimulation to identify any associations.
2. Methods
2.1. Subjects
The participants were 22 newly-diagnosed patients with MS (8 men and 14 women) and 20 healthy indi-viduals (8 men and 12 women). The patients were admit-ted to the MS Center of Shephah Hospital affiliated to Kerman University of Medical Sciences (Kerman, Iran) and expressed RRMS (Relapsing-remitting MS) pattern of the disease. The McDonald’s criteria (McDonald et al., 2001) using clinical and paraclinical findings (MRI observations, oligoclonal bands in Cerebral Spinal Fluid (CSF) and evoked potentials) were employed to diag-nose MS.
The healthy individuals were recruited among the blood donors of the local Kerman Blood Transfusion Center, and matched to the patients regarding gender and age. The healthy individuals were in good health condi-tions, without medical history of CNS related diseases, recurrent infections, immunological disorders, malig-nancy, asthma, allergy and or atopic diseases. History of using medication, smoking, operation, and severe trauma within six months prior to blood collection were among other exclusion criteria. A sample of peripheral blood (5 mL) was collected from each participant and their PMBCs were isolated for more analysis.
2.2. In vitro stimulation of PBMCs
A gradient centrifugation method over the LymphoSep (Biosera, UK) was employed to isolate PBMCs from the heparinized peripheral blood. The PBMCs layer was carefully harvested and washed three times with Roswell Park Memorial Institute (RPMI)-1640 medium. Then, the PBMCs were again suspended in the supplemented-RPMI-1640 medium (a medium contained 10% heat in-activated fetal bovine serum [Gibco Life Technologies Ltd, Paisley, UK], 100 U/mL of penicillin, and 100 μg/mL of streptomycin).
The PBMCs were then dispensed in the 24-well sterile flat-bottomed microtiter plates (1×10⁶ cell/well) and cul-tured (at 37°C in a 5% CO2 incubator for 24 hours) in the absence of a stimulator, in the presence of MOG (35-
Etesam, Z., et al. (2018). Th1- and Th2-related major transcription factors in MS. BCN, 9(6), 458-469.

Basic and Clinical
461
November, December 2018, Volume 9, Number 6
55) human (Anaspec, USA) or PHA (Gibco Life Tech-nologies Ltd, Paisley, UK) at a concentration of 10 μg/mL. After this time, the total RNA was extracted from the PBMCs for more analyses.
2.3. RNA extraction, reverse transcription, and quantitative real-time PCR
The Trizol reagent (Bionner, Korea) was used to ex-tract the total RNA from cultured PBMCs. Then, the extracted RNA was treated with DNase I (Thermo Sci-entific, EU) to eliminate the possible contamination with genomic DNA. The purity of the extracted RNA was as-sessed by electrophoresis on the agarose gel (pretreated with ethidium bromide) along with the calculation of 260/280 absorption ratio by a spectrophotometer system.
The conversion of the extracted RNA into complemen-tary DNA (cDNA) was performed using a cDNA syn-thesis kit (Bionner, Korea), which contained both oligo (dT) and random hexamer primers. The T-bet and GATA-3 expression was estimated using a real-time Polymerase Chain Reaction (PCR) technique. The β-actin gene was also employed as an internal control. The employed prim-ers were purchased from Bionner Company (Korea).
Real-time PCR procedure was performed using a real-time PCR system (Applied Biosystems, USA) in a trip-licate manner using a SYBR green master mix (Bion-ner, Korea) combined with 2 µL of appropriate primers (Table 1) and 200 ng of template cDNA. The protocol of reverse transcription was an initial heating at 95°C for 15 minutes (in the absence of reverse transcriptase enzyme), -20°C for 60 seconds (cooling phase), adding reverse transcriptase, 40 consecutive cycles of 95°C for 30 seconds and 60°C for 30 seconds, and a final 72°C for 30 seconds.
The β-actin gene, as a housekeeping gene, was em-ployed to normalize the amplified T-bet and GATA-3 genes. The amounts of the T-bet and GATA-3 expression in the PBMCs were calculated by the 2-∆∆Ct formula. The Applied Biosystems software version 1.1.308.111 (USA) was also employed to analyze the melting curves and the quantitative assessment of the data. The PCR products were also visualized on a 1% agarose gel (containing 0.5 mg/mL ethidium bromide) following electrophoresis.
2.4. Statistical analysis
The results were expressed as Mean±SEM. The com-parison of the variables was performed using appropri-ate statistical tests including ANOVA, t test, the Kruskal-Wallis, and the Mann-Whitney U test. P values less than 0.05 were also considered significant.
3. Results
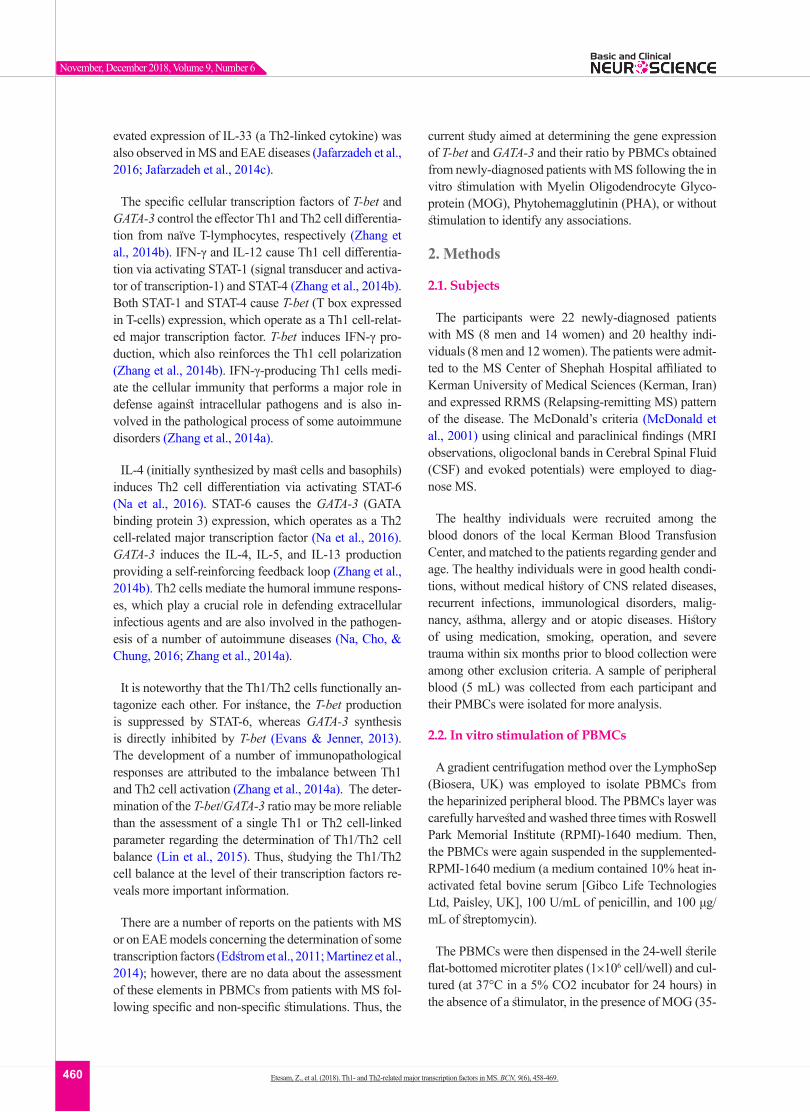
The demographic and baseline characteristics of par-ticipants are presented in Table 2. The differences of the age and gender ratio between the MS and healthy groups were not significant (P=0.79 and P=0.80, respectively).
3.1. The T-bet and GATA-3 expression in healthy individuals and patients with MS
The PHA-stimulated PBMCs from both healthy con-trol and MS groups expressed higher amounts of T-bet, GATA-3, and T-bet/GATA-3 ratio when compared with those of non-stimulated cultures (P<0.01, P<0.05, and P<0.05, respectively) (Table 3). The MOG-stimulated PBMCs of patients with MS expressed higher levels of T-bet as compared with those of non-stimulated cultures (P<0.05) (Table 3). In healthy individuals, the T-bet ex-pression in MOG-stimulated PBMCs was also higher than that of non-stimulated cultures, but the difference was not significant.
Table 1. The sequence of primers used to assess T-bet and GATA-3 expression by PBMCs in the MS and control groups
PrimerGene
F: 5-GGGAAACGGATGAAGGACTGAGA-3T-bet
R: 5-TTAGGGCAGAGGATGGGGCAA-3
F: 5-TCATTAAGCCCAAGCGAAGG-3GATA-3
R: 5-GTCCCCATTGGCATTCCT-3
F: 5-GCATGGGTCAGAAGGATTC-3β-Actin
R: 5-GTCCCAGTTGGTGACGAT-3
Etesam, Z., et al. (2018). Th1- and Th2-related major transcription factors in MS. BCN, 9(6), 458-469.
Basic and Clinical
462
November, December 2018, Volume 9, Number 6
In healthy individuals, the MOG-stimulated GATA-3 expression in PBMCs was significantly enhanced in comparison with that of non-stimulated cultures (P<0.01). However, the GATA-3 expression did not show significant difference between MOG-stimulated and non-stimulated PBMCs of patients with MS (Table 3). In the
healthy control group and patients with MS, the differ-ences in the expression of T-bet/GATA-3 ratio between MOG-stimulated and non-stimulated PBMC were not statistically significant, although, this ratio was higher in MOG-stimulated PBMCs (Table 3).
Table 2. Demographic and baseline characteristics of the study participants
CharacteristicsGroup
MS (n=22) Control (n=20)
Age (Mean±SD, y) 35.56±11.16 36.45±11.73
GenderMale 8(36.37%) 8(40.00%)
Female 14(63.63%) 12(60.00%)
Medications 0 0
Current smoking 0 0
Disabling symptoms
Muscle weakness 14(63.63%) 0
Muscle spasm 5(22.72%) 0
Ocular problems 6(27.27%) 0
Urinary incontinence 6(27.27%) 0
Fatigue 5(22.72%) 0
Lack of balance 6(27.27%) 0
Dysarthria 3(13.63%) 0
Headache 4(18.18%) 0
Etesam, Z., et al. (2018). Th1- and Th2-related major transcription factors in MS. BCN, 9(6), 458-469.
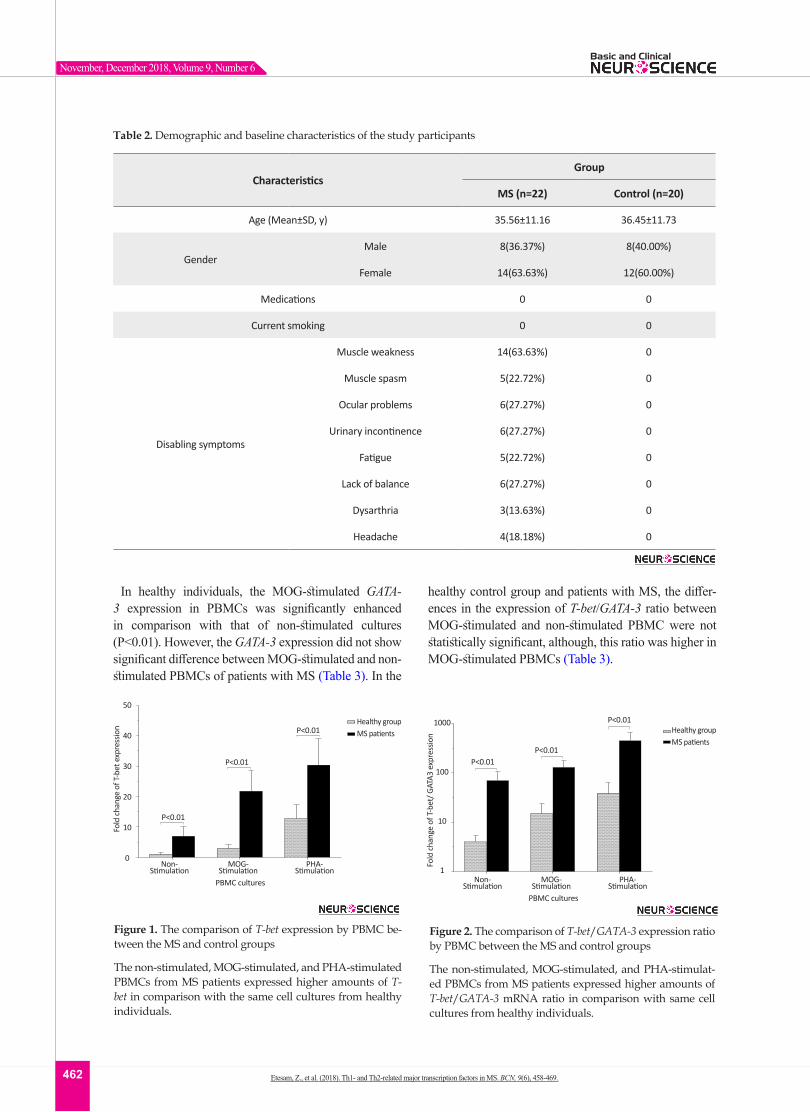
Figure 1. The comparison of T-bet expression by PBMC be-tween the MS and control groups
The non-stimulated, MOG-stimulated, and PHA-stimulated PBMCs from MS patients expressed higher amounts of T-bet in comparison with the same cell cultures from healthy individuals.
P B M C c u ltu r e s
Fo
ld c
ha
ng
e o
f T
-be
t e
xp
re
ssio
n
N o n - s t im u la t io n
M O G - s t im u la t io n
P H A - s t im u la t io n
0
10
20
30
40
50
M S p a tie n ts
H e a lth y g ro u p
P < 0 .0 1
P < 0 .0 1
P < 0 .0 1
Fold
chan
ge o
f T-b
et e
xpre
ssio
n
50
40
30
20
10
0Non-
StimulationMOG-
StimulationPHA-
StimulationPBMC cultures
Healthy groupMS patients
P<0.01
P<0.01
P<0.01
Figure 2. The comparison of T-bet/GATA-3 expression ratio by PBMC between the MS and control groups
The non-stimulated, MOG-stimulated, and PHA-stimulat-ed PBMCs from MS patients expressed higher amounts of T-bet/GATA-3 mRNA ratio in comparison with same cell cultures from healthy individuals.
P B M C c u ltu r e s
Fo
ld c
ha
ng
e o
f T
be
t /
GA
TA
3 e
xp
re
ssio
n
N o n - s t im u la t io n
M O G - s t im u la t io n
P H A - s t im u la t io n
1
10
100
1000
H e a lth y g ro u p
M S p a tie n ts
P < 0 .0 1
P < 0 .0 1
P < 0 .0 0 1
Fold
chan
ge o
f T-b
et/ G
ATA3
exp
ress
ion
1000
100
10
1Non-
StimulationMOG-
StimulationPHA-
StimulationPBMC cultures
Healthy groupMS patients
P<0.01P<0.01
P<0.01

Basic and Clinical
463
November, December 2018, Volume 9, Number 6
Table 3. The T-bet, GATA-3, and T-bet/GATA-3 expression ratio by PBMC in the MS and control groups
Group StimulatedPBMCs Gender T-bet Expression GATA-3 Expression T-bet/GATA-3
mRNA Ratio
Control
Without stimulation
Male 0.65±0.29 1.30±0.61 4.50±3.51
Female 1.22±0.66 0.81±0.33 3.66±1.18
Total 0.43 1.00±0.31 3.97±1.43
MOG
Male 0.90±0.62 5.88±2.70 17.41±15.92
Female 4.24±2.21 5.12±2.14 13.64±11.78
Total 2.94±1.40 5.42±1.63 15.10±9.21
PHA
Male 15.15±8.48 18.78±11.95 24.49±15.26
Female 10.95±6.70 6.16±3.55 48.65±42.63
Total 12.72±4.65 11.21±5.24 39.26±26.33
MS
Withoutstimulation
Male 4.78±3.43 0.52±0.46 40.21±37.50
Female 8.30±4.79 0.05±0.008 88.17±54.59
Total 6.89±3.09 0.24±0.18 70.18±35.94
MOG
Male 22.62±14.07 1.29±0.83 33.83±24.01
Female 21.23±7.70 0.38±0.20 188.93±71.26
Total 21.72±6.80 0.67±0.30 130.77±48.49
PHA
Male 25.81±13.68 6.69±3.55 100.01±55.99
Female 32.74±11.49 1.05±0.59 718.09±371.90
Total 30.32±8.69 2.75±1.23 453.20±225.77
Etesam, Z., et al. (2018). Th1- and Th2-related major transcription factors in MS. BCN, 9(6), 458-469.
Figure 3. The comparison of GATA-3 expression by PBMC between the MS and control groups
The non-stimulated, MOG-simulated, and PHA-stimulat-ed PBMCs from MS patients expressed lower amounts of GATA-3 in comparison with same cell cultures from healthy individuals.
P B M C c u ltu r e s
Fo
ld c
ha
ng
e o
f G
AT
A3
ex
pre
ssio
n
N o n - s t im u la t io n
M O G - s t im u la t io n
P H A - s t im u la t io n
0
5
10
15
20
H e a lth y g ro u p
M S p a tie n ts
P < 0 .0 3
P < 0 .0 1
P < 0 .0 2
Fold
chan
ge o
f GAT
A3 e
xpre
ssio
n
20
15
10
5
0Non-
StimulationMOG-
StimulationPHA-
StimulationPBMC cultures
Healthy groupMS patients
P<0.03
P<0.01
P<0.02
Figure 4. The comparison of T-bet expression by PBMC be-tween healthy males and male patients with MS
The expression of T-bet in non-stimulated and MOG-stim-ulated PBMCs from MS male patients were significantly higher than that of the same cultures from the healthy males (P<0.05 and P<0.004, respectively).
P B M C c u ltu r e s
Fo
ld c
ha
ng
e o
f T
-be
t e
xp
re
ssio
n
N o n - s t im u la t io n
M O G - s t im u la t io n
P H A - s t im u la t io n
0
10
20
30
40
50H e a lth y g ro u p
M S p a tie n ts
P < 0 .0 5
P < 0 .0 0 4
P = 0 .3 9
Non-Stimulation
MOG-Stimulation
PHA-Stimulation
PBMC cultures
Healthy groupMS patients
50
40
30
20
10
0
Fold
chan
ge o
f T-b
et e
xpre
ssio
n
P<0.05
P<0.004P=0.39

Basic and Clinical
464
November, December 2018, Volume 9, Number 6
The T-bet expression and the T-bet/GATA-3 ratio in PBMCs of patients with MS were higher than those of the counterpart cell cultures of the healthy individuals after stimulation with MOG, after stimulation with PHA, or in the absence of a stimulator (P<0.01, P<0.01, and P<0.01 for T-bet; P<0.01, P<0.001, and P<0.01 for T-bet/GATA-3 ratio, respectively) (Figures 1 and 2). However, the PBMCs of patients with MS expressed lower levels of GATA3 after stimulation with MOG, after stimulation with PHA, or in the absence of a stimulator, than those
of the equivalent cell cultures of the healthy individuals (P<0.03, P<0.01, and P<0.02, respectively) (Figure 3).
3.2. The T-bet and GATA-3 expression according to the gender of participants
The T-bet and GATA-3 expression and the T-bet/GATA-3 expression ratio in the control and MS groups, accord-ing to gender are summarized in Table 3. The males with MS exhibited higher T-bet expression in non-stimulated and MOG-stimulated PBMCs (P<0.05 and P<0.004, respectively), higher T-bet/GATA-3 expression ratio in
Etesam, Z., et al. (2018). Th1- and Th2-related major transcription factors in MS. BCN, 9(6), 458-469.
Figure 5. The comparison of T-bet/GATA-3 mRNA ratio by PBMC between healthy men and male patients with MS
The T-bet/GATA-3 expression ratio in non-stimulated PBMCs from male patients with MS was significantly higher than that of the same culture from the healthy males. The T-bet/GATA-3 expression ratio in MOG-stimulated PBMCs from male patients with MS was higher than that of the same culture from healthy males (P=0.07).
P B M C c u ltu r e s
Fo
ld c
ha
ng
e o
f T
be
t /
GA
TA
3 e
xp
re
ssio
n
N o n - s t im u la t io n
M O G - s t im u la t io n
P H A - s t im u la t io n
0
50
100
150
200H e a lth y g ro u p
M S p a tie n ts
P < 0 .0 5
P = 0 .0 7
P = 0 .2 7
Fold
chan
ge o
f T-b
et/ G
ATA3
exp
ress
ion
200
150
100
50
0Non-
StimulationMOG-
StimulationPHA-
StimulationPBMC cultures
P<0.05
P=0.07
P=0.27
Healthy groupMS patients
Figure 6. The comparison of GATA-3 expression by PBMCs between healthy males and male patients with MS
The GATA-3 expression in MOG-stimulated PBMCs from males with MS was significantly lower than that of the same culture from healthy males. The GATA-3 expression in non-stimulated and PHA-stimulated PBMCs from male patients with MS was lower than that of the same cultures from the healthy males, but the differences were insignificant.
P B M C c u ltu r e s
Fo
ld c
ha
ng
e o
f G
AT
A3
ex
pre
ssio
n
N o n - s t im u la t io n
M O G - s t im u la t io n
P H A - s t im u la t io n
0
10
20
30
40H e a lth y g ro u p
M S p a tie n ts
P = 0 .2 2
P < 0 .0 5
P = 0 .3 6
40
30
20
10
0Non-
StimulationMOG-
StimulationPHA-
StimulationPBMC cultures
P=0.22
P<0.05
P=0.36
Healthy groupMS patients
Fold
chan
ge o
f GAT
A3 e
xpre
ssio
n
Figure 7. The comparison of T-bet expression by PBMCs be-tween healthy females and female patients with MS
The expression of T-bet in non-stimulated, MOG-stimulated, and PHA-stimulated PBMCs from female patients with MS was significantly higher than that of the same cell cultures from the healthy females.
P B M C c u ltu r e s
Fo
ld c
ha
ng
e o
f T
-be
t e
xp
re
ssio
n
N o n - s t im u la t io n
M O G - s t im u la t io n
P H A - s t im u la t io n
0
10
20
30
40
50H e a lth y g ro u p
M S p a tie n ts
P < 0 .0 5
P < 0 .0 1
P < 0 .0 0 1
Non-Stimulation
MOG-Stimulation
PHA-Stimulation
PBMC cultures
P<0.05
P<0.01
P<0.001 Healthy groupMS patients
50
40
30
20
10
0
Fold
chan
ge o
f T-b
et e
xpre
ssio
n
Figure 8. The comparison of T-bet/GATA-3 mRNA Ratio by PBMCs between healthy females and female patients with MS
The T-bet/GATA-3 expression ratio in non-stimulated, MOG-stimulated, and PHA-stimulated PBMCs from female patients with MS was significantly higher than that of the same cell cultures from the healthy females.
P B M C c u ltu r e s
Fo
ld c
ha
ng
e o
f T
bet
/ G
AT
A3
ex
pre
ssio
n
N o n - s t im u la t io n
M O G - s t im u la t io n
P H A - s t im u la t io n
0
500
1000
1500H e a lth y g ro u p
M S p a tie n ts
P < 0 .0 2
P < 0 .0 1
P < 0 .0 1
Non-Stimulation
MOG-Stimulation
PHA-Stimulation
PBMC cultures
1500
1000
500
0Fold
chan
ge o
f T-b
et/ G
ATA3
exp
ress
ion
Healthy groupMS patients
P<0.02P<0.01
P<0.01

Basic and Clinical
465
November, December 2018, Volume 9, Number 6
non-stimulated PBMCs (P<0.05), lower GATA-3 expres-sion in MOG-stimulated PBMCs (P<0.05) in compari-son with counterpart cultures from healthy subjects with the same gender (Figures 4, 5, and 6).
The females with MS also exhibited higher T-bet ex-pression, higher T-bet/GATA-3 expression ratio, and lower GATA-3 expression in non-stimulated, MOG-stimulated, and PHA-stimulated PBMCs in comparison with equal cell cultures from healthy individuals with the same gender (P<0.05, P<0.01, and P<0.001 for T-bet; P<0.02, P<0.01, and P<0.01 for T-bet/GATA-3 ratio; P<0.05, P<0.01, and P<0.001 for GATA-3, respectively) (Figures 7, 8, and 9).
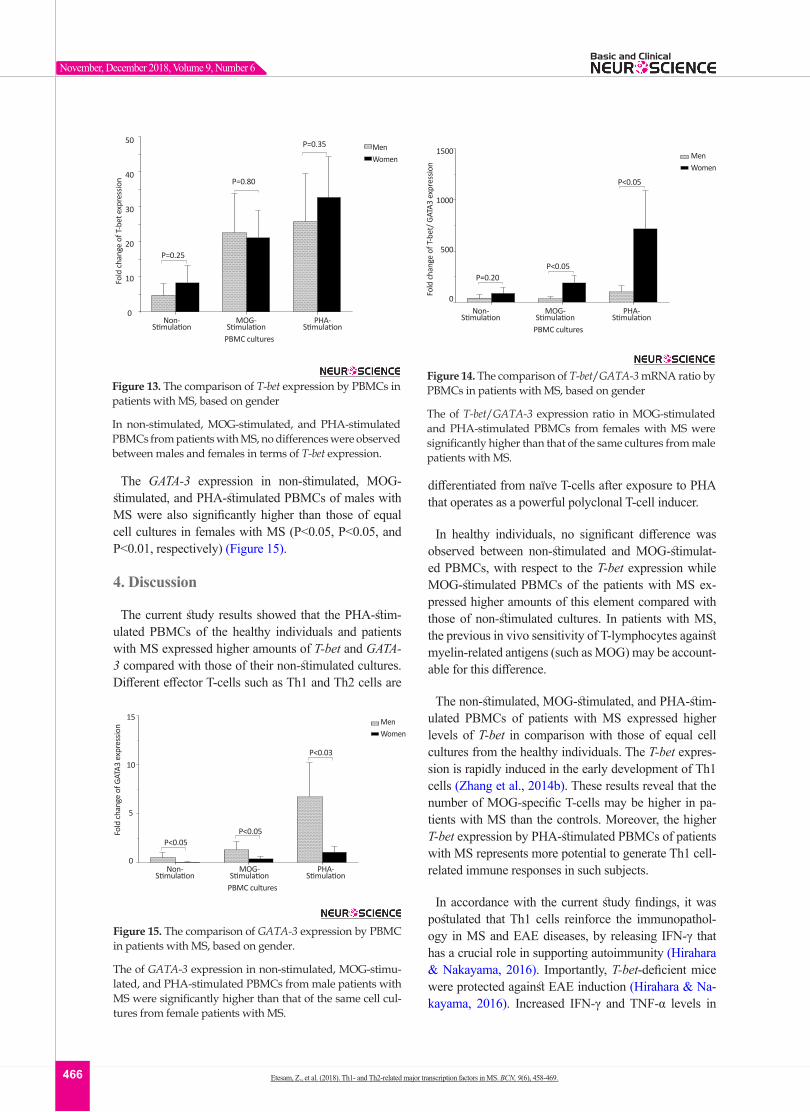
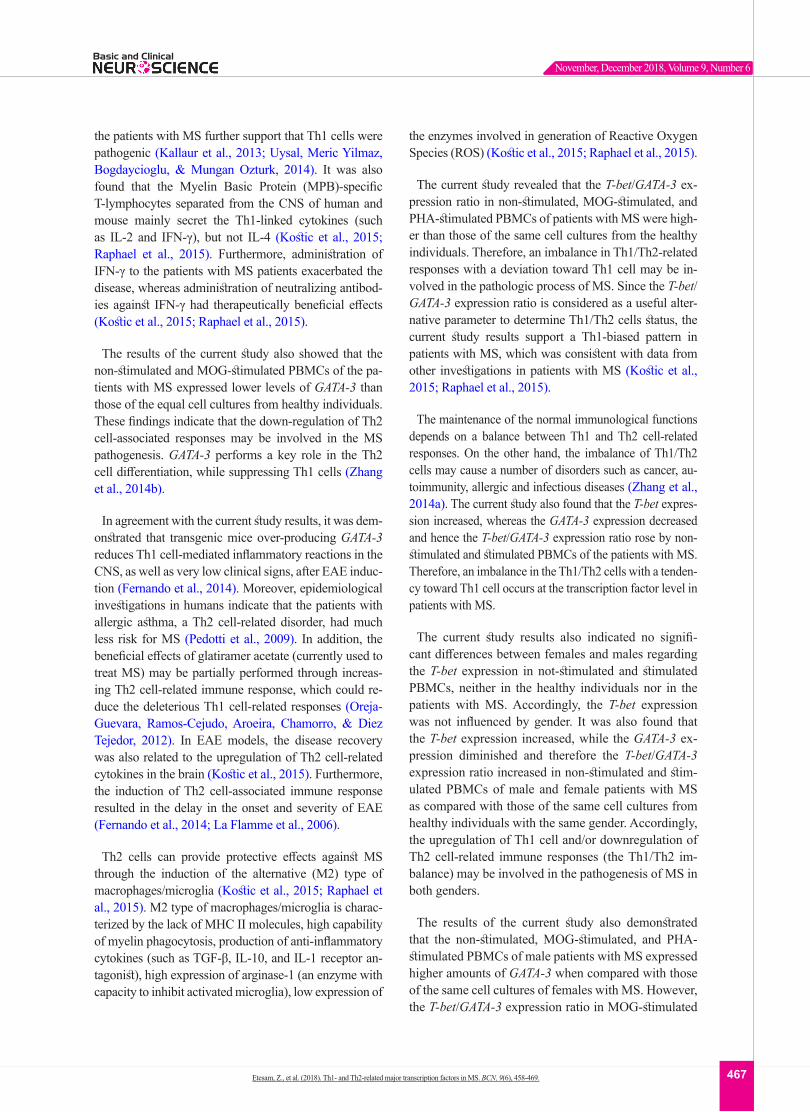
In healthy individuals, the T-bet and GATA-3 expres-sion, and the bet/GATA-3 expression ratio did not sig-nificantly differ between males and females in the three cultures, including non-stimulated, MOG-stimulated, and PHA-stimulated PBMCs (Figures 10, 11, and 12). No significant differences were observed between male and female patients with MS concerning the T-bet ex-pression by non-stimulated, MOG-stimulated, and PHA-stimulated PBMCs, although this parameter was higher in females than males (Figure 13). However, the T-bet/GATA-3 expression ratio in MOG-stimulated and PHA-stimulated PBMCs of females with MS were significant-ly higher than those of the equivalent cultures from males with MS (P<0.05 and P<0.05, respectively) (Figure 14).
Etesam, Z., et al. (2018). Th1- and Th2-related major transcription factors in MS. BCN, 9(6), 458-469.
Figure 10. The Comparison of T-bet expression by PBMCs in healthy individuals, based on gender
In non-stimulated, MOG-stimulated, and PHA-stimulated PBMCs, no significant differences were observed between healthy males and females in terms of T-bet expression.
P B M C c u ltu r e s
Fo
ld c
ha
ng
e o
f T
-be
t e
xp
re
ssio
n
N o n - s t im u la t io n
M O G - s t im u la t io n
P H A - s t im u la t io n
0
5
10
15
20
25M e n
W o m e n
P = 0 .4 4
P = 0 .1 7
P = 0 .6 0
Non-Stimulation
MOG-Stimulation
PHA-Stimulation
PBMC cultures
25
20
15
10
5
0
Fold
chan
ge o
f T-b
et e
xpre
ssio
n
Men Women
Figure 9. The comparison of GATA-3 expression by PBMCs between healthy females and female patients with MS
The GATA-3 expression in non-stimulated, MOG-stimulat-ed and PHA-stimulated PBMCs from MS female patients was significantly lower than that of the same cell cultures from the healthy females.
P B M C c u ltu r e s
Fo
ld c
ha
ng
e o
f G
AT
A3
ex
pre
ssio
n
N o n - s t im u la t io n
M O G - s t im u la t io n
P H A - s t im u la t io n
0
5
10
15H e a lth y g ro u p
M S p a tie n ts
P < 0 .0 5
P < 0 .0 1
P < 0 .0 0 1
Non-Stimulation
MOG-Stimulation
PHA-Stimulation
PBMC cultures
15
10
5
0Fold
chan
ge o
f GAT
A3 e
xpre
ssio
n
Healthy groupMS patients
P<0.05
P<0.01
P<0.001
Figure 11. The comparison of T-bet/GATA-3 mRNA ratio by PBMCs in healthy subjects, based on gender
In non-stimulated, MOG-stimulated, and PHA-stimulated PBMCs from healthy controls, no significant differences were observed between males and females in terms of T-bet/GATA-3 expression ratio.
P B M C c u ltu r e s
Fo
ld c
ha
ng
e o
f T
bet
/ G
AT
A3
ex
pre
ssio
n
N o n - s t im u la t io n
M O G - s t im u la t io n
P H A - s t im u la t io n
0
20
40
60
80
100M e n
W o m e n
P = 0 .7 8
P = 0 .8 4
P = 0 .1 0 Men Women
Non-Stimulation
MOG-Stimulation
PHA-Stimulation
PBMC cultures
Fold
chan
ge o
f T-b
et/ G
ATA3
exp
ress
ion 100
80
60
40
20
0
P=0.78
P=0.84
P=0.10
Figure 12. The comparison of GATA-3 expression by PBMCs in healthy individuals, based on gender
In non-stimulated, MOG-stimulated, and PHA-stimulated PBMCs from healthy controls, no significant differences were observed between males and females in terms of GATA-3 expression.
P B M C c u ltu r e s
Fo
ld c
ha
ng
e o
f G
AT
A3
ex
pre
ssio
n
N o n - s t im u la t io n
M O G - s t im u la t io n
P H A - s t im u la t io n
0
10
20
30
40M e n
W o m e n
P = 0 .4 6
P = 0 .8 2
P = 0 .0 7
Men Women
Non-Stimulation
MOG-Stimulation
PHA-Stimulation
PBMC cultures
40
30
20
10
0
Fold
chan
ge o
f GAT
A3 e
xpre
ssio
n
P=0.46
P=0.82
P=0.07
Basic and Clinical
466
November, December 2018, Volume 9, Number 6
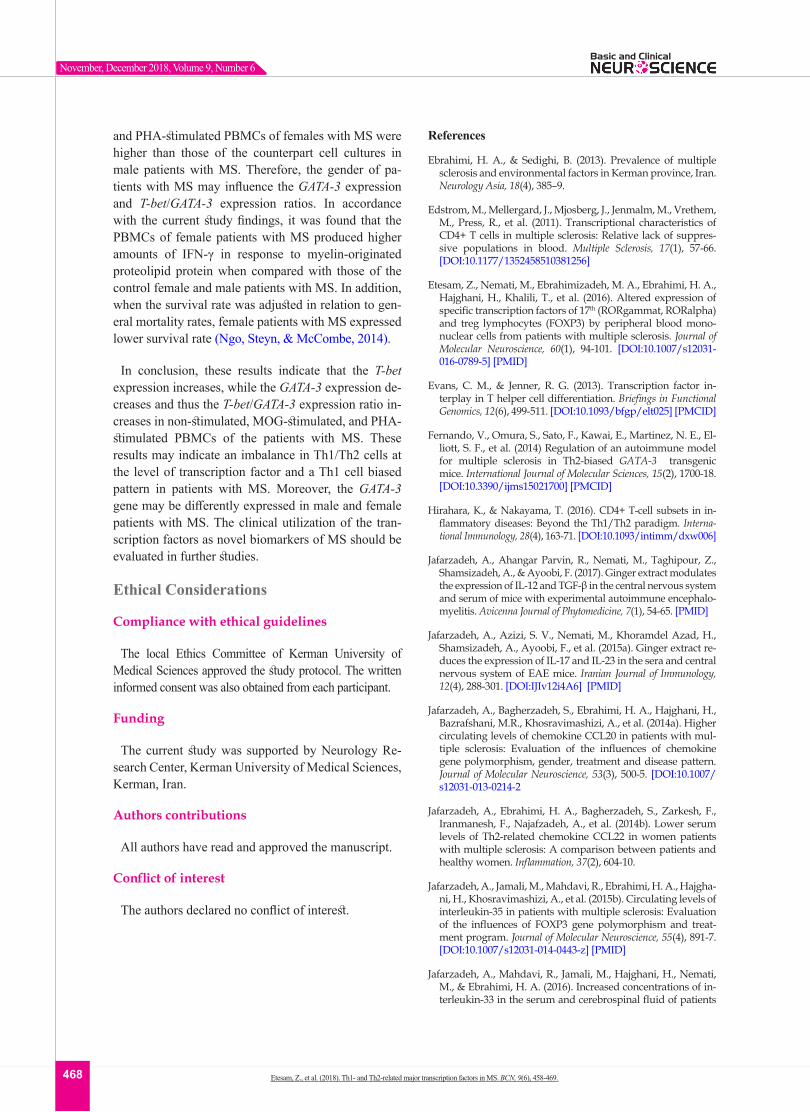
The GATA-3 expression in non-stimulated, MOG-stimulated, and PHA-stimulated PBMCs of males with MS were also significantly higher than those of equal cell cultures in females with MS (P<0.05, P<0.05, and P<0.01, respectively) (Figure 15).
4. Discussion
The current study results showed that the PHA-stim-ulated PBMCs of the healthy individuals and patients with MS expressed higher amounts of T-bet and GATA-3 compared with those of their non-stimulated cultures. Different effector T-cells such as Th1 and Th2 cells are
differentiated from naïve T-cells after exposure to PHA that operates as a powerful polyclonal T-cell inducer.
In healthy individuals, no significant difference was observed between non-stimulated and MOG-stimulat-ed PBMCs, with respect to the T-bet expression while MOG-stimulated PBMCs of the patients with MS ex-pressed higher amounts of this element compared with those of non-stimulated cultures. In patients with MS, the previous in vivo sensitivity of T-lymphocytes against myelin-related antigens (such as MOG) may be account-able for this difference.
The non-stimulated, MOG-stimulated, and PHA-stim-ulated PBMCs of patients with MS expressed higher levels of T-bet in comparison with those of equal cell cultures from the healthy individuals. The T-bet expres-sion is rapidly induced in the early development of Th1 cells (Zhang et al., 2014b). These results reveal that the number of MOG-specific T-cells may be higher in pa-tients with MS than the controls. Moreover, the higher T-bet expression by PHA-stimulated PBMCs of patients with MS represents more potential to generate Th1 cell-related immune responses in such subjects.
In accordance with the current study findings, it was postulated that Th1 cells reinforce the immunopathol-ogy in MS and EAE diseases, by releasing IFN-γ that has a crucial role in supporting autoimmunity (Hirahara & Nakayama, 2016). Importantly, T-bet-deficient mice were protected against EAE induction (Hirahara & Na-kayama, 2016). Increased IFN-γ and TNF-α levels in
Etesam, Z., et al. (2018). Th1- and Th2-related major transcription factors in MS. BCN, 9(6), 458-469.
Figure 13. The comparison of T-bet expression by PBMCs in patients with MS, based on gender
In non-stimulated, MOG-stimulated, and PHA-stimulated PBMCs from patients with MS, no differences were observed between males and females in terms of T-bet expression.
P B M C c u lt u r e s
Fo
ld c
ha
ng
e o
f T
-be
t e
xp
re
ssio
n
N o n - s t im u la tio n
M O G - s t im u la tio n
P H A - s t im u la tio n
0
1 0
2 0
3 0
4 0
5 0
M e n
W o m en
P = 0 .2 5
P = 0 .8 0
P = 0 .3 5
Non-Stimulation
MOG-Stimulation
PHA-Stimulation
PBMC cultures
50
40
30
20
10
0
Fold
chan
ge o
f T-b
et e
xpre
ssio
n
Men Women
P=0.25
P=0.80
P=0.35
Figure 14. The comparison of T-bet/GATA-3 mRNA ratio by PBMCs in patients with MS, based on gender
The of T-bet/GATA-3 expression ratio in MOG-stimulated and PHA-stimulated PBMCs from females with MS were significantly higher than that of the same cultures from male patients with MS.
P B M C c u lt u r e s
Fo
ld c
ha
ng
e o
f T
bet
/ G
AT
A3
ex
pr
essi
on
N o n - s t im u la t io n
M O G - s t im u la t io n
P H A - s t im u la t io n
0
5 0 0
1 0 0 0
1 5 0 0
M e n
W o m en
P = 0 .2 0
P < 0 .0 5
P < 0 .0 5
Non-Stimulation
MOG-Stimulation
PHA-Stimulation
PBMC cultures
Men Women
1500
1000
500
0
Fold
chan
ge o
f T-b
et/ G
ATA3
exp
ress
ion
P=0.20P<0.05
P<0.05
Figure 15. The comparison of GATA-3 expression by PBMC in patients with MS, based on gender.
The of GATA-3 expression in non-stimulated, MOG-stimu-lated, and PHA-stimulated PBMCs from male patients with MS were significantly higher than that of the same cell cul-tures from female patients with MS.
P B M C c u lt u r e s
Fo
ld c
ha
ng
e o
f G
AT
A3
ex
pre
ssio
n
N o n - s t im u la tio n
M O G - s t im u la tio n
P H A - s t im u la tio n
0
5
1 0
1 5
M e n
W o m en
P < 0 .0 5
P < 0 .0 5
P < 0 .0 3
Non-Stimulation
MOG-Stimulation
PHA-Stimulation
PBMC cultures
Men Women
15
10
5
0
Fold
chan
ge o
f GAT
A3 e
xpre
ssio
n
P<0.05P<0.05
P<0.03
Basic and Clinical
467
November, December 2018, Volume 9, Number 6
the patients with MS further support that Th1 cells were pathogenic (Kallaur et al., 2013; Uysal, Meric Yilmaz, Bogdaycioglu, & Mungan Ozturk, 2014). It was also found that the Myelin Basic Protein (MPB)-specific T-lymphocytes separated from the CNS of human and mouse mainly secret the Th1-linked cytokines (such as IL-2 and IFN-γ), but not IL-4 (Kostic et al., 2015; Raphael et al., 2015). Furthermore, administration of IFN-γ to the patients with MS patients exacerbated the disease, whereas administration of neutralizing antibod-ies against IFN-γ had therapeutically beneficial effects (Kostic et al., 2015; Raphael et al., 2015).
The results of the current study also showed that the non-stimulated and MOG-stimulated PBMCs of the pa-tients with MS expressed lower levels of GATA-3 than those of the equal cell cultures from healthy individuals. These findings indicate that the down-regulation of Th2 cell-associated responses may be involved in the MS pathogenesis. GATA-3 performs a key role in the Th2 cell differentiation, while suppressing Th1 cells (Zhang et al., 2014b).
In agreement with the current study results, it was dem-onstrated that transgenic mice over-producing GATA-3 reduces Th1 cell-mediated inflammatory reactions in the CNS, as well as very low clinical signs, after EAE induc-tion (Fernando et al., 2014). Moreover, epidemiological investigations in humans indicate that the patients with allergic asthma, a Th2 cell-related disorder, had much less risk for MS (Pedotti et al., 2009). In addition, the beneficial effects of glatiramer acetate (currently used to treat MS) may be partially performed through increas-ing Th2 cell-related immune response, which could re-duce the deleterious Th1 cell-related responses (Oreja-Guevara, Ramos-Cejudo, Aroeira, Chamorro, & Diez Tejedor, 2012). In EAE models, the disease recovery was also related to the upregulation of Th2 cell-related cytokines in the brain (Kostic et al., 2015). Furthermore, the induction of Th2 cell-associated immune response resulted in the delay in the onset and severity of EAE (Fernando et al., 2014; La Flamme et al., 2006).
Th2 cells can provide protective effects against MS through the induction of the alternative (M2) type of macrophages/microglia (Kostic et al., 2015; Raphael et al., 2015). M2 type of macrophages/microglia is charac-terized by the lack of MHC II molecules, high capability of myelin phagocytosis, production of anti-inflammatory cytokines (such as TGF-β, IL-10, and IL-1 receptor an-tagonist), high expression of arginase-1 (an enzyme with capacity to inhibit activated microglia), low expression of
the enzymes involved in generation of Reactive Oxygen Species (ROS) (Kostic et al., 2015; Raphael et al., 2015).
The current study revealed that the T-bet/GATA-3 ex-pression ratio in non-stimulated, MOG-stimulated, and PHA-stimulated PBMCs of patients with MS were high-er than those of the same cell cultures from the healthy individuals. Therefore, an imbalance in Th1/Th2-related responses with a deviation toward Th1 cell may be in-volved in the pathologic process of MS. Since the T-bet/GATA-3 expression ratio is considered as a useful alter-native parameter to determine Th1/Th2 cells status, the current study results support a Th1-biased pattern in patients with MS, which was consistent with data from other investigations in patients with MS (Kostic et al., 2015; Raphael et al., 2015).
The maintenance of the normal immunological functions depends on a balance between Th1 and Th2 cell-related responses. On the other hand, the imbalance of Th1/Th2 cells may cause a number of disorders such as cancer, au-toimmunity, allergic and infectious diseases (Zhang et al., 2014a). The current study also found that the T-bet expres-sion increased, whereas the GATA-3 expression decreased and hence the T-bet/GATA-3 expression ratio rose by non-stimulated and stimulated PBMCs of the patients with MS. Therefore, an imbalance in the Th1/Th2 cells with a tenden-cy toward Th1 cell occurs at the transcription factor level in patients with MS.
The current study results also indicated no signifi-cant differences between females and males regarding the T-bet expression in not-stimulated and stimulated PBMCs, neither in the healthy individuals nor in the patients with MS. Accordingly, the T-bet expression was not influenced by gender. It was also found that the T-bet expression increased, while the GATA-3 ex-pression diminished and therefore the T-bet/GATA-3 expression ratio increased in non-stimulated and stim-ulated PBMCs of male and female patients with MS as compared with those of the same cell cultures from healthy individuals with the same gender. Accordingly, the upregulation of Th1 cell and/or downregulation of Th2 cell-related immune responses (the Th1/Th2 im-balance) may be involved in the pathogenesis of MS in both genders.
The results of the current study also demonstrated that the non-stimulated, MOG-stimulated, and PHA-stimulated PBMCs of male patients with MS expressed higher amounts of GATA-3 when compared with those of the same cell cultures of females with MS. However, the T-bet/GATA-3 expression ratio in MOG-stimulated
Etesam, Z., et al. (2018). Th1- and Th2-related major transcription factors in MS. BCN, 9(6), 458-469.
Basic and Clinical
468
November, December 2018, Volume 9, Number 6
and PHA-stimulated PBMCs of females with MS were higher than those of the counterpart cell cultures in male patients with MS. Therefore, the gender of pa-tients with MS may influence the GATA-3 expression and T-bet/GATA-3 expression ratios. In accordance with the current study findings, it was found that the PBMCs of female patients with MS produced higher amounts of IFN-γ in response to myelin-originated proteolipid protein when compared with those of the control female and male patients with MS. In addition, when the survival rate was adjusted in relation to gen-eral mortality rates, female patients with MS expressed lower survival rate (Ngo, Steyn, & McCombe, 2014).
In conclusion, these results indicate that the T-bet expression increases, while the GATA-3 expression de-creases and thus the T-bet/GATA-3 expression ratio in-creases in non-stimulated, MOG-stimulated, and PHA-stimulated PBMCs of the patients with MS. These results may indicate an imbalance in Th1/Th2 cells at the level of transcription factor and a Th1 cell biased pattern in patients with MS. Moreover, the GATA-3 gene may be differently expressed in male and female patients with MS. The clinical utilization of the tran-scription factors as novel biomarkers of MS should be evaluated in further studies.
Ethical Considerations
Compliance with ethical guidelines
The local Ethics Committee of Kerman University of Medical Sciences approved the study protocol. The written informed consent was also obtained from each participant.
Funding
The current study was supported by Neurology Re-search Center, Kerman University of Medical Sciences, Kerman, Iran.
Authors contributions
All authors have read and approved the manuscript.
Conflict of interest
The authors declared no conflict of interest.
References
Ebrahimi, H. A., & Sedighi, B. (2013). Prevalence of multiple sclerosis and environmental factors in Kerman province, Iran. Neurology Asia, 18(4), 385–9.
Edstrom, M., Mellergard, J., Mjosberg, J., Jenmalm, M., Vrethem, M., Press, R., et al. (2011). Transcriptional characteristics of CD4+ T cells in multiple sclerosis: Relative lack of suppres-sive populations in blood. Multiple Sclerosis, 17(1), 57-66. [DOI:10.1177/1352458510381256]
Etesam, Z., Nemati, M., Ebrahimizadeh, M. A., Ebrahimi, H. A., Hajghani, H., Khalili, T., et al. (2016). Altered expression of specific transcription factors of 17th (RORgammat, RORalpha) and treg lymphocytes (FOXP3) by peripheral blood mono-nuclear cells from patients with multiple sclerosis. Journal of Molecular Neuroscience, 60(1), 94-101. [DOI:10.1007/s12031-016-0789-5] [PMID]
Evans, C. M., & Jenner, R. G. (2013). Transcription factor in-terplay in T helper cell differentiation. Briefings in Functional Genomics, 12(6), 499-511. [DOI:10.1093/bfgp/elt025] [PMCID]
Fernando, V., Omura, S., Sato, F., Kawai, E., Martinez, N. E., El-liott, S. F., et al. (2014) Regulation of an autoimmune model for multiple sclerosis in Th2-biased GATA-3 transgenic mice. International Journal of Molecular Sciences, 15(2), 1700-18. [DOI:10.3390/ijms15021700] [PMCID]
Hirahara, K., & Nakayama, T. (2016). CD4+ T-cell subsets in in-flammatory diseases: Beyond the Th1/Th2 paradigm. Interna-tional Immunology, 28(4), 163-71. [DOI:10.1093/intimm/dxw006]
Jafarzadeh, A., Ahangar Parvin, R., Nemati, M., Taghipour, Z., Shamsizadeh, A., & Ayoobi, F. (2017). Ginger extract modulates the expression of IL-12 and TGF-β in the central nervous system and serum of mice with experimental autoimmune encephalo-myelitis. Avicenna Journal of Phytomedicine, 7(1), 54-65. [PMID]
Jafarzadeh, A., Azizi, S. V., Nemati, M., Khoramdel Azad, H., Shamsizadeh, A., Ayoobi, F., et al. (2015a). Ginger extract re-duces the expression of IL-17 and IL-23 in the sera and central nervous system of EAE mice. Iranian Journal of Immunology, 12(4), 288-301. [DOI:IJIv12i4A6] [PMID]
Jafarzadeh, A., Bagherzadeh, S., Ebrahimi, H. A., Hajghani, H., Bazrafshani, M.R., Khosravimashizi, A., et al. (2014a). Higher circulating levels of chemokine CCL20 in patients with mul-tiple sclerosis: Evaluation of the influences of chemokine gene polymorphism, gender, treatment and disease pattern. Journal of Molecular Neuroscience, 53(3), 500-5. [DOI:10.1007/s12031-013-0214-2
Jafarzadeh, A., Ebrahimi, H. A., Bagherzadeh, S., Zarkesh, F., Iranmanesh, F., Najafzadeh, A., et al. (2014b). Lower serum levels of Th2-related chemokine CCL22 in women patients with multiple sclerosis: A comparison between patients and healthy women. Inflammation, 37(2), 604-10.
Jafarzadeh, A., Jamali, M., Mahdavi, R., Ebrahimi, H. A., Hajgha-ni, H., Khosravimashizi, A., et al. (2015b). Circulating levels of interleukin-35 in patients with multiple sclerosis: Evaluation of the influences of FOXP3 gene polymorphism and treat-ment program. Journal of Molecular Neuroscience, 55(4), 891-7. [DOI:10.1007/s12031-014-0443-z] [PMID]
Jafarzadeh, A., Mahdavi, R., Jamali, M., Hajghani, H., Nemati, M., & Ebrahimi, H. A. (2016). Increased concentrations of in-terleukin-33 in the serum and cerebrospinal fluid of patients
Etesam, Z., et al. (2018). Th1- and Th2-related major transcription factors in MS. BCN, 9(6), 458-469.

Basic and Clinical
469
November, December 2018, Volume 9, Number 6
with multiple sclerosis. Oman Medical Journal, 31(1), 40-5. [DOI:10.5001/omj.2016.08] [PMCID] [PMID]
Jafarzadeh, A., Mohammadi Kordkhayli, M., Ahangar Parvin, R., Azizi, V., Khoramdel Azad, H., et al. (2014c). Ginger ex-tracts influence the expression of IL-27 and IL-33 in the cen-tral nervous system in experimental autoimmune encepha-lomyelitis and ameliorates the clinical symptoms of disease. Journal of Neuroimmunology, 276(1-2), 80-8. [DOI:10.1016/j.jneuroim.2014.08.614]
Kallaur, A. P., Oliveira, S. R., Colado Simao, A. N., Delicato de Almeida, E. R., Kaminami Morimoto, H., Lopes, J., et al. (2013). Cytokine profile in relapsingremitting multiple sclero-sis patients and the association between progression and ac-tivity of the disease. Molecular Medicine Reports, 7(3), 1010-20. [DOI:10.3892/mmr.2013.1256]
Kostic, M., Stojanovic, I., Marjanovic, G., Zivkovic, N., & Cvetanovic, A. (2015). Deleterious versus protective autoim-munity in multiple sclerosis. Cellular Immunology, 296, 122-32. [DOI:10.1016/j.cellimm.2015.04.006]
La Flamme, A. C., Harvie, M., McNeill, A., Goldsack, L., Tier-ney, J. B., & Bäckström, B. T. (2006). Fcγ receptor-ligating complexes improve the course of experimental autoimmune encephalomyelitis by enhancing basal Th2 responses. Im-munology and Cell Biology, 84(6), 522-9. [DOI:10.1111/j.1440-1711.2006.01464.x]
Lin, Z. W., Wu, L. X., Xie, Y., Ou, X., Tian, P. K., Liu, X. P., et al. (2015). The expression levels of transcription factors T-bet, GATA-3, RORgammat and FOXP3 in Peripheral Blood Lymphocyte (PBL) of patients with liver cancer and their sig-nificance. International Journal of Medical Sciences, 12(1), 7-16. [DOI:10.7150/ijms.8352] [PMCID]
Mahad, D. H., Trapp, B. D., & Lassmann, H. (2015) Pathologi-cal mechanisms in progressive multiple sclerosis. The Lancet Neurology, 14(2), 183-93.
Martinez, N.E., Sato, F., Omura, S., Kawai, E., Takahashi, S., Yoh, K., et al. (2014). RORgammat, but not T-bet, overexpres-sion exacerbates an autoimmune model for multiple sclero-sis. Journal of Neuroimmunology, 276(0), 142-9. [DOI:10.1016/j.jneuroim.2014.09.006]
McDonald, W. I., Compston, A., Edan, G., Goodkin, D., Har-tung, H. P., Lublin, F. D., et al. (2001). Recommended diagnos-tic criteria for multiple sclerosis: Guidelines from the Interna-tional Panel on the diagnosis of multiple sclerosis. Annals of Neurology, 50(1), 121-7. [DOI:10.1002/ana.20849] [PMID]
Na, H., Cho, M. & Chung, Y. (2016). Regulation of Th2 cell immunity by dendritic cells. Immune Network, 16, 1-12. [Doi:10.4110/in.2016.16.1.1]
Ngo, S. T., Steyn, F. J., & McCombe, P. A. (2014). Gender differ-ences in autoimmune disease. Frontiers in Neuroendocrinology, 35(3), 347-69. [DOI:10.1016/j.yfrne.2014.04.004]
Oreja Guevara, C., Ramos-Cejudo, J., Aroeira, L. S., Chamorro, B., & Diez Tejedor, E. (2012). TH1/TH2 cytokine profile in relapsing-remitting multiple sclerosis patients treated with Glatiramer acetate or Natalizumab. BMC Neurology,12, 95. [DOI:10.1186/1471-2377-12-95] [PMCID]
Pedotti, R., Farinotti, M., Falcone, C., Borgonovo, L., Confalonie-ri, P., Campanella, A., et al. (2009). Allergy and multiple scle-rosis: A population-based case-control study. Multiple Sclero-sis, 15, 899-906. [DOI:10.1177/1352458509106211] [PMID]
Raphael, I., Nalawade, S., Eagar, T. N., & Forsthuber, T. G. (2015). T cell subsets and their signature cytokines in autoimmune and inflammatory diseases. Cytokine, 74, 5-17. [DOI:10.1016/j.cyto.2014.09.011] [PMCID]
Uysal, S., Meric Yilmaz, F., Bogdaycioglu, N., Mungan Ozturk, S., & Ak, F. (2014) Increased serum levels of some inflam-matory markers in patients with multiple sclerosis. Minerva Medica, 105, 229-35. [DOI:10.4172/2329-6895.S1.003]
Zhang, Y., Zhang, Y., Gu, W., He, L., & Sun, B. (2014a). Th1/Th2 cell’s function in immune system. Advances in Experimental Medi-cine and Biology, 841, 45-65. [DOI:10.1007/978-94-017-9487-9_3]
Zhang, Y., Zhang, Y., Gu, W. & Sun, B. (2014b). TH1/TH2 cell dif-ferentiation and molecular signals. Advances in Experimental Med-icine and Biology, 841, 15-44. [DOI:10.1007/978-94-017-9487-9_2]
Etesam, Z., et al. (2018). Th1- and Th2-related major transcription factors in MS. BCN, 9(6), 458-469.