Different Behavior of Organotin Compounds by Anodic Stripping Voltammetry and their Quantification...
7
Different Behavior of Organotin Compounds by Anodic Stripping Voltammetry and their Quantification after Partial Ion Exchange Separation Klaus-Michael Ochsenku ¨hn 1 , Maria Ochsenku ¨ hn-Petropoulou 2; , Fotis Tsopelas 2 , and Leonidas Mendrinos 2 1 Laboratory of Trace Element Studies, Institute of Physical Chemistry, NCSR ‘‘Demokritos’’, Aghia Paraskevi, 153 10 Athens, Greece 2 Laboratory of Inorganic and Analytical Chemistry, Department of Chemical Engineering, National Technical University of Athens, Iroon Polytechniou 9, 157 73 Athens, Greece Abstract. The electrochemical behavior and the ana- lytical performance of the organotin compounds mono-, di- and tributyltin, as well as, mono-, di- and triphenyltin were investigated by various voltammetric techniques, such as alternating current polarography of the first harmonic (ACP1), square wave polarography at a hang- ing mercury drop electrode (SQW) and anodic stripping voltammetry (ASV). Differences could be observed in the sensitivity, the detection limit and the reproducibility of the organotins by the techniques used and in some cases their simultaneously determination was difficult, as the half-wave potentials were very close together. However, by ASV double peaks were observed only for the monophenyltin and dibutyltin species, distinguish- ing them from the overlapping peaks of diphenyltin and triphenyltin, respectively. This different electrochemical behavior, is due to the formation of intermediate pro- ducts during the electrolysis of these compounds with other half wave potentials and was successfully utilized for the separation and determination of monophenyltin in the presence of diphenyltin. In the case of dibutyltin, where no linear calibration curves for the two peaks were obtained, a prior suitable ion exchange procedure was developed for its separation and determination from the interfering triphenyltin. The successful application of this technique could be proved on a CRM freshwater sediment of BCR. Key words: Organotins; square wave polarography; anodic strip- ping voltammetry; double peaks by dibutyltin and monophenyltin; separation by ion exchange The worldwide usage of the highly toxic organotin compounds and the damage caused to estuarine organisms has forced the scientific community and the health organizations at local and international level, to a systematic research for the precise and accurate determination of these compounds, even at very low concentrations, in the environment [1, 2]. The organo- tin compounds mostly used are tributyltin (TBT) for antifouling paints on vessels and as stabilizer for PVC and triphenyltin (TPT) in fungicides. They undergo a degradation in the environment by the progressive removal of the butyl- or phenyl-groups from the tin atom leading to dibutyltin (DBT), monobutyltin (MBT) and diphenyltin (DPT), monophenyltin (MPT) species, respectively. Because of the large differences in the toxicity and bioavailability of these organotin species, several analytical approaches have been used for their accurate and precise determination in ultratrace con- centrations in environmental samples, such as sedi- ments, marine organisms or surface waters. The organotin analysis is a multi-step procedure and mostly hyphenated techniques, such as GC or HPLC, cryogenic trapping, supercritical fluid extraction or solid phase micro extraction (SPME) with an element specific detection system, such as AAS, UV spectro- metry, ICP-AES, ICP-MS, GC-MID-AED (microwave induced-atomic emission detection) or non-specific detection e.g. flame photometric detection (FPD) have Mikrochim. Acta 136, 129–135 (2001) To whom correspondence should be addressed
Transcript of Different Behavior of Organotin Compounds by Anodic Stripping Voltammetry and their Quantification...

Different Behavior of Organotin Compounds by Anodic StrippingVoltammetry and their Quanti®cation after Partial Ion Exchange Separation
Klaus-Michael OchsenkuÈhn1, Maria OchsenkuÈhn-Petropoulou2;�, Fotis Tsopelas2,
and Leonidas Mendrinos2
1 Laboratory of Trace Element Studies, Institute of Physical Chemistry, NCSR `̀ Demokritos'', Aghia Paraskevi, 153 10 Athens, Greece2 Laboratory of Inorganic and Analytical Chemistry, Department of Chemical Engineering, National Technical University of Athens, Iroon
Polytechniou 9, 157 73 Athens, Greece
Abstract. The electrochemical behavior and the ana-
lytical performance of the organotin compounds mono-,
di- and tributyltin, as well as, mono-, di- and triphenyltin
were investigated by various voltammetric techniques,
such as alternating current polarography of the ®rst
harmonic (ACP1), square wave polarography at a hang-
ing mercury drop electrode (SQW) and anodic stripping
voltammetry (ASV). Differences could be observed in
the sensitivity, the detection limit and the reproducibility
of the organotins by the techniques used and in some
cases their simultaneously determination was dif®cult,
as the half-wave potentials were very close together.
However, by ASV double peaks were observed only for
the monophenyltin and dibutyltin species, distinguish-
ing them from the overlapping peaks of diphenyltin and
triphenyltin, respectively. This different electrochemical
behavior, is due to the formation of intermediate pro-
ducts during the electrolysis of these compounds with
other half wave potentials and was successfully utilized
for the separation and determination of monophenyltin
in the presence of diphenyltin. In the case of dibutyltin,
where no linear calibration curves for the two peaks
were obtained, a prior suitable ion exchange procedure
was developed for its separation and determination from
the interfering triphenyltin. The successful application
of this technique could be proved on a CRM freshwater
sediment of BCR.
Key words: Organotins; square wave polarography; anodic strip-ping voltammetry; double peaks by dibutyltin and monophenyltin;separation by ion exchange
The worldwide usage of the highly toxic organotin
compounds and the damage caused to estuarine
organisms has forced the scienti®c community and
the health organizations at local and international level,
to a systematic research for the precise and accurate
determination of these compounds, even at very low
concentrations, in the environment [1, 2]. The organo-
tin compounds mostly used are tributyltin (TBT) for
antifouling paints on vessels and as stabilizer for PVC
and triphenyltin (TPT) in fungicides. They undergo a
degradation in the environment by the progressive
removal of the butyl- or phenyl-groups from the tin
atom leading to dibutyltin (DBT), monobutyltin (MBT)
and diphenyltin (DPT), monophenyltin (MPT) species,
respectively. Because of the large differences in the
toxicity and bioavailability of these organotin species,
several analytical approaches have been used for their
accurate and precise determination in ultratrace con-
centrations in environmental samples, such as sedi-
ments, marine organisms or surface waters. The
organotin analysis is a multi-step procedure and
mostly hyphenated techniques, such as GC or HPLC,
cryogenic trapping, supercritical ¯uid extraction or
solid phase micro extraction (SPME) with an element
speci®c detection system, such as AAS, UV spectro-
metry, ICP-AES, ICP-MS, GC-MID-AED (microwave
induced-atomic emission detection) or non-speci®c
detection e.g. ¯ame photometric detection (FPD) have
Mikrochim. Acta 136, 129±135 (2001)
� To whom correspondence should be addressed

been reported [3±9]. For most of the above mentioned
techniques usually an additional step, the derivatisation
of the organotin species to more volatile compounds is
required, such as hydride generation or Grignard
alkylation [10]. Voltammetric techniques used for the
determination of organotins are, however, independent
of any derivatisation procedure, are simple to handle,
accurate and reproducible [11±19]. But in some cases
no differentiation of organotins is possible and they
have to be converted into inorganic tin prior to their
polarographic determination. In other cases very close
half wave potentials for some of the organotin species
were observed and therefore a separation and enrich-
ment is necessary prior to analysis, to reach low
enough detection limits, required for some environ-
mental matrices.
In the present work the behavior of the butyl- and
phenyltin compounds with three polarographic techni-
ques, such as the alternating current polarography of
the ®rst harmonic (ACP1), the square wave polaro-
graphy (SQW) with a hanging mercury drop electrode
(HMDE), as well as the anodic stripping voltammetry
(ASV) was investigated, with the aim of developing
a simple method for distinguishing and determining
the different organotin species. Furthermore a suitable
ion exchange procedure was developed to separate
and enrich some of the investigated species prior to
polarographic analysis. This procedure was applied to
the determination of some organotins in a candidate
CRM freshwater sediment of BCR.
Experimental
Instrumentation
The polarograph VA 746 Trace Analyzer (Metrohm) in connectionwith the VA 747 Stand equipped with a multimode electrode, asworking electrode, was used for the polarographic determination ofthe organotin compounds. The reference electrode was a Ag/AgClelectrode ®lled with 0.2 M LiClO4 in abs. ethanol and the auxiliaryelectrode a glassy carbon electrode. All polarograms were scannedin the voltage range from ÿ0.2 to ÿ1.2 V. The alternating currentpolarography (ACP) was performed with the dropping mercuryelectrode (DME) with a dropping time of 20 ms, sweep rate: 24 mV/s,amplitude of alternating current (AC) voltage: 30 mV, modulatedfrequency: 50 Hz. For the square wave polarography (SQW) withthe hanging mercury drop electrode (HMDE) a drop size: 4, t.meas:2.0 ms, sweep rate: 20 mV/s, voltage amplitude: 20 mV, modulatedfrequency: 50 Hz were used. For the anodic stripping voltammetry(ASV) in the SQW mode using the HMDE, the parameters were:drop size: 4, voltage amplitude: 20 mV, modulated frequency: 50 Hz,sweep rate: 20 mV/s, pre-electrolysis time: 180 s, pre-electrolysisvoltage: ÿ1200 mV. Especially for dibutyltin (DBT) and mono-phenyltin (MPT), where double peaks were observed, the followingpre-electrolysis times: 10, 20, 30, 60, 120, 180 and 240 s and pre-
electrolysis voltages: ÿ1000, ÿ1100, ÿ1200, ÿ1400 andÿ1700 mV were tested.
Reagents
The investigated organotin compounds, such as BuSnCl3 (MBTCl3)(95%, liq.), Bu2SnCl2 (DBTCl2) (96%, solid), PhSnCl3 (MPTCl3)(98%, liq.), Ph2SnCl2 (DPTCl2) (96%, solid) were supplied byAldrich, while Bu3SnCl (TBTCl) (97%, liq.) and Ph3SnCl (TPTCl)(� 97%, solid) by Fluka Chemica. Stock solutions in the rangeof 1 � 10ÿ2±2 � 10ÿ2 mol=L of each compound were preparedevery week in abs. ethanol and kept frozen (ÿ15 �C), and workingsolutions were prepared daily in the range of 1 � 10ÿ4±1 � 10ÿ3 mol=L. For the extraction of the organotin compounds,dichloromethane, p.a. (Merck), was used and as electrolyte 0.2 MLiClO4, prepared from LiClO4 � 3H2O, Merck p.a. dissolved inabs. ethanol (Merck p.a.). For the separation of DBT and TPT fromtheir mixtures the cation exchanger DOWEX 50 W-X8 (Serva) inthe H�-form, 100±200 mesh, packed into a glass column (i.d.0.5 cm, 15 cm long) was used. The used resin bed was 7 cm long.The elution of the organotin compounds from the resin wasperformed with 3 M HCl in methanol. The ¯ow rate of 1 ml/min wasregulated with a peristaltic pump (Minipuls 2, Gilson). For theapplication of this procedure on a real sample, the candidatereference material CRM 646, a freshwater sediment from a canalnear Amsterdam/Netherlands, was analysed for DBT and TPT.
Analytical Procedure
For the polarographic determination appropriate micro amounts ofthe investigated organotin compounds and their mixtures, werespiked in a 10 ml Metrohm polarographic cell containing as blank3 ml of dichloromethane and 3 ml of the electrolyte 0.2 M LiClO4
in abs. ethanol. The mixture was cooled at 10 �C and deoxygenatedby passing nitrogen saturated with solvent (abs. ethanol/dichlor-omethane) for 5 min. Then, the polarograms were scanned sub-sequently by changing the measurement mode. The evaluation ofthe polarograms was achieved using either calibration curves,taken under the same conditions as described above or the standardaddition method.
Ion exchange separation: 20 ml of 0.5 N HCl were spiked withmicro amounts of DBT or TPT or their mixtures and passed throughthe ion exchange column. The elution of the organotin compoundswas performed with 3 M HCl in methanol [17] and fractions of 1 mlwere taken in order to obtain the elution curves. For thepolarographic determination each fraction of the eluate, as well asthe ef¯uent, were transferred into a separatory funnel, then 5 ml ofdichloromethane and 5 ml of distilled water, for phase separation,were added and shaken for 5 min. After phase separation 3 ml of theorganic phase and 3 ml of 0.2 M LiClO4 in abs. ethanol weretransferred into the polarographic cell and the determination wasperformed as mentioned above. As blank 0.5 M HCl was used,passed through the ion exchange column and subjected to the sameprocedure as the sample.
Sediment sample: For the determination of DBT and TPT in theCRM 646 freshwater sediment, micro-amounts of DBT and TPT(4±8mg) were spiked in 5±25 g of the well mixed sediment andthe mixture was leached with 70 ml of 0.5 M HCl for 20±24 h atlow temperature (5±10 �C). After centrifugation of the slurry at2000 rpm for 20 min, the supernatant liquid was ®ltered through a0.45mm Sartorius cellulose acetate ®lter. The ®ltrate was then passedthrough the ion exchanger column with a ¯ow rate of 1 ml/min. The
130 K.-M. OchsenkuÈhn et al.

elution was performed using 3 M HCl in methanol with a ¯ow rateof 1 ml/min. Two fractions were taken, the ®rst one containing DBT(0±10 ml) and a second one containing TPT (11±20 ml), as itresulted from the corresponding elution curves. These fractions wereanalyzed as mentioned above. The evaluation of the polarogramswas achieved using the standard addition method.
Results and Discussion
In Table 1 the half wave potentials obtained by the
three polarographic techniques for each organotin
compound are presented. As it can be seen, the half
wave potentials for DBT and TPT by ACP1 and SQW
at the HMDE are very close together, as well as for
MPT and DPT. Therefore a simultaneously determina-
tion of these compounds is not possible using these
voltammetric techniques. However, by the ASV, double
peaks could be observed only for DBT and MPT, when
the electrolysis took place under certain conditions,
regarding the pre-electrolysis time and voltage. Based
on the different electrochemical behavior of these two
compounds, an attempt was made to distinguish them
and, if possible, to determine them in the presence of
the above mentioned interfering compounds. As far as
the determination of MBT with voltammetric techni-
ques concerns, it was found not sensitive enough and
the calibration curves, obtained were not linear. There-
fore this compound was not taken into consideration
for the further measurements. It is to mention that
inorganic tin did not interfere with the investigated
organotin compounds, as it was not extracted by di-
chloromethane [17].
The occurrence of a double peak can be explained
by an electrode process during the electrolysis, where
in the ®rst step an organotin radical is produced from
the organotin compound, which afterwards is recom-
bined to a dimer organotin compound [11, 14]. The
dimer compounds are obviously in the case of DBT and
MPT stable and have different half wave potentials as
their monomer forms. This effect is of interest for the
separate determination of organotin compounds, which
otherwise have about the same half wave potential.
In Fig. 1 the polarograms of MPT are demonstrated,
obtained by SQW at the HMDE (lower part (I), one
peak) and by reverse scanning (ASV, upper part (II),
two peaks). The ratio of the sensitivities of the peaks
between the direct (at ÿ0.58 V) and reverse scan (at
ÿ0.43 V) is for this case about 1:10.
Table 1. Half wave potentials of the organotin compounds DBT, TBT, MPT, DPT and TPT, obtained by ACP 1, SQW voltammetry at theHMDE and ASV
E1=2[V]
Organotin ACP SQW ASVsalts (HMDE)
Bu2SnCl2 (DBT) ÿ0:71� 0:01 0:72� 0:01 ÿ0:73� 0:01 (1st peak)�ÿ0:69� ÿ �ÿ0:62� (2nd peak)�
Bu3SnCl (TBT) ÿ0:99� 0:01 ÿ1:00� 0:01 ÿ1:02� 0:01PhSnCl3 (MPT) ÿ0:58� 0:01 ÿ0:58� 0:01 ÿ0:53� 0:01 (1st peak)
ÿ0:43� 0:01 (2nd peak)Ph2SnCl2 (DPT) ÿ0:58� 0:01 ÿ0:58� 0:01 ÿ0:55� 0:01Ph3SnCl (TPT) ÿ0:68� 0:01 ÿ0:69� 0:01 ÿ0:70� 0:01
� E1=2 is depending on the concentration.
Fig. 1. Polarogram of MPT by SQW at the HMDE (I) and by ASV(II), pre-electrolysis at ÿ1200 mV for 180 s
Different Behavior of Organotin Compounds by Anodic Stripping Voltammetry 131
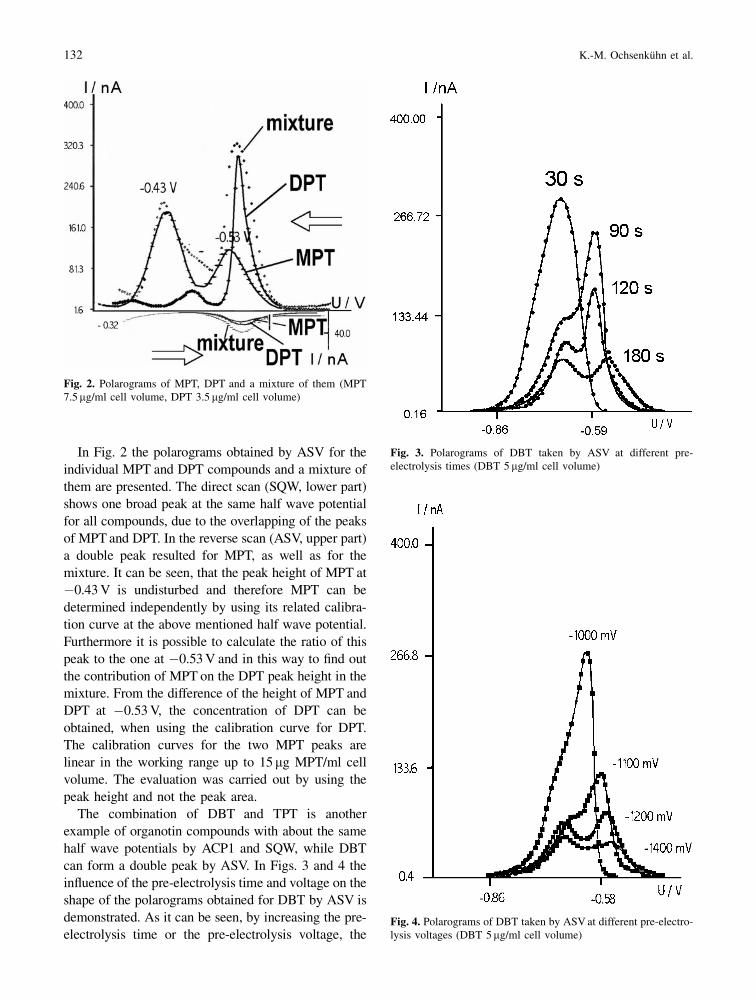
In Fig. 2 the polarograms obtained by ASV for the
individual MPT and DPT compounds and a mixture of
them are presented. The direct scan (SQW, lower part)
shows one broad peak at the same half wave potential
for all compounds, due to the overlapping of the peaks
of MPT and DPT. In the reverse scan (ASV, upper part)
a double peak resulted for MPT, as well as for the
mixture. It can be seen, that the peak height of MPT at
ÿ0.43 V is undisturbed and therefore MPT can be
determined independently by using its related calibra-
tion curve at the above mentioned half wave potential.
Furthermore it is possible to calculate the ratio of this
peak to the one at ÿ0.53 V and in this way to ®nd out
the contribution of MPT on the DPT peak height in the
mixture. From the difference of the height of MPT and
DPT at ÿ0.53 V, the concentration of DPT can be
obtained, when using the calibration curve for DPT.
The calibration curves for the two MPT peaks are
linear in the working range up to 15mg MPT/ml cell
volume. The evaluation was carried out by using the
peak height and not the peak area.
The combination of DBT and TPT is another
example of organotin compounds with about the same
half wave potentials by ACP1 and SQW, while DBT
can form a double peak by ASV. In Figs. 3 and 4 the
in¯uence of the pre-electrolysis time and voltage on the
shape of the polarograms obtained for DBT by ASV is
demonstrated. As it can be seen, by increasing the pre-
electrolysis time or the pre-electrolysis voltage, the
Fig. 2. Polarograms of MPT, DPT and a mixture of them (MPT7.5mg/ml cell volume, DPT 3.5 mg/ml cell volume)
Fig. 3. Polarograms of DBT taken by ASV at different pre-electrolysis times (DBT 5 mg/ml cell volume)
Fig. 4. Polarograms of DBT taken by ASV at different pre-electro-lysis voltages (DBT 5mg/ml cell volume)
132 K.-M. OchsenkuÈhn et al.

formation of the double peak is favoured to the debit of
the peak height. A pre-electrolysis time of 180 s and a
pre-electrolysis voltage of ÿ1200 mV were selected for
the measurements with ASV of DBT, as well as of
MPT.
However the development of the double peak in
dependence of the concentration of DBT is much more
different than by MPT and the calibration curves,
obtained for the two DBT peaks, are not linear (Fig. 5).
It is assumed that by DBT during the electrolysis at
HMDE not only dimeric species but also polymer
compounds are produced, changing the half wave
potentials [14]. At concentrations less than 1.5mg/ml
cell volume a well developed peak appears at ÿ0.69 V
(curve I), which shifts at higher concentrations to
ÿ0.62 V. At about 1.3mg DBT/ml cell volume a second
peak atÿ0.72 V (curve II) becomes visible. Both peaks
pass a maximum, the 1st one at about 1.8 and the 2nd
one at about 3mg DBT/ml cell volume. After about
4mg DBT/ml cell volume the intensity of the 2nd peak
becomes higher than this of the 1st one. Under these
circumstances an analytical determination of DBT by
ASV can only be performed in the range up to 1.5mg
DBT/ml cell volume. Due to the fact that the two
peaks, obtained for DBT by ASV, have a half wave
potential close to those of TPT, it was not possible to
separate these compounds using their different electro-
chemical behavior as in the above mentioned case of
MPT and DPT.
Therefore, a chromatographic separation of DBT and
TPT was performed prior to the polarographic
determination. Using the cation exchanger DOWEX
50 WX8 in the H�-form in a 7 cm high resin bed and
3 M HCl in methanol as eluent, a separation of DBT
and TPT was possible (Fig. 6). By a stepwise elution of
both compounds it can be seen, that in the ®rst 10 min
DBT was removed from the column and after 10 min
TPT was eluted. The recovery of DBT after the ion-
exchange separation was about 70±75% and those of
TPT 25±35%. Through the optimization of the ion
exchange procedure, a higher recovery rate for TPT
(70%) could be obtained [21].
For the determination of these two compounds, the
whole volume (10 ml) in the ®rst 10 min fraction was
used for the determination of DBT and the whole
volume (10 ml) in the second 10 min fraction for the
determination of TPT.
In Table 2 the sensitivities, obtained from the slope
of the corresponding calibration graphs and the
detection limits, resulted for the three polarographic
techniques for each organotin compound are presented.
The comparison of the three polarographic techniques
shows that the highest sensitivities and the lowest
detection limits were achieved by ASV, as it is ex-
pected, due to the enrichment of the compounds
occurred by the electrolysis. However, the reproduc-
ibilities of the two other techniques, such as ACP1
Fig. 5. Dependence of the peak heights of DBT at ÿ0.69 V toÿ0.62 V (I) and ÿ0.73 V (II) from the concentration, when usingASV
Fig. 6. Separation of a mixture of DBT and TPT (DBT 18.9 mg,TPT 40.2mg) with the ion exchanger DOWEX 50 WX8, 7 cm resinbed and 3 M HCl in methanol as eluent
Different Behavior of Organotin Compounds by Anodic Stripping Voltammetry 133

(7±12%) and SQW at HMDE (4±7%) are better in
comparison to those obtained by ASV (20±25%), due
to the complex electrode processes, which take place at
the surface of the stationary electrode during the
electrolysis [11, 14].
Application of the technique was demonstrated
through the determination of DBT and TPT in a
candidate freshwater sediment, CRM 646 (BCR). Due
to the very low concentration of TPT in the investigated
sediment, its determination could be achieved only in-
direct using the spiked sediment samples and sub-
stracting the spiked amount of TPT. By the evaluation,
the recovery rates, as well as the moisture content of
the samples were taken into consideration [17, 20].
The statistical treatment of the results for the real
sample, obtained by the described method, and the
results of the certi®cation exercise show that there are
no statistical differences between the two mean values.
The reproducibility of about 20% is very satisfactory
taking into consideration the various steps required
prior to the analysis. The corresponding RSD value
obtained from all laboratory data of the certi®cation
exercise on this sediment was about 15%. The most
important result which arises from this investigation is
that now DBT and TPT, two organotins with very close
half wave potentials, could be separated and in that
way determined in the same matrix.
Conclusion
As the investigation demonstrated, the polarographic
determination of the interfering species DPT and MPT,
as well as DBT and TPT is possible through a double
peak evaluation and a prior chromatographic separation
and the detection limits for the determination of TBT,
DBT, MPT, DPT and TPT could be improved to lower
concentrations, when using ASV at a HMDE.
References
[1] World Health Organization, Tributyltin Compounds, Environ.Health Criteria, Geneva, 1990, p. 116.
[2] S. J. Blunden, C. J. Evans, Handbook of EnvironmentalChemistry, Part 3E. In: O. Hutzinger (Ed.) Springer, BerlinHeidelberg New York Tokyo, 1990, pp. 1±44.
[3] L. Ebdon, S. J. Hall, W. R. Ward, Analyst 1987, 112, 1.[4] Ph. Quevauviller, O. F. Donard, Appl. Organomet. Chem.
1990, 4, 353.[5] G. Schulze, C. Lechmann, Anal. Chim. Acta 1994, 288, 215.[6] J. A. Stab, T. P. Traas, G. Stroomberg, Arch. Environ. Contam.
Toxicol. 1996, 31, 319.[7] Ph. Quevauviller, J. Chromatogr. A 1996, 750, 25.[8] M. Abalos, J. M. Bayona, R. Compano, M. Granados, C. Leal,
M. D. Prat, J. Chromatogr. A 1997, 788, 1.[9] T. de Smaele, L. Moens, P. Sandra, R. Dams, Mikrochim. Acta
1999, 130, 241.
Table 2. Sensitivities and detection limits of the organotin compounds DBT, TBT, MPT, DPT and TPT, obtained by ACP 1, SQWvoltammetry at the HMDE and ASV.
Sensitivity [nA/mg organotin Detection limit [mg organotincompound/ml cell volume] compound/ml cell volume]
Organotin ACP1 SQW ASV ACP1 SQW ASVsalts (HMDE) (HMDE)
273:7ÿ 13:5� CBu2SnCl2 36.6 22.6 (ÿ0.69 V) 0.28 0.11 0.009(DPT) 131:1ÿ 37� C (ÿ0.69 V)
(ÿ0.72 V)Bu3SnCl 16.1 7.4 7.3 1.00 3.12 0.5(TBT)PhSnCl3 5.9 2.9 35.2 (ÿ0.43 V) 1.83 2.05 0.15(MPT) 21.9 (ÿ0.53 V) (ÿ0.43 V)Ph2SnCl2 22.7 11.9 75.4 0.30 0.23 0.02(DPT)Ph3SnCl 10.3 5.8 15.7 0.75 0.35 0.13(TPT)
Table 3. Results of DBT and TPT determination, obtained by ASVafter ion exchange separation and enrichment (this work) andlaboratory means of the certi®cation exercise from BCR onCRM 646 fresh water sediment [20]
Organotin This work Certi®cation exercise(ng/g dry sediment) CRM 646
(ng/g dry sediment)mean of mean values [20]
DBT 654.6� 130.8 770.3� 117.2TPT 29.2� 9.0 34.9� 5.1
134 K.-M. OchsenkuÈhn et al.

[10] J. Szpunar-Lobinska, C. Witte, R. Lobinski, F. C. Adams,Fresenius J. Anal. Chem. 1995, 351, 351.
[11] M. D. Booth, B. Fleet, Anal. Chem. 1970, 42, 825.[12] K. Hasebe, Y. Yamamoto, T. Kambara, Fresenius J. Anal.
Chem. 1982, 310, 234.[13] P. Kenis, A. Zirino, Anal. Chim. Acta 1983, 149, 157.[14] H. Kitamura, A. Sugimae, M. Nakamoto, Bull. Chem. Soc.
Jpn. 1985, 58, 2641.[15] A. M. Bond, N. M. McLachlan, Anal. Chim. Acta 1988, 204, 151.[16] C. M. G. van der Berg, S. H. Khan, Analyst 1991, 116, 585.[17] M. OchsenkuÈhn-Petropoulou, G. Poulea, G. Parissakis,
Mikrochim. Acta 1992, 109, 93.
[18] M. OchsenkuÈhn-Petropoulou, K. M. OchsenkuÈhn, G. Parissa-kis, A. N. Giannakis, H. D. Smith, Can. J. Appl. Spectrosc.1995, 40, 66.
[19] A. M. Bond, N. J. Turoczy, R. J. Carter, Anal. Chim. Acta1995, 310, 109.
[20] Minutes of the Certi®cation Meeting on Organotin in Fresh-water Sediment. Amsterdam, 21 September 1998 (EU projectMAT 1-CT 94-071).
[21] K. M. OchsenkuÈhn, M. OchsenkuÈhn-Petropoulou, F. Tsopelas,L. Mendrinos, European Conference on AnalyticalChemistry, Euroanalysis XI. Lisbon-Portugal, 3±9 September2000.
Different Behavior of Organotin Compounds by Anodic Stripping Voltammetry 135