Faulting landforms from side- by-side (transform) motion Strike-slip faulting and landforms.
Differences in Source and Ground Motion Characteristics between
Shallow and Buried Faulting
Paul SomervilleURS
Pasadena, CA
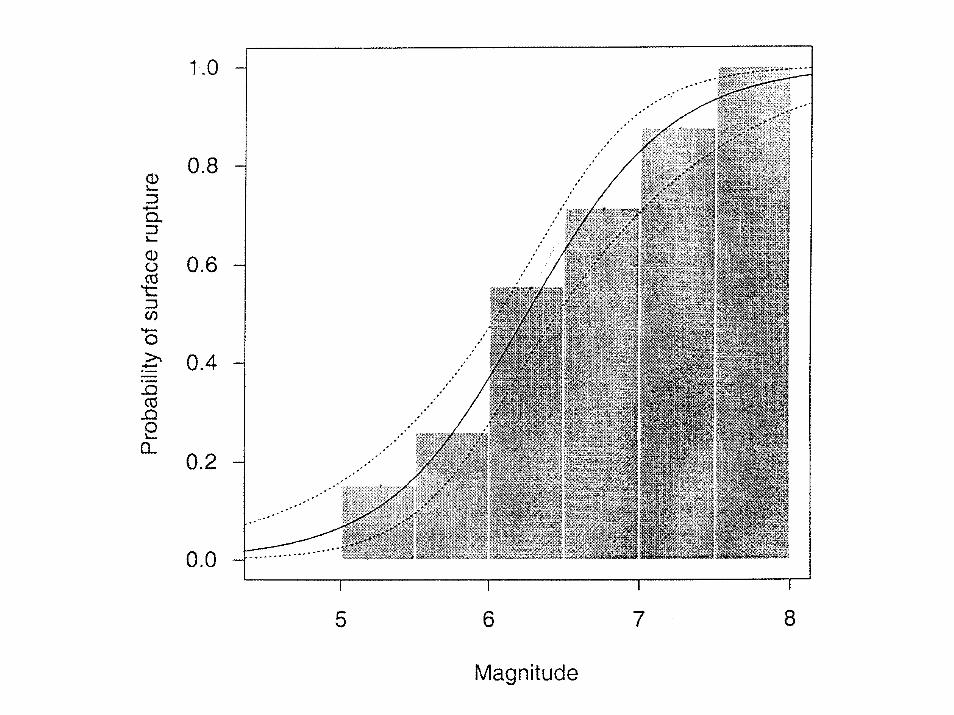
Evidence for Differences in Source and Ground Motion Characteristics between
Surface and Buried Earthquakes
• Asperity characteristics• Recorded ground motions • Presence of precariously balanced rocks near
major surface faults• Slip velocities from kinematic rupture models of
past earthquakes• Fracture energy from dynamic rupture models of
past earthquakes• Velocity hardening in dynamic rupture models
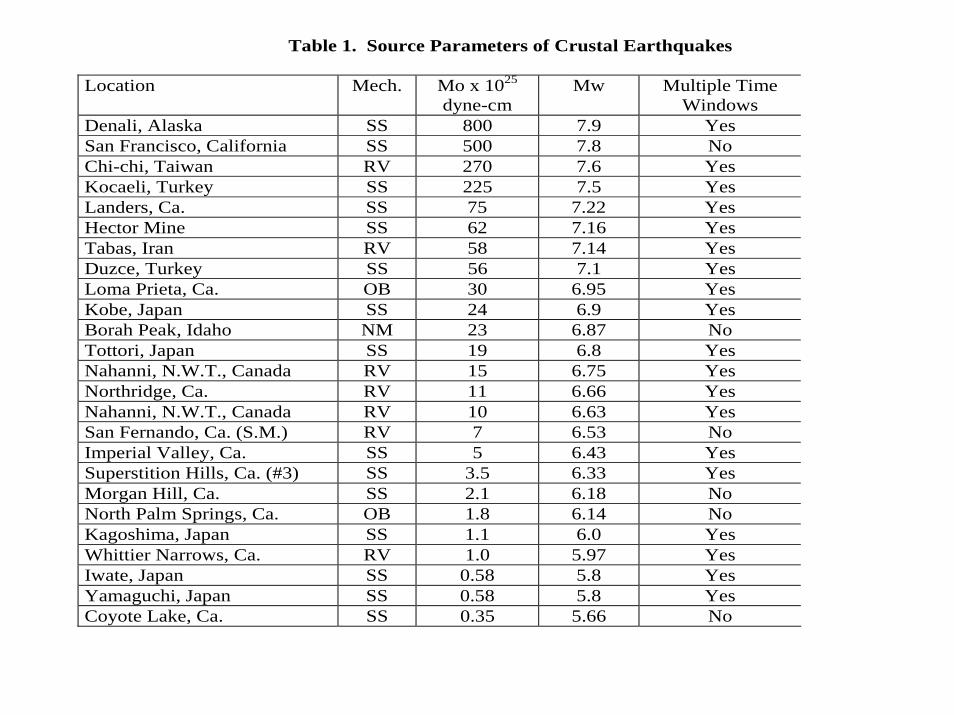
Table 1. Source Parameters of Crustal Earthquakes
Location Mech. Mo x 1025 dyne-cm
Mw Multiple Time Windows
Denali, Alaska SS 800 7.9 Yes San Francisco, California SS 500 7.8 No Chi-chi, Taiwan RV 270 7.6 Yes Kocaeli, Turkey SS 225 7.5 Yes Landers, Ca. SS 75 7.22 Yes Hector Mine SS 62 7.16 Yes Tabas, Iran RV 58 7.14 Yes Duzce, Turkey SS 56 7.1 Yes Loma Prieta, Ca. OB 30 6.95 Yes Kobe, Japan SS 24 6.9 Yes Borah Peak, Idaho NM 23 6.87 No Tottori, Japan SS 19 6.8 Yes Nahanni, N.W.T., Canada RV 15 6.75 Yes Northridge, Ca. RV 11 6.66 Yes Nahanni, N.W.T., Canada RV 10 6.63 Yes San Fernando, Ca. (S.M.) RV 7 6.53 No Imperial Valley, Ca. SS 5 6.43 Yes Superstition Hills, Ca. (#3) SS 3.5 6.33 Yes Morgan Hill, Ca. SS 2.1 6.18 No North Palm Springs, Ca. OB 1.8 6.14 No Kagoshima, Japan SS 1.1 6.0 Yes Whittier Narrows, Ca. RV 1.0 5.97 Yes Iwate, Japan SS 0.58 5.8 Yes Yamaguchi, Japan SS 0.58 5.8 Yes Coyote Lake, Ca. SS 0.35 5.66 No
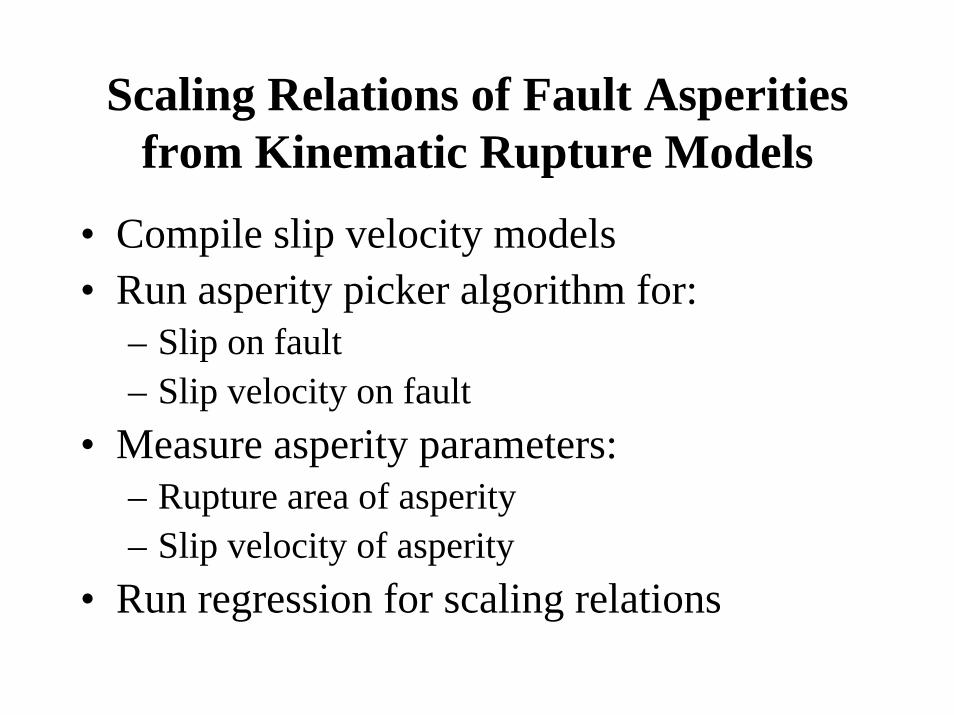
Scaling Relations of Fault Asperities from Kinematic Rupture Models
• Compile slip velocity models• Run asperity picker algorithm for:
– Slip on fault– Slip velocity on fault
• Measure asperity parameters:– Rupture area of asperity– Slip velocity of asperity
• Run regression for scaling relations


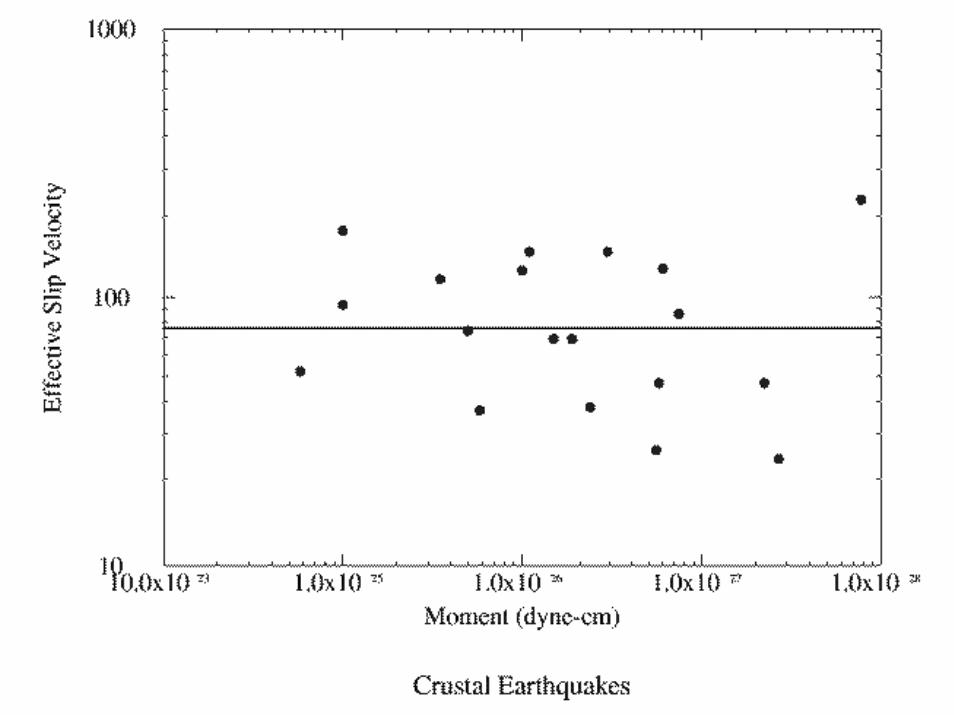
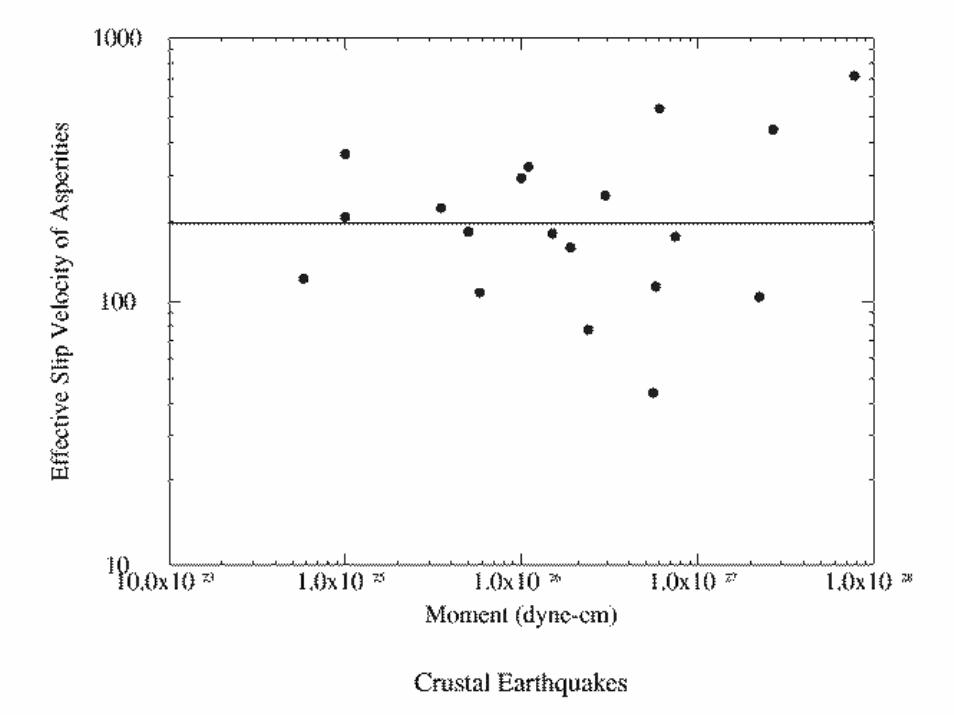
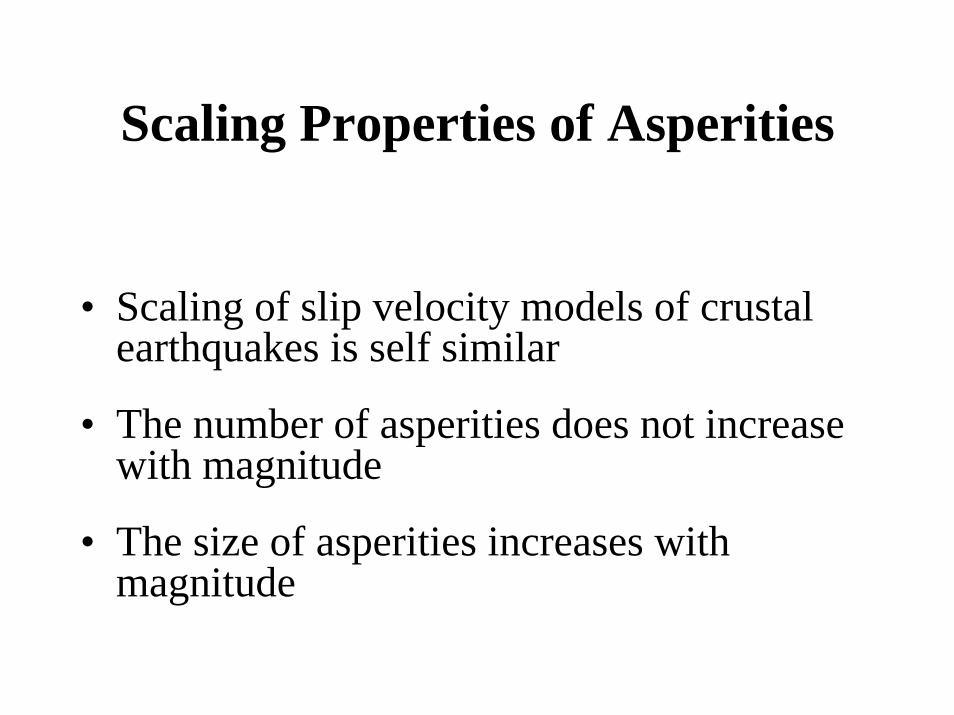
Scaling Properties of Asperities
• Scaling of slip velocity models of crustalearthquakes is self similar
• The number of asperities does not increase with magnitude
• The size of asperities increases with magnitude
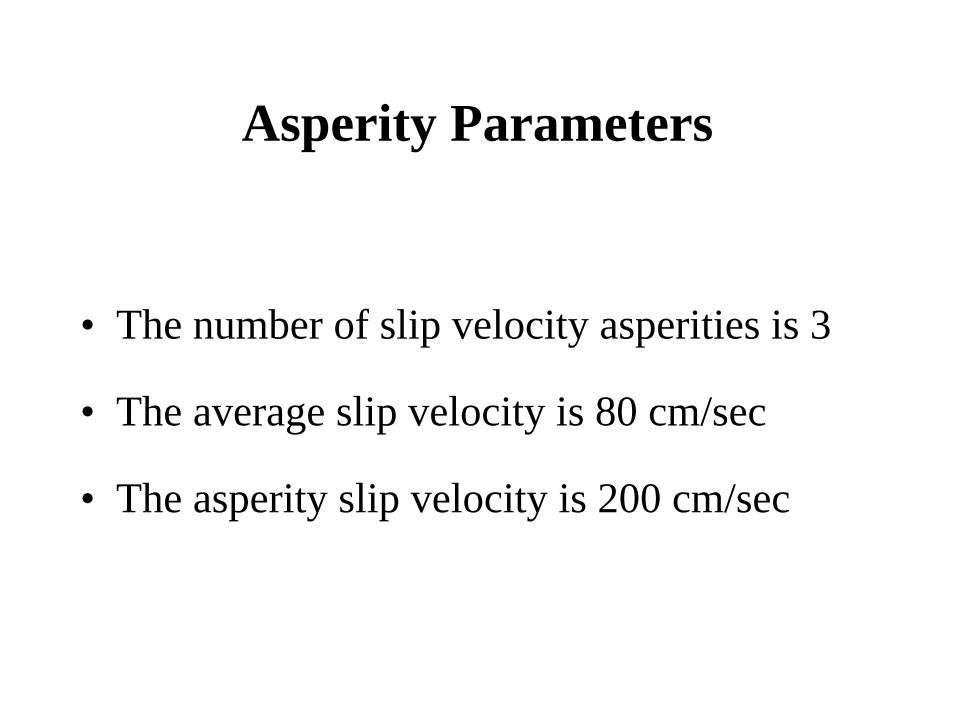
Asperity Parameters
• The number of slip velocity asperities is 3
• The average slip velocity is 80 cm/sec
• The asperity slip velocity is 200 cm/sec
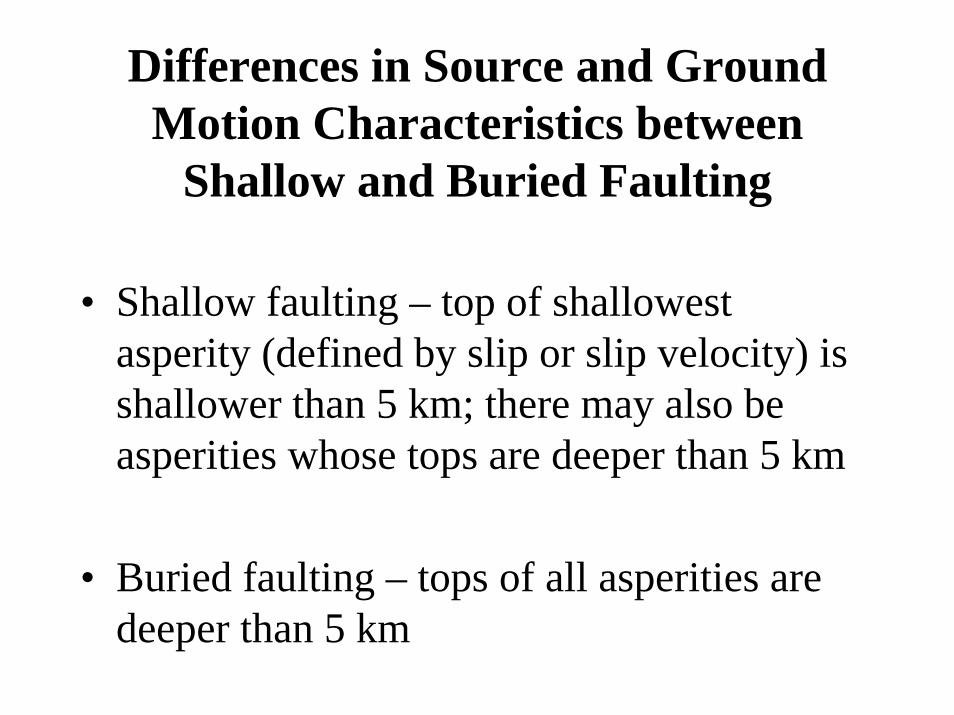
Differences in Source and Ground Motion Characteristics between
Shallow and Buried Faulting
• Shallow faulting – top of shallowest asperity (defined by slip or slip velocity) is shallower than 5 km; there may also be asperities whose tops are deeper than 5 km
• Buried faulting – tops of all asperities are deeper than 5 km
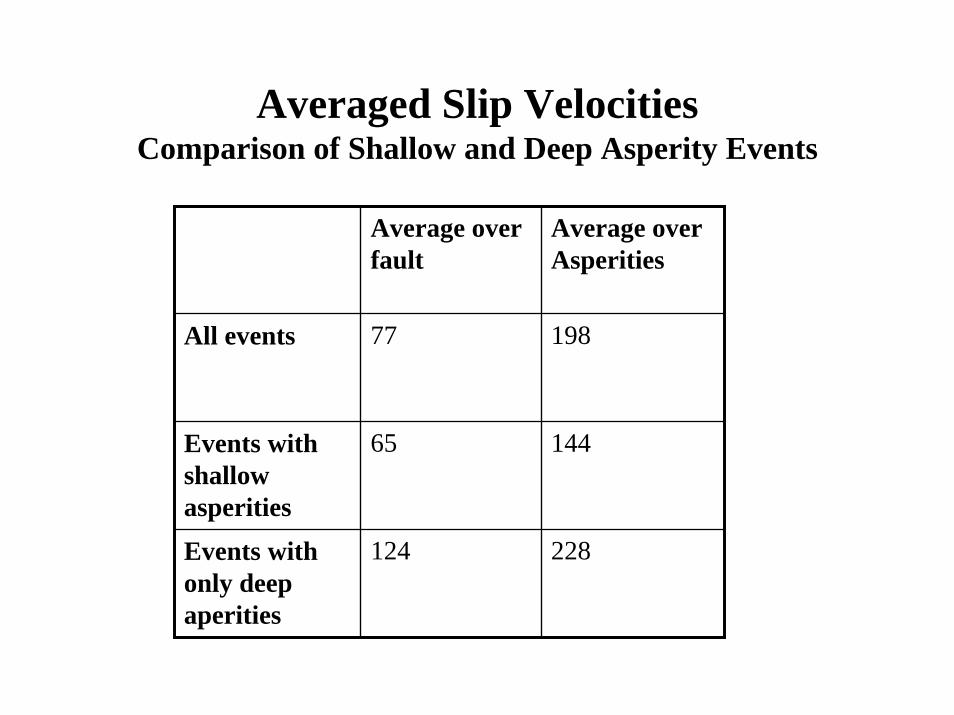
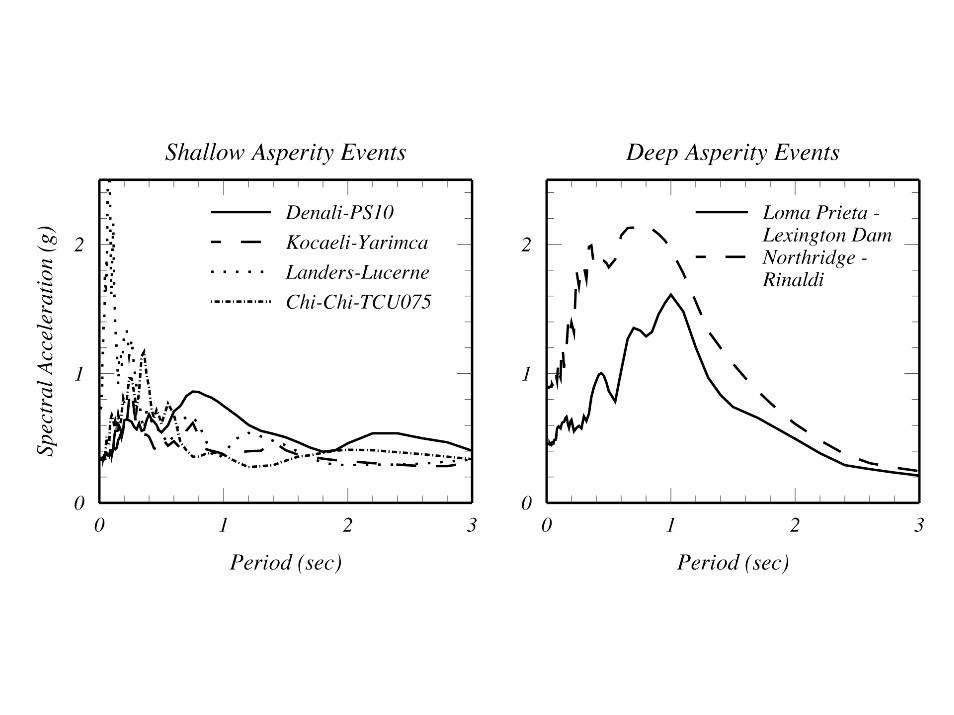
Averaged Slip Velocities Comparison of Shallow and Deep Asperity Events
Average over fault
Average over Asperities
All events 77 198
Events with shallow asperities
65 144
Events with only deep aperities
124 228


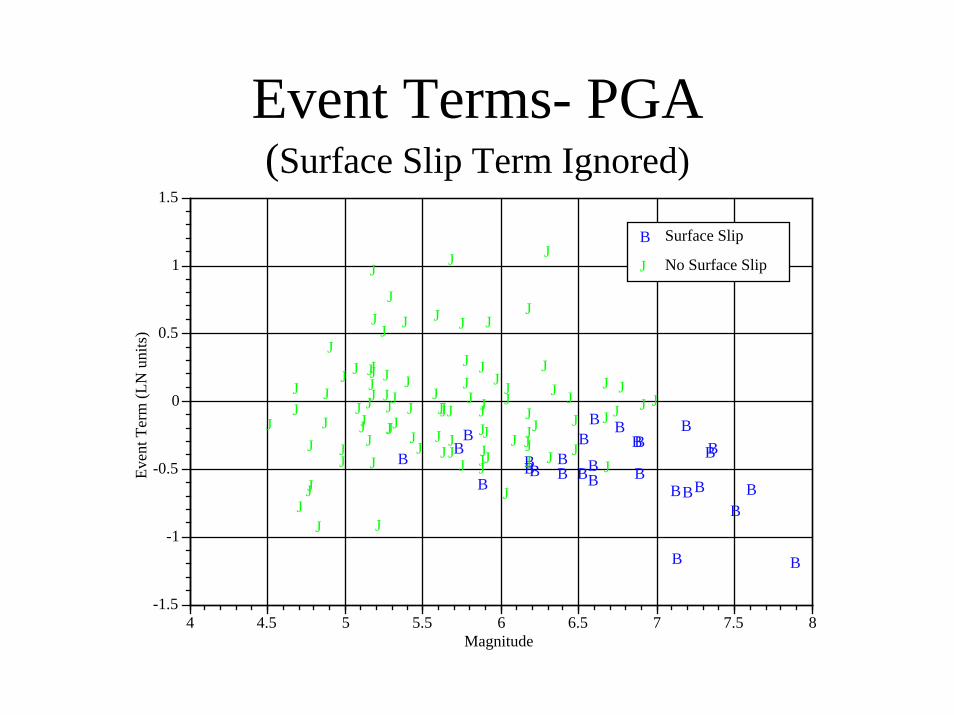
Event Terms- PGA(Surface Slip Term Ignored)
B
B
B
BBB
B B
BBBB
BBB
BB
B
B
BB
BB
B
B
B
B
B
JJ
J
JJ
J
J
J
JJ
J
J J
JJ
J
J
J
J
JJJ
J J
JJ
J
J
JJ
J
J
J
JJJ
JJ J
J
J
J
J
J
J
JJJ
J
J
J
J
J
J
JJ
J
J
J
J
J
J
J
J
J JJ
JJJ
J
J
J
J
J J
J
J
J
JJ
JJ
J
J
J
J
J
J
J
J
JJ
J
J
-1.5
-1
-0.5
0
0.5
1
1.5
4 4.5 5 5.5 6 6.5 7 7.5 8
Even
t Ter
m (L
N u
nits
)
Magnitude
B Surface Slip
J No Surface Slip
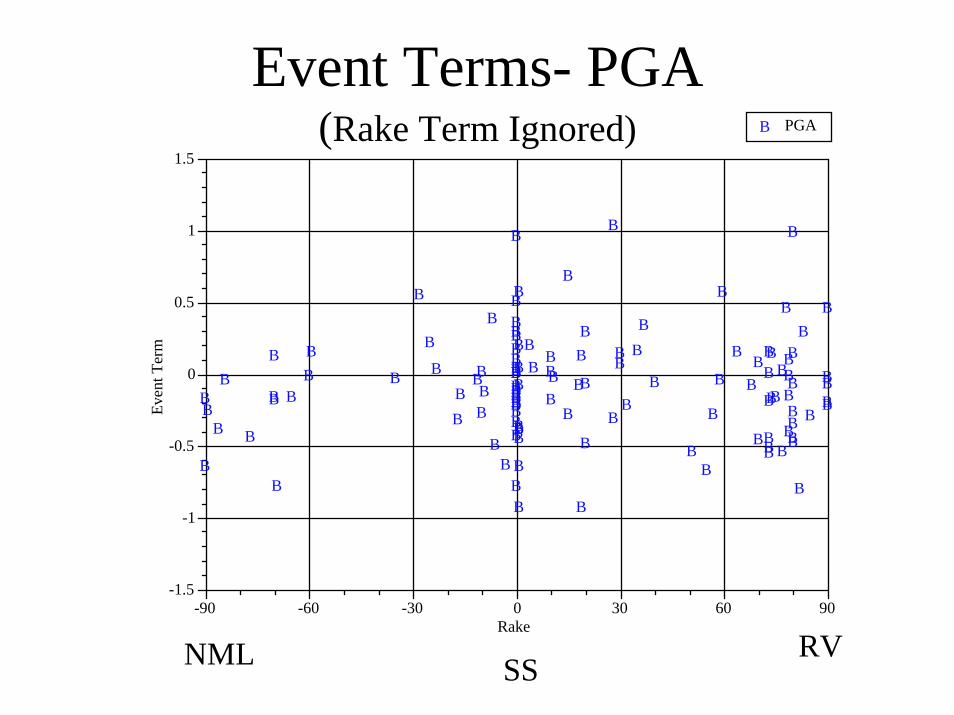
Event Terms- PGA(Rake Term Ignored)
BBB
B
BB
B
B
B B
B
BB
BB
B
B
B
B
BBB BB
BB
B
B
BB
B
B
B
BBBB
BB
B
B
B
B
B
B
BB B
B
BB
B
B
B
BB B
B
B
B
B
B
B
B
BB
B
BB B
B
B
B
B
BB
B
B
B
BB
BB
B
B
B
B
B
B
B
BB
B
BB
BB B
B B
B
B
BB
B
B
B
BB
B
B
B
B
B
B
B
B
BB
B
B
-1.5
-1
-0.5
0
0.5
1
1.5
-90 -60 -30 0 30 60 90
Even
t Ter
m
Rake
B PGA
RVNML SS
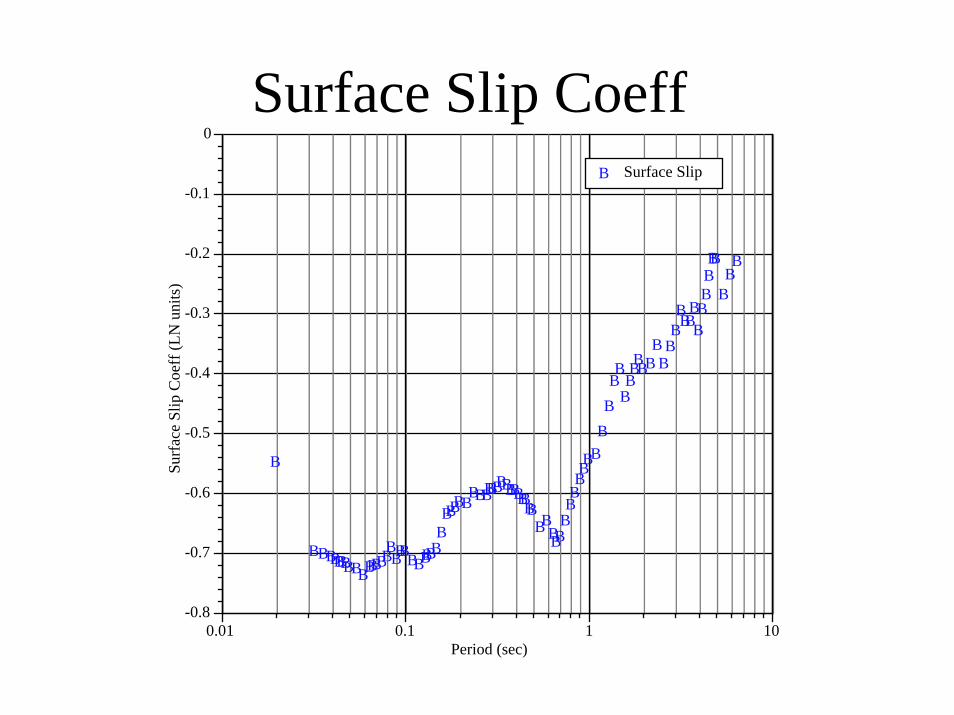
Surface Slip Coeff
B
BBBBBBBBBBBBBBBBBBBBBBBBB
BBBB
BBBBBBBB
BBBBBBBBBBB
BBBBBBBBB
BBBBB
BBBBBB
BBBBBBB
BBBBBBB
BBB
-0.8
-0.7
-0.6
-0.5
-0.4
-0.3
-0.2
-0.1
0
0.01 0.1 1 10
Surf
ace
Slip
Coe
ff (L
N u
nits
)
Period (sec)
B Surface Slip

Evidence from Recorded Strong Ground Motions
• Ground motion is weaker for earthquakes that break the surface than for earthquakes that do not
• Ground motion is weaker for earthquakes having asperities within 5 km of the surface than for earthquakes that do not

Evidence from Precariously Balanced Rocks
The presence of precariously balanced rocks near major faults (e.g. the San Andreas fault) appears to be inconsistent with current ground motion models (Brune, Anooshepoor, Purvance, Anderson, et al)Possible problems with existing ground motion models:
• Limitations of the ergodic assumption
• Variability in ground motion level too high
• Median ground motion level to high

Analysis using Vector Valued Seismic Hazard
Toppling of rocks depends on both peak acceleration PGA and peak velocity PGV
• Hazard surface for PGA and PGV
• Fragility surface for PGA and PGV
• Combine to give probability of toppling as a function of return period
• Results are incompatible with the presence of balanced rocks
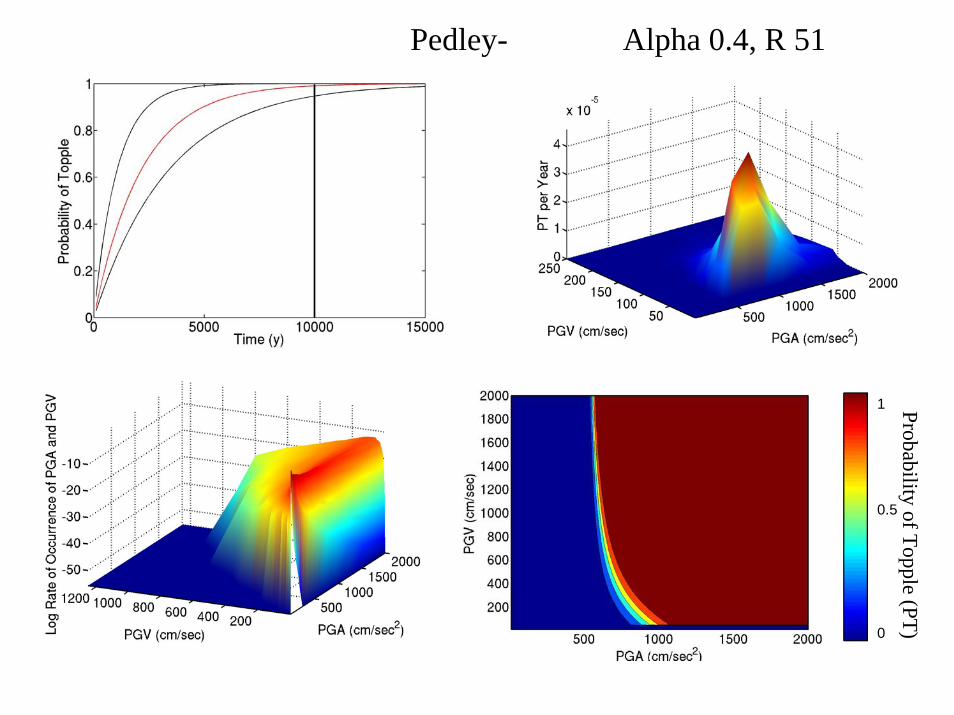
Pedley- Alpha 0.4, R 51
1
0.5
0
Probability of Topple (PT)
Evidence from Precarious Rocks
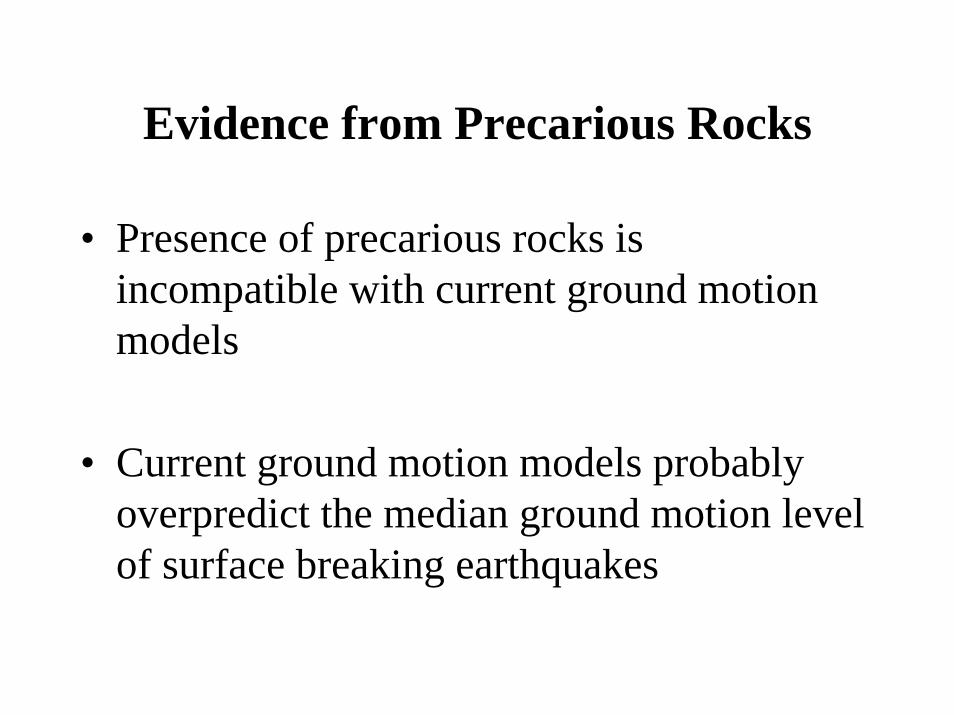
• Presence of precarious rocks is incompatible with current ground motion models
• Current ground motion models probably overpredict the median ground motion level of surface breaking earthquakes
Physical Insight into Differences in Source and Ground Motion
Characteristics between Surface and Buried Faulting
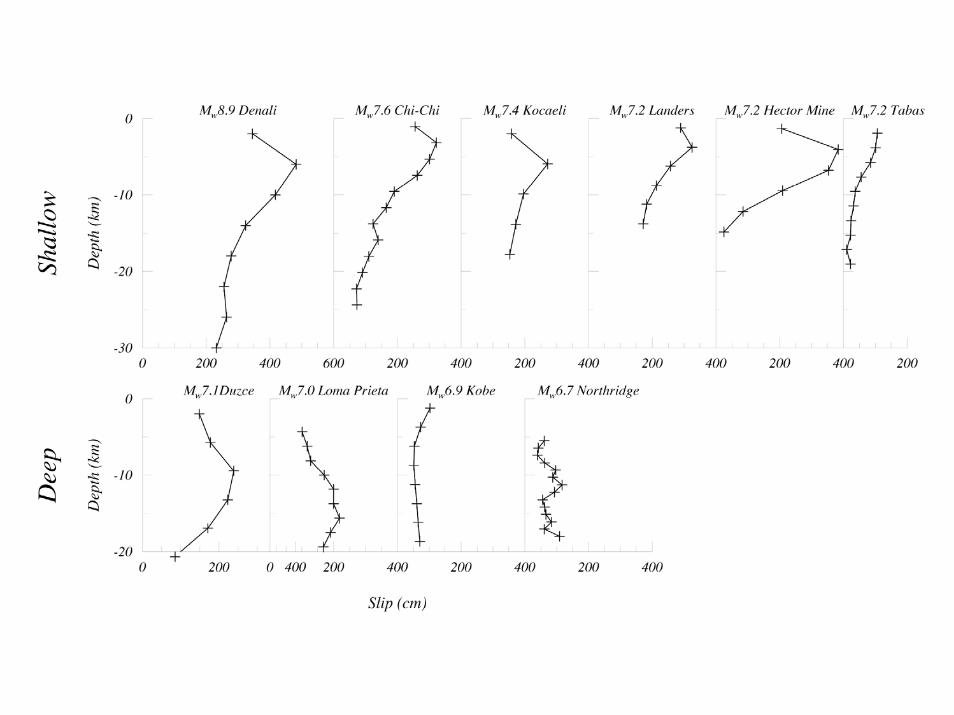

Evidence from Kinematic Rupture Models of Crustal Earthquakes
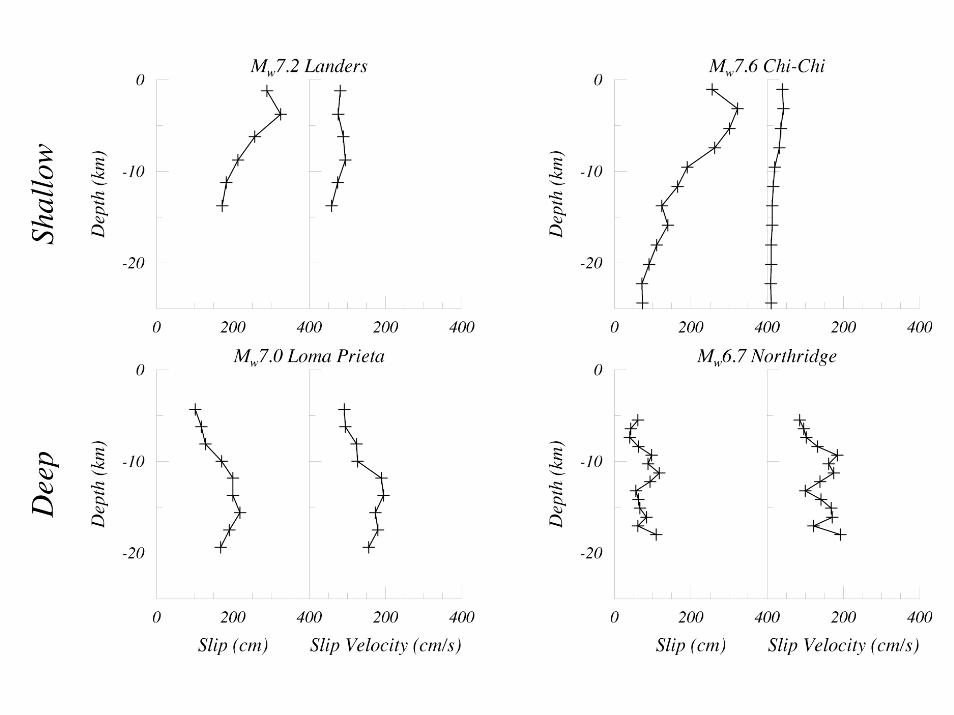
• Shallow faulting – fault slip displacement may be large but slip velocity is low
• Buried faulting - fault slip displacement may be small but slip velocity may be large

Evidence from Dynamic Rupture Parameters of Shallow and Buried Faulting Earthquakes
Defined surface rupture(1) Izmit Dalguer(2) Kobe Song(3) Landers Song (4) Landers Pitarka
Defined subsurface rupture(5) Northridge Guatteri(6) Northridge Guatteri(7) Loma Prieta Song
Undefined rupture(8) Tottori Dalguer(9) Kagoshima Dalguer(10) Yamaguchi Dalguer(11) Whittier N. Song
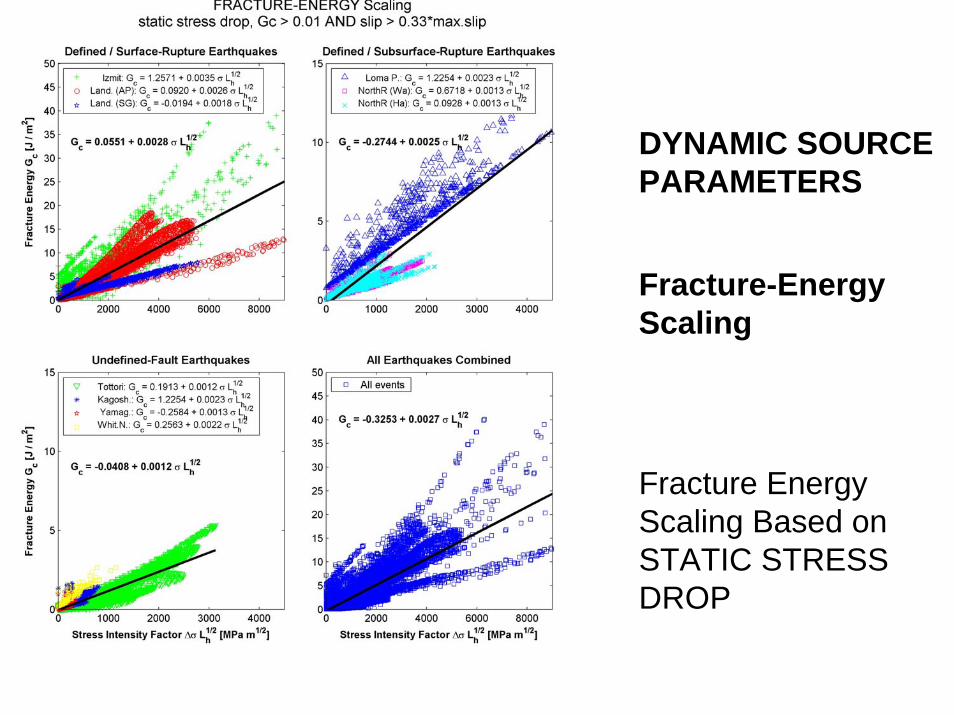
DYNAMIC SOURCE PARAMETERS
Fracture-Energy Scaling
Fracture Energy Scaling Based on STATIC STRESS DROP

Fracture Energy and Stress Intensity Factor
• Large for defined surface faulting events
• Small for defined subsurface and undefined faults
• Large fracture energy events may produce mainly long period seismic radiation
• This is consistent with surface faulting events producing weak high frequency ground motions
Evidence from Dynamic Rupture Modeling
Day and Ely, BSSA 2003
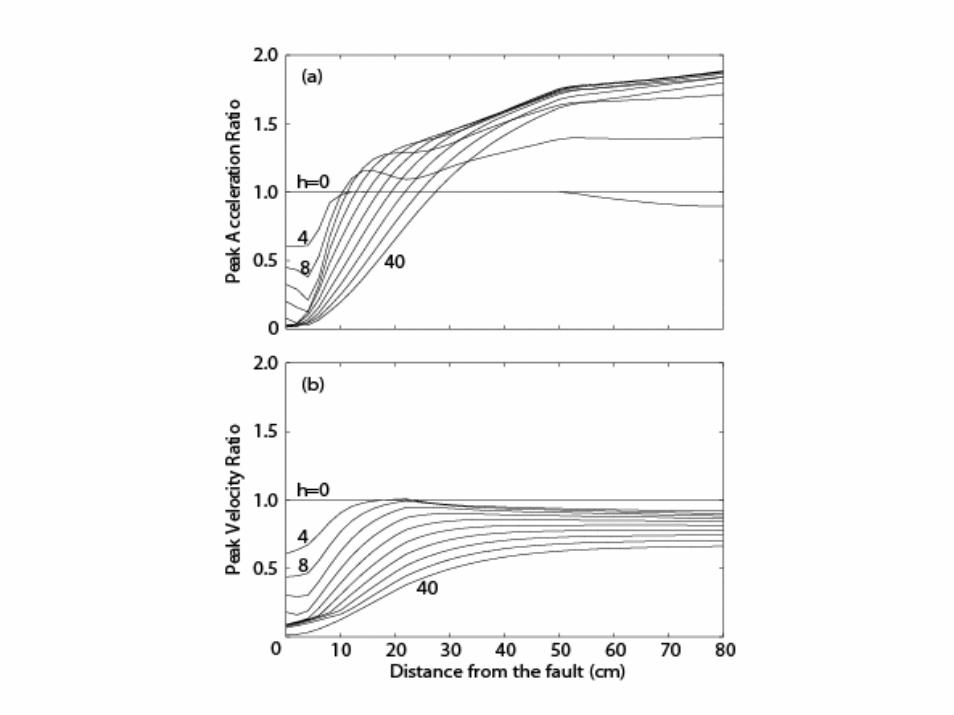
• Velocity hardening in the shallow part of the fault causes a stopping phase
• The stopping phase causes larger high frequency ground motions near a buried fault than near a surface breaking fault


Features of Rupture in the Shallow Part of Fault (0 – 5 km depth)
• Controlled by velocity strengthening• Larger slip weakening distance Dc• Larger fracture energy i.e.much energy absorbed
from the crack tip• Lower rupture velocity• Lower slip velocity• Lower ground motions than buried faulting events

Evidence for Differences in Source and Ground Motion Characteristics between
Surface and Buried Earthquakes
• Weak ground motions recorded near major surface faulting earthquakes
• Presence of precariously balanced rocks near major surface faults
• Low slip velocities at shallow depths from kinematicrupture models of past earthquakes
• Large fracture energy from dynamic rupture models of past earthquakes
• Stopping phases from velocity hardening in dynamic models of buried faulting
Implications for Characterizing Fault Asperities
• Properties of shallow and deep asperities may be different
• At a given site, the deterministic ground motions may be controlled by deep asperities, not shallow asperities
• This may not be true of probabilistic ground motions
– Surface breaking fault may have high slip rate and short earthquake recurrence
– Buried fault may have low slip rate and long earthquake recurrence
Implications for Seismic Hazards
• Ground motion amplitudes from shallow faulting earthquakes may have been overestimated in current seismic hazard estimates
• Need separate ground motion models for shallow and buried faulting
• Need criteria for predicting surface and/or subsurface faulting on mapped surface faults
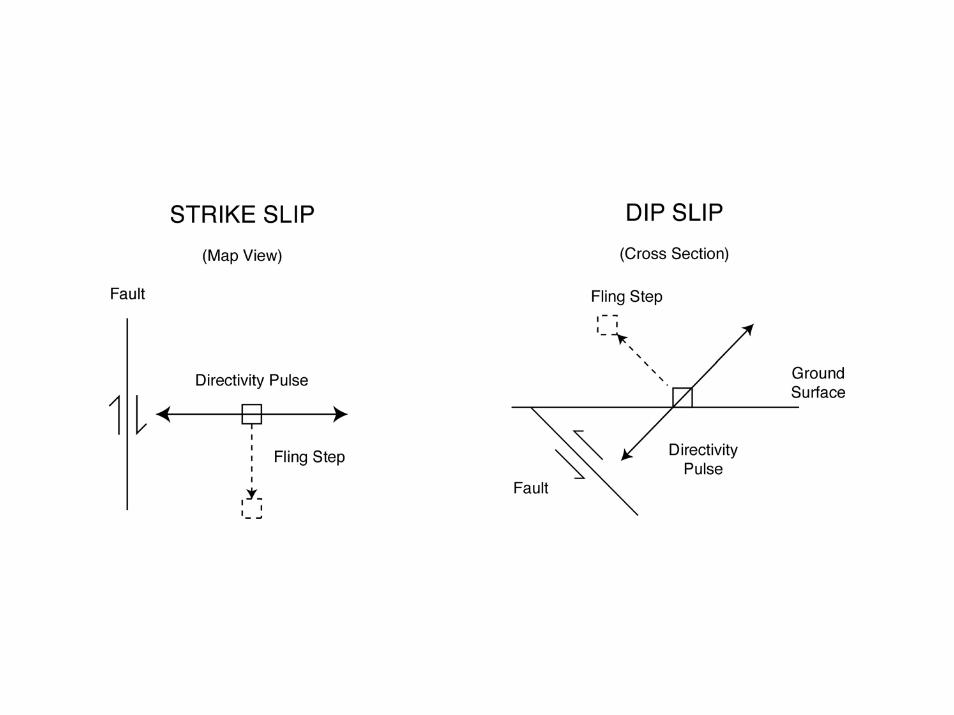
Near Fault Rupture Directivity Pulse
• Geometry and Orientation
• Magnitude Scaling of Period of Pulse

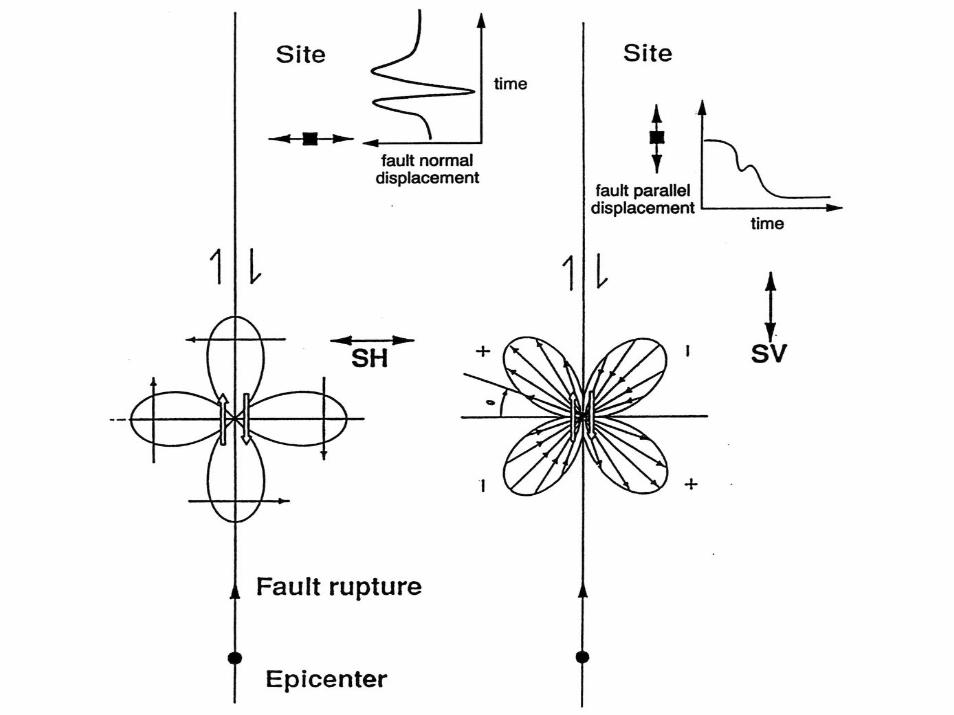
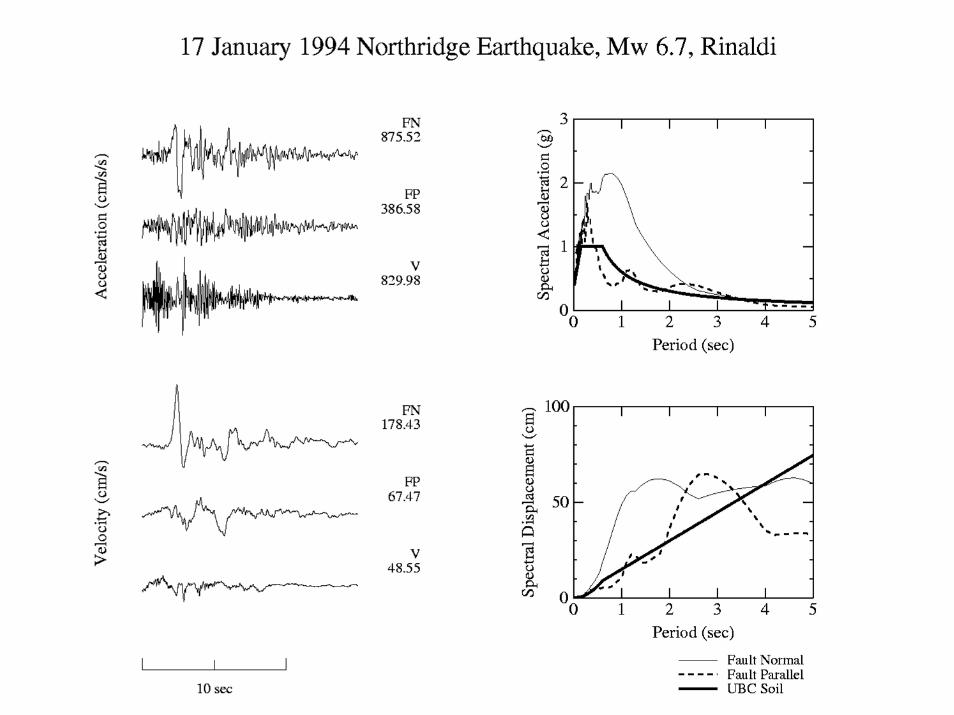
Rupture Directivity Pulse
• Large pulse of ground motion at near-fault sites
• Occurs on the fault normal component
• Causes large spectral acceleration at periods (longer than 0.5 sec) that depend on Mw

Fling Step
• Large permanent displacement of ground
• Occurs on the fault parallel component for strike-slip; fault normal for dip-slip
• May take several seconds to occur
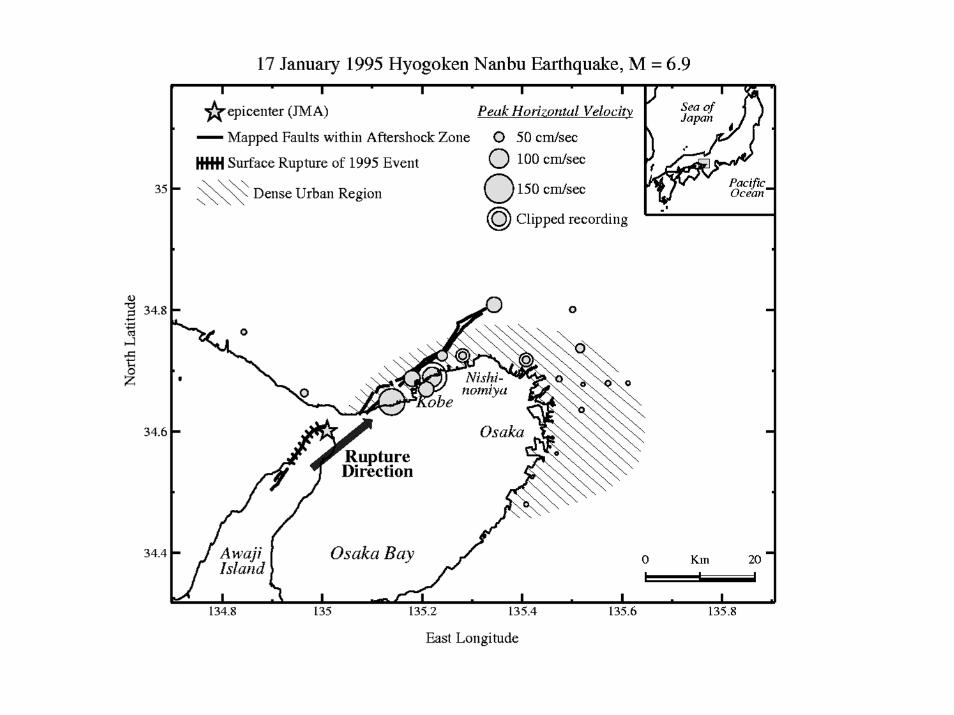


Conditions for Forward Directivity
• Rupture propagates toward the site
• The slip on the fault is aligned with the rupture propagation direction
• Away from epicenter for strike-slip faulting
• Updip from hypocenter for dip-slip faulting

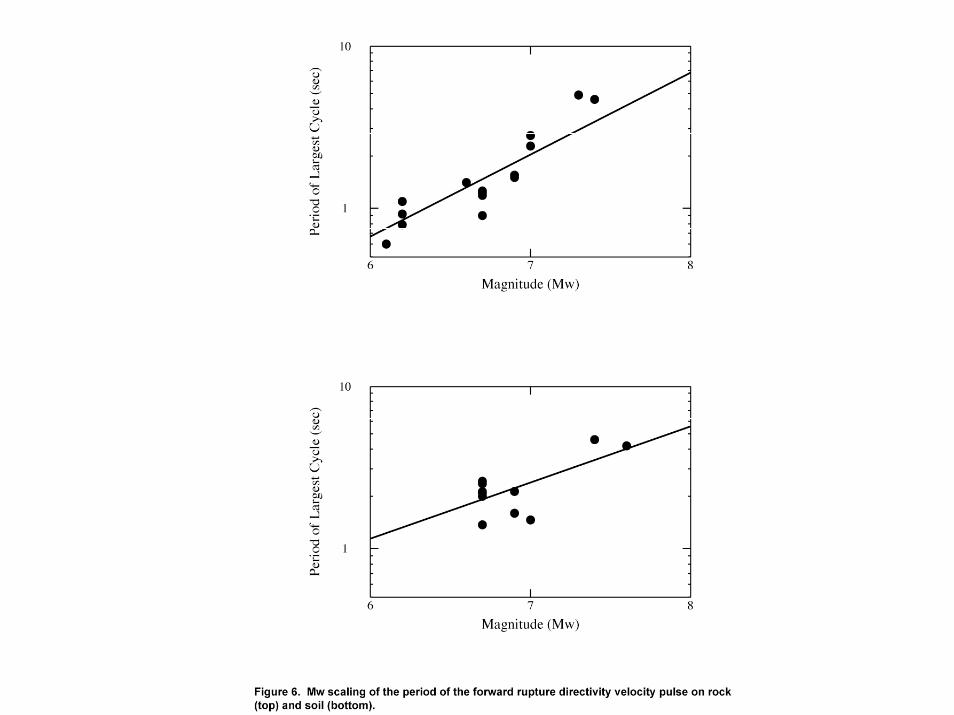
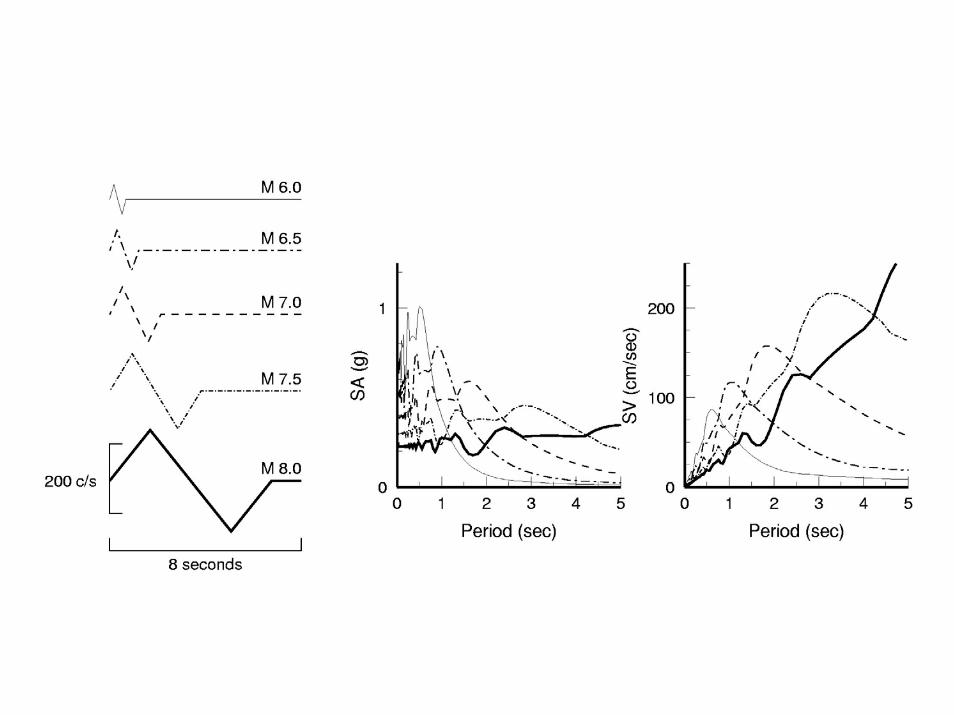
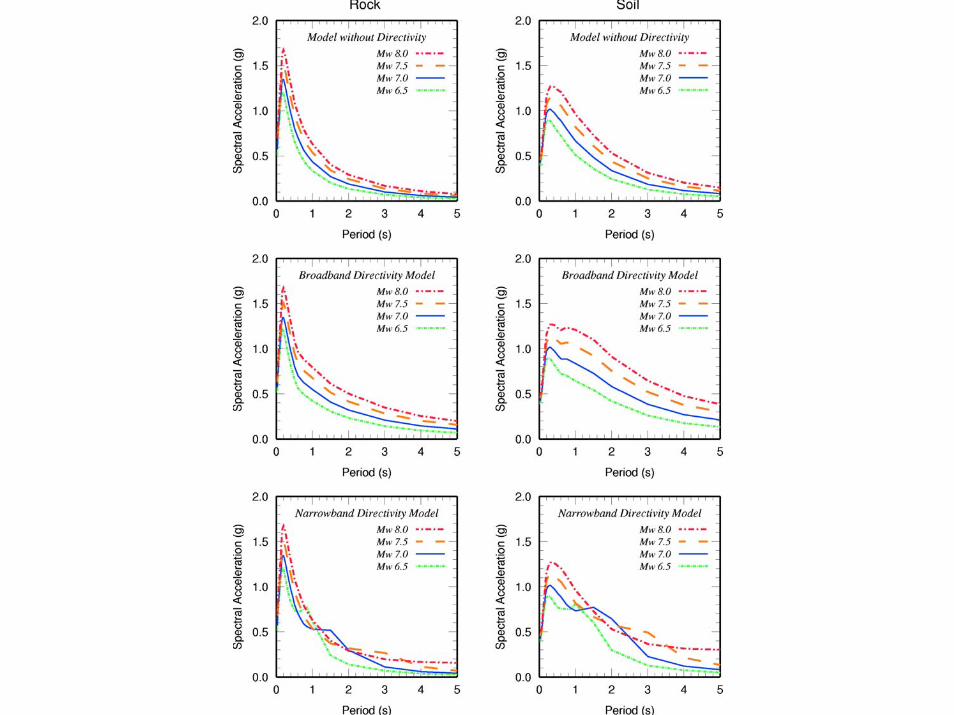

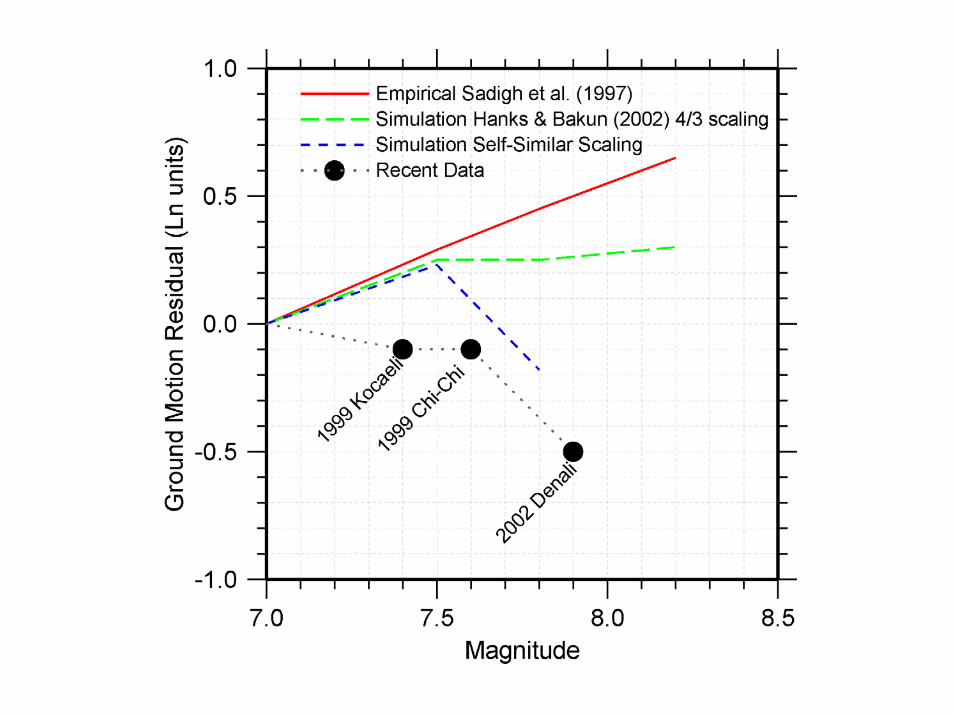
Magnitude Scaling Of Near Fault Ground Motions
• The forward directivity pulse is narrow band
• The period of the pulse increases with magnitude
• The pulse causes a peak in the acceleration response spectrum whose period increases with magnitude
Implications of Magnitude Scaling of Near Fault Directivity Pulse
• Ground motion amplitudes do not increase uniformly with magnitude at all response spectral periods
• At 1.5 seconds period, elastic response for M 7 is stronger than for M 7.5
• The difference between M 7 and M 7.5 may be less for inelastic response