Differences in Retention-Related Risk Factors and ...
27
University of Nebraska - Lincoln DigitalCommons@University of Nebraska - Lincoln Honors eses, University of Nebraska-Lincoln Honors Program Spring 4-16-2018 Differences in Retention-Related Risk Factors and Potential Resources across First-Generation and Non-First-Generation College Students Taylor Lofdahl University of Nebraska-Lincoln Follow this and additional works at: hps://digitalcommons.unl.edu/honorstheses Part of the Educational Leadership Commons , and the Psychology Commons is Article is brought to you for free and open access by the Honors Program at DigitalCommons@University of Nebraska - Lincoln. It has been accepted for inclusion in Honors eses, University of Nebraska-Lincoln by an authorized administrator of DigitalCommons@University of Nebraska - Lincoln. Lofdahl, Taylor, "Differences in Retention-Related Risk Factors and Potential Resources across First-Generation and Non-First- Generation College Students" (2018). Honors eses, University of Nebraska-Lincoln. 26. hps://digitalcommons.unl.edu/honorstheses/26
Transcript of Differences in Retention-Related Risk Factors and ...

University of Nebraska - LincolnDigitalCommons@University of Nebraska - Lincoln
Honors Theses, University of Nebraska-Lincoln Honors Program
Spring 4-16-2018
Differences in Retention-Related Risk Factors andPotential Resources across First-Generation andNon-First-Generation College StudentsTaylor LofdahlUniversity of Nebraska-Lincoln
Follow this and additional works at: https://digitalcommons.unl.edu/honorstheses
Part of the Educational Leadership Commons, and the Psychology Commons
This Article is brought to you for free and open access by the Honors Program at DigitalCommons@University of Nebraska - Lincoln. It has beenaccepted for inclusion in Honors Theses, University of Nebraska-Lincoln by an authorized administrator of DigitalCommons@University of Nebraska- Lincoln.
Lofdahl, Taylor, "Differences in Retention-Related Risk Factors and Potential Resources across First-Generation and Non-First-Generation College Students" (2018). Honors Theses, University of Nebraska-Lincoln. 26.https://digitalcommons.unl.edu/honorstheses/26

Running head: RISK FACTORS ACROSS FIRST-GENERATION STUDENTS
1
DIFFERENCES IN RETENTION-RELATED RISK FACTORS AND POTENTIAL
RESOURCES ACROSS FIRST-GENERATION AND NON-FIRST-GENERATION
COLLEGE STUDENTS
An Undergraduate Honors Thesis
Submitted in Partial fulfillment of
University Honors Program Requirements
University of Nebraska- Lincoln
By
Taylor Lofdahl, BA
Agricultural Education- Leadership
College of Agricultural Sciences and Natural Resources
April 16, 2018
Faculty Mentor:
Arthur “Trey” Andrews III, PhD, Psychology

RISK FACTORS ACROSS FIRST-GENERATION STUDENTS 2
Abstract
This study was completed to examine the differences in experience of first-generation
and non-first-generation college students both before and during college. The purpose focused on
retention-related risk factors as well as potential resources. The study was conducted through an
online survey system called Qualtrics. There were 246 participants from the psychology
department of the University of Nebraska- Lincoln, and participants received research credits for
completing the survey. The study included measures for stress, depression symptoms, anxiety,
perceived support as well as questions regarding academic practices and biographical
information. The results of the study were analyzed using SPSS software, and they indicated that
high-achieving first-generation and non-first-generation students do not significantly differ
across many academic practices during college; however, implications do exist for first-
generation college students in preparation for college as well as their attainment of social and
cultural capital upon arriving on a college campus.
Key Words: First-generation, non-first-generation, college students, cultural capital, high-
achieving

RISK FACTORS ACROSS FIRST-GENERATION STUDENTS 3
Dedication
I would like to thank Dr. Trey Andrews for his time and support throughout the duration
of this project. Learning about research has been incredibly influential for me, and it has
provided the confidence needed to pursue research in my future studies and work. Additionally,
his patience and encouragement at each step of the process have made the completion of this
thesis possible. Finally, I would like to thank the UCARE program of the University of
Nebraska- Lincoln for providing funding for students to get involved with research. I would have
never imagined myself participating in such a project a few years ago, but UCARE made it
possible for me to dive into a new experience with support and excitement.

RISK FACTORS ACROSS FIRST-GENERATION STUDENTS 4
Differences in Retention-Related Risk Factors and Potential Resources Across First-
Generation and Non-First-Generation College Students
For each student, there is a different reason or purpose for pursuing a college degree, and
for first-generation students, these aspirations are frequently cut short. First-generation students,
or students whose parents received only a high school diploma or less, receive lower GPAs
(Hottinger & Rose, 2006; Inman & Mayes, 1999), graduate college less often (Hottinger & Rose,
2006; Ishitani, 2006), and possess lower levels of the cultural and social capitals necessary to
successfully navigate the college environment as compared to peers whose parents attended
college (Engle, 2007, pg. 26; Hottinger & Rose, 2006, p. 116; Ishitani, 2006; Dumais & Ward,
2009). These disparities, greatly influenced by the preparation and support received from
parents, have contributed to major gaps in educational experiences and, ultimately, post-graduate
success (Engle, 2007). The current study focused on the experiences of college students to best
understand which campus resources and support systems are most beneficial for the retention of
first-generation college students.
Before setting foot on a college campus, first-generation students may already be at a
disadvantage. In a study conducted by the National Center for Education Statistics (NCES),
Hottinger and Rose (2006) found that first-generation college students received lower SAT
scores compared with non-first-generation students (SAT averages were 858 compared to 1011,
respectively). Additionally, first-generation students often had lower high school GPAs than
their counterparts whose parents attended college (GPAs averaging 2.6 compared to 2.9,
respectively). With the SAT and GPA being important for the college application process,
disparities arise in the college entrance rates and prestige of universities attended by first-
generation and non-first-generation college students (Engle, 2007; Inman & Mayes, 1999).

RISK FACTORS ACROSS FIRST-GENERATION STUDENTS 5
Once admitted into college, weaker preparations in high school for first-generation
students are reflected in their academic decisions. In a study of 7,400 12-graders in the National
Education Longitudinal Study of 1988, Chen (2005) found that first-generation students are more
likely to take remedial courses their first semester of college than non-first-generation students
(55% compared with 27%). Additionally, first-generation students experience greater difficulty
in selecting a major in college (33% without a major compared with 13% for non-first-generation
students), and they often earn less credit hours in their first year of college (18 credit hours
compared with 25, respectively). These disadvantages experienced by first-generation students in
the first year of college will likely increase the length of time and perhaps costs necessary to
attain a college degree.
There are a variety of other characteristics common of first-generation students. In the
same NCES study mentioned previously, Hottinger and Rose (2006) found that 39% of first-
generation students chose to live off campus, 49.9% chose a school within 50 miles of their
home to remain close to family members, and 22.7% had major concerns about affording their
collegiate education. Additionally, first-generation college students were more likely to be older,
from low-income households, Black or Hispanic, a part-time student, a full-time employee, and
married with dependents as compared to students whose parents have attended college (Hottinger
& Rose, 2006; Engle, 2007). These attributes greatly limit the time and resources first-generation
students are able to dedicate to academics and other collegiate pursuits (Hottinger & Rose, 2006;
Engle, 2007). Rather than joining student organizations, attending office hours, or meeting new
students at campus events, first-generation students must often spend time learning how to study
at a collegiate level, working to afford college, or perhaps resolving familial conflict associated
with being the first member to leave home and attend college (Engle, 2007).

RISK FACTORS ACROSS FIRST-GENERATION STUDENTS 6
Because the majority of college students have parents who attended college, the dominant
culture on college campuses is likely college literate, or familiar with the procedures and skills
necessary to be successful in college (Hottinger & Rose, 2006). In turn, cultural capital, or the
understanding of the dominant culture in a specified setting, may help explain the disparities
between first-generation and non-first-generation students, especially in terms of college
preparation (Hottinger & Rose, 2006; Dumais & Ward, 2009). For example, Engle (2007)
describes that non-first-generation students have an advantage because their parents, who have
experienced many of the collegiate processes previously, can better prepare and guide their
students through their experiences in applying and attending college. This advantage also
translates into higher levels of social capital, or proficiency in relationships, for non-first-
generation students. As a result of parental influence, non-first-generation students are often
better prepared to develop social connections that they may leverage to better succeed in college,
such as joining campus organizations, meeting new people, accessing campus resources, and
asking for help from faculty, staff, or peers (Engle, 2007).
Cultural and social capital may have large consequences including attrition and degree
completion (Dumais & Ward, 2009). According to a study completed by Inmann and Mayes
(1999), 10% of first-generation students dropped out after the first semester, emphasizing the
importance of the first few months of college. This pattern, certainly not unique to any one
institution, is a national concern which has been acted upon through federally funded TRIO
Programs, which provide services for individuals from disadvantaged backgrounds, have become
prominent at universities across the country (Engle, 2007). Student Support Services, a federally
funded program for students who are low-income, first generation, or have a documented
disability, currently serves students at more than 700 institutions and various structural elements,

RISK FACTORS ACROSS FIRST-GENERATION STUDENTS 7
such as learning community membership or academic peer groups, have been implemented to
create a more successful first-year experience (Thayer, 2000).
In addition to TRIO programming, other studies have identified key factors that increase
the success and experience of first-generation students in the first semester of college. First,
retention rates increase when students have routine interactions with faculty, staff, and other
students who promote their continued academic efforts (Hottinger & Rose, 2006). Interactions
such as academic advising, tutoring, office hours, or study groups, help first-generation students
find a greater sense of success and belonging on campus (Engle, 2007). Second, college
programs and curriculum must be clearly explained and understood, especially for students who
change majors throughout their college career (Hottinger & Rose, 2006). Next, support services
greatly increase a student’s chances of success, and it is important that they are easily accessible
and known by students (Hottinger & Rose, 2006). Finally, retention is best at institutions that
encourage and support academic-related behaviors so that students can develop and apply skills
that are useful on and off campus (Hottinger & Rose, 2006).
For the reasons stated above, many universities and college institutions have placed great
value in the creation and implementation of learning communities. According to Vincent Tinto
of Syracuse University, learning communities begin with shared classes which connect first-year
students within similar majors, interests, or career paths (Tinto, 1999). Generally, effective
learning communities also include shared responsibilities within the community, structured
curriculum applied to a chosen focus, and collaborative faculty members to guide the
programming (Tinto, 1999). Students who are part of a learning community have been known to
create strong self-supporting groups within their learning communities, become more

RISK FACTORS ACROSS FIRST-GENERATION STUDENTS 8
academically and socially engaged, and ultimately, persist at a higher rate than students that are
not in learning communities (Tinto, 1999).
From an economic standpoint, men and women with college degrees make more money
and have greater job opportunities than others with only a high school diploma (Hottinger &
Rose, 2006). Additionally, college graduates are more likely to have meaningful work, be
satisfied in their careers, be happier, have higher self-esteem, be healthier, be better investors,
have higher verbal and quantitative skills, be more tolerant of others, be more politically active,
and be more likely to be active within their communities (Hottinger & Rose, 2006). With this in
mind, continued improvements and support for first-generation students contribute to the
creation of a more engaged society.
Purpose
The purpose of this study is to identify retention-related risk factors and potential
resources for first-generation students as compared to non-first-generation students. The study
contributed to the literature on first-generation college students by focusing on 1) at-home and
on-campus stressors, 2) perceived support systems and sense of self, and 3) the utilization of
campus resources. The analyses of this study can be used to identify ongoing challenges for first-
generation students and opportunities for program development to increase retention rates and
create a more successful experience for first-generation students.
Methods
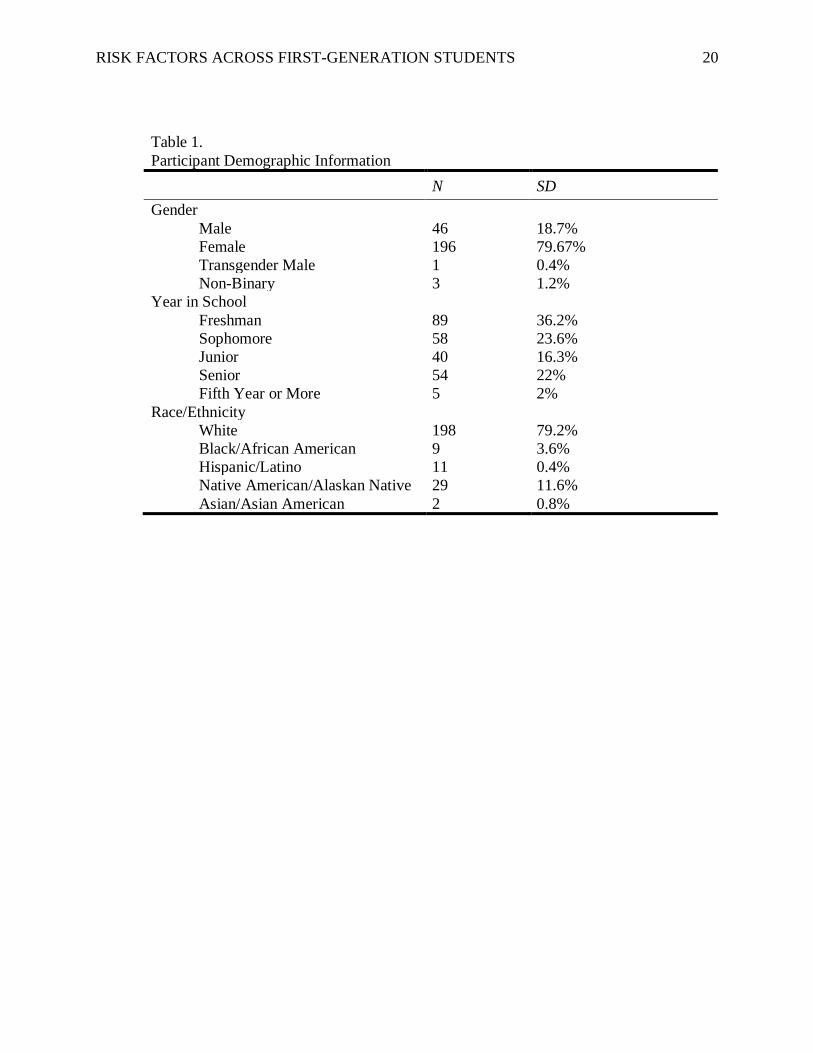
Participants
Participants were 246 undergraduate students at the University of Nebraska-Lincoln and
received course credit as compensation for their participation. Of the participants, 89 (36.2%)
were freshmen, 58 (23.6%) were sophomores, 40 (16.3%) were juniors, 54 (22%) were seniors,

RISK FACTORS ACROSS FIRST-GENERATION STUDENTS 9
and 5 (2%) were fifth-year or students or more. Most participants were women (n = 196, 79.7%);
however, 46 (18.7%) participants identified as male, 1 (0.4%) transgender male, and 3 (1.2%)
identified as non-binary. In regards to race/ethnicity, 198 (79.20%) of the participants identified
as White, 9 (3.6%) as Black/African American, 11 (4.40%) as Hispanic/Latino, 1 (0.4%) as
Native American/Alaska Native, 29 (11.60%) as Asian/Asian American, and 2 (0.8%) as other.
A minority (15.04%) of participants reported that their parents have not attended college,
and the remaining participants have had at least one parent attend college. Within the group,
57.38% reported that their parents did not graduate college. For the purpose of this study, first-
generation students will be considered as any participant whose parents did not graduate college.
Measures
Campus social integration and support. The Multidimensional Scale of Perceived
Social Support (MSPSS; Zimet et al., 1988), a 12-item questionnaire with a 7-point Likert scale
ranging from 1 (Very Strongly Disagree) to 7 (Very Strongly Agree), was included to ask
students about the people and support systems available to them, including family, friends, and
significant others. The MSPSS has proven to be psychometrically sound in diverse samples and
to have good internal reliability, test-retest reliability, and factorial validity (i.e., = 0.81 to 0.98
in non-clinical samples and 0.92 to 0.94 in clinical samples; Wongpakaran et al., 2011).
Mental health. To assess mental health symptoms, we included the Patient Health
Questionnaire, a 9-item questionnaire measuring depression (PHQ-9; Spitzer et al., 1999). We
also included the GAD-7, a seven-item measure of symptoms of Generalized Anxiety Disorder
(Spitzer et al., 2006). Both the GAD-7 and the PHQ-9 use the same format and ask participants
how often they have been bothered by various problems over the last two weeks. Participants
respond using a 4-point Likert-type scale ranging from 0 (Not at all) to 3 (Nearly every day).

RISK FACTORS ACROSS FIRST-GENERATION STUDENTS 10
Both the GAD-7 (Lowe et al., 2008) and the PHQ-9 (Spitzer et al., 2001) have been found to
have good internal consistency (i.e., = 0.89).
Stressors. To identify sources of stress and the ways in which participants respond to
stress, we incorporated the Perceived Stress Scale and the Undergraduate Stress Questionnaire.
The Perceived Stress Scale includes 10 questions in which participants respond using a 5-point
Likert scale ranging from 0 (Never) to 4 (Very Often). The PSS-10 has been evaluated to have a
minimum measure of internal consistency (i.e., > 0.70; Lee, 2012). The Undergraduate Stress
Questionnaire (USQ; Crandall et al., 1992) is an 82-item questionnaire, and participants are
asked to check all stressors from a list that have affected them in the past semester of college.
The USQ has been found to have good internal reliability (i.e., = 0.86; Akgun & Ciarrochi,
2003).
Demographics and academic achievement. We asked questions regarding their age,
gender, race/ethnicity, grades, parents’ and family members’ education levels, and high school
coursework. Additionally, we included a questionnaire related to their academic performance,
use of university resources, and history with any available learning communities.
Procedures
The study was administered online using Qualtrics, an online research platform, after
receiving research approval from the IRB board at the University of Nebraska-Lincoln.
Participants of the study were able to complete the questionnaires on a device of their choosing,
and there were no specifications for the location or amount of time required to complete the
questionnaire. Students were free to exit the survey at any time and those that reached the end of
the study received two research credits for their participation.
Data Analysis

RISK FACTORS ACROSS FIRST-GENERATION STUDENTS 11
Due to recruitment limitations, the participants of the study were largely found to be
high-achieving students, having GPAs higher than 3.0, regardless of the educational status of
their parents, which did not produce the anticipated risks associated with first-generation
students. As a result, the focus of the data analysis was altered to closely examine hypotheses
related to a high-achieving student population. Tests were conducted to focus more on
differences in compensatory strategies utilized by first-generation students in comparison to their
non-first-generation peers.
The items included in this study were selected on the basis of being stressors most often
cited as influencing the experience of a first-generation student. The order of the questionnaires
went as follows: PHQ-9, CASQ, Perceived Stress Scale, Undergraduate Stress Questionnaire,
BIS/BAS Scales, Brief COPE, MSPSS, PSSM, GAD-7, Academic Services and Background,
Demographics, and Perceived Racism Scale, if applicable. The data analysis was completed
using independent samples t tests, chi-square tests of independence, and linear regression tests
with the IBM SPSS Statistics software.
First, to examine to examine differences in at-home and on-campus stressors for first-
generation and non-first-generation students, a series of t tests was completed to better
understand college preparatory strategies utilized by first-generation and non-first-generation
students, such as attending campus visits and earning college credits in high school, as well as
high school and college GPAs. Additionally, a series of t tests were completed to measure
experiences with stress, depression, and anxiety.
Next, to examine social support systems, a series of t tests were completed to gauge
levels of perceived support from family members, friends, and significant others. Information

RISK FACTORS ACROSS FIRST-GENERATION STUDENTS 12
from the previous t tests regarding mental well-being were also used to examine stress related to
relationships.
Finally, a series of t tests and chi square tests were completed to better understand the
academic practices and involvements of first-generation and non-first-generation students. The
groups were compared across their frequency of meeting with an academic advisor, attending
academic workshops, missing class for unexcused absences, going to professor’s office hours,
turning in incomplete or no assignments, and time spent preparing for an exam. Participants were
also asked about their involvement in learning communities and perceived connections as a
result of such membership.
Results
Similarities amongst First-Generation and Non-First-Generation Students
Across many measures, first-generation and non-first-generation students were found to
exhibit similarities in behavior and academic practices. Collegiate GPAs, t (229) = 1.20, p =
0.251, and the propensity to earn college credits in high school, χ2 (1) = 0.30, p = 0.59, were not
found to be significantly different between first-generation and non-first-generation students. In
examining perceived support systems, there were also no significant differences between the
groups for support from family, t (231) = 0.88, p = 0.382, friends, t (231) = 0.89, p = 0.372, and
significant others t (231) = -0.51, p =0.612. Stress and anxiety, often thought to be higher for
first-generation students, did not significantly differ in their reported depressive symptoms on the
PHQ-9, t (231) = -1.18, p = 0.241, or anxiety on the GAD-7, t (231) = -1.17, p = 0.244. In
examining stress, the Undergraduate Stress Questionnaire, t (231) = 0.32, p = 0.750, and the
Perceived Stress Scale, t (231) = 0.14, p = 0.889, also produced insignificant results.

RISK FACTORS ACROSS FIRST-GENERATION STUDENTS 13
Academic practices and involvements during college are similar between participant
groups as well. First-generation and non-first-generation students did not significantly differ in
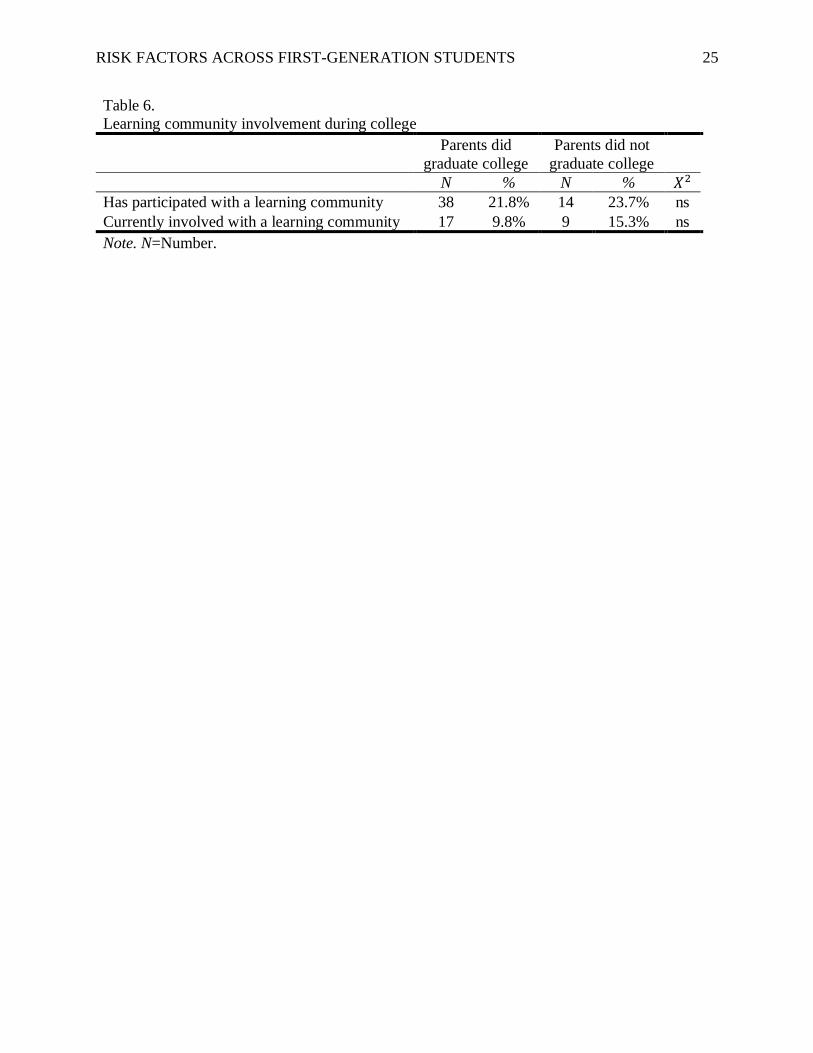
their likelihood of participating in a learning community, χ2 (1) = 0.09, p = 0.76. Additionally,
behaviors such as meeting with an academic advisor, t (230) = -0.38, p = 0.704, missing class, t
(231) = 0.59, p = 0.559, visiting a professor during office hours, t (108.10) = -1.06, p = 0.291,
completing assignments, t (231) = -0.54, p = 0.589, and preparing for an exam, t (231) = 0.42, p
= 0.675, were not significantly different between first-generation and non-first-generation
students and do not produce significant results.
Differences in Academic Preparedness and Engagement
The study found that non-first-generation students are more likely to have a parent
accompany them on a campus visit, χ2 (1) = 7.10, p = 0.010. Additionally, it was found that first-
generation students are more likely to attend academic workshops on campus, t (231) = -2.65, p
= 0.010.
Discussion
The purpose of this study was to analyze retention-related risk factors and potential
campus resources available to first-generation students in comparison to their non-first-
generation counterparts. Surprisingly, first-generation and non-first-generation students did not
differ in their academic outcomes, which does not comport with prior literature indicating that
first-generation college students often have poorer academic outcomes compared with non-first-
generation students (Hottinger & Rose, 2006; Inman & Mayes, 1999). This lack of difference
may have resulted from recruiting biases in which primarily high-achieving participants were
from both backgrounds participated in the study. In response, the study shifted focus to
differences in behaviors across high-achieving first-generation and non-first-generation students.

RISK FACTORS ACROSS FIRST-GENERATION STUDENTS 14
Across many factors, these groups were similar. As high-achieving students, both groups
may have well-developed practices for handling stress and anxiety associated with academic
assignments and tasks, which has been indicated by non-significant results for the PHQ-9, GAD-
7, USQ, and PSS measures. Additionally, in contrast to beginning research, there were no
significant differences in academic practices between groups despite potential differences in
levels of cultural and social capital (Engle, 2007; Hottinger & Rose, 2006). Non-first-generation
students are often thought to be better prepared for navigating campus and seeking out resources,
but this was not the case for the study (Engle, 2007).
It was also surprising to find that there were no significant findings for students who have
participated in learning communities, which have been shown previously to help students better
engage with course material as well as develop strong relationships with peers and faculty
(Tinto, 1999). The study could benefit from learning more about the experience of learning
community students and attracting participants from such groups. Further information regarding
the application process for learning communities as well as how they are promoted to incoming
students before entering college could also be helpful. First-generation students might be tracked
into learning communities more frequently with increased awareness of such programs.
There were two significant differences that might be attributed to a gap in college
literacy. First, parents of first-generation students were less likely to attend campus visits with
their students. Perhaps, it is not clear that parents commonly accompany their students at such
events or are at least welcome to do so. Additionally, it may be intimidating or overwhelming for
first-generation parents to participate in a campus tour, not knowing which questions to ask or
how to interpret the information they receive. Despite this difference, the presence of parents on

RISK FACTORS ACROSS FIRST-GENERATION STUDENTS 15
campus visits did not correlate with perceived familial support for either first-generation or non-
first-generation students.
The second significant finding is related to the utilization of campus resources. It was
found that first-generation students are more likely to attend academic workshops than non-first-
generation students. As learned in prior research, first-generation students are likely to have
lower levels of cultural capital in regards to the collegiate experience because their parents may
not be able to explain the academic expectations and skills required for success (Hottinger &
Rose, 2006; Dumais & Ward, 2009); therefore, workshops may be utilized to learn about such
topics.
Limitations
This study has several limitations. Most significantly, the shortened period of time
allotted for data collection potentially attracted responses from high-achieving students and
excluded responses from students that are more apt to wait until later in the semester to
participate in research studies. An extended period of data collection, perhaps throughout an
entire semester or academic year, could provide greater variety in academic-related practices,
GPA, and perhaps involvements on campus. With this in mind, the current results of the study
might be skewed toward habits of naturally high-achieving students, regardless of the
educational status of their parents.
A second limitation of this study is that it was purely correlational. Observations or
experiments were not completed to further analyze the behaviors or practices outlined in the
hypothesis. All data received from the study was self-reported, and other sources were not
contacted for verification in answers such as class attendance, hours spent studying, and
frequency of attending professor’s office hours.

RISK FACTORS ACROSS FIRST-GENERATION STUDENTS 16
Conclusion
Discrepancies exist between first-generation and non-first-generation students in both
their preparation for college and their experiences on campus as has been outlined in our
research and data analysis. Although many measures did not prove to be significant within the
current study, the findings begin to identify areas of interest, such as campus visits and academic
workshops. There is still much to learn about the retention-related resources and potential
resources that best contribute to academic success, and further exploration will help academic
institutions better serve their students by addressing at-home and on-campus stressors, enhancing
support systems, and providing resources for both first-generation and non-first-generation
students.

RISK FACTORS ACROSS FIRST-GENERATION STUDENTS 17
References
Akgun, Serap. & Ciarrochi, Joseph. (2003). Learned Resourcefulness Moderates the
Relationship Between Academic Stress and Academic Performance. Educational
Psychology 23(3). Retrieved from
https://www.tandfonline.com/doi/pdf/10.1080/0144341032000060129
Chen, X. (2005). First Generation Students in Postsecondary Education: A Look at Their College
Transcripts (NCES 2005–171). U.S. Department of Education, National Center for
Education Statistics. Washington, DC: U.S. Government Printing Office.
Crandall, Chris, Preisler, Jeanne J., & Aussprung, Julie. (1993). Measuring Life Event Stress in
the Lives of College Students: The Undergraduate Stress Questionnaire (USQ). Journal
of Behavioral Medicine 15(6). Retrieved from
https://www.researchgate.net/publication/21672105_Measuring_life_event_stress_in_the
_lives_of_college_students_The_Undergraduate_Stress_Questionnaire_USQ
Dumais, Susan A. & Ward, Aaryn. (2009). Cultural Capital and First-Generation College
Success. Department of Sociology, Louisiana State University. Retrieved from
https://www.sciencedirect.com/science/article/pii/S0304422X09000680
Engle, Jennifer. (2007). Postsecondary Access and Success for First-Generation College
Students. In American Academic, vol. 3. Retrieved from
https://pdfs.semanticscholar.org/e27f/6b423579e29231e22446c0b7777d7b5946bf.pdf
Hottinger, Jennifer A., & Rose, Caleb P. (2006). First-Generation College Students. In
Understanding College Student Subpopulations: A Guide for Student Affairs
Professionals (chapter 6). Retrieved from
https://s3.amazonaws.com/academia.edu.documents/30907974/UCCS.pdf?AWSAccessK
RISK FACTORS ACROSS FIRST-GENERATION STUDENTS 18
eyId=AKIAIWOWYYGZ2Y53UL3A&Expires=1516590947&Signature=gX1Xm6DAB
TVa6HQNTYVeUfejncs%3D&response-content-
disposition=inline%3B%20filename%3DAsian_American_Students.pdf#page=123
Inman, Elliot w. & Mayes, Larry. (1999). The Importance of Being First: Unique Characteristics
of First Generation Community College Students. In Community College Review 26(4).
Retrieved from http://journals.sagepub.com/doi/pdf/10.1177/009155219902600402
Ishitani, Terry T. (2006). Studying Attrition and Degree Completion Behavior among First-
Generation College Students in the United States. The Journal of Higher Education,
77(5). Retrieved from https://doi.org/10.1080/00221546.2006.11778947
Spitzer, Robert L., Kroenke, Kurt, & Williams, Janet B.W. (2001). The PHQ-9. Journal of
General Internal Medicine 16(9). Retrieved from
https://onlinelibrary.wiley.com/doi/full/10.1046/j.1525-
1497.2001.016009606.x?regionCode=US-NE&identityKey=f8fe5689-5fe6-4f9e-b623-
403a908c55a5&wol1URL=%2Fdoi%2F10.1046%2Fj.1525-
1497.2001.016009606.x%2Ffull
Lee, Eun-Hyun. (2012). Review of the Psychometric Evidence of the Perceived Stress Scale.
Korean Society of Nursing Science. Retrieved from http://www.asian-
nursingresearch.com/article/S1976-1317(12)00052-7/fulltext#sec2.2
Lowe, B., Decker, O., Muller S., Brahler, E., Schelberg, D., Herzog, W., & Herzberg P.Y.
(2008). Validation and Standardization of the Generalized Anxiety Disorder Screener
(GAD-7) in the General Population. Med Care 46(3). Retrieved from
https://www.ncbi.nlm.nih.gov/pubmed/18388841

RISK FACTORS ACROSS FIRST-GENERATION STUDENTS 19
Thayer, Paul B. (2000). Retention of Students from First Generation and Low Income
Backgrounds. The Journal of the Council for Opportunity in Education. Retrieved from
https://files.eric.ed.gov/fulltext/ED446633.pdf
Tinto, Vincent. (1999). Taking Retention Seriously: Rethinking the First Year of College.
NACADA, Journal 19(2). Retrieved from
http://www.nacadajournal.org/doi/pdf/10.12930/0271-9517-19.2.5?code=naaa-site
Wongpakaran, Tinakon, Wongpakaran, Nathathai, & Ruktrakul, Ruk. (2011). Reliability and
Validity of the Multidimensional Scale of Perceived Social Support (MSPSS): Thai
Version. Clinical Practice & Epidemiology in Mental Health, vol. 7. Retrieved from
https://www.ncbi.nlm.nih.gov/pmc/articles/PMC3219878/
Zimet, Gregory, Dahlem, Nancy W., Zimet, Sara G., & Farley, Gordon K. (1988). The
Multidimensional Scale of Perceived Social Support. Journal of Personality Assessment
52(1). Retrieved from
https://www.researchgate.net/publication/240290845_The_Multidimensional_Scale_of_P
erceived_Social_Support
RISK FACTORS ACROSS FIRST-GENERATION STUDENTS 20
Table 1.
Participant Demographic Information
N SD
Gender
Male 46 18.7%
Female 196 79.67%
Transgender Male 1 0.4%
Non-Binary 3 1.2%
Year in School
Freshman 89 36.2%
Sophomore 58 23.6%
Junior 40 16.3%
Senior 54 22%
Fifth Year or More 5 2%
Race/Ethnicity
White 198 79.2%
Black/African American 9 3.6%
Hispanic/Latino 11 0.4%
Native American/Alaskan Native 29 11.6%
Asian/Asian American 2 0.8%

RISK FACTORS ACROSS FIRST-GENERATION STUDENTS 21
Table 2.
Multidimensional Scales of Perceived Social Support
Parents did graduate
college
Parents did not
graduate college
M SD M SD t-test
Friend 5.65 1.44 5.46 1.42 ns
Family 5.69 1.51 5.50 1.45 ns
Significant Other 5.55 1.60 5.67 1.42 ns
Note. M=Mean. SD=Standard Deviation. The Multidimensional Scales of
Perceived Social Support range from 1 (Very Strongly Disagree) to 7
(Very Strongly Agree).

RISK FACTORS ACROSS FIRST-GENERATION STUDENTS 22
Table 3.
Stress and Anxiety
Parents did
graduate college
Parents did not
graduate college
M SD M SD t-test
Undergraduate Stress Questionnaire (USQ) 20.06 11.77 19.49 12.28 ns
Perceived Stress Scale (PSS) 18.77 4.49 18.68 5.03 ns
Patient Health Questionnaire (PHQ-9) 14.14 5.20 15.08 5.62 ns
Generalized Anxiety Disorder (GAD-7) 13.63 5.24 14.59 6.20 ns

RISK FACTORS ACROSS FIRST-GENERATION STUDENTS 23
Table 4.
Academic Practices Among High-Achieving First-Generation and Non-First-Generation
Students
Parents did
graduate college
Parents did not
graduate college
M SD M SD t test
Meet with academic advisor 2.32 0.68 2.36 0.61 ns
Attend academic workshops 1.56 0.93 2.05 1.31 0.01
Miss class for unexcused absences 2.15 0.94 2.07 0.89 ns
Attend professor’s office hours 1.84 0.81 1.97 0.74 ns
Turn in incomplete or absent assignments 1.25 0.50 1.29 0.53 ns
Hours spent studying for a test 3.06 0.75 3.02 0.66 ns
Note. M=Mean. SD=Standard Deviation.

RISK FACTORS ACROSS FIRST-GENERATION STUDENTS 24
Table 5.
College Preparation
Parents did
graduate college
Parents did not
graduate college
N % N % 𝜒2
Earned college credits in high school 113 64.9% 36 61.0% ns
Attended campus visit before enrolling 144 82.8% 51 86.4% ns
Parents attended campus visit with student 146 83.9% 40 67.8% 0.014
Note. N=Number.
RISK FACTORS ACROSS FIRST-GENERATION STUDENTS 25
Table 6.
Learning community involvement during college
Parents did
graduate college
Parents did not
graduate college
N % N % 𝑋2
Has participated with a learning community 38 21.8% 14 23.7% ns
Currently involved with a learning community 17 9.8% 9 15.3% ns
Note. N=Number.

RISK FACTORS ACROSS FIRST-GENERATION STUDENTS 26
Table 7.
GPA
Parents did
graduate college
Parents did not
graduate college
M SD M SD t test
High School GPA 4.17 4.99 3.61 0.63 ns
College GPA 3.43 0.51 3.35 0.47 ns
Note. M=Mean. SD=Standard Deviation.