Difference Plot
16
Difference Plot Add-in User Manual ADD_DP150_E0 Atoll RF Planning and Optimisation Software
-
Upload
lilia-kalcheva-eror -
Category
Documents
-
view
35 -
download
3
description
Difference Plot
Transcript of Difference Plot

Difference PlotAdd-in
User Manual
ADD_DP150_E0
AtollRF Planning and Optimisation Software


Difference Plot Add-in
Contact Information
Difference Plot Add-in User Manual Release ADD_DP150_E0
© Copyright 1997 - 2008 by Forsk
The software described in this document is provided under a license agreement. The software may only be used/copiedunder the terms and conditions of the license agreement. No part of this document may be copied, reproduced ordistributed in any form without prior authorisation from Forsk.
The product or brand names mentioned in this document are trademarks or registered trademarks of their respectiveregistering parties.
About Difference Plot Add-in User Manual
This document describes the Difference Plot add-in developed by Forsk, which uses standard Atoll API interfaces to plotthe differences between two signal-level based coverage prediction studies.
This document covers the installation process and working of the add-in.
Forsk (Head Office) 7 rue des Briquetiers 31700 Blagnac France
[email protected]@[email protected]+33 (0) 562 74 72 10+33 (0) 562 74 72 25+33 (0) 562 74 72 11
WebGeneral informationSales and pricing informationTechnical supportGeneralTechnical supportFax
Forsk (USA Office) 200 South Wacker Drive Suite 3100 Chicago, IL 60606 USA
[email protected][email protected]+1 312 674 4846+1 888 GoAtoll (+1 888 462 8655)+1 312 674 4847
Sales and pricing informationTechnical supportGeneralTechnical supportFax
Forsk (China Office) Suite 302, 3/F, West Tower, Jiadu Commercial Building, No.66 Jianzhong Road, Tianhe Hi-Tech Industrial Zone, Guangzhou, 510665, People’s Republic of China
[email protected]+86 20 8553 8938+86 20 8553 8285+86 10 6513 4559
WebInformation and enquiriesTelephoneFax (Guangzhou)Fax (Beijing)
© Forsk 2008 ADD_DP150_E0 iii

Difference Plot Add-in
iv ADD_DP150_E0 © Forsk 2008
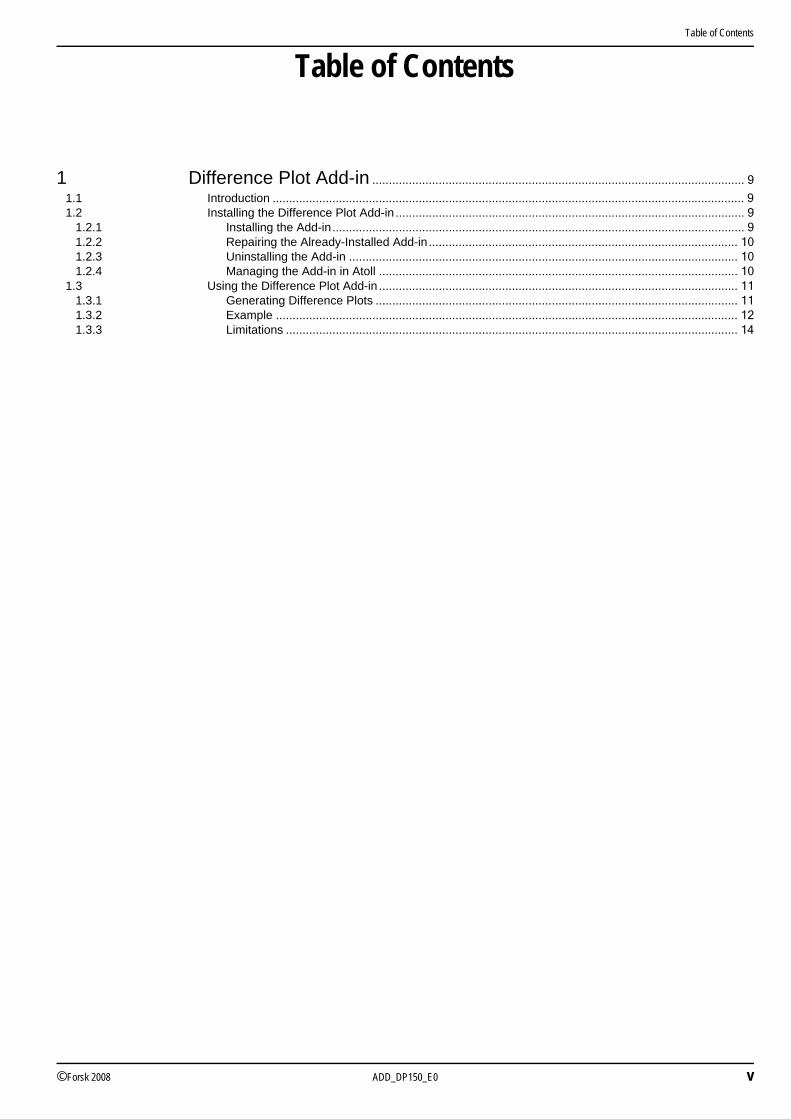
Table of Contents
Table of Contents
1 Difference Plot Add-in ................................................................................................................ 9
1.1 Introduction .............................................................................................................................................. 91.2 Installing the Difference Plot Add-in ......................................................................................................... 9
1.2.1 Installing the Add-in ............................................................................................................................ 91.2.2 Repairing the Already-Installed Add-in ............................................................................................. 101.2.3 Uninstalling the Add-in ..................................................................................................................... 101.2.4 Managing the Add-in in Atoll ............................................................................................................ 10
1.3 Using the Difference Plot Add-in ............................................................................................................ 111.3.1 Generating Difference Plots ............................................................................................................. 111.3.2 Example ........................................................................................................................................... 121.3.3 Limitations ........................................................................................................................................ 14
© Forsk 2008 ADD_DP150_E0 v

Difference Plot Add-in
vi ADD_DP150_E0 © Forsk 2008

Difference Plot Add-in
This document covers the installation process and working of the add-in.
Chapter 1
AtollRF Planning and Optimisation Software

8 ADD_DP150_E0 © Forsk 2008
Difference Plot Add-in

Chapter 1: Difference Plot Add-in
1 Difference Plot Add-in
1.1 IntroductionThe Difference Plot add-in is developed by Forsk, and is available on demand. It can be used with Atoll version 2.4.1 Build1632 and above. The Difference Plot add-in can be used to generate coverage plots which show the difference of signallevels between two selected signal-level based coverage prediction studies. You can use this add-in to precisely evaluatethe differences between two network scenarios.
The Difference Plot add-in can generate three types of difference plots:
• Coverage map of areas covered by scenario A but not by scenario B• Coverage map of areas covered by scenario B but not by scenario A• Coverage map of areas covered by both scenarios
1.2 Installing the Difference Plot Add-in
1.2.1 Installing the Add-inTo install the add-in:
1. Double-click the setup icon to run the setup program.2. Specify an installation folder for the add-in.
It is not necessary to install the add-in in the Atoll installation directory.
3. Specify whether the installation should only be performed in the current user profile or for all users.
4. Click Next to start the installation.
5. Click Close to exit the setup program when the installation is finished.
Figure 1.1: Difference Plot Setup Wizard Figure 1.2: Destination Folder Selection Dialog
Figure 1.3: Installation Confirmation Dialog Figure 1.4: Installation Progress
© Forsk 2008 ADD_DP150_E0 9

Difference Plot Add-in
1.2.2 Repairing the Already-Installed Add-inThe setup program allows you to repair the already-installed add-in by re-installing it using the installation parameters thatyou defined when performing the installation. To repair an installation:
1. Double-click the setup file icon to start the setup program.2. Choose Repair Difference Plot Tool.3. Click Finish to repair the installation.
1.2.3 Uninstalling the Add-inTo uninstall the Difference Plot add-in:
1. Double-click the setup file icon to start the setup program.2. Choose Remove Difference Plot Tool.3. Click Finish to uninstall the add-in.
1.2.4 Managing the Add-in in AtollOnce installed, the add-in will be available in the list of add-ins installed with Atoll. You can access the Add-ins and Macrosdialog in Atoll through the Tools menu in the menubar.
You can activate or deactivate add-ins in this dialog to set their availability in Atoll. For example, if you uncheck the DiffPlots
Class check box in this dialog, the command Difference Plots will not be available in the Tools menu, and the icon willnot be available in the Toolbar.
Figure 1.5: Repair Installation Dialog
Figure 1.6: Uninstallation Dialog Figure 1.7: Uninstallation Progress
Note:
• You can also uninstall the add-in through Windows Control Panel > Add or Remove Programs.
10 ADD_DP150_E0 © Forsk 2008

Chapter 1: Difference Plot Add-in
To make the add-in available:
1. Select Add-ins and Macros from the Tools menu in the menubar.2. Check the DiffPlots Class check box in the Add-ins and Macros dialog.3. Click Close to exit the dialog.
The icon and the Difference Plots command will now be available in the Toolbar and in the Tools menu respectively.
You can also verify the version and installation details about the add-in by clicking the Infos... button in the Add-ins andMacros dialog:
1.3 Using the Difference Plot Add-in
1.3.1 Generating Difference PlotsYou require two signal-level based coverage prediction studies to run the Difference Plot add-in. Both the coverageprediction studies should have a coverage plot gradient of 1 dB. You can choose other parameters of the coverageprediction studies as you like, but you must keep all the parameters same for both the coverage prediction studies in orderto get meaningful comparison results.
Let us suppose that you have created two coverage scenarios, Scenario A and Scenario B, with the following displayparameters.
Figure 1.8: Add-ins and Macros Dialog in Atoll
Figure 1.9: Add-in Details
Note:
• You can create a signal-level based coverage prediction study with 1 dB display gradient and thenduplicate it in order to have the exact same parameters for the other coverage prediction study as well.
Figure 1.10: Signal-Level Based Coverage Prediction Study Properties
© Forsk 2008 ADD_DP150_E0 11
Difference Plot Add-in
Before running the Difference Plots add-in, make sure that both of the coverage prediction studies are locked.
To generate difference plots:
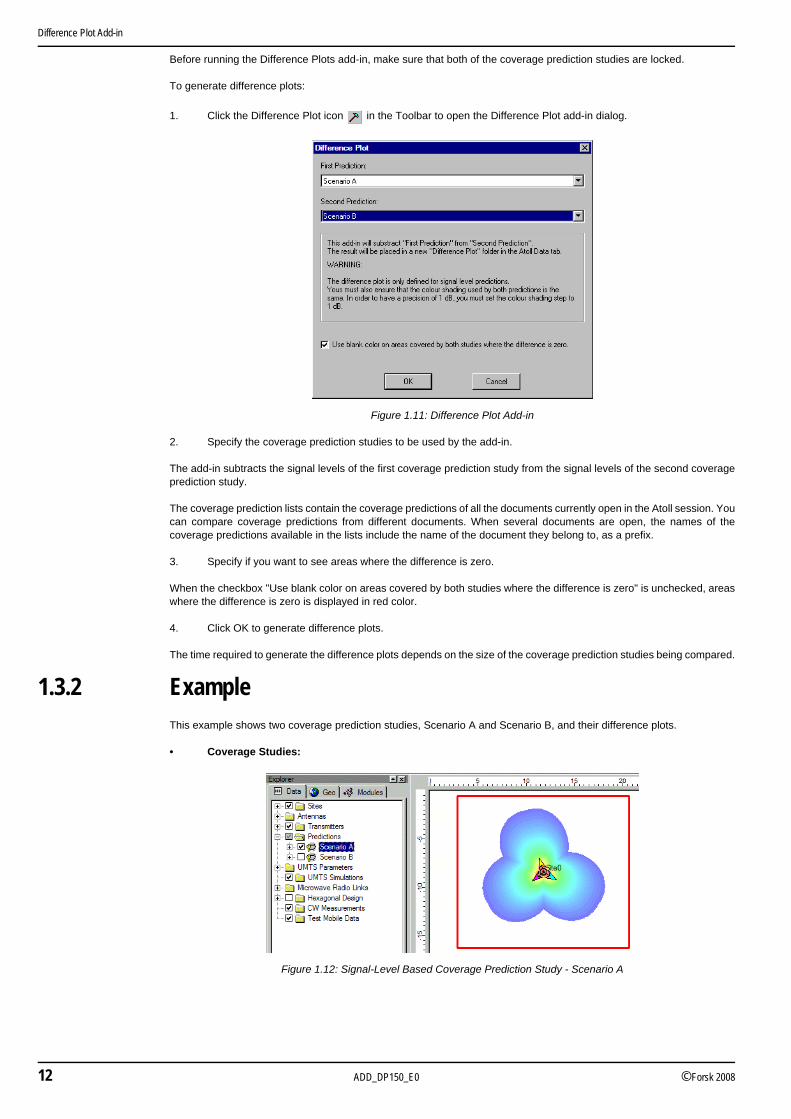
1. Click the Difference Plot icon in the Toolbar to open the Difference Plot add-in dialog.
2. Specify the coverage prediction studies to be used by the add-in.
The add-in subtracts the signal levels of the first coverage prediction study from the signal levels of the second coverageprediction study.
The coverage prediction lists contain the coverage predictions of all the documents currently open in the Atoll session. Youcan compare coverage predictions from different documents. When several documents are open, the names of thecoverage predictions available in the lists include the name of the document they belong to, as a prefix.
3. Specify if you want to see areas where the difference is zero.
When the checkbox "Use blank color on areas covered by both studies where the difference is zero" is unchecked, areaswhere the difference is zero is displayed in red color.
4. Click OK to generate difference plots.
The time required to generate the difference plots depends on the size of the coverage prediction studies being compared.
1.3.2 ExampleThis example shows two coverage prediction studies, Scenario A and Scenario B, and their difference plots.
• Coverage Studies:
Figure 1.11: Difference Plot Add-in
Figure 1.12: Signal-Level Based Coverage Prediction Study - Scenario A
12 ADD_DP150_E0 © Forsk 2008

Chapter 1: Difference Plot Add-in
• Resulting Difference Plots:
Figure 1.13: Signal-Level Based Coverage Prediction Study - Scenario B
Figure 1.14: Areas Covered by Both Coverage Prediction Studies
Figure 1.15: Areas Covered by Coverage Prediction Study "Scenario B"
Figure 1.16: Areas Covered by Coverage Prediction Study "Scenario A"
© Forsk 2008 ADD_DP150_E0 13

Difference Plot Add-in
1.3.3 LimitationsPlease keep the following points in mind when using the Difference Plot add-in:
• The coverage prediction studies must be calculated and up to date before running the Difference Plot add-in.• If you have changed the display settings of your coverage prediction studies, you must update the coverage
studies before running the Difference Plot add-in. You have to calculate the coverage prediction studies afterchanging the display settings in order to update them.
Note:
• You can create a signal-level based coverage prediction study with 1 dB display gradient and thenduplicate it in order to have the exact same parameters for the other coverage prediction study as well.
14 ADD_DP150_E0 © Forsk 2008

© Forsk 2008 ADD_DP150_E0 15
Difference Plot Add-in
7 rue des briquetiers – 31700 – Blagnac – France
Tel: +33 (0)5 62 74 72 10 – Fax: +33 (0)5 62 74 72 11
http://www.forsk.com
Difference Plot Add-inUser Manual
ADD_DP150_E0
October 2008
![Onset of deep drainage and salt mobilization following ...monitoreodesmonte.com.ar/archivos/Amdan_2013_Salta.pdf · [4] The water balance of a given plot results from the difference](https://static.fdocuments.in/doc/165x107/5d66d88988c99332038b7caf/onset-of-deep-drainage-and-salt-mobilization-following-4-the-water-balance.jpg)