Dietary Patterns and Type 2 Diabetes: A Systematic ... · Dietary Approaches to Stop Hypertension...
9
The Journal of Nutrition Nutritional Epidemiology Dietary Patterns and Type 2 Diabetes: A Systematic Literature Review and Meta- Analysis of Prospective Studies 1–3 Franziska Jannasch, 4,5 * Janine Kro ¨ ger, 4,5 and Matthias B Schulze 4,5 4 Department of Molecular Epidemiology, German Institute of Human Nutrition Potsdam-Rehbruecke, Nuthetal, Germany; and 5 German Center for Diabetes Research, Mu ¨ nchen-Neuherberg, Germany Abstract Background: Different methodologic approaches for constructing dietary patterns and differences in their composition limit conclusions on healthful patterns for diabetes prevention. Objective: We summarized evidence from prospective studies that examined associations of dietary patterns with type 2 diabetes by considering different methodologic approaches. Methods: The literature search (MEDLINE and Web of Science) identified prospective studies (cohorts or trials) that associated dietary patterns with diabetes incidence in nondiabetic and apparently healthy participants. We summarized evidence by meta-analyses and distinguished different methodologic approaches. Results: The search resulted in 48 articles comprising 16 cohorts. Adherence to the Mediterranean diet (RR for comparing extreme quantiles: 0.87; 95% CI: 0.82, 0.93), Dietary Approaches to Stop Hypertension (DASH) (RR: 0.81; 95% CI: 0.72, 0.92), and Alternative Healthy Eating Index (AHEI) (RR: 0.79; 95% CI: 0.69, 0.90) was associated with significant risk reductions of incident diabetes. Patterns from exploratory factor and principal component analyses characterized by red and processed meat, refined grains, high-fat dairy, eggs, and fried products (‘‘mainly unhealthy’’) were positively associated with diabetes (RR: 1.44; 95% CI: 1.27, 1.62), whereas patterns characterized by vegetables, legumes, fruits, poultry, and fish (‘‘mainly healthy’’) were inversely associated with diabetes (RR: 0.84; 95% CI: 0.77, 0.91). Reduced rank regression (RRR) used diabetes-related biomarkers to identify patterns. These patterns were characterized by high intakes of refined grains, sugar-sweetened soft drinks, and processed meat and were all significantly associated with diabetes risk. Conclusions: Our meta-analysis suggests that diets according to the Mediterranean diet, DASH, and AHEI have a strong potential for preventing diabetes, although they differ in some particular components. Exploratory dietary patterns were grouped based on concordant food groups and were significantly associated with diabetes risk despite single-component foods having limited evidence for an association. Still, they remain population-specific observations. Consistent positive associations with diabetes risk were observed for 3 RRR patterns. J Nutr 2017;147:1174–82. Keywords: dietary patterns, type 2 diabetes, investigator-driven statistical methods, exploratory statistical methods, systematic review, meta-analysis Introduction In terms of diabetes prevention, evidence from clinical trials and observational studies suggests that the consumption of several foods and beverages is associated with a reduction in diabetes risk, e.g., a high intake of whole grains, nuts, coffee, and a moderate consumption of alcohol and low intake of processed and unprocessed red meats and sugar-sweetened beverages (SSBs) 6 (1). However, people do not consume single food groups but rather a combination of many foods. To address this problem, the investigation of dietary patterns (DPs) has emerged 1 Supported by the German Federal Ministry of Education and Research and the Joint Programming Initiative ‘‘A Healthy Diet for a Healthy Life.’’ 2 Author disclosures: F Jannasch, J Kro ¨ ger, and MB Schulze, no conflicts of interest. 3 Supplemental Figures 1–8 and Supplemental Tables 1–15 are available from the ‘‘Online Supporting Material’’ link in the online posting of the article and from the same link in the online table of contents at http://jn.nutrition.org. *To whom correspondence should be addressed. E-mail: franziska.jannasch@ dife.de. 6 Abbreviations used: AHEI, Alternative Healthy Eating Index; DASH, Dietary Approaches to Stop Hypertension; DP, dietary pattern; HEI, Healthy Eating Index; PCA, principal component analysis; PREDIMED, Prevencion con Dieta Mediterranea; RRR, reduced rank regression; SIGN, Scottish Intercollegiate Guidelines Network; SLR, systematic literature review; SSB, sugar-sweetened beverage. ã 2017 American Society for Nutrition. 1174 Manuscript received October 6, 2016. Initial review completed November 15, 2016. Revision accepted March 20, 2017. First published online April 19, 2017; doi:10.3945/jn.116.242552. by guest on July 31, 2017 jn.nutrition.org Downloaded from 2.DCSupplemental.html http://jn.nutrition.org/content/suppl/2017/04/19/jn.116.24255 Supplemental Material can be found at:
Transcript of Dietary Patterns and Type 2 Diabetes: A Systematic ... · Dietary Approaches to Stop Hypertension...

The Journal of Nutrition
Nutritional Epidemiology
Dietary Patterns and Type 2 Diabetes: ASystematic Literature Review and Meta-Analysis of Prospective Studies1–3
Franziska Jannasch,4,5* Janine Kroger,4,5 and Matthias B Schulze4,5
4Department of Molecular Epidemiology, German Institute of Human Nutrition Potsdam-Rehbruecke, Nuthetal, Germany; and 5German
Center for Diabetes Research, Munchen-Neuherberg, Germany
Abstract
Background: Different methodologic approaches for constructing dietary patterns and differences in their composition
limit conclusions on healthful patterns for diabetes prevention.
Objective:We summarized evidence from prospective studies that examined associations of dietary patterns with type 2
diabetes by considering different methodologic approaches.
Methods: The literature search (MEDLINE and Web of Science) identified prospective studies (cohorts or trials) that
associated dietary patterns with diabetes incidence in nondiabetic and apparently healthy participants. We summarized
evidence by meta-analyses and distinguished different methodologic approaches.
Results: The search resulted in 48 articles comprising 16 cohorts. Adherence to theMediterranean diet (RR for comparing
extreme quantiles: 0.87; 95% CI: 0.82, 0.93), Dietary Approaches to Stop Hypertension (DASH) (RR: 0.81; 95% CI: 0.72,
0.92), and Alternative Healthy Eating Index (AHEI) (RR: 0.79; 95% CI: 0.69, 0.90) was associated with significant risk
reductions of incident diabetes. Patterns from exploratory factor and principal component analyses characterized by red
and processed meat, refined grains, high-fat dairy, eggs, and fried products (‘‘mainly unhealthy’’) were positively
associated with diabetes (RR: 1.44; 95% CI: 1.27, 1.62), whereas patterns characterized by vegetables, legumes, fruits,
poultry, and fish (‘‘mainly healthy’’) were inversely associated with diabetes (RR: 0.84; 95% CI: 0.77, 0.91). Reduced rank
regression (RRR) used diabetes-related biomarkers to identify patterns. These patterns were characterized by high intakes of
refined grains, sugar-sweetened soft drinks, and processed meat and were all significantly associated with diabetes risk.
Conclusions: Our meta-analysis suggests that diets according to the Mediterranean diet, DASH, and AHEI have a strong
potential for preventing diabetes, although they differ in some particular components. Exploratory dietary patterns were
grouped based on concordant food groups and were significantly associated with diabetes risk despite single-component
foods having limited evidence for an association. Still, they remain population-specific observations. Consistent positive
associations with diabetes risk were observed for 3 RRR patterns. J Nutr 2017;147:1174–82.
Keywords: dietary patterns, type 2 diabetes, investigator-driven statistical methods, exploratory statistical methods,
systematic review, meta-analysis
Introduction
In terms of diabetes prevention, evidence from clinical trials andobservational studies suggests that the consumption of severalfoods and beverages is associated with a reduction in diabetes
risk, e.g., a high intake of whole grains, nuts, coffee, and amoderate consumption of alcohol and low intake of processedand unprocessed red meats and sugar-sweetened beverages(SSBs)6 (1). However, people do not consume single food groupsbut rather a combination of many foods. To address thisproblem, the investigation of dietary patterns (DPs) has emerged
1 Supported by the German Federal Ministry of Education and Research and the
Joint Programming Initiative ‘‘A Healthy Diet for a Healthy Life.’’2 Author disclosures: F Jannasch, J Kroger, and MB Schulze, no conflicts of
interest.3 Supplemental Figures 1–8 and Supplemental Tables 1–15 are available from
the ‘‘Online Supporting Material’’ link in the online posting of the article and from
the same link in the online table of contents at http://jn.nutrition.org.
*To whom correspondence should be addressed. E-mail: franziska.jannasch@
dife.de.
6 Abbreviations used: AHEI, Alternative Healthy Eating Index; DASH, Dietary
Approaches to Stop Hypertension; DP, dietary pattern; HEI, Healthy Eating
Index; PCA, principal component analysis; PREDIMED, Prevencion con Dieta
Mediterranea; RRR, reduced rank regression; SIGN, Scottish Intercollegiate
Guidelines Network; SLR, systematic literature review; SSB, sugar-sweetened
beverage.
ã 2017 American Society for Nutrition.
1174 Manuscript received October 6, 2016. Initial review completed November 15, 2016. Revision accepted March 20, 2017.
First published online April 19, 2017; doi:10.3945/jn.116.242552.
by guest on July 31, 2017jn.nutrition.org
Dow
nloaded from
2.DCSupplemental.html http://jn.nutrition.org/content/suppl/2017/04/19/jn.116.24255Supplemental Material can be found at:

as a complementary approach. DPs can be derived from foodconsumption data by several approaches in observationalstudies (2, 3). A priori approaches estimate a person�s adherence torecommended intakes and need preliminary knowledge about thedetriments or benefits of specific foods to calculate indexes.Commonly used indexes have been theMediterranean diet (4), theDietary Approaches to Stop Hypertension (DASH) diet (5), theHealthy Eating Index (HEI) based on the USDA�s food guidancesystem (6), and the alternative HEI (AHEI) based on nutrientsand foods predictive of chronic disease risk (7). Exploratoryapproaches such as principal component analysis (PCA), factoranalysis, or cluster analysis create patterns based on correlationsamong food groups and are useful for characterizing population-specific DPs but do not necessarily identify optimal patternswith regard to chronic disease risk (2). As a mix of a priori andexploratory approaches, reduced rank regression (RRR) combinesthe pre-existing knowledge about specific mediating factors in-volved in disease development with a data-driven method foridentifying DPs (8). The wide variety of approaches for evaluatingDPs and the heterogeneity of pattern composition have not beenadequately taken into account in previous systematic literaturereviews (SLRs) that have aimed to summarize the evidence of DPs�relation with diabetes risk. Reviews have been restricted to eithera priori patterns (9) or exploratory approaches (10), or have sum-marized exploratory patterns along with a priori patterns suchas the Mediterranean diet (11, 12), although they do not shareidentical components. Furthermore, evidence from rather‘‘unhealthy’’ exploratory DPs has frequently been ignored inprevious reviews (11, 13), although such patterns have beenfound to relate to diabetes risk (14, 15). Thus, this SLR aims tosummarize evidence of prospective studies by evaluating theassociation between DPs and type 2 diabetes and consideringthe heterogeneity of different statistical approaches for gener-ating DPs and differences in pattern composition.
Methods
Search strategy. To identify published studies on DPs and diabetes,
we searched MEDLINE and Web of Science databases until 31
December 2015. The search strategy combined medical subjectheading terms and partly truncated text words. We covered 4 thematic
areas (dietary habits and patterns, a priori and a posteriori statistical ap-
proaches to generate dietary patterns, type 2 diabetes, and prospective designof the studies) with several selected search strings (Supplemental Table 1).
The search was limited to English articles. Reference lists of articles were
screened for further relevant articles.
Screening process. A hierarchical approach was applied for assessing
the relevance of the studies. We independently screened titles, abstracts,
and full texts, and disagreements were solved by consensus. Articles
using single food groups or nutrients were excluded as well as studieswith a cross-sectional or retrospective study design. Furthermore,
gestational diabetes or type 1 diabetes was not considered. Studies
restricted to patients with diabetes, impaired glucose tolerance, insulinresistance, or other chronic diseases were excluded as well.
Data extraction. Data were extracted with a standardized form
developed by the investigators that included information on authors,year of publication, country, design, name and duration of the study,
number of incident cases, size of study population, sex, age at baseline,
dietary assessment method, outcome and its definition, method for
deriving DPs, DP label, categorization, statistical parameter with 95%CIs, P-trends, and adjustment variables.
Quality assessment of the included studies. The Scottish Intercol-
legiate Guidelines Network (SIGN) checklist was used to assess the
quality of studies (Supplemental Table 2). This checklist was specified for
the evaluation of cohort studies, and in this SLR 14 questions were
adapted from the original checklist. According to the number ofquestions, which could be answered with ‘‘yes,’’ ‘‘no,’’ or ‘‘cannot say,’’
the studies were rated as low quality, acceptable, or high quality.
Intervention studies were evaluated with an adapted SIGN checklist for
randomized controlled trials comprising 10 questions (Supplemental
Table 3).
Meta-analyses. The meta-analyses were undertaken with Cochrane
RevMan version 5.3, and pooled estimates were calculated according toeach pattern approach. Furthermore, approaches repeatedly applied in
one study population were restricted to the most recent publication.
Patterns derived by exploratory methods need to be generally consideredpopulation-specific, which limits the potential for meta-analytical
summarization. Therefore, patterns were only considered for meta-
analysis if they were characterized by a set of concordant food groups,
admitting one food group missing. For the RRR method, the originallyderived RRR patterns and their confirmations in external study
populations were meta-analytically summarized. This was because of
the large heterogeneity of the derived RRR scores that used different
diabetes-related biomarkers as responses. Two risk estimates from aconfirmatory analysis (15) were recalculated according to their direction
of association to make them comparable to the originally derived dietary
patterns. To estimate the weight of each included study, the standarderror of the logarithm of the studies� risk estimate comparing the extreme
quantiles was calculated via an inverse variance method. Risk estimates
of several studies were provided upon request. Heterogeneity was
determined with the use of the I2 statistic, and a value >25%, indicatingmoderate heterogeneity, supported the application of random-effects
models rather than fixed-effects models (16). Potential publication bias
was addressed by funnel plots, and asymmetry was further evaluated by
the Egger test (17). However, this was exclusively applied to meta-analyses with $5 studies.
Results
The search in MEDLINE and Web of Science resulted in 1047articles after combining and eliminating duplicates. The screen-ing process resulted in 48 articles (5, 7, 14, 15, 18–61)(Supplemental Figure 1). Studies were conducted across 4continents and included a comprehensive set of DPs in differentregions. Most studies were conducted in the United States(n = 22), followed by Europe (n = 18), Asia (n = 5), and Australia(n = 3). However, no contributions from the African or SouthAmerican continent met the inclusion criteria. In total, 16individual study populations were investigated. Overall, 27articles examined the participants� adherence to predefinedscores or indexes (Supplemental Table 4). Among this group,most articles determined the association between the Mediter-ranean diet and diabetes (n = 8), followed by the HEI or AHEI(n = 6) and the DASH diet (n = 5). Among 16 studies that usedexploratory approaches, most studies applied factor analysis orPCA (n = 14). Patterns based on RRR were investigated in 6studies.
A priori approachesMediterranean diet. Eight studies investigated adherence tothe Mediterranean diet and the association with type 2 diabetesin different populations—5 in Southern Europe and 3 in non-Mediterranean populations. Fruits, nuts, vegetables, legumes,fish and seafood, and moderate alcohol consumption werealways part of the diet indexes (Supplemental Table 5).However, some investigators implemented different food groupsubdivisions. For instance, Abiemo et al. (18) emphasized thebeneficial effect of nonrefined grains. Meat was considered either
Dietary patterns and type 2 diabetes 1175
by guest on July 31, 2017jn.nutrition.org
Dow
nloaded from

as total meat intake (26, 41, 53), restricted to red and processedmeat (18, 23), or as awhite:redmeat ratio (54). Some investigators(26, 41, 52, 53) used total dairy; others (18) stressed whole-fatdairy as detrimental or excluded it because of restricted dataavailability (36). Olive oil is an essential part of the Mediter-ranean diet (62). However, in non-Mediterranean populationsthe MUFA:SFA ratio was a frequent surrogate (18, 23, 36).Moderate alcohol consumption was always included but withaltering definitions (18, 23, 54, 63). In total, 5 of 6 studiesobserved a risk reduction ranging from 9% (36) to 25% (23)comparing extreme quantiles, whereas no significant associa-tion was observed in one US-based study (18). More than 50%of the studies were rated high quality; the remaining were ratedacceptable (Supplemental Tables 2 and 3). Data from Jacobset al. (36) were provided upon request. A meta-analysis of pro-spective cohort studies suggests that a higher Mediterranean dietscore was related to a significant risk reduction (RR for comparingextreme quantiles: 0.87; 95% CI: 0.82, 0.93) (Figure 1A). Theheterogeneity between the included studies was relatively low(I2 = 26%). Potential publication bias was not present according tothe funnel plot (Supplemental Figure 2), in which the smalleststudy (18) did not contribute to the overall estimate but rathershowed an opposite effect, even if the Egger test (b: 0.92;P < 0.0001)indicated a small study effect. The inverse association in obser-vational cohort studies was confirmed in the PREDIMED (Pre-vencion con Dieta Mediterranea) intervention trial (54), in whicha Mediterranean diet (diet advice either supplemented with oliveoil or nuts) resulted in a 30% risk reduction compared with thecontrol group (54).
DASH. The DASH score from Liese et al. (5) (SupplementalTable 6) was composed of 10 food groups: total grains; high-fiber grains; vegetables; fruits; total dairy; low-fat dairy; nuts,seeds, and legumes; meat; fats and oil; and sweets. Altogether, 6studies investigated the association of the DASH score withdiabetes and included relatively similar food groups. WhereasLiese et al. (5) and Kroger and colleagues (15) did not distinguishdifferent meat sources, the remaining 4 studies (23, 24, 36, 37)considered red and processed meat and included SSBs and lowsodium intake. Two studies (15, 23) were rated high quality, and4 studies (5, 24, 36, 37) were rated acceptable (SupplementalTable 2). A high DASH score was associated with a significantlyreduced risk of diabetes in 3 studies (23, 36, 37). One study (37)was not included in the meta-analysis because it was also part ofthe InterAct Consortium (15). Data from De Oliveira Otto et al.(24) were provided upon request. The pooled RR for comparingextreme quantiles was 0.82 (95%CI: 0.74, 0.92) (Figure 1B). Allindividual studies reported effect estimates suggesting an inverseassociation, but heterogeneity was present (I2 = 62%). Potentialpublication bias was not present based on the funnel plot(Supplemental Figure 3) and Egger test (b: 0.79; P = 0.10).
HEI and AHEI. Two studies investigated the HEI with regard todiabetes risk (23, 36). De Koning et al. (23) observed noassociation for HEI-2005, whereas Jacobs et al. (36) observed arisk reduction of 9% for HEI-2010. Although both HEI-2005and HEI-2010 included whole grains, vegetables, fruits, anddairy, both studies used different score compositions (Supple-mental Table 7) (36).
FIGURE 1 Meta-analysis of pro-
spective studies presenting the RRs
and 95% CIs for type 2 diabetes
incidence for the highest compared
with the lowest intake of the Mediter-
ranean diet (A), the DASH diet (B), and
the AHEI (C). AHEI, Alternative Healthy
Eating Index; DASH, Dietary Appro-
aches to Stop Hypertension; EPIC,
European Prospective Investigation
into Cancer and Nutrition; HPFS, Health
Professionals Follow-Up Study; IRAS,
Insulin Resistance Atherosclerosis
Study; MEC, Multiethnic Cohort;
MESA, Multi-Ethnic Study of Athero-
sclerosis; NHS, Nurses� Health Study;
PREDIMED, Prevencion con Dieta
Mediterranea; SUN, Seguimiento Uni-
versidad de Navarra; WHI, Women’s
Health Initiative.
1176 Jannasch et al.
by guest on July 31, 2017jn.nutrition.org
Dow
nloaded from
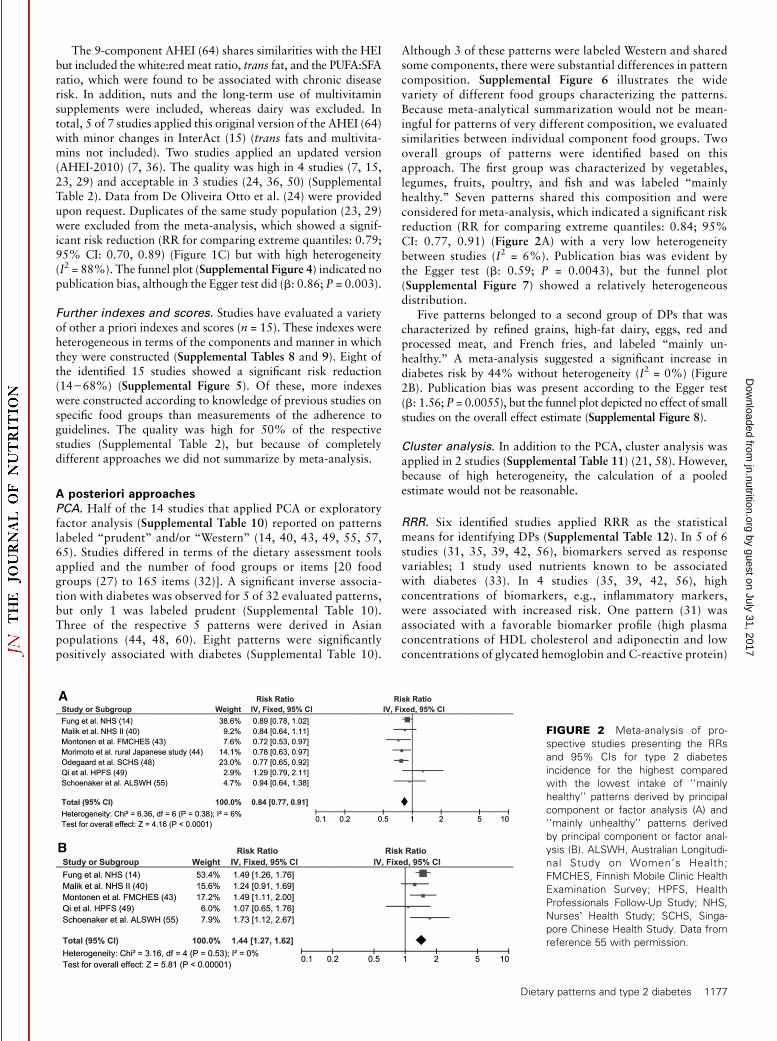
The 9-component AHEI (64) shares similarities with the HEIbut included the white:red meat ratio, trans fat, and the PUFA:SFAratio, which were found to be associated with chronic diseaserisk. In addition, nuts and the long-term use of multivitaminsupplements were included, whereas dairy was excluded. Intotal, 5 of 7 studies applied this original version of the AHEI (64)with minor changes in InterAct (15) (trans fats and multivita-mins not included). Two studies applied an updated version(AHEI-2010) (7, 36). The quality was high in 4 studies (7, 15,23, 29) and acceptable in 3 studies (24, 36, 50) (SupplementalTable 2). Data from De Oliveira Otto et al. (24) were providedupon request. Duplicates of the same study population (23, 29)were excluded from the meta-analysis, which showed a signif-icant risk reduction (RR for comparing extreme quantiles: 0.79;95% CI: 0.70, 0.89) (Figure 1C) but with high heterogeneity(I2 = 88%). The funnel plot (Supplemental Figure 4) indicated nopublication bias, although the Egger test did (b: 0.86; P = 0.003).
Further indexes and scores. Studies have evaluated a varietyof other a priori indexes and scores (n = 15). These indexes wereheterogeneous in terms of the components and manner in whichthey were constructed (Supplemental Tables 8 and 9). Eight ofthe identified 15 studies showed a significant risk reduction(14268%) (Supplemental Figure 5). Of these, more indexeswere constructed according to knowledge of previous studies onspecific food groups than measurements of the adherence toguidelines. The quality was high for 50% of the respectivestudies (Supplemental Table 2), but because of completelydifferent approaches we did not summarize by meta-analysis.
A posteriori approachesPCA. Half of the 14 studies that applied PCA or exploratoryfactor analysis (Supplemental Table 10) reported on patternslabeled ‘‘prudent’’ and/or ‘‘Western’’ (14, 40, 43, 49, 55, 57,65). Studies differed in terms of the dietary assessment toolsapplied and the number of food groups or items [20 foodgroups (27) to 165 items (32)]. A significant inverse associa-tion with diabetes was observed for 5 of 32 evaluated patterns,but only 1 was labeled prudent (Supplemental Table 10).Three of the respective 5 patterns were derived in Asianpopulations (44, 48, 60). Eight patterns were significantlypositively associated with diabetes (Supplemental Table 10).
Although 3 of these patterns were labeled Western and sharedsome components, there were substantial differences in patterncomposition. Supplemental Figure 6 illustrates the widevariety of different food groups characterizing the patterns.Because meta-analytical summarization would not be mean-ingful for patterns of very different composition, we evaluatedsimilarities between individual component food groups. Twooverall groups of patterns were identified based on thisapproach. The first group was characterized by vegetables,legumes, fruits, poultry, and fish and was labeled ‘‘mainlyhealthy.’’ Seven patterns shared this composition and wereconsidered for meta-analysis, which indicated a significant riskreduction (RR for comparing extreme quantiles: 0.84; 95%CI: 0.77, 0.91) (Figure 2A) with a very low heterogeneitybetween studies (I2 = 6%). Publication bias was evident bythe Egger test (b: 0.59; P = 0.0043), but the funnel plot(Supplemental Figure 7) showed a relatively heterogeneousdistribution.
Five patterns belonged to a second group of DPs that wascharacterized by refined grains, high-fat dairy, eggs, red andprocessed meat, and French fries, and labeled ‘‘mainly un-healthy.’’ A meta-analysis suggested a significant increase indiabetes risk by 44% without heterogeneity (I2 = 0%) (Figure2B). Publication bias was present according to the Egger test(b: 1.56; P = 0.0055), but the funnel plot depicted no effect of smallstudies on the overall effect estimate (Supplemental Figure 8).
Cluster analysis. In addition to the PCA, cluster analysis wasapplied in 2 studies (Supplemental Table 11) (21, 58). However,because of high heterogeneity, the calculation of a pooledestimate would not be reasonable.
RRR. Six identified studies applied RRR as the statisticalmeans for identifying DPs (Supplemental Table 12). In 5 of 6studies (31, 35, 39, 42, 56), biomarkers served as responsevariables; 1 study used nutrients known to be associatedwith diabetes (33). In 4 studies (35, 39, 42, 56), highconcentrations of biomarkers, e.g., inflammatory markers,were associated with increased risk. One pattern (31) wasassociated with a favorable biomarker profile (high plasmaconcentrations of HDL cholesterol and adiponectin and lowconcentrations of glycated hemoglobin and C-reactive protein)
FIGURE 2 Meta-analysis of pro-
spective studies presenting the RRs
and 95% CIs for type 2 diabetes
incidence for the highest compared
with the lowest intake of ‘‘mainly
healthy’’ patterns derived by principal
component or factor analysis (A) and
‘‘mainly unhealthy’’ patterns derived
by principal component or factor anal-
ysis (B). ALSWH, Australian Longitudi-
nal Study on Women’s Health;
FMCHES, Finnish Mobile Clinic Health
Examination Survey; HPFS, Health
Professionals Follow-Up Study; NHS,
Nurses� Health Study; SCHS, Singa-
pore Chinese Health Study. Data from
reference 55 with permission.
Dietary patterns and type 2 diabetes 1177
by guest on July 31, 2017jn.nutrition.org
Dow
nloaded from

and reduced diabetes risk (Supplemental Table 13). All iden-tified RRR patterns were related significantly to diabetesrisk, with the strongest association observed with the use ofthrombosis markers as responses (39). Participants in thehighest quartile of this RRR pattern, characterized by rela-tively high intakes of red meat and low-fiber bread andcereals, dried beans, fried potatoes, tomatoes, eggs, cheese,cottage cheese, and a low intake of wine, had a >4-fold higherrisk than participants within the lowest quartile (OR: 4.51;95% CI: 1.60, 12.69) (Supplemental Table 13). Comparingthe food groups contributing to the RRR patterns showed thatrefined grains, processed meat, SSBs, and wine loaded onthe patterns in $4 of 6 studies (Supplemental Table 14).However, the RRR patterns also differed in regard to their char-acterization by food groups such as fruits, beer, red meat,legumes, poultry (31), diet soft drinks, vegetables, coffee (56),onions, burgers and sausages, snacks, jam, dressings, and wholegrains (42).
Several RRR patterns were evaluated subsequently inindependent cohort studies (Supplemental Table 15) (15, 35,56). The pooled estimate for the RRR pattern originallyderived by Heidemann et al. (31) indicated a significantdiabetes risk reduction (RR for comparing extreme quantiles:0.51; 95% CI: 0.27, 0.98) but with heterogeneity between theincluded studies (I2 = 86%) (Figure 3A). The RRR pattern (56)derived within the Nurses� Health Study was validatedinternally and externally (15, 35, 56). The pooled estimatecalculated by the random-effects model was RR for compar-ing extreme quantiles (RR: 2.53; 95% CI: 1.56, 4.10) (Figure3B), showing heterogeneity (I2 = 94%) between US-basedstudies and the European InterAct Consortium study (15)with a considerably weaker, although still significant, positiveassociation in the latter study. The meta-analysis of the thirdRRR pattern (42), replicated in 2 additional cohort studies(15, 35), suggested a significant increase in diabetes risk of;40% (RR for comparing extreme quantiles: 1.39; 95% CI:1.25, 1.54), and no heterogeneity was present (I2 = 0%)(Figure 3C).
Discussion
The aim of this SLR was to identify prospective studies on DPsand diabetes considering different methodologic approaches andsummarizing evidence by means of meta-analyses. We identified48 studies that included ;1.5 million participants. To our
knowledge, this is the most comprehensive review on the topic, byfar exceeding previous reviews by Alhazmi et al. (12) (15 articles),Esposito et al. (11) (18 articles), Schwingshackl and Hoffmann(9) (7 studies), and McEvoy et al. (10) (9 studies). Previousreviews have focused exclusively on a priori (9) or explora-tory patterns (10) or did not separately investigate different
methodologic approaches to generate patterns and thus largelyignored differences in their composition. Some reviews (11, 12)summarized studies evaluating various DPs ranging from theMediterranean diet over DASH to the so-called prudent patternsfrom PCA that may share some components but also havedifferences in composition. For example, diet patterns describedas Mediterranean differ substantially from DASH in whole
grains, alcohol, SSBs, fish, sweets, and dairy consumption, andPCA-derived healthy or prudent patterns are frequently notrelated to low red meat or SSB intake. Although Esposito et al.(11) reported on those patterns with a described beneficial healtheffect, their approach ignored evidence from a large proportionof exploratory patterns. We identified a large number of studies
observing increased diabetes risk of rather unhealthy DPs.Because the direction of the association of DPs is merely afunction of the definition of the exposure groups [an unhealthypattern (e.g., high in red and processed meats, SSBs, and refinedgrains) with a direct association with diabetes risk can simply bereversed into a healthy pattern (low in respective food groups)with a protective association by rescaling or with the use of a
different reference group], previous reviews have given only aselected picture of the available evidence. One review (10)summarized the evidence of the association of exploratory DPswith diabetes but included studies in the meta-analysis based onthe pattern label and not on the actual composition. Given thatexploratory patterns per definition are population-specific, this
FIGURE 3 Meta-analysis of pro-
spective studies presenting the RRs
and 95% CIs for type 2 diabetes
incidence for the highest compared
with the lowest intake of RRR pattern
derived by Heidemann et al. (31)
applied in 2 external study populations
(A); RRR pattern derived by Schulze
et al. (56) applied in 3 external study
populations without blood donations
[risk estimate by InterAct Consortium
(15) recalculated according to the di-
rection of association] (B); and RRR
pattern derived by McNaughton et al.
(42) applied in 2 external study popu-
lations [risk estimate by InterAct Con-
sortium (15) recalculated according to
the direction of association] (C). EPIC,
European Prospective Investigation
into Cancer and Nutrition; FOS, Fra-
mingham Offspring Study; NHS,
Nurses� Health Study; RRR, reduced
rank regression; w.b., without blood
donation; WHS II, Whitehall Study II.
1178 Jannasch et al.
by guest on July 31, 2017jn.nutrition.org
Dow
nloaded from

approach is questionable. In contrast, we summarized onlypatterns with similar compositions. Not surprisingly, the set ofstudies included in this review (10) shows limited overlap withours (healthy patterns: 4 studies; unhealthy patterns: 3 studies).
We identified 6 prospective cohort studies that examined theassociation of the Mediterranean diet with diabetes. The overallrisk estimate suggests a significant risk reduction. Previous meta-analyses (13, 66) reported a similar risk reduction, although theset of included studies slightly differed because of distinctinclusion criteria. One included study (18) observed no signif-icant risk reduction. Possible reasons for the null finding couldbe the relative short follow-up time (6.6 y), the dietarymeasurement tool not specifically designed for the Mediterra-nean diet, or the omission of characteristic components such asolive oil (18). However, studies in non-Mediterranean popula-tions (23, 36) facing similar difficulties observed risk reductions.In addition to cohort studies, the PREDIMED randomized trialobserved a 30% risk reduction for participants following aMediterranean diet compared with controls. Thus, there isstrong evidence overall that adherence to theMediterranean dietreduces diabetes risk.
We also found evidence that adherence to DASH reducesdiabetes risk. Similar conclusions were drawn in a recent review(9). There is a considerable overlap of components of DASH andthe Mediterranean diet, such as vegetables, fruits, nuts, andlegumes as beneficial components [although evidence for theirassociation with diabetes is limited (67, 68)] and red andprocessed meat as a rather detrimental component [with strongevidence for risk increase (69)]. However, unlike the Mediter-ranean diet, DASH includes whole grains, low-fat dairy, a broadgroup of fats and oils, and SSBs but does not consider alcohol.Evidence is quite strong for risk-reducing properties of low-fatdairy (70) and whole-grains (71) and risk-increasing propertiesof SSBs (72). As for many of the Mediterranean diet compo-nents, the evidence for an association with diabetes is ratherlimited. It remains unclear which components are responsiblefor the preventive effect on diabetes risk. Although single foodeffects may be too weak to be detectable and only the combinedeffect of DPs triggers an association, results from the InterActstudy also suggest that the association of the Mediterranean dietmay mainly be related to alcohol, meat, and olive oil (52).
For adherence to AHEI, our meta-analysis observed a signif-icant risk reduction. Interestingly, the 4 US-based studiesobserved significant risk reductions, whereas the European-based InterAct study observed no significant association. Apossible explanation for this discrepancy could be the distinctdistribution of dietary intake (73). One previous meta-analysisexamined the association of the AHEI with diabetes but used adifferent study set (9). Although the AHEI shares some compo-nents with the DASH diet, moderate alcohol consumption as awell-established protective factor for diabetes (74) is an impor-tant difference. Although our meta-analysis supports thatadherence to AHEI can reduce diabetes risk, generalizability tonon-US populations should be further investigated.
Similar to the HEI, several investigations have evaluatedscores reflecting adherence to national dietary recommenda-tions. Although core components were always present (foodshigh in dietary fiber with low glycemic load and a good fatquality, described as the PUFA:SFA ratio), the heterogeneity ofapproaches prohibited a meta-analytical summarization.
We identified 32 PCA patterns evaluating the associationwith diabetes risk, although previous reviews were restricted to aconsiderably smaller number (10–12). Furthermore, our SLRclearly indicates that PCA patterns are not easily comparable
between different study populations despite the use of similarlabels by authors. Previous reviews (10–12) have summarizedstudies rather uncritically based on observed associations withdiabetes risk but not based on pattern compositions—largelylimiting the interpretability of the findings. To systematicallyaddress this point, the patterns in this SLR were only included inmeta-analyses when characterized by concordant food groups,resulting in a considerably smaller number of exploratorypatterns included in the meta-analysis than were published.Although we consider our approach as being strong, this alsohighlights that many published associations of exploratorypatterns remain population-specific findings and single observa-tions. We were able to identify 2 groups of patterns. First,patterns mainly characterized by vegetables, legumes, fruits,poultry, and fish were inversely associated with diabetes.Evidence for risk-reducing properties is limited for these foods(67–69, 75); however, DPs, being a combination of these foods,seem to reduce diabetes risk. A second group of patterns wascharacterized by refined grains, high-fat dairy, eggs, red andprocessed meat, and French fries and was related to an increaseddiabetes risk, consistent with associations observed for eggs (76)and red and processed meat (69). However, refined grains (71)and high-fat dairy (70) have not been consistently linked todiabetes risk. Overall, the contributions of single PCA-patterncomponents remain unknown to observed associations withdiabetes risk. Furthermore, in every study that we evaluated,food items were condensed to food groups in a different manner,comprising various numbers, which may have affected thenumber and characteristics of the derived patterns (77).
We identified 3 RRR patterns that were repeatedly evaluated inprospective cohort studies beyond the studies from which theywere initially derived. As an advantage of RRR compared withpurely data-driven methods, pattern generation aims to explainmaximum variance in a set of responses, e.g., biomarkers linkedto diabetes. The associations with diabetes were relatively strongcompared with other approaches. The heterogeneity between thestudies was relatively high, but even the lowest reported effect sizewas quite comparable to those reported for other approaches.Furthermore, the I2 measure of heterogeneity increases withincreasing the sample size of included studies (78). Thus, estimatesof heterogeneity may not be easily comparable between DPapproaches. The use of glycated hemoglobin or HOMA-IR asresponses could be criticized because they are prediction markersof type 2 diabetes. Although it was shown that the derived RRRpatterns were similarly associated with diabetes risk in indepen-dent study populations, the patterns might be specific for diabetesbut of less importance for other chronic diseases. The use of more‘‘upstream’’ markers might be more useful for identifying patternsimportant for a variety of outcomes based on shared biologicalpathways, such as inflammation (56, 79). Still, our meta-analysismight indicate that RRR is advantageous for identifying diabetes-relevant DPs. Previous reviews summarized studies irrespective ofdifferent biomarker response sets and pattern composition (12,13). Our meta-analyses of 3 selected RRR patterns revealed thatrefined grains, SSBs, and processed meat play a major role,independent of the biomarkers used as responses. This is partly inline with components of the mainly unhealthy group of PCA-derived patterns. Thus, DPs with these components seemed toincrease diabetes risk, regardless of the applied approach. It isworth noting that each RRR pattern was also characterizedby different components possibly because of different biomarkersets, reflecting different pathways in the metabolism leadingto diabetes (15) or population-specific dietary habits; e.g., thenegative loading of legumes to the RRR score derived by
Dietary patterns and type 2 diabetes 1179
by guest on July 31, 2017jn.nutrition.org
Dow
nloaded from

Heidemann et al. (31) may reflect that legumes are often con-sumed as stews in combination with processed meat in thisparticular population (15).
The problem of potential confounding was addressed in thequality assessment of the studies and by summarizing only thoserisk estimates from the most comprehensively adjustedmodels. Thefunnel plots did not indicate publication bias, although such biasmay not be fully ruled out inmeta-analyses. Furthermore, themeta-analytical summarization of DPs generated by factor analysis andPCA may be questioned because they remain population-specific,even if similar components were identified. The summarized apriori patterns were partly characterized by slight differences incomposition. Furthermore, risk estimates refer to the comparisonsof extreme quantiles but did not consider dose-response relations.
To conclude, diets according to the Mediterranean diet,DASH, and AHEI each have a strong potential for preventingdiabetes, although they differ in particular components. The 2identified groups of exploratory DPs characterized by concordantfood groups were significantly associated with diabetes risk. Thisobservation suggests that the combination of several food groupsallows the identification of DPs associated with diabetes risk evenif single-component foods have limited evidence for an associa-tion. Still, exploratory DPs quite frequently remain population-specific observations. For 3 RRR patterns, consistent positiveassociations with diabetes were observed across independentpopulations that might favor the RRR approach over purelyexploratory approaches.
AcknowledgmentsThe authors’ responsibilities were as follows—FJ: completedthe first draft of the manuscript; JK and MBS: contributed to allcontent, editing, and the final draft of the manuscript; and allauthors: read and approved the final manuscript.
References
1. Ley SH, Hamdy O, Mohan V, Hu FB. Prevention and management oftype 2 diabetes: dietary components and nutritional strategies. Lancet2014;383:1999–2007.
2. Schulze MB, Hu FB. Dietary patterns and risk of hypertension, type 2diabetes mellitus, and coronary heart disease. Curr Atheroscler Rep2002;4:462–7.
3. Schulze MB, Hoffmann K. Methodological approaches to study dietarypatterns in relation to risk of coronary heart disease and stroke. Br JNutr 2006;95:860–9.
4. Trichopoulou A, Kouris-Blazos A, Wahlqvist ML, Gnardellis C, Lagiou P,Polychronopoulos E, Vassilakou T, Lipworth L, Trichopoulos D. Diet andoverall survival in elderly people. BMJ 1995;311:1457–60.
5. Liese AD, Nichols M, Sun X, D�Agostino RB Jr., Haffner SM. Adher-ence to the DASH diet is inversely associated with incidence of type 2diabetes: the insulin resistance atherosclerosis study. Diabetes Care2009;32:1434–6.
6. Guenther PM, Reedy J, Krebs-Smith SM. Development of the healthyeating index—2005. J Am Diet Assoc 2008;108:1896–901.
7. Chiuve SE, Fung TT, Rimm EB, Hu FB, McCullough ML, Wang M,Stampfer MJ, Willett WC. Alternative dietary indices both stronglypredict risk of chronic disease. J Nutr 2012;142:1009–18.
8. Weikert C, Schulze MB. Evaluating dietary patterns: the role of reducedrank regression. Curr Opin Clin Nutr Metab Care 2016 Jul 6 (Epubahead of print; DOI: 10.1097/MCO.0000000000000308).
9. Schwingshackl L, Hoffmann G. Diet quality as assessed by the healthyeating index, the alternate healthy eating index, the dietary approaches tostop hypertension score, and health outcomes: a systematic review andmeta-analysis of cohort studies. J Acad Nutr Diet 2015;115:780–800 e5.
10. McEvoy CT, Cardwell CR, Woodside JV, Young IS, Hunter SJ,McKinley MC. A posteriori dietary patterns are related to risk of type 2diabetes: findings from a systematic review and meta-analysis. J AcadNutr Diet 2014;114:1759–75.
11. Esposito K, Chiodini P, Maiorino MI, Bellastella G, Panagiotakos D,
Giugliano D. Which diet for prevention of type 2 diabetes? A meta-
analysis of prospective studies. Endocrine 2014;47:107–16.
12. Alhazmi A, Stojanovski E, McEvoy M, Garg ML. The association
between dietary patterns and type 2 diabetes: a systematic review
and meta-analysis of cohort studies. J Hum Nutr Diet 2014;27:251–
60.
13. Esposito K, Kastorini CM, Panagiotakos DB, Giugliano D. Prevention
of type 2 diabetes by dietary patterns: a systematic review of prospective
studies and meta-analysis. Metab Syndr Relat Disord 2010;8:471–6.
14. Fung TT, Schulze M, Manson JE, Willett WC, Hu FB. Dietary patterns,
meat intake, and the risk of type 2 diabetes in women. Arch Intern Med
2004;164:2235–40.
15. InterAct Consortium. Adherence to predefined dietary patterns and
incident type 2 diabetes in European populations: EPIC-InterAct Study.
Diabetologia 2014;57:321–33.
16. Higgins JP, Thompson SG, Deeks JJ, Altman DG. Measuring inconsis-
tency in meta-analyses. BMJ 2003;327:557–60.
17. Egger M, Davey Smith G, Schneider M, Minder C. Bias in meta-analysis
detected by a simple, graphical test. BMJ 1997;315:629–34.
18. Abiemo EE, Alonso A, Nettleton JA, Steffen LM, Bertoni AG, Jain A,
Lutsey PL. Relationships of the Mediterranean dietary pattern with
insulin resistance and diabetes incidence in the Multi-Ethnic Study of
Atherosclerosis (MESA). Br J Nutr 2013;109:1490–7.
19. Alhazmi A, Stojanovski E, McEvoy M, Brown W, Garg ML. Diet quality
score is a predictor of type 2 diabetes risk in women: the Australian
longitudinal study on women�s health. Br J Nutr 2014;112:945–51.
20. Bauer F, Beulens JW, van der A DL, Wijmenga C, Grobbee DE,
Spijkerman AM, van der Schouw YT, Onland-Moret NC. Dietary
patterns and the risk of type 2 diabetes in overweight and obese indi-
viduals. Eur J Nutr 2013;52:1127–34.
21. Brunner EJ, Mosdol A, Witte DR, Martikainen P, Stafford M,
Shipley MJ, Marmot MG. Dietary patterns and 15-y risks of major
coronary events, diabetes, and mortality. Am J Clin Nutr 2008;87:
1414–21.
22. Chiuve SE, Sampson L, Willett WC. The association between a nutri-
tional quality index and risk of chronic disease. Am J Prev Med 2011;
40:505–13.
23. de Koning L, Chiuve SE, Fung TT, Willett WC, Rimm EB, Hu FB. Diet-
quality scores and the risk of type 2 diabetes in men. Diabetes Care
2011;34:1150–6.
24. De Oliveira Otto MC, Padhye NS, Bertoni AG, Jacobs DR Jr.,
Mozaffarian D. Everything in moderation—dietary diversity and qual-
ity, central obesity and risk of diabetes. PLoS One 2015;10:e0141341.
25. Dominguez LJ, Bes-Rastrollo M, Basterra-Gortari FJ, Gea A,
Barbagallo M, Martinez-Gonzalez MA. Association of a dietary score
with incident type 2 diabetes: the dietary-based diabetes-risk score
(DDS). PLoS One 2015;10:e0141760.
26. Domınguez LJ, Bes-Rastrollo M, de la Fuente-Arrillaga C, Toledo E,
Beunza JJ, Barbagallo M, Martinez-Gonzalez MA. Similar prediction of
total mortality, diabetes incidence and cardiovascular events using relative-
and absolute-component Mediterranean diet score: the SUN cohort. Nutr
Metab Cardiovasc Dis 2013;23:451–8.
27. Erber E, Hopping BN, Grandinetti A, Park SY, Kolonel LN,
Maskarinec G. Dietary patterns and risk for diabetes: the multiethnic
cohort. Diabetes Care 2010;33:532–8.
28. Ford ES, Bergmann MM, Kroger J, Schienkiewitz A, Weikert C,
Boeing H. Healthy living is the best revenge: findings from the European
Prospective Investigation into Cancer and Nutrition-Potsdam study.
Arch Intern Med 2009;169:1355–62.
29. Fung TT, McCullough M, van Dam RM, Hu FB. A prospective study of
overall diet quality and risk of type 2 diabetes in women. Diabetes Care
2007;30:1753–7.
30. Gopinath B, Rochtchina E, Flood VM, Mitchell P. Diet quality is pro-
spectively associated with incident impaired fasting glucose in older
adults. Diabet Med 2013;30:557–62.
31. Heidemann C, Hoffmann K, Spranger J, Klipstein-Grobusch K,
Mohlig M, Pfeiffer AFH, Boeing H. A dietary pattern protective against
type 2 diabetes in the European Prospective Investigation into Cancer
and Nutrition (EPIC)-Potsdam study cohort. Diabetologia 2005;48:
1126–34.
1180 Jannasch et al.
by guest on July 31, 2017jn.nutrition.org
Dow
nloaded from

32. Hodge AM, English DR, O�Dea K, Giles GG. Dietary patterns anddiabetes incidence in the Melbourne collaborative cohort study. Am JEpidemiol 2007;165:603–10.
33. Hoffmann K, Schulze MB, Schienkiewitz A, Nothlings U, Boeing H.Application of a new statistical method to derive dietary patterns innutritional epidemiology. Am J Epidemiol 2004;159:935–44.
34. Hu FB, Manson JE, Stampfer MJ, Colditz G, Liu S, Solomon CG,Willett WC. Diet, lifestyle, and the risk of type 2 diabetes mellitus inwomen. N Engl J Med 2001;345:790–7.
35. Imamura F, Lichtenstein AH, Dallal GE, Meigs JB, Jacques PF. Gener-alizability of dietary patterns associated with incidence of type 2 dia-betes mellitus. Am J Clin Nutr 2009;90:1075–83.
36. Jacobs S, Harmon BE, Boushey CJ, Morimoto Y, Wilkens LR, LeMarchand L, Kroger J, Schulze MB, Kolonel LN, Maskarinec G. Apriori-defined diet quality indexes and risk of type 2 diabetes: themultiethnic cohort. Diabetologia 2015;58:98–112.
37. Joosten MM, Grobbee DE, van der A DL, Verschuren WM, Hendriks HF,Beulens JW. Combined effect of alcohol consumption and lifestyle be-haviors on risk of type 2 diabetes. Am J Clin Nutr 2010;91:1777–83.
38. Lacoppidan SA, Kyro C, Loft S, Helnaes A, Christensen J, Hansen CP,Dahm CC, Overvad K, Tjonneland A, Olsen A. Adherence to a healthyNordic food index is associated with a lower risk of type-2 diabetes—theDanish Diet, Cancer and Health cohort study. Nutrients 2015;7:8633–44.
39. Liese AD, Weis KE, Schulz M, Tooze JA. Food intake patterns associ-ated with incident type 2 diabetes: the Insulin Resistance AtherosclerosisStudy. Diabetes Care 2009;32:263–8.
40. Malik VS, Fung TT, van Dam RM, Rimm EB, Rosner B, Hu FB. Dietarypatterns during adolescence and risk of type 2 diabetes in middle-agedwomen. Diabetes Care 2012;35:12–8.
41. Martınez-Gonzalez MA, de la Fuente-Arrillaga C, Nunez-Cordoba JM,Basterra-Gortari FJ, Beunza JJ, Vazquez Z, Benito S, Tortosa A, Bes-Rastrollo M. Adherence to Mediterranean diet and risk of developingdiabetes: prospective cohort study. BMJ 2008;336:1348–51.
42. McNaughton SA, Mishra GD, Brunner EJ. Dietary patterns, insulinresistance, and incidence of type 2 diabetes in the Whitehall II Study.Diabetes Care 2008;31:1343–8.
43. Montonen J, Knekt P, Harkanen T, Jarvinen R, Heliovaara M,Aromaa A, Reunanen A. Dietary patterns and the incidence of type 2diabetes. Am J Epidemiol 2005;161:219–27.
44. Morimoto A, Ohno Y, Tatsumi Y, Mizuno S, Watanabe S. Effects ofhealthy dietary pattern and other lifestyle factors on incidence of diabetesin a rural Japanese population. Asia Pac J Clin Nutr 2012;21:601–8.
45. Mozaffarian D, Kamineni A, Carnethon M, Djousse L, Mukamal KJ,Siscovick D. Lifestyle risk factors and new-onset diabetes mellitus inolder adults: the cardiovascular health study. Arch Intern Med 2009;169:798–807.
46. Nanri A, Shimazu T, Takachi R, Ishihara J, Mizoue T, Noda M,Inoue M, Tsugane S. Dietary patterns and type 2 diabetes in Japanesemen and women: the Japan Public Health Center-Based ProspectiveStudy. Eur J Clin Nutr 2013;67:18–24.
47. Nettleton JA, Steffen LM, Ni H, Liu K, Jacobs DR Jr. Dietary patternsand risk of incident type 2 diabetes in the multi-ethnic study ofatherosclerosis (MESA). Diabetes Care 2008;31:1777–82.
48. Odegaard AO, Koh WP, Butler LM, Duval S, Gross MD, Yu MC,Yuan JM, Pereira MA. Dietary patterns and incident type 2 diabetes inChinese men and women: the Singapore Chinese health study. DiabetesCare 2011;34:880–5.
49. Qi L, Cornelis MC, Zhang C, van Dam RM, Hu FB. Genetic predis-position, Western dietary pattern, and the risk of type 2 diabetes in men.Am J Clin Nutr 2009;89:1453–8.
50. Qiao Y, Tinker L, Olendzki BC, Hebert JR, Balasubramanian R,Rosal MC, Hingle M, Song Y, Schneider KL, Liu S, et al. Racial/ethnicdisparities in association between dietary quality and incident diabetesin postmenopausal women in the United States: the women�s healthinitiative 1993–2005. Ethn Health 2014;19:328–47.
51. Reis JP, Loria CM, Sorlie PD, Park Y, Hollenbeck A, Schatzkin A.Lifestyle factors and risk for new-onset diabetes: a population-basedcohort study. Ann Intern Med 2011;155:292–9.
52. Romaguera D, Guevara M, Norat T, Langenberg C, Forouhi NG,Sharp S, Slimani N, Schulze MB, Buijsse B, Buckland G, et al. Medi-terranean diet and type 2 diabetes risk in the European ProspectiveInvestigation into Cancer and Nutrition (EPIC) study: the InterActproject. Diabetes Care 2011;34:1913–8.
53. Rossi M, Turati F, Lagiou P, Trichopoulos D, Augustin LS, LaVecchia C, Trichopoulou A. Mediterranean diet and glycaemicload in relation to incidence of type 2 diabetes: results from theGreek cohort of the population-based European ProspectiveInvestigation into Cancer and Nutrition (EPIC). Diabetologia2013;56:2405–13.
54. Salas-Salvado J, Bullo M, Estruch R, Ros E, Covas MI, Ibarrola-Jurado N, Corella D, Aros F, Gomez-Gracia E, Ruiz-Gutierrez V,et al. Prevention of diabetes with Mediterranean diets: a sub-group analysis of a randomized trial. Ann Intern Med 2014;160:1–10.
55. Schoenaker DA, Dobson AJ, Soedamah-Muthu SS, Mishra GD. Factoranalysis is more appropriate to identify overall dietary patterns associ-ated with diabetes when compared with Treelet transform analysis. JNutr 2013;143:392–8.
56. Schulze MB, Hoffmann K, Manson JE, Willett WC, Meigs JB,Weikert C, Heidemann C, Colditz GA, Hu FB. Dietary pattern, in-flammation, and incidence of type 2 diabetes in women. Am J Clin Nutr2005;82:675–84.
57. van Dam RM, Rimm EB, Willett WC, Stampfer MJ, Hu FB. Dietarypatterns and risk for type 2 diabetes mellitus in U.S. men. Ann InternMed 2002;136:201–9.
58. Villegas R, Yang G, Gao YT, Cai H, Li H, Zheng W, Shu XO. Dietarypatterns are associated with lower incidence of type 2 diabetes inmiddle-aged women: the Shanghai women�s health study. Int JEpidemiol 2010;39:889–99.
59. von Ruesten A, Illner AK, Buijsse B, Heidemann C, Boeing H. Adher-ence to recommendations of the German food pyramid and risk ofchronic diseases: results from the EPIC-Potsdam study. Eur J Clin Nutr2010;64:1251–9.
60. Yu R, Woo J, Chan R, Sham A, Ho S, Tso A, Cheung B, Lam TH,Lam K. Relationship between dietary intake and the development oftype 2 diabetes in a Chinese population: the Hong Kong dietary survey.Public Health Nutr 2011;14:1133–41.
61. Zamora D, Gordon-Larsen P, He K, Jacobs DR Jr., Shikany JM,Popkin BM. Are the 2005 dietary guidelines for Americans associatedwith reduced risk of type 2 diabetes and cardiometabolic risk factors?Twenty-year findings from the CARDIA study. Diabetes Care 2011;34:1183–5.
62. Perez-Jimenez F, Alvarez de Cienfuegos G, Badimon L, Barja G,Battino M, Blanco A, Bonanome A, Colomer R, Corella-Piquer D,Covas I, et al. International conference on the healthy effect of virginolive oil. Eur J Clin Invest 2005;35:421–4.
63. Trichopoulou A, Costacou T, Bamia C, Trichopoulos D. Adherence to aMediterranean diet and survival in a Greek population. N Engl J Med2003;348:2599–608.
64. McCullough ML, Feskanich D, Stampfer MJ, Giovannucci EL,Rimm EB, Hu FB, Spiegelman D, Hunter DJ, Colditz GA,Willett WC. Diet quality and major chronic disease risk in men andwomen: moving toward improved dietary guidance. Am J Clin Nutr2002;76:1261–71.
65. Imamura F, Lichtenstein AH, Dallal GE, Meigs JB, Jacques PF.Confounding by dietary patterns of the inverse association betweenalcohol consumption and type 2 diabetes risk. Am J Epidemiol 2009;170:37–45.
66. Koloverou E, Esposito K, Giugliano D, Panagiotakos D. The effect ofMediterranean diet on the development of type 2 diabetes mellitus: ameta-analysis of 10 prospective studies and 136,846 participants.Metabolism 2014;63:903–11.
67. Afshin A, Micha R, Khatibzadeh S, Mozaffarian D. Consumption ofnuts and legumes and risk of incident ischemic heart disease, stroke, anddiabetes: a systematic review and meta-analysis. Am J Clin Nutr2014;100:278–88.
68. Boeing H, Bechthold A, Bub A, Ellinger S, Haller D, Kroke A, Leschik-Bonnet E, Muller MJ, Oberritter H, Schulze M, et al. Critical review:vegetables and fruit in the prevention of chronic diseases. Eur J Nutr2012;51:637–63.
69. Feskens EJ, Sluik D, van Woudenbergh GJ. Meat consumption, diabe-tes, and its complications. Curr Diab Rep 2013;13:298–306.
70. Gijsbers L, Ding EL, Malik VS, de Goede J, Geleijnse JM, Soedamah-Muthu SS. Consumption of dairy foods and diabetes incidence: a dose-response meta-analysis of observational studies. Am J Clin Nutr 2016;103:1111–24.
Dietary patterns and type 2 diabetes 1181
by guest on July 31, 2017jn.nutrition.org
Dow
nloaded from

71. Aune D, Norat T, Romundstad P, Vatten LJ. Whole grain and refined
grain consumption and the risk of type 2 diabetes: a systematic review
and dose-response meta-analysis of cohort studies. Eur J Epidemiol
2013;28:845–58.
72. Greenwood DC, Threapleton DE, Evans CE, Cleghorn CL, Nykjaer C,
Woodhead C, Burley VJ. Association between sugar-sweetened and artifi-
cially sweetened soft drinks and type 2 diabetes: systematic review and dose-
response meta-analysis of prospective studies. Br J Nutr 2014;112:725–34.
73. de Souza RJ, Mente A, Maroleanu A, Cozma AI, Ha V, Kishibe T,
Uleryk E, Budylowski P, Schunemann H, Beyene J, et al. Intake of sat-
urated and trans unsaturated fatty acids and risk of all cause mortality,
cardiovascular disease, and type 2 diabetes: systematic review and meta-
analysis of observational studies. BMJ 2015;351:h3978.
74. Baliunas DO, Taylor BJ, Irving H, Roerecke M, Patra J, Mohapatra S,
Rehm J. Alcohol as a risk factor for type 2 diabetes: a systematic review
and meta-analysis. Diabetes Care 2009;32:2123–32.
75. Yanai H, Hamasaki H, Katsuyama H, Adachi H, Moriyama S, Sako A.
Effects of intake of fish or fish oils on the development of diabetes. J Clin
Med Res 2015;7:8–12.
76. Shin JY, Xun P, Nakamura Y, He K. Egg consumption in relation to risk
of cardiovascular disease and diabetes: a systematic review and meta-
analysis. Am J Clin Nutr 2013;98:146–59.
77. Martınez ME, Marshall JR, Sechrest L. Invited commentary: factor
analysis and the search for objectivity. Am J Epidemiol 1998;148:
17–9.
78. Li SJ, Jiang H, Yang H, Chen W, Peng J, Sun MW, Lu CD, Peng X,
Zeng J. The dilemma of heterogeneity tests in meta-analysis: a challenge
from a simulation study. PLoS One 2015;10:e0127538.
79. Lucas M, Chocano-Bedoya P, Schulze MB, Mirzaei F, O�Reilly EJ,
Okereke OI, Hu FB, Willett WC, Ascherio A. Inflammatory dietary
pattern and risk of depression among women. Brain Behav Immun 2014;
36:46–53.
1182 Jannasch et al.
by guest on July 31, 2017jn.nutrition.org
Dow
nloaded from