
Dietary enrichment of n-3 PUFA for laying hens: effect of ... performance, egg production, fatty...
14
411 Animal Science Papers and Reports vol. 33 (2015) no. 4, 411-424 Institute of Genetics and Animal Breeding, Jastrzębiec, Poland Dietary enrichment of n-3 PUFA for laying hens: effect of different sources on production, composition and quality of eggs Antonella Dalle Zotte, Igino Andrighetto, Valerio Giaccone, Giorgio Marchesini* Department of Animal Medicine, Production and Health, University of Padova, Agripolis, Viale dell’Universita, 16, 35020 Legnaro (PD), Italy (Accepted October 1, 2015) Seventy-two Warren strain laying hens were fed 4 isonitrogenous diets ad libitum for 61 days in order to investigate the effects of different sources of n-3 polyunsaturated fatty acids (PUFA) on hen performance, egg production, fatty acid (FA) composition and egg quality. Extruded linseed (EL), ground linseed (GL) and a commercial fish oil source (NF) were added to the control diet (C) at 10.0, 10.0, and 3.4%, respectively. The eggs were collected daily and subjected to measurement and analysis ten times throughout the experimental period. Compared to the C diet, the NF diet significantly improved egg production efficiency (P<0.01) and overall egg weight/hen ratio (P<0.05), whereas the GL and NF diets led to a reduction in hen weight gain (P<0.01). Equilibrium in the yolk FA profile was reached after 14 days of dietary n-3 PUFA source inclusion. All experimental diets significantly affected yolk FA composition and reduced the n-6/n-3 ratio (11.4, 2.0, 2.3, and 2.0 at equilibrium for C, EL, GL, and NF, respectively; P<0.05). Yolk redness (a* values: -1.13 vs -2.25 and -2.96) and yellowness (b* values: 50.7 vs 48.5 and 48.2) were significantly reduced by both linseed- supplemented diets (C vs EL and GL, respectively; P<0.05). Moreover, the form of linseed in the diet (extruded vs ground) significantly affected yolk n-3 PUFA content (7.1 vs 6.4 % total FAME for EL and GL, respectively; P<0.05), and the extruded form significantly enhanced the rate of inclusion, thereby illustrating the importance of feed source processing in egg quality traits. KEY words: laying hen / dietary n-3 PUFA / egg production / egg composition/ egg colour Considering the positive effects of highly polyunsaturated fatty acids (HUFA) of the omega-3 series (n-3), namely EPA (20:5 n-3) and DHA (22:6 n-3), on human *Corresponding author: [email protected]
Transcript of Dietary enrichment of n-3 PUFA for laying hens: effect of ... performance, egg production, fatty...

411
Animal Science Papers and Reports vol. 33 (2015) no. 4, 411-424 Institute of Genetics and Animal Breeding, Jastrzębiec, Poland
Dietary enrichment of n-3 PUFA for laying hens: effect of different sources on production, composition and quality of eggs
Antonella Dalle Zotte, Igino Andrighetto, Valerio Giaccone, Giorgio Marchesini*Department of Animal Medicine, Production and Health, University of Padova, Agripolis, Viale dell’Universita, 16, 35020 Legnaro (PD), Italy
(Accepted October 1, 2015)
Seventy-two Warren strain laying hens were fed 4 isonitrogenous diets ad libitum for 61 days in order to investigate the effects of different sources of n-3 polyunsaturated fatty acids (PUFA) on hen performance, egg production, fatty acid (FA) composition and egg quality. Extruded linseed (EL), ground linseed (GL) and a commercial fish oil source (NF) were added to the control diet (C) at 10.0, 10.0, and 3.4%, respectively. The eggs were collected daily and subjected to measurement and analysis ten times throughout the experimental period. Compared to the C diet, the NF diet significantly improved egg production efficiency (P<0.01) and overall egg weight/hen ratio (P<0.05), whereas the GL and NF diets led to a reduction in hen weight gain (P<0.01). Equilibrium in the yolk FA profile was reached after 14 days of dietary n-3 PUFA source inclusion. All experimental diets significantly affected yolk FA composition and reduced the n-6/n-3 ratio (11.4, 2.0, 2.3, and 2.0 at equilibrium for C, EL, GL, and NF, respectively; P<0.05). Yolk redness (a* values: -1.13 vs -2.25 and -2.96) and yellowness (b* values: 50.7 vs 48.5 and 48.2) were significantly reduced by both linseed-supplemented diets (C vs EL and GL, respectively; P<0.05). Moreover, the form of linseed in the diet (extruded vs ground) significantly affected yolk n-3 PUFA content (7.1 vs 6.4 % total FAME for EL and GL, respectively; P<0.05), and the extruded form significantly enhanced the rate of inclusion, thereby illustrating the importance of feed source processing in egg quality traits.
KEY words: laying hen / dietary n-3 PUFA / egg production / egg composition/ egg colour
Considering the positive effects of highly polyunsaturated fatty acids (HUFA) of the omega-3 series (n-3), namely EPA (20:5 n-3) and DHA (22:6 n-3), on human
*Corresponding author: [email protected]
412
health [Simopoulos 2000, Poławska et al. 2013] and the recommendation that the desirable ratio of n-6/n-3 polyunsaturated fatty acids (PUFA) should be less than 4:1 in human diet [Kralik et al. 2008], n-3 PUFA sources are being introduced in the feeding of poultry to improve the fatty acid (FA) composition of their meat and eggs. A proven ability to modify egg yolk FA profile would provide a meaningful marketing tool for egg producers. Among the numerous dietary supplements for laying hens, fish oil [Ebeid 2011], marine algae [Lemahieu et al. 2013], and linseed [Nain et al. 2012] are reported to be effective in enhancing yolk n-3 FA content. The different sources of n-3 FA, however, do not have the same effect on FA composition [Kirubakaran et al. 2011, Van Elswyk 1997], laying performance, egg quality and sensory traits [Ebeid 2011, Yi et al. 2014], and generally have both advantages and disadvantages. Fish oil, for example, readily promotes the deposition of EPA and DHA in egg yolk [Cachaldora et al. 2006], but has also been seen to decrease yolk weight [Novak and Scheideler 2001, Whitehead et al. 1993]. Other sources of n-3 FA have shown different levels of lipid oxidation and consequently result in different egg shelf life [Botsoglou et al. 2012, Meynier et al. 2014]. Linseed, which is rich in α-linolenic acid (ALA) that is partially converted in EPA and DHA and transferred to the egg [Surai and Sparks 2001], has been found by some authors [Bean and Leeson 2003, Leeson et al. 2000, Novak and Scheideler 2001] to decrease body weight, egg production, and yolk weight when included in laying hen diets, even if other authors have not reported these negative effects [Nain et al. 2012]. Those differences could depend on the technological treatment given to feed components, which in some cases alleviate the negative effects of anti-nutritional factors such as trypsin inhibitors, mucilage, and cyanogenic glycosides present in linseed [Nain et al. 2012]. Although some authors [Thacker et al. 2005] have observed the linseed extrusion process to degrade mucilage and improve digestibility and feed conversion in broilers, to our knowledge little is known on the effect of linseed extrusion on production, FA composition and the quality of eggs in laying hens.
The purpose of this study was to compare the effects of feeding different forms of n-3 FA sources (extruded linseed, ground linseed and microencapsulated fish oil) on hen performance, egg production, FA composition, cholesterol content, lipid oxidation, and colour and pH of the yolk. Moreover, given that egg composition shows some changes throughout the oviposition cycle [Nain et al. 2012], the effect of time on yolk colour and n-3 FA profile was investigated in order to understand when the transfer of nutrients from the feed to the egg is complete and leads to constant FA and colour trait values and the achievement of a status of equilibrium.
Material and methods
Experimental design and animal management
Four isonitrogenous diets containing different sources of n-3 PUFA were tested. The control diet was a commercial diet (C), whereas the three experimental diets
A. Dalle Zotte et al.

413
consisted in adding the following n-3 PUFA-rich ingredients to the C diet: extruded linseed (EL), ground linseed (GL), and a commercial product derived from refined and microencapsulated fish oil (NF: Nordos Fat®, produced by Trouw Nutrition Italia S.p.A., Bussolengo, Verona, Italy) at 10.0, 10.0 and 3.4% of the C diet, respectively. Each diet was enriched with 300 mg α-tocopheryl acetate/kg.
Seventy-two Warren strain laying hens of 24 weeks of age were randomly housed in pairs in enriched cages with 750 cm2 floor space per hen in an experimental farm with the controlled environment conditions. Hens were allocated into four experimental groups (nine replicates per treatment) corresponding to the four experimental diets fed ad libitum for 61 days. Water was provided ad libitum with a nipple waterer. The lighting regime was 16 h of light and 8 h of darkness, and the temperature ranged between 15 and 22°C. Hen body weight was measured at the 1st and 61st day of the experiment. Egg production (number and weight) and feed intake (unconsumed feed was weighed back daily) were measured daily in each cage and calculated on a hen-day basis. All animals were handled according to the principles stated in the EC Directive 86/609/EEC regarding the protection of animals used for experimental and other scientific purposes.
Sample collection and analysis
Diets were analysed (Tab. 1) to determine dry matter (DM), crude protein (CP), ether extract (EE), and ash according to AOAC [AOAC 2000], whilst NDF, ADF and ADL were analysed according to Van Soest et al. [1991] using a Fibre Analyser (ANKOM/ 2000; ANKOM Technology, New York, NY, USA). The FA profile of diets was determined using gas chromatography and it is shown in Table 1. In brief, fatty acids were extracted from ground and mixed samples using chloroform:methanol (2:1. vol/vol) [Folch et al. 1957]. For each sample 20 mg of fat were exposed to acid derivatization with 2 mL of methanolic-H2SO4, 10% vol/vol (Sigma-Aldrich, St. Louis, MO) at 65°C for 1 h and mixed. After dilution with deionized water, fatty acid methyl esters were extracted using exhane and then separated and quantified using a gas chromatograph (Shimatzu GC17A, with a FID detector and an Omegawax 250 column 30 m x 0.25 mm x 0.25 μm).
As mentioned above, all eggs laid during the trial were counted and weighed, and total egg weight/hen was also calculated. Egg production efficiency was calculated by dividing the number of laid eggs/hen by days of egg collection ×100. The eggs laid at days 0, 2, 4, 8, 14, 21, 28, 35, 42 and 56 were collected (No.=720). The day after each collection, the weight of the whole egg and yolk were measured, and also the pH of yolk and albumen. The pH was measured in duplicate with a portable pH-meter (Piccolo, Hanna Instruments, Villafranca Padovana, Italy). At each collecting date, the above-mentioned egg measurements of the two hens per cage were averaged, and 90 eggs per dietary treatment were considered. Cholesterol content of the yolk was determined using high performance liquid chromatography (HPLC) and the method described by Casiraghi et al. (1994), whereas FA composition was determined using the
Dietary enrichment of n-3 PUFA for laying hens
414
method described for diets [Folch et al. 1957]. Thiobarbituric acid reactive substance (TBARS) analysis was performed by HPLC [Bergamo et al. 1998] and the results were expressed as ng malondialdehyde (MDA) equivalents/g yolk. Cholesterol and TBARS contents were determined on 36 eggs (9 eggs per dietary treatment) collected at day 56.
Instrumental yolk colour expressed as L* (lightness), a* (redness), and b* (yellowness) according to the CIELab system [CIE, 1976] was measured with a Minolta CR300 chromameter (Minolta, Osaka, Japan). The illuminant was D65, and an incidence angle of 0 was used. The values corresponded to the average of two measurements per sample.
Statistical analysis
Data on hen performance and production and egg composition were subjected to two-way analysis of variance (with interaction) using the ANOVA procedure [SAS
A. Dalle Zotte et al.
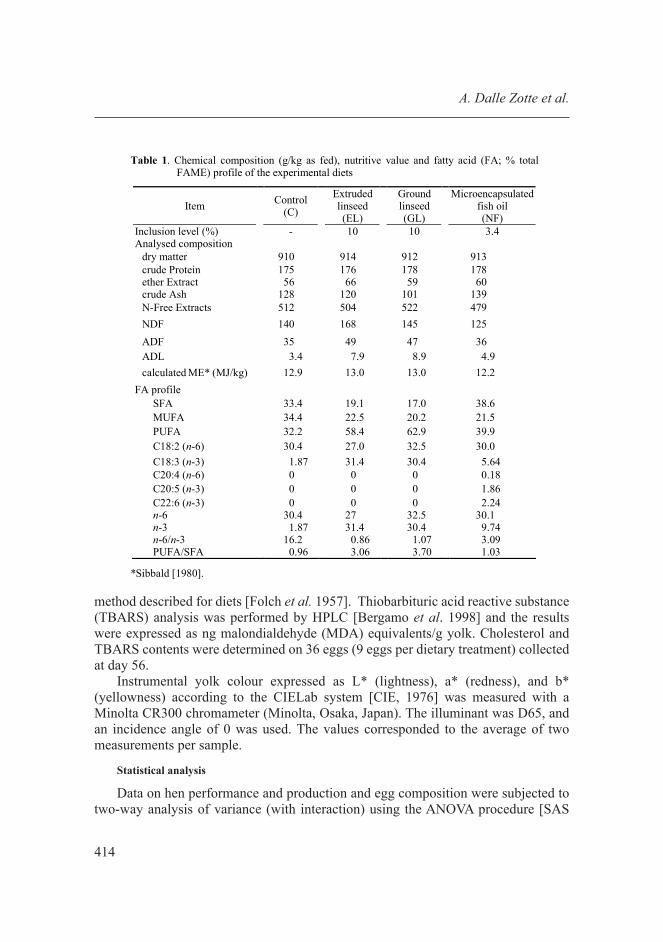
Table 1. Chemical composition (g/kg as fed), nutritive value and fatty acid (FA; % total FAME) profile of the experimental diets
Item Control
(C)
Extruded linseed (EL)
Ground linseed (GL)
Microencapsulated fish oil (NF)
Inclusion level (%) - 10 10 3.4 Analysed composition
dry matter 910 914 912 913 crude Protein 175 176 178 178 ether Extract 56 66 59 60 crude Ash 128 120 101 139 N-Free Extracts 512 504 522 479 NDF 140 168 145 125 ADF 35 49 47 36 ADL 3.4 7.9 8.9 4.9 calculated ME* (MJ/kg) 12.9 13.0 13.0 12.2
FA profile SFA 33.4 19.1 17.0 38.6 MUFA 34.4 22.5 20.2 21.5 PUFA 32.2 58.4 62.9 39.9 C18:2 (n-6) 30.4 27.0 32.5 30.0 C18:3 (n-3) 1.87 31.4 30.4 5.64 C20:4 (n-6) 0 0 0 0.18 C20:5 (n-3) 0 0 0 1.86 C22:6 (n-3) 0 0 0 2.24 n-6 30.4 27 32.5 30.1 n-3 1.87 31.4 30.4 9.74 n-6/n-3 16.2 0.86 1.07 3.09 PUFA/SFA 0.96 3.06 3.70 1.03
*Sibbald [1980].

415
2008], adopting a linear model that considered the effect of the four experimental diets. Data of yolk FA composition and colour were also analysed by adopting a linear model that considered the diet effect (D), the time of experimental diet supplementation (T), and their interaction DxT, where T has three levels: initial (d0, first day of diet supplementation), pre-equilibrium (d2 to d14), and equilibrium (d21 to d56). In this procedure, the repeated measurement option was used to test the significance of T. The adjusted Bonferroni correction for multiple comparison was used.
results and discussion
Performance data
Overall hen body weight and feed intake showed no significant effect of dietary PUFA sources (Tab. 2). Our observations confirmed those of other authors [Baucells et al. 2000, Ebeid 2011],who compared several dietary fat sources, such as fish oil, linseed oil, rapeseed oil, sunflower oil and tallow, at different inclusion levels.
In contrast to the observations reported by Scheideler and Froning [1996] and by Novak and Scheideler [2001], linseed-supplemented diets did not reduce hen body weight. However, when considering weight gain during the 61 days of experimental feed supplementation, we observed that the GL and NF groups gained less weight than the C group (P<0.01), whereas the EL group showed an intermediate value. Dietary n-3 PUFA sources did not modify feed efficiency in egg production (Tab. 2), as had already been demonstrated by Baucells et al. [2000], Grobas et al. [2001] and Nain et al. [2012] when several different fat sources were used in the diet. The NF diet increased egg production significantly (both total egg weight and egg number) compared to the C diet, whereas both linseed treatments led to intermediate yields. The average weight of the eggs was not significantly affected by dietary treatment. These findings seem to suggest that enrichment with n-3 PUFA leads to an overall improvement in egg production, although it tends to reduce the weight gain.
Even if many authors have not reported any effect of n-3 PUFA supplementation on egg production or egg weight [Baucells et al. 2000, Ebeid 2011, Novak and Scheideler 2001], others [Aziza et al. 2013, Scheideler and Froning 1996] have observed increased egg production after supplementation with linseed, fish oil or camelina meal. Furthermore, Scheideler and Froning [1996] showed that linseed inclusion led to a reduction in egg weight. No significant effect of the physical form of linseed (extruded vs ground) on hen performance, egg production or weight was found (Tab. 2).
Egg quality and composition
Yolk weight was affected by the treatment (P<0.05), and its highest value was found in hens fed the C diet, even though Bonferroni test showed no significant differences in pairwise comparisons (Tab. 2). Previously, other authors had reported a decrease in yolk proportion when diets were supplemented with fish oil or linseed
Dietary enrichment of n-3 PUFA for laying hens

416
[Novak and Scheideler 2001, Scheideler and Froning 1996, Whitehead et al. 1993]. One possible reason is that the diet’s long chain FA composition can influence the synthesis of estradiol, leading to a reduction in the formation of yolk FA precursors and their transport into the ovarian follicles [Novak and Scheideler 2001, Whitehead et al. 1993]. Other authors, however, after feeding hens different n-3 PUFA sources, such as fish oil, linseed, and microalgae, did not report any effects on yolk percentage [Ebeid 2011, Kim et al. 2014, Nain et al. 2012]. Generally, using supplemented-PUFA sources does not seem to negatively affect the weight of eggs or that of their components, and the reduction of egg components sometimes observed is amply compensated for by increased egg production, as demonstrated in the present study.
The pH of yolk and albumen did not show differences associated with dietary treatment (Tab. 2), neither did Ahn et al. [1999] observe any significant pH variation in egg yolk or albumen when feeding hens a conjugated linoleic acid (CLA) supplement.
A. Dalle Zotte et al.
Table 2. The effect of feeding n-3 PUFA sources on laying hen performance, egg production, yolk cholesterol content, and TBARS index (wet basis)
Diet
Item
control (C)
extruded linseed (EL)
ground linseed (GL)
microen-capsulated fish oil
(NF)
P-value
SEM1
No. of hens 18 18 18 18 Initial body weight 1866 1867 1859 1866 0.663 165 Weight gain 0-61 day (g/d) 2.6B 1.8AB 1.1A 1.3A 0.007 1.3
Feed intake 0-61 days2 (g/hen/d) 119 123 117 119 0.652 5.7 Feed efficiency 0-61 day (kg feed/kg egg) 2.14 2.09 2.01 1.97 0.784 0.15 Overall eggs weight/hen3 (61 days) (g) 3370a 3525ab 3506ab 3623b 0.035 257 Eggs laid/hen (61days) (No.) 54.6A 57.9AB 57.7AB 59.9B 0.009 3.6 Egg production efficiency3 (%) 89A 95AB 95AB 98B 0.006 6 Egg weight4 (g) 61.8 60.9 60.8 60.5 0.681 4.7 Yolk weight4 (g) 14.7 14.1 14.3 14.0 0.042 1.3 Yolk pH4 6.20 6.17 6.20 6.22 0.367 0.12 Albumen pH4 9.00 8.99 8.98 8.99 0.137 0.12 Yolk cholesterol5 (mg/g) 10.96Aa 11.83B 11.79B 11.54ABb 0.002 0.74 Yolk cholesterol5 (mg/yolk) 176.1β 167.7α 169.3α 160.3α 0.089 20.2 TBARS6 (ng MDA/g) 37.4A 70.0C 69.5C 57.3B <0.001 0.73
1SEM is the standard error of the least squares means. 2Mean value calculated considering the cage consumption. 3Egg production considering the average output of two hens per cage. 4On 360 eggs (90 eggs per dietary treatment). 5On 95 eggs (20, 22, 26 and 27 eggs per C, EL, GL and NF, respectively). 6On 36 eggs (9 eggs per dietary treatment, of the last collection day). aA...Means within a rows bearing different superscripts differ significantly at: small letters − P<0.05; capitals − P<0.01.

417
Yolk cholesterol concentration, expressed as mg/g of yolk, increased in both linseed diets (P<0.01) and also in the NF diet (P<0.05) when compared to the C diet (Tab. 2). When considering cholesterol content per yolk, however, it was lower (P<0.10) in the hens fed the n-3 PUFA-supplemented diets due to their lower yolk weight, and it was below the standard total cholesterol egg content (210 mg/egg) reported by other authors [Ebeid et al. 2008].
TBARS, a measure of lipid peroxidation expressed as ng MDA/g yolk, was higher in all the n-3 PUFA-supplemented diets when compared to the C diet, and this increase was particularly relevant (P<0.001) in both linseed diets (Tab. 2). The level of yolk unsaturation, in fact, was enhanced by supplementation with n-3 PUFA sources (Tab. 1), leading to a greater susceptibility to lipid peroxidation [Botsoglou et al. 2013]. Although a direct comparison of TBARS values in different studies should be considered with caution, in this study TBARS was observed to be low when compared to the findings of some authors [Cortinas et al. 2003] concerning fresh eggs (100-180 ng MDA/g yolk), and this was probably due to the addition of α-tocopheryl acetate in all the diets.
FA composition of yolk
Dietary supplementation of n-3 PUFA led to a gradual increase in ALA in the yolk from day 2 to day 14 of feeding (pre-equilibrium phase), after which a status of equilibrium was achieved and ALA content was fairly constant (Fig. 1). This result is in line with the findings of Nain et al. [2012] and Van Elswyk [1997], who reported that the deposition of lipids in the yolk in response to PUFA supplementation in the diet reaches a plateau after 6 and 9 days of diet enrichment, respectively. For this reason, the time effect (T) on yolk composition was represented by 3 time phases: initial (d0), pre-equilibrium (d2-d14), and equilibrium (d21-d56). As expected, the FA composition varied depending on T as reported in Tables 3 and 4, and the diet × time (D×T) interaction was significant for all FAs. Hens fed n-3 PUFA-supplemented diets
Dietary enrichment of n-3 PUFA for laying hens
Fig. 1. The α-Linolenic acid trend in egg yolks throughout the dietary supplementation period (d0-d56, days of egg collection).
418
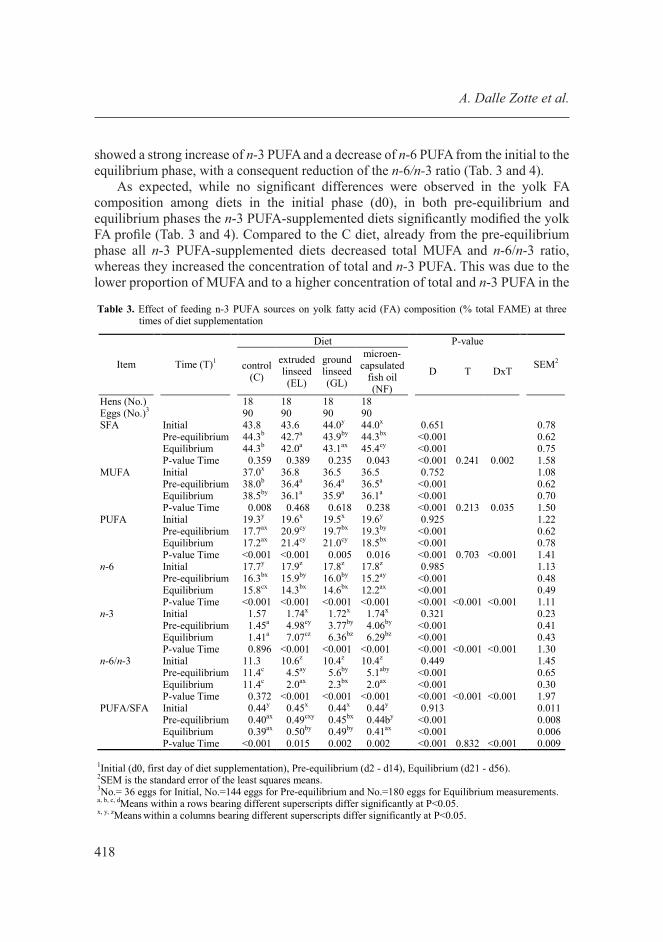
showed a strong increase of n-3 PUFA and a decrease of n-6 PUFA from the initial to the equilibrium phase, with a consequent reduction of the n-6/n-3 ratio (Tab. 3 and 4).
As expected, while no significant differences were observed in the yolk FA composition among diets in the initial phase (d0), in both pre-equilibrium and equilibrium phases the n-3 PUFA-supplemented diets significantly modified the yolk FA profile (Tab. 3 and 4). Compared to the C diet, already from the pre-equilibrium phase all n-3 PUFA-supplemented diets decreased total MUFA and n-6/n-3 ratio, whereas they increased the concentration of total and n-3 PUFA. This was due to the lower proportion of MUFA and to a higher concentration of total and n-3 PUFA in the
A. Dalle Zotte et al.
Table 3. Effect of feeding n-3 PUFA sources on yolk fatty acid (FA) composition (% total FAME) at three times of diet supplementation
Diet P-value
Item
Time (T)1
control (C)
extruded linseed (EL)
ground linseed (GL)
microen-capsulated
fish oil (NF)
D T DxT
SEM2
Hens (No.) 18 18 18 18 Eggs (No.)3 90 90 90 90 SFA Initial 43.8 43.6 44.0y 44.0x 0.651 0.78 Pre-equilibrium 44.3b 42.7a 43.9by 44.3bx <0.001 0.62 Equilibrium 44.3b 42.0a 43.1ax 45.4cy <0.001 0.75 P-value Time 0.359 0.389 0.235 0.043 <0.001 0.241 0.002 1.58 MUFA Initial 37.0x 36.8 36.5 36.5 0.752 1.08 Pre-equilibrium 38.0b 36.4a 36.4a 36.5a <0.001 0.62 Equilibrium 38.5by 36.1a 35.9a 36.1a <0.001 0.70 P-value Time 0.008 0.468 0.618 0.238 <0.001 0.213 0.035 1.50 PUFA Initial 19.3y 19.6x 19.5x 19.6y 0.925 1.22 Pre-equilibrium 17.7ax 20.9cy 19.7bx 19.3by <0.001 0.62 Equilibrium 17.2ax 21.4cy 21.0cy 18.5bx <0.001 0.78 P-value Time <0.001 <0.001 0.005 0.016 <0.001 0.703 <0.001 1.41 n-6 Initial 17.7y 17.9z 17.8z 17.8z 0.985 1.13 Pre-equilibrium 16.3bx 15.9by 16.0by 15.2ay <0.001 0.48 Equilibrium 15.8cx 14.3bx 14.6bx 12.2ax <0.001 0.49 P-value Time <0.001 <0.001 <0.001 <0.001 <0.001 <0.001 <0.001 1.11 n-3 Initial 1.57 1.74x 1.72x 1.74x 0.321 0.23 Pre-equilibrium 1.45a 4.98cy 3.77by 4.06by <0.001 0.41 Equilibrium 1.41a 7.07cz 6.36bz 6.29bz <0.001 0.43 P-value Time 0.896 <0.001 <0.001 <0.001 <0.001 <0.001 <0.001 1.30 n-6/n-3 Initial 11.3 10.6z 10.4z 10.4z 0.449 1.45 Pre-equilibrium 11.4c 4.5ay 5.6by 5.1aby <0.001 0.65 Equilibrium 11.4c 2.0ax 2.3bx 2.0ax <0.001 0.30 P-value Time 0.372 <0.001 <0.001 <0.001 <0.001 <0.001 <0.001 1.97 PUFA/SFA Initial 0.44y 0.45x 0.44x 0.44y 0.913 0.011 Pre-equilibrium 0.40ax 0.49cxy 0.45bx 0.44by <0.001 0.008 Equilibrium 0.39ax 0.50by 0.49by 0.41ax <0.001 0.006 P-value Time <0.001 0.015 0.002 0.002 <0.001 0.832 <0.001 0.009
1Initial (d0, first day of diet supplementation), Pre-equilibrium (d2 - d14), Equilibrium (d21 - d56). 2SEM is the standard error of the least squares means. 3No.= 36 eggs for Initial, No.=144 eggs for Pre-equilibrium and No.=180 eggs for Equilibrium measurements. a, b, c, dMeans within a rows bearing different superscripts differ significantly at P<0.05. x, y, zMeans within a columns bearing different superscripts differ significantly at P<0.05.

419
n-3 PUFA-supplemented diets, with the latter being reported to exert an inhibitory effect on the Δ9-desaturase necessary for the synthesis of MUFA [Garg et al. 1988]. In the pre-equilibrium phase n-6 FA contents were significantly lower only in NF yolks, and at equilibrium even EL and GL diets lowered the yolk n-6 PUFA. In the pre-equilibrium phase, yolk SFA proportions were lowered only by EL, whereas at equilibrium the SFA in yolks were decreased also by GL, while they were increased by NF; the SFA proportions found in yolks were consistent with those of the diets (Tab. 1). The ratio between PUFA and SFA in the yolk is consistent with that in the diets, showing the highest values in EL and GL, particularly at equilibrium.
EPA (C20:5 n-3) and DHA (C22:6 n-3) showed the greatest concentration in yolks of the NF group, followed by linseed-based diets and then by the C diet (Tab. 4). In contrast, ALA (C18:3 n-3) showed the highest concentration in EL yolk, followed by GL, NF, and C. The C diet maintained the highest concentration of arachidonic acid (C20:4 n-6), followed by the GL, EL and NF diets (Tab. 4). The linoleic acid (C18:2 n-6) proportion in pre-equilibrium was lowest in the C diet, whereas after the
Dietary enrichment of n-3 PUFA for laying hens
Table 4. The effect of feeding n-3 PUFA sources on yolk polyunsaturated fatty acid (PUFA; % total FAME) profile at three times of diet supplementation
Diet (D) P-value
Item
Time (T)1
control (C)
extruded linseed (EL)
ground linseed (GL)
microen-capsulated
fish oil (NF)
D T DxT
SEM2
Hens (No.) 18 18 18 18 Eggs (No.)3 90 90 90 90 C18:2 n-6 Initial 12.7y 12.8 12.7 12.6y 0.963 0.87 Pre-equilibrium 12.0ax 12.4bc 12.5c 12.1by 0.021 0.41 Equilibrium 11.9bx 12.3c 12.5c 10.7ax <0.001 0.42 P-value Time 0.006 0.101 0.640 <0.001 0.002 <0.001 <0.001 0.73 C18:3 n-3 Initial 0.15 0.16x 0.16x 0.16x 0.911 0.02 Pre-equilibrium 0.18a 2.31dy 1.60cy 0.49b <0.001 0.18 Equilibrium 0.18a 3.71dz 3.07cz 0.75by <0.001 0.25 P-value Time 0.935 <0.001 <0.001 0.028 <0.001 <0.001 <0.001 0.64 C20:4 n-6 Initial 5.01z 5.10z 5.07z 5.23z 0.809 0.49 Pre-equilibrium 4.26cy 3.44by 3.48by 3.14ay <0.001 0.25 Equilibrium 3.92cx 2.00bx 2.14bx 1.52ax <0.001 0.16 P-value Time <0.001 <0.001 <0.001 <0.001 <0.001 <0.001 <0.001 0.64 C20:5 n-3 Initial - - - - - - - - Pre-equilibrium <0.000a 0.093cx 0.030bx 0.150dx <0.001 0.02 Equilibrium <0.000a 0.193cy 0.153by 0.341dy <0.001 0.03 P-value Time - <0.001 <0.001 <0.001 <0.001 <0.001 <0.001 0.07 C22:6 n-3 Initial 1.42 1.58x 1.57x 1.58x 0.343 0.23 Pre-equilibrium 1.26a 2.58cy 2.14bx 3.42dy <0.001 0.36 Equilibrium 1.23a 3.17bz 3.13by 5.20cz <0.001 0.31 P-value Time 0.885 <0.001 <0.001 <0.001 <0.001 <0.001 <0.001 0.82
1Initial (d0, first day of diet supplementation), Pre-equilibrium (d2 - d14), Equilibrium (d21 - d56). 2SEM is the standard error of the least squares means. 3No.= 36 eggs for Initial, No.=144 eggs for Pre-equilibrium and No.=180 eggs for Equilibrium measurements. a, b, c, dMeans within a rows bearing different superscripts differ significantly at P<0.05. x, y, zMeans within a columns bearing different superscripts differ significantly at P<0.05.

420
achievement of equilibrium it showed its minimum concentration in the NF group. As reported by other authors [Ebeid 2011, Jia et al. 2008], hens consuming both linseed and fish oil increased total n-3 FA contents in egg yolk and decreased the n-6/n-3 ratio to below 4:1, the recommended value for human diet [Kralik et al. 2008].
Eggs from linseed-fed hens were not enriched only with ALA, but also with EPA and DHA, because ALA is their precursor through the desaturation-chain elongation pathway in the liver [Nain et al. 2012]. This conversion requires the same desaturase and elongase enzymes necessary for the synthesis of arachidonic acid from linoleic acid, and due to this competition the concentration of arachidonic acid in yolks produced by hens fed the n-3 PUFA-supplemented diets is lower than those from hens fed the C diet [Jia et al. 2008, Nain et al. 2012]. After the achievement of equilibrium, compared to GL diet, the EL diet was responsible for higher concentrations of n-3 PUFA, ALA, and EPA in egg yolks, with a subsequent reduction of their n-6/n-3 ratio. The ability of the extruded form of linseed (EL diet) to anticipate and improve the deposition of all the n-3 FAs in yolks (Tab. 3 and 4) needs to be stressed here. This likely means that the extruded form of linseed led to a higher and faster absorption of PUFA when compared to the ground form, especially with regard to n-3 PUFA. This could be explained by the fact that the extruded form was deprived of anti-nutritional factors and became more readily digestible, as reported by Thacker et al. [2005].
Colour of egg yolk
Yolk colour is a relevant quality trait that affects egg consumer acceptance [Ebeid 2011, Krawczyk 2009, Laca et al. 2009]. In the present study yolk colour was modified by the dietary n-3 PUFA sources and by the diet × phase of feeding interaction. On the whole, dietary n-3 PUFA enrichment did not enhance yolk colour when compared to the C diet. Although it is well established that the absorption and further deposition of oxicarotenoids responsible for egg yolk pigmentation is expected to increase with the concurrent increase in dietary lipid concentration [Ebeid 2011, Grobas et al. 2001], Cachaldora et al. [2006] found that the composition of the dietary FA source affects yolk lipid content, and consequently also yolk colour.
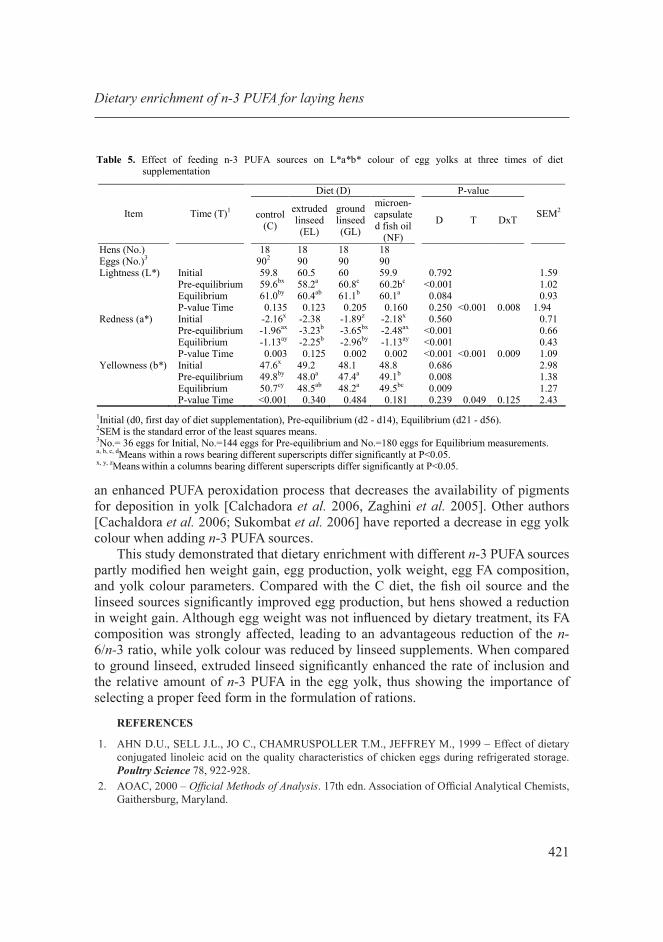
The variation of yolk colour throughout the experimental diet supplementation (T) was not significant in terms of lightness (L*) and yellowness (b*) values, whereas a non-linear trend was observed for redness (a*) that did not seem to indicate a biological relationship with T (Tab. 5).
As far as the effects of the experimental diets are concerned, the L* value was significantly affected in the pre-equilibrium phase and showed a tendency to gain in significance after equilibrium (P<0.1); in the pre-equilibrium phase L* was found to be lowest in the EL and highest in the GL group. Egg yolks from the linseed-supplemented diets exhibited on average lower a* and b* values when compared to those of C and NF diets both in the pre-equilibrium and equilibrium phases. This could in part be due to linseed’s lower oxicarotenoid pigment content in comparison to that of other natural sources of n-3 PUFA [Karunajeewa et al. 1984] and in part to
A. Dalle Zotte et al.
421
an enhanced PUFA peroxidation process that decreases the availability of pigments for deposition in yolk [Calchadora et al. 2006, Zaghini et al. 2005]. Other authors [Cachaldora et al. 2006; Sukombat et al. 2006] have reported a decrease in egg yolk colour when adding n-3 PUFA sources.
This study demonstrated that dietary enrichment with different n-3 PUFA sources partly modified hen weight gain, egg production, yolk weight, egg FA composition, and yolk colour parameters. Compared with the C diet, the fish oil source and the linseed sources significantly improved egg production, but hens showed a reduction in weight gain. Although egg weight was not influenced by dietary treatment, its FA composition was strongly affected, leading to an advantageous reduction of the n-6/n-3 ratio, while yolk colour was reduced by linseed supplements. When compared to ground linseed, extruded linseed significantly enhanced the rate of inclusion and the relative amount of n-3 PUFA in the egg yolk, thus showing the importance of selecting a proper feed form in the formulation of rations.
rEFErENCEs
AHN D.U., SELL J.L., JO C., CHAMRUSPOLLER T.M., JEFFREY M., 1999 − Effect of dietary conjugated linoleic acid on the quality characteristics of chicken eggs during refrigerated storage. Poultry Science 78, 922-928.AOAC, 2000 – Official Methods of Analysis. 17th edn. Association of Official Analytical Chemists, Gaithersburg, Maryland.
1.
2.
Dietary enrichment of n-3 PUFA for laying hens
Table 5. Effect of feeding n-3 PUFA sources on L*a*b* colour of egg yolks at three times of diet supplementation
Diet (D) P-value
Item
Time (T)1
control (C)
extruded linseed (EL)
ground linseed (GL)
microen-capsulated fish oil
(NF)
D T DxT
SEM2
Hens (No.) 18 18 18 18 Eggs (No.)3 902 90 90 90 Lightness (L*) Initial 59.8 60.5 60 59.9 0.792 1.59 Pre-equilibrium 59.6bx 58.2a 60.8c 60.2bc <0.001 1.02 Equilibrium 61.0by 60.4ab 61.1b 60.1a 0.084 0.93 P-value Time 0.135 0.123 0.205 0.160 0.250 <0.001 0.008 1.94 Redness (a*) Initial -2.16x -2.38 -1.89z -2.18x 0.560 0.71 Pre-equilibrium -1.96ax -3.23b -3.65bx -2.48ax <0.001 0.66 Equilibrium -1.13ay -2.25b -2.96by -1.13ay <0.001 0.43 P-value Time 0.003 0.125 0.002 0.002 <0.001 <0.001 0.009 1.09 Yellowness (b*) Initial 47.6x 49.2 48.1 48.8 0.686 2.98 Pre-equilibrium 49.8by 48.0a 47.4a 49.1b 0.008 1.38 Equilibrium 50.7cy 48.5ab 48.2a 49.5bc 0.009 1.27 P-value Time <0.001 0.340 0.484 0.181 0.239 0.049 0.125 2.43
1Initial (d0, first day of diet supplementation), Pre-equilibrium (d2 - d14), Equilibrium (d21 - d56). 2SEM is the standard error of the least squares means. 3No.= 36 eggs for Initial, No.=144 eggs for Pre-equilibrium and No.=180 eggs for Equilibrium measurements. a, b, c, dMeans within a rows bearing different superscripts differ significantly at P<0.05. x, y, zMeans within a columns bearing different superscripts differ significantly at P<0.05.
422
AZIZA A.E., PANDA A.K, QUEZADA N., CHERIAN G., 2013 − Nutrient digestibility, egg quality, and fatty acid composition of brown laying hens fed camelina or flaxseed meal. The Journal of Applied Poultry Research 22, 832-841.BAUCELLS M.D., CRESPO N., BARROETA C., LŇPEZ-FERRER S., GRASHORN M.A., 2000 − Incorporation of different polyunsaturated fatty acids into eggs, Poultry Science 79, 51-59.BEAN L.D., LEESON S., 2003 − Long-term effects of feeding flaxseed on performance and egg fatty acid composition of brown and white hens. Poultry Science 82, 388-394.BERGAMO P., FEDELE E., BALESTRIERI M., ABRESCIA P., FERRARA L., 1998 – Measurement of malondialdehyde levels in food by high-performance liquid chromatography with fluorometric detection. Journal of Agriculture and Food Chemistry 46, 2171-2176.BOTSOGLOU E., GOVARIS A., FLETOURIS D., BOTSOGLOU N., 2012 − Effect of supplementation of the laying hen diet with olive leaves (Olea europea L.) on lipid oxidation and fatty acid profile of α-linolenic acid enriched eggs during storage. British Poultry Science 53, 508-519.BOTSOGLOU E., GOVARIS A., FLETOURIS D., ILIADIS S., 2013 − Olive leaves (Olea europea L.) and α-tocopheryl acetate as feed antioxidants for improving the oxidative stability of α-linolenic acid-enriched eggs. Journal of Animal Physiology and Animal Nutrition 97, 740-753. CACHALDORA P., GARCÍA-REBOLLAR P., ALVAREZ C., DE BLAS JC, MÉNDEZ J., 2006 − Effect of type and level of fish oil supplementation on yolk fat composition and n-3 fatty acids retention efficiency in laying hens. British Poultry Science 47, 43-49.CASIRAGHI E., LUCISANO M., POMPEI C., DELLEA C., 1994 − Cholesterol determination in butter by high performance chromatography. Milchwissenschaft 49, 194–196.CIE, 1976 − Official recommendations on uniform colour spaces colour differences equations and metric colour terms. Suppl. 2 to CIE Publication N. 15, Colourimetry. Commission Internationale de l’Éclairage Publ., Paris, France.CORTINAS L., GALOBART J., BARROETA A.C., BAUCELLS M.D., GRASHORN M.A., 2003 − Change in a-tocopherol contents, lipid oxidation and fatty acid profile in eggs enriched with linolenic acid or very long-chain v3 polyunsaturated fatty acids after different processing methods. Journal of the Science of Food and Agriculture 83, 820–829.EBEID T.A., 2011 − The impact of incorporation of n-3 fatty acids into eggs on ovarian follicular development, immune response, antioxidative status and tibial bone characteristics in aged laying hens. Animal 5, 1554-1562.EBEID T., EID Y., SALEH A., EL-HAMID H. ABD., 2008 − Ovarian follicular development, lipid peroxidation, antioxidative status and immune response in laying hens fed fish oil-supplemented diets to produce n-3-enriched eggs. Animal 2, 84–91. FOLCH J., LEES M., STANLEY G.H.S., 1957 − A simple method for the isolation and purification of total lipids from animal tissues, The Journal of Biological Chemistry 226, 497-509.GARG, M.L., SEBOKOVA E., WIERZBICKI A., THOMSON A.B.R., CLANDININ M.T., 1988 − Differential effects of dietary linoleic and α-linolenic acid on lipid metabolism in rat tissues. Lipids 23, 847–852.GROBAS S., MÉNDEZ J., LŔZARO R., DE BLAS C., MATEOS G.G., 2001 − Influence of source and percentage of fat added to diet on performance and fatty acid composition of egg yolks of two strains of laying hens, Poultry Science 80, 1171-1179.JIA, W., SLOMINSKI B.A., GUENTER W., HUMPHREYS A., JONES O., 2008 − The effect of enzyme supplementation on egg production parameters and omega-3 fatty acid deposition in laying hens fed flaxseed and canola seed. Poultry Science 87, 2005-2014.KARUNAJEEWA H., HUGHES R.J., MCDONALD M.W., SHENSTONE F.S., 1984 − A review of factors influencing pigmentation of egg yolks, World’s Poultry Science Journal 40, 52-65.
3.
4.
5.
6.
7.
8.
9.
10.
11.
12.
13.
14.
15.
16.
17.
18.
19.
A. Dalle Zotte et al.

423
KIM J., MAGNUSON A., LEI X., 2014 − Effects of three types of dietary microalgal inclusions on n-3 and n-6 fatty acid profiles in egg yolks of laying hens. In: Proc. American Dairy Science Association Joint Annual Meeting, Kansas City, MO (USA). 468.KIRUBAKARAN A., NARAHARI D., EZHIL VALAVAN T., SATHISH KUMAR A., 2011 − Effects of flaxseed, sardines, pearl millet, and holy basil leaves on production traits of layers and fatty acid composition of egg yolks. Poultry Science 90, 147-156.KRALIK G., SKRTIC Z., SUCHY P., STRAKOVA E., GAJCEVIC Z., 2008 − Feeding fish oil and linseed oil to laying hens to increase the n-3 PUFA of egg yolk. Acta Veterinaria Brno 77, 561-568.KRAWCZYK J., 2009 − Quality of eggs from Polish native Greenleg Partridge chicken-hens maintained in organic vs. backyard production systems. Animal Science Papers and Reports 27, 227-235.LACA A., PAREDES B., DÍAZ M., 2009 − Quality characteristics of n-3 polyunsaturated fatty acid-enriched eggs. Journal of Animal and Feed Sciences, 18, 101-112. LEESON S., SUMMERS J.D., CASTON L.J., 2000 − Response of layers to dietary flaxseed according to body weight classification at maturity. The Journal of Applied Poultry Research 9, 297-302.LEMAHIEU C., BRUNEEL C., TERMOTE-VERHALLE R., MUYLAERT K., BUYSE J., FOUBERT I., 2013 − Impact of feed supplementation with different omega-3 rich microalgae species on enrichment of eggs of laying hens. Food Chemistry 141, 4051-4059. MEYNIER A., LEBORGNE C., VIAU M., SCHUCK P., GUICHARDANT M., RANNOU C., ANTON M., 2014 − N-3 fatty acid enriched eggs and production of egg yolk powders: an increased risk of lipid oxidation? Food Chemistry 153, 94-100.NAIN S., RENEMA R.A., KORVER D.R., ZUIDHOF M.J., 2012 − Characterization of the n-3 polyunsaturated fatty acid enrichment in laying hens fed an extruded flax enrichment source. Poultry Science 91, 1720-1732.NOVAK C., SCHEIDELER S.E., 2001 − Long-term effects of feeding flaxseed-based diets. 1. Egg production parameters, components, and eggshell quality in two strains of laying hens. Poultry Science 80, 1480-1489.POŁAWSKA E., HORBAŃCZUK J.O., PIERZCHAŁA M., STRZAŁKOWSKA N., JÓŹWIK A., WÓJCIK A., POMIANOWSKI J., GUTKOWSKA K., WIERZBICKA A., HOFFMAN L.C., 2013. 2013 − Effect of dietary linseed and rapeseed supplementation on fatty acid profiles in the ostrich. Part 1. Muscles. Animal Science Papers and Reports 31, 239-248.SAS Insitute Inc., 2008 − User’s Guide: Version 6. SAS Institute Inc., Cary, North Carolina. SCHEIDELER S.E., FRONING G.W., 1996 − The combined influence of dietary flaxseed variety, level, form, and storage conditions on egg production and composition among vitamin E-supplemented hens. Poultry Science 75, 1221-1226. SIBBALD I.R., 1984 − L’alimentation des animaux monogastriques: porc, lapin, volailles: INRA Eds., Paris, France.SIMOPOULOS A.P., 2000 − Human Requirement for n-3 Polyunsaturated Fatty Acids. Poultry Science 79, 961–970.SUKSOMBAT W., SAMITAYOTIN, S., LOUNGLAWAN P., 2006 − Effects of conjugated linoleic acid supplementation in layer diet on fatty acid compositions of egg yolk and layer performances. Poultry Science 85, 1603-1609.SURAI P.F., SPARKS N.H.C., 2001 − Designer eggs: from improvement of egg composition to functional food. Trends in food science & Technology 12, 7-16.THACKER, P.A., WILLING B.P., RACZ V.J., 2005 − Performance of broiler chickens fed wheat-based diets supplemented with combinations of non-extruded or extruded canola, flax and peas. Journal of Animal and Veterinary Advances 4, 902-907.
20.
21.
22.
23.
24.
25.
26.
27.
28.
29.
30.
31.32.
33.
34.
35.
36.
37.
Dietary enrichment of n-3 PUFA for laying hens
424
VAN ELSWYK M.E., 1997 − Comparison of n-3 fatty acid sources in laying hen rations for improvement of whole egg nutritional quality: a review. British Journal of Nutrition 78, Suppl 1, S61-69.VAN SOEST P.J., ROBERTSON J.B., LEWIS B.A., 1991 − Methods for dietary fiber, neutral detergent fiber, and non-starch polysaccharides. Journal of Dairy Science 74, 3583-3597.WHITEHEAD C.C., BOWMAN A.S., GRIFFIN H.D., 1993 − Regulation of plasma oestrogens by dietary fats in the laying hen: relationship with egg weight. British Poultry Science 34, 999-1010. YI H., HWANG K.T., REGENSTEIN J.M., SHIN S.W., 2014 − Fatty acid composition and sensory characteristics of eggs obtained from hens fed flaxseed oil, dried whitebait and/or fructo-oligosaccharide. Asian-Australasian Joural of Animal Sciences 27, 1026-1034. ZAGHINI A., MARTELLI G., RONCADA P., SIMIOLI M., RIZZI L 2005 − Mannanoligosaccharides and Aflatoxin B1 in Feed for Laying Hens: Effects on Egg Quality, Aflatoxins B1 and M1 Residues in Eggs, and Aflatoxin B1 Levels in Liver. Poultry Science 84, 825-832.
38.
39.
40.
41.
42.
A. Dalle Zotte et al.


