Diet and trophic role of western rock lobsters ( Panulirus ... · abundance and commercial...
209
Diet and trophic role of western rock lobsters (Panulirus cygnus George) in temperate Western Australian deep-coastal ecosystems (35-60m). Kris Ian Waddington Bachelor of Science (Honours) Supervisors Prof. Diana Walker Dr. Lynda Bellchambers Dr Mathew Vanderklift Dr. Jessica Meeuwig This thesis is presented for the degree of the Doctor of Philosophy at The University of Western Australia School of Plant Biology 2008
Transcript of Diet and trophic role of western rock lobsters ( Panulirus ... · abundance and commercial...

Diet and trophic role of western rock lobsters (Panulirus cygnus
George) in temperate Western Australian deep-coastal
ecosystems (35-60m).
Kris Ian Waddington
Bachelor of Science (Honours)
Supervisors
Prof. Diana Walker
Dr. Lynda Bellchambers
Dr Mathew Vanderklift
Dr. Jessica Meeuwig
This thesis is presented for the degree of the Doctor of Philosophy at The University of
Western Australia
School of Plant Biology
2008

ii
Abstract
Removal of consumers through fishing has been shown to influence ecosystem structure
and function by changing the biomass and composition of organisms occupying lower
trophic levels. The western rock lobster (Panurilus cygnus), an abundant consumer along
the temperate west coast of Australia, forms the basis of Australia’s largest single species
fishery, with catches frequently exceeding 11000 tonnes annually. Despite their high
abundance and commercial importance, the diet and trophic role of adult lobster
populations in deep-coastal-ecosystems (35-60 m) remains unknown. An understanding of
the diet and trophic role of lobsters in these ecosystems is a key component of the
assessment of ecosystem effects of the western rock lobster fishery.
This study uses gut content and stable isotope analyses to determine the diet and trophic
role of lobsters in deep-coastal ecosystems. Dietary analysis indicated adult lobsters in
deep-coastal ecosystems were primarily carnivorous with diet reflecting food available on
the benthos. Gut content analyses indicate crabs (62 %) and amphipods/isopods (~10 %)
are the most important lobster dietary sources. Stable isotope analysis indicates natural diet
of lobsters in deep coastal ecosystems is dominated by amphipods/isopods (contributing up
to ~50 %) and crabs (to ~75 %), with bivalves/gastropods, red algae and sponges of lesser
importance (<10 % of diet each). Diet of lobsters in deep-coastal ecosystems differed from
that reported for lobsters inhabiting shallow water ecosystems in this region, reflecting
differences in food availability and food choice between these ecosystems. Bait from the
fishery was also determined (by stable isotope analyses) to be a significant dietary
component of lobsters in deep-coastal ecosystems, contributing between 10 and 80 % of
lobster food requirements at some study locations.
The robustness of dietary techniques depends upon the assumptions that underlie those
techniques. Values of consumer-diet δ15N and δ13C discrimination specific to western rock
lobster tail and leg tissue were determined. Consumer-diet discrimination was found to
depend upon both muscle tissue type and diet quality. Further, consumer-diet δ15N and δ13C
discrimination of lobster tail tissue differed to consumer-diet discrimination reported in the
literature. Sensitivity analyses indicated such variation in consumer-diet discrimination can

iii
substantially affect estimation of consumer diet composition from stable isotopes.
Evacuation rates of different prey from the foregut of western rock lobsters were also
determined. As foregut composition is used as a proxy for dietary composition, differences
in evacuation rates can affect estimated lobster dietary composition. Evacuation rates were
variable between prey and occurred in the order red algae>crabs>pilchards. Prey with hard
components were evacuated from the foregut of lobsters slower than prey lacking hard
components. Observed variation in evacuation rates will overestimate the importance of
those prey that are evacuated slowly from the foreguts of western rock lobsters. Evacuation
rates should be taken into account as a factor that may skew estimated dietary composition
when using gut content analysis to estimate dietary composition of western rock lobsters.
A mass balance biomass-production model was constructed to investigate the contribution
of bait on an ecosystem-wide scale and evaluate the outcomes from the stable isotope
analyses which suggested that bait contributed between 10 and 80 % of lobster diet. This
model indicated that bait may contribute approximately 13 % of lobster food requirements
over the whole ecosystem during a single year. Bait contribution varies spatially and
temporally depending on the fishing fleet distribution, with potential bait contribution as
high as 35 % during some months of the fishing season. As samples for stable isotope
analysis were collected from high relief areas during the peak of the fishing season, the
contribution of bait to lobster diet determined by stable isotope analyses was likely
overestimated. Given observed effects of organic matter addition in trawl fisheries, and also
associated with aquaculture, bait addition is likely to have implications for processes
occurring within deep-coastal ecosystems in this region, particularly given its oligotrophic
status, most likely by increasing the food available to scavenging species.
Removal of lobsters from deep-coastal ecosystems may affect the composition and
abundance of lobster prey communities through a reduction in predation pressure. Such
effects have been demonstrated for other spiny lobster species. These effects are typically
most observable amongst common prey taxa which in other studies have been commonly
herbivores. In deep-coastal ecosystems, crabs and amphipods/isopods are the most common
prey taxa and most likely to be effected. The ecosystem-impacts of top-down control of
non-herbivorous prey species is unknown and constrains the inferences possible from this
study. However, the establishment of ‘no-take’ areas in deep-coastal ecosystems would

iv
allow the ecosystem effects of lobster removal to be further assessed in these deep-coastal
ecosystems. While data from the current study did not allow the ecosystem effects of
lobster removal to be properly assessed, this study provided information regarding the
ecology of western rock lobsters in previously unstudied ecosystems.
v
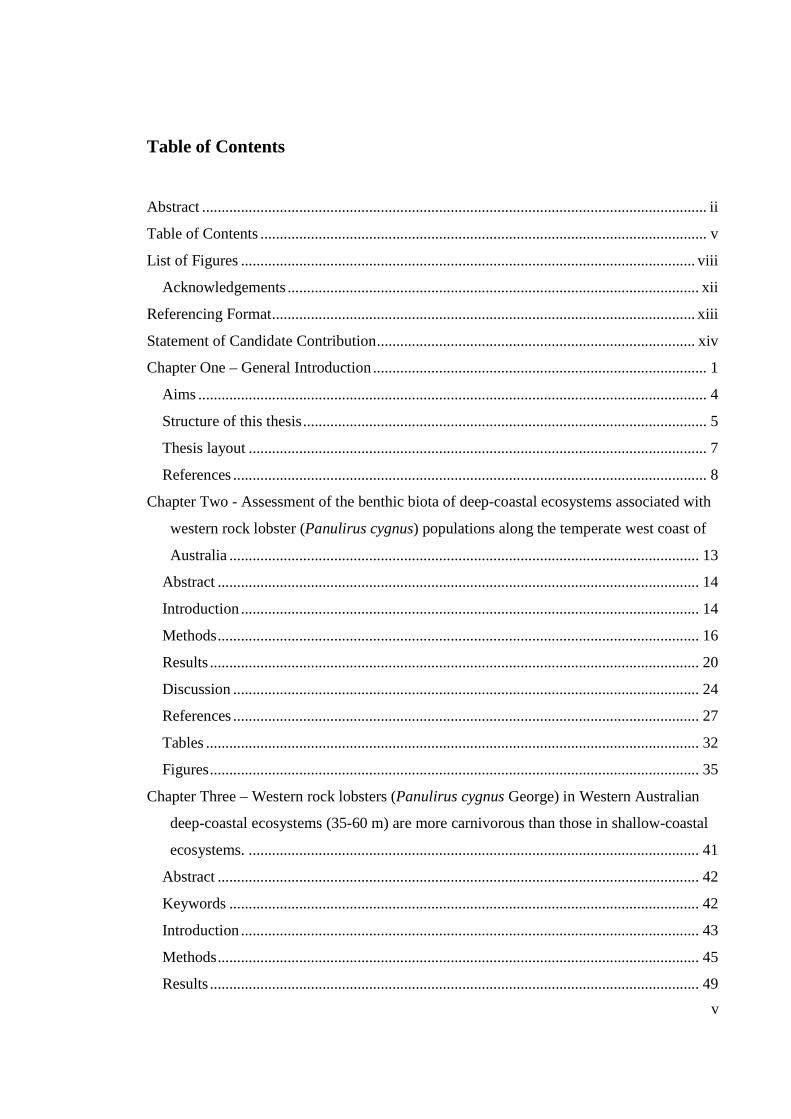
Table of Contents
Abstract .................................................................................................................................. ii
Table of Contents ................................................................................................................... v
List of Figures ..................................................................................................................... viii
Acknowledgements .......................................................................................................... xii
Referencing Format............................................................................................................. xiii
Statement of Candidate Contribution.................................................................................. xiv
Chapter One – General Introduction...................................................................................... 1
Aims ................................................................................................................................... 4
Structure of this thesis........................................................................................................ 5
Thesis layout ...................................................................................................................... 7
References .......................................................................................................................... 8
Chapter Two - Assessment of the benthic biota of deep-coastal ecosystems associated with
western rock lobster (Panulirus cygnus) populations along the temperate west coast of
Australia ......................................................................................................................... 13
Abstract ............................................................................................................................ 14
Introduction ...................................................................................................................... 14
Methods............................................................................................................................ 16
Results .............................................................................................................................. 20
Discussion ........................................................................................................................ 24
References ........................................................................................................................ 27
Tables ............................................................................................................................... 32
Figures.............................................................................................................................. 35
Chapter Three – Western rock lobsters (Panulirus cygnus George) in Western Australian
deep-coastal ecosystems (35-60 m) are more carnivorous than those in shallow-coastal
ecosystems. .................................................................................................................... 41
Abstract ............................................................................................................................ 42
Keywords ......................................................................................................................... 42
Introduction ...................................................................................................................... 43
Methods............................................................................................................................ 45
Results .............................................................................................................................. 49

vi
Discussion .........................................................................................................................51
Tables ................................................................................................................................60
Figures...............................................................................................................................61
Chapter Four - Diet quality and tissue type influence consumer-diet discrimination in
captive reared rock lobsters (Panulirus cygnus George). ...............................................67
Abstract .............................................................................................................................68
Introduction.......................................................................................................................69
Materials and Methods......................................................................................................71
Results...............................................................................................................................74
Discussion .........................................................................................................................76
References.........................................................................................................................80
Tables ................................................................................................................................84
Figures...............................................................................................................................87
Chapter Five - The effect of variation in consumer-diet discrimination on calculation of
consumer dietary composition. .......................................................................................91
Abstract .............................................................................................................................92
Introduction.......................................................................................................................92
Methods.............................................................................................................................95
Results...............................................................................................................................96
Discussion .........................................................................................................................98
Figures.............................................................................................................................101
References.......................................................................................................................107
Chapter Six - Contribution of bait to lobster production in an oligotrophic marine
ecosystem......................................................................................................................111
Abstract ...........................................................................................................................112
Introduction.....................................................................................................................113
Methods...........................................................................................................................115
Results.............................................................................................................................117
Discussion .......................................................................................................................121
References.......................................................................................................................124
Table................................................................................................................................129
Figures.............................................................................................................................131
vii
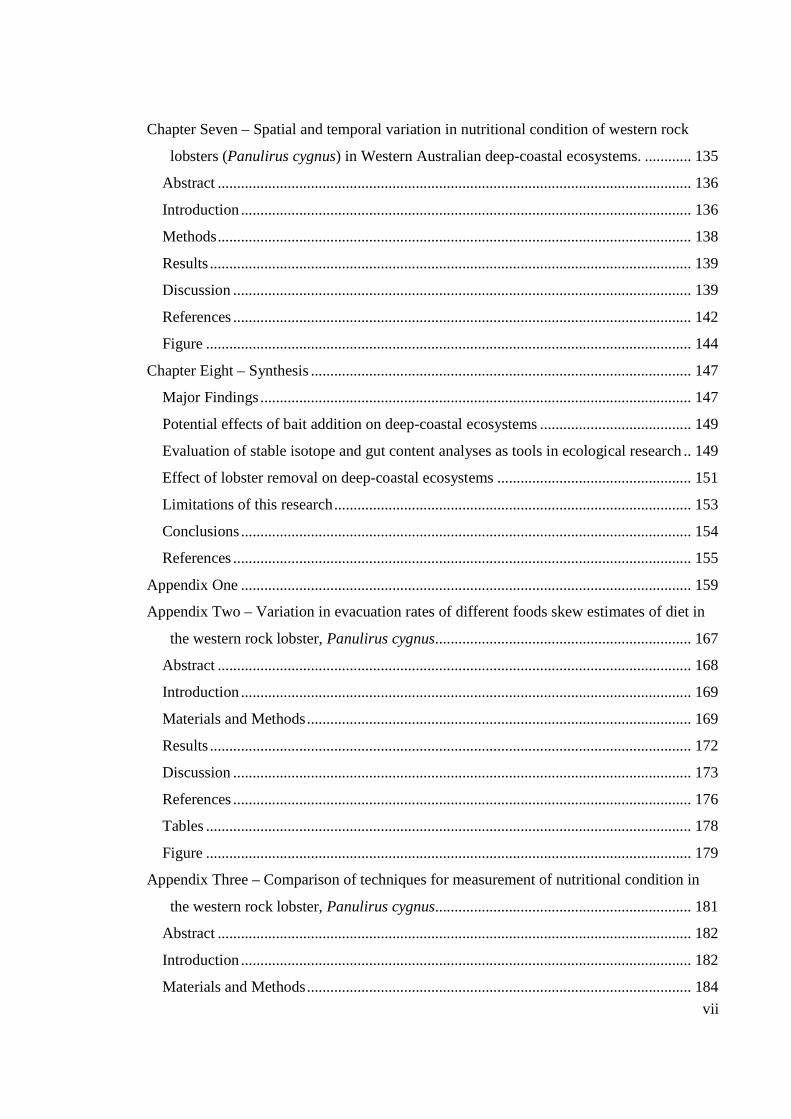
Chapter Seven – Spatial and temporal variation in nutritional condition of western rock
lobsters (Panulirus cygnus) in Western Australian deep-coastal ecosystems. ............ 135
Abstract .......................................................................................................................... 136
Introduction .................................................................................................................... 136
Methods.......................................................................................................................... 138
Results ............................................................................................................................ 139
Discussion ...................................................................................................................... 139
References ...................................................................................................................... 142
Figure ............................................................................................................................. 144
Chapter Eight – Synthesis .................................................................................................. 147
Major Findings............................................................................................................... 147
Potential effects of bait addition on deep-coastal ecosystems ....................................... 149
Evaluation of stable isotope and gut content analyses as tools in ecological research .. 149
Effect of lobster removal on deep-coastal ecosystems ..................................................151
Limitations of this research............................................................................................ 153
Conclusions.................................................................................................................... 154
References ...................................................................................................................... 155
Appendix One .................................................................................................................... 159
Appendix Two – Variation in evacuation rates of different foods skew estimates of diet in
the western rock lobster, Panulirus cygnus.................................................................. 167
Abstract .......................................................................................................................... 168
Introduction .................................................................................................................... 169
Materials and Methods................................................................................................... 169
Results ............................................................................................................................ 172
Discussion ...................................................................................................................... 173
References ...................................................................................................................... 176
Tables ............................................................................................................................. 178
Figure ............................................................................................................................. 179
Appendix Three – Comparison of techniques for measurement of nutritional condition in
the western rock lobster, Panulirus cygnus.................................................................. 181
Abstract .......................................................................................................................... 182
Introduction .................................................................................................................... 182
Materials and Methods................................................................................................... 184

viii
Results.............................................................................................................................187
Discussion .......................................................................................................................188
References.......................................................................................................................191
Tables ..............................................................................................................................192
Figure ..............................................................................................................................195
List of Figures
Fig. 2.1: Showing dive sites and video transects at each of the three study locations..........35
Fig. 2.2: (a) MDS plot (square root transformed data) and (b) constrained ordination
(untransformed data) of sponge and algal assemblages at the three study locations
determined by towed video. Similarity determined using Bray-Curtis coefficient. .......36
Fig. 2.3: (a) MDS plot (square root transformed data) and (b) constrained ordination
(untransformed data) of sponge and algal assemblages at the three study locations
determined by diver sampling. Similarity determined using Bray-Curtis coefficient. ...37
Fig. 2.4: MDS plot of invertebrate community composition at Lancelin, Jurien Bay and
Dongara. Data were square root transformed and similarity determined using Bray-
Curtis coefficient.............................................................................................................37
Fig. 2.5. Mean biomass (± se) of algae and sponge at the three study locations. .................38
Fig. 2.6: Mean biomass (± se) of macroinvertebrate groups at the three study locations.....38
Fig. 2.7: Relative distribution of points from constrained ordination plots..........................39
Figure 3.1: δ13C and δ15N of western rock lobsters and potential prey in deep coastal
ecosystems off (a) Lancelin, (b) Jurien Bay, and (c) Dongara, Western Australia. Prey
comprising <1% of diet (determined by gut content analysis) are not shown................62
Figure 3.2: Contribution of prey to diet of lobsters collected from (a) Lancelin (b) Jurien
Bay and (c) Dongara. Prey contribution calculated using IsoSource. Outside tick marks
represent range of feasible proportions (1-99%). Midline represents mean of feasible
proportions. RA = Red Algae, A/I = Amphipods/Isopods, Sp. = Sponge, B/G =
Bivalves/Gastropods. ......................................................................................................63
Figure 3.3: Percentage (mean ± se, n=30) of diet categories in lobster foreguts at all
locations. All lobsters were caught by divers or in unbaited pots. Diet categories

ix
comprising <1% of diet are not shown on graph. A/I = Amphipods/Isopods, Sed. =
Sediment, B/G = Bivalves/Gastropods. ......................................................................... 64
Figure 3.4: Ivlev’s index of prey electivity for taxa observed in the guts of lobsters
collected from Jurien Bay (n=19). A/I = Amphipods/Isopods, Cr. = Crabs, RA = Red
Algae, Poly = Polychaetes, B/G = Bivalves/Gastropods. .............................................. 64
Figure 4.1: δ15N discrimination (a) and δ13C discrimination (b) between diet and muscle
tissue for lobster fed four different diets. ....................................................................... 87
Figure 4.2: Change in δ15N (a) and δ13C (b) concentration of leg muscle tissue from lobsters
fed four different diets. t = time since diet switch. ........................................................ 88
Fig. 5.1: Illustration of the technique used for the calculation of consumer diet from three
potential dietary sources using two elements. The consumers’ stable isotope value is
adjusted to account for consumer-diet δ13C and δ15N discrimination. The area enclosed
by dietary sources represents mixing space. ................................................................ 101
Fig. 5.2: Illustration of the technique used for the calculation of consumer diet from five
potential dietary sources using two isotopes. Discrete solutions for the contribution of
diet sources to consumer diet are not possible, instead the range of possible contribution
of each dietary source to consumer diet is defined...................................................... 102
Fig. 5.3: Data used in this study. Adjusted isotope values of the consumer (Panulirus
cygnus) (arising due to variation in δ13C and δ15N discrimination) are bounded by the
grey box. Lobsters (P. cygnus) are consumers in this system while other taxa shown are
potential lobster diet sources........................................................................................ 102
Fig. 5.4: Showing the effect of variation in δ13C and δ15N discrimination on the mean
calculated contribution of lobster diet sources. Variation in both δ13C and δ15N
discrimination affects the proportional contribution of lobster diet sources. y-axis on
small graphs refers to proportional contribution of lobster diet sources (0-1). x-axis
represents diet sources (L-R; Ba. = bait, Cr. = crabs, R.A. = red algae, A/I = amphipods/
isopods, and Sp. = sponge). The graph with the dark border indicates the calculated
contribution of each lobster diet source using the discrimination values of Waddington
and MacArthur (submitted). ‘No result’ refers to cases where the corrected consumer
signature falls outside the boundaries of the mixing space, meaning no solution is
possible......................................................................................................................... 103
Fig. 5.5: Showing the effect of variation in δ13C and δ15N discrimination on the minimum
calculated contribution of lobster diet sources. Variation in both δ13C and δ15N

x
discrimination affects the proportional contribution of lobster diet sources. y-axis on
small graphs refers to proportional contribution of each lobster diet source (0-1). x-axis
represents diet sources (L-R; Ba. = bait, Cr. = crabs, R.A. = red algae, A/I = amphipods/
isopods, and Sp. = sponge). The graph with the dark border indicates the calculated
contribution of each lobster diet source using the discrimination values of Waddington
and MacArthur (submitted). ‘No result’ refers to cases where the corrected consumer
signature falls outside the boundaries of the mixing space, meaning no solution is
possible..........................................................................................................................104
Fig 5.6: Showing the effect of variation in δ13C and δ15N discrimination on the maximum
calculated contribution of lobster diet sources. Variation in both δ13C and δ15N
discrimination affects the proportional contribution of lobster diet sources. y-axis on
small graphs refers to proportional contribution of each lobster diet source (0-1). x-axis
represents diet sources (L-R; Ba. = bait, Cr. = crabs, R.A. = red algae, A/I = amphipods/
isopods, and Sp. = sponge). The graph with the dark border indicates the calculated
contribution of each lobster diet source using the discrimination values of Waddington
and MacArthur (submitted). ‘No result’ refers to cases where the corrected consumer
signature falls outside the boundaries of the mixing space, meaning no solution is
possible..........................................................................................................................105
Figure 6.1. Food required to support observed lobster growth vs. food available (as natural
diet items and bait). Error bars represent standard error...............................................131
Figure 6.2. Temporal patterns in the potential contribution of bait to lobster diet during the
study period...................................................................................................................131
Figure 6.3. Result of 500 error simulations showing distribution of possible contribution of
bait to lobster diet. Arrow represents potential contribution of bait to lobster diet
calculated from the model (13.3% ± 3.38). The coefficient of variation of the
distribution of outcomes was 0.23. ...............................................................................132
Fig. 7.1: Nutritional condition of lobsters collected from two sites offshore of Jurien Bay
during 2006/2007 fishing season. Dashed lines represent commencement of the
commercial fishing season and commencement of fishing in deep-coastal ecosystems.
.......................................................................................................................................144
Fig. A2.1. Proportion of ingested food remaining in lobster foreguts for three different diet
items fed to lobsters. Evacuation of diet items is modeled by exponential functions
(solid line). ....................................................................................................................179

xi
Fig. A3.1: Relationship between frequency of lobster feeding and lobster nutritional
condition (mean ± se). Letters above treatment groups indicate groups are significantly
different according to post-hoc Tukey tests (p<0.05, df = 3). ..................................... 195

xii
Acknowledgements
Thanks must first go to my fantastic supervisors, Jessica Meeuwig, Diana Walker, Mathew
Vanderklift and Lynda Bellchambers. Your comments, suggestions and guidance have
greatly improved the quality of my work over the last 3 years. Special thanks to Jessica
who introduced me to the world of mass balance modeling and taught me how to separate
the probable from the possible!
The following people helped out in the field and for that I thank them, Dovid Clarke, Mark
Rossbach, Jeremiah Shultz, Andrew Tennyson, Mathew Vanderklift, Lucas Vanderklift,
and the skipper and crew of the vessel Southern Image. Special thanks must go to Scott
Evans, Adam Eastman, Owen Young, and Kylie Cook. Their help at times exceeded what
might reasonably have been expected but it was certainly appreciated. Thanks must also go
to Danielle Johnston who provided lobsters for those experiments described in Chapter
Four and Chapter Seven and to Jane Fromont for help with identification of some of the
sponge specimens collected during this study.
Thank you to the following people who read various drafts during the course of my PhD,
Kylie Cook, Grey Coupland, Michaela Guest, Rebecca Ince, Danielle Johnston, Tim
Langlois, Hector Lozano-Montes, Lachlan MacArthur and Justin McDonald. There is no
doubt that your comments and suggestions improved the quality of the work presented in
this thesis.
To the rest of the marine group and friends at UWA, I thank you for your suggestions and
comments along the way.
Financial support for my research was provided by an Australian Postgraduate Research
Award, the Fisheries Research and Development Corporation (FRDC 2004/049), The
Department of Fisheries Western Australia, and The School of Plant Biology at The
University of Western Australia

xiii
Thank you to all of my friends. While contributing very little in an academic sense over the
last three years, you did contribute to my mental wellbeing.
I wish to thank my family for their love and support over the last three years.
And finally I wish to thank my beautiful girlfriend Bec!
Referencing Format
In cases where individual chapters have been submitted for publication, references are
included at the end of the relevant chapter in the format specified by the relevant journal. In
cases where chapters have not been submitted for publication, references are included at the
end of the relevant chapter in a format based on the Harvard style.

xiv
Statement of Candidate Contribution
This thesis is entirely my own work unless otherwise stated.
Kris Waddington
February 2008

1
Chapter One – General Introduction
Fishing is known to affect marine ecosystems, both directly and indirectly (Hall 1999).
Removal of target and by-catch species along with the addition of organic matter through
discard of by-catch are direct impacts of fishing that have been shown to affect ecosystem
function (Probert et al. 1997; Cook 2001; Daskalov et al. 2007). Indirect effects of fishing
include gear damage to the habitat being fished (Bergman and Hup 1992; Turner et al.
1999; Kaiser et al. 2000). Removal of target species can result in a decrease in predation
pressure on lower trophic levels (Pace et al. 1999; Polis 1999; Shears and Babcock 2002).
Depending on the role of organisms that occupy these trophic levels, removal of predation
pressure can have implications for the rest of the ecosystem (Paine 1974; Strong 1992;
Estes and Duggins 1995; Shears and Babcock 2002).
The effects of removing consumers from an ecosystem depend both on the biomass of the
species extracted and the strength of the interactions between that species and the rest of the
community (see Connell and Vanderklift 2007). Trophic cascades describe the vertical and
strong interactions of two or more non-adjacent trophic levels within an ecosystem (Strong
1992; Huryn 1998; Pace et al. 1999). Trophic cascades are top-down phenomena where
variation in the abundance or biomass of one trophic level alters the abundance or
productivity of lower trophic levels (Pace et al. 1999; Polis 1999).
Trophic cascades are frequently driven by anthropogenic impacts such as the removal of a
top predator through fishing (Shurin et al. 2002). Removal of taxa that exert strong top-
down control on ecosystems has been shown to result in significant ecosystem changes
(Paine 1974; Strong 1992; Estes and Duggins 1995). For example, removal of sea otters
from Alaskan kelp forests has been shown to result in the proliferation of sea urchins, and a
decrease in the abundance of kelp (Estes and Duggins 1995). After re-establishment of sea-
otters in southern Alaska, urchin numbers decreased and kelp biomass increased (Estes and
Duggins 1995). Sea urchins subsequently increased in abundance during the 1990’s as otter
numbers decreased as a result of predation by killer whales, further demonstrating the
importance of top-down control in this system (Estes et al. 1998). However, removal of
predators from ecosystems will not always lead to changes in the structure of ecosystems

2
(Polis et al. 2000). Changes in ecosystem structure depend on many factors including
strength of trophic interactions within the system, habitat diversity, aspects of predator and
prey population dynamics and predator and prey behaviour (for a review see Strong 1992;
Polis et al. 2000; Shurin et al. 2002; Connell and Vanderklift 2007). In understanding the
effect of removal of predators on associated ecosystems, identifying the number and
strength of trophic interactions and trophic role of predators within ecosystems is
important.
Worldwide, spiny lobsters have been shown to be important predators in coastal marine
food-webs. Predation by spiny lobsters has been demonstrated to lead to observable
differences in invertebrate assemblage structure in New Zealand (Shears and Babcock
2002; Langlois et al. 2005; Langlois et al. 2006), Tasmania (Pederson and Johnson 2006),
South Africa (Tarr et al. 1996; Mayfield and Branch 2000) and California (Tegner and
Levin 1983). Of these studies, only Shears and Babcock (2002) were able to identify a
trophic cascade where removal of lobsters resulted in higher sea urchin abundance leading
to a change in algal assemblage structure from a macroalgal dominated assemblage to an
assemblage dominated by crustose algae.
Those studies that have demonstrated detectable effects of lobster removal on ecosystem
structure have shown sea urchins to be important lobster prey (Tegner and Levin 1983; Tarr
et al. 1996; Mayfield and Branch 2000; Mayfield et al. 2000; Shears and Babcock 2002;
Pederson and Johnson 2006). Further, some of the strongest of all trophic cascades are
found in those systems where sea urchins are present, reflecting the fact that sea urchins are
highly effective herbivores (Strong 1992; Shurin et al. 2002). Occurrence of omnivores
within food webs contributes to trophic complexity (Polis and Strong 1996). The
occurrence of omnivorous species within systems increases the number of connections and
interactions by which resources can move through ecological systems (Polis and Strong
1996). Since omnivorous species consume food from a range of different sources, including
primary producer groups, omnivorous groups are less likely to play a strong role in
controlling abundance of organisms at lower trophic levels as may be expected in more
linear food webs where carnivores predominate.

3
The temperate Western Australian coast is an oligotrophic system dominated by the
Leeuwin current (Cresswell 1991; Lenanton et al. 1991). The oligotrophic nature of this
system means that pelagic production is low and species relying on benthic production such
as the western rock lobster (Panulirus cygnus) and prawns dominate (Lenanton et al. 1991).
Sea urchin abundance in these systems is also low relative to those systems where lobster
removal has been shown to have detectable effects on ecosystem structure (Fowler-Walker
and Connell 2002; Vanderklift 2002).
The current thesis investigates the diet and trophic role of western rock lobsters (Panulirus
cygnus George) in temperate Western Australian deep-coastal ecosystems (35-60 m).
Understanding the diet and trophic role of western rock lobsters will help when
understanding important ecological interactions within this oligotrophic system. Lobster
diet will first be investigated as an understanding of an organism’s diet underpins any
understanding of an organism’s feeding ecology (Polis and Strong 1996). Along with
establishing the diet of lobsters in deep-coastal ecosystems, the trophic position of western
rock lobsters will also be determined. An understanding of the diet and trophic position of
lobsters will assist when determining the trophic role of lobsters in deep-coastal
ecosystems. An understanding of the number and strength of ecological interactions
associated with western rock lobsters will be important when assessing the potential effect
of lobster removal on these ecosystems.
Western rock lobsters occur from 0-150 m depth along the temperate west coast of
Australia between Cape Leeuwin (34° 22’ S, 115° 8’ E) and North West Cape (21° 48’ S,
114° 9’ E) (Chittleborough 1970). Along their distributional range, western rock lobsters
are dominant benthic consumers (Lenanton et al. 1991), and support a large commercial
fishery. The commercial fishery operates using baited pots with catches frequently
exceeding 11 000 tonnes p.a. from ~10.1 million potlifts. Despite P. cygnus occurring from
0-150 m depth, all previous lobster dietary studies have focused on those lobsters inhabiting
shallow water ecosystems (<5 m depth) (Joll and Phillips 1984; Edgar 1990; Jernakoff et al.
1993), largely reflecting the accessibility of these areas. Areas of the continental shelf in
depths of 35-70 m (hereon referred to as deep-coastal ecosystems) are important areas of
the western rock lobster fishery, with approximately 40% of commercial landings taken
from these areas (Department of Fisheries Western Australia, unpublished data 2007). The
4
diet and trophic role of western rock lobsters in these deep-coastal ecosystems are the focus
of the current study.
This thesis examines the diet and trophic role of a large consumer, the western rock lobster
(Panulirus cygnus) in temperate Western Australian deep-coastal ecosystems, using stable
isotope analysis coupled with gut content analysis. Direct and indirect effects of fishing on
the target species and the ecosystem it inhabits are then inferred.
Aims
The primary aim of this study was to determine the diet and trophic role of western rock
lobsters in temperate Western Australian deep-coastal ecosystems. Understanding the diet
and trophic role of lobsters in Western Australian deep-coastal ecosystems is important in
understanding the ecological role of western rock lobsters and when assessing the
ecosystem impacts of the western rock lobster fishery. To fully understand the diet and
trophic role of lobsters in these ecosystems, a number of secondary aims were also
addressed. These secondary aims are listed below:
i) To characterise the benthic biota of temperate Western Australian deep-coastal
ecosystems.
ii) To construct a mass balance biomass-production model allowing investigation of
the contribution of various diet sources to lobster diet on an ecosystem-wide scale.
iii) To investigate spatial and temporal variation in lobster nutritional condition on
an ecosystem-wide scale.
iv) To determine consumer-diet δ15N and δ13C discrimination specific to western
rock lobster muscle tissue, ensuring results from stable isotope analysis are robust.
v) To investigate the effect of variation in consumer-diet δ15N and δ13C
discrimination on estimated lobster dietary composition.
vi) To investigate the evacuation rate of common prey from the foreguts of western
rock lobsters, ensuring results from gut content analysis are robust.
5
Structure of this thesis
An understanding of an organism’s environment is inherent when attempting to understand
that organism’s feeding ecology. Thus, characterisation of the deep-coastal ecosystems
inhabited by western rock lobsters is the first aim of this thesis. The biotic composition of
deep-coastal ecosystems was characterised using towed video and diver sampling (Chapter
Two).
The diet and trophic role of western rock lobsters in these deep-coastal ecosystems was
then determined using stable isotope analysis and gut content analysis (Chapter Three).
These techniques are complementary as they examine the diet of lobsters on different time
scales. Gut content analysis gives a ‘snapshot’ of lobster diet between ingestion and
digestion, while stable isotope analysis provides a time-integrated description of trophic
relationships based on assimilated diets over the time scale of tissue turnover rate of the
organism (Kling et al. 1992; Overman and Parrish 2001). Both of these methods of dietary
analysis, however, rely on underlying assumptions, violation of which can affect estimates
of consumer dietary composition. To ensure results from stable isotope analysis were
robust, values for consumer-diet discrimination specific to western rock lobster muscle
tissue were determined (Chapter Four). The effect of variation in consumer-diet
discrimination on estimated lobster dietary composition was then investigated (Chapter
Five). Further, as variation in evacuation rates of different prey from lobster foreguts may
affect estimates of dietary composition from gut content analysis, the foregut evacuation
rate of three common lobster prey are compared (Appendix Two).
Once lobster diet had been determined using stable isotope analysis, the feeding ecology of
lobsters was examined on an ‘ecosystem-wide’ scale (Chapter Six). While gut content
analysis and stable isotope analysis provides dietary information for individual lobsters at
those sites examined, these results are not broadly applicable if they do not relate to the rest
of the ecosystem at other times of the year. A mass balance model was constructed to
estimate the relative contribution of different prey to lobster diet on an ecosystem-wide
scale over one year. Construction of the mass balance model was also useful for verifying
results from stable isotope analysis.

6
Spatial and temporal variation in lobster nutritional condition was then investigated at
Jurien Bay (Chapter Seven). Investigation of lobster nutritional condition gives an
indication of both the quality and quantity of prey ingested by an organism. Prior to
investigating spatial and temporal variation in lobster nutritional condition, a suitable
measure of nutritional condition was identified from laboratory experiments (Appendix
Three).
Chapter Eight synthesizes the results of each component of this thesis. Results are
discussed in terms of the potential impacts of fishing on these deep-coastal ecosystems.

Thesis layout
SynthesisWhat is the role of western rock lobsters in these
deep-coastal ecosystems?
Chapter 2Where do the lobsters occur?Biotic composition of these
ecosystems
Stable Isotope Analysis
Gut content analysis
Chapter 3What do lobsters consume
in these ecosystems?
Chapter 7 Nutritional condition of lobsters
Chapter 6 Mass balance approach
What else do lobsters eat? Bait?
Chapter 4 P. cygnusConsumer-diet discrimination
Chapter 5 Sensitivity of variation in consumer-diet discrimination to calculated dietary composition
Appendix 2 Gut evacuation rates of western rock lobsters
Verification of Techniques
Appendix 3 Comparison of techniques for determining lobster nutritional condition
Chapter 2Where do the lobsters occur?Biotic composition of these
ecosystems
Stable Isotope Analysis
Gut content analysis
Chapter 3What do lobsters consume
in these ecosystems?
Stable Isotope Analysis
Gut content analysis
Chapter 3What do lobsters consume
in these ecosystems?
Chapter 7 Nutritional condition of lobsters
Chapter 6 Mass balance approach
What else do lobsters eat? Bait?
Chapter 4 P. cygnusConsumer-diet discrimination
Chapter 5 Sensitivity of variation in consumer-diet discrimination to calculated dietary composition
Appendix 2 Gut evacuation rates of western rock lobsters
Verification of Techniques
Appendix 3 Comparison of techniques for determining lobster nutritional condition

8
References
Bergman MJN, Hup M (1992) Direct effects of beamtrawling on macrofauna in a sandy
sediment in the southern North Sea. ICES Journal of Marine Science 49: 5-11
Chittleborough RG (1970) Studies on recruitment in the Western Australian rock lobster,
Panulirus longipes cygnus George: Density and natural mortality of juveniles.
Australian Journal of Marine and Freshwater Research 21: 131-148
Connell SD, Vanderklift M, A. (2007) Negative interactions: The influence of predators
and herbivores on prey and ecological systems. In: Connell SD, Gillanders BM
(eds) Marine Ecology. Oxford University Press, Melbourne, pp 72-100
Cook R (2001) The magnitude and impact of by-catch mortality by fishing gear. Reykjavik
Conference on Responsible Fisheries in the Marine Ecosystem, Reykjavik, Iceland
Cresswell GR (1991) The Leeuwin Current - observations and general models. Journal of
the Royal Society of Western Australia 74: 1-14
Daskalov GM, Grishin AN, Rodionov S, Mihneva V (2007) Trophic cascades triggered by
overfishing reveal possible mechanisms of ecosystem regime shifts. Proceedings of
the National Academy of Science 104: 10518-10523
Edgar GJ (1990) Predator-prey interactions in seagrass beds. I. The influence of
macrofaunal abundance and size-structure on the diet and growth of the western
rock lobster Panulirus cygnus George. Journal of Experimental Marine Biology and
Ecology 139: 1-22
Estes JA, Duggins DO (1995) Sea otters and kelp forests in Alaska: Generality and
variation in a community ecological paradigm. Ecological Monographs 65: 75-100
Estes JA, Tinker MT, Williams TM, Doak DF (1998) Killer whale predation on sea otters
linking oceanic and nearshore ecosystems. Science 282: 473-476
Fowler-Walker MJ, Connell SD (2002) Opposing states of subtidal habitat across temperate
Australia: consistency and predictability in kelp canopy — benthic associations. .
Marine Ecology Progress Series 240: 49-56
Hall SJ (1999) The effects of fishing on marine ecosystems and communities. Blackwell
Science, Oxford
Huryn AD (1998) Ecosystem-level evidence for top-down and bottom-up control of
production in a grassland stream system. Oecologia 115: 173-183
9
Jernakoff P, Phillips BF, Fitzpatrick JJ (1993) The diet of post-puerulus western rock
lobster, Panulirus cygnus George, at Seven Mile Beach, Western Australia.
Australian Journal of Marine and Freshwater Research 44: 649-655
Joll LM, Phillips BF (1984) Natural diet and growth of juvenile western rock lobster
Panulirus cygnus George. Journal of Experimental Marine Biology and Ecology 75:
145-169
Kaiser MJ, Ramsay K, Richardson CA, Spence FE, Brand AR (2000) Chronic fishing
disturbance has changed shelf sea benthic community structure. Journal of Animal
Ecology 69: 494-503
Kling GW, Fry B, O'Brien W, J. (1992) Stable isotopes and planktonic trophic structure in
arctic lakes. Ecology 73: 561-566
Langlois TJ, Anderson MJ, Babcock RC (2005) Reef-associated predators influence
adjacent soft-sediment communities. Ecology 86: 1508-1519
Langlois TJ, Anderson MJ, Brock M, Murman G (2006) Importance of rock lobster size-
structure for trophic interactions: choice of soft-sediment bivalve prey. Marine
Biology 149: 447-454
Lenanton RC, Joll L, Penn J, Jones K (1991) The influence of the Leeuwin Current on
coastal fisheries of Western Australia. Journal of the Royal Society of Western
Australia 74: 101-114
Mayfield S, Branch GM (2000) Interrelations among rock lobsters, sea urchins, and
juvenile abalone: implications for community management. Canadian Journal of
Fisheries and Aquatic Sciences 57: 2175-2185
Mayfield S, Branch GM, Cockroft AC (2000) Relationships among diet, growth rate and
food availability for the South African Rock Lobster, Jasus lalandii (Decapoda,
Palinuridae). Crustaceana 73: 815-834
Overman NC, Parrish DL (2001) Stable isotope composition of walleye: 15N accumulation
with age and area-specific differences in 13C. Canadian Journal of Fisheries and
Aquatic Sciences 58: 1253-1260
Polis GA, Strong DR (1996) Food web complexity and community dynamics. The
American Naturalist 147: 813-846
Pace ML, Cole JJ, Carpenter SR, Kitchell JF (1999) Trophic cascades revealed in diverse
ecosystems. Trends in Ecology and Evolution 14: 483-488

10
Paine RT (1974) Intertidal community structure: experimental studies on the relationship
between a dominant competitor and its principle predator. Oecologia 15: 93-120
Pederson HG, Johnson CR (2006) Predation of the sea urchin Heliocidaris erythrogramma
by rock lobsters (Jasus edwardsii) in no-take marine reserves. Journal of
Experimental Marine Biology and Ecology 336: 120-134
Polis GA (1999) Why are parts of the world green? Multiple factors control productivity
and the distribution of biomass. Oikos 86: 3-15
Polis GA, Sears ALW, Huxel GR, Strong DR, Maron J (2000) When is a trophic cascade a
trophic cascade? Trends in Ecology and Evolution 15: 473-475
Probert PK, McKnight DG, Grove SL (1997) Benthic invertebrate bycatch from a deep-
water trawl fishery, Chatham Rise, New Zealand. Aquatic Conservation: Marine
and Freshwater Ecosystems 7: 27-40
Shears NT, Babcock RC (2002) Marine reserves demonstrate top-down control of
community structure on temperate reefs. Oecologia 132: 131-142
Shurin JB, Borer ET, Seabloom EW, Anderson K, Blanchette CA, Broitman B, Cooper SD,
Halpern BS (2002) A cross-ecosystem comparison of the strength of trophic
cascades. Ecology Letters 5: 785-791
Strong DR (1992) Are trophic cascades all wet? Differentiation and donor-control in
speciose ecosystems. Ecology 73: 747-754
Tarr RJQ, Williams PVG, MacKenzie AJ (1996) Abalone, sea urchins and rock lobster: A
possible ecological shift may affect traditional fisheries. South African Journal of
Marine Science 17: 319-323
Tegner MJ, Levin LA (1983) Spiny lobsters and sea urchins: analysis of a predator-prey
interaction. Journal of Experimental Marine Biology and Ecology 73: 125-150
Turner SJ, Thrush SF, Hewitt JE, Cummins VJ, Funnell G (1999) Fishing impacts and the
degradation or loss of habitat structure. Fisheries Management and Ecology 6: 401-
420
Vanderklift MA (2002) Interactions between sea urchins and macroalgae in south-western
Australia: testing general predictions in a local context. PhD. Department of Botany,
Perth, Western Australia

11

SynthesisWhat is the role of western rock lobsters in these
deep-coastal ecosystems?
Chapter 2Where do the lobsters occur?Biotic composition of these
ecosystems
Stable Isotope Analysis
Gut content analysis
Chapter 3What do lobsters consume
in these ecosystems?
Chapter 7 Nutritional condition of lobsters
Chapter 6 Mass balance approach
What else do lobsters eat? Bait?
Chapter 4 P. cygnusConsumer-diet discrimination
Chapter 5 Sensitivity of variation in consumer-diet discrimination to calculated dietary composition
Appendix 2 Gut evacuation rates of western rock lobsters
Verification of Techniques
Appendix 3 Comparison of techniques for determining lobster nutritional condition
Chapter 2Where do the lobsters occur?Biotic composition of these
ecosystems
Stable Isotope Analysis
Gut content analysis
Chapter 3What do lobsters consume
in these ecosystems?
Stable Isotope Analysis
Gut content analysis
Chapter 3What do lobsters consume
in these ecosystems?
Chapter 7 Nutritional condition of lobsters
Chapter 6 Mass balance approach
What else do lobsters eat? Bait?
Chapter 4 P. cygnusConsumer-diet discrimination
Chapter 5 Sensitivity of variation in consumer-diet discrimination to calculated dietary composition
Appendix 2 Gut evacuation rates of western rock lobsters
Verification of Techniques
Appendix 3 Comparison of techniques for determining lobster nutritional condition

13
Chapter Two - Assessment of the benthic biota of deep-coastal ecosystems
associated with western rock lobster (Panulirus cygnus) populations along
the temperate west coast of Australia

14
Abstract
The benthic biota of deep-coastal ecosystems (35-75 m) along the temperate west coast of
Australia was classified using towed video and diver sampling at three locations, Lancelin,
Jurien Bay and Dongara. Deep-coastal ecosystems have significant algal and sponge
assemblages, suggesting a reduction in irradiance with depth is not restricting algal growth
at these depths. While differences in sponge/algal assemblages and macroinvertebrate
community composition were detected between study locations, any direct link between
sponge/algal assemblage structure and macroinvertebrate community composition was not
investigated. Macroinvertebrates are important prey items for western rock lobsters
(Panulirus cygnus George.), meaning differences in macroinvertebrate community
composition between locations will have implications for prey available to western rock
lobsters. The two methods used to classify assemblage structure, towed video and diver
sampling were also compared. Both methods of classifying assemblage structure yielded
similar outcomes, suggesting a single method of classifying habitat can be employed in
future studies to determine assemblage structure.
Introduction
Ecology can be defined as the study of the relationship among organisms and between
organisms and their environment (Haeckel 1866). Thus, an understanding of the
environment in which an organism is found is inherent to any appreciation of that
organisms’ ecology. Western rock lobsters (Panulirus cygnus George.) inhabit coastal
ecosystems along the temperate west coast of Australia. This region is oligotrophic and
strongly influenced by the Leeuwin current – a low nutrient current that flows southward
along the west coast of Australia (Cresswell 1991; Johannes et al. 1994; Hanson et al.
2005). The presence of the Leeuwin current, along with low runoff of terrestrial water
sources in this area (Li et al. 1999) means pelagic production in this region is low, and
species relying on benthic production such as western rock lobsters are abundant (Lenanton
et al. 1991).

15
Shallow water ecosystems (<20 m) along the temperate west coast of Australia have been
extensively described. The region is characterised by limestone reefs running parallel to the
coastline between one and ten kilometres offshore (Searle and Semeniuk 1985). These reefs
are dominated by the kelp Ecklonia radiata (C. Agardh) J. Agardh (Phillips et al. 1997;
Wernberg et al. 2003b; Kendrick et al. 2004) which reach 1-2 metres in length (Wernberg
et al. 2003a) and form extensive areas of habitat termed kelp beds (Steinberg and Kendrick
1999). Other alga also occur on these reefs, both associated with E. radiata and on small
patches of reef (Kendrick et al. 1999; Kendrick et al. 2004, Vanderklift and Kendrick
2004). Macroinvertebrates, including various crustaceans, molluscs, polychaetes, and
echinoderms are highly abundant and productive in these ecosystems (Edgar 1990a; Edgar
and Shaw 1995). Macroinvertebrates are commonly consumed by higher order consumers
such as fish and lobsters. They are likely important in near-shore food webs (Joll and
Phillips 1984; Edgar 1990b; Edgar 1990c; Jernakoff et al. 1993; Edgar and Shaw 1995).
While the biota of shallow water ecosystems have been extensively characterised, the
composition of ecosystems at deeper depths in this region remains relatively unknown.
Irradiance is reduced as water depth increases, which may affect macroalgal communities
(Kirkman 1989). An increase in depth may result in a decrease in wave action (Brey 1991),
potentially leading to differences in benthic algal assemblages (Molloy and Bolton 1996;
Phillips et al. 1997).
Deep-coastal ecosystems yield large catches of western rock lobsters, suggesting benthic
production is significant at these depths. Sources of benthic production may be from in situ
primary production, from benthic-pelagic coupling (eg. Graf 1989; Waite et al. 2000), or
from import of detrital material (eg. Harrold et al. 1998; Okey 2003). These sources of
benthic production must be sufficient to support observed lobster production from these
deep-coastal ecosystems. Western rock lobsters are ecologically and commercially
important (Edgar 1990b; Jernakoff et al. 1993; Fletcher and Head 2006), with over 40% of
recent lobster catches taken from the deep-coastal ecosystems that are the focus of this
study (unpublished catch and effort statistics, Department of Fisheries Western Australia).
Characterising the benthic biota and habitat of deep-coastal reefs will assist when
determining the ecology of western rock lobsters in these deep-coastal ecosystems.

16
This study also compares two methods of classifying sponge and algal assemblages –
towed video and diver sampling. Methods of classification were compared using a
“surrogacy approach” (see Gaston and Williams 1993; Andersen 1995). Surrogates have
been extensively used in diversity studies to estimate species diversity from occurrence of
higher taxonomic levels (Gaston and Williams 1993; Andersen 1995; Vanderklift et al.
1998; Cardoso et al. 2004). The rationale of this approach is, if patterns in diversity at the
species level can be captured at higher taxonomic levels, costs associated with collecting
and processing samples can be reduced (Andersen 1995). Here, the applicability of one
method to act as a surrogate for the other method will allow investigation of whether the 2
methods of classification provide comparable data, and the degree to which information is
lost if one method alone is employed to classify sponge and algal assemblages.
The aims of this study were twofold, (1) to characterise the biota of deep-coastal
ecosystems at three locations along the temperate west coast of Australia and (2) to
evaluate the utility of towed video as a surrogate for diver sampling when determining
sponge and algal assemblage structure.
Methods
Study Locations
Biota of deep-coastal ecosystems was classified at three locations Lancelin, Jurien Bay, and
Dongara (Fig. 2.1). These locations span 200 km of the Western Australian coastline near
the center of the distribution of western rock lobsters. Habitat at each location was assessed
using two complementary techniques. Towed video was used to classify habitat on a broad
scale (kilometres), while diver-harvested quadrats were used to classify habitat on a fine
scale (metres). It is important to note that not only does the scale of the measures differ, the
specific locations and number of samples also vary.

17
Determining broad-scale habitat characteristics using towed video
Broad-scale habitat classification using towed video was carried out between March 2005
and May 2007. Between 8 and 11 transects (depths 35 m to 75 m) ranging in length from
1075 m to 3725 m (mean ~2500 m) were surveyed at each of the three locations. An
underwater video apparatus, consisting of one forward and one downward facing video
camera was towed between one and two knots between one and two metres above the
substratum. Footage was recorded to video and classified in the laboratory. To classify
habitat, video was paused every 0.013 seconds of latitude (equal to approx 25m straight line
distance) and substratum in the field of view (~1 m diameter) was identified, providing a
series of habitat snapshots along the transects.
Habitat was classified on the basis of assemblage type and coverage, using the categories
described in Tables 2.1 and 2.2. For bare reef, rubble/limestone, and sand no measure of
habitat coverage was recorded.
Data analysis
Broad-scale classification using towed video provided a description of assemblage type and
coverage (ie. 1a, 4c, 5b) at various points along each video transect (See Tables 2.1 and
2.2). The proportional contribution of each habitat category along each transect was then
calculated. Data were analysed using the PRIMER v5® statistical package. Effectively, the
habitat categories were treated as “species”. Bray-Curtis similarity was used as, like
species, habitat categories can be present or absent e.g. zeros are meaningful in their own
right and joint absence of a category does not affect the similarity of transects. Data were
square root transformed to reduce the influence of dominant habitat categories, and non
metric MDS were generated for sponge/algal assemblages. Constrained ordinations were
also plotted using untransformed data, allowing the dispersion of the data points to be
investigated. Differences in assemblage structure between sites and locations were
investigated using analysis of similarity (ANOSIM), while species responsible for driving
18
observed differences in assemblage structure were identified using similarity percentages
(SIMPER).
Determining fine-scale habitat characteristics by diver sampling
Habitat samples were collected by divers for fine-scale classification during March and
April 2006. Between four and five sites (35-60 m depth) were selected for sampling at each
of the three locations. Divers breathing mixed gas (Enriched Air Nitrox, Trimix) from
SCUBA collected habitat samples at each site. When collecting habitat samples, the entire
contents of a 0.25 m2 quadrat were removed using a paint scraper and placed in a calico
bag, ensuring no material was lost (n=2 sub-samples at each site at Dongara and Jurien Bay
and n=3 sub-samples at each site at Lancelin). Abundance and biomass of large
macroinvertebrates was determined at each site using a 5 m belt transect. A 5 m transect
line was laid out along the reef and all large macroinvertebrates (>20 mm) collected from
0.5 m each side of the transect line. In the laboratory, all collected material was sorted to
lowest possible taxonomic level then weighed, yielding the biomass of alga, sponges, and
macroinvertebrates per unit area.
Data Analysis
Non metric MDS and constrained ordinations were plotted for sponge/algal assemblages
and macroinvertebrate community composition. PRIMER v5 was used to investigate
differences in sponge and algal assemblages and macroinvertebrate community
composition. Data were square root transformed to reduce the influence of dominant
species. Bray-Curtis similarity was used and non metric MDS were plotted for sponge/algal
assemblages along with macroinvertebrate community composition. Constrained
ordinations were plotted using Bray-Curtis similarity and untransformed data, allowing the
dispersion or “shape” of these data to be investigated. Differences in sponge/algal
assemblage structure and macroinvertebrate community composition depending on the
factors site and location were investigated using ANOSIM. Species responsible for driving
differences in assemblage structure were identified using SIMPER.
19
Following analysis of community composition using multivariate techniques, taxa were
combined into functional groups (algae, sponges, invertebrates) and biomass of functional
groups compared for the factors site and location using two-way analysis of variance
(ANOVA).
Comparison of broad-scale and fine-scale methods of habitat classification
Following habitat classification using broad-scale and fine-scale techniques, these two
methods of habitat classification were compared. While the same locations were sampled
by both methods, they can be considered independent as sampling within locations was not
at the same sites, and sampling occurred at different scales and used different variables (e.g.
as relative occurrence of habitat type for broad-scale and biomass of species for fine-scale).
This is analogous but not identical to surrogacy studies that ask whether a location can be
characterized by one set of variables (species) or another (family or order) (Andersen 1995;
Olsgard and Somerfield 2000), although these variables are typically collected from the
same sites within locations.
Conventional methods of comparing methods of classification require a correspondence
between samples (eg. BIOENV, Relate analyses; Whitman et al. 2004) or variables (eg. 2nd
Stage MDS; Clarke et al. 2006). As such, these methods were not applicable for
comparison of these two datasets. As an alternative approach, we built on the concepts
behind these techniques by asking the question to what degree do the spatial distribution of
samples correspond between the two techniques e.g. are the Lancelin samples similarly
spatially distributed relative to each other and the samples from the other locations in space
regardless of the technique used? The comparison of broad-scale and fine-scale methods for
habitat classification was based on the overlap of the constrained ordination for both
datasets. PERMANOVA was used to test whether the distribution of points on the
ordination plots varied with (1) location and (2) method. Location was treated as a fixed
factor with three levels and method of analysis was also treated as a fixed factor with two
levels. The dependant variables were the x, y - coordinates of the sampling points on the
constrained ordination. This analysis gave an indication of whether the points differed in
their mean position by location. The dispersion of points on the ordination plots (shape of

20
data) was also examined on the basis of location and method using PERMDISP. The scale
of constrained ordinations is determined by the maximum dissimilarity between two data
points. Differences in assemblage structure between each location can then be compared to
this maximum dissimilarity of points in the data set, giving a relative measure of
differences in assemblage structure between locations. Differences in assemblage structure
between locations determined by each classification method can then be compared.
Results
Deep-coastal reef ecosystems at the three locations support considerable biomass of
sponges and algae. Biomass of sponge and algae at the three locations were between 1.2
and 2.2 kg. 0.25m-2. Macroinvertebrate biomass are commonly between 2.5 and 3.0 g.
0.25m-2, with polychaetes, small crabs and amphipods the most common invertebrate fauna
encountered. Both sponge/algal assemblage structure and invertebrate community
composition differed between locations.
Broad-scale patterns in sponge/algal assemblage structure determined from towed video
Differences in assemblage structure were apparent from the towed video images (Fig. 2.2).
Analysis using ANOSIM indicated that locations had significantly different sponge and
algal assemblages (Clarke’s R = 0.55, p = 0.001, permutations = 999). Pairwise tests
indicated significant differences in assemblage structure occurred between all locations
(Table 2.3).
Analysis using similarity percentages (SIMPER) indicated it was primarily high occurrence
of habitat categories containing sponge fauna at Dongara that were responsible for driving
observed differences in assemblage structure between study locations (Appendix One,
Tables 1, 2, 3). Low occurrence of mixed assemblage with E. radiata, no sponge (class 4b)
and mixed assemblage, no E. radiata, no sponge (class 3b) along with high occurrence of
low coverage mixed assemblage with sponge, no E. radiata (class 2c) contribute to
observed differences between Dongara and the other two locations (Appendix One, Table

21
3). Differences in assemblage structure between Lancelin and Jurien Bay were primarily
driven by high occurrence of mixed assemblage with E. radiata, no sponge (class 4b) at
Lancelin relative to Jurien Bay, reflecting the lower occurrence of sponge at Lancelin
relative to Jurien Bay (Appendix One, Table 1).
Fine-scale patterns in sponge/algal assemblage structure determined by diver sampling
A range of taxa were identified from samples collected by divers. Collected samples were
dominated by sponges at Dongara, while the kelp Ecklonia radiata accounted for a high
proportion of sample biomass at Lancelin. Jurien Bay had high biomass of both E. radiata
and sponges. Across the three locations 149 sponge species, 34 red algal species, 8
coralline algal species, 5 green algal species, 7 brown algal species and a single seagrass
species (Thallassodendron pachyrhizum den Hartog) were recorded.
Collection of biota using divers allowed species biomass to be assessed on a fine-scale (eg.
metres). Differences in algal and sponge assemblages were apparent between locations
(Fig. 2.3) (Clarke’s R=0.47, p=0.001, permutations=999). Pairwise tests indicate all
locations had significantly different algal and sponge assemblages (Table 2.4). Differences
in assemblage structure were also apparent between sites within locations (Lancelin,
Clarke’s R=0.63, p=0.002, permutations=9999; Jurien Bay, Clarke’s R=0.67, p=0.004,
permutations=9999; Dongara, Clarke’s R=0.58, p=0.008, permutations=945).
Analysis using SIMPER revealed high biomass of three sponge species (Class Calcarea,
Order Clathrinida, Clathrinida sp 6; Class Demospongiae, Order Dictyoceratida, Family
Irciniidae, Sarcotragus sp.; and Class Demospongiae, Order Dictyoceratida, Family
Thorectidae, Cacospongia sp.) and low biomass of kelp (E. radiata) at Dongara relative to
Jurien Bay and Lancelin were responsible for driving observed differences in assemblage
structure between Dongara and Lancelin/Jurien Bay (Appendix One, Tables 4, 5, 6).

22
Macroinvertebrate community composition
Macroinvertebrate community composition was also assessed from diver samples. Across
the three locations 16 families of macroinvertebrates, including four species of sea stars and
27 sessile invertebrates (not including sponges) were identified. The invertebrate groups,
echinoderms, crustaceans, molluscs, polychaetes, sipunculids, bryozoans, ascidians, and
corals were all encountered. Of the macroinvertebrate fauna, crabs (<15 mm carapace
width), polychaetes, and amphipods were most commonly encountered.
The invertebrate community composition did not differ between sites within locations
(Clarke’s R=0.17, p=0.09, permutations=999), but did differ between locations (Fig. 2.4)
(Clarke’s R=0.28, p=0.001, permutations=999). Pairwise tests indicated all locations
significantly differed in macroinvertebrate community composition (Table 2.5).
SIMPER analysis was used to determine which taxa were responsible for driving observed
differences in invertebrate community composition between study locations (Appendix
One, Tables 7, 8, 9). Higher abundances of decapod crustaceans (excluding crabs) and the
hammer oyster (Malleus sp.) at Dongara relative to Lancelin and Jurien Bay were the
primary taxa driving observed differences in invertebrate fauna between Dongara and the
other study locations (Appendix One, Tables 8, 9). Bivalves and gastropods were also more
abundant at Dongara relative to Lancelin and Jurien Bay which also contributed to
observed differences in invertebrate community composition (Appendix One, Tables 8, 9).
Few differences in the composition of invertebrate communities were apparent between
Lancelin and Jurien Bay.
Comparison of total sponge, algal and macroinvertebrate abundances
Taxa were combined into functional groups (algae, sponges and invertebrates) and total
biomass of functional groups compared on the basis of site and location. No difference in
algal biomass was detected between sites within locations (Table 2.6). However, significant

23
differences in algal biomass were detected among locations (Table 2.6; Fig. 2.5). Further
analysis using post hoc Tukey tests indicated algal biomass was significantly higher at
Lancelin relative to Dongara (p=0.009). No difference in algal biomass were apparent
between Lancelin and Jurien Bay (p=0.792), or Jurien Bay and Dongara (p=0.069).
Sponge biomass did not significantly differ among sites within locations (Table 2.7),
however significant differences in sponge biomass were observed among locations (Table
2.7; Fig. 2.5). Post hoc Tukey tests indicated that sponge biomass at Dongara was
significantly higher than sponge biomass at Lancelin (p=0.043). No difference in sponge
biomass was apparent between Dongara and Jurien Bay (p=0.99) or Lancelin and Jurien
Bay (p=0.07). No differences in macroinvertebrate biomass were observed between sites
within locations or between locations (Table 2.8; Fig. 2.6).
Comparison of towed video and diver sampling for classification of sponge and algal
assemblages
Both methods used to classify sponge/algal assemblage provided similar results with
respect to differences in algal and sponge assemblages among locations. Both methods of
habitat classification characterised Lancelin as algal dominated, Dongara as sponge
dominated, and Jurien Bay as sponge and algal dominated. Fig. 2.7 shows the overlap of
the constrained ordinations from the broad-scale classification (white symbols, n=29) and
the fine-scale classification (black symbols, n=30). A PERMANOVA on the x and y
coordinates demonstrated that the points on the ordination plots were dependant on location
but not method of analysis (Table 2.9), indicating that the relative position of Lancelin,
Dongara and Jurien are the same using both methods.
While differences in the mean location of points were detected on the basis of location, no
differences in the dispersion of points on the ordination plots were detected on the basis of
location (Table 2.10), or method of analysis (Table 2.11). This indicates that observed
variation in assemblage structure within locations (determined by the two methods of
classification) is consistent.

24
Discussion
Deep-coastal reef ecosystems along the temperate west coast of Australia support
significant algal assemblages. These assemblages are comparable in biomass (Wernberg et
al. 2006), and composition (Kendrick et al. 1999; Wernberg et al. 2003; Kendrick et al.
2004) to shallow water assemblages in this region. The occurrence of comparable algal
assemblages, particularly the kelp, Ecklonia radiata suggests irradiance does not constrain
the distribution of E. radiata to depths shallower than 60 m. Observed biomass and
coverage of E. radiata and associated algal species suggest macroalgae are the dominant
source of primary production in these deep-coastal ecosystems. Detached macroalgae were
rarely observed in deep-coastal ecosystems and are unlikely to be a significant source of
production, unlike in shallow water systems (Wernberg et al. 2006). Sponges were
frequently observed in deep-coastal ecosystems, particularly at Dongara and Jurien Bay,
suggesting benthic pelagic coupling may contribute to observed secondary production of
these deep-coastal ecosystems (Graf 1989; Waite et al. 2000; Zhou et al. 2006). However,
further research is required to establish the strength of any such link between the pelagic
and benthic zones.
Differences in algal and sponge assemblages were detected between the study locations.
These differences in habitat assemblages were driven by high biomasses and occurrence of
sponge at Dongara relative to Lancelin where macroalgae were more abundant. Differences
in macroalgal assemblage structure have been observed on comparable scales in shallow
water ecosystems (Wernberg et al. 2003). Few other studies have characterised sponge
biomass and assemblage structure in temperate sub-tidal systems. More commonly
coverage and species richness were investigated. A study by McQuillan (2006) showed that
sponges occupy 30-50% of the limestone reef in shallow water ecosystems (8-12 m depth)
in Marmion Lagoon (31° 44′ S, 115° 40′ E). Sponge coverage observed in that study is
comparable to coverage observed for deep-coastal ecosystems in the current study,
although sponge coverage was observed to differ between locations.
Differences in algal and sponge abundance among the three locations have implications for
associated macroinvertebrate fauna. Ecosystem engineers are those taxa that are important

25
in structuring marine ecosystems, and have implications for other species within
ecosystems (Jones et al. 1994; Lawton and Jones 1995). In deep-coastal ecosystems, the
presence of sponges and macroalgae increases habitat complexity. The presence of sponges
and algae will increase the available space and nutrients for associated macroinvertebrate
fauna. A positive correlation between habitat complexity and invertebrate abundance has
previously been demonstrated for a number of systems (Heck and Orth 1980; Gore et al.
1981; Robertson and Lenanton 1984; Jernakoff and Nielsen 1998; Attilla et al. 2005). For
example, Jenakoff and Nielson (1998) identified a highly significant relationship between
the density of epifaunal invertebrates and seagrass biomass. These responses are typically
taxa specific depending on the requirements of different taxa for resources provided by the
ecosystem engineers. For example, higher abundance of crabs and amphipods/isopods at
Dongara relative to Lancelin and Jurien Bay may be because sponges meet the
requirements of these taxa more effectively than algae. Alternatively, invertebrate
abundance may be influenced by other factors such as predation and competition (Heck and
Orth 1980; Langlois et al. 2005; Pederson and Johnson 2006).
Links between sponge and algal assemblage structure and macroinvertebrate abundance
may have implications for food available to higher order consumers such as the western
rock lobster. Western rock lobsters are known to consume various macroinvertebrate fauna
in shallow water ecosystems, with differences in diet shown to reflect differences in prey
availability (Joll and Phillips 1984; Edgar 1990a; Jernakoff et al. 1993). Observed
differences in macroinvertebrate community composition among locations will influence
prey availability to lobsters between study locations.
Towed video as a surrogate for diver sampling in classification of sponge and algal
assemblages
Results indicated towed video provides a reliable surrogate to diver sampling when
classifying sponge and algal assemblages in temperate Western Australian ecosystems.
Method of classification had no determinable influence on classification of sponge and
algal assemblages, and the differences between locations were preserved. The observed
correlation between classification methods indicates fine-scale patterns in sponge and algal

26
assemblages can be inferred from broad-scale patterns determined by towed video. Towed
video is not depth limited, is cost-effective (relative to diver sampling), and allows
classification of large areas of habitat cheaply, making it an effective technique for
classifying sponge and algal assemblages. Diver sampling is a useful measure when sample
collection and examination of macroinvertebrate community composition is desired (such
as for trophodynamic studies) (e.g. Davenport and Bax 2002). Since these two techniques
of habitat classification are highly correlated, techniques employed to classify sponge and
algal assemblage structure in future studies should also reflect the broader aims of the
relevant research projects.
Conclusions
The current study has demonstrated that significant algal and sponge assemblages occur in
temperate Western Australian deep-coastal ecosystems, suggesting benthic primary
production is a significant contributor to production in these ecosystems. Algal and sponge
assemblages have significant biomasses of macroinvertebrates associated with them –
sufficient to support lobster production in this region (Waddington and Meeuwig
submitted/Chapter Six). Macroinvertebrate biomasses observed in deep-coastal ecosystems
are low compared to shallow water ecosystems in this region (data converted from
Lenanton et al. 1982; Robertson and Lucas 1983). Macroinvertebrate biomass is also low
compared to other systems worldwide (Banse and Mosher 1980; Riddle et al. 1990;
Bologna and Heck 1999; Okey and Mahmoudi 2002; Cusson and Bourget 2005), likely
reflecting the oligotrophic nature of this region (Cresswell 1991; Johannes et al. 1994;
Hanson et al. 2005). While the ecosystem processes influencing observed abundances of
macroinvertebrates are not presently known (and may involve bottom-up and/or top-down
processes), the description of benthic communities provided in the current study provides a
useful basis for future investigation of such ecosystem processes. Comparison of
classification methods found no difference in sponge and algal assemblages determined by
the two methods. Where sample collection is not required, broad scale classification using
towed video provides the most cost effective method of assessing benthic habitat at the
assemblage level.

27
Acknowledgements
I wish to thank Scott Evans (Department of Fisheries, Western Australia) for his help with
the analysis of video reported in this chapter. I also wish to thank Dr Jessica Meeuwig who
assisted with the development of ideas and data analysis relating to the comparison of
classification methods.
References
Andersen AN (1995) Measuring more of biodiversity: Genus richness as a surrogate for
species richness in Australian ant faunas. Biological Conservation 73: 39-43
Atilla N, Fleeger JW, Finelli CM (2005) Effects of habitat complexity and hydrodynamics
on the abundance and diversity of small invertebrates colonizing artificial
substrates. Journal of Marine Research 63: 1151-1172
Banse K, Mosher S (1980) Adult body mass and annual production/biomass relationships
of field populations. Ecological Monographs 50: 355-379
Bologna PAX, Heck KLJ (1999) Macrofaunal associations with seagrass epiphytes:
relative importance of trophic and structural characteristics. Journal of Experimental
Marine Biology and Ecology 242: 21–39
Brey T (1991) The relative significance of biological and physical disturbance: An example
from intertidal and subtidal sandy bottom communities. Estuarine Coastal and Shelf
Science 33: 339-360
Cardoso P, Silva I, de Oliveira NG, Serrano ARM (2004) Higher taxa surrogates of spider
(Araneae) diversity and their efficiency in conservation. Biological Conservation
117: 453-459
Clarke KR, Somerfield PJ, Airoldi L, Warwick RM (2006) Exploring interactions by
second-stage community analyses. Journal of Experimental Marine Biology and
Ecology 338: 179-192
Cresswell GR (1991) The Leeuwin Current - observations and general models. Journal of
the Royal Society of Western Australia 74: 1-14
Cusson M, Bourget E (2005) Global patterns of macroinvertebrate production in marine
benthic habitats. Marine Ecology Progress Series 297: 1–14

28
Davenport SD, Bax NJ (2002) A trophic study of a marine ecosystem off southeastern
Australia using stable isotopes of carbon and nitrogen. Canadian Journal of
Fisheries and Aquatic Sciences 59: 514-530
Edgar GJ (1990a) The influence of plant structure on the species richness, biomass and
secondary production of macrofaunal assemblages associated with Western
Australian seagrass beds. Journal of Experimental Marine Biology and Ecology
137: 215-240
Edgar GJ (1990b) Predator-prey interactions in seagrass beds. I. The influence of
macrofaunal abundance and size-structure on the diet and growth of the western
rock lobster Panulirus cygnus George. Journal of Experimental Marine Biology and
Ecology 139: 1-22
Edgar GJ (1990c) Predator-prey interactions in seagrass beds. III. Impact of the western
rock lobster Panulirus cygnus George. on epifaunal gastropod populations. Journal
of Experimental Marine Biology and Ecology 139: 33-42
Edgar GJ, Shaw C (1995) The production and trophic ecology of shallow-water fish
assemblages in southern Australia. II. Diets of fishes and trophic relationships
between fishes and benthos at Western Port, Victoria. Journal of Experimental
Marine Biology and Ecology 194: 83-106
Fletcher WJ, Head F (2006) State of the fisheries report 2005/06. Department of Fisheries,
Western Australia. Perth, Australia
Gaston KJ, Williams PH (1993) Mapping the world's species-The higher taxon approach.
Biodiversity Letters 1: 2-8
Gore RH, Gallaher EE, Scotto LE, Wilson KA (1981) Studies on decapod crustacea from
the Indian River region of Florida. Estuarine Coastal and Shelf Science 12: 485-508
Graf G (1989) Benthic-pelagic coupling in a deep-sea benthic community. Nature 341:
437-439
Haeckel E (1866) Generelle Morpholigie der Organismen. Georg Reimer, Berlin
Hanson CE, Pattiaratchi CB, Waite AM (2005) Seasonal production regimes off south-
western Australia: influence of the Capes and Leeuwin Currents on phytoplankton
dynamics. Marine and Freshwater Research 56: 1-16
Harrold C, Light K, Lisin S (1998) Organic enrichment of submarine-canyon and
continental-shelf benthic communities by macroalgal drift imported from nearshore
kelp forests. Limnology and Oceanography 43: 669-678
29
Heck KL, Orth RJ (1980) Seagrass habitats: The roles of habitat complexity, competition
and predation in structuring associated fish and motile macroinvertebrate
assemblages. In: Kennedy VS (ed) Estuarine Perspectives: International estuarine
research conference (5th: 1979: Jekyll Island, Ga.). Academic Press, New York, pp
449-464
Jernakoff P, Phillips BF, Fitzpatrick JJ (1993) The diet of post-puerulus western rock
lobster, Panulirus cygnus George, at Seven Mile Beach, Western Australia.
Australian Journal of Marine and Freshwater Research 44: 649-655
Jernakoff P, Nielsen J (1998) Plant-animal associations in two species of seagrasses in
Western Australia. Aquatic Botany 60: 359-376
Johannes RE, Pearce AF, Wiebe WJ, Crossland CJ, Rimmer DW, Smith DF, Manning C
(1994) Nutrient characteristics of well-mixed coastal waters off Perth, Western
Australia. Estuarine, Coastal and Shelf Science 39: 273-285
Joll LM, Phillips BF (1984) Natural diet and growth of juvenile western rock lobster
Panulirus cygnus George. Journal of Experimental Marine Biology and Ecology 75:
145-169
Jones CG, Lawton JH, Shachak M (1994) Organisms as ecosystem engineers. Oikos 69:
373-386
Kendrick GA, Harvey ES, Wernberg T, Harman N, Goldberg N (2004) The role of
disturbance in maintaining diversity of benthic macroalgal assemblages in
southwestern Australia. The Japanese Journal of Phycology 52 supplement: 5-9
Kendrick GA, Lavery PA, Phillips JC (1999) Influence of Ecklonia radiata kelp canopy on
structure of macro-algal assemblages in Marmion Lagoon, Western Australia.
Hydrobiologia 399: 275-283
Kirkman H (1989) Growth, density and biomass of Ecklonia radiata at different depths and
growth under artificial shading off Perth, Western Australia. Australian Journal of
Marine and Freshwater Research 40: 169-197
Langlois TJ, Anderson MJ, Babcock RC (2005) Reef-associated predators influence
adjacent soft-sediment communities. Ecology 86: 1508-1519
Lawton JH, Jones CG (1995) Linking species and ecosystems: Organisms as ecological
engineers. In: Jones CG, Lawton JH (eds) Linking species and ecosystems.
Chapman and Hall, New York, pp 141-150

30
Lenanton RC, Joll L, Penn J, Jones K (1991) The influence of the Leeuwin Current on
coastal fisheries of Western Australia. Journal of the Royal Society of Western
Australia 74: 101-114
Lenanton RC, Robertson AI, Hansen JA (1982) Nearshore accumulations of detached
macrophytes as nursery areas for fish. Marine Ecology Progress Series 9: 51-57
Li Q, James NP, Bone Y, McGowran B (1999) Palaeoceanographic significance of recent
foraminiferal biofacies on the southern shelf of Western Australia: a preliminary
study. Palaeogeography, Palaeoclimatology, Palaeoecology 147: 101-120
McQuillan L (2006) Species richness, density and cover of sponge assemblages on
temperate reefs off Perth, Western Australia. MSc thesis. Edith Cowan University.
Perth, Australia
Molloy FJ, Bolton JJ (1996) The effects of wave exposure and depth on the morphology of
inshore populations of the Namibian kelp, Laminaria schinzii Foslie. Botanica
Marina 39: 525-531
Okey TA, Mahmoudi B (2002) An ecosystem model of the West Florida Shelf for use in
fisheries management and ecological research: Volume II. Model construction.
Florida Marine Research Institute, St. Petersburg, Florida
Okey TA (2003) Macrobenthic colonist guilds and renegades in Monterey Canyon (USA)
drift algae: Partitioning multidimensions. Ecological Monographs 73: 415-440
Olsgard F, Somerfield PJ (2000) Surrogates in marine benthic investigations, which
taxonomic unit to target? Journal of Aquatic Ecosystem Stress and Recovery 7: 25-
42
Pederson HG, Johnson CR (2006) Predation of the sea urchin Heliocidaris erythrogramma
by rock lobsters (Jasus edwardsii) in no-take marine reserves. Journal of
Experimental Marine Biology and Ecology 336: 120-134
Phillips JC, Kendrick GA, Lavery PA (1997) A test of a functional group approach to
detecting shifts in macroalgal communities along a disturbance gradient. Marine
Ecology Progress Series 153: 125-138
Riddle MJ, Alondi DM, Dayton PK, Hansen JA, Klumpp DW (1990) Detrital pathways in a
coral reef lagoon. I. Macrofaunal biomass and estimates of production. Marine
Biology 104: 109-118
31
Robertson AI, Lucas JS (1983) Food choice, feeding rates, and the turnover of macrophyte
biomass by a surf-zone inhabiting amphipod. Journal of Experimental Marine
Biology and Ecology 12:99-124
Robertson AI, Lenanton RCJ (1984) Fish community structure and food chain dynamics in
the surf-zone of sandy beaches: the role of detached macrophyte detritus. Journal of
Experimental Marine Biology and Ecology 84: 265-283
Searle DJ, Semeniuk V (1985) The natural sectors of the inner Rottnest Shelf coast
adjoining the Swan Coastal Plain. Journal of the Royal Society of Western Australia
67: 116-136
Steinberg P, Kendrick GA (1999) Kelp forests. University of New South Wales Press Ltd,
Sydney
Vanderklift MA, Kendrick GA (2004) Variation in abundances of herbivorous invertebrates
in temperate subtidal rocky reef habitats. Marine and Freshwater Research 55: 93-
103
Vanderklift MA, Ward TJ, Phillips JC (1998) Use of assemblages derived from different
taxonomic levels to select areas for conserving marine biodiversity. Biological
Conservation 86: 307-315
Waddington KI, Meeuwig JJ (submitted) Contribution of bait to lobster production in an
oligotrophic marine ecosystem Canadian Journal of Fisheries and Aquatic Science
Waite AM, Safi KA, Hall JA, Nodder SD (2000) Mass sedimentation of picoplankton
embedded in organic aggregates. Limnology and Oceanography 45: 87-97
Wernberg T, Coleman M, Fairhead A, Miller S, Thomsen M (2003a) Morphology of
Ecklonia radiata (Phaeophyta, Laminarales) along its geographic distribution in
south-western Australia and Australasia. Marine Biology 143: 47-55
Wernberg T, Kendrick GA, Phillips JC (2003b) Regional differences in kelp-associated
algal assemblages on temperate limestone reefs in south-western Australia.
Diversity and Distributions 9: 427-441
Wernberg T, Vanderklift MA, How J, Lavery PS (2006) Export of detached macroalgae
from reefs to adjacent seagrass beds. Oecologia 147: 692-701
Whitman RL, Nevers MB, Goodrich ML, Murphy PC, Davis BM (2004) Characterization
of Lake Michigan coastal lakes using zooplankton assemblages. Ecological
Indicators 4: 277–286

32
Zhou Y, Yang H, Zhang T, Liu S, Zhang S, Liu Q, Xiang J, Zhang F (2006) Influence of
filtering and biodeposition by the cultured scallop Chlamys farreri on
benthicpelagic coupling in a eutrophic bay in China. Marine Ecology Progress
Series 317: 127-141
Tables
Table 2.1: Categories used to classify habitat assemblage type.
Habitat code Habitat type
1 Mixed assemblage with Ecklonia radiata and sponge
2 Mixed assemblage with sponge/ no Ecklonia radiata
3 Mixed assemblage no Ecklonia radiata no sponge
4 Mixed assemblage with Ecklonia radiata no sponge
5 Brown algae (no Ecklonia radiata)
6 Reef structure with no visible algae
7 Rubble/ limestone with no visible algae
8 Sand
Table 2.2: Categories used to classify habitat coverage.
Coverage code Coverage Coverage
a High >70% of field of view
b Medium 30-70% of field of view
c Low <30% of field of view
Table 2.3. Pairwise comparisons showing differences in assemblage structure among
locations determined by towed video. Results considered significant at p<0.05.
Comparison Clarke’s R No. permutations p-value
Lancelin, Jurien Bay 0.46 999 0.002
Lancelin, Dongara 0.82 999 0.001
Jurien Bay, Dongara 0.36 999 0.002

33
Table 2.4: Pairwise comparisons showing differences in sponge and algae assemblages
determined by diver sampling. Results considered significant at p<0.05.
Comparison Clarke’s R No. permutations p-value
Lancelin, Jurien Bay 0.24 999 0.014
Lancelin, Dongara 0.68 999 0.001
Jurien Bay, Dongara 0.41 999 0.001
Table 2.5: Pairwise comparisons showing differences in macroinvertebrate community
composition between locations. Results considered significant at p<0.05.
Comparison Clarke’s R No. permutations p-value
Lancelin, Jurien Bay 0.16 999 0.04
Lancelin, Dongara 0.41 999 0.001
Jurien Bay, Dongara 0.214 999 0.002
Table 2.6. Two-way ANOVA testing the effect of the factors location and site on algal
biomass.
Source of Variation df SS MS F value p-value
Location 2 7.82 3.91 5.89 0.009
Site 4 7.35 1.84 2.77 0.052
Residual 23 15.27 0.66
Total 29 32.43 1.12
Table 2.7. Two-way ANOVA testing the effect of the factors location and site on sponge
biomass.
Source of Variation df SS MS F value p-value
Location 2 0.31 0.15 4.09 0.030
Site 4 0.15 0.04 0.99 0.432
Residual 23 0.86 0.04
Total 29 1.25 0.04

34
Table 2.8: Two-way ANOVA comparing total biomass of invertebrates between sites and
locations.
Source of Variation df SS MS F value p-value
Location 2 0.03 0.01 0.12 0.88
Site 4 0.08 0.02 0.18 0.94
Residual 23 2.56 0.11
Total 29 2.67 0.09
Table 2.9: Two-way PERMANOVA for differences in the co-ordinates of points on
constrained ordinations depending on location and method of classification. p-values were
generated from 999 permutations of raw data.
Source of Variation df SS MS Pseudo F p-value
Location 2 2.07 1.03 73.84 0.001
Method of classification 1 0.006 0.006 0.44 0.633
Location × Method 2 0.008 0.04 2.87 0.034
Residual 53 0.74 0.014
Total 58 2.89
Table 2.10: PERMDISP for differences in the dispersion of ordination points depending on
location. p-value was generated from 999 permutations of raw data.
Source of Variation F-value df 1 df 2 p-value
Location 0.34 2 56 0.726
Table 2.11: PERMDISP for differences in the dispersion of ordination points depending on
method of classification. p-value was determined from 999 permutations of raw data.
Source of Variation F-value df 1 df 2 p-value
Method of classification 2.75 1 57 0.133

35
Figures
Fig. 2.1: Showing dive sites and video transects at each of the three study locations.

36
Fig. 2.2: (a) MDS plot (square root transformed data) and (b) constrained ordination
(untransformed data) of sponge and algal assemblages at the three study locations
determined by towed video. Similarity determined using Bray-Curtis coefficient.

37
Fig. 2.3: (a) MDS plot (square root transformed data) and (b) constrained ordination
(untransformed data) of sponge and algal assemblages at the three study locations
determined by diver sampling. Similarity determined using Bray-Curtis coefficient.
Fig. 2.4: MDS plot of invertebrate community composition at Lancelin, Jurien Bay and
Dongara. Data were square root transformed and similarity determined using Bray-Curtis
coefficient.

38
Fig. 2.5. Mean biomass (± se) of algae and sponge at the three study locations.
Fig. 2.6: Mean biomass (± se) of macroinvertebrate groups at the three study locations.

39
Fig. 2.7: Relative distribution of points from constrained ordination plots.

SynthesisWhat is the role of western rock lobsters in these
deep-coastal ecosystems?
Chapter 2Where do the lobsters occur?Biotic composition of these
ecosystems
Stable Isotope Analysis
Gut content analysis
Chapter 3What do lobsters consume
in these ecosystems?
Chapter 7 Nutritional condition of lobsters
Chapter 6 Mass balance approach
What else do lobsters eat? Bait?
Chapter 4 P. cygnusConsumer-diet discrimination
Chapter 5 Sensitivity of variation in consumer-diet discrimination to calculated dietary composition
Appendix 2 Gut evacuation rates of western rock lobsters
Verification of Techniques
Appendix 3 Comparison of techniques for determining lobster nutritional condition
Chapter 2Where do the lobsters occur?Biotic composition of these
ecosystems
Stable Isotope Analysis
Gut content analysis
Chapter 3What do lobsters consume
in these ecosystems?
Stable Isotope Analysis
Gut content analysis
Chapter 3What do lobsters consume
in these ecosystems?
Chapter 7 Nutritional condition of lobsters
Chapter 6 Mass balance approach
What else do lobsters eat? Bait?
Chapter 4 P. cygnusConsumer-diet discrimination
Chapter 5 Sensitivity of variation in consumer-diet discrimination to calculated dietary composition
Appendix 2 Gut evacuation rates of western rock lobsters
Verification of Techniques
Appendix 3 Comparison of techniques for determining lobster nutritional condition

41
Chapter Three – Western rock lobsters (Panulirus cygnus George) in
Western Australian deep-coastal ecosystems (35-60 m) are more
carnivorous than those in shallow-coastal ecosystems.
Preamble: The following chapter has been accepted for publication in Estuarine, Coastal
and Shelf Science. Co-authors on this manuscript, Dr Lynda Bellchambers, Dr Mathew
Vanderklift and Prof. Diana Walker provided supervisory assistance while the study was
being undertaken and assistance with the editing of the manuscript.

42
Kris I Waddington
Lynda M Bellchambers
Mathew A Vanderklift
Diana I Walker
Abstract
The western rock lobster (Panurilus cygnus) is a conspicuous consumer in the coastal
ecosystems of temperate Western Australia. We used stable isotope analysis and gut
content analysis to determine the diet and trophic position of western rock lobsters from
mid-shelf coastal ecosystems (35-60 m depth) at three locations. Lobsters were primarily
carnivorous, and no consistent differences in diet were detected with varying lobster size,
sex or among locations. The main components of the diet were bait (from the fishery) and
small crustaceans — crabs and amphipods/isopods. Foliose red algae, bivalves/gastropods
and sponges were minor contributors to diet. The diet of lobsters in deep-coastal
ecosystems differed to results of previous studies of diets of lobsters from shallow water
ecosystems. In particular, coralline algae and molluscs — important prey in studies of
lobsters from shallow water — were minor components of the diet. These differences are
likely to reflect differences in food availability between these systems and potentially,
differences in choice of prey by lobsters that inhabit deeper water. Given the high
contribution of bait to lobster diet, bait is likely to be subsidizing lobster production in deep
coastal ecosystems during the fishing season.
Keywords
Trophic relationships; bait; carnivores; diet; Panulirus cygnus; deep-coastal ecosystems.

43
Introduction
Knowledge of species’ diets and trophic position is fundamental to understanding food
webs. The composition of a consumer’s diet provides insights into the transfer of energy
through food webs, and into the ultimate sources of production supporting food webs (Polis
and Strong, 1996). Trophic position provides a general framework for understanding the
direct and indirect interactions between predators and prey (Polis and Strong, 1996).
Spiny lobsters are abundant consumers in many coastal ecosystems and an understanding
the diet and trophic position of spiny lobsters is important as their feeding ecology can be
important in determining ecosystem structure (Tarr et al., 1996; Tegner and Dayton, 2000;
Shears and Babcock, 2002; Langlois et al., 2005). Predation by spiny lobsters has caused
differences in the abundance and size structure of their prey in New Zealand (Shears and
Babcock, 2002; Langlois et al., 2005; Langlois et al., 2006b), Tasmania (Pederson and
Johnson, 2006), South Africa (Tarr et al., 1996; Mayfield and Branch, 2000) and California
(Tegner and Levin, 1983). These changes in prey abundance can have indirect effects on
other elements of the ecosystem (e.g. Babcock et al., 1999).
The diet of spiny lobsters can change with lobster size (Goni et al., 2001; Mayfield et al.,
2001; Langlois et al., 2006b). Differences in choice of prey have been demonstrated for the
spiny lobster Jasus edwardsii, with larger lobsters tending to choose large prey and smaller
lobsters tending to choose small prey (Langlois et al., 2006b). Such patterns may relate to
an increased ability of larger lobsters to consume larger, hard-shelled prey (Robles et al.,
1990), although prey choice may also be influenced by a relationship between energetic
value of prey and energetic costs of prey capture and consumption (Hughes, 1980).
Changes in choice of prey with increases in lobster size has been shown to affect prey
community composition inside marine reserves where large lobsters are more abundant
(Langlois et al., 2006a).
The western rock lobster (Panulirus cygnus) is a conspicuous spiny lobster species endemic
to the west coast of Australia (Phillips, 1990). Previous studies have found that juvenile P.
cygnus consume a wide range of benthic biota including molluscs, polychaetes, small
44
crustaceans and coralline algae (Joll and Phillips, 1984; Edgar, 1990; Jernakoff et al.,
1993). However, these investigations have focused on shallow water ecosystems (<5 m
depth). The diet of lobsters in deeper coastal ecosystems (>35 m depth) has been poorly
studied. The size structure of lobsters in these deep-coastal ecosystems differ from those in
shallow water. Deeper coastal ecosystems are occupied by a greater proportion of adult
lobsters; approximately 25% of P. cygnus in deeper water (>35 m) are >80 mm carapace
length (unpublished catch and effort statistics, Department of Fisheries Western Australia
2007), while the proportion of >80 mm P. cygnus in shallow water (LD MacArthur,
unpublished data) is approximately 4%. In addition, approximately 40% of the commercial
catch of P. cygnus is taken from depths >35 m (unpublished catch and effort statistics,
Department of Fisheries Western Australia 2007). The differences in lobster size structure
between deep and shallow coastal ecosystems may therefore result in differences in diet,
and so differences in trophic interactions by lobsters. Because of this, the potential indirect
effects of fishing between shallow and deep-coastal ecosystems may differ in important
ways.
In this study, we used stable isotope and gut content analyses to determine the diet and
trophic position of Panulirus cygnus in deep-coastal (35-60 m depth) ecosystems. Stable
isotopes of carbon and nitrogen can help unravel complex food webs and identify important
trophic relationships within ecosystems (Fry, 1988; Jennings et al., 1997; Davenport and
Bax, 2002; Post, 2002). Analyses of gut contents provides dietary information on a shorter
time scale — between ingestion and assimilation of food (Overman and Parrish, 2001) —
and are also useful in verifying results from stable isotope analyses (Whitledge and Rabeni,
1997). The aim of this study was to determine diet and trophic position of P. cygnus,
focusing on whether the diet and trophic position of lobsters varied spatially, or according
to lobster size or sex.

45
Methods
Study area
This study was conducted at three locations on the west coast of Australia: Lancelin (30°
58.2 S, 114° 57.1 E), Jurien Bay (30° 12.5 S, 114° 39.1 E) and Dongara (29° 18.9 S, 114°
38.5 E). These locations span 200 km of coast near the center of the distribution of P.
cygnus. Four sites were selected at Lancelin and Jurien Bay and five sites were selected at
Dongara, with sites separated by at least 2 km. Sites contained higher relief than the
surrounding reef habitat, and were selected to maximize probability of encountering
lobsters. The sites were located 20-40 km from the shore in 35-60 m depth. The sea floor is
comprised of limestone reefs, which are remnants of Pleistocene/Holocene coastal sand
dunes (Seddon, 1972; Searle and Semeniuk, 1985). Offshore reefs are typically low relief
(<1 m relief) and are dominated by kelp, Ecklonia radiata, and sponges (Waddington,
unpublished data).
Collection
Divers breathing mixed gas (Enriched Air Nitrox, Trimix) from SCUBA apparatus
collected biota at each site between 28th March and 10th April 2006. For reef biota, the
entire contents of a 0.25m2 quadrat were removed using a paint scraper and placed in a
calico bag, ensuring no material was lost (n=2 per site for Dongara and Jurien Bay and n=3
per site for Lancelin). For sediment biota, cores (100 mm diameter × 200 mm deep) were
collected from sediment adjacent to the reef (n=2 for each site). Sample sizes are small,
reflecting the difficulty of sampling at these depths. At the completion of each dive,
samples were frozen for later sorting in the laboratory.
Lobsters were collected by the divers from three of the sites at each location. Lobsters were
collected within two hours of sunrise using a noose and were between 53.7 and 144.6 mm
carapace length (CL). Collection occurred soon after sunrise to minimise error associated
46
with variable evacuation rates of gut contents (Waddington, unpublished data). Following
collection, lobsters were immersed in an ice-slurry to induce a chill coma. Lobster size, sex
and moult stage were recorded. Lobster foreguts were then removed and frozen for later gut
content analysis. A sample of muscle tissue for stable isotope analysis was dissected from
the tail and frozen. Additional lobsters were collected from Jurien Bay using unbaited pots.
Pots were set overnight and retrieved within one hour of sunrise and foreguts and tail
muscle removed as described above. Baited pots were unsuitable for collecting lobsters for
gut content analysis as the lobsters fed on bait in the pots, and so gut contents would be
biased. Exclusion of the bait using ‘bait savers’ attracted isopods (Natatolana sp.), which
the lobsters fed on, also causing bias (Kris Waddington personal observation, 2005).
However, baited pots were suitable for collecting lobsters for stable isotope analysis, and
were used to collect additional lobsters from Lancelin and Dongara between 20th and 30th
April 2006.
Stable isotope analyses
In the laboratory, biota collected from quadrats and cores were defrosted, sorted, and
identified to at least family. Sediment cores were sieved and potential lobster prey
removed. Bulk tissue of macroalgae, muscle tissue from tails of lobsters, and whole (or
multiple whole) polychaetes, crabs, amphipods and isopods were used for stable isotope
analysis. The flesh of imported mackerel (Scomber spp.) and Australian pilchards
(Sardinops sagax Jenyns) – two baits commonly used in the fishery – were also analysed as
they were possible lobster dietary items. All samples were rinsed in de-ionised water,
placed in an oven at 60 °C until completely dry, then ground to a fine powder using a ball
mill grinder. Samples containing non-dietary carbonates (crabs, amphipods, isopods,
coralline algae) were treated with 1M HCl to dissolve these non-dietary carbonates (Bunn
et al. 1995).
Continuous-flow isotope ratio mass spectrometry using Europa Scientific (Roboprep-CN/
Tracermass and ANCA-NT/20-20 units) and Isogas Sira 9 Instruments were used to
measure δ15N and δ13C. Most samples were analysed in dual isotope mode, allowing δ15N
and δ13C to be measured simultaneously. Samples containing non-dietary carbonates were

47
analysed for δ15N prior to acid treatment, and analysed for δ13C after acid treatment.
Analytical precision of the instruments was 0.081‰ and 0.046‰ (± se) for δ15N and δ13C
respectively. Cornflour, lobster muscle tissue and turnip calibrated against IAEE reference
materials (IAEA-CH-6, IAEA-N-1, IAEA-N-2, USGS40, USGS41, USGS24) were used as
internal standards for stable isotope analysis
Defining lobster dietary sources
The mixing model software IsoSource (Phillips and Gregg, 2003) was used to determine
the contribution of each potential prey to lobster diet for each location (Lancelin n=25
lobsters, Jurien Bay n=19 lobsters, Dongara n=35 lobsters) (source increment 1%, tolerance
0.1). To reduce variability in mixing model outputs, we sought to combine similar diets
prior to analysis. Only taxonomically related groups with similar life histories and feeding
strategies were considered for combination (Phillips et al., 2005). The K nearest-neighbour
randomization test was used to test for differences in δ15N and δ13C isotope signatures of
those groups considered for combination (Rosing et al., 1998), and taxa were combined if
δ15N and δ13C were not significantly different (p<0.05).
The IsoSource method is appropriate when the number of dietary sources = i+2, where i is
the number of stable isotopes (Phillips and Gregg, 2003). While no unique solution for the
contribution of dietary sources exists, calculations yield the range of possible dietary source
contributions to lobster diet (Phillips and Gregg, 2003). Values for consumer-diet
discrimination (2.57‰ for δ15N and 3.20‰ for δ13C), determined from a separate
experiment (Waddington and MacArthur, submitted) were used to ‘adjust’ stable isotope
values before input to IsoSource. Sites within locations were pooled for these analyses.
Trophic position of lobsters
A continuous measure of trophic position of P. cygnus was calculated. Such measures of
trophic position are useful in ecological studies as assigning organisms to discrete levels
ignores processes such as omnivory and diet shifts (Polis and Strong, 1996; Vanderklift et

48
al., 2006). The following formula modified from (Vander Zanden et al., 1997) was used to
determine trophic position of lobsters:
57.2
1NδmacroalgaeNδlobsterPositionTrophic 1515 +−=,
where 2.57 is the average consumer-diet discrimination between lobster tail muscle tissue
and diet (Waddington and MacArthur, submitted).
Gut content analyses
Lobster foreguts were defrosted, blotted dry and weighed. After removing the gut contents,
the foregut membrane was blotted dry and re-weighed. A quantitative index of gut fullness
(GFI) was calculated for all lobsters collected by divers and using unbaited pots as
Mayfield et al., (2000)
(g)ight foregut we total
100(g) weight membraneforegut - (g)ight foregut we total GFI ×=.
The contents of lobster foreguts were rinsed into a 9.5 cm diameter petri dish and placed
over a sheet with 60 randomly marked dots. The item over each dot was then identified to
lowest possible taxonomic level using a dissecting microscope (6.4× – 40× magnification),
yielding a score out of a possible 60 for each prey (note that according to binomial
probability, 60 points gives a 95% chance of recording a prey that makes up 5% or more of
the gut contents (Vanderklift et al., 2006). The score for each prey was then multiplied by
100/60 to give percentage of each prey in the gut. Prey observed in the gut but not recorded
using this method were assigned a value of 1%. Due to breakdown of dietary items in
lobster guts, it was not always possible to identify prey to species level, and prey were more
frequently identified to family level. Amphipods and isopod fragments could not be
separated during identification so were combined.
All lobsters used in gut content analyses were in intermoult, and were caught by divers or
using unbaited pots. Analyses were further restricted to lobster foreguts with GFI >10 to
avoid biases introduced by individuals with guts containing few dietary items. Distance-
based multivariate multiple regression, DISTLM (Legendre and Anderson, 1999; McArdle
and Anderson, 2001) was used to test for relationships between gut content composition

49
and lobster size, sex, location of capture (Lancelin, Jurien Bay, Dongara), method of
capture (unbaited pot, diver) and gut fullness (GFI). The analysis was based on Bray-Curtis
dissimilarities and significance was determined by 4 999 permutations of the raw data.
Prey electivity
Ivlev’s index of prey electivity (Ivlev, 1961) was used to calculate electivity by P. cygnus.
Ivlev’s index of electivity (E) relates the proportional abundance of a prey on the benthos
(determined from quadrats and sediment cores collected by divers) relative to the
proportional abundance of that prey within a lobster gut as:
ii
ii
p r
p r (E)index sIvlev'
+
−=,
where ri represents the proportion of prey i on the benthos, and pi represents the proportion
of prey i in the gut of the lobster. Electivity of -1 indicates the prey is inaccessible, or there
is total selection against the prey, while electivity of +1 indicates there is complete
selection for the prey. A value near 0 indicates the item is consumed in proportion to its
abundance on the benthos. Electivity was calculated for prey making up >1 % of gut
contents. Due to insufficient sample size, lobsters at Lancelin and Dongara were not
considered. Ivlev’s index can be biased by different availability of food to predators, and by
differences in prey digestion rates (Kohler and Ney, 1982).
Results
Determination of diet using stable isotopes
The stable isotope values of the potential diets of western rock lobster were generally
consistent between locations (Figure 1a-c). The spread of values was similar for all three
locations (between -28‰ and -12‰ for δ13C and between 4‰ and 11‰ for δ15N).
However at Dongara (figure 1c), δ13C and δ15N of amphipods/isopods were higher than the

50
other two locations. Foliose red algae from Lancelin had lower δ13C, and higher δ15N than
foliose red algae from the other locations.
At all locations gut content analysis indicated that lobsters were omnivorous, preying on
amphipods/isopods, crabs, bait, foliose red algae and sponges. However, the proportional
contribution of each diet, as estimated by IsoSource, differed among the three locations
(Figure 2a-c). One consistent pattern was that bait, crabs, and amphipods/isopods were
likely to be important components of the diet at all locations. Bait was estimated to have
contributed between 30 and 57% of the diet of lobsters at Lancelin, between 62 and 79% at
Jurien Bay, and between 4 and 70% of diet of lobsters at Dongara. Crabs (Lancelin 0-50%;
Jurien Bay 0-26%; Dongara 0-76%), and amphipods/isopods (Lancelin 0-54%; Jurien Bay
0-23%; Dongara 0-52%) were also likely to be important diets at all three locations. Foliose
red algae (Lancelin 6-25%; Jurien Bay 2-13%; Dongara 0-13%) and sponges (Lancelin 0-
16%; Jurien Bay 0-11%; Dongara 0-15%) were likely to be of lesser importance. IsoSource
also estimated that lobsters at Dongara might also prey on molluscs (bivalves and/or
gastropods: 0-24%). These taxa were not observed in benthic samples collected from
Lancelin or Jurien Bay and so were not included in the IsoSource analyses.
Trophic position
The trophic position of lobsters was calculated relative to the δ15N value for macroalgae.
The δ15N values of red, green, and brown algae were consistent. Lobsters occupied the
trophic positions expected by a first-order predator, with trophic position at each location
between 1.90 and 2.18. Trophic positions varied significantly among locations (ANOVA: F
75, 2 = 7.724, p < 0.001), although the magnitude of differences was small. Post hoc Tukey
tests indicated that lobsters from Lancelin occupied a significantly higher trophic level
(2.18 ± 0.06, n=25) than lobsters from Dongara (1.90 ± 0.05, n=35) (p < 0.001) while
lobsters from Jurien Bay were intermediate (2.01 ± 0.04, n=18) and were not significantly
different to lobsters from either Lancelin or Dongara.
51
Gut content analysis
Neither size, sex, location of capture, method of capture, nor gut fullness index were found
to be significantly related to the composition of gut contents (n=30) (Tables 1 and 2). Thus
all locations were combined for further analysis. The composition of food items in lobster
foreguts were dominated by crabs (61.8%): bait (13.9%) and amphipods/isopods (9.1%)
were other important diet items (Figure 3). Bivalves/gastropods, foliose red algae, sponges,
and polychaetes each comprised less than 2% of gut contents (Figure 3).
Electivity
Lobsters at Jurien Bay exhibited clear electivity for some prey (Figure 4). Such differences
may result from selection for or against prey, differences in accessibility of prey, or
differences in evacuation rates of prey from lobster foreguts. Amphipods/isopods and crabs
were selected by lobsters and/or were highly available to lobsters when foraging.
Conversely, lobsters selected against polychaetes and/or polychaetes were less accessible to
the lobsters during foraging. Bivalves/gastropods were selected for, although not as
strongly as amphipods/isopods and crabs.
Discussion
At the locations sampled, western rock lobsters in deep coastal (35-60 m) ecosystems were
omnivorous, with a diet consisting mainly of crabs, amphipods/isopods and bait, and small
quantities of bivalves/gastropods, sponges and red algae. The diet of lobsters did not vary
with sex, size or among locations. While conclusions drawn in the current study are based
on data from a small number of quadrats and lobsters for gut content analyses, results of
this study provide important quantitative information regarding the diet of western rock
lobsters in previously inaccessible ecosystems.
Stable isotope analysis and gut content analysis indicated that bait is an important
component of lobster diet, contributing up to 80% of diet. Bait is available to the lobsters

52
while the lobsters are in the pots as well as in the form of discards from the fishing fleet.
The high relief sites we targeted will presumably also be targeted by fishermen, perhaps
increasing the bait input on a localized scale. In addition, our surveys occurred during the
months of April and May. While the commercial fishing season operates between 15th
November and 30th June, maximum fishing effort in deep-coastal ecosystems occurs
between January and May. Our survey occurred during peak fishing times in deep-coastal
ecosystems, suggesting the average contribution of bait to lobster diet over the entire year
may be lower. Considering the tissue turnover rate for decapod crustaceans is less than
three months (Fantle et al., 1999; Waddington and MacArthur, submitted), the high
contribution of bait determined from stable isotope analysis might reflect higher
consumption of bait during the fishing season. Nevertheless, given the likelihood of high
bait contribution to lobster diet, and the known positive relationship between growth rate
and food availability for Panulirus cygnus (Chittleborough, 1976), bait input is likely to
provide a significant subsidy to lobster growth in these ecosystems during the ~5 months
that the fishing fleet is present. Bait has also been shown to subsidise production of
American Lobsters (Homarus americanus) in the Gulf of Maine (Saila et al., 2002). In the
Gulf of Maine, bait was estimated to meet between one-quarter and one-third of lobster
food requirements (Saila et al., 2002), which is comparable to the results from the current
study. When present, bait appears to be highly elected for by the lobsters. High electivity of
bait by lobsters may be because lobster pots provide a ready source of food and shelter, two
important resources for spiny lobsters (Chittleborough, 1975; Eggleston and Lipcius, 1992).
However, due to spatial and temporal variability in bait addition, formal comparison of
electivity is not possible using Ivlev’s electivity index (Ivlev, 1961).
Bait is imported from outside the study area, meaning it represents a direct subsidy to
lobster production in these ecosystems (Saila et al., 2002). Addition of organic matter to
marine ecosystems has been shown to have consequences for the functioning of marine
ecosystems worldwide, primarily through the enhancement of secondary production from
trawl discards (Groenewold and Fonds 2000; Ramsay et al. 1997). It is highly likely that
addition of organic matter in the form of bait may be having similar effects in Western
Australian ecosystems, particularly given the oligotrophic nature of these systems
(Lenanton et al. 1991). Further studies should be undertaken to investigate the potential
effects of bait input in these systems.

53
The natural diet of western rock lobsters was dominated by crabs and amphipods/isopods,
with sponges, algae, gastropods/bivalves and polychaetes less important. Crabs and
amphipods/isopods were strongly selected for – or alternatively highly available to lobsters
– relative to gastropods/bivalves, polychaetes, sponges and foliose red algae. Given the
high biomass of sponges and red algae on the reef where lobsters were collected, the low
importance of red algae and sponges to lobster diet is likely due to low selection for these
taxa. Polychaetes and gastropods have previously been shown to be important lobster prey
in shallow water (Joll and Phillips, 1984; Edgar, 1990; Jernakoff et al., 1993), suggesting
the low proportion of these items observed in diet of lobsters in this study might be the
result of low availability. Bivalves and gastropods were not frequently observed in benthic
samples collected by divers in this study. While polychaetes were observed in samples
collected by divers, they were most frequently observed within sponges collected from the
benthos. A hypothesis for the low importance of polychaetes in lobster diet may relate to
the burrowing habit of polychaetes (Netto et al., 1999; Abdo, 2007), providing a refuge
from predation by lobsters.
The two techniques of dietary analysis employed in the current study gave differing
outcomes for the proportional contribution of prey to lobster diet. Analysis using stable
isotope data indicated bait was the most important component of lobster diet whereas gut
content analysis indicated crabs were more important. Observed differences likely reflect
the different time scales over which the two techniques calculate dietary composition
(Overman and Parrish, 2001) and the variability in evacuation rates of prey from lobster
guts (Waddington, submitted). Gut content analysis provides an indication of lobster diet
between ingestion and assimilation of prey whereas stable isotope analysis provides a time
integrated description of lobster diet over the time scale equivalent to the tissue turnover
rate of the tissue analysed (Kling et al., 1992; Overman and Parrish, 2001). At the time
lobsters were collected for gut content analysis crabs were the most important lobster prey.
When the diet of lobsters was integrated over a longer period, bait was more important to
lobster diet reflecting the spatial and temporal variability of bait input to these ecosystems.
The relative contribution of crabs to lobster diet determined from gut content analysis may
also be overestimated due to variability in evacuation rates of prey from lobster foreguts
(Waddington, submitted). A recent study indicated that prey with hard components were

54
more slowly evacuated from lobster foreguts relative to diet items without these hard
components (Waddington, submitted). This suggests the relative contribution of crabs and
bait may be overestimated in the current study relative to prey such as foliose red algae that
are rapidly evacuated from lobster guts.
Diet of western rock lobsters in the current study differs to diet of western rock lobsters
from shallow water ecosystems (<10 m) (Joll and Phillips, 1984; Edgar, 1990; Jernakoff et
al., 1993). Observed differences in diet between these ecosystems occur despite overlap in
the lobster size range. The size range of lobsters in the current study (between 53.7 and
144.6 mm CL) overlaps the size range of lobsters previously investigated from shallow
water (25 – 90 mm CL) (Edgar, 1990). Since differences in diet occur between shallow and
deep-coastal ecosystems (despite overlap in lobster size) it is unlikely lobster
size/ontogenetic stage is driving observed differences in lobster diet. Lobsters in deep-
coastal ecosystems predominantly consume animal prey (crabs, amphipods/isopods, and
bait), with algae less important to lobster nutrition. Observed differences in lobster diet
between shallow water and deep-coastal ecosystems are mirrored by the trophic positions
occupied by lobsters in these ecosystems. In deep-coastal ecosystems at Jurien Bay,
lobsters had a trophic position of 2.01 reflecting their role as secondary consumers in these
ecosystems. Lobsters from shallow water ecosystems at Jurien Bay had a trophic position
between 1.50 and 1.60 (Lachlan MacArthur, Edith Cowan University, personal
communication) reflecting the importance of plant sources (primarily coralline algae) to
lobsters in shallow water ecosystems (Joll and Phillips, 1984; Edgar, 1990; Jernakoff et al.,
1993).
Differences in lobster diet between shallow and deep-coastal ecosystems may reflect
differences in prey availability or prey choice between these ecosystems. Molluscs
comprise a high proportion of gut contents of lobsters from shallow water ecosystems (Joll
and Phillips, 1984; Edgar, 1990; Jernakoff et al., 1993), but were poorly represented in gut
contents in the current study. This low consumption of molluscs likely reflects low
abundances of molluscs in benthic samples collected from Lancelin and Jurien Bay. Two
species of coralline algae commonly consumed by lobsters in shallow water ecosystems
(Jania affinis and Amphiroa anceps) (Joll and Phillips, 1984) were not observed to be
consumed in the current study, despite being present in deep-coastal ecosystems (average
55
biomass ~80 g. m-2). This indicates differences in diet may also reflect differences in prey
choice between shallow and deep-coastal ecosystems.
Differences in lobster diet between shallow water and deep-coastal ecosystems have
implications when assessing the effect of lobster removal on these ecosystems. Removal of
spiny lobsters (through fishing) reduces predation pressure on lower trophic levels (Tegner
and Dayton, 2000). Differences in spiny lobster abundance due to differences in
exploitation rates have been shown to have detectable effects on abundance of spiny lobster
prey in California (Tegner and Levin, 1983), South Africa (Mayfield and Branch, 2000),
New Zealand (Shears and Babcock, 2002; Langlois et al., 2005), and Tasmania (Pederson
and Johnson, 2006). As lobsters inhabiting deep-coastal ecosystems are mostly carnivorous,
the interaction between lobsters and macroinvertebrates is likely stronger than the
interaction between lobsters and macroinvertebrate communities in shallow water
ecosystems where lobsters are omnivorous. Thus, when assessing impacts of fishing on
these ecosystems the effect of lobster removal on macroinvertebrate community
composition is likely to be greater in deep-coastal ecosystems where lobsters principally
consume macroinvertebrates. In shallow water ecosystems, lobster removal may have
weaker effects on macroinvertebrate community composition as lobsters also prey upon
coralline algae.
Acknowledgements
The authors wish to thank the divers, Dovid Clarke and Jeremiah Shultz, and the skipper
and crew of the vessel Southern Image. We also wish to thank Scott Evans for his help with
field collection and coordination. Lachlan MacArthur provided helpful comments on an
earlier version of this manuscript. Funding for this research was provided by the Fisheries
Research and Development Corporation (FRDC 2004/049), and the School of Plant
Biology at the University of Western Australia. This project has UWA animal ethics
approval (Approval number RA/3/100/478).

56
References
Abdo, D., 2007. Endofauna differences between two temperate marine sponges
(Demospongiae; Haplosclerida; Chalinidae) from southwest Australia. Marine
Biology 152: 845-854.
Babcock, R.C., Kelly, S., Shears, N.T., Walker, J.W., Willis, T.J., 1999. Changes in
community structure in temperate marine reserves. Marine Ecology Progress Series
189: 125-134.
Bunn, S.E., Loneragan, N.R., Kempster, M.A., 1995. Effects of acid washing on stable
isotope ratios of C and N in penaeid shrimp and seagrass: Implications for food-web
studies using multiple stable isotopes. Limnology and Oceanography 40: 622-625.
Chittleborough, R.G., 1975. Environmental factors affecting growth and survival of
juvenile western rock lobsters Panulirus longipes (Milne-Edwards). Australian
Journal of Marine and Freshwater Research 26: 177-196.
Chittleborough, R.G., 1976. Growth of juvenile Panulirus longipes cygnus George on
coastal reefs compared with those reared under optimal environmental conditions.
Australian Journal of Marine and Freshwater Research 27: 279-295.
Davenport, S.D., Bax, N.J., 2002. A trophic study of a marine ecosystem off southeastern
Australia using stable isotopes of carbon and nitrogen. Canadian Journal of
Fisheries and Aquatic Sciences 59: 514-530.
Edgar, G.J., 1990. Predator-prey interactions in seagrass beds. I. The influence of
macrofaunal abundance and size-structure on the diet and growth of the western
rock lobster Panulirus cygnus George. Journal of Experimental Marine Biology and
Ecology 139: 1-22.
Eggleston, D.B., Lipcius, R.N., 1992. Shelter selection by spiny lobster under variable
predation risk, social conditions, and shelter size. Ecology 73: 992-1011.
Fantle, M.S., Dittel, A.I., Schwalm, S.M., Epifanio, C.E., Fogel, M.L., 1999. A food web
analysis of the juvenile blue crab, Callinectes sapidus using stable isotopes in whole
animals and individual amino acids. Oecologia 120: 416-426.
Fry, B., 1988. Food web structure on Georges Bank from stable C, N, and S isotopic
compositions. Limnology and Oceanography 33: 1182-1190.
Goni, R., Quetglas, A., Renones, O., 2001. Diet of the spiny lobster Panulirus elephas
(Decapoda: Palinuridea) from the Columbretes Islands Marine Reserve (north-
57
western Mediterranean). Journal of the Marine Biological Association of the United
Kingdom 81: 347-348.
Groenewold, S., Fonds, M., 2000. Effects on benthic scavengers of discards and damaged
benthos produced by the beam-trawl fishery in the southern North Sea. ICES
Journal of Marine Science 57: 1395-1406.
Hughes, R.N., 1980. Optimal foraging theory in a marine context. Oceanography and
Marine Biology Annual Review 18: 423-481.
Ivlev, V.S., 1961. Experimental ecology of the feeding of fishes. Yale University Press,
New Haven, Connecticut, 302 pp.
Jennings, S., Renones, O., Morales-Nin, B., Polunin, N.V.C., Moranta, J., Coll, J., 1997.
Spatial variation in the 15N and 13C stable isotope composition of plants,
invertebrates and fishes on Mediterranean reefs: implications for the study of
trophic pathways. Marine Ecology Progress Series 146: 109-116.
Jernakoff, P., Phillips, B.F., Fitzpatrick, J.J., 1993. The diet of post-puerulus western rock
lobster, Panulirus cygnus George, at Seven Mile Beach, Western Australia.
Australian Journal of Marine and Freshwater Research 44: 649-655.
Joll, L.M., Phillips, B.F., 1984. Natural diet and growth of juvenile western rock lobster
Panulirus cygnus George. Journal of Experimental Marine Biology and Ecology 75:
145-169.
Kling, G.W., Fry, B., O'Brien, W.J., 1992. Stable isotopes and planktonic trophic structure
in arctic lakes. Ecology 73: 561-566.
Kohler, C.C., Ney, J.J., 1982. A comparison of methods for quantitative analysis of feeding
selection of fishes. Environmental Biology of Fishes 7: 363-368.
Langlois, T.J., Anderson, M.J., Babcock, R.C., 2005. Reef-associated predators influence
adjacent soft-sediment communities. Ecology 86: 1508-1519.
Langlois, T.J., Anderson, M.J., Babcock, R.C., Kato, S., 2006a. Marine reserves
demonstrate trophic interactions across habitats. Oecologia 147: 134-140.
Langlois, T.J., Anderson, M.J., Brock, M., Murman, G., 2006b. Importance of rock lobster
size-structure for trophic interactions: choice of soft-sediment bivalve prey. Marine
Biology 149: 447-454.
Legendre, P., Anderson, M.J., 1999. Distance-based redundancy analysis: testing
multispecies responses in multifactorial ecological experiments. Ecological
Monographs 69: 1-24.
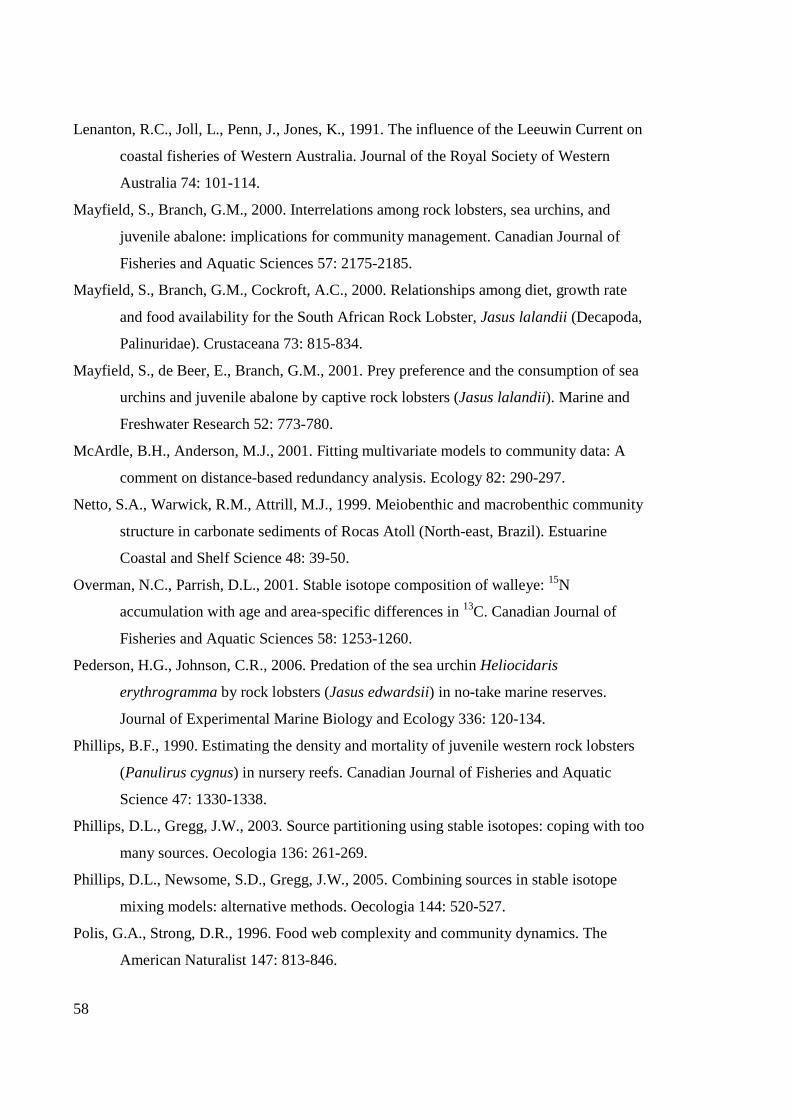
58
Lenanton, R.C., Joll, L., Penn, J., Jones, K., 1991. The influence of the Leeuwin Current on
coastal fisheries of Western Australia. Journal of the Royal Society of Western
Australia 74: 101-114.
Mayfield, S., Branch, G.M., 2000. Interrelations among rock lobsters, sea urchins, and
juvenile abalone: implications for community management. Canadian Journal of
Fisheries and Aquatic Sciences 57: 2175-2185.
Mayfield, S., Branch, G.M., Cockroft, A.C., 2000. Relationships among diet, growth rate
and food availability for the South African Rock Lobster, Jasus lalandii (Decapoda,
Palinuridae). Crustaceana 73: 815-834.
Mayfield, S., de Beer, E., Branch, G.M., 2001. Prey preference and the consumption of sea
urchins and juvenile abalone by captive rock lobsters (Jasus lalandii). Marine and
Freshwater Research 52: 773-780.
McArdle, B.H., Anderson, M.J., 2001. Fitting multivariate models to community data: A
comment on distance-based redundancy analysis. Ecology 82: 290-297.
Netto, S.A., Warwick, R.M., Attrill, M.J., 1999. Meiobenthic and macrobenthic community
structure in carbonate sediments of Rocas Atoll (North-east, Brazil). Estuarine
Coastal and Shelf Science 48: 39-50.
Overman, N.C., Parrish, D.L., 2001. Stable isotope composition of walleye: 15N
accumulation with age and area-specific differences in 13C. Canadian Journal of
Fisheries and Aquatic Sciences 58: 1253-1260.
Pederson, H.G., Johnson, C.R., 2006. Predation of the sea urchin Heliocidaris
erythrogramma by rock lobsters (Jasus edwardsii) in no-take marine reserves.
Journal of Experimental Marine Biology and Ecology 336: 120-134.
Phillips, B.F., 1990. Estimating the density and mortality of juvenile western rock lobsters
(Panulirus cygnus) in nursery reefs. Canadian Journal of Fisheries and Aquatic
Science 47: 1330-1338.
Phillips, D.L., Gregg, J.W., 2003. Source partitioning using stable isotopes: coping with too
many sources. Oecologia 136: 261-269.
Phillips, D.L., Newsome, S.D., Gregg, J.W., 2005. Combining sources in stable isotope
mixing models: alternative methods. Oecologia 144: 520-527.
Polis, G.A., Strong, D.R., 1996. Food web complexity and community dynamics. The
American Naturalist 147: 813-846.
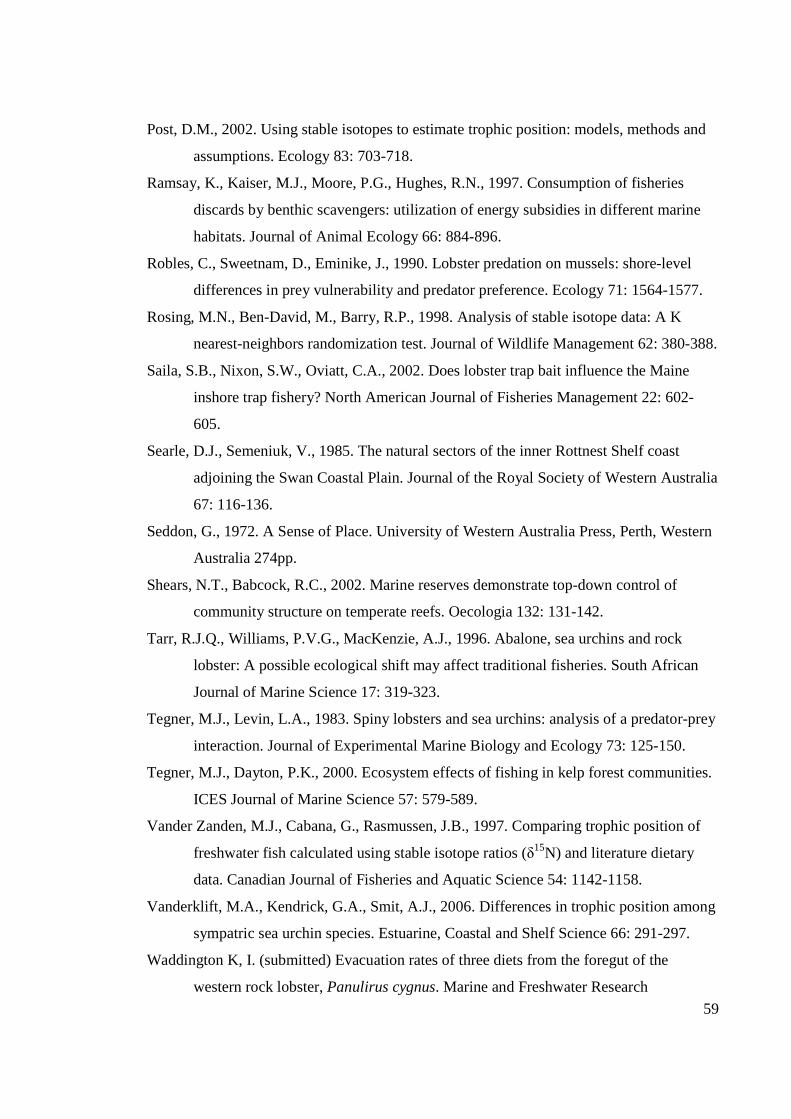
59
Post, D.M., 2002. Using stable isotopes to estimate trophic position: models, methods and
assumptions. Ecology 83: 703-718.
Ramsay, K., Kaiser, M.J., Moore, P.G., Hughes, R.N., 1997. Consumption of fisheries
discards by benthic scavengers: utilization of energy subsidies in different marine
habitats. Journal of Animal Ecology 66: 884-896.
Robles, C., Sweetnam, D., Eminike, J., 1990. Lobster predation on mussels: shore-level
differences in prey vulnerability and predator preference. Ecology 71: 1564-1577.
Rosing, M.N., Ben-David, M., Barry, R.P., 1998. Analysis of stable isotope data: A K
nearest-neighbors randomization test. Journal of Wildlife Management 62: 380-388.
Saila, S.B., Nixon, S.W., Oviatt, C.A., 2002. Does lobster trap bait influence the Maine
inshore trap fishery? North American Journal of Fisheries Management 22: 602-
605.
Searle, D.J., Semeniuk, V., 1985. The natural sectors of the inner Rottnest Shelf coast
adjoining the Swan Coastal Plain. Journal of the Royal Society of Western Australia
67: 116-136.
Seddon, G., 1972. A Sense of Place. University of Western Australia Press, Perth, Western
Australia 274pp.
Shears, N.T., Babcock, R.C., 2002. Marine reserves demonstrate top-down control of
community structure on temperate reefs. Oecologia 132: 131-142.
Tarr, R.J.Q., Williams, P.V.G., MacKenzie, A.J., 1996. Abalone, sea urchins and rock
lobster: A possible ecological shift may affect traditional fisheries. South African
Journal of Marine Science 17: 319-323.
Tegner, M.J., Levin, L.A., 1983. Spiny lobsters and sea urchins: analysis of a predator-prey
interaction. Journal of Experimental Marine Biology and Ecology 73: 125-150.
Tegner, M.J., Dayton, P.K., 2000. Ecosystem effects of fishing in kelp forest communities.
ICES Journal of Marine Science 57: 579-589.
Vander Zanden, M.J., Cabana, G., Rasmussen, J.B., 1997. Comparing trophic position of
freshwater fish calculated using stable isotope ratios (δ15N) and literature dietary
data. Canadian Journal of Fisheries and Aquatic Science 54: 1142-1158.
Vanderklift, M.A., Kendrick, G.A., Smit, A.J., 2006. Differences in trophic position among
sympatric sea urchin species. Estuarine, Coastal and Shelf Science 66: 291-297.
Waddington K, I. (submitted) Evacuation rates of three diets from the foregut of the
western rock lobster, Panulirus cygnus. Marine and Freshwater Research

60
Waddington K, MacArthur L (submitted) Diet quality and tissue type influence diet-
consumer discrimination in captive reared rock lobsters (Panulirus cygnus). Marine
Biology
Whitledge, G.W., Rabeni, C.F., 1997. Energy sources and ecological role of crayfishes in
an Ozark stream; Insights from stable isotopes and gut analysis. Canadian Journal of
Fisheries and Aquatic Science 54: 2555-2562.
Tables
Table 1: Distance-based multivariate multiple regression (DISTLM) testing for the
significance of the amount of variation in the composition of lobster guts contents that was
explained by lobster size, lobster sex, location of capture, and method of capture. p-value
determined by 4,999 permutations of the raw data.
Source of Variation df SS MS pseudo F p value
Factors 5 12 268 2 453 1.30 0.216
Residual 19 35 749 1 881
Total 24
Table 2: Percentage of diet categories in lobster foreguts at each location. All lobsters were
caught by divers or in unbaited pots.
Lancelin
n=5
53.7-114.5 mm CL
Jurien Bay
n=19
54.1-81.9 mm CL
Dongara
n=6
64.1-144.6 mm CL
Prey Item mean (± se) mean (± se) mean (± se)
Crab 79.2 ± 10.6 54.9 ± 8.6 79.9 ± 7.2
Amphipods / Isopods 6.1 ± 4.7 10.0 ± 5.6 3.3 ± 3.1
Bait 8.0 ± 3.2 18.3 ± 7.4 8.9 ± 3.0
Sediment 0 9.4 ± 4.5 0
Bivalves/Gastropods 0.6 ± 0.4 1.6 ± 0.6 7.8 ± 4.8
Algae 2.2 ± 1.7 0.7 ± 0.3 0
Sponge 2.2 ± 1.7 0.9 ± 0.4 0

61
Figures
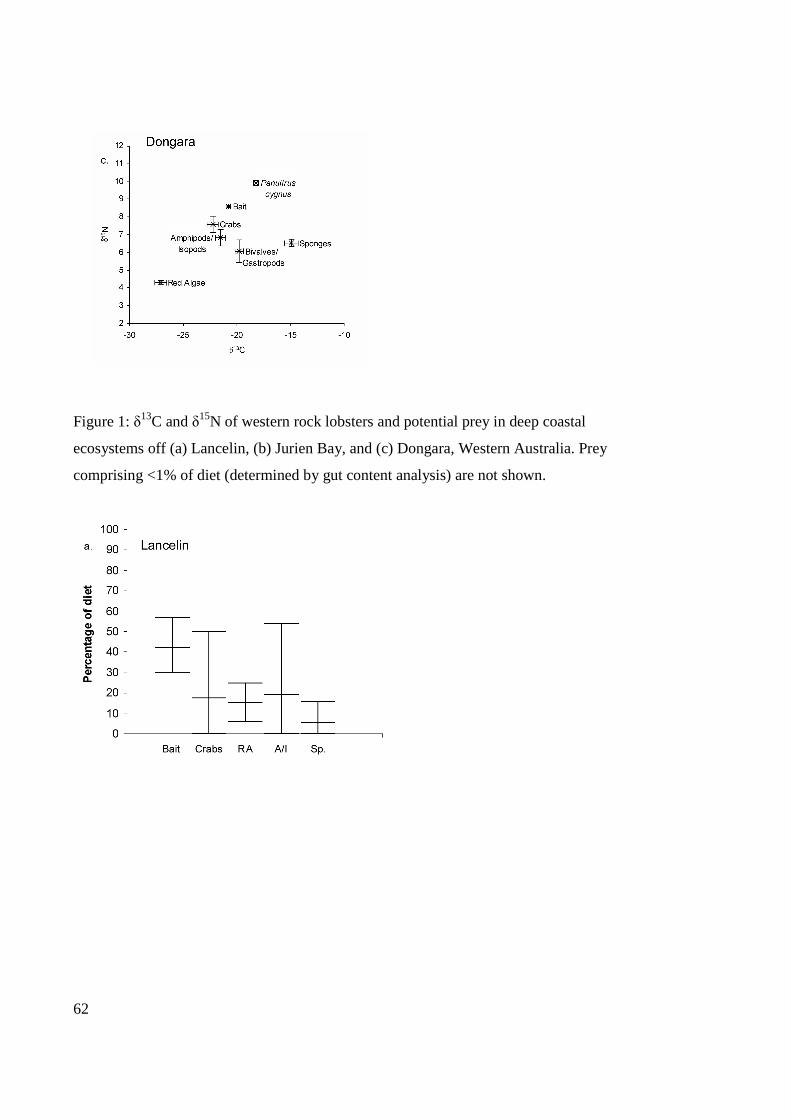
62
Figure 1: δ13C and δ15N of western rock lobsters and potential prey in deep coastal
ecosystems off (a) Lancelin, (b) Jurien Bay, and (c) Dongara, Western Australia. Prey
comprising <1% of diet (determined by gut content analysis) are not shown.
63
Figure 2: Contribution of prey to diet of lobsters collected from (a) Lancelin (b) Jurien Bay
and (c) Dongara. Prey contribution calculated using IsoSource. Outside tick marks
represent range of feasible proportions (1-99%). Midline represents mean of feasible
proportions. RA = Red Algae, A/I = Amphipods/Isopods, Sp. = Sponge, B/G =
Bivalves/Gastropods.

64
Figure 3: Percentage (mean ± se, n=30) of diet categories in lobster foreguts at all locations.
All lobsters were caught by divers or in unbaited pots. Diet categories comprising <1% of
diet are not shown on graph. A/I = Amphipods/Isopods, Sed. = Sediment, B/G =
Bivalves/Gastropods.
Figure 4: Ivlev’s index of prey electivity for taxa observed in the guts of lobsters collected
from Jurien Bay (n=19). A/I = Amphipods/Isopods, Cr. = Crabs, RA = Red Algae, Poly =
Polychaetes, B/G = Bivalves/Gastropods.

65

SynthesisWhat is the role of western rock lobsters in these
deep-coastal ecosystems?
Chapter 2Where do the lobsters occur?Biotic composition of these
ecosystems
Stable Isotope Analysis
Gut content analysis
Chapter 3What do lobsters consume
in these ecosystems?
Chapter 7 Nutritional condition of lobsters
Chapter 6 Mass balance approach
What else do lobsters eat? Bait?
Chapter 4 P. cygnusConsumer-diet discrimination
Chapter 5 Sensitivity of variation in consumer-diet discrimination to calculated dietary composition
Appendix 2 Gut evacuation rates of western rock lobsters
Verification of Techniques
Appendix 3 Comparison of techniques for determining lobster nutritional condition
Chapter 2Where do the lobsters occur?Biotic composition of these
ecosystems
Stable Isotope Analysis
Gut content analysis
Chapter 3What do lobsters consume
in these ecosystems?
Stable Isotope Analysis
Gut content analysis
Chapter 3What do lobsters consume
in these ecosystems?
Chapter 7 Nutritional condition of lobsters
Chapter 6 Mass balance approach
What else do lobsters eat? Bait?
Chapter 4 P. cygnusConsumer-diet discrimination
Chapter 5 Sensitivity of variation in consumer-diet discrimination to calculated dietary composition
Appendix 2 Gut evacuation rates of western rock lobsters
Verification of Techniques
Appendix 3 Comparison of techniques for determining lobster nutritional condition
67
Chapter Four - Diet quality and tissue type influence consumer-diet
discrimination in captive reared rock lobsters (Panulirus cygnus George).
Preamble: This chapter has been submitted for publication to Marine Biology. All research
presented in this manuscript was undertaken in conjunction with Lachlan MacArthur, PhD
Candidate at Edith Cowan University, Perth, Western Australia. Equal contributions were
made to all work presented in this manuscript.
68
Kris Waddington
Corresponding author
M090 School of Plant Biology
The University of Western Australia
35 Stirling Highway
Crawley 6009.
Tel: +61 8 6488 7919
Fax: +61 8 6488 1001
Email address: [email protected]
Lachlan MacArthur
Center for Ecosystem Management, School of Natural Sciences,
Edith Cowan University
100 Joondalup Drive
Joondalup, Western Australia 6027.
Email address: [email protected]
Abstract
Fundamental to the accuracy of stable isotope analysis in trophodynamic studies is the
ability to predict discrimination between a consumer and its diet. Despite the widespread
use of stable isotope analysis in trophic ecology, uncertainty still surrounds the factors
affecting consumer-diet discrimination. Here we present evidence that diet quality and
location of muscle tissue analysed affects the consumer-diet discrimination for the western
rock lobster, Panulirus cygnus. Consumer-diet δ15N and δ13C discrimination for western
rock lobster tail tissue were 1.67-2.97‰ and 2.92-3.60‰ respectively, with δ13C
discrimination differing to values reported in the literature. Differences in nitrogen and
carbon discrimination were observed between tail and leg tissue of lobsters of 1.22‰ and
1.13‰ respectively. Diet quality was also found to affect consumer-diet discrimination,
with high protein pilchard diet leading to lower δ15N and higher δ13C discrimination. Diet
quality should be considered as a factor that has the potential to affect consumer-diet
discrimination when interpreting results from stable isotope studies.

69
Introduction
The ability to predict consumer-diet discrimination in stable isotopes of carbon and
nitrogen (differences in δ15N and δ13C between a consumers’ tissue relative to its diet
(Minagawa and Wada 1984; Robinson 2001)) has allowed ecologists to unravel complex
trophic interactions (eg. Rounick and Winterbourne, 1986, Davenport and Bax, 2002).
Predictable patterns in consumer-diet δ13C discrimination allows us to identify important
sources of production to higher consumers (DeNiro and Epstein 1978), while patterns in
consumer-diet δ15N discrimination allow us to determine the trophic position occupied by
consumers (DeNiro and Epstein 1981; Post 2002).
Early studies indicated δ13C consumer-diet discrimination exhibited little variability (0-1‰
between trophic levels) (DeNiro and Epstein 1978; McConnaughey and McRoy 1979),
however more recently, measures of consumer-diet δ13C discrimination have been
suggested to be more variable than first thought (between -10‰ and 2.8‰) (Checkley and
Entzeroth 1985; Crawley et al. 2007). Similarly, consumer-diet δ15N discrimination has
been observed to be highly variable, ranging from -3.22‰ to 9.2‰ (DeNiro and Epstein
1981; Oelbermann and Scheu 2002).
A number of factors have been identified as contributing to variability in δ15N and δ13C
discrimination. Variation in consumer-diet δ13C discrimination has been suggested to
depend on organism diet, respiration rate and tissue type (Hobson and Clark 1992; Pinnegar
and Polunin 1999; Hobson and Bairlein 2003; McCutchan Jr et al. 2003). Similarly,
variation in δ15N discrimination has been shown to vary depending on organism diet, mode
of excretion, taxon, nutritional condition and tissue type (Fantle et al. 1999; Pinnegar and
Polunin 1999; Ponsard and Averbuch 1999; Vanderklift and Ponsard 2003).
The effect of muscle tissue type and diet quality on consumer-diet discrimination is known
to be large, but unpredictable (eg. Fantle et al. 1999; Pinnegar and Polunin 1999). While
tissue type has been determined to affect both δ13C and δ15N discrimination (DeNiro and
Epstein 1978; DeNiro and Epstein 1981; Tieszen et al. 1983; Pinnegar and Polunin 1999;
Schmidt et al. 2004; Seminoff et al. 2006), considerably less research effort has focused on

70
the influence of the location of muscle tissue on discrimination (Pinnegar and Polunin
1999). Muscle tissue is a common tissue used for ecological studies conducted on many
taxa including fish, birds, mammals, and crustaceans (Fry and Parker 1979; Bunn et al.
1995; Davenport and Bax 2002). If the δ13C or δ15N discrimination is variable for the same
tissue type taken from different parts of the body, this will affect results gathered from
trophodynamic studies.
The effect of diet quality on consumer-diet discrimination is also largely unknown, despite
the fact that diet quality may vary spatially or temporally in the wild. Knowledge of the
effect of diet quality on consumer-diet discrimination will be useful in refining
discrimination values for consumers where diet quality is known to vary on spatial or
temporal scales.
Due to known variability in discrimination with tissue type, measures of discrimination
must be used corresponding to the tissue type sampled to ensure accurate interpretation of
results from ecological studies. While variation in discrimination between tissue types of an
organism are well documented (Meyer-Rochow et al. 1992; Hobson 1995; Pinnegar and
Polunin 1999; Seminoff et al. 2006), few studies have sought to determine the variability
within muscle tissue taken from different parts of an organism. Pinnegar and Polunin
(1999) determined that variability between muscle tissues of an organism can be
considerable, prompting us to compare discrimination between white muscle tissues in our
study.
Diet quality has been shown to affect consumer-diet δ13C and δ15N discrimination (Dittel et
al. 2000). Quality of diet items available to consumers in the wild is known to vary both
spatially and temporally (eg. Joll and Phillips 1984). Thus, the effect of diet quality on the
consumer-diet discrimination should be investigated to account for observed variability in
discrimination with diet quality that may otherwise introduce error into results from trophic
studies. Carbon to nitrogen ratios (C:N) can be used to indicate diet quality (Fantle et al.
1999). As nitrogen is mostly present as protein, diets with a low C:N ratio contain a greater
proportion of protein and are of higher quality to a consumer relative to diets with a high
C:N ratio (Fantle et al. 1999).

71
We use the western rock lobster (Panulirus cygnus George) to determine the effect of
location of muscle tissue and diet quality on consumer-diet discrimination. The western
rock lobster is a spiny lobster species distributed along the west coast of Western Australia
between Cape Leeuwin (34° 22’ S, 115° 8’ E) and North West Cape (21° 48’ S, 114° 9’ E)
(Chittleborough 1970). This species is highly abundant along its distributional range,
forming the basis of Australia’s largest single species fishery with over 14 000 tonnes
caught during the 2004/2005 fishing season (Fletcher and Head 2006). Western rock
lobsters are known to consume a wide variety of plant and animal material, including
coralline algae, seagrass, and a wide variety of macroinvertebrate fauna (Joll and Phillips
1984; Edgar 1990; Jernakoff et al. 1993).
The current study aims to determine the effect of muscle tissue location and diet quality on
the consumer-diet discrimination of western rock lobsters. Specifically we will test the
following null hypotheses. (i) Muscle tissue location does not affect consumer-diet
discrimination, and (ii) diet quality does not affect consumer-diet discrimination.
Materials and Methods
Pre-Experiment
Lobsters were collected as post-puerulus and raised on a diet of pellets and the mussel,
Mytilus edulis (Johnston et al. 2007). Prior to the experiment commencing, lobsters were
kept in four circular tanks, 1 m diameter, 0.8 m deep for 30 days to acclimate. At the
commencement of experiments, lobsters were juveniles, approximately two years post-
puerulus and between 54.6 and 61.1 mm carapace length (CL).
Experimental design
Following acclimation, individual lobsters were randomly allocated to one of eight tanks
(0.6 m × 0.4 m × 0.44 m). Each tank was split into two compartments (0.3 m × 0.4 m × 0.4

72
m) using a shade-cloth and PVC screen, with one lobster per compartment. The PVC screen
prevented exchange of food particles but not water between compartments. Exchange of
water between compartments was important as spiny lobsters are gregarious animals
(Atema and Cobb 1980; Cobb 1981), with conspecific detection occurring via chemical
cues (Zimmer-Faust and Spanier 1987).
Plastic mesh was attached to partitions in the center of tanks to form a roof under which
lobsters could shelter. Filtered seawater was added to tanks at constant rates of 72 L. hr-1.
Lighting was ambient (approx 14 hours light/ 10 hours dark). Seawater input was directly
from the ocean and unheated, meaning water temperatures were consistent with
temperatures experiences in coastal lagoons in this region during this time of year (between
19 °C to 21 °C over the course of the experiment). The experiment was run for 119 days
(17 weeks), from 16th January 2006 until 15th May 2006.
Diet Manipulation
Prior to commencement of experiment, four lobsters were sacrificed and tail and leg tissue
samples taken for stable isotope analysis. The remaining 16 lobsters had one of four diets
randomly allocated to them. Diets of differing qualities (C:N ratio) were used. We used
C:N ratios as a proxy for diet quality, as a diet with low C:N ratio will presumably have a
higher proportion of protein (Dittel et al. 2000).
Diets fed to lobsters were (i) mussels (Mytilus edulis) (supplier – Blue lagoon mussels,
Rockingham, Western Australia), (ii) Australian pilchards (Sardinops sagax) (WA bait
supply, O’Connor, Western Australia), (iii) coralline algae (Amphiroa gracilis) (collected
from Marmion lagoon (31° 44′ S, 115° 40′ E)) and, (iv) a mussel/ coralline algae mix
(mussels and coralline algae fed to lobsters on alternate weeks). These diets are
representative of diets consumed in the wild. All diets were collected at the same time and
frozen to minimise variation in isotopic signature over time. Frozen diet samples did not
differ in isotopic signature between t0, t65, and t119 (one-way ANOVAs; p > 0.20). The
pilchard diet was significantly higher in δ15N than both mussels and coralline algae (one-
way ANOVA; F2, 9 = 57.87, p < 0.001) and lower in δ13C relative to mussels and algae

73
(one-way ANOVA; F2, 9 = 2.14, p = 0.029), whilst coralline algae had a higher C:N ratio
than mussels and pilchards (one-way ANOVA; F2, 12, p = 0.03) (Table 1). Mussels and
coralline algae did not significantly differ in δ15N or δ 13C (Tukey test, p > 0.05). Lobsters
were fed daily to excess, with uneaten food removed prior to the addition of fresh food. At
the commencement of the experiment (t0) and 32, 64, 96, and 119 days later a randomly
chosen leg was removed to identify changes in δ15N or δ13C over time. Limb loss amongst
crustaceans is a natural process termed autotomy (Robinson et al. 1970). At the conclusion
of the experiment, samples of tail tissue were taken from all lobsters for stable isotope
analysis.
Assessment of lobster condition
At the conclusion of the experiment, blood protein concentration of lobsters was
determined using a protein refractometer. Blood protein concentration provides a measure
of lobster nutritional condition (Dall 1974), allowing the condition of lobsters fed the
different diets to be compared. This comparison was made using one-way ANOVA.
Tissue Analysis
Leg and tail white muscle tissues were washed using de-ionised water before being dried in
an oven at 60°C for 72 hours. Tissue was then ground in a ball mill grinder before being
stored in centrifuge tubes in a dessicator. δ15N and δ13C were measured by continuous-flow
isotope ratio mass spectrometry using ANCA-NT (Europa Scientific, Crewe, UK)
interfaced with a 20-20 isotope ratio mass spectrometer (Europa Scientific, Crewe, UK).
Lobster, mussel and pilchard samples were analysed in dual isotope mode, allowing δ15N
and δ13C to be determined simultaneously. Coralline algae samples were analysed for δ15N
prior to treatment with 1M HCl to remove inorganic carbonates, then re-analysed for δ13C.
We used fish flesh standardised against IAEE reference materials (IAEA-CH-6, IAEA-N-1,
IAEA-N-2, USGS40, USGS41, USGS24) as our internal standard for SI analysis.
Analytical precision of the instruments was 0.04 (s.e) and 0.07 (s.e) for δ15N and δ13C
respectively.

74
Data Analysis
As leg and tail tissue was taken from the same experimental lobster at the completion of the
experiment, a split-plot ANOVA was used to compare δ15N and δ13C discrimination (at 119
days) with the factors diet (fixed factor, four levels), and tissue location (fixed factor, two
levels). Where differences between factors were detected, post hoc Tukey tests were used
to determine which levels of factors were significantly different.
A two-way repeated measures ANOVA was performed with diet type and time as factors to
determine if δ15N or δ13C of leg tissue changed between sampling times for lobsters fed
different diets. Bonferonni pairwise comparisons and separate one-way repeated measures
ANOVAs were used to further investigate significant differences highlighted in the two-
way design. All data were first checked for homogeneity of variance using Levene’s test
before analysis and were found to be homogenous.
Comparison of results to wild captured lobsters
To ensure any differences in δ15N and δ13C discrimination between tail and leg tissue
observed in the laboratory were applicable to wild populations, 40 lobsters were captured
from wild populations and had leg and tail tissue analysed. Differences in isotopic values
between leg and tail tissue (δ15Ntail – δ15Nleg and δ13Ctail – δ13Cleg) were compared between
laboratory and wild caught lobster using a one-way ANOVA.
Results
Assessment of lobster condition
The blood protein concentration of lobsters from different treatments did not differ (Table
2), indicating the health of lobsters fed different diets was comparable at the end of the
experiment.
75
Variation in δ15N and δ13C discrimination between muscle tissues
Consumer-diet δ15N discrimination for lobster tail tissue was significantly lower than
discrimination for lobster leg tissue (Table 3; Figure 1a). Consumer-diet δ13C
discrimination for lobster tail tissue was significantly higher than observed discrimination
for lobster leg tissue (Table 4; Figure 1b). Lobster leg tissue was found to have higher C:N
ratio than lobster tail tissue (p<0.001) (Table 5).
Differences in between tail and leg δ15N and tail and leg δ13C of 40 wild caught lobsters
(1.34±0.07 for δ15N and 1.18±0.04 for δ13C) were of the same magnitude as differences
observed amongst laboratory reared animals (0.76±0.08 for δ15N and 1.03±0.08 for δ13C)
(Table 6). As the ANOVA was not significant, the observed differences in δ15N and δ13C of
tail and leg tissue were indistinguishable between lobsters collected from the field and
those raised in the laboratory.
Effect of diet on δ15N and δ13C discrimination
Significant differences in δ15N and δ13C discrimination were observed between lobsters fed
different diets (Tables 3 and 4). Lobsters fed the pilchard diet showed significantly less
δ15N discrimination for both leg and tail tissue than lobsters fed on other diets (Post hoc
Tukey test, p<0.001, df = 3; Figure 1a) but exhibited significantly higher δ13C
discrimination than lobsters fed coralline algae or the mixed coralline algae/mussel diet
(Tukey test, p < 0.05, df = 3; Figure 1b). Lobster fed the mussel diet exhibited higher δ13C
discrimination than those fed coralline algae (Tukey test, p<0.05, df = 3; Figure 1b).
Changes in δ15N and δ13C of leg tissue over time
Results from repeated measures ANOVA indicated significant changes occurred in leg
muscle δ15N values over time as well as differences between lobsters fed different diets

76
(Table 7; Figure 2a). Observed changes over time were consistent between diets, indicated
by non significant interaction between factors time and diet. Bonferonni pairwise
comparisons between times averaged over diets indicated that δ15N concentration in leg
muscle rose significantly between t0 and t32 (p<0.01) and between t32 and t96 (p<0.05)
but then did not rise further (ie. dropped between t96 and t119 (p<0.01)). The final recorded
concentration was significantly higher than at the beginning of the experiment (p<0.05). In
contrast to the results for δ15N, a significant interaction existed between time and diet for
leg muscle δ13C values, indicating change in δ13C over time depended upon diet (Table 8;
Figure 2b). As a consequence, separate one-way repeated measures ANOVAs were
performed for each diet type to investigate the effect of time. None of these tests were
significant at p<0.05 using Bonferonni corrected p-values (p<0.05/4), indicating no change
in δ13C over the 119 day period for lobsters fed individual diets.
Discussion
Both location of muscle tissue and diet quality affect consumer-diet discrimination in
western rock lobsters. Both null hypotheses are therefore rejected. Location of muscle
tissue affects consumer-diet discrimination, with leg tissue consistently higher in δ15N and
lower in δ13C relative to tail tissue regardless of diet or whether lobsters were laboratory
reared or field caught. Diet quality also affects consumer-diet discrimination. δ15N
discrimination was determined to be lower for lobsters fed pilchards (high quality diet)
relative to lobsters fed coralline algae. δ13C discrimination was determined to be higher for
lobsters fed pilchards relative to lobsters fed other diets. δ15N of leg muscle tissue showed a
pattern consistent with asymptotic change while δ13C of leg muscle tissue showed no
change over the 119 day period. As lobsters were observed to be actively feeding during
this time, a conclusion was reached that 119 days is sufficient for δ15N and δ13C to reach a
new stable level.

77
Variation in δ15N and δ13C discrimination between muscle tissues
This study has revealed that for the western rock lobster, Panulirus cygnus, tail and leg
muscle differ in their discrimination of δ15N and δ13C. Diet-tissue δ15N discrimination of
lobster tail tissue ranged between 1.67‰ and 2.97‰, dependant on diet type, whilst δ15N
discrimination of lobster leg tissue ranged between 2.87‰ and 4.22‰, dependant on diet
type. Observed differences in δ15N discrimination between tail and leg muscle tissue (mean
difference of 1.22‰) may account for up to half a trophic level in ecological studies and
thus this factor has the potential to influence conclusions on trophic structure if it is not
controlled for when investigating food webs.
δ13C discrimination between diet and tail tissue in this study ranged between 2.92‰ and
3.60‰, whilst discrimination between diet and leg tissue ranged between 1.95‰ and
2.21‰. The mean observed difference in discrimination was 1.13‰ across all diets. Thus,
controlling the location of muscle tissue used in ecological studies is important as observed
differences in δ13C discrimination between muscle tissues exceeds the δ13C discrimination
observed for one trophic level in ecological studies. Differences in isotope values observed
between muscle tissues from the laboratory study paralleled differences observed amongst
wild populations, indicating findings from the laboratory are applicable to field populations
and have applications for food web studies involving western rock lobster.
Differences in δ15N and δ13C discrimination between tissue types have been previously
found for many species (DeNiro and Epstein 1978; DeNiro and Epstein 1981; Hobson and
Clarke 1992; Bearhop et al. 2002; Cherel et al. 2005; Seminoff et al. 2006). Further,
variable discrimination between different muscle tissue types has been determined among
fish whereby δ15N and δ13C discrimination differed between white and red muscle tissue
(Pinnegar and Polunin 1999). The current study has demonstrated that δ15N and δ13C
discrimination is also variable amongst white muscle tissue from different body parts on the
same individual. As white muscle tissue is commonly used by ecologists in trophic studies
(eg. Bunn et al. 1995; Davenport and Bax 2002), researchers should recognise the potential
for differences in white muscle tissue location to affect consumer-diet discrimination. To
account for demonstrated differences in discrimination between muscle tissue location,

78
discrimination values specific to the muscle tissue chosen for analysis should be used when
calculating results and using models in analysis of stable isotope data.
Differences in discrimination of δ15N and δ13C in different muscle tissues might be related
to differences in tissue composition since different compounds vary in their δ15N and δ13C
signatures. Lipid rich tissues have a lower δ13C than a protein rich tissue since lipids are
depleted in 13C relative to proteins (Tieszen et al. 1983). It is possible that following
digestion, proteins are preferentially assimilated into tail tissue of the western rock lobster
thereby increasing the concentration of 13C in the tail. A comparison of C:N ratios of
lobster leg and tail tissues reveals leg tissue has a higher C:N ratio relative to tail tissue
(Waddington and MacArthur, unpublished data), perhaps indicating that tail tissue has a
higher concentration of proteins, thereby lending some support to this idea.
Effect of diet on δ15N and δ13C discrimination
δ15N and δ13C discrimination was also found to differ with diet. Lobsters fed pilchards
displayed less δ15N discrimination but higher δ13C discrimination between diet and tissue
than those fed other diets. Differences in δ15N and δ13C discrimination of individuals fed
diets of differing quality have been demonstrated for the blue crab, Callinectes sapidus
(Fantle et al. 1999; Dittel et al. 2000) and the anomopod crustacean, Daphnia magna
(Adams and Sterner 2000). In these examples, higher discrimination of δ15N was observed
for animals fed low quality diets with high C:N ratios; the proposed explanation for this
being that the high C:N diet provides insufficient N for metabolic needs and thus tissue N
reserves are utilized, raising concentration of δ15N as the lighter δ14N is preferentially
excreted (Gannes et al. 1997). Whilst lobsters fed the lowest quality diet, coralline algae,
exhibited higher discrimination of δ15N than those fed pilchards, lobsters fed mussels also
exhibited higher discrimination whilst not differing significantly to pilchards in C:N.
Results suggest that even different diets controlled for C:N may be discriminated
differently and that the composition of individual compounds (e.g. amino acids) within
diets may be important in determining the degree of fractionation (Schmidt et al. 2004).

79
Values for consumer-diet δ15N discrimination of lobster tail tissue (range 1.67‰ to 2.97‰;
mean all diets 2.57‰) are lower than the value of 3.4‰ (range of 3-5‰) for δ15N
discrimination reported in the literature (DeNiro and Epstein 1981; Minagawa and Wada
1984; Post 2002) and commonly utilized in ecological studies (Kling et al. 1992; Hecky
and Hesslein 1995). Our range of values for δ15N discrimination encompassed the estimate
of 2‰ for δ15N discrimination reported by Vanderklift and Ponsard (2003) for 21
crustacean taxa. Similarly, values for consumer-diet δ13C discrimination of lobster tail
tissue (range 2.92‰ to 3.60‰; mean all diets 3.20‰) differed to those reported in the
literature. These values for δ13C discrimination exceed the range 0-1‰ suggested by
DeNiro and Epstein (1978) for discrimination between trophic levels. Similarly large δ13C
discrimination values have been determined for other ectothermic organisms. Values of
2.0‰ to 3.4‰ for δ13C have been determined for fish tissue (Hesslein et al. 1993; Pinnegar
and Polunin 1999; McCutchan Jr et al. 2003), while variation in δ13C of between -10‰ and
-2‰ have been reported for the amphipod, Allorchestes compressa (Crawley et al. 2007).
The range of δ15N leg tissue-diet discrimination determined from our study is 2.87‰-
4.22‰; mean all diets 3.79‰. These values encompass the average of 3.4‰ reported in the
literature for δ15N discrimination (DeNiro and Epstein 1981; Minagawa and Wada 1984;
Post 2002). However, the value reported in our study exceed the average of 2‰ reported by
Vanderklift and Ponsard, (2003) for crustacean taxa. As with tail tissue δ13C discrimination,
the values for lobster leg tissue δ13C discrimination (1.95‰-2.21‰; mean all diets 2.07‰)
exceed the values 0-1‰ reported in the literature for δ13C discrimination (DeNiro and
Epstein 1978; Post 2002; McCutchan Jr et al. 2003). Models incorporating measures of
consumer-diet discrimination for the analysis of lobster trophodynamic relationships should
validate discrimination values used to accurately represent ecological relationships.
Conclusions
This study further highlights the complexity surrounding selection of appropriate
consumer-diet discrimination factors for trophodynamic studies. In addition to factors such
as mode of excretion, taxon, nutritional condition, respiration rate and tissue type, our
research suggests location of muscle tissue must also be considered when selecting tissue

80
for analysis. In situations where significant differences in the quality of the food available
to (eaten by) the organism exist, diet quality must also be considered as a factor affecting
δ13C and δ15N discrimination. Our values for δ13C consumer-diet discrimination and δ
15N
discrimination of leg tissue were found to differ to those reported in the literature. To
increase the confidence associated with the application of naturally occurring stable
isotopes in ecological studies, species-specific values for discrimination are preferable to
using values derived from a number of other species.
Acknowledgements
We wish to thank Danielle Johnston for providing experimental lobsters and Kylie Cook
for help feeding the lobsters. We thank Diana Walker and Mat Vanderklift for helpful
comments on the manuscript. This project was funded by the School of Plant Biology at the
University of Western Australia, the School of Natural Sciences at Edith Cowan University,
and The Strategic Research Fund for the Marine Environment (SRFME). All procedures
were approved by the animal ethics committee at The University of Western Australia
(Approval number RA/3/100/478), and authorized under state government permits.
References
Adams TS, Sterner RW (2000) The effect of dietary nitrogen content on trophic level 15N
enrichment. Limnol Oceanogr 45: 601-607
Atema J, Cobb JS (1980) Social behaviour. In: Cobb JS, Phillips BF (eds) The Biology and
Management of Lobsters. Academic Press, New York, pp 409-450
Bearhop S, Waldron S, Votier SC, Furness RW (2002) Factors influencing assimilation
rates and fractionation of nitrogen and carbon stable isotopes in avian blood and
feathers. Physiol Biochem Zool 75: 451-458
Bunn SE, Loneragan NR, Kempster MA (1995) Effects of acid washing on stable isotope
ratios of C and N in penaeid shrimp and seagrass: Implications for food-web studies
using multiple stable isotopes. Limnol Oceanogr 40: 622-625

81
Checkley DM, Entzeroth LC (1985) Elemental and isotopic fractionation of carbon and
nitrogen by marine, planktonic copepods and implications to the marine nitrogen
cycle. Journal of Plankton Research 7: 553-568
Cherel Y, Hobson KA, Hassani S (2005) Isotopic discrimination between food and blood
and feathers of captive penguins: Implications for dietary studies in the wild.
Physiol Biochem Zool 78: 106-115
Chittleborough RG (1970) Studies on recruitment in the Western Australian rock lobster,
Panulirus longipes cygnus George: Density and natural mortality of juveniles. Aust
J Mar Freshwat Res 21: 131-148
Cobb JS (1981) Behaviour of the Western Australian spiny lobster in the field and
laboratory. Aust J Mar Freshwat Res 32: 399-409
Crawley KR, Hyndes GA, Vanderklift MA (2007) Variation among diets in discrimination
of δ13C and δ15N in the amphipod Allorchestes compressa. J exp Mar Biol Ecol 349:
370–377
Dall W (1974) Indices of nutritional state in the western rock lobster, Panulirus longipes
(Milne Edwards). I. Blood and tissue constituents and water content. J Exp Mar Biol
Ecol 16: 167-180
Davenport SD, Bax NJ (2002) A trophic study of a marine ecosystem off southeastern
Australia using stable isotopes of carbon and nitrogen. Can J Fish Aquat Sci 59:
514-530
DeNiro MJ, Epstein S (1978) Influence of diet on the distribution of carbon isotopes in
animals. Geochim et Cosmochim Acta 42: 495-506
DeNiro MJ, Epstein S (1981) Influence of diet on the distribution of nitrogen isotopes in
animals. Geochim et Cosmochim Acta 45: 341-351
Dittel AI, Epifanio CE, Schwalm SM, Fantle MS, Fogel ML (2000) Carbon and Nitrogen
sources for juvenile blue crabs Callinectes sapidus in coastal wetlands. Mar Ecol
Prog Ser 194: 103-112
Edgar GJ (1990) Predator-prey interactions in seagrass beds. I. The influence of
macrofaunal abundance and size-structure on the diet and growth of the western
rock lobster Panulirus cygnus George. J Exp Mar Biol Ecol 139: 1-22
Fantle MS, Dittel AI, Schwalm SM, Epifanio CE, Fogel ML (1999) A food web analysis of
the juvenile blue crab, Callinectes sapidus using stable isotopes in whole animals
and individual amino acids. Oecologia 120: 416-426

82
Fletcher WJ, Head F (2006) State of the fisheries report. Department of Fisheries, Perth
Western Australia. Australia.
Fry B, Parker PL (1979) Animal diet in Texas seagrass meadows: δ13C evidence for the
importance of benthic plants. Estuar, Coastal Mar Sci 8: 499-509
Gannes LZ, O'Brien DM, Martinez Del Rio C (1997) Stable isotopes in animal ecology:
Assumptions, caveats, and a call for more laboratory experiments. Ecology 78:
1271-1276
Hecky RE, Hesslein RH (1995) Contributions of benthic algae to lake food webs as
revealed by stable isotope analysis. J North Am Benthol Soc 14: 631-653
Hesslein RH, Hallard KA, Ramal P (1993) Replacement of sulphur, carbon and nitrogen of
growing broad whitefish (Coregornus nasus) in response to a change in diet traced
by 34S, 13C and 15N Can J Fish Aquat Sci 50: 2071-2076
Hobson KA (1995) Reconstructing avian diets using stable-carbon and nitrogen isotope
analysis of egg components: Patterns of isotopic fractionation and turnover. The
Condor 97: 752-762
Hobson KA, Bairlein F (2003) Isotopic fractionation and turnover in captive garden
warblers (Sylvia borin): Implications for delineating dietary and migratory
associations in wild passerines. Can J Zool 81: 1630-1635
Hobson KA, Clark RG (1992) Assessing avian diets using stable isotopes I: Turnover of 13C in tissues. The Condor 94: 181-188
Jernakoff P, Phillips BF, Fitzpatrick JJ (1993) The diet of post-puerulus western rock
lobster, Panulirus cygnus George, at Seven Mile Beach, Western Australia. Aust J
Mar Freshwat Res 44: 649-655
Johnston DJ, Melville-Smith R, Hendricks B (2007) Survival and growth of western rock
lobster Panulirus cygnus (George) fed formulated diets with and without fresh
mussel supplement. Aquaculture 273: 108-117
Joll LM, Phillips BF (1984) Natural diet and growth of juvenile western rock lobster
Panulirus cygnus George. J Exp Mar Biol Ecol 75: 145-169
Kling GW, Fry B, O'Brien WJ (1992) Stable isotopes and planktonic trophic structure in
arctic lakes. Ecology 73: 561-566
McConnaughey T, McRoy CP (1979) Food-web structure and the fractionation of carbon
isotopes in the Bering Sea. Mar Biol 53: 257-262
83
McCutchan Jr JH, Lewis Jr WM, Kendall C, McGrath CC (2003) Variation in trophic shift
for stable isotope ratios of carbon, nitrogen, and sulfur. Oikos 102: 378-390
Meyer-Rochow VB, Cook I, Hendy CH (1992) How to obtain clues from the otoliths of an
adult fish about the aquatic environment it has been in as a larvae. Comp Biochem
Physiol 103A: 333-335
Minagawa M, Wada E (1984) Stepwise enrichment of 15N along food chains: Further
evidence and the relation between δ15N and animal age. Geochim et Cosmochim
Acta 48: 1135-1140
Oelbermann K, Scheu S (2002) Stable isotope enrichment (δ15N and δ13C) in a generalist
predator (Pardosa lugubris, Araneae: Lycosidae): effects of prey quality. Oecologia
130: 337-344
Pinnegar JK, Polunin NVC (1999) Differential fractionation of δ13C and δ15N among fish
tissues: Implications for the study of trophic interactions. Funct Ecol 13: 225-231
Ponsard S, Averbuch P (1999) Should growing and adult animals fed on the same diet show
different δ15N values? Rapid Comm Mass Spec 13: 1305-1310
Post DM (2002) Using stable isotopes to estimate trophic position: Models, methods and
assumptions. Ecology 83: 703-718
Robinson D (2001) δ15N as an integrator of the nitrogen cycle. Trends Ecol Evol 13: 153-
162
Robinson MH, Abele LG, Robinson B (1970). Attack autotomy: A defence against
predators. Science 169: 300-301
Rounick JS, Winterbourne MJ (1986) Stable carbon isotopes and carbon flow in
ecosystems. Biosci 36: 171-177
Schmidt K, McClelland JW, Mente E, Montoya JP, Atkinson A, Voss M (2004) Trophic-
level interpretation based on δ15N values: Implications of tissue-specific
fractionation and amino acid composition. Mar Ecol Prog Ser 266: 43-58
Seminoff JA, Jones TT, Eguchi T, Jones DR, Dutton PH (2006) Stable isotope
discrimination (δ13C and δ15N) between soft tissues of the green sea turtle Chelonia
mydas and its diet. Mar Ecol Prog Ser 308: 271-278
Tieszen LL, Boutton TW, Tesdahl KG, Slade NA (1983) Fractionation and turnover of
stable carbon isotopes in animal tissues: Implications for 13C analysis of diet.
Oecologia 57: 32-37
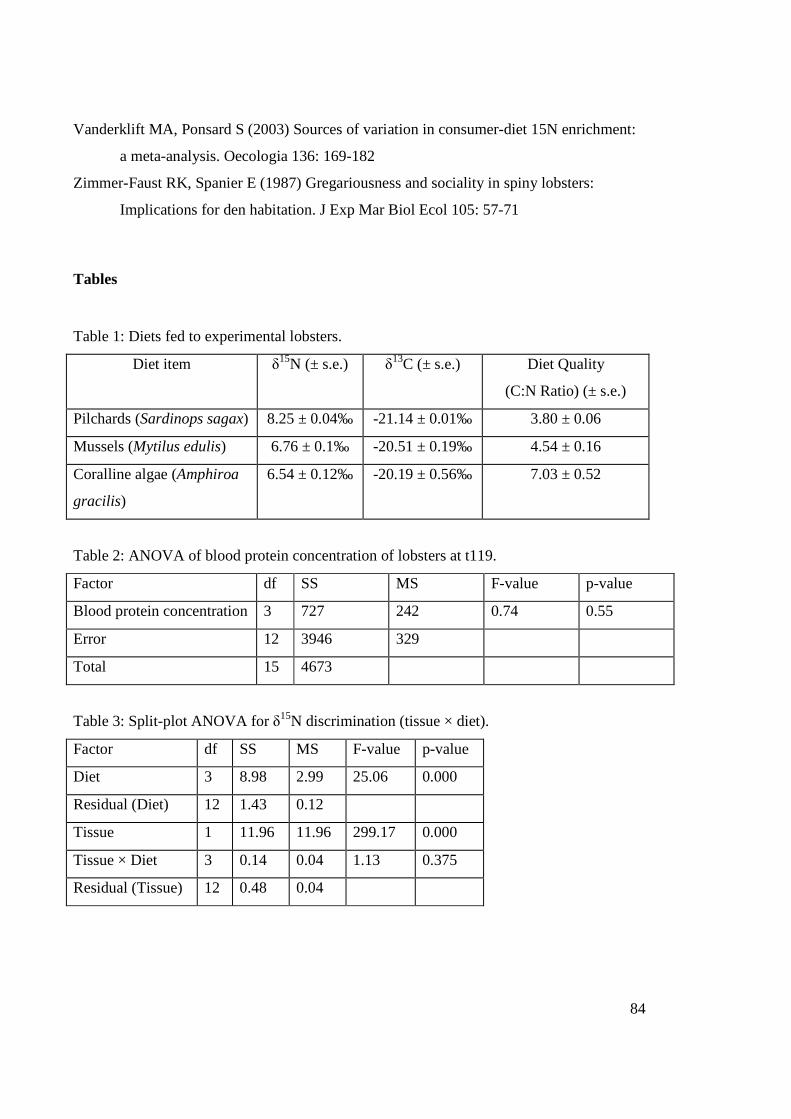
84
Vanderklift MA, Ponsard S (2003) Sources of variation in consumer-diet 15N enrichment:
a meta-analysis. Oecologia 136: 169-182
Zimmer-Faust RK, Spanier E (1987) Gregariousness and sociality in spiny lobsters:
Implications for den habitation. J Exp Mar Biol Ecol 105: 57-71
Tables
Table 1: Diets fed to experimental lobsters.
Diet item δ15N (± s.e.) δ
13C (± s.e.) Diet Quality
(C:N Ratio) (± s.e.)
Pilchards (Sardinops sagax) 8.25 ± 0.04‰ -21.14 ± 0.01‰ 3.80 ± 0.06
Mussels (Mytilus edulis) 6.76 ± 0.1‰ -20.51 ± 0.19‰ 4.54 ± 0.16
Coralline algae (Amphiroa
gracilis)
6.54 ± 0.12‰ -20.19 ± 0.56‰ 7.03 ± 0.52
Table 2: ANOVA of blood protein concentration of lobsters at t119.
Factor df SS MS F-value p-value
Blood protein concentration 3 727 242 0.74 0.55
Error 12 3946 329
Total 15 4673
Table 3: Split-plot ANOVA for δ15N discrimination (tissue × diet).
Factor df SS MS F-value p-value
Diet 3 8.98 2.99 25.06 0.000
Residual (Diet) 12 1.43 0.12
Tissue 1 11.96 11.96 299.17 0.000
Tissue × Diet 3 0.14 0.04 1.13 0.375
Residual (Tissue) 12 0.48 0.04

85
Table 4: Split-plot ANOVA for δ13C discrimination (tissue × diet).
Factor df SS MS F-value p-value
Diet 3 1.14 0.38 5.12 0.016
Residual (Diet) 12 0.89 0.07
Tissue 1 10.23 10.23 157.91 0.000
Tissue × Diet 3 0.24 0.08 1.26 0.332
Residual (Tissue) 12 0.78 0.06
Table 5: Split-plot ANOVA comparing C:N ratio (tissue × diet).
Factor df SS MS F-value p-value
Diet 3 0.06 0.02 2.736 0.090
Residual (Diet) 12 0.08 0.01
Tissue 1 0.53 0.53 204.928 0.000
Tissue × Diet 3 0.00 0.00 0.444 0.726
Residual (Tissue) 12 0.03 0.00
Table 6: Difference in δ15N and δ13C of leg and tail tissues compared between laboratory
reared animals and lobsters collected from the field.
Isotope Factor df SS MS F-value p-value
δ15N Lobster origin 1 0.37 0.37 1.30 0.258
Residual 86 24.41 0.28
Total 87 24.78
δ13C Lobster origin 1 1.18 1.18 2.650 0.107
Residual 86 38.22 0.44
Total 87 39.39

86
Table 7: Two-way repeated measures ANOVA showing differences in δ15N of lobster leg
muscle tissue over time and for lobsters fed different diets. Since Mauchly’s test indicated a
violation of sphericity, degrees of freedom marked ‘*’ have been adjusted using the Huynh-
Feldt correction.
Factor df SS MS F-value p-value
Diet 3 3.42 1.14 4.13 0.032
Residual (Diet) 12 3.31 0.27
Time 3.537* 7.71 2.18 21.60 0.000
Time × Diet 10.612* 1.48 0.14 1.39 0.217
Residual (Time) 42.449* 4.28 0.10
Table 8: Two-way ANOVA showing differences in δ13C of lobster leg muscle tissue over
time and for lobsters fed different diets.
Factor df SS MS F-value p-value
Diet 3 3.32 1.11 11.754 0.001
Residual (Diet) 12 1.13 0.09
Time 4 1.49 0.37 8.291 0.000
Time × Diet 12 1.10 0.09 2.045 0.040
Residual
(Time)
48 2.16 0.04

87
Figures
Figure 1: δ15N discrimination (a) and δ13C discrimination (b) between diet and muscle
tissue for lobster fed four different diets.

88
Figure 2: Change in δ15N (a) and δ13C (b) concentration of leg muscle tissue from lobsters
fed four different diets. t = time since diet switch.

89

SynthesisWhat is the role of western rock lobsters in these
deep-coastal ecosystems?
Chapter 2Where do the lobsters occur?Biotic composition of these
ecosystems
Stable Isotope Analysis
Gut content analysis
Chapter 3What do lobsters consume
in these ecosystems?
Chapter 7 Nutritional condition of lobsters
Chapter 6 Mass balance approach
What else do lobsters eat? Bait?
Chapter 4 P. cygnusConsumer-diet discrimination
Chapter 5 Sensitivity of variation in consumer-diet discrimination to calculated dietary composition
Appendix 2 Gut evacuation rates of western rock lobsters
Verification of Techniques
Appendix 3 Comparison of techniques for determining lobster nutritional condition
Chapter 2Where do the lobsters occur?Biotic composition of these
ecosystems
Stable Isotope Analysis
Gut content analysis
Chapter 3What do lobsters consume
in these ecosystems?
Stable Isotope Analysis
Gut content analysis
Chapter 3What do lobsters consume
in these ecosystems?
Chapter 7 Nutritional condition of lobsters
Chapter 6 Mass balance approach
What else do lobsters eat? Bait?
Chapter 4 P. cygnusConsumer-diet discrimination
Chapter 5 Sensitivity of variation in consumer-diet discrimination to calculated dietary composition
Appendix 2 Gut evacuation rates of western rock lobsters
Verification of Techniques
Appendix 3 Comparison of techniques for determining lobster nutritional condition

91
Chapter Five - The effect of variation in consumer-diet discrimination on
calculation of consumer dietary composition.

92
Abstract
Consumer-diet discrimination is an important parameter when determining the composition
of a consumers’ diet using stable isotope analysis. Here I investigate the effect of variation
in consumer-diet discrimination on calculated dietary composition of the western rock
lobster (Panulirus cygnus George). Variation in δ15N discrimination had the greatest effect
on lobster dietary composition, due to a greater variation in δ15N discrimination relative to
range of δ15N values of dietary sources. The effect of variation in consumer-diet
discrimination on the calculated contribution of different lobster diet sources was
determined to be dependant upon the relative values of diet sources. While results are
specific to the data set investigated, principles may be applied to all data that use geometric
or linear mixing models to calculate diet of a consumer. To avoid error in calculated
consumer dietary composition, it is suggested that where possible, species-specific
estimates of consumer-diet discrimination should be used when determining the dietary
composition of a consumer.
Introduction
Naturally-occurring stable isotopes are frequently used as a tool to determine the
contribution of dietary sources to a consumers’ diet (eg. Szepanski et al. 1999; Hollows et
al. 2002). Stable isotope analysis complements traditional methods of determining
consumer dietary composition such as gut content analysis (Whitledge and Rabeni 1997;
Szepanski et al. 1999; Johannsson et al. 2001). Using stable isotope values for a consumer
and potential diets, a consumer’s dietary composition can be determined using a mixing
model (eg. Ben-David et al. 1997; Whitledge and Rabeni 1997; Phillips 2001). As well as
having applications in determining the contribution of various diet sources to a consumer’s
diet, mixing models have applications in any situation investigating the contribution of
isotopically distinct sources to an end product (Phillips and Gregg 2003). As such, mixing
models have been used to determine the importance of various water sources to a plant
(Dawson 1993), in anthropogenic studies such as when determining the relative
contribution of pollution sources to lake sediment lead contamination (Bindler et al. 2001),
93
and in geochemistry to determine the relative contribution of marine aerosols to soil
nutrients (Whipkey et al. 2000).
Consumer-diet discrimination refers to differences in isotope values between a consumer
and its prey (Robinson 2001). Differences in isotopic signature between trophic levels
occur because lighter isotopes (14N and 12C) are either preferentially excreted or respired
during metabolism (Peterson and Fry 1987). Prior to calculation of a consumer’s diet using
a mixing model, a consumer’s isotopic value must be adjusted to account for consumer-diet
discrimination. Thus, values for consumer-diet discrimination may have implications when
estimating a consumers dietary composition.
Calculation of consumer diet using geometric or linear mixing models is based on
differences in isotopic values of the consumer relative to the isotopic values of diet sources
(Figs. 5.1 and 5.2). In the application of geometric mixing models, the contribution of each
diet source to a consumers’ diet is related to the inverse of the distance between the isotopic
value of the consumer and the isotopic value of the diet source (Figs. 5.1 and 5.2) (Ben-
David et al. 1997). Similarly, linear mixing models calculate the relative contribution of
diet sources to a consumers’ diet based on relative differences in isotopic values of
consumers and diet sources (Phillips 2001). In instances where the number of diet sources
do not exceed the number of elements (i.e. N, C, etc) by n+1 (where n is the number of
elements), a single solution for the contribution of dietary sources to consumers diet can be
attained (Fig. 5.1) (Whitledge and Rabeni 1997; Szepanski et al. 1999). In cases where the
number of diets exceed the number of elements by >1, the contribution of dietary sources
can only be defined within ranges (Fig. 5.2) (Phillips and Gregg 2003). As variation in
consumer-diet discrimination is used to ‘adjust’ the isotopic value of a consumer (or diet
sources) prior to determination of consumer dietary composition using mixing models,
consumer-diet discrimination is a factor that may affect calculated consumer dietary
composition in ecological studies.
Consumer-diet discrimination values were thought to be consistent inter-specifically and
intra-specifically, with values between 0-1‰ for δ13C and of 3.4‰ for δ15N (DeNiro and
Epstein 1978; DeNiro and Epstein 1981; Minagawa and Wada 1984). However, more
recently consumer-diet δ13C and δ15N discrimination have been suggested to be more

94
variable (see reviews by Vander Zanden and Rassmussen 2001; Vanderklift and Ponsard
2003; McCutchan Jr et al. 2003). Recent reviews have indicated values for consumer-diet
discrimination are affected by taxon, tissue type analysed, method of excreting nitrogenous
waste, whether the organism inhabits a marine, freshwater or terrestrial environment, along
with diet quality (protein content of diet) (McCutchan Jr et al. 2003; Vanderklift and
Ponsard 2003; Waddington and MacArthur submitted/Chapter Four). Estimates of
discrimination reported in the literature range between -10 and 2.8‰ for δ13C (Checkley
and Entzeroth 1985; Crawley et al. 2007) and between -3.22 and 9.2‰ for δ15N (DeNiro
and Epstein 1981; Oelbermann and Scheu 2002). As researchers have imperfect knowledge
of discrimination or the factors that affect discrimination, measures of discrimination used
in ecological studies will rarely be exact or constant. Thus, an understanding of how
variation in consumer-diet discrimination affects estimates of consumer-dietary
composition is required as this will potentially affect results and conclusions from
ecological studies.
The current study will investigate the effect of variation in consumer-diet discrimination on
the calculated dietary composition of western rock lobsters (Panulirus cygnus). Consumer-
diet δ13C and δ15N discrimination for western rock lobster (Panulirus cygnus) have recently
been determined (Waddington and MacArthur submitted/Chapter Four). The δ13C
consumer-diet discrimination determined by Waddington and MacArthur
(submitted/Chapter Four) (3.20‰) exceeds the range of values for δ13C consumer-diet
discrimination traditionally used (0-1‰) but is similar to δ13C discrimination of up to 3.1‰
reported for the American Lobster, Homarus americanus (Stephenson et al. 1986). In
contrast, the δ15N consumer-diet discrimination (2.57‰) is lower than the value for δ15N
discrimination traditionally used (3.4‰), but similar to values reported for other
crustaceans (Vanderklift and Ponsard 2003). Here those data of Waddington and
MacArthur (submitted/Chapter Four) are used to determine the effect of variation in
consumer-diet discrimination on a consumer’s dietary composition.
95
Methods
Data of Waddington et al. (in press/Chapter Three) are used for this study. These isotope
data were used to determine the diet of the western rock lobster (Panulirus cygnus George.)
in deep-coastal ecosystems (35-60 m) at Jurien Bay (30° 12.5 S, 114° 39.1 E), Western
Australia (Fig. 5.3). In this study potential lobster diet sources were bait, crabs, red algae,
amphipods/ isopods, and sponge. The effect of variation in δ15N and δ13C discrimination on
the calculated contribution of these diet sources to western rock lobster diet was examined
over 0.5‰ increments – between 2.07‰ and 5.57‰ for δ15N and between 0.0‰ and 3.7‰
for δ13C. These ranges were chosen as they encompass values of consumer-diet
discrimination determined by Waddington and MacArthur (submitted/ Chapter Four) and
values commonly used to represent discrimination in ecological studies (DeNiro and
Epstein 1978, DeNiro and Epstein 1981; Minagawa and Wada 1984).
Data analysis
The program IsoSource (Phillips and Gregg 2003) was used for all calculations. The effect
of variation in δ15N and δ13C discrimination on the mean, minimum (1%) and maximum
(99%) contribution of diet sources to lobster diet was examined. Changes in discrimination
were examined by investigating changes in the proportional contribution of lobster diet
sources. The mean change in the estimated contribution of diet sources upon a 0.5‰
change in consumer-diet δ15N and δ13C discrimination (n=125 combinations) was
determined to identify which of δ15N or δ13C had the greatest influence on consumer dietary
composition. The change in the estimated contribution of different diet sources to lobster
diet upon a 0.5‰ change in either δ15N or δ13C discrimination was also determined to
investigate which diet sources were most sensitive to changes in consumer-diet
discrimination.

96
Results
Variation in consumer-diet δ15N discrimination was found to affect the estimated dietary
composition of the western rock lobster to a greater extent than variation in δ13C
discrimination. A change in δ15N discrimination of 0.5‰ resulted in average change of
0.107 ± 0.008 (se) to the proportional contribution of diet sources to lobster diet. In
contrast, a change in δ13C discrimination of 0.5‰ resulted in average change of 0.033 ±
0.002 (se) to the proportional contribution of diet sources to lobster diet.
Variation in consumer-diet δ15N discrimination had the greatest effect on the estimated
contribution of bait, crabs and amphipods/isopods to lobster diet (Fig. 5.4). A change in
δ15N discrimination of 1.5‰ (from 2.57‰ to 4.07‰; δ13C constant at 3.20‰) resulted in a
decrease in the contribution of bait to lobster diet from 0.75 to 0.12. The proportional
contribution of crabs increased from 0.06 to 0.24 with this change in δ15N discrimination,
while the contribution of amphipods/isopods increased from 0.08 to 0.31. The contribution
of sponge and red algae to lobster diet both increased with the same change in δ15N
discrimination (from 0.02 to 0.12 and 0.01 to 0.20 respectively).
Upon changes in δ15N discrimination, variation in the range of contributions (1-99th
percentile) of dietary sources to lobster diet followed a similar pattern to changes in the
mean contribution (Figs. 5.5 and 5.6). An increase in δ15N discrimination from 2.57‰ to
4.57‰ (δ13C constant at 3.20‰) resulted in a decrease in the proportional contribution of
bait to lobster diet from between 0.68 and 0.81 to between 0 and 0.11, an increase in the
proportional contribution of crabs from between 0 and 0.17 to between 0 and 0.25 and an
increase in the contribution of amphipods/isopods from between 0 and 0.23 to between 0
and 0.75 (Figs. 5.5 and 5.6). The effect of variation in δ15N discrimination had a greater
effect on the range of contributions of sponge to lobster diet with the same variation in δ15N
discrimination (from between 0 and 0.06 to between 0.15 and 0.31), while the range of
contributions of red algae to lobster diet increased from between 0.02 and 0.16 to between
0.07 and 0.52 (Figs 5.5 and 5.6).
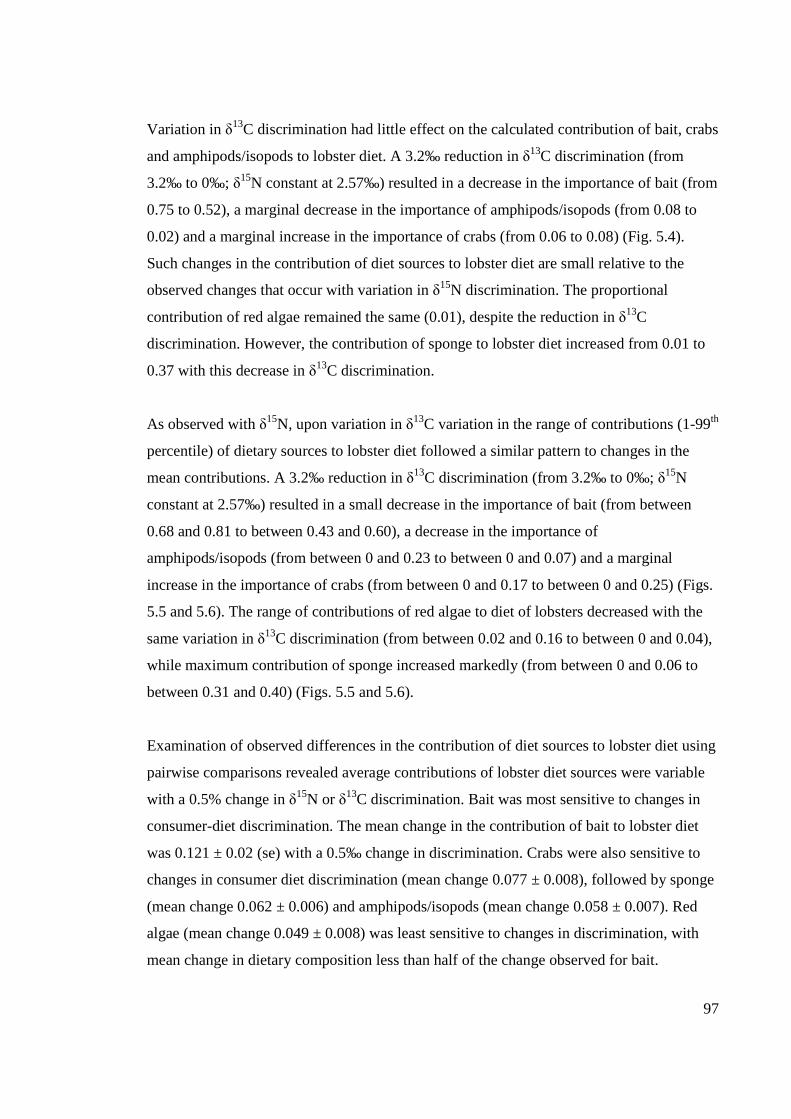
97
Variation in δ13C discrimination had little effect on the calculated contribution of bait, crabs
and amphipods/isopods to lobster diet. A 3.2‰ reduction in δ13C discrimination (from
3.2‰ to 0‰; δ15N constant at 2.57‰) resulted in a decrease in the importance of bait (from
0.75 to 0.52), a marginal decrease in the importance of amphipods/isopods (from 0.08 to
0.02) and a marginal increase in the importance of crabs (from 0.06 to 0.08) (Fig. 5.4).
Such changes in the contribution of diet sources to lobster diet are small relative to the
observed changes that occur with variation in δ15N discrimination. The proportional
contribution of red algae remained the same (0.01), despite the reduction in δ13C
discrimination. However, the contribution of sponge to lobster diet increased from 0.01 to
0.37 with this decrease in δ13C discrimination.
As observed with δ15N, upon variation in δ13C variation in the range of contributions (1-99th
percentile) of dietary sources to lobster diet followed a similar pattern to changes in the
mean contributions. A 3.2‰ reduction in δ13C discrimination (from 3.2‰ to 0‰; δ15N
constant at 2.57‰) resulted in a small decrease in the importance of bait (from between
0.68 and 0.81 to between 0.43 and 0.60), a decrease in the importance of
amphipods/isopods (from between 0 and 0.23 to between 0 and 0.07) and a marginal
increase in the importance of crabs (from between 0 and 0.17 to between 0 and 0.25) (Figs.
5.5 and 5.6). The range of contributions of red algae to diet of lobsters decreased with the
same variation in δ13C discrimination (from between 0.02 and 0.16 to between 0 and 0.04),
while maximum contribution of sponge increased markedly (from between 0 and 0.06 to
between 0.31 and 0.40) (Figs. 5.5 and 5.6).
Examination of observed differences in the contribution of diet sources to lobster diet using
pairwise comparisons revealed average contributions of lobster diet sources were variable
with a 0.5% change in δ15N or δ13C discrimination. Bait was most sensitive to changes in
consumer-diet discrimination. The mean change in the contribution of bait to lobster diet
was 0.121 ± 0.02 (se) with a 0.5‰ change in discrimination. Crabs were also sensitive to
changes in consumer diet discrimination (mean change 0.077 ± 0.008), followed by sponge
(mean change 0.062 ± 0.006) and amphipods/isopods (mean change 0.058 ± 0.007). Red
algae (mean change 0.049 ± 0.008) was least sensitive to changes in discrimination, with
mean change in dietary composition less than half of the change observed for bait.

98
Discussion
Results from this study indicate variation in δ15N discrimination influences consumer
dietary composition to a greater extent than variation in δ13C discrimination. Bait and crabs
were the dietary sources that were most sensitive to changes in consumer-diet
discrimination. The observed effect of consumer-diet discrimination on lobster dietary
composition relates to the geometry of the mixing space investigated in this study. Two
aspects of the mixing space are particularly important for determining the effect of
variation in consumer-diet discrimination on dietary composition of the consumer 1) range
of isotopic values of diet sources and 2) relative values of diet sources.
The δ13C values of diet sources investigated in this study covered a range of 13.4‰ (from -
27.30‰ for red algae to -13.9‰ for sponges). In contrast, δ15N values of diet sources cover
a range of 4.5‰ (from 4.1‰ for red algae to 8.6‰ for bait). Thus a change in δ13C
discrimination of 0.5‰ is small relative to the 13.4‰ range in δ13C, while a 0.5‰ change
in δ15N discrimination is large relative to the 4.5‰ range in δ15N. If the isotopic values of
diet sources cover a narrow range, variation in discrimination of this isotope will affect the
calculated consumer dietary composition to a greater extent than variation in discrimination
of an isotope where values for diet sources cover a greater range. In ecological studies, δ15N
values of organisms commonly cover a smaller range of isotopic values than the δ13C
values of organisms. For example, Loneragan et al. (1997) reported a range of δ15N values
of ~9‰ (between 0‰ and 9‰) for organisms inhabiting an estuarine system. This is
approximately half of the 19‰ range (between -29‰ and -10‰) reported for organisms’
δ13C values in that systems. Similarly, Ostrom et al. (1997) studied a terrestrial system and
reported a range of 5‰ (between -1‰ and 4‰) for δ15N of organisms but a range of 22‰
(between -27‰ and -5‰) for δ13C values of organisms. Smaller ranges in δ15N values of
organisms relative to δ15N values means error associated with estimates of δ15N
discrimination will influence estimates of consumer dietary composition to a greater extent
than the same amount of error associated with estimates of δ13C discrimination.
The effect of variation in consumer-diet discrimination on dietary composition of a
consumer will also be influenced by the isotopic values of diet sources. In the current study

99
the contribution of bait and sponge to lobster diet was more sensitive to changes in
discrimination than crabs, amphipods/isopods and red algae. When using a mixing model
with two isotopes to determine a consumers’ diet, only three diet sources are required to
gain a solution – as long as the consumers adjusted stable isotope value falls within the
mixing space (eg. Fig. 5.1). Where more than three diet sources are present a range of
possible solutions can be identified (eg. Fig. 5.2) (Phillips and Gregg 2003). Where two diet
sources occur in the same direction of the mixing space (ie. if one of these diet sources was
not included, the adjusted consumers’ stable isotope value will remain within the mixing
space bounded by the other diet sources), the relative change in contribution of these diet
sources to the consumers’ diet will be smaller upon a 0.5‰ change in discrimination.
Where only one diet source occurs in one direction (ie. if this diet source was not included,
the adjusted consumers’ stable isotope value will be outside the mixing space bounded by
the remaining diet sources), a 0.5‰ change in discrimination will affect the contribution of
that diet source to consumers’ diet to a greater extent. In the current study, changes in
discrimination (depicted by grey box on Fig. 5.3) have the greatest effect on the
contribution of bait to lobster diet. This is because bait is frequently the only diet source in
one direction (ie. bait is frequently required to form a solution) meaning bait is most
sensitive to changes in discrimination.
Depending on the range of dietary source isotopic values and the relative isotopic values of
these diet sources, small changes in consumer-diet discrimination can significantly affect
calculated consumer dietary composition. In addition to diet, multiple factors affect
consumer-diet discrimination including taxon, type of tissue analysed, acidification of
samples, method of excreting nitrogenous waste, diet quality, feeding mode, and the
environment inhabited by an organism (Vander Zanden and Rasmussen 2001; McCutchan
Jr et al. 2003; Vanderklift and Ponsard 2003; Waddington and MacArthur
submitted/Chapter Four). These factors may introduce substantial error into estimates of
consumer-diet discrimination. Consumer-diet discrimination of between -10 and 2.8‰ for
δ13C and between -3.22 and 9.2‰ for δ15N have been demonstrated (DeNiro and Epstein
1981; Checkley and Entzeroth 1985; Oelbermann and Scheu 2002; Crawley et al. 2007).
The current investigation demonstrates that such variation in isotopic discrimination can
substantially affect calculated consumer dietary composition, particularly for variation in

100
δ15N discrimination. This may affect findings of studies utilizing stable isotopes to calculate
consumer dietary composition.
Values of consumer-diet δ13C and δ15N discrimination for western rock lobster (3.20‰ and
2.57‰ respectively) determined by Waddington and MacArthur (submitted) differ to
values for discrimination commonly used in the literature to represent consumer-diet
discrimination (Kling et al. 1992; Hecky and Hesslein 1995). If values commonly used for
δ13C and δ15N discrimination (ie. 0-1‰ and 3.4‰ respectively) were used for to correct
consumer stable isotope values, the calculated lobster dietary composition would greatly
differ. Using these values for isotopic discrimination, sponge and crabs would be most
important to lobster diet (contributing 33-55% and 0-50% respectively), while
amphipods/isopods (0-36%) and bait (0-23%) would be considerably less important. These
results differ from the findings of Waddington et al. (in press/Chapter Three) who
determined that bait was the most important component of lobster diet, contributing
between 68 and 81% of lobster dietary requirements at this location with other dietary
sources contributing a maximum of 23%. If values of 3.4‰ and 0-1‰ were used by
Waddington et al. (in press/Chapter Three) to represent consumer-diet δ15N and δ13C
discrimination, conclusions drawn about the importance of bait to lobster diet and effects of
fishing on the deep-coastal ecosystems investigated would be considerably differ. Variation
in consumer-diet discrimination has also been shown to affect calculated diet of suspension
feeding species’ (Dubois et al. 2007). Following determination of discrimination values
specific to suspension feeders, application of calculated values to studies from the literature
led to a revision in the estimated contribution of microphytobenthos to the diet of
suspension feeders (see Dubois et al. 2007). Such comparisons demonstrate the importance
of choosing appropriate values for consumer-diet discrimination when using isotopes to
calculate consumer dietary composition. Where possible, species-specific values for
consumer-diet discrimination should be used to ensure data are not mis-interpreted.
Conclusions
This study demonstrates the importance of having accurate estimates of consumer-diet
discrimination when using stable isotope data to estimate dietary composition of

101
consumers. Arbitrary values have previously been used to represent δ13C and δ15N
discrimination (DeNiro and Epstein 1978; DeNiro and Epstein 1981; Minagawa and Wada
1984). Recently, variation in consumer-diet discrimination has been shown to be more
variable (Vander Zanden and Rasmussen 2001; McCutchan Jr et al. 2003; Vanderklift and
Ponsard 2003). Observed variation in isotopic discrimination can have considerable
implications when calculating consumer dietary composition, potentially affecting
conclusions drawn in ecological studies. To ensure accuracy of dietary composition,
species-specific values for consumer-diet discrimination should be estimated and utilized in
ecological studies where possible.
Acknowledgements
I wish to thank Dr Mathew Vanderklift for providing editorial comments on this
manuscript.
Figures
Fig. 5.1: Illustration of the technique used for the calculation of consumer diet from three
potential dietary sources using two elements. The consumers’ stable isotope value is
adjusted to account for consumer-diet δ13C and δ15N discrimination. The area enclosed by
dietary sources represents mixing space.

102
Fig. 5.2: Illustration of the technique used for the calculation of consumer diet from five
potential dietary sources using two isotopes. Discrete solutions for the contribution of diet
sources to consumer diet are not possible, instead the range of possible contribution of each
dietary source to consumer diet is defined.
Fig. 5.3: Data used in this study. Adjusted isotope values of the consumer (Panulirus
cygnus) (arising due to variation in δ13C and δ15N discrimination) are bounded by the grey
box. Lobsters (P. cygnus) are consumers in this system while other taxa shown are potential
lobster diet sources.

103
Fig. 5.4: Showing the effect of variation in δ13C and δ15N discrimination on the mean
calculated contribution of lobster diet sources. Variation in both δ13C and δ15N
discrimination affects the proportional contribution of lobster diet sources. y-axis on small
graphs refers to proportional contribution of lobster diet sources (0-1). x-axis represents
diet sources (L-R; Ba. = bait, Cr. = crabs, R.A. = red algae, A/I = amphipods/ isopods, and
Sp. = sponge). The graph with the dark border indicates the calculated contribution of each
lobster diet source using the discrimination values of Waddington and MacArthur
(submitted). ‘No result’ refers to cases where the corrected consumer signature falls outside
the boundaries of the mixing space, meaning no solution is possible.

104
Fig. 5.5: Showing the effect of variation in δ13C and δ15N discrimination on the minimum
calculated contribution of lobster diet sources. Variation in both δ13C and δ15N
discrimination affects the proportional contribution of lobster diet sources. y-axis on small
graphs refers to proportional contribution of each lobster diet source (0-1). x-axis represents
diet sources (L-R; Ba. = bait, Cr. = crabs, R.A. = red algae, A/I = amphipods/ isopods, and
Sp. = sponge). The graph with the dark border indicates the calculated contribution of each
lobster diet source using the discrimination values of Waddington and MacArthur
(submitted). ‘No result’ refers to cases where the corrected consumer signature falls outside
the boundaries of the mixing space, meaning no solution is possible.

105
Fig 5.6: Showing the effect of variation in δ13C and δ15N discrimination on the maximum
calculated contribution of lobster diet sources. Variation in both δ13C and δ15N
discrimination affects the proportional contribution of lobster diet sources. y-axis on small
graphs refers to proportional contribution of each lobster diet source (0-1). x-axis represents
diet sources (L-R; Ba. = bait, Cr. = crabs, R.A. = red algae, A/I = amphipods/ isopods, and
Sp. = sponge). The graph with the dark border indicates the calculated contribution of each
lobster diet source using the discrimination values of Waddington and MacArthur
(submitted). ‘No result’ refers to cases where the corrected consumer signature falls outside
the boundaries of the mixing space, meaning no solution is possible.

106

107
References
Ben-David M, Flynn RW, Schell DM (1997) Annual and seasonal changes in diets of
martens: evidence from stable isotope analysis. Oecologia 111: 280-291
Bindler R, Renberg I, Anderson NJ, Appleby PG, Emteryd O, Boyle J (2001) Pb isotope
ratios of lake sediments in West Greenland: inferences on pollution sources.
Atmospheric Environment 35: 4675-4685
Checkley DM, Entzeroth LC (1985) Elemental and isotopic fractionation of carbon and
nitrogen by marine, planktonic copepods and implications to the marine nitrogen
cycle. Journal of Plankton Research 7: 553-568
Crawley KR, Hyndes GA, Vanderklift MA, (2007) Variation among diets in discrimination
of δ13C and δ15N in the amphipod Allorchestes compressa. Journal of Experimental
Marine Biology and Ecology 349: 370–377
Dawson TE (1993) Water sources of plants as determined from xylem-water isotopic
composition; perspectives on plant competition, distributions and water relations.
In: Ehleringer JR, Hall AE, Farquhar GD (eds) Stable isotopes and plant carbon-
water relations. . Academic Press, San Diego, pp 465-496
DeNiro MJ, Epstein S (1978) Influence of diet on the distribution of carbon isotopes in
animals. Geochimica et Cosmochimica Acta 42: 495-506
DeNiro MJ, Epstein S (1981) Influence of diet on the distribution of nitrogen isotopes in
animals. Geochimica et Cosmochimica Acta 45: 341-351
Dubois S, Jean-Louis B, Bertrand B, Lefebvre S (2007) Isotope trophic-step fractionation
of suspension-feeding species: Implications for food partitioning in coastal
ecosystems. Journal of Experimental Marine Biology and Ecology 351: 121-128
Hecky RE, Hesslein RH (1995) Contributions of benthic algae to lake food webs as
revealed by stable isotope analysis. Journal of the North American Benthological
Society 14: 631-653
Hollows JW, Townsend CR, Collier KJ (2002) Diet of the crayfish Paranephrops
zealandicus in bush and pasture streams: insights from stable isotope and stomach
analysis. New Zealand Journal of Marine and Freshwater Research 36: 129-142
Johannsson OE, Leggett MF, Rudstam LG, Servos MR, Mohammadian MA, Gal G,
Dermott RM, Hesslein RH (2001) Diet of Mysis relicta in Lake Ontario as revealed
108
by stable isotope and gut content analysis. Canadian Journal of Fisheries and
Aquatic Science 58: 1975-1986
Kling GW, Fry B, O'Brien W, J. (1992) Stable isotopes and planktonic trophic structure in
arctic lakes. Ecology 73: 561-566
Loneragan NR, Bunn SE, Kellaway DM (1997) Are mangroves and seagrasses sources of
organic carbon for penaeid prawns in a tropical Australian estuary? Marine Biology
130: 289-300
McCutchan Jr JH, Lewis Jr WM, Kendall C, McGrath CC (2003) Variation in trophic shift
for stable isotope ratios of carbon, nitrogen, and sulfur. Oikos 102: 378-390
Minagawa M, Wada E (1984) Stepwise enrichment of 15N along food chains: Further
evidence and the relation between δ15N and animal age. Geochimica et
Cosmochimica Acta 48: 1135-1140
Oelbermann K, Scheu S (2002) Stable isotope enrichment (δ15N and δ13C) in a generalist
predator (Pardosa lugubris, Araneae: Lycosidae): effects of prey quality. Oecologia
130: 337-344
Ostrom PH, Colunga-Garcia M, Gage SH (1997) Establishing pathways of energy flow for
insect predators using stable isotope ratios: field and laboratory evidence. Oecologia
109: 108-113
Peterson BJ, Fry B (1987) Stable isotopes in ecosystem studies. Annual Review of Ecology
and Systematics 18: 293-320
Phillips DL (2001) Mixing models in analyses of diet using multiple stable isotopes: a
critique. Oecologia 127: 166-170
Phillips DL, Gregg JW (2003) Source partitioning using stable isotopes: coping with too
many sources. Oecologia 136: 261-269
Robinson D (2001) δ15N as an integrator of the nitrogen cycle. Trends in Ecology and
Evolution 13: 153-162
Stephenson RL, Tan FC, Mann KH (1986) Use of stable carbon isotope ratios to compare
plant material and potential consumers in a seagrass bed and a kelp bed in Nova
Scotia, Canada. Marine Ecology Progress Series 30: 1-7
Szepanski MM, Ben-David M, Ballenberghe VV (1999) Assessment of anadromous
salmon resources in the diet of the Alexander Archipelago wolf using stable isotope
analysis. Oecologia 120: 327-335
109
Vander Zanden MJ, Rasmussen JB (2001) Variation in δ15N and δ13C trophic fractionation:
Implications for aquatic food web studies. Limnology and Oceanography 46: 2061-
2066
Vanderklift MA, Ponsard S (2003) Sources of variation in consumer-diet 15N enrichment:
a meta-analysis. Oecologia 136: 169-182
Waddington K, MacArthur L (submitted) Diet quality and tissue type influence diet-
consumer discrimination in captive reared rock lobsters (Panulirus cygnus). Marine
Biology
Waddington K, Bellchambers L, Vanderklift M, Walker D (In press) Western rock lobsters
(Panulirus cygnus George.) in Western Australian deep-coastal ecosystems (35-60
m) are more carnivorous than those in shallow-coastal ecosystems. Estuarine
Coastal and Shelf Science
Whipkey CE, Capo RC, Chadwick OA, Stewart BW (2000) The importance of sea spray to
the cation budget of a coastal Hawaiian soil: a strontium isotope approach.
Chemical Geology 168: 37-48
Whitledge GW, Rabeni CF (1997) Energy sources and ecological role of crayfishes in an
Ozark stream; Insights from stable isotopes and gut analysis. Canadian Journal of
Fisheries and Aquatic Science 54: 2555-2562

SynthesisWhat is the role of western rock lobsters in these
deep-coastal ecosystems?
Chapter 2Where do the lobsters occur?Biotic composition of these
ecosystems
Stable Isotope Analysis
Gut content analysis
Chapter 3What do lobsters consume
in these ecosystems?
Chapter 7 Nutritional condition of lobsters
Chapter 6 Mass balance approach
What else do lobsters eat? Bait?
Chapter 4 P. cygnusConsumer-diet discrimination
Chapter 5 Sensitivity of variation in consumer-diet discrimination to calculated dietary composition
Appendix 2 Gut evacuation rates of western rock lobsters
Verification of Techniques
Appendix 3 Comparison of techniques for determining lobster nutritional condition
Chapter 2Where do the lobsters occur?Biotic composition of these
ecosystems
Stable Isotope Analysis
Gut content analysis
Chapter 3What do lobsters consume
in these ecosystems?
Stable Isotope Analysis
Gut content analysis
Chapter 3What do lobsters consume
in these ecosystems?
Chapter 7 Nutritional condition of lobsters
Chapter 6 Mass balance approach
What else do lobsters eat? Bait?
Chapter 4 P. cygnusConsumer-diet discrimination
Chapter 5 Sensitivity of variation in consumer-diet discrimination to calculated dietary composition
Appendix 2 Gut evacuation rates of western rock lobsters
Verification of Techniques
Appendix 3 Comparison of techniques for determining lobster nutritional condition

111
Chapter Six - Contribution of bait to lobster production in an
oligotrophic marine ecosystem
Preamble: The following chapter has been submitted for publication in The Canadian
Journal of Fisheries and Aquatic Sciences. Dr Jessica Meeuwig, listed as co-author on this
manuscript provided supervision while the mass balance model was constructed and the
manuscript prepared

112
Kris I Waddington
Corresponding author
M090 School of Plant Biology
The University of Western Australia
35 Stirling Highway
Crawley 6009.
Tel: +61 8 6488 7919
Fax: +61 8 6488 1001
Email address: [email protected]
Jessica J Meeuwig
M090 School of Plant Biology
The University of Western Australia
35 Stirling Highway
Crawley 6009.
Abstract
A mass balance model indicates bait from a trap-based fishery for lobsters may contribute
up to 13% of lobster food requirements over the whole ecosystem during a single year. This
contribution will differ spatially and temporally reflecting uneven distribution of fishing
effort and may be as high as 35% during some months of the fishing season. Given
observed effects of organic matter addition on ecosystem processes in trawl fisheries and
associated with aquaculture, it is likely that the effects of bait addition on ecosystem
function are more widespread than lobster production. Due to uneven distribution of fishing
effort, ecosystem effects of bait addition will be most apparent in heavily fished areas and
during the fishing season.
113
Introduction
Fisheries interact with ecosystems in a number of ways, both directly and indirectly (Hall
1999). The removal of target and bycatch species and addition of organic matter in the form
of discards are direct impacts of fishing that have been demonstrated to affect ecosystem
functioning (Probert et al. 1997; Cook 2001; Daskalov 2002; Daskalov et al. 2007), while
gear damage of the habitat being fished is an example of an indirect effect (Bergman and
Hup 1992; Turner et al. 1999; Kaiser et al. 2000). While such impacts of fishing have been
well established in the literature, considerably less attention has been paid to the impact of
bait on the target species and the ecosystem being fished.
Addition of organic material to marine ecosystems has been shown to affect marine
ecosystem function worldwide (Wassenberg and Hill 1987; Ramsay et al. 1997;
Groenewold and Fonds 2000; Dempster et al. 2002; Castro et al. 2005; Catchpole et al.
2006; Tuya et al. 2006). For instance, addition of organic matter to marine systems has
been shown to enhance secondary production, particularly in areas where trawl fishing
occurs such as the North Sea (eg. Groenewold and Fronds 2000; Ramsay et al. 1997).
Addition of organic matter also provides carrion to scavenging species which would be
unavailable under normal circumstances (Castro et al. 2005). Research into the effect of
addition of organic matter on ecosystem functioning has primarily focused on discards from
trawl vessels (eg. Dayton et al. 1995; Cook 2001) and from aquaculture (Cancemia et al.
2003; Yi Zhou et al. 2006; Vita et al. 2007). The role of bait as an ecosystem subsidy is less
explored. The importance of bait in subsidizing growth rates of the lobster Homarus
americanus in the Gulf of Maine, USA has recently been demonstrated (Saila et al. 2002).
Unlike discards from a trawl fishery, bait is commonly imported from outside the fishing
grounds, and delivered to areas where lobsters are known to occur. Thus, bait represents a
direct subsidy to secondary production in these ecosystems (Saila et al. 2002).
The western rock lobster (Panuliridae: Panulirus cygnus George.) fishery in Western
Australia uses approximately 14000 tonnes of bait per annum which may constitute an
important subsidy to ecosystem production. Waddington et al. (in press) demonstrated that
bait may comprise up to 80% of western rock lobster diet based on stable isotope analysis

114
and approximately 13% based on gut content analysis. However, due to the use of a
multiple-source isotope mixing-model (Phillips and Gregg 2003), the contribution of bait to
lobster diet in these ecosystems could not be further refined. Furthermore, sampling for that
study occurred during the peak of the fishing season and at high relief sites, which are
characteristically areas of high lobster abundance (Cobb 1981). Presumably fishing effort is
also targeted at such areas, which may lead to an overrepresentation of the importance of
bait to lobster diet in such areas. Here we construct a biomass-productivity mass balance
model to explore the role of bait in supporting production in the western rock lobster
fishery on an ecosystem wide scale.
The fishery for western rock lobster operates using baited pots and is Australia’s largest
single species fishery. Lobsters enter pots because they are attracted by bait, with unbaited
pots catching few lobsters. There were over 10.2 million potlifts during the 2002/2003
fishing season (Compulsory catch and effort statistics, Dept. of Fisheries, Western
Australia). An average of 1.4 kg of bait is added to each pot meaning over 14,300 tonnes of
bait was added to the fishery during the 2002/ 2003 fishing season. This corresponds to an
average of 1.13 kg of bait for every 1 kg of lobster removed.
Western rock lobsters inhabit coastal ecosystems to 150 m depth along the west coast of
Australia between Cape Leeuwin (34° 22’ S, 115° 8’ E) and North West Cape (21° 48’ S,
114° 9’ E) (Chittleborough 1970; Chittleborough and Phillips 1975). Western rock lobsters
are secondary consumers in these ecosystems, eating various small invertebrate fauna (Joll
and Phillips 1984; Edgar 1990: Jernakoff et al. 1993; Waddington et al. in press). They are
in turn prey for higher order consumers such as fish (Howard 1988) and octopus (Joll
1977). High abundances of lobsters in these ecosystems coupled with their role as
secondary consumers make this species important in ecosystem processes.
The west coast of Australia to which western rock lobsters are endemic is an oligotrophic
system dominated by the Leeuwin current (Cresswell 1991). Due to the oligotrophic nature
of this region, biomass of pelagic species is relatively low compared to the Humboldt and
Benguelan regions on the western boundaries of Africa and South America, where
upwelling occurs (Cushing 1971; Lenanton et al. 1991). Instead benthic species such as the
western rock lobster, which are strongly dependant on benthic production, dominate this
115
region (Lenanton et al. 1991). Biomass of lobsters in the region is substantial, with captures
from the fishery regularly exceeding 12,000 tonnes per annum (Flecher and Head 2006).
Thus, lobster productivity in the system is significant, and bait addition to this system may
play an important role in subsidizing lobster production. Addition of organic matter in the
form of bait may cause an increase in lobster abundance due to increased food supply as
has been reported for the sand crab, Portunus pelagicus in Morton Bay, Australia
(Wassenberg and Hill 1987). Addition of bait may also have implications in terms of a
reduction in predation pressure. If lobsters are preferentially feeding on bait, diet items that
would be preyed upon in the absence of bait will be released from predation and an increase
in abundance of these diet items may result. Further, natural prey items of the lobsters will
likely be more available to those taxa that compete with lobsters for food resources in a
natural system.
Mass balance models have widespread applications and have been used to assess extraction
and production of mammals in the Congo and Amazon basins (Fa et al. 2002), and to
determine the effect of removal of sharks, rays, and chimaeras on trophic interactions in
marine ecosystems (Stevens et al. 2000). Mass balance models are premised on the
principle of conservation of a given currency, which may be carbon (Taipale et al. 2007), or
biomass (Pauly et al. 2000). Such models allow one to effectively balance production and
losses against observed biomass and to evaluate the realism of estimates of individual
components of the mass balance equation.
Here we use a mass-balance approach to assess the potential contribution of bait to western
rock lobster production in deep-coastal ecosystems off the west coast of Western Australia.
Our mass balance model aims to determine the biomass of lobsters present in the study area
during the study period, then use food conversion ratios to compare food required to
explain lobster growth to food available in terms of natural diet items and bait.
Methods
The model was constructed for deep coastal ecosystems at Jurien Bay (30° 12.500 S, 114°
39.100 E), Western Australia. Jurien Bay is near the center of western rock lobster

116
distribution and is one of the main areas of the fishery. The study area was reef habitat >20
fathoms (36.5m), between 30°S to 31°S. The model was constructed over the period from
15 November 2002 to 14 November 2003 to encompass the 2002/2003 fishing season.
As our objective was to determine the food requirement to support observed biomass and
assess the relative contribution of bait to lobster food requirements, the mass balance model
was built on the principle that the observed population biomass reflects the difference
between inputs (growth fueled by food ingestion and immigration) and outputs (fishing
mortality, natural mortality and emigration) integrated over time. Our general equation is
thus:
Bt1 (kg) = Bt0 (kg) + [k* × Bt0 (kg)] + I (kg. month-1) – [ M × Bt0 (kg)] – F (kg)
where Bt1 refers to the biomass on the first day of the month, and Bt0 refers to the biomass
on the first day of the previous month. Biomass present at the start of each calendar month
was calculated from the biomass present during the previous month and the parameters k, I,
F, and M (Table 1). Emigration from the study area was assumed to be nil. Our model is
also size structured, taking into account size specific rates of growth, immigration, and food
conversion ratios. Estimation of these parameters is incorporated into the results section.
Estimating food requirements of the population requires an estimate of population size.
Biomass of legal sized lobsters in the study area was calculated using the techniques
described in Wright et al. (2006). Biomass present each month was then multiplied by the
growth co-efficient, k (kg month-1) to determine growth of biomass present for each month.
Growth of biomass for each month over the study period was then summed to give biomass
increase for the study period due to growth.
The food required to support observed growth was determined by multiplying the biomass
increase due to growth by food conversion ratio. The food required to support observed
growth was compared to abundance of diet items present on the benthos and bait input from
the fishery to determine if bait is providing a significant subsidy to lobster growth.

117
Western rock lobsters enter baited pots because they are attracted to bait (Jernakoff and
Phillips 1988) and lobsters in the pot are able to consume bait, so the potential contribution
of bait to lobster production was calculated assuming lobsters preferentially consume bait
in the pots.
Verification of constructed model
The constructed model was verified by comparing the calculated biomass at June 30, 2003
(end of 2002/2003 fishing season) to the biomass at the same time derived by depletion
analysis.
Error Assessment
To manage uncertainty around estimates used in the model, we estimated lower and upper
limits for each parameter (Table 1). Some parameters had associated lower and upper limits
with estimates, while other parameters had values of confidence assigned depending on the
methods used to derive the parameter. The model was re-run with a value between the
lower and upper limit randomly chosen for each parameter. The contribution of bait to
lobster diet calculated from 500 runs of the model was plotted as a frequency histogram.
The coefficient of variation of the distribution of outcomes was also calculated.
Results
Estimates of model parameters
Table 1 presents the parameters and estimates used in the mass balance model.
Biomass of lobsters (sub-legal and legal) in the study area at the beginning of the study
period was estimated as 876,096 kg. An estimate of legal-sized biomass, derived from
depletion analysis was provided for the study area (Ian Wright, Department of Fisheries
118
Western Australia, unpublished data). As the biomass of sub-legal lobsters was not
included in this estimate, the proportion of sub-legal to legal sized biomass for the study
area was determined from the annual fishery independent breeding stock survey (IBSS)
(Phillips and Melville-Smith 2005). Biomass of sub-legal lobsters was then added to
biomass of legal sized lobsters determined from depletion analysis to give total biomass of
lobsters. Calculation of biomass had associated error. The same magnitude of error was
used in the calculation of sub-legal biomass from survey data.
The growth coefficient of the population (k) was estimated as 0.043 kg. month-1. The
growth coefficient of the population in the study area was derived from the Von Bertalanffy
curve for this species (Chittleborough 1976) applied to the IBSS sample of the population
(Phillips and Melville-Smith 2005). Error associated with estimating growth in this manner
was considered to be 10%.
The biomass of lobsters immigrating into the study area (I) was estimated as 456,077 kg.
Immigrating biomass was assumed to be a function of the biomass of lobsters in shallow
water (Hyndes et al. 2006) the proportion of these that migrate (Phillips 1983), and
migrating success – where natural mortality (M) and fishing mortality (F) (estimated from
Compulsory Catch and Effort statistics, Department of Fisheries, Western Australia) are
factors that might prevent successful lobster migration. Lower and upper limits for each of
these terms were carried through the calculation of biomass of lobsters immigrating,
providing lower and upper estimates for error calculation.
Emigration (E) from the study area was assumed to be nil since the study area encompasses
the maximum depth which lobsters are known to occur (Chittleborough 1970). This species
is not known to migrate inshore following migration to deep coastal ecosystems. While
long-shore movements have been reported, net longshore movement was estimated to be
approximately nil.
The coefficient of natural mortality was estimated as 0.23, lower and upper error limits of
0.15 and 0.30 respectively (Nick Caputi, Department of Fisheries Western Australia,
unpublished data). Fishing mortality of lobsters (F) in the study area was 664,609 kg. yr-1.
This estimate of fishing mortality was derived from the Compulsory Catch and Effort

119
statistics provided by lobster fishers to the Department of Fisheries, Western Australia.
Error of 2% was included with the estimates to allow for error associated with fishermen
misreporting catches. Misreporting in this fishery is believed to be insignificant as the
fishery is effort-managed.
The reef area in the study area was estimated to be 35,067 ha. Estimates of reef area were
gained by interviewing fishers. Associated error of ± 10% were included with the estimate
to allow for variation.
Food conversion ratio (FCR) was derived from various values for this and other species,
accounting for known reduction in FCR with size/age. The FCR was expressed as wet
weight food items/ lobster weight gain (wwt). The value for FCR used in the model was
9.09. Conversion to wet weight units was done by multiplying FCR and wwt/ dry weight
ratios of common food items (common food items from Waddington et al. in press),
allowing direct comparison of food required to explain observed growth (wwt) to food
available. Lower and upper limits associated with estimates and conversions of FCR were
used for error estimates in the model.
Abundance of natural diet items was determined from diver sampling (Waddington et al. in
press). Abundance of natural diet items was 266 ± 101 kg. ha-1. yr-1. Abundance of natural
diet items was converted into abundance.year-1 using the turnover rate determined by Okey
et al. (2002). Bait input was estimated to be 582,275 kg. yr-1. Bait input was estimated as a
function of potlifts within the study area (415,911) and the average weight of bait added to
each pot (1.4 kg – Eric Barker, Department of Fisheries Western Australia, personal
communication, 2006).
Verification of the constructed model
Biomass of lobsters present within the study area at June 30, 2003 calculated from the mass
balance model was 401 tonnes. Biomass present from depletion analysis was estimated to
be 373 tonnes (Ian Wright, unpublished data). Differences between these two estimates of

120
lobster biomass are less than 7%, suggesting the constructed model is a reasonably robust
representation of the area.
Model outputs
Sufficient natural diet items were present in the benthos to explain biomass accumulation of
lobsters observed over the study period (Fig 1). Food required to account for the estimated
biomass accumulation is 124 kg. ha. yr-1, while 266 kg. ha. yr-1 are available on the
benthos. While some of these potential diet items will be consumed by other organisms
present in this ecosystem, biomass of diet items available are almost double the biomass
required to explain the growth of P. cygnus over the study period.
If lobsters are preferentially feeding on bait in lobster pots rather than foraging over the
reef, bait can potentially contribute 13% of observed lobster biomass increase during the
study period. Given the current study was carried out over one year and because the fishery
for western rock lobsters is seasonal, the potential contribution of bait to lobster production
will vary over the course of the year, reflecting temporal variation in fishing effort. Figure 2
shows the potential contribution of bait (derived from monthly potlift data) relative to
lobster food requirements in the study area. Bait will be most important to lobster
production from December to April. Between December and April, the potential
contribution of bait to lobster production in the study area averages 26%. Highest
contribution is during the months of January (33%) and April (34%), when fishing effort
(hence bait input) is highest.
The results of 500 error simulations (where a value between the upper and lower limit for
each parameter was randomly chosen and run in the model) are shown in Figure 3. Results
indicate the calculated contribution of bait to lobster diet on an ecosystem wide scale
(13.3% ± 3.38 s.d.) is at the middle/ lower end of the distribution of outcomes for the
model. These error simulations suggest our values chosen for each parameter are
reasonably robust with variation 23% of the mean.

121
Discussion
Results from our study indicate bait may contribute approximately 13 % of lobster food
requirements on an ecosystem-wide scale over the course of a year, assuming preferential
consumption of bait. These results suggest Waddington et al. (in press) overestimated the
contribution of bait to lobster diet, likely reflecting sampling of high relief areas during the
fishing season. Distribution of fishing effort is variable on spatial and temporal scales.
Fishers are only allowed to fish during the fishing season and presumably target areas of
high relief reef due to their suitability as lobster habitat. Thus, bait input will reflect
variation in fishing effort. The sites selected for sampling by Waddington et al. (in press)
were high relief areas, with sampling occurring during April/ May (months of high fishing
effort). Selection of sites likely exposed to high fishing effort likely explains the higher
contribution of bait to lobster diet indicated by stable isotope analysis (Waddington et al. in
press).
The maximum contribution of bait to western rock lobster diet over the whole ecosystem is
less than that calculated for the American Lobster, Homarus americanus in the Inshore
Gulf of Maine (Saila et al. 2002). Possible bait subsidies of between one-quarter and one-
third of lobster food requirements were estimated for American lobsters (Saila et al. 2002).
Fishers in the inshore Gulf of Maine add approximately 8.4 kg of bait to the system for
every 1 kg of lobster removed (calculated from data in Saila et al. 2002). This is higher
relative to the 1.13 kg of bait added to the ecosystem under consideration in the current
study, likely reflecting the high proportion of sub-legal lobsters in the Gulf of Maine
populations that have access to the bait and high food requirements of these sub-legal
lobsters (Saila et al. 2002). In both systems, bait is sourced from outside the study area,
meaning it represents a direct subsidy to lobster production (Saila et al. 2002). A
comparison of the biomass of bait added to the ecosystem relative to the net primary
production (taken from Lozano-Montes et al. (submitted)) indicates that bait as a subsidy
represents only 5.8% of the net primary production of these systems. However, given the
high protein content of bait coupled with the oligotrophic nature of Western Australian
ecosystems, the importance of bait to lobster production may be higher than such figures
suggest.

122
Western rock lobsters are attracted to pots by bait (Jernakoff and Phillips 1988), and are
able to enter pots, feed on the bait within the pots, then exit through the neck of the pots
(Jernakoff and Phillips 1988). Further, sub-legal lobsters are able to exit the pots through
escape gaps (305mm × 54mm) required to be fitted to all pots. As sub-legal lobsters can
exit through these fitted escape gaps and are required to be returned to the water if
captured, bait may be more important in subsidizing productivity of sub-legal lobsters
relative to legal sized lobsters. In such an event, bait addition will provide a significant
subsidy to growth of undersize lobsters relative to legal sized lobsters. It has previously
been demonstrated that competition for food may limit the growth rate of lobsters on
coastal reefs (Chittleborough 1976). An increase in food availability through bait addition,
particularly in areas of high lobster density that attract high fishing effort will lead to an
increase in growth rate of these undersize lobsters.
Our model may have overestimated bait contribution to lobster production, as evidence
exists that a proportion of the bait is consumed by sea lice (Natatolana sp.) (Winzer 2007),
and other scavenging species. However, assuming only 50% of bait is eaten by lobsters
directly, this still equates to approximately 6.5 % of lobster food requirements being met by
bait. Further, lobsters feed on sea lice in the lobster pots indicating a secondary feeding
process may occur whereby sea lice feed on bait in lobster pots, and are themselves preyed
upon by lobsters.
Direct predation of western rock lobsters on bait in this ecosystem may reduce the
predation pressure on those taxa consumed by western rock lobsters in the absence of bait.
Natural diet items of western rock lobsters in these ecosystems include crabs, amphipods
and isopods (Waddington et al. in press). Considering the food requirements of lobster
populations, the release of predation pressure on taxa that form the basis of the lobsters’
natural diet may be significant. A reduction in predation pressure on these taxa may lead to
a localized increase in abundance of these taxa, increasing competition with small
invertebrate taxa such as polychaetes.
An increase in abundance of natural lobster prey items will have implications for the
functioning of the ecosystem in areas of high bait input. The extent of these implications

123
will be dependant on the role of these taxa in ecosystem function. Studies have shown that
a reduction in lobster abundance (effectively a reduction in predation pressure) leads to
changes in the abundance and composition of lobster prey communities (Shears and
Babcock 2002; Lafferty 2004; Tegner and Dayton 2000; Langlois et al. 2005). Depending
on the role of these taxa released from predation within the ecosystem, processes occurring
within the ecosystem may be altered. Changes observed in other ecosystems include a
change in algal assemblage structure on temperate New Zealand reefs (Tegner and Dayton
2000; Shears and Babcock 2002). While similar trophic cascades due to a reduction in
predation pressure have not been demonstrated for temperate Western Australian
ecosystems, this may reflect the lack of ‘no-take’ areas in this region allowing large-scale
investigation of such processes.
An increase in abundance of taxa that form the natural diet of lobsters due to a reduction in
predation pressure may be moderated by an increase in abundance of invertebrate taxa that
also consume bait. Isopods also consume bait from pots, so an increase in bait addition will
increase isopod abundance. Since lobsters are known to consume isopods (Waddington et
al. in press), the diet of lobsters will be indirectly subsidised by bait addition.
Without a thorough knowledge of the role of small invertebrate taxa in the functioning of
deep coastal ecosystems, the potential implications of bait addition to the functioning of
these ecosystems can only be speculated upon. The amount of bait added to this ecosystem
annually is significant and it is highly likely that the effects of bait addition are greater than
subsidizing lobster production. Research on the effects of trawling (Dayton et al. 1995;
Cook 2001), and aquaculture (Dempster et al. 2002; Tuya et al. 2006) has demonstrated
that organic matter input can lead to an increase in the abundance of scavenging species.
Dayton et al. (1995) suggested that since scavenging species consume discarded material,
discards has a selective effect on communities, giving scavenging species a competitive
advantage. Similar effects of organic matter input are likely occurring within the western
rock lobster fishery, with the magnitude of effects reflecting spatial and temporal variation
in fishing effort.
Use of a mass balance approach has allowed the potential contribution of bait to lobster
production on an ecosystem-wide scale to be estimated. While the outcome is limited to

124
determining the contribution of bait to lobster production and tells us little regarding further
ecosystem effects, such information is useful when attempting to determine the effect of
bait addition on this ecosystem. Future studies using a more complicated model (eg.
Ecopath) may help when predicting additional effects of bait addition to ecosystems where
lobster fishing occurs.
Worldwide, many forms of fishing gear use bait to capture target species. This study shows
that while the magnitude of bait addition on an ecosystem wide-scale may not be
significant, the fact that bait is targeted at areas where target species are thought to be most
abundant increases the contribution of bait to populations on a localized scale. In fisheries
where bait is commonly discarded or scavengers have ready access to bait without being
captured, bait may have a significant effect on the functioning of ecosystems.
Acknowledgements
We wish to thank researchers at the Department of Fisheries Western Australia, particularly
Eric Barker Lynda Bellchambers, Nick Caputi, Simon de Lestang and Ian Wright who
provided data and estimates used in the construction of the model. We also thank the
various fishermen who provided estimates of reef area within the study area. Helpful
comments from Hector Lozano-Montes improved an earlier version of this manuscript.
Funding for this research was provided by the Fisheries Research and Development
Corporation (FRDC) and the School of Plant Biology at the University of Western
Australia.
References
Bergman, M.J.N., and Hup, M. 1992. Direct effects of beamtrawling on macrofauna in a
sandy sediment in the southern North Sea. ICES J. Mar. Sci. 49: 5-11.
Cancemia, G., De Falcob, G., and Pergenta, G. 2003. Effects of organic matter input from a
fish farming facility on a Posidonia oceanica meadow. Est. Coast. Mar. Sci. 56:
961-968.

125
Castro, M., Arau´jo, A., and Monteiro, P. 2005. Fate of discards from deep water
crustacean trawl fishery off the south coast of Portugal. N.Z. J. Mar. Freshwater
Res. 39: 437–446.
Catchpole, T.L., Frid, C.L.J., and Gray, T.S. 2006. Importance of discards from the English
Nephrops norvegicus fishery in the North Sea to marine scavengers. Mar. Ecol.
Prog. Ser. 313: 215–226.
Chittleborough, R.G. 1970. Studies on recruitment in the Western Australian rock lobster,
Panulirus longipes cygnus George: Density and natural mortality of juveniles. Aust.
J. Mar. Freshw. Res. 21: 131-148.
Chittleborough, R.G. 1976. Growth of juvenile Panulirus longipes cygnus George on
coastal reefs compared with those reared under optimal environmental conditions.
Aust. J. Mar. Freshw. Res. 27: 279-295.
Chittleborough, R.G., and Phillips, B.F. 1975. Fluctuations of year class strength and
recruitment in the western rock lobster Panulirus longipes (Milne Edwards). Aust. J.
Mar. Freshw. Res. 26: 317-328.
Cobb, J.S. 1981. Behaviour of the Western Australian spiny lobster in the field and
laboratory. Aust. J. Mar. Freshw. Res. 32: 399-409.
Cook, R. 2001. The magnitude and impact of by-catch mortality by fishing gear. Reykjavik
Conference on Responsible Fisheries in the Marine Ecosystem, Reykjavik, Iceland
1-4 October 2001.
Cresswell GR (1991) The Leeuwin Current - observations and general models. Journal of
the Royal Society of Western Australia 74: 1-14
Cushing, D.H. 1971. Upwelling and the production of fish. Adv. Mar. Biol. 9: 255-334.
Daskalov, G.M. 2002. Overfishing drives a trophic cascade in the Black Sea. Mar. Ecol.
Prog. Ser. 225: 53-63.
Daskalov, G.M., Grishin, A.N., Rodionov, S., and Mihneva, V. 2007. Trophic cascades
triggered by overfishing reveal possible mechanisms of ecosystem regime shifts.
Proc. Natl. Acad. Sci. 104: 10518-10523.
Dayton, P.K., Thrush, S.F., Agardy, M.T., and Hofman, R.J. 1995. Environmental effects
of marine fishing. Aquat. Conserv. Mar. Freshwater. Ecosyst. 5: 205-232.
Dempster, T., Sanchez-Jerez, P., Bayle-Sempere, J.T., Giménez-Casalduero, F., and Valle,
C. 2002. Attraction of wild fish to sea-cage fish farms in the south-western

126
Mediterranean Sea: spatial and short-term temporal variability. Mar. Ecol. Prog.
Ser. 242: 237–252.
Edgar, G.J. 1990. Predator-prey interactions in seagrass beds. I. The influence of
macrofaunal abundance and size-structure on the diet and growth of the western
rock lobster Panulirus cygnus George. J. Exp. Mar. Biol. Ecol. 139: 1-22.
Fa, J.E., Peres, C.A., and Meeuwig, J. 2002. Bushmeat exploitation in tropical forests: an
intercontinental comparison. Conserv. Biol. 16: 232-237.
Fletcher, W.J., and Head, F. 2006. State of the fisheries report. Department of Fisheries,
Perth Australia. Available from http://www.fish.wa.gov.au/docs/sof/index.php
Groenewold, S., and Fonds, M. 2000. Effects on benthic scavengers of discards and
damaged benthos produced by the beam-trawl fishery in the southern North Sea.
ICES J. Mar. Sci. 57: 1395-1406.
Hall, S. J. 1999. The effects of fishing on marine ecosystems and communities. Blackwell
Science, Oxford.
Howard, R.K. 1988. Fish predators of the western rock lobster Panulirus cygnus George in
a nearshore nursery habitat. Aust. J. Mar. Freshw. Res. 39: 307-316.
Hyndes, G.A., MacArthur, L., Babcock, R.C., and Vanderklift, M. 2006. Ecological
Interactions in Coastal Marine Ecosystems: Rock Lobster CSIRO. Strategic
Research Fund for the Marine Environment (SRFME). Marine and Atmospheric
Research Perth unpublished report
Jernakoff, P., and Phillips, B.F. 1988. Effect of a baited trap on the foraging movements of
juvenile western rock lobsters, Panulirus cygnus George. Aust. J. Mar. Freshw. Res.
39: 185-192.
Jernakoff, P., Phillips, B.F., and Fitzpatrick, J.J. 1993. The diet of post-puerulus western
rock lobster, Panulirus cygnus George, at Seven Mile Beach, Western Australia.
Aust. J. Mar. Freshw. Res. 44: 649-655.
Joll, L.M. 1977. Growth and food intake of Octopus tetricus (Mollusca: Cephalopoda) in
aquaria. Aust. J. Mar. Freshw. Res. 28: 45-56.
Joll, L.M., and Phillips, B.F. 1984. Natural diet and growth of juvenile western rock lobster
Panulirus cygnus George. J. Exp. Mar. Biol. Ecol. 75: 145-169.
Kaiser, M.J., Ramsay, K., Richardson, C.A., Spence, F.E., and Brand, A.R. 2000. Chronic
fishing disturbance has changed shelf sea benthic community structure. J. Anim.
Ecol. 69: 494-503.

127
Lafferty K.D. 2004. Fishing for lobsters indirectly increases epidemics in sea urchins. Ecol.
App. 14: 1566-1573.
Langlois, T.J., Anderson, M.J., Babcock, R.C. 2005. Reef-associated predators influence
adjacent soft-sediment communities. Ecology 86: 1508-1519.
Lenanton, R.C., Joll, L., Penn, J., and Jones, K. 1991. The influence of the Leeuwin Current
on coastal fisheries of Western Australia. J. Roy. Soc. Western Australia 74: 101-
114.
Lozano-Montes, H.M., Loneragan, N.R., Babcock, R.C., and Jackson, K. submitted. Using
trophic flows and ecosystem structure to model the effects of fishing in the Jurien
Bay Marine Park, temperate Western Australia.
Okey, T.A. 2003. Macrobenthic colonist guilds and renegades in Monterey Canyon (USA)
drift algae: Partitioning multidimensions Ecol. Monogr. 73: 415-440.
Pauly, D., Christensen, V., and Walters, C. 2000. Ecopath, Ecosim, and Ecopath as tools
for evaluating ecosystem impact on fisheries. ICES J. Mar. Sci. 57: 697-706.
Phillips, B.F. 1983. Migrations of pre-adult western rock lobsters, Panulirus cygnus in
Western Australia. Mar. Biol. 76: 311-318.
Phillips, B.F., and Melville-Smith, R. 2005. Sustainability of the western rock lobster
fishery: A review of past progress and future challenges. Bull. Mar. Sci. 76: 485-
500.
Phillips, D.L., and Gregg, J.W. 2003. Source partitioning using stable isotopes: coping with
too many sources. Oecologia 136: 261-269.
Probert, P.K., McKnight, D.G., and Grove, S.L. 1997. Benthic invertebrate bycatch from a
deep-water trawl fishery, Chatham Rise, New Zealand. Aquat. Conserv. Mar.
Freshwater. Ecosyst. 7: 27-40.
Ramsay, K., Kaiser, M.J., Moore, P.G., and Hughes, R.N. 1997. Consumption of fisheries
discards by benthic scavengers: utilization of energy subsidies in different marine
habitats. J. Anim. Ecol. 66: 884-896.
Saila, S.B., Nixon, S.W., and Oviatt, C.A. 2002. Does lobster trap bait influence the Maine
inshore trap fishery? Nth Am. J. Fish. Manage. 22: 602-605.
Shears, N.T., and Babcock, R.C. 2002. Marine reserves demonstrate top-down control of
community structure on temperate reefs. Oecologia 132: 131-142.

128
Stevens, J.D., Bonfil, R., Dulvy, N.K., and Walker, P.A. 2000. The effects of fishing on
sharks, rays, and chimaeras (chondrichthyans), and the implications for marine
ecosystems. ICES J. Mar. Sci. 57: 476-494.
Taipale, S., Kankaala, P., and Jones, R.I. 2007. Contributions of different organic carbon
sources to Daphnia in the pelagic foodweb of a small polyhumic lake: Results from
mesocosm (DIC)-C-13-additions. Ecosystems 10: 757-772.
Tegner, M.J., and Dayton, P.K. 2000. Ecosystem effects of fishing in kelp forest
communities. ICES J. Mar. Sci. 57: 579-589.
Turner, S.J., Thrush, S.F., Hewitt, J.E., Cummins, V.J., and Funnell, G. 1999. Fishing
impacts and the degradation or loss of habitat structure. Fish. Manage. Ecol. 6: 401-
420.
Tuya, F., Sanchez-Jerez, P., Dempster, T., Boyra, A., and Haroun, R.J. 2006. Changes in
demersal wild fish aggregations beneath a sea-cage fish farm after the cessation of
farming. J. Fish Biol. 69: 682-697.
Vita, R., Marin, A., and Marin, R.A. 2007. Environmental impact of capture-based bluefin
tuna aquaculture on benthic communities in the western Mediterranean. Aquacult.
Res. 38: 331-339.
Waddington, K., Bellchambers, L., Vanderklift, M., Walker, D. In press. Western rock
lobsters (Panulirus cygnus George.) in Western Australian deep-coastal ecosystems
(35-60 m) are more carnivorous than those in shallow-coastal ecosystems. Est.
Coast. Shelf. Sci.
Wassenberg, T.J., and Hill, B.J. 1987. Feeding by the sand crab Portunus pelagicus on
material discarded from prawn trawlers in Moreton Bay, Australia. Mar. Biol. 95:
387-393.
Winzer, A. 2007. Biology and prevalence of Cirolana hesperia and their effect on the
Western Rocklobster fishery. PhD thesis. Murdoch University, Perth, Australia.
Wright, I., Caputi, N., and Penn, J.W. 2006. Depletion based population estimates for
western rock lobster (Panulirus cygnus) fishery in Western Australia. N.Z. J. Mar.
Freshwater Res. 40: 107-122.
Yi Zhou, Y., Yang, H., Zhang, T., Liu, S., Zhang, S., Liu, Q., Xiang, J., and Zhang, F.
2006. Influence of filtering and biodeposition by the cultured scallop Chlamys
farreri on benthicpelagic coupling in a eutrophic bay in China. Mar. Ecol. Prog.
Ser. 317: 127-141.

129
Table
Table 1. Table of parameters used in the study.
* Values for immigration were highly variable about the mean. However, biomass caught
during migration (determined from SRFME survey data and probability of capture during
migration) were compared to actual captures by fishermen during the migratory period and
were found to be within 2.40%. This increased the confidence of the authors in using the
mean value to estimate migration, but did contribute to high variability in the model.
Parameter Variable Units Value Lower Limit Upper Limit How Derived (Source)
Bt0 Biomass at time 0 kg-1 876,096 841,402 910,789 Biomass of legal sized lobsters were calculated using depletion analysis described by Wright et al. (2006). Sub
legal biomass added using a sample distribution from 2002 survey of population (Phillips and Melville
2005).
k Growth coefficient kg. month-1 0.043 0.0387 0.0473 Von Bertalanffy curve (Chittleborough 1976) applied to size distribution from 2002 survey of population (Phillips
and Melville-Smith 2005).
I Immigration* kg. year-1 456,077 302,015 1,208,669 Derived from (Hyndes, G.A., MacArthur, L., Babcock, R.C., and Vanderklift, M. 2006. CSIRO Marine and
Atmospheric Research Perth unpublished report)
M Natural mortality coefficient 0.23 0.15 0.30 Dr Nick Caputi, Department of Fisheries Western Australia, personal communication, 2006.
F Fishing mortality kg 664,609 651,317 677,901 Compulsory fishers' monthly catch and effort statistics (CAES) obtained by the Department of Fisheries, Western
Australia.
E Emigration kg. year-1 0 0 0 Assumed to be nil. Very little emigration from breeding grounds occurs for this species.
Estimated reef area ha 35,067 31,560 38,573 Derived from estimates of reef area by surveying fishermen (± 10%)
FCR Food Conversion Ratio (wwt food items)/ wwt gain 9.09 7.63 10.55
FCR × (wwt/dwt ratio of lobster dietary items)
Abundance natural diet items kg. ha-1.yr-1 266 ± 101 Benthic diver sampling. Biomass present multiplied by the P:B ratio (turnover rate) determined by Okey et al.
2002.
Bait input kg 582,275 Number of pots deployed (from CAES stats) × 1.4kg (Average weight of bait per pot, Eric Barker, Department of
Fisheries Western Australia personal communication, 2006)

130

131
Figures
Figure 1. Food required to support observed lobster growth vs. food available (as natural
diet items and bait). Error bars represent standard error.
Figure 2. Temporal patterns in the potential contribution of bait to lobster diet during the
study period.

132
Figure 3. Result of 500 error simulations showing distribution of possible contribution of
bait to lobster diet. Arrow represents potential contribution of bait to lobster diet calculated
from the model (13.3% ± 3.38). The coefficient of variation of the distribution of outcomes
was 0.23.

133

SynthesisWhat is the role of western rock lobsters in these
deep-coastal ecosystems?
Chapter 2Where do the lobsters occur?Biotic composition of these
ecosystems
Stable Isotope Analysis
Gut content analysis
Chapter 3What do lobsters consume
in these ecosystems?
Chapter 7 Nutritional condition of lobsters
Chapter 6 Mass balance approach
What else do lobsters eat? Bait?
Chapter 4 P. cygnusConsumer-diet discrimination
Chapter 5 Sensitivity of variation in consumer-diet discrimination to calculated dietary composition
Appendix 2 Gut evacuation rates of western rock lobsters
Verification of Techniques
Appendix 3 Comparison of techniques for determining lobster nutritional condition
Chapter 2Where do the lobsters occur?Biotic composition of these
ecosystems
Stable Isotope Analysis
Gut content analysis
Chapter 3What do lobsters consume
in these ecosystems?
Stable Isotope Analysis
Gut content analysis
Chapter 3What do lobsters consume
in these ecosystems?
Chapter 7 Nutritional condition of lobsters
Chapter 6 Mass balance approach
What else do lobsters eat? Bait?
Chapter 4 P. cygnusConsumer-diet discrimination
Chapter 5 Sensitivity of variation in consumer-diet discrimination to calculated dietary composition
Appendix 2 Gut evacuation rates of western rock lobsters
Verification of Techniques
Appendix 3 Comparison of techniques for determining lobster nutritional condition
135
Chapter Seven – Spatial and temporal variation in nutritional condition
of western rock lobsters (Panulirus cygnus) in Western Australian deep-
coastal ecosystems.

136
Abstract
Nutritional condition of lobsters was investigated at two sites offshore of Jurien Bay during
the 2006/2007 commercial fishing season, to investigate if nutritional condition of the
western rock lobster (Panulirus cygnus) changed in response to perceived differences in
fishing effort/bait input. Lobster nutritional condition was determined to be variable on
temporal, but not spatial scales. Observed temporal variation in lobster nutritional condition
most likely reflects lobster moult stage rather than bait input from the fishery, as
hypothesised. Results of this study indicate that future studies using nutritional condition to
investigate the effect of bait addition on rock lobster populations should sample lobsters
from a greater number of smaller areas that have known differences in bait input.
Introduction
The nutritional condition of a consumer is a reflection of the quality and quantity of food
consumed (Moore et al. 2000). Spatial and temporal variation in the nutritional condition of
a consumer will reflect variation in the quality or quantity of food resources over these
scales. Since diet of spiny lobsters is known to reflect food availability (Edgar 1990;
Jernakoff et al. 1993), variation in nutritional condition of lobster populations will reflect
spatial and temporal variation in food availability. For example, spatial variation in the
nutritional condition of the Hawaiian spiny lobster, Panulirus marginatus has been
suggested to relate to spatial differences in food availability (Parrish and Martinelli-Liedtke
1999).
Spiny lobster nutritional condition is linked to lobster growth (Chittleborough 1976; Joll
and Phillips 1984), so differences in spiny lobster nutritional condition may indicate
whether food availability is limiting lobster growth or survival (Moore et al. 2000). A link
between food availability and growth has previously been suggested for the western rock
lobster in shallow water ecosystems (Edgar 1990). In shallow water, it was hypothesised
that localised settlement of the trochid mollusc, Cantharidus lepidus may contribute to
higher growth rates of lobsters observed at one locality (Edgar 1990).

137
Current research suggests that bait input from the lobster fishery can be important to the
diet of western rock lobster (Panulirus cygnus) populations in Western Australian deep-
coastal ecosystems (35-60 m). Bait is used in lobster pots to attract lobsters to pots, so bait
input in deep-coastal ecosystems reflects spatial and temporal distribution of fishing effort.
Stable isotope analyses has indicated bait may form a significant proportion of lobster
dietary requirements in heavily fished areas during the fishing season (Chapter Three/
Waddington et al. in press). Since bait will increase food available to lobsters where fishing
occurs, the nutritional condition of lobsters in such areas may be higher than surrounding
areas, reflecting the uneven distribution of fishing effort. However, such an increase in
lobster nutritional condition will only occur if i) lobsters have access to and consume the
bait, and ii) bait input leads to an increase in food quality or quantity in areas where bait
input occurs. As sub-legal lobsters can exit pots and are required to be released if captured,
any increase in lobster nutritional condition as a result of bait input should be more
noticeable amongst sub-legal lobsters.
Here variation in lobster nutritional condition in response to variation in fishing effort (and
bait input) will be investigated. Fishing effort varies on spatial scales due to the unequal
fishing of reef habitat by fishers. High relief areas will presumably be fished more heavily
as these areas are characteristic lobster habitat (Cobb 1981). The fishery for western rock
lobsters is seasonal (operating between November and June annually), meaning fishing
effort is temporally variable. Further, upon commencement of the fishing season fishers
target migrating lobsters in shallow water (<20 m) (Phillips 1983; Brown et al. 1995) with
fishing in deep-coastal ecosystems rarely commencing until January. These gradients in
fishing effort will be used to determine the importance of bait to lobster nutrition by
investigating spatial and temporal variation in lobster nutritional condition. Nutritional
condition of sub-legal lobsters was investigated periodically at two sites of contrasting
relief during the 2006/2007 fishing season. The null hypotheses, that no (i) spatial or (ii)
temporal differences in lobster nutritional condition occur are tested.
138
Methods
Weight of digestive gland relative to lobster size (RWDG) was used to determine lobster
nutritional condition. RWDG was used as it is a simple measure, effective at identifying
variation in western rock lobster nutritional condition (Dall 1974; Appendix Three).
Sampling occurred between October 2006 and June 2007 at two sites offshore of Jurien
Bay (30° 17’ S, 115° 02’ E). One site, ‘The Lumps’ is high relief (ledges of ~1 m common
at this site) while the other site, referred to as ‘The Second Bank’ is characteristically low
relief (ledges exceeding 0.2 m uncommon at this site) (Average relief determined from ~5
km of towed video in these areas). Water depth at both sites is approximately 50 m.
Collection of lobsters occurred approximately monthly, with six sampling events at The
Lumps and four sampling events at The Second Bank. However, as lobsters were collected
from commercial vessels, collection of lobsters from each site on each occasion was not
possible.
Male lobsters, 65-76 mm carapace length (CL) were collected using baited traps deployed
overnight. Captured lobsters were immediately immersed in an ice bath to induce a chill
coma. Lobster size (CL) was then determined (±0.1 mm), a pleopod removed for moult
stage determination and digestive glands removed. Upon removal, digestive glands were
immediately frozen.
In the laboratory, samples were dried in a freeze-dryer (Heto model FD 4.0 freeze dryer)
for 96 hours until completely dry. Relative weight of lobster digestive gland (RWDG) was
calculated as:
(CL) (mm) sizelobster
(g) gland digestive of dry weight RWDG =.
Data analysis
To eliminate effects of moult state and reproductive state on nutritional condition (Heath
and Barnes 1970; Dall 1975; Musgrove 2001; Waddington et al. 2005), analysis of
139
nutritional condition was restricted to male intermoult lobsters. Data were analysed using
two-way Analysis of Variance (ANOVA). The effect of the factors ‘site’ (2 levels, fixed
factor) and ‘days since season start’ (8 levels, random factor) on RWDG were investigated.
As the collection of samples from each site at each sampling time was not possible, the
‘area × days since season start’ interaction term could not be tested.
Results
The relative weight of digestive gland (RWDG) of lobsters collected during this study
ranged between 0.034 and 0.133. Lobster RWDG of 0.034 represents a nutritional
condition slightly lower than that reported for lobsters fed (3.09 ± 0.19 g. dw. muscle
tissue. lobster-1) weekly in laboratory experiments (Appendix Three). RWDG of 0.133
approximates the nutritional condition recorded for lobsters fed (3.09 ± 0.19 g. dw. muscle
tissue. lobster-1) daily in laboratory experiments (Appendix Three). The average RWDG of
lobsters collected during this study was 0.088 approximating the nutritional condition of
lobsters fed once every one to three days in the laboratory (Appendix Three).
Site of collection had no significant effect on lobster nutritional condition (F1,75 = 1.93; p =
1.69) (Fig. 7.1). In contrast, days since season start had a significant effect on RWDG (F7,75
= 3.29; p = 0.005), indicating lobster nutritional condition was variable on temporal scales.
Post hoc Tukey tests indicated the RWDG of lobsters sampled 8 days after the season
started was significantly higher than the RWDG of lobsters sampled 114 days (p=0.029),
174 days (p=0.003), and 205 days (p<0.001) after the season started. RWDG of lobsters
sampled 51 days after the season started was also significantly higher (p=0.005) than the
RWDG of lobsters sampled 205 days after the season started.
Discussion
This study has demonstrated that the nutritional condition of western rock lobsters in deep-
coastal ecosystems at Jurien Bay is variable over the temporal scales investigated, but not
over the spatial scales. Thus, the null hypothesis – that no temporal differences in lobster

140
nutritional condition occur, is rejected. Average nutritional condition of lobsters in the
current study was comparable to the nutritional condition of lobsters fed every day to three
days in the laboratory (Appendix Three). Considering lobsters can survive more than three
months starvation in the laboratory (Chittleborough 1974), lobsters collected during the
current study are not thought to be nutritionally stressed.
While nutritional condition of lobsters in this study was variable on temporal scales,
observed variation was not consistent with variation in nutritional condition expected if bait
addition to these ecosystems was significant in lobster production. If bait addition was
increasing the condition of lobsters as hypothesised, nutritional condition would be
expected to increase as fishing effort in deep-coastal ecosystems increases. Upon opening
of the commercial fishing season, the migratory ‘white’ western rock lobsters are targeted
in shallow water (George 1958), meaning fishing in deep-coastal ecosystems does not
commence until approximately 35 days after the fishing season begins (Phillips 1983;
Brown et al. 1995). In the months following the commencement of fishing in deep-coastal
ecosystems, the nutritional condition of lobsters is lower than in the months prior. Bait
input therefore appears to have no observable effect on the nutritional condition of lobsters
in deep-coastal ecosystems. Instead, some other factor(s) might be driving observed
temporal variation in lobster nutritional condition.
Temporal variation in lobster nutritional condition observed in the current study likely
reflects lobster moult stage. Growth in P. cygnus has been described as a lengthy
physiological process involving short moulting periods, followed by longer intermoult
periods during which the animal gains weight and builds up muscle and other tissue
(Melville-Smith et al. 1997). Nutritional condition of collected lobsters may also be
variable during the intermoult period reflecting this weight gain and muscle buildup. While
analysis of lobster nutritional condition was restricted to lobsters in intermoult in the
current study, variation in nutritional condition could occur within the intermoult period,
explaining observed temporal patterns in lobster nutritional condition.
Lobsters of the size range investigated have been recorded to moult twice annually, once
between February and April and again sometime between the end of the fishing season and
prior to the season beginning in November (Melville-Smith et al. 1997). Due to lack of

141
captures during the closed season, Melville-Smith et al. (1997) could not refine estimates of
the timing of this second moult event. In the current study, a decline in lobster nutritional
condition was observed during the first moult period in February/March. While this decline
was not significant, such a decline may reflect a reduction in lobster nutritional condition
associated with moulting as has been reported for other lobster species (Heath and Barnes
1970; Musgrove 1998).
No spatial variation in lobster nutritional condition was observed. Lack of spatial variation
in lobster nutritional condition may be because bait input does not lead to an increase in the
quality or quantity of food available to lobster populations. Waddington and Meeuwig
(submitted/Chapter Six) have previously demonstrated that prey items are unlikely to be
limiting in these deep-coastal ecosystems. If sufficient natural food resources are present,
an increase in fishing effort may not lead to identifiable differences in food availability,
except in areas of high lobster density. At high lobster densities, the competition for food
resources between individuals increases (Chittleborough 1976). The sites sampled in this
study are likely too large to allow differences in lobster nutritional condition arising as a
result of increased competition/density to be detected (the lumps cover an area of ~10 km2,
whilst the second bank covers an area of 38 km2). Differences in lobster density leading to
variability in competition likely occur on a scale smaller than the area of the study sites. In
this case, within site variation will mask any between site variation in lobster nutritional
condition.
Conclusions
While the current study failed to identify differences in lobster nutritional condition relating
to spatial or temporal variation in fishing effort and bait input, temporal differences in
lobster nutritional condition were detected. These temporal differences in lobster nutritional
condition most likely relate to lobster’s moult cycle. Furthermore, no differences in lobster
nutritional condition would be detected upon addition of bait if lobsters already have
sufficient natural diet items available. In such cases, lobsters may only become nutritionally
stressed when they occur in high densities, increasing competition for food resources on a
localised scale. Future studies seeking to investigate variation in nutritional condition
142
should target small sampling areas with known gradients in lobster abundance and/or
fishing effort. This was not possible in the current study as sampling from commercial
vessels was a requirement. With the above changes in sampling strategy, temporal and
spatial variation in western rock lobster nutritional condition could be determined more
accurately.
References
Brown RS, Caputi N, Barker E (1995) A preliminary assessment of increases in fishing
power on stock assessment and fishing effort expended in the western rock lobster
(Panulirus cygnus) fishery. Crustaceana 68: 227-237
Chittleborough RG (1974) Review of prospects for rearing rock lobsters. Australian
Fisheries 33: 4-8
Chittleborough RG (1976) Growth of juvenile Panulirus longipes cygnus George on coastal
reefs compared with those reared under optimal environmental conditions.
Australian Journal of Marine and Freshwater Research 27: 279-295
Cobb JS (1981) Behaviour of the Western Australian spiny lobster in the field and
laboratory. Australian Journal of Marine and Freshwater Research 32: 399-409
Dall W (1974) Indices of nutritional state in the western rock lobster, Panulirus longipes
(Milne Edwards). I. Blood and tissue constituents and water content. Journal of
Experimental Marine Biology and Ecology 16: 167-180
Dall W (1975) Indices of nutritional state in the western rock lobster, Panulirus longipes
(Milne Edwards). II. Gastric fluid constituents. Journal of Experimental Marine
Biology and Ecology 18: 1-18
Edgar GJ (1990) Predator-prey interactions in seagrass beds. I. The influence of
macrofaunal abundance and size-structure on the diet and growth of the western
rock lobster Panulirus cygnus George. Journal of Experimental Marine Biology and
Ecology 139: 1-22

143
George RW (1958) The status of the "white" crayfish in Western Australia. Australian
Journal of Marine and Freshwater Research 9: 537–545
Heath JR, Barnes H (1970) Some changes in biochemical composition with season and
during the moulting cycle of the common shore crab, Carcinus meanus. Journal of
Experimental Marine Biology and Ecology 5: 199-233
Jernakoff P, Phillips BF, Fitzpatrick JJ (1993) The diet of post-puerulus western rock
lobster, Panulirus cygnus George, at Seven Mile Beach, Western Australia.
Australian Journal of Marine and Freshwater Research 44: 649-655
Joll LM, Phillips BF (1984) Natural diet and growth of juvenile western rock lobster
Panulirus cygnus George. Journal of Experimental Marine Biology and Ecology 75:
145-169
Melville-Smith R, Jones JB, Brown RS (1997) Biological tags as moult indicators in
Panulirus cygnus George. Marine and Freshwater Research 48: 959-965
Moore LE, Smith DM, Loneragan NR (2000) Blood refractive index and whole-body lipid
content as indicators of nutritional condition for penaeid prawns (Decapoda:
Penaeidae). Journal of Experimental Marine Biology and Ecology 244: 131-143
Musgrove RJB (1998) Condition and its assessment in the southern rock lobster Jasus
edwardsii. I. Assessment of condition indices and moult staging techniques.
Fisheries Research and Development Corporation Project 95/017
Musgrove RJB (2001) Interactions between haemolymph chemistry and condition in the
southern rock lobster, Jasus edwardsii. Marine Biology 139: 891-899
Parrish FA, Martinelli-Liedtke TL (1999) Some preliminary findings on the nutritional
status of the Hawaiian spiny lobster (Panulirus marginatus). Pacific Science 53:
361-366
Phillips BF (1983) Migrations of pre-adult western rock lobsters, Panulirus cygnus, in
Western Australia. Marine Biology 76: 311-318

144
Waddington K, Bellchambers L, Vanderklift M, Walker D (in press) Western rock lobsters
(Panulirus cygnus George.) in Western Australian deep-coastal ecosystems (35-60
m) are more carnivorous than those in shallow-coastal ecosystems. Estuarine
Coastal and Shelf Science
Waddington K, Melville-Smith R, Walker D, Knott B (2005) Effect of reproductive state
and sex on movement and food consumption of western rock lobster (Panulirus
cygnus) in a tank environment New Zealand Journal of Marine and Freshwater
Research 39: 365-372
Figure
Fig. 7.1: Nutritional condition of lobsters collected from two sites offshore of Jurien Bay
during 2006/2007 fishing season. Dashed lines represent commencement of the commercial
fishing season and commencement of fishing in deep-coastal ecosystems.

145

SynthesisWhat is the role of western rock lobsters in these
deep-coastal ecosystems?
Chapter 2Where do the lobsters occur?Biotic composition of these
ecosystems
Stable Isotope Analysis
Gut content analysis
Chapter 3What do lobsters consume
in these ecosystems?
Chapter 7 Nutritional condition of lobsters
Chapter 6 Mass balance approach
What else do lobsters eat? Bait?
Chapter 4 P. cygnusConsumer-diet discrimination
Chapter 5 Sensitivity of variation in consumer-diet discrimination to calculated dietary composition
Appendix 2 Gut evacuation rates of western rock lobsters
Verification of Techniques
Appendix 3 Comparison of techniques for determining lobster nutritional condition
Chapter 2Where do the lobsters occur?Biotic composition of these
ecosystems
Stable Isotope Analysis
Gut content analysis
Chapter 3What do lobsters consume
in these ecosystems?
Stable Isotope Analysis
Gut content analysis
Chapter 3What do lobsters consume
in these ecosystems?
Chapter 7 Nutritional condition of lobsters
Chapter 6 Mass balance approach
What else do lobsters eat? Bait?
Chapter 4 P. cygnusConsumer-diet discrimination
Chapter 5 Sensitivity of variation in consumer-diet discrimination to calculated dietary composition
Appendix 2 Gut evacuation rates of western rock lobsters
Verification of Techniques
Appendix 3 Comparison of techniques for determining lobster nutritional condition
147
Chapter Eight – Synthesis
The aim of this thesis was to determine the diet and trophic role of western rock lobsters
(Panulirus cygnus George.) in Western Australian deep-coastal ecosystems. Determination
of lobster dietary composition and trophic role is an important component in assessment of
the ecosystem effects of fishing on these deep-coastal ecosystems. Moreover, this study
provided an unusual opportunity to consider the trophic role of a major consumer in an
oligotrophic deep water system in which herbivores occur in low abundances (Fowler-
Walker and Connell 2002).
Major Findings
Natural prey of lobsters in deep-coastal ecosystems included crabs, amphipods/isopods,
bivalves/gastropods, sponge and foliose red algae. Lobsters occupied a trophic position
consistent with secondary consumers reflecting the high proportion of animal prey in their
diet. Lobster diet was related to prey availability on the benthos with highly abundant
macroinvertebrate fauna such as crabs and amphipods/isopods most commonly consumed.
Further, differences in lobster dietary composition between locations likely reflect
differences in food availability between study locations.
Lobster diet and trophic position differed between deep-coastal ecosystems and shallow
water (<10 m) ecosystems in this region (Joll and Phillips 1984; Edgar 1990; Jernakoff et
al. 1993; LD MacArthur, Edith Cowan University, unpublished data). Lobsters in deep-
coastal ecosystems had a trophic position of ~2.0 consistent with the finding that they are
primarily carnivorous. In contrast, lobsters from shallow water ecosystems had a trophic
position between 1.5 and 1.6 (Lachlan MacArthur, Edith Cowan University, personal
communication 2008) reflecting the higher importance of algae to lobster nutrition in
shallow water ecosystems (Joll and Phillips 1984; Edgar 1990; Jernakoff et al. 1993). There
was overlap in the size range of lobsters from shallow water and deep-coastal ecosystems,
suggesting it is unlikely lobster size/ontogenetic stage is driving observed differences in
lobster diet. It is more likely that differences in lobster diet and trophic position are driven

148
by differences in prey availability and prey choice between these ecosystems. Molluscs
were infrequently consumed in deep-coastal ecosystems relative to shallow water
ecosystems reflecting low abundance of molluscs in benthic samples collected from deep-
coastal ecosystems. Two species of coralline algae commonly consumed by lobsters in
shallow water ecosystems (Jania affinis and Amphiroa anceps) (Joll and Phillips 1984)
were not observed to be consumed in the current study despite being abundant in deep-
coastal ecosystems, indicating differences in diet also reflect lobster prey choice.
Bait was found to be an important component of lobster diet in this study, indicating fishing
is directly affecting processes in deep-coastal ecosystems. Since bait is imported from
outside these ecosystems, bait represents a direct subsidy to lobster production in these
areas. Drawing on evidence from gut content analysis, stable isotope analysis and mass
balance modeling, it can be concluded that bait likely contributes approximately 10% of
lobster dietary requirements. The high contribution of bait to lobster diet estimated by
stable isotope analysis resulted from collection of stable isotope samples from heavily
fished areas during peak fishing season. Once this spatial and temporal variation in fishing
effort and bait input was accounted for, results from stable isotope analysis complemented
results from mass balance modeling. Mass balance modeling also determined that sufficient
natural prey were present on the benthos to support estimated lobster production in deep-
coastal ecosystems, indicating lobsters may preferentially feed within lobster pots in deep-
coastal ecosystems. In addition to providing a ready source of nutrition, feeding on bait in
pots may convey benefits to the lobsters in terms of reduced predation risk. Communal
defense and use of shelter are two behaviours used by spiny lobsters to reduce the risk of
predation (Zimmer-Faust et al. 1985; Zimmer-Faust and Spanier 1987; Eggleston and
Lipcius 1992). Lobster pots provide a ready source of food and shelter for lobsters,
allowing lobsters to exhibit gregarious behaviour while feeding. Lobster pots provide food
and shelter to groups of lobsters which likely encourage lobsters to preferentially feed
within lobster pots rather than foraging across reef habitat where lobsters may be exposed
to a greater risk of predation. It is also possible that lobsters may display a dietary
preference for bait over naturally occurring dietary items. Pilchards were readily consumed
by lobsters in laboratory studies and spiny lobsters have previously demonstrated
preference for different diet types (Griffiths and Seiderer 1980; Zimmer-Faust 1993; Barkai
et al. 1996; Mayfield et al. 2001). Further studies should be conducted to investigate

149
behaviours associated with lobsters preferentially feeding within lobster pots and lobster
prey preference. Such studies will provide an understanding of behaviours associated with
trap entry which will be important when assessing the ecosystem impacts of using baited
pots to capture spiny lobsters.
Potential effects of bait addition on deep-coastal ecosystems
Addition of bait to deep-coastal ecosystems, particularly oligotrophic systems will likely
have implications for processes occurring within these ecosystems. Addition of organic
matter to marine ecosystems increases the food available to scavenging species that would
be unavailable under normal circumstances (Castro et al. 2005). Western rock lobsters
along with crabs and amphipods/isopods are known scavengers (Gray 1992; Kaiser and
Spencer 1994; Groenewold and Fonds 2000; Winzer 2007), so these taxa likely derive
nutritional benefit from the addition of bait to these deep-coastal ecosystems. As lobsters
also consume crabs and amphipods/isopods in deep-coastal ecosystems, the addition of bait
may also benefit lobsters indirectly by increasing the biomass of these important lobster
prey (Figure 8.1). However, the effect of bait addition on the functioning of these deep-
coastal ecosystems is currently unknown. Manipulative experiments may be useful in
determining the effects of bait addition on these deep-coastal ecosystems. Results from
such manipulative experiments will have implications for other trap-based fisheries.
Evaluation of stable isotope and gut content analyses as tools in ecological research
Stable isotope analysis and gut content analysis are two techniques commonly used for
dietary studies. Both of these techniques have underlying assumptions that can affect the
results provided by these methods. To ensure results from dietary analysis were robust, this
thesis included an investigation of the assumptions underlying the calculation of lobster
dietary composition using these techniques. A laboratory study was conducted to determine
consumer-diet discrimination for western rock lobsters. Consumer-diet discrimination is an
important parameter when estimating consumer dietary composition from stable isotope
data (e.g. Ben-David et al. 1997; Whitledge and Rabeni 1997; Phillips 2001). Consumer-

150
diet discrimination has also been reported as variable between species (Vanderklift and
Ponsard 2003), and to deviate from values traditionally used to estimate discrimination
(DeNiro and Epstein 1978; Minagawa and Wada 1984). To provide complete confident in
results from stable isotope analyses, consumer-diet discrimination specific to western rock
lobster muscle tissue was determined. These values were calculated for both tail and leg
tissue. Consumer-diet δ15N and δ13C discrimination was found to differ between tail and leg
tissue, with discrimination different to values previously reported in the literature (0-1‰
for δ13C; 3-5‰ for δ15N) (DeNiro and Epstein 1978; Minagawa and Wada 1984).
Sensitivity analysis conducted in Chapter Five shows variation in consumer-diet
discrimination values can substantially affect estimated dietary composition of lobster,
highlighting the importance of using accurate values for consumer-diet discrimination.
Further, as values for consumer-diet discrimination are specific to tissue type, the tissue of
consumers used for stable isotope analysis should be consistent with values for
discrimination used specific to the tissue type analysed.
Gut content analysis as a method of dietary analysis is based on the quantification of
foregut contents where lobster foregut composition is used as a proxy for dietary
composition. Thus, variation in the rate of evacuation of different prey from lobster
foreguts may influence estimated lobster dietary composition. If prey are evacuated from
lobster foreguts at different rates, the composition of lobster foreguts determined by gut
content analysis will not accurately reflect the composition of food ingested. A laboratory
study comparing the evacuation rate of three common pre from lobster foreguts was
conducted (Appendix Two). Variation in evacuation rates of different prey from lobster
foreguts was observed, with evacuation in the order of coralline algae>crabs>pilchards.
Evacuation of diet items from the lobster foreguts was significantly slower than rates
previously reported for this species (Joll 1982), with evacuation of crabs and pilchards
likely still not complete 24 hours post feeding. If variation in foregut evacuation rates is not
accounted for when using gut content analysis to determine lobster dietary composition, the
importance of crabs and bait to lobster diet may be overestimated relative to red algae.
Researchers using gut content analysis for the determination of lobster diet should consider
variable evacuation rates as a factor that may skew estimates of dietary composition.

151
Effect of lobster removal on deep-coastal ecosystems
Ecosystem effects of spiny lobster removal (through fishing) have been demonstrated
worldwide (Tegner and Levin 1983; Tarr et al. 1996; Mayfield and Branch 2000; Shears
and Babcock 2002; Langlois et al. 2005; Langlois et al. 2006; Pederson and Johnson 2006).
Such studies have demonstrated that a reduction in predation pressure arising from lobster
removal leads to a proliferation of invertebrate fauna that would be controlled by lobster
predation in natural systems (e.g. Langlois et al. 2005; Pederson and Johnson 2006). The
majority of those studies demonstrating detectable effects of spiny lobster removal on
ecosystem structure identified sea urchins to be important lobster prey (Tegner and Levin
1983; Tarr et al. 1996; Mayfield and Branch 2000; Mayfield et al. 2000; Shears and
Babcock 2002; Pederson and Johnson 2006). Frequent consumption of sea urchins by spiny
lobsters in these studies suggests strong top down control of sea urchin abundance by spiny
lobsters. Removal of lobsters reduces predation pressure on lower trophic levels, leading to
proliferation of sea urchins. Given that sea urchins are highly effective herbivores (Strong
1992), lobster removal may ultimately have implications for other components of these
ecosystems.
The current study set out to determine the diet and trophic role of western rock lobsters in
deep-coastal ecosystems. Knowledge of lobster diet and trophic role is the first step in
determining if removal of western rock lobsters from Western Australian deep-coastal
ecosystems has detectable effects on the structure and functioning of these ecosystems. Due
to the influence of the Leeuwin current, ecosystems along the temperate Western Australian
coast are oligotrophic (Cresswell 1991; Lenanton et al. 1991). The oligotrophic nature of
these systems means demersal species that rely on benthic production such as western rock
lobsters and prawns dominate (Lenanton et al. 1991). Sea urchin abundance in these
ecosystems is also low relative to those systems where lobster removal has been shown to
have detectable effects on ecosystem structure (Fowler-Walker and Connell 2002;
Vanderklift 2002).
To understand the role of western rock lobsters in deep-coastal ecosystems, the current
study first sought to determine the diet and trophic role of western rock lobsters. From the
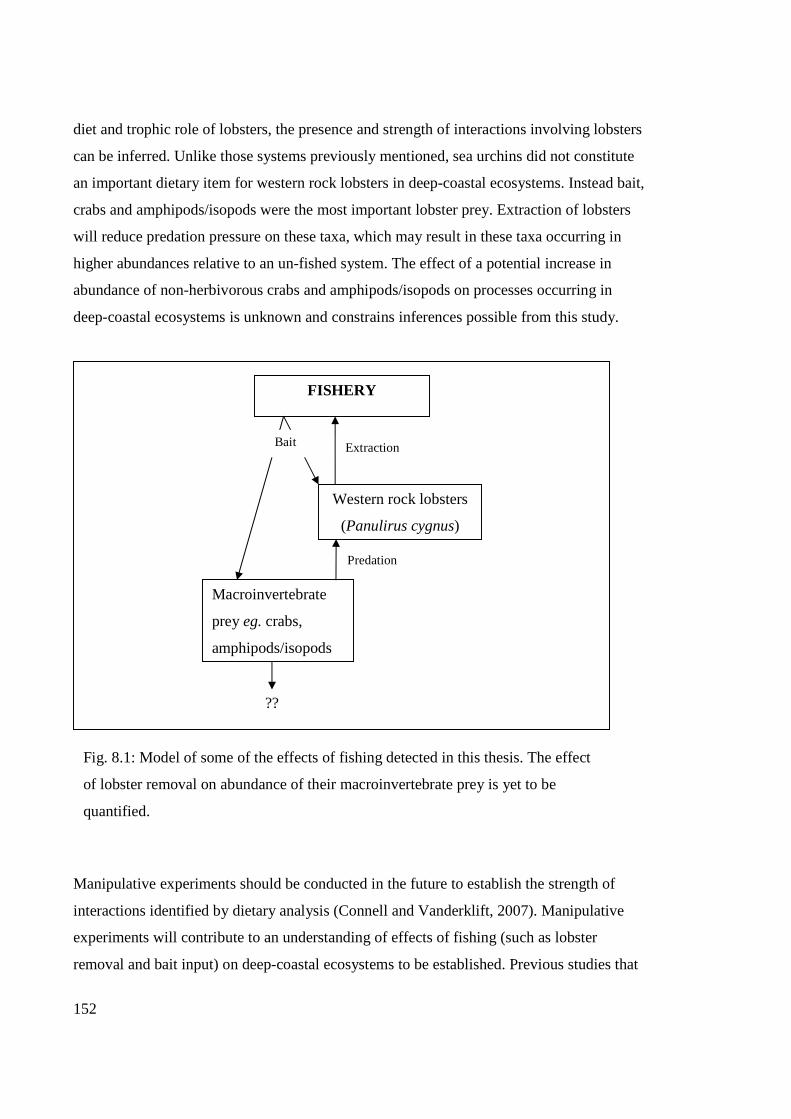
152
diet and trophic role of lobsters, the presence and strength of interactions involving lobsters
can be inferred. Unlike those systems previously mentioned, sea urchins did not constitute
an important dietary item for western rock lobsters in deep-coastal ecosystems. Instead bait,
crabs and amphipods/isopods were the most important lobster prey. Extraction of lobsters
will reduce predation pressure on these taxa, which may result in these taxa occurring in
higher abundances relative to an un-fished system. The effect of a potential increase in
abundance of non-herbivorous crabs and amphipods/isopods on processes occurring in
deep-coastal ecosystems is unknown and constrains inferences possible from this study.
Manipulative experiments should be conducted in the future to establish the strength of
interactions identified by dietary analysis (Connell and Vanderklift, 2007). Manipulative
experiments will contribute to an understanding of effects of fishing (such as lobster
removal and bait input) on deep-coastal ecosystems to be established. Previous studies that
FISHERY
Western rock lobsters
(Panulirus cygnus)
Macroinvertebrate
prey eg. crabs,
amphipods/isopods
Fig. 8.1: Model of some of the effects of fishing detected in this thesis. The effect
of lobster removal on abundance of their macroinvertebrate prey is yet to be
quantified.
Bait
??
Predation
Extraction

153
have been successful in identifying effects of lobster removal on marine ecosystems have
had the benefit of areas closed to fishing (e.g. Shears and Babcock 2002; Pederson and
Johnson 2006). Such ‘no take’ areas have not been established in deep-coastal ecosystems
that were the focus of this study but are important as they allow the comparison of
exploited areas with areas more closely resembling natural systems (Langlois and
Ballantine, 2005). No-take areas also allow distinction of changes as a result of fishing
from those occurring due to other factors such as disturbance or climate change (Shears and
Babcock 2003).
Limitations of this research
This study provided the first ecological information on the diet and trophic role of western
rock lobsters in deep-coastal ecosystems. However, it also had associated limitations.
Determination of lobster diet using stable isotope analysis in the current study is based on
one sampling event, reflecting the logistical challenges of performing ecological studies at
these depths. This constraint raises questions regarding the applicability of results to other
times of the year. Diet of western rock lobsters in shallow water has been demonstrated to
vary at different times of the year due to differences in food availability (Edgar 1990;
Jernakoff et al. 1993). In shallow water the diet of western rock lobsters was highly
influenced by settlement of the trochid mollusc, Cantharidus lepidus during late summer
(Edgar 1990). The lack of a temporal sampling component in the current study limits the
applicability of results to other times of the year. In fact the high contribution of bait to
lobster diet shown in Chapter Three of this thesis was subsequently determined to most
likely be a reflect temporal variation in fishing effort (Chapter Six). However, despite the
lack of a temporal component, this study provided important preliminary information
regarding the diet and trophic role of P. cygnus in the deep-coastal ecosystems it inhabits.
The absence of no-take areas for comparison of fished and un-fished areas also limits
conclusions to be drawn regarding the effect of fishing on deep-coastal ecosystems.
Establishment of ‘no-take’ areas in these ecosystems will allow effects of fishing such as
bait addition and lobster removal on the surrounding ecosystem to be studied more
effectively.

154
Conclusions
This thesis presents the first research investigating the diet and trophic role of western rock
lobsters in Western Australian deep-coastal ecosystems (35-60 m). Western rock lobsters in
these ecosystems were determined to be primarily carnivorous with bait, crabs,
amphipods/isopods major components of lobster diet. Bivalves/gastropods, sponge and
foliose red algae were minor contributors to lobster diet.
This thesis also included an investigation of the assumptions underlying the calculation of
lobster diet using stable isotope and gut content analysis. Values for consumer-diet
discrimination were calculated specific for western rock lobsters. Values for consumer-diet
discrimination of lobster tail tissue (δ15N = 2.57, δ13C = 3.20) differ to those reported in the
literature, which can have significant implications when using stable isotopes to calculate
consumer dietary composition. Evacuation rates of different prey from the foreguts of
western rock lobsters were also found to be variable. Evacuation of prey from lobster
foreguts occurred in the order of red algae > crabs > pilchards. Observed variability in
evacuation rates has implications when interpreting results of gut content analysis.
Effects of lobster removal on the structure and function of deep-coastal ecosystems could
not be readily detected. Lack of detectable effects of lobster removal likely reflects the
absence of ‘no-take’ areas in these ecosystems. No-take areas allow comparison of
exploited systems with those more closely resembling natural systems (Langlois and
Ballantine 2005). Establishment of no-take areas in Western Australian deep-coastal
ecosystems should be a priority. Removal of spiny lobsters reduces predation pressure on
lower trophic levels (Shears and Babcock 2002). Removal of western rock lobsters from the
deep-coastal ecosystems described in this study may be leading to an increase in the
abundance of crabs and amphipods/isopods in these systems. The effect of any such
increase in abundance of these taxa on ecosystem processes should be investigated upon
establishment of no-take areas.

155
Establishment of no-take areas will also allow the effect of bait addition on ecosystem
processes to be investigated. Addition of organic matter from trawl fisheries and
aquaculture has been shown to influence ecosystem processes, primarily through increasing
food available to scavenging species (Castro et al. 2005; Tuya et al. 2006). It is likely that
addition of bait may have similar implications for ecosystem processes occurring in these
deep-coastal ecosystems.
References
Barkai A, Davis CL, Tugwell S (1996) Prey selection by the South African Cape Rock
Lobster Jasus lalandii: Ecological and physiological approaches. Bulletin of Marine
Science 58: 1-8
Ben-David M, Flynn RW, Schell DM (1997) Annual and seasonal changes in diets of
martens: evidence from stable isotope analysis. Oecologia 111: 280-291
Castro M, Arau´jo A, Monteiro P (2005) Fate of discards from deep water crustacean trawl
fishery off the south coast of Portugal. New Zealand Journal of Marine and
Freshwater Research 39: 437–446
Connell SD, Vanderklift M, A. (2007) Negative interactions: The influence of predators
and herbivores on prey and ecological systems. In: Connell SD, Gillanders BM
(eds) Marine Ecology. Oxford University Press, Melbourne, pp 72-100
Cresswell GR (1991) The Leeuwin Current - observations and general models. Journal of
the Royal Society of Western Australia 74: 1-14
DeNiro MJ, Epstein S (1978) Influence of diet on the distribution of carbon isotopes in
animals. Geochimica et Cosmochimica Acta 42: 495-506
Edgar GJ (1990) Predator-prey interactions in seagrass beds. I. The influence of
macrofaunal abundance and size-structure on the diet and growth of the western
rock lobster Panulirus cygnus George. Journal of Experimental Marine Biology and
Ecology 139: 1-22
Eggleston DB, Lipcius RN (1992) Shelter selection by spiny lobster under variable
predation risk, social conditions, and shelter size. Ecology 73: 992-1011

156
Fowler-Walker MJ, Connell SD (2002) Opposing states of subtidal habitat across temperate
Australia: consistency and predictability in kelp canopy – benthic associations.
Marine Ecology Progress Series 240: 49-56
Gray HG (1992) The western rock lobster. Book 1: A natural history. Westralian Books,
Geraldton, Australia
Griffiths CL, Seiderer JL (1980) Rock-lobsters and mussels - Limitations and preferences
in a predator-prey interaction. Journal of Experimental Marine Biology and Ecology
44: 95-109
Groenewold S, Fonds M (2000) Effects on benthic scavengers of discards and damaged
benthos produced by the beam-trawl fishery in the southern North Sea. ICES
Journal of Marine Science 57: 1395-1406
Jernakoff P, Phillips BF, Fitzpatrick JJ (1993) The diet of post-puerulus western rock
lobster, Panulirus cygnus George, at Seven Mile Beach, Western Australia.
Australian Journal of Marine and Freshwater Research 44: 649-655
Joll LM (1982) Foregut evacuation of four foods by the western rock lobster, Panulirus
cygnus, in aquaria. Australian Journal of Marine and Freshwater Research 33: 939-
943
Joll LM, Phillips BF (1984) Natural diet and growth of juvenile western rock lobster
Panulirus cygnus George. Journal of Experimental Marine Biology and Ecology 75:
145-169
Kaiser MJ, Spencer BE (1994) Fish scavenging behaviour in recently trawled areas. Marine
Ecology Progress Series 112: 41-49
Langlois TJ, Anderson MJ, Babcock RC (2005) Reef-associated predators influence
adjacent soft-sediment communities. Ecology 86: 1508-1519
Langlois TJ, Anderson MJ, Brock M, Murman G (2006) Importance of rock lobster size-
structure for trophic interactions: choice of soft-sediment bivalve prey. Marine
Biology 149: 447-454
Langlois TJ, Ballantine WJ (2005) Marine ecological research in New Zealand: Developing
predictive models through the study of no-take marine reserves. Conservation
Biology 19: 1763-1770
Lenanton RC, Joll L, Penn J, Jones K (1991) The influence of the Leeuwin Current on
coastal fisheries of Western Australia. Journal of the Royal Society of Western
Australia 74: 101-114

157
Mayfield S, Branch GM (2000) Interrelations among rock lobsters, sea urchins, and
juvenile abalone: implications for community management. Canadian Journal of
Fisheries and Aquatic Sciences 57: 2175-2185
Mayfield S, Branch GM, Cockroft AC (2000) Relationships among diet, growth rate and
food availability for the South African Rock Lobster, Jasus lalandii (Decapoda,
Palinuridae). Crustaceana 73: 815-834
Mayfield S, de Beer E, Branch GM (2001) Prey preferences and the consumption of sea
urchins and juvenile abalone by captive rock lobsters (Jasus lalandii). Marine and
Freshwater Research 53: 773-780
Minagawa M, Wada E (1984) Stepwise enrichment of 15N along food chains: Further
evidence and the relation between δ15N and animal age. Geochimica et
Cosmochimica Acta 48: 1135-1140
Pederson HG, Johnson CR (2006) Predation of the sea urchin Heliocidaris erythrogramma
by rock lobsters (Jasus edwardsii) in no-take marine reserves. Journal of
Experimental Marine Biology and Ecology 336: 120-134
Phillips DL (2001) Mixing models in analyses of diet using multiple stable isotopes: a
critique. Oecologia 127: 166-170
Saila SB, Nixon SW, Oviatt CA (2002) Does lobster trap bait influence the Maine inshore
trap fishery? North American Journal of Fisheries Management 22: 602-605
Shears NT, Babcock RC (2002) Marine reserves demonstrate top-down control of
community structure on temperate reefs. Oecologia 132: 131-142
Shears NT, Babcock RC (2003) Continuing trophic cascade effects after 25 years of no-
take marine reserve protection. Marine Ecology Progress Series 246: 1-16
Strong DR (1992) Are trophic cascades all wet? Differentiation and donor-control in
speciose ecosystems. Ecology 73: 747-754
Tarr RJQ, Williams PVG, MacKenzie AJ (1996) Abalone, sea urchins and rock lobster: A
possible ecological shift may affect traditional fisheries. South African Journal of
Marine Science 17: 319-323
Tegner MJ, Levin LA (1983) Spiny lobsters and sea urchins: analysis of a predator-prey
interaction. Journal of Experimental Marine Biology and Ecology 73: 125-150
Tuya F, Sanchez-Jerez P, Dempster T, Boyra A, Haroun RJ (2006) Changes in demersal
wild fish aggregations beneath a sea-cage fish farm after the cessation of farming.
Journal of Fish Biology 69: 682-697

158
Vanderklift MA (2002) Interactions between sea urchins and macroalgae in south-western
Australia: testing general predictions in a local context. PhD thesis. The University
of Western Australia. Perth, Australia
Vanderklift MA, Ponsard S (2003) Sources of variation in consumer-diet δ15N enrichment:
a meta-analysis. Oecologia 136: 169-182
Whitledge GW, Rabeni CF (1997) Energy sources and ecological role of crayfishes in an
Ozark stream; Insights from stable isotopes and gut analysis. Canadian Journal of
Fisheries and Aquatic Science 54: 2555-2562
Winzer A (2007) Biology and Prevalence of Cirolana hesperia and their effect on the
Western Rocklobster fishery. PhD. Murdoch University, Perth, Australia
Zimmer-Faust RK, Tyre JE, Case JF (1985) Chemical attraction causing aggregation in the
spiny lobster, Panulirus interruptus (Randall), and its probable ecological
significance. Biological Bulletin 169: 106-118
Zimmer-Faust RK, Spanier E (1987) Gregariousness and sociality in spiny lobsters:
implications for den habitation. Journal of Experimental Marine Biology and
Ecology 105: 57-71
Zimmer-Faust RK (1993) ATP: A potent prey attractant evoking carnivory. Limnology and
Oceanography 38: 1271-1275
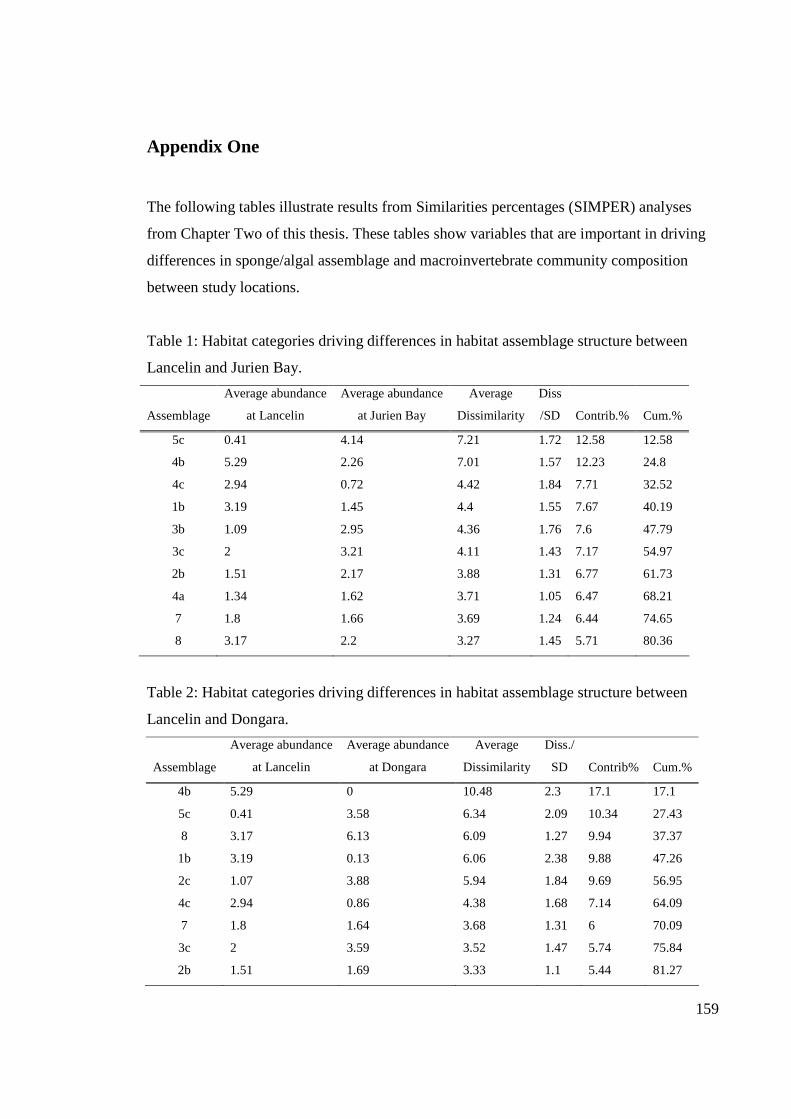
159
Appendix One
The following tables illustrate results from Similarities percentages (SIMPER) analyses
from Chapter Two of this thesis. These tables show variables that are important in driving
differences in sponge/algal assemblage and macroinvertebrate community composition
between study locations.
Table 1: Habitat categories driving differences in habitat assemblage structure between
Lancelin and Jurien Bay.
Assemblage
Average abundance
at Lancelin
Average abundance
at Jurien Bay
Average
Dissimilarity
Diss
/SD Contrib.% Cum.%
5c 0.41 4.14 7.21 1.72 12.58 12.58
4b 5.29 2.26 7.01 1.57 12.23 24.8
4c 2.94 0.72 4.42 1.84 7.71 32.52
1b 3.19 1.45 4.4 1.55 7.67 40.19
3b 1.09 2.95 4.36 1.76 7.6 47.79
3c 2 3.21 4.11 1.43 7.17 54.97
2b 1.51 2.17 3.88 1.31 6.77 61.73
4a 1.34 1.62 3.71 1.05 6.47 68.21
7 1.8 1.66 3.69 1.24 6.44 74.65
8 3.17 2.2 3.27 1.45 5.71 80.36
Table 2: Habitat categories driving differences in habitat assemblage structure between
Lancelin and Dongara.
Assemblage
Average abundance
at Lancelin
Average abundance
at Dongara
Average
Dissimilarity
Diss./
SD Contrib% Cum.%
4b 5.29 0 10.48 2.3 17.1 17.1
5c 0.41 3.58 6.34 2.09 10.34 27.43
8 3.17 6.13 6.09 1.27 9.94 37.37
1b 3.19 0.13 6.06 2.38 9.88 47.26
2c 1.07 3.88 5.94 1.84 9.69 56.95
4c 2.94 0.86 4.38 1.68 7.14 64.09
7 1.8 1.64 3.68 1.31 6 70.09
3c 2 3.59 3.52 1.47 5.74 75.84
2b 1.51 1.69 3.33 1.1 5.44 81.27

160
Table 3: Habitat categories driving differences in habitat assemblage structure between
Jurien Bay and Dongara.
Assemblage
Average abundance
at Jurien Bay
Average abundance
at Dongara
Average
Dissimilarity
Diss./
SD Contrib% Cum.%
8 2.2 6.13 8.09 1.69 15.22 15.22
2c 1.28 3.88 5.45 2 10.24 25.46
3b 2.95 0.82 5.04 1.58 9.48 34.94
4b 2.26 0 4.34 1 8.16 43.1
5c 4.14 3.58 4.18 1.22 7.87 50.97
7 1.66 1.64 3.97 1.19 7.46 58.42
3c 3.21 3.59 3.63 1.42 6.82 65.24
2b 2.17 1.69 3.36 1.4 6.32 71.56
4a 1.62 0 3.1 0.69 5.83 77.39
1b 1.45 0.13 2.81 0.81 5.28 82.67
Table 4: Taxa driving differences in sponge and algal assemblages between Lancelin and
Jurien Bay.
Species
Av. abundance
at Lancelin
Av. abundance
at Jurien Bay
Average
Dissimilarity
Diss./S
D
Contrib
%
Cum.
%
Ecklonia radiata 1.52 1.22 2.29 0.88 2.77 2.77
Voucher 40** 1.37 0.46 1.66 0.75 2 4.77
Voucher 75• 0 1.69 1.61 0.75 1.95 6.72
Voucher 56† 0.69 1.54 1.58 1.2 1.91 8.63
Voucher 41 1 0.91 1.48 0.95 1.79 10.42
Keutzingia
canaliculata 0.96 1.09 1.42 1.85 1.72 12.14
Voucher 42 0.7 1.19 1.39 1.05 1.68 13.82
Voucher 28 1.27 0 1.31 0.88 1.58 15.4
Voucher 67†† 0.22 1.34 1.26 1.21 1.53 16.92
Hennedya crispa 0.7 1.09 1.26 1.18 1.52 18.44
Thalassodendron
pachyrhizon 1.02 0.45 1.18 0.93 1.43 19.87
Callophycus
oppositifolius 1.09 0.52 1.18 1.06 1.43 21.3
Pink encrusting
coralline algae 0.76 1.2 1.18 1.09 1.42 22.72

161
Table 5: Taxa driving differences in sponge and algal assemblages between Lancelin and
Dongara.
Species
Average
abundance
at Lancelin
Average
abundance
at Dongara
Average
Dissimilarity Diss./SD
Contrib
%
Cum.
%
Voucher 5* 0.24 2.02 1.91 1.99 2.14 2.14
Voucher 67†† 0.22 1.78 1.71 1.74 1.92 4.06
Voucher 89•• 0 1.64 1.64 1.22 1.84 5.89
Ecklonia radiata 1.52 0.28 1.54 0.87 1.72 7.62
Voucher 40** 1.37 0.24 1.44 0.75 1.61 9.23
Voucher 28 1.27 0 1.23 0.91 1.38 10.61
Voucher 106 0 1.16 1.22 0.57 1.37 11.98
Voucher 56† 0.69 0.87 1.18 0.83 1.32 13.3
Voucher 58 0.14 1.1 1.15 0.75 1.29 14.59
Voucher 4 0.2 1.14 1.15 1.16 1.29 15.88
Voucher 69 0.24 1.23 1.14 1.58 1.28 17.16
Haloplegma 0.57 1.14 1.09 1.02 1.23 18.38
Voucher 41 1 0 1.09 0.69 1.23 19.61

162
Table 6: Taxa driving differences in sponge and algal assemblages between Dongara and
Jurien Bay.
Species
Average
abundance
at Dongara
Average
abundance
at Jurien Bay
Average
Dissimilarity Diss./SD
Contrib
%
Cum.
%
Voucher 5* 2.02 0.14 1.69 1.88 2.01 2.01
Voucher 89•• 1.64 1.26 1.54 1.28 1.82 3.83
Ecklonia radiata 0.28 1.22 1.43 0.66 1.7 5.54
Voucher 75• 0 1.69 1.37 0.76 1.63 7.16
Voucher 56† 0.87 1.54 1.33 1.24 1.58 8.75
Voucher 42 0.22 1.19 1.15 0.97 1.36 10.11
Voucher 67†† 1.78 1.34 1.1 1.14 1.31 11.42
Voucher 106 1.16 0 1.08 0.56 1.28 12.7
Voucher 58 1.1 0.36 1.08 0.77 1.28 13.98
Voucher 68 0.76 0.83 1.04 0.93 1.24 15.22
Hennedya crispa 0 1.09 1.03 1.15 1.23 16.44
Voucher 4 1.14 0 1.01 1.13 1.2 17.65
Voucher 93 0.86 0.68 0.99 0.94 1.17 18.82
* Class Calcarea, Order Clathrinida, Clathrinida sp 6
** Class Demospongiae, Order Haplosclerida, Family Petrosiidae, Petrosia sp. † Class Demospongiae, Order Poecilosclerida, Family Tedaniidae, Tedania sp †† Class Demospongiae, Order Dictyoceratida, Family Thorectidae, Cacospongia • Class Demospongiae, Order Poecilosclerida, Family Iotrochotidae, Iotrochota sp. •• Class Demospongiae, Order Dictyoceratida, Family Irciniidae, Sarcotragus sp.

163
Table 7: Taxa driving differences in macroinvertebrate community composition between
Lancelin and Jurien Bay.
Species
Average
abundance
at Lancelin
Average
abundance
at Jurien Bay
Average
Dissimilarity Diss./SD
Contrib
%
Cum.
%
Crab - Family
Dromiidae 0.41 0.48 6.1 1.32 11.71 11.71
Amphipods 0.29 0.64 5.73 1.35 11 22.72
Gastropods 0.38 0.26 4.95 1.09 9.51 32.22
Brittle stars 0.56 0.77 4.94 1.24 9.47 41.7
Polychaetes 0.95 0.69 4.63 1.2 8.89 50.59
Bivalves 0 0.35 4.18 0.72 8.01 58.6
Natatolana sp. 0.18 0.28 3.91 1.19 7.51 66.11
Other Decapods 0.04 0.24 3.58 0.71 6.87 72.98
Crab - Family
Galatheidae 0.2 0.15 3.23 0.76 6.19 79.17
Isopods 0.11 0.1 2.55 0.56 4.89 84.06
Prawn Family
Penaeidae 0.19 0.06 2.36 0.66 4.53 88.6
Basket stars 0 0.15 1.53 0.37 2.94 91.54
Table 8: Taxa driving differences in macroinvertebrate community composition between
Lancelin and Dongara.
Species
Average
abundance
at Lancelin
Average
abundance
at Dongara
Average
Dissimilarity Diss./SD
Contrib
%
Cum.
%
Other Decapods 0.04 0.9 11.06 2.69 18.19 18.19
Big bivalve 0 0.65 6.23 0.49 10.25 28.44
Amphipods 0.29 0.64 5.68 1.45 9.34 37.78
Gastropods 0.38 0.43 5.59 1.29 9.19 46.97
Crab – Family
Dromiidae 0.41 0 5.46 1.02 8.97 55.95
Bivalves 0 0.43 4.99 1.13 8.21 64.16
Polychaetes 0.95 0.8 4.2 1.1 6.91 71.07
Brittle stars 0.56 0.46 4.07 1.1 6.69 77.75
Isopods 0.11 0.24 3.16 0.82 5.19 82.95
Sipunculids 0 0.23 3.08 0.62 5.07 88.02
Natatolana sp. 0.18 0 2.07 0.66 3.41 91.42

164
Table 9: Taxa driving differences in macroinvertebrate community composition between
Dongara and Jurien Bay.
Species
Average
abundance
at Dongara
Average
abundance
at Jurien Bay
Average
Dissimilarity Diss./SD
Contrib
%
Cum.
%
Other Decapods 0.9 0.24 7.5 1.7 14.35 14.35
Big bivalve 0.65 0 5.68 0.49 10.87 25.23
Bivalves 0.43 0.35 5.1 1.16 9.76 34.99
Gastropods 0.43 0.26 4.81 1.17 9.19 44.18
Crab – Family
Dromiidae 0 0.48 4.76 1.15 9.11 53.3
Brittle stars 0.46 0.77 3.82 1.25 7.3 60.6
Natatolana sp. 0 0.28 3.27 1.14 6.25 66.85
Amphipods 0.64 0.64 3.05 0.99 5.83 72.68
Sipunculids 0.23 0.09 3.02 0.7 5.78 78.46
Polychaetes 0.8 0.69 2.93 1.18 5.6 84.05
Isopods 0.24 0.1 2.89 0.8 5.54 89.59
Crab - Family
Galatheidae 0 0.15 1.61 0.55 3.08 92.67

165

SynthesisWhat is the role of western rock lobsters in these
deep-coastal ecosystems?
Chapter 2Where do the lobsters occur?Biotic composition of these
ecosystems
Stable Isotope Analysis
Gut content analysis
Chapter 3What do lobsters consume
in these ecosystems?
Chapter 7 Nutritional condition of lobsters
Chapter 6 Mass balance approach
What else do lobsters eat? Bait?
Chapter 4 P. cygnusConsumer-diet discrimination
Chapter 5 Sensitivity of variation in consumer-diet discrimination to calculated dietary composition
Appendix 2 Gut evacuation rates of western rock lobsters
Verification of Techniques
Appendix 3 Comparison of techniques for determining lobster nutritional condition
Chapter 2Where do the lobsters occur?Biotic composition of these
ecosystems
Stable Isotope Analysis
Gut content analysis
Chapter 3What do lobsters consume
in these ecosystems?
Stable Isotope Analysis
Gut content analysis
Chapter 3What do lobsters consume
in these ecosystems?
Chapter 7 Nutritional condition of lobsters
Chapter 6 Mass balance approach
What else do lobsters eat? Bait?
Chapter 4 P. cygnusConsumer-diet discrimination
Chapter 5 Sensitivity of variation in consumer-diet discrimination to calculated dietary composition
Appendix 2 Gut evacuation rates of western rock lobsters
Verification of Techniques
Appendix 3 Comparison of techniques for determining lobster nutritional condition

167
Appendix Two – Variation in evacuation rates of different foods skew
estimates of diet in the western rock lobster, Panulirus cygnus.
Preamble: This appendix has been accepted for publication in Marine and Freshwater
Research.

168
Kris Waddington
M090 School of Plant Biology
The University of Western Australia
35 Stirling Highway
Crawley 6009.
Western Australia
Ph: +61 8 6488 7919
Fax: +61 8 6488 1001
Email: [email protected]
Abstract
Knowledge regarding differences in evacuation rates of diet items from a consumers’
stomach is important when using gut content analysis to quantify consumer diet.
Evacuation rates of three diet items (pilchards, crabs and coralline algae) from the foreguts
of western rock lobsters (Panulirus cygnus) were compared in aquaria. To determine
evacuation rates, lobsters were allowed to consume offered food during a 90 minute feeding
period, before being sacrificed at 4, 6, 8, 10 and 12 hours after the feeding period
concluded. Diet items differed in their rate of evacuation from lobster foreguts with
coralline algae evacuated most rapidly, followed by crabs, then pilchards. Evacuation of
crabs and pilchards was still not complete 12 hours after the feeding period concluded.
Food not evacuated after 12 hours predominantly consisted of hard components of lobster
diet, indicating it is these components that account for slower evacuation. Observed
variation in evacuation rates between diet items may skew results of studies that use gut
content analysis to quantify diet of western rock lobsters.
Keywords
Foregut; evacuation rate; gut content analysis; dietary composition.

169
Introduction
Identification of the contents of a consumers’ gut is a simple and effective way of assessing
its diet, with the composition of the consumers’ gut related to food ingested prior to
evacuation from the gut (Williams 1981; Cristo 2001). An understanding of gut evacuation
rates of different diet items is important when using gut content analysis to quantify dietary
composition of a consumer (Hill 1976; Choy 1986). Differences in evacuation rates of diet
items may influence results from gut content analysis – diet items that are quickly
evacuated are underestimated relative to diet items that are evacuated more slowly (Sarda
and Valladares 1990).
Studies of a number of decapod crustaceans have demonstrated that evacuation rate of diet
items from the foregut occurs at different rates (Hill 1976; Choy 1986; Sarda and Valadares
1990). These studies showed that foregut evacuation rates are slower for diet items with
hard components compared to diet items with no hard components. The only previous study
investigating foregut clearance rates of western rock lobsters (Panulirus cygnus) did not
consider diet items with hard body parts (Joll 1982), and crustaceans and fish have been
shown to be important lobster diet items (Joll and Phillips 1984; Jernakoff et al. 1993;
Waddington, unpublished data). I determined evacuation rates of these diet items from the
foreguts of western rock lobsters. Crustaceans and fish have hard body components that
may be evacuated more slowly from lobster foreguts relative to evacuation of diet items
previously tested.
I investigated evacuation rates of three diet items (pilchards, crabs and coralline algae) from
the foregut of western rock lobsters. I tested the null hypothesis that there is no difference
in evacuation rates between diet items.
Materials and Methods
Western rock lobsters (70-76 mm carapace length) were trapped from Marmion Lagoon
(31° 44′ S, 115° 40′ E). Prior to experiment commencing, lobsters were kept in 2 circular
tanks, 1.0 m diameter × 0.8 m deep for 7 days to acclimate. During this time experimental

170
animals were provided with a brick and PVC shelter and fed mussels, (Mytilus edulis (L.))
to excess. After acclimating for one week, feeding was ceased for one week to ensure
lobsters consumed offered food during experimentation.
The experiment was performed over two consecutive nights during July 2007. A total of 15
lobsters were used each day. On the day prior to experimentation, lobsters were randomly
allocated to one of 15 aquaria 30 cm × 40 cm × 40 cm. A plastic mesh shelter was provided
to each lobster. Flow rates of the tanks were 18 L. hr-1. Lighting was ambient
(approximately 11 hours light/ 13 hours dark) as was water temperature (16 °C). Ambient
water temperatures were chosen so that results are applicable when correcting dietary
composition data from wild caught lobsters. An excess amount of food was blotted dry,
weighed (±0.01 g), then fed to experimental lobsters 1.5 hours prior to sunrise. Lobsters
were then allowed to feed undisturbed until sunrise. This feeding period was chosen as
spiny lobsters have been shown to be nocturnal foragers (Jernakoff et al. 1987), with a peak
in feeding activity just prior to sunrise (Kanciruk and Herrnkind 1973). At sunrise, uneaten
food was first removed by hand, then by siphoning water through a 125 µm sieve. Food
removed was blotted dry and reweighed (±0.01 g). As no food was able to escape the tank
during the feeding period, and this species has not been observed to regurgitate food, the
difference in the amount of food added to and removed from the tank was assumed to be
the quantity of food ingested by the lobsters. Food offered to the pilchards were Australian
pilchards (Sardinops sagax Jenyns) (WA Bait Supply, O’Connor, Western Australia), the
foliose coralline algae (Metagoniolithon stelliferum (Lamarck)) collected from Marmion
lagoon (31° 44′ S, 115° 40′ E), and brachyuran crabs (Cyclograpsus audouinii Edwards)
collected from Ocean Reef Harbour (31° 45′ S, 115° 43′ E). Pilchards and crabs have been
observed to be important lobster diet items (Waddington, unpublished data). M. stelliferum
has been shown to be an important component of lobster diet (Joll and Phillips 1984; Edgar
1990; Jernakoff et al. 1993), and has previously been used in gut clearance experiments
(Joll 1982) allowing comparison of evacuation rates between studies.
Two lobsters fed each diet were sacrificed at 4, 6, 8, 10, 12 hours after the feeding period
concluded (hereon referred to as time “post feeding”). When sacrificing, lobsters were
immersed in an ice-slurry to induce a chill coma, before having their foreguts removed by

171
dissection. Food in the foregut was removed, blotted dry and weighed to derive a measure
of food remaining at each time post feeding.
Food ingested by a lobster passes through the esophagus and into the cardiac stomach
(termed the foregut in this study). The cardiac stomach is a muscular chamber with a thick,
chitinous lining (Gray 1992). From the cardiac stomach, food passes through the gastric
mill into the pyloric sac where it is diverted back to the gastric mill, to the intestine or to the
hepatopancreas (Gray 1992). In this study we examine the rate of evacuation of food from
the cardiac stomach/foregut of the lobster. Food that had passed through the gastric mill
was considered to be evacuated in this study and food remaining refers to the amount of
ingested food remaining in lobster foreguts after each time period. “Evacuation rate” refers
to the rate at which this ingested food is evacuated from lobster foreguts.
Data analysis
Amount of ingested food remaining in lobster foreguts was calculated for each time post
feeding (4, 6, 8, 10, 12 hours) and for each diet type fed to the lobsters. Amount of food
remaining was then expressed as the proportion of the initial amount ingested. Gastric
evacuation followed an exponential equation of the type – from Sarda and Valladares
(1990):
Wt = Wo eRt,
where Wt = weight of stomach contents at time t, Ao = weight of food ingested during the
feeding period, R = instantaneous evacuation rate, and t = time in hours since the
conclusion of the feeding period.
Prior to analysis, data were checked for homogeneity of variance using Bartlett’s test (Zar
1999). Differences in proportion of ingested food remaining in lobster foreguts were tested
using two-way Analysis of Variance (ANOVA), testing the factors diet (fixed, 3 levels) and
time (random, 5 levels, crossed with diet). Where differences were observed, these were

172
assessed using post-hoc Tukey tests. Amount of each diet item ingested by the lobsters
were also compared using one way ANOVA.
Amount of ingested food remaining in lobster foreguts was calculated for each time post
feeding (4, 6, 8, 10, 12 hours) and for each diet type fed to the lobsters. Amount of food
remaining was then expressed as the proportion of food ingested. Differences in proportion
of ingested food remaining since feeding concluded were compared using two-way
ANOVA. Where significant differences were observed, Tukey tests were used to identify
which groups significantly differed. Rate of food evacuation was determined from the
difference in the amount of food present at the end of each time period and is expressed as
g. hr-1 for each time period. Differences in rates of evacuation of different diet items
between time periods were compared using two-way ANOVA and Tukey tests. Amount of
each diet item ingested by lobsters were also compared using one-way ANOVA and Tukey
tests.
Results
The proportion of ingested food remaining in lobster foreguts at time t after feeding can be
expressed by the following regression equations:
Pilchards: Wt = e-0.063t, r2 = 0.94,
Crabs: Wt = e-0.12t, r2 = 0.95,
Coralline algae: Wt = e-0.905t, r2 = 0.86
The instantaneous rate of evacuation (R) for coralline algae (-0.91) exceeded the rate of
evacuation of crab (-0.12), and pilchard (-0.06) (Fig. 1).
Data were found to have homogenous variance (p=1.00) no transformation of raw data was
required prior to analysis. The amount of food remaining in the foregut of lobsters was
dependant on both diet type and time since conclusion of the feeding period (Table 1). A
significant diet × time interaction was also observed (Table 1), indicating the proportion of
each food type remaining in lobster guts was not constant at each time post-feeding, likely
owing to observed differences in evacuation rates between different diet items.

173
Proportion of pilchards remaining were not significantly different to proportion of crabs
remaining after four (p=0.45) and six hours post-feeding (p<0.69), but proportion of
pilchards and crabs differed to proportion of coralline algae remaining during these times
(p<0.001). After six hours post feeding, all diets differed significantly in proportion of
ingested food remaining (p<0.05).
Differences in the absolute amount of food ingested were detected using one-way ANOVA
(Table 2). Post hoc Tukey tests showed that lobsters offered pilchards ingested significantly
more food (mean 6.40 ± se 0.38) than those offered either crabs or algae (p<0.05). No
significant differences were detected between the amount of crabs (4.13 ± 0.53) or coralline
algae (2.10 ± 1.04) ingested by lobsters (p<0.01).
Examination of foreguts of lobsters fed crabs sacrificed 12 hours post feeding showed
matter that had not been evacuated consisted of hard exoskeleton. All flesh and connective
tissue had been evacuated. The foreguts of lobsters fed pilchards sacrificed 12 hours post
feeding had predominantly bones and scales present in their foreguts as well as a small
amount of flesh and muscle tissue. Extrapolation of regression equations indicate that
approximately 22.2% of ingested pilchards and 5.5% of ingested crabs will remain in
lobster foreguts 24 hours after the conclusion of the feeding period. Evacuation of 99% of
ingested crabs was estimated to occur 38 hours after feeding period concluded while it was
estimated to take 60+ for 99% of ingested pilchards to be evacuated.
Discussion
Diet items were determined to evacuate from the foreguts of western rock lobsters at
different rates. Thus, the null hypothesis that there is no difference in foregut evacuation
rates of the three diet items is rejected. Evacuation of diet items also occurred significantly
slower than evacuation rates previously reported for this species (Joll 1982). Complete
evacuation of foods from western rock lobster foreguts has previously been reported to
occur 4-6 hours after the feeding period concluded (Joll 1982).

174
Instantaneous rate of evacuation was observed to differ between diet items with evacuation
of coralline algae fastest (-0.91), followed by crabs (-0.12), then pilchards (-0.06). These
results are in accordance with the findings of Sarda and Valladares (1990) who determined
that diet type affects evacuation rates. Rate of crab and pilchard evacuation from this study
are comparable with evacuation rates reported for other decapod crustaceans. Sarda and
Valladares (1990) reported instantaneous rates of evacuation (R) of between -0.0026 and -
0.0056 hr-1 for the Norwegian lobster, Nephrops norvegicus, while in a separate study
Cristo (2001) determined R between -0.177 and -0.172 hr-1 for N. norvegicus. Choy (1986)
determined R between -0.0968 and -0.1473 hr-1 for the crabs Liocarcinus puber and
Liocarcinus holsatus. Evacuation of coralline algae from lobster foreguts occurred
significantly faster than rates reported in the literature, likely relating to the small amount
of coralline algae consumed by the lobsters during the feeding period – lobsters are largely
indifferent to coralline algae as a diet item (Joll 1982). Evacuation of food from the
stomach of the fish, Pleuronectes platessa has similarly been demonstrated to be dependant
upon amount of food consumed (Jobling and Davies 1979).
Evacuation of diet items from the foreguts of western rock lobsters occurred significantly
slower than rates previously reported for this species (Joll 1982). Pilchards and crabs were
present in lobster foreguts 12 hours post-feeding with extrapolation of observed evacuation
rates indicating crabs and pilchards will be detected in lobster foreguts at least 24 hours
after the feeding period concluded. Slower evacuation rates in the current study relative to
the study of Joll (1982) likely relate to lower water temperatures in the current study (16°C
vs. 25°C). Temperature has previously been identified as the most important factor
affecting evacuation rates amongst copepods and fish (Jobling and Davies 1979; Dam and
Peterson 1988), and has also been shown to affect gut clearance rates for the Portunid crab,
Ovalipes catharus (Haddon and Wear 1987). A decrease in water temperature (from 11 °C
to 9 °C) led to slower evacuation (from 11 to 18 hours) of food items from foreguts of the
Portunid crab (Haddon and Wear 1987). Thus differences in water temperature between the
current study and that of Joll (1982) are sufficient to explain observed differences in
evacuation rates.
Remnants of food persisting in lobster foreguts at the conclusion of the experimental time
(12 hours post feeding period) predominantly consisted of hard components of the diet fed

175
to the lobsters, indicating these items are evacuated from lobster foreguts more slowly than
softer components of lobster dietary items. Slower evacuation of hard dietary components
relative to soft dietary components has previously been observed for crabs (Hill 1976; Choy
1986), and for the lobster Nephrops norvegicus (Sarda and Valladares 1990). These studies
showed that it is common for hard components of the diet to be present 2-3 days after
feeding ceased. Similar evacuation times are feasible upon extrapolation of data from the
current study.
Variation in evacuation rates of different diet items from lobster foreguts have significant
implications for those studies that use foregut composition as a proxy for dietary
composition. An underlying assumption when using gut content analysis for the analysis of
dietary composition is that composition of diet items in lobster foreguts represents the
composition of diet items consumed (eg. Joll and Phillips 1984; Edgar 1990). Variation in
evacuation of diet items from lobster foreguts means lobster foregut composition may not
represent lobster dietary composition. Since evacuation rates differ with diet type,
researchers using gut content analysis should correct for variable evacuation rates when
calculating consumer dietary composition.
Conclusions
The current study has demonstrated that evacuation rates of dietary items from the foregut
of the spiny lobster species, Panulirus cygnus are variable. Further, foregut evacuation rates
observed in this study are slower than rates previously reported for this species, most likely
relating to differences in water temperature. Studies that use gut content analysis to
estimate dietary composition of western rock lobsters should recognise diet type and
temperature as factors that may skew estimates of dietary composition.
Acknowledgements
I thank Andrew Tennyson and Mathew and Lucas Vanderklift for help collecting diet
items. I also thank Mark Rossbach for helping with lobster collection. Mathew Vanderklift
and Diana Walker provided helpful comments on an earlier version of this manuscript.

176
Funding for this study was provided by the School of Plant Biology at the University of
Western Australia. All procedures were approved by the animal ethics committee at The
University of Western Australia (Approval number RA/3/100/478), and authorized under
state government permits.
References
Choy, S. C. (1986). Natural diet and feeding habits of the crabs Liocarcinus puber and L.
holsatus (Decapoda, Brachyura, Portunidae). Marine Ecology Progress Series 31, 87-99.
Dam, H. G., and Peterson, W. T. (1988). The effect of temperature on the gut clearance
rates of planktonic copepods. Journal of Experimental Marine Biology and Ecology 123, 1-
14.
Cristo, M. (2001). Gut evacuation rates in Nephrops norvegicus (L., 1758): laboratory and
field estimates. Scientia Marina 65, 341-346.
Edgar, G. J. (1990). Predator-prey interactions in seagrass beds. I. The influence of
macrofaunal abundance and size-structure on the diet and growth of the western rock
lobster Panulirus cygnus George. Journal of Experimental Marine Biology and Ecology
139, 1-22.
Gray, H. G. (1992). 'The western rock lobster. Book 1: A natural history.' (Westralian
Books: Geraldton.)
Haddon, M., and Wear, R. G. (1987). Biology of feeding in the New Zealand paddle crab
Ovalipes catharus (Crustacea, Portunidae). New Zealand Journal of Marine and
Freshwater Research 21, 55-64.
Hill, B. J. (1976). Natural food, foregut clearance-rate and activity of the crab Scylla
serrata. Marine Biology 34, 109-116.

177
Jernakoff, P., Phillips, B. F., and Maller, R. A. (1987). A quantitative study of nocturnal
foraging distances of the western rock lobster Panulirus cygnus George. Journal of
Experimental Marine Biology and Ecology 113, 9-21.
Jernakoff, P., Phillips, B. F., and Fitzpatrick, J. J. (1993). The diet of post-puerulus western
rock lobster, Panulirus cygnus George, at Seven Mile Beach, Western Australia. Australian
Journal of Marine and Freshwater Research 44, 649-655.
Jobling, M., and Davies, P. S. (1979). Gastric evacuation in plaice, Pleuronectes platessa
L.: effects of temperature and meal size. Journal of Fish Biology 14, 539-546.
Joll, L. M. (1982). Foregut evacuation of four foods by the western rock lobster, Panulirus
cygnus, in aquaria. Australian Journal of Marine and Freshwater Research 33, 939-943.
Joll, L. M., and Phillips, B. F. (1984). Natural diet and growth of juvenile western rock
lobster Panulirus cygnus George. Journal of Experimental Marine Biology and Ecology 75,
145-169.
Kanciruk, P., and Herrnkind, W. F. (1973). Preliminary investigations of the daily and
seasonal locomotor activity rhythms of the spiny lobster, Panulirus argus. Marine
Behaviour and Physiology 1, 351-359.
Sarda, F., and Valladares, F. J. (1990). Gastric evacuation of different foods by Nephrops
norvegicus (Crustacea: Decapoda) and estimation of soft tissue ingested, maximum food
intake and cannibalism in captivity. Marine Biology 104, 25-30.
Williams, M. J. (1981). Methods for the analysis of natural diet in Portunid crabs
(Crustacea: Decapoda: Portunidae). Journal of Experimental Marine Biology and Ecology
52, 103-113.
Zar, J. H. (1999). 'Biostatistical Analysis.' (Prentice-Hall International, Inc.: Sydney.)

178
Tables
Table 1. Two way ANOVA for differences in proportion of ingested food remaining in
lobster foreguts for lobsters fed different diets. Two factors design: diet (fixed, 3 levels) and
time (fixed, 5 levels, crossed with diet).
Source of Variation df SS MS F-value p-value
Diet 2 1.73 0.86 168.011 <0.001
Time 4 0.44 0.11 21.209 <0.001
Diet × Time 8 0.11 0.01 2.731 0.045
Residual 15 0.08 0.01
Total 29 2.53 0.08
Table 2. One way ANOVA for comparison of amount of each diet type ingested by
experimental lobsters during the feeding period.
Source of Variation df SS MS F-value p-value
Diet type 2 92.57 46.28 9.144 <0.001
Residual 27 136.67 5.06
Total 29 229.24

179
Figure
Fig. 1. Proportion of ingested food remaining in lobster foreguts for three different diet
items fed to lobsters. Evacuation of diet items is modeled by exponential functions (solid
line).

SynthesisWhat is the role of western rock lobsters in these
deep-coastal ecosystems?
Chapter 2Where do the lobsters occur?Biotic composition of these
ecosystems
Stable Isotope Analysis
Gut content analysis
Chapter 3What do lobsters consume
in these ecosystems?
Chapter 7 Nutritional condition of lobsters
Chapter 6 Mass balance approach
What else do lobsters eat? Bait?
Chapter 4 P. cygnusConsumer-diet discrimination
Chapter 5 Sensitivity of variation in consumer-diet discrimination to calculated dietary composition
Appendix 2 Gut evacuation rates of western rock lobsters
Verification of Techniques
Appendix 3 Comparison of techniques for determining lobster nutritional condition
Chapter 2Where do the lobsters occur?Biotic composition of these
ecosystems
Stable Isotope Analysis
Gut content analysis
Chapter 3What do lobsters consume
in these ecosystems?
Stable Isotope Analysis
Gut content analysis
Chapter 3What do lobsters consume
in these ecosystems?
Chapter 7 Nutritional condition of lobsters
Chapter 6 Mass balance approach
What else do lobsters eat? Bait?
Chapter 4 P. cygnusConsumer-diet discrimination
Chapter 5 Sensitivity of variation in consumer-diet discrimination to calculated dietary composition
Appendix 2 Gut evacuation rates of western rock lobsters
Verification of Techniques
Appendix 3 Comparison of techniques for determining lobster nutritional condition

181
Appendix Three – Comparison of techniques for measurement of
nutritional condition in the western rock lobster, Panulirus cygnus.
182
Abstract
Nutritional condition provides a measure of both the quality and quantity of prey ingested
by an organism and can be a useful parameter when investigating an organisms feeding
ecology. Due to their hard exoskeleton, spiny lobster nutritional condition cannot be
assessed by external appearance, so indices relating to physiological and chemical
processes are used. In this study I compared six different measures for determining
nutritional condition of the spiny lobster, Panulirus cygnus George. Blood protein
concentration, abdominal tissue wet weight/ dry weight ratio, weight of digestive gland
relative to lobster size and weight of digestive gland relative to lobster weight were all
found to respond to changes in lobster feeding regime. Of these indices, weight of digestive
gland relative to lobster size, and blood protein concentration appear most suitable for use
on wild populations. These measures have applications for identifying gradients in
available food resources amongst wild populations.
Introduction
Nutritional condition of an organism or population reflects both the quality and quantity of
ingested prey, and can indicate if food quality or quantity is limiting growth or survival of
an organism or population (Moore et al. 2000). Consequently, nutritional condition is an
important parameter when assessing the feeding ecology of individuals or populations (eg.
Parrish and Martinelli-Liedtke, 1999). Spiny lobsters are encased in a hard exoskeleton,
meaning their nutritional condition cannot be assessed by external appearance (eg.
plumpness), as one would if measuring condition of a vertebrate (Dall 1974; Moore et al.
2000). Instead, measures of spiny lobster nutritional condition reflect physiological or
chemical changes that occur when a lobster is under nutritional stress (Dall 1974; Dall
1975; Parrish and Martinelli-Liedtke 1999; Musgrove 2001; Johnston et al. 2003).
Measures that have been used in the past to identify nutritional condition of spiny lobsters
include blood protein concentration (Dall 1974), wet weight/dry weight ratios of abdominal
tissue (Dall 1974), tissue glycogen concentration (Parrish and Martinelli-Liedtke 1999) and
183
weight of digestive gland (hepatopancreas) (van Weel 1970; Vogt et al. 1985; Smith et al.
2004).
Measures used to determine lobster nutritional condition reflect physiological or chemical
changes that occur as a lobster becomes nutritionally stressed. Lobsters that are under
nutritional stress are known to re-metabolize their own tissues (Dall 1974). This re-
metabolization of tissues may be measured directly (eg. wet weight to dry weight of
abdominal tissue; dry weight of tail tissue relative to lobster carapace length), or using a
proxy such as blood protein concentration (Dall 1974). Loss of solids from the digestive
gland also commonly occurs as lobsters become nutritionally stressed. The digestive gland
is a storage organ for glycogen and fat (Munn 1963 in Heath and Barnes 1970; van Weel
1970; Vogt et al. 1985). As glycogen and fat are used during times of nutritional stress, the
result is a reduction in the weight of the digestive gland during these periods (van Weel
1970; Vogt et al. 1985; Smith et al. 2004). Glycogen concentration of muscle tissues may
be similarly depleted during times of nutritional stress, making tissue glycogen
concentration another potential index of lobster nutritional condition (Parrish and
Martinelli-Liedtke 1999).
While the above methods have been reported as possible indicators of spiny lobster
nutritional condition, little consensus exists in the literature regarding the most appropriate
measure of nutritional condition for spiny lobsters. In the 1970’s certain indices for
determining nutritional condition of western rock lobsters were compared (Dall 1974; Dall
1975). These studies however, compared nutritional condition of animals fed ad libitum
with those starved for 4 weeks. Comparison of lobster nutritional condition over these time
periods is unsuitable when identifying a measure of nutritional condition for wild
populations. A measure of nutritional condition suitable for wild populations should be
sensitive to fine scale variation in food quality and/or quantity that may occur due to
variation in food resource availability in the wild.
In this study, I aim to identify a suitable measure for determining the nutritional condition
of the western rock lobster (Panulirus cygnus George.). I compare six indices previously
suggested as suitable for determining spiny lobster nutritional condition. Indices
investigated included blood protein concentration (Dall 1974), wet weight/dry weight ratios

184
of abdomen and tail tissue (Dall 1974), tissue glycogen concentration (Parrish and
Martinelli-Liedtke 1999) and weight of digestive gland (hepatopancreas) (van Weel 1970;
Vogt et al. 1985; Smith et al. 2004). The applicability of these indices for determining the
nutritional condition of lobsters fed either daily, every three days, every five days or weekly
was investigated. A measure of nutritional condition able to detect differences in lobster
nutritional condition at different temporal scales will have applications when investigating
spatial and temporal gradients in food resources available to wild populations.
Materials and Methods
Experimental lobsters were collected as post-puerulus and raised on pellets formulated for
the tropical rock lobster (Panulirus ornatus) supplemented with the mussel, Mytilus edulis
(See Johnston et al. 2007). Prior to experimentation, lobsters 2-3 years post-puerulus were
placed in 4 circular tanks (1 metre diameter, 80 cm deep) for 30 days to acclimate, during
which time they were fed mussels daily to excess. Shelter in the form of brick and PVC
sheets were provided to the lobsters. Following acclimation, tanks were divided in half
using a frame constructed of PVC pipe and shade-cloth, resulting in 8 semicircular
experimental enclosures. Tank flow rates were 72 L hr-1 for the duration of the experiment,
water temperatures were ambient (19°C to 21°C), and lighting followed normal daylight
summer patterns (approx 14 hours light/ 10 hours darkness). The experiment was run for 90
days between January 20 and April 20 2006.
Three lobsters 57.4 – 69.3 mm carapace length (CL) were randomly allocated to each
experimental enclosure. As nutritional condition responds to changes in diet quality and
quantity, diet quality offered to lobsters was constant, with quantity of food offered to
experimental lobsters manipulated. One of four treatment levels (either fed daily, every 3
days, every 5 days, or weekly) were randomly allocated to the 8 enclosures, resulting in 6
replicate lobsters for each feeding regime. At each feeding event, the three lobsters in an
experimental enclosure were fed 9 mussels between 65 and 85 mm total length – equating
to 3.09 ± 0.19 g dw mussel tissue lobster-1 (0.241 ± 0.0855 g nitrogen; 1.096 ± 0.58 g
carbon lobster-1 feeding event-1). Excess food was removed from each enclosure 24 hours

185
after feeding. In the event of a lobster moulting, the old carapace of the lobster was
removed from the tank and the moult recorded.
Techniques
All food was removed from experimental tanks 24 hours prior to sampling of lobsters for
determination of nutritional condition, ensuring measures of lobster nutritional condition
were not confounded by short term nutritional state. Upon sampling, lobsters were removed
from tanks and dried using the techniques described by Chittleborough (1975). Lobster
size, sex, and weight were measured. A pleopod of each lobster was then removed for
determination of moult stage using the techniques of Glen Lyle and MacDonald (1983).
Following removal of pleopod, lobsters were immersed in an ice-slurry for 10-15 minutes
to induce a chill coma.
Blood protein concentration
Upon removal of lobsters from the ice-slurry, the haemolymph of the lobsters was sampled
by inserting a No. 19 needle under the rear of the carapace. Approximately 1 ml of
haemolymph was withdrawn and immediately placed on a protein refractometer before
coagulation occurred. The refractive index of the haemolymph was then recorded and blood
protein concentration calculated from the refractive index as described by Paterson et al.
(2000).
Dry weight of tail relative to lobster carapace length
Tails of lobsters were removed by cutting straight through the tail posterior of the first
abdominal plate. Removed tail tissue was immediately placed in a large vial and dried at 60
°C for 72 hours until completely dry. Tail tissue was then weighed and dry weight of tail
tissue divided by lobster size to give the ratio – weight of tail tissue/lobster size (mm CL).

186
Wet weight/ dry weight ratio of abdominal tissue
Between 7 and 8 g of tail tissue was dissected from within the first abdominal segment and
placed in a pre-weighed container. Tissue was weighed to determine wet weight before
being dried at 60 °C for 72 hours until completely dry then re-weighed to determine dry
weight. Wet weight/ dry weight ratios were calculated for each lobster.
Glycogen analysis
Approximately 2 g of tissue was dissected for glycogen analysis and immediately frozen.
When determining tissue glycogen concentrations, tissue was crushed using a mortar and
pestle. Perchloric acid and potassium iodide were then added and glycogen concentration
determined using colorimetric methods (Krisman 1962).
Relative weight of digestive gland (RWDG)
Finally, digestive glands were dissected from experimental lobsters. Following dissection,
digestive glands were placed in pre-weighed vials and dried in a vacuum freeze dryer for 96
hours. Upon removal from freeze dryer, weight of digestive glands were recorded and the
ratios for dry digestive gland to lobster size (mm CL) and weight (g) were calculated.
Data Analysis
As moult stage has been shown to affect nutritional condition (Heath and Barnes 1970; Dall
1975; Musgrove 2001), analyses were restricted to lobsters in intermoult. This resulted in
the exclusion of two lobsters ‘fed weekly’ from the analysis. Comparisons were made for
each measure of nutritional condition using one-way nested analysis of variance (ANOVA).
The effects of the factors, frequency of feeding (4 levels, random factor) and enclosure (8
levels, random factor, nested within frequency of feeding), were investigated. In cases
where enclosure was not found to significantly affect nutritional condition (p>0.25), further

187
analysis using one-way analysis of variance was performed to determine the effect of
frequency of feeding on each measure of nutritional condition. Where significant
differences were detected (p<0.05), post-hoc Tukey tests were used to identify those
treatment groups that significantly differed.
Results
Enclosure was found to have no effect on calculated indices of nutritional condition for
total blood protein concentration (p=0.61), tail tissue dry weight/lobster CL (p=0.26), tissue
glycogen concentration (p=0.43), and weight of digestive gland relative to lobster size
(p=0.256), or weight (p= 0.513). Enclosure however, significantly affected abdomen tissue
wet weight/dry weight ratio (Table 1). Those indices where no effect of enclosure was
detected (p>0.25) had lobsters from the same feeding regime pooled and analysis was
performed using one-way ANOVA.
Of the six measures of nutritional condition chosen for analysis, four showed significant
differences in response to feeding regime. A significant decrease in blood protein
concentration (mg/ml) was observed as feeding became more infrequent (Table 2, Fig. 1a).
While a decrease in blood protein was observed as frequency of feeding decreased, no
difference in blood protein concentration was observed between lobsters fed every five
days and lobsters fed weekly (Tukey test, p=0.11). Abdomen tissue wet weight/dry weight
ratio increased as frequency of feeding decreased (Fig. 1c). While this difference was
significant, enclosure also had a significant effect on abdomen tissue wet weight/dry weight
ratio (Table 1). Weight of lobster digestive gland relative to lobster weight and size showed
significant differences in response to frequency of lobster feeding (Tables 5 and 6) (Figs. 1e
and 1f) with weight of digestive gland relative to size and weight decreasing with
decreasing frequency of feeding (Figs. 1e and 1f). While a decrease in RWDG (weight) was
observed with frequency of lobster feeding, significant differences in RWDG (weight) were
not observed between lobsters fed every three days and lobsters fed every five days (Tukey
test, p=0.13). In contrast, clear significant differences in RWDG (size) were observed
between lobsters from all feeding regimes (Tukey tests p<0.05).
188
Dry weight of tail tissue/lobster CL was shown to exhibit a decreasing trend with a
decrease in feeding frequency (Fig. 1b) however, this difference was not significant (Table
3). Tissue glycogen concentration (mg of glycogen/ g tissue) also appeared to respond to
differences in feeding regime, with a reduction in tissue glycogen concentration observed
with a decrease in frequency of feeding (Fig. 1d). Observed differences were however, not
significant (Table 4), likely due to high within treatment variability.
Discussion
Blood protein concentration, abdominal tissue wet weight/dry weight ratio, and weight of
digestive gland relative to lobster size (RWDG (size)) and weight (RWDG (weight)) all
responded to variability in lobster feeding regime. Of these indices only RWDG (size)
displayed clear differences between all treatment groups. Clear identifiable differences in
RWDG (size) in response to treatment groups make RWDG (size) an appropriate measure
for determining nutritional condition of western rock lobsters in the wild. Total blood
protein may also provide an applicable measure of nutritional condition as it is independent
of lobster size and does not require destruction of lobsters.
Relative weight of digestive gland (calculated relative to both size and weight) showed
clear differences in response to frequency of feeding. The physiological basis underlying
use of digestive gland as a measure of nutrition is that the digestive gland is used as a
storage organ for glycogen and fat – compounds that are used during times of nutritional
stress resulting in a reduction in the weight of the digestive gland during these periods
(Munn 1963 in Heath and Barnes 1970; van Weel 1970; Vogt et al. 1985; Smith et al.
2004). Relating the weight of digestive gland to lobster weight/size accounts for larger
lobsters having larger digestive glands.
The applicability of the six measures of lobster nutritional condition will depend on the
feeding frequency chosen for the manipulative experiment. Frequency of lobster feeding in
the current study was chosen to encompass likely nutritional condition of lobsters in the
wild. To allow comparison of lobsters, the nutritional condition of lobsters from the
laboratory must be comparable with condition of lobsters from the wild. Comparable
189
nutritional condition will allow variation in nutritional condition observed for wild caught
lobsters to be related to known quality and quantity of food in the laboratory. This will
allow inferences regarding variation in food resource availability in the wild to be drawn.
Tissue glycogen concentration is one measure of nutritional condition that may show
differences if different feeding regimes were chosen. A previous study on the Hawaiian
spiny lobster (Panulirus marginatus) demonstrated that tissue glycogen concentration was
positively correlated with frequency of lobster feeding (Parrish and Martinelli-Liedtke
1999). While a similar correlation is evident from the current study, high within treatment
variability in tissue glycogen concentration meant that no significant relationship between
frequency of feeding and tissue glycogen concentration could be detected. Similarly dry
weight of tail tissue relative to lobster carapace length did not significantly respond to
differences in feeding frequency. This measure has the same physiological basis (loss of
tissue through re-metabolization of tissues) as abdominal tissue wet weight/dry weight ratio
for which significant differences were detected. Differences between abdominal muscle dry
weight was detected by Dall (1974) when lobsters fed ad libitum and starved for four weeks
were compared. Our study detected a decreasing trend in weight of tissue with decreasing
frequency of feeding, however, observed differences were not significant, likely due to the
weight of the carapace masking changes in weight of muscle tissue.
The identification of an accurate measure of spiny lobster nutritional condition has
applications in field studies of spiny lobster feeding ecology (Dall 1975; Parrish and
Martinelli-Liedtke 1999). Clear observable differences in response to all treatments makes
RWDG (size) a useful method for identification of spatial and temporal variation in the
nutritional condition of field populations (Parrish and Martinelli-Liedtke 1999), which may
reflect spatial and temporal variation in food quality and/or quality. As nutritional condition
can be determined from trap-caught lobsters, this method allows information on the feeding
ecology of otherwise inaccessible populations (due to depth or cost constraints) to be
gained. While a measure of nutritional condition cannot provide information regarding
dietary composition of lobsters in marine ecosystems, it has the potential to indicate if food
quality and/or quantity are limiting lobster growth and survival. Measures of lobster
nutritional condition may also be used to complement traditional techniques used to
determine lobster feeding ecology.
190
Determination of lobster nutritional condition using RWDG (size) involves lobster
destruction. While lobster destruction is irrelevant when lobsters are sampled for dietary
analysis, destruction of lobsters may be problematic where the large sampling programs are
being performed and in aquaculture (Ozbay and Riley 2002; Johnston et al. 2003). In cases
where a non-destructive measure of lobster nutritional condition is required, blood protein
concentration may be suitable. As well as providing a non-destructive measure, techniques
required to determine blood protein concentration are simple and this measure yields a
measure of nutritional condition independent of lobster size.
Conclusions
The current study demonstrates that weight of digestive gland relative to lobster size is an
accurate method for identification of western rock lobster nutritional condition. Blood
protein concentration may also be used to determine nutritional condition of this species
particularly where a measure is sought that does not require lobster destruction. Techniques
identified in the current study for determining lobster nutritional condition will have
applications for the study of lobster feeding ecology and food resource availability in the
wild. Further, as nutritional condition can be determined from pot-captured lobsters, these
methods of determining lobster nutritional condition will be useful when studying the
feeding ecology of populations in deep water ecosystems.
Acknowledgements
This study would not have been possible without the experimental lobsters provided by
Danielle Johnston (Department of Fisheries, Western Australia). I thank Kylie Cook and
Lachlan MacArthur for help feeding experimental lobsters. This project was funded by the
School of Plant Biology at the University of Western Australia.

191
References
Chittleborough RG (1975) Environmental factors affecting growth and survival of juvenile
western rock lobsters Panulirus longipes (Milne-Edwards). Australian Journal of
Marine and Freshwater Research 26: 177-196
Dall W (1974) Indices of nutritional state in the western rock lobster, Panulirus longipes
(Milne Edwards). I. Blood and Tissue constituents and water content. Journal of
Experimental Marine Biology and Ecology 16: 167-180
Dall W (1975) Indices of nutritional state in the western rock lobster, Panulirus longipes
(Milne Edwards). II. Gastric fluid constituents. Journal of Experimental Marine
Biology and Ecology 18: 1-18
Glen Lyle W, MacDonald CD (1983) Molt stage determination in the Hawaiian spiny
lobster Panulirus marginatus. Journal of Crustacean Biology 3: 208-216
Heath JR, Barnes H (1970) Some changes in biochemical composition with season and
during the moulting cycle of the common shore crab, Carcinus meanus. Journal of
Experimental Marine Biology and Ecology 5: 199-233
Johnston DJ, Calvert KA, Crear BJ, Carter CG (2003) Dietary carbohydrate/lipid ratios and
nutritional condition in juvenile southern rock lobster, Jasus edwardsii. Aquaculture
220: 667-682
Johnston DJ, Melville-Smith R, Hendricks B (2007) Survival and growth of western rock
lobster Panulirus cygnus (George) fed formulated diets with and without fresh
mussel supplement. Aquaculture 273: 108-117
Krisman CR (1962) A method for the colorimetric estimation of glycogen with Iodine.
Analytical Biochemistry 4: 17-23
Moore LE, Smith DM, Loneragan NR (2000) Blood refractive index and whole-body lipid
content as indicators of nutritional condition for penaeid prawns (Decapoda:
Penaeidae). Journal of Experimental Marine Biology and Ecology 244: 131-143
Munn EA (1963) The nature and metabolism of the carbohydrates of Carcinus maenas.
PhD. University of Southampton
Musgrove RJB (2001) Interactions between haemolymph chemistry and condition in the
southern rock lobster, Jasus edwardsii. Marine Biology 139: 891-899
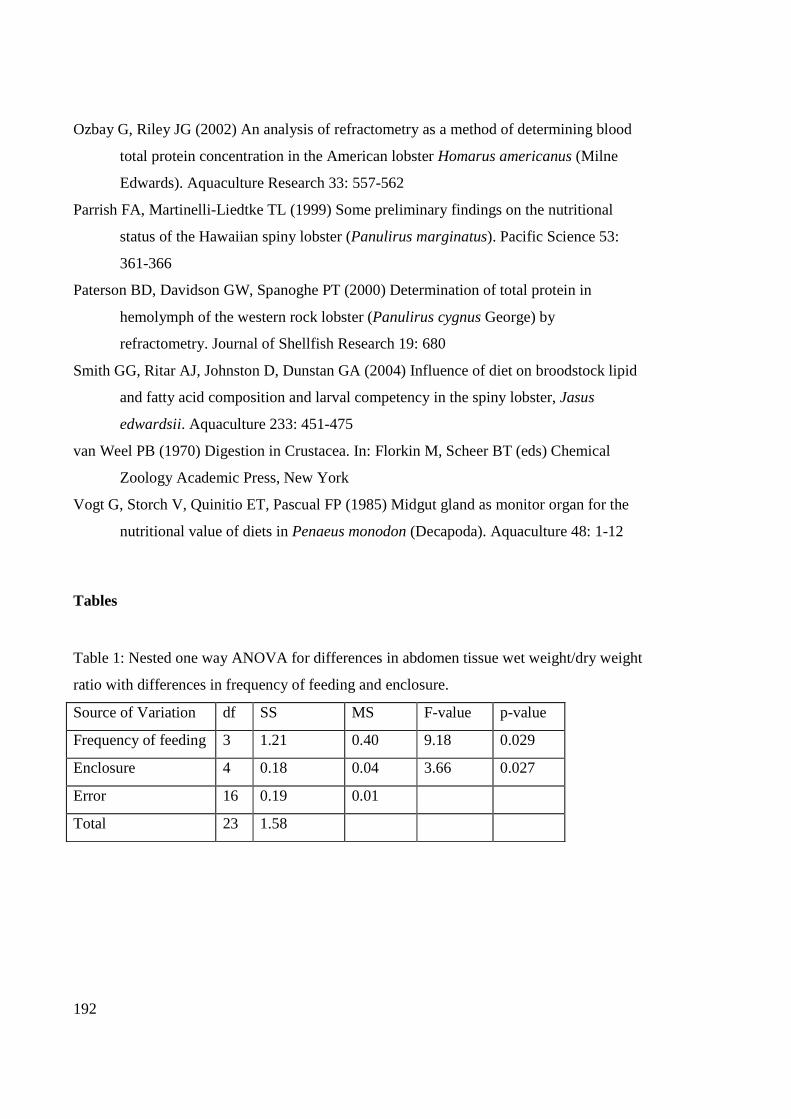
192
Ozbay G, Riley JG (2002) An analysis of refractometry as a method of determining blood
total protein concentration in the American lobster Homarus americanus (Milne
Edwards). Aquaculture Research 33: 557-562
Parrish FA, Martinelli-Liedtke TL (1999) Some preliminary findings on the nutritional
status of the Hawaiian spiny lobster (Panulirus marginatus). Pacific Science 53:
361-366
Paterson BD, Davidson GW, Spanoghe PT (2000) Determination of total protein in
hemolymph of the western rock lobster (Panulirus cygnus George) by
refractometry. Journal of Shellfish Research 19: 680
Smith GG, Ritar AJ, Johnston D, Dunstan GA (2004) Influence of diet on broodstock lipid
and fatty acid composition and larval competency in the spiny lobster, Jasus
edwardsii. Aquaculture 233: 451-475
van Weel PB (1970) Digestion in Crustacea. In: Florkin M, Scheer BT (eds) Chemical
Zoology Academic Press, New York
Vogt G, Storch V, Quinitio ET, Pascual FP (1985) Midgut gland as monitor organ for the
nutritional value of diets in Penaeus monodon (Decapoda). Aquaculture 48: 1-12
Tables
Table 1: Nested one way ANOVA for differences in abdomen tissue wet weight/dry weight
ratio with differences in frequency of feeding and enclosure.
Source of Variation df SS MS F-value p-value
Frequency of feeding 3 1.21 0.40 9.18 0.029
Enclosure 4 0.18 0.04 3.66 0.027
Error 16 0.19 0.01
Total 23 1.58

193
Table 2: One way ANOVA for differences in blood protein with differences in lobster
feeding regime
Source of Variation df SS MS F-value p-value
Frequency of feeding 3 14285 4762 34.88 0.0001
Error 20 2730 137
Total 23 17015
Table 3: One way ANOVA for differences in tail tissue dry weight/lobster CL with
differences in lobster feeding regime
Source of Variation df SS MS F-value p-value
Frequency of feeding 3 0.006 0.002 2.79 0.067
Error 20 0.014 0.000
Total 23 0.02
Table 4: One way ANOVA for differences in tissue glycogen concentration with
differences in lobster feeding regime
Source of Variation df SS MS F-value p-value
Frequency of feeding 3 0.0005 0.0001 1.54 0.236
Error 20 0.002 0.0001
Total 23 0.002
Table 5: One way ANOVA for differences in RWDG (weight) with differences in lobster
feeding regime
Source of Variation df SS MS F-value p-value
Frequency of feeding 3 0.0008 0.0002 36.33 0.0001
Error 20 0.0001 0.0000
Total 23 0.001

194
Table 6: One way ANOVA for differences in RWDG (size) with differences in lobster
feeding regime
Source of Variation df SS MS F-value p-value
Frequency of feeding 3 0.015 0.005 25.17 0.0001
Error 20 0.004 0.0002
Total 23 0.019

195
Figure
Fig. 1: Relationship between frequency of lobster feeding and lobster nutritional condition
(mean ± se). Letters above treatment groups indicate groups are significantly different
according to post-hoc Tukey tests (p<0.05, df = 3).