Diet and Eating Practices among Adolescent Girls...Diet and Eating Practices among Adolescent Girls...
182
Diet and Eating Practices among Adolescent Girls in Low- and Middle-Income Countries A Systematic Review FEBRUARY 2018 EMILY C. KEATS, AVIVA RAPPAPORT, REENA JAIN, CHRISTINA OH, SHAILJA SHAH, ZULFIQAR A. BHUTTA
Transcript of Diet and Eating Practices among Adolescent Girls...Diet and Eating Practices among Adolescent Girls...
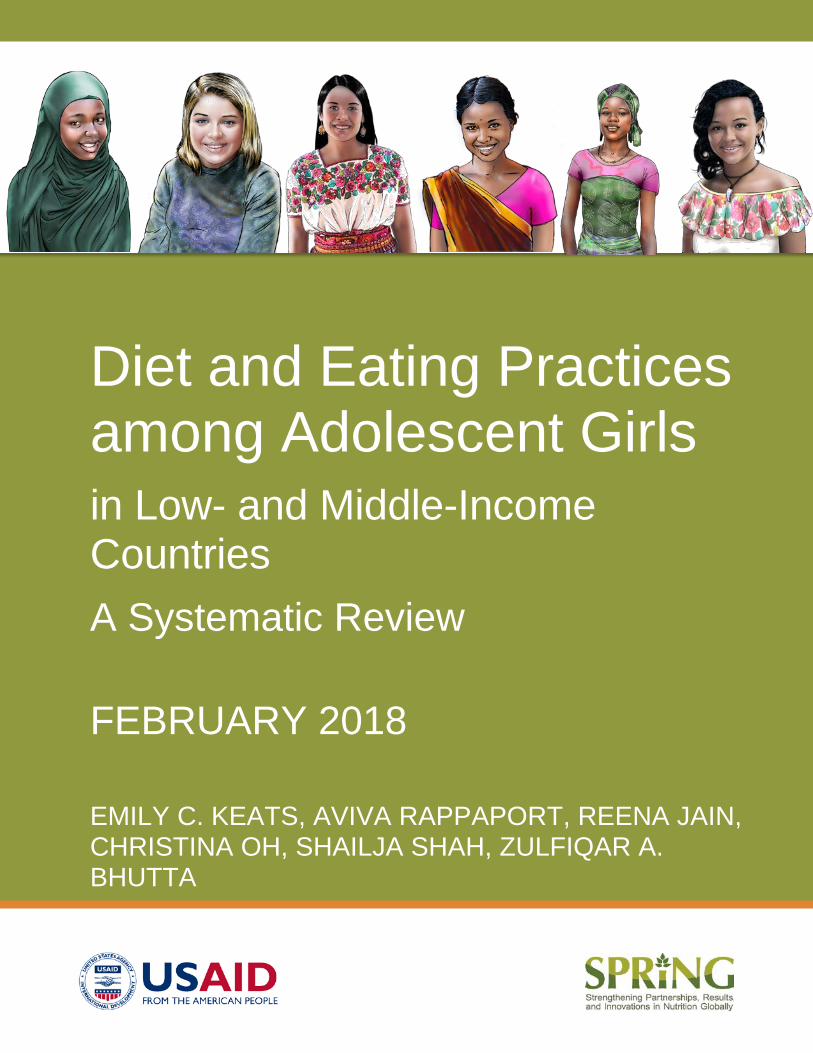
Diet and Eating Practices among Adolescent Girls in Low- and Middle-Income Countries A Systematic Review
FEBRUARY 2018
EMILY C. KEATS, AVIVA RAPPAPORT, REENA JAIN, CHRISTINA OH, SHAILJA SHAH, ZULFIQAR A. BHUTTA
ABOUT SPRING
The Strengthening Partnerships, Results, and Innovations in Nutrition Globally (SPRING) project is a seven-year USAID-funded cooperative agreement to strengthen global and country efforts to scale up high-impact nutrition practices and policies and improve maternal and child nutrition outcomes. The project is managed by JSI Research & Training Institute, Inc., with partners Helen Keller International, The Manoff Group, Save the Children, and the International Food Policy Research Institute.
RECOMMENDED CITATION
Keats, Emily C., Aviva I. Rappaport, Reena Jain, Christina Oh, Shailja Shah, Zulfiqar A. Bhutta. 2018. Diet and Eating Practices among Adolescent Girls in Low- and Middle-Income Countries: A Systemic Review. Arlington, VA: Strengthening Partnerships, Results, and Innovations in Nutrition Globally (SPRING) project.
DISCLAIMER
This report is made possible by the generous support of the American people through the United States Agency for International Development (USAID) under the terms of the Cooperative Agreement AID-OAA-A-11-00031, SPRING, managed by JSI Research & Training Institute, Inc. (JSI). The contents are the responsibility of JSI, and do not necessarily reflect the views of USAID or the U.S. Government.
SPRING
JSI Research & Training Institute, Inc.
1616 Fort Myer Drive, 16th Floor
Arlington, VA 22209 USA
Phone: 703-528-7474
Fax: 703-528-7480
Email: [email protected]
Internet: 35Twww.spring-nutrition.org35T
COVER ILLUSTRATIONS: Victor Nolasco for SPRING

46TDiet and Eating Practices among Adolescent Girls in Low- and Middle-Income Countries A Systematic Review Emily C. Keats, Aviva I. Rappaport, Reena Jain, Christina Oh, Shailja Shah, Zulfiqar A. Bhutta
ABSTRACT Adolescent girls in low-and middle-income countries (LMIC) have poor nutrition profiles, including high risks for undernutrition, overweight/obesity, and micronutrient deficiencies. To better understand the current dietary intake and practices of adolescents in LMIC, we undertook a large-scale systematic review. We identified 288 studies which passed the inclusion and exclusion criteria. Foods were grouped according to an adapted version of the Food and Nutrition Technical Assistance (FANTA III) Minimum Dietary Diversity Guide for Women. We found that the diet quality of adolescent girls in LMIC is generally poor. Fruit and vegetable intake is vastly inadequate, and girls are consuming high-fat and calorie-rich foods that are likely to be contributing to the rise in overweight and obesity, especially among younger adolescents (10–14 years). In South Asia and Africa, protein intake is inadequate and fat intake is low—factors which may contribute to the prevalence of underweight in these regions. Overall, breakfast skipping and snacking are highly prevalent among adolescent girls of all ages. Along with obesity prevention initiatives, school-based policies should be mandated to limit the availability of unhealthy foods throughout the day. School meal programs should be considered for vulnerable or low-income populations.
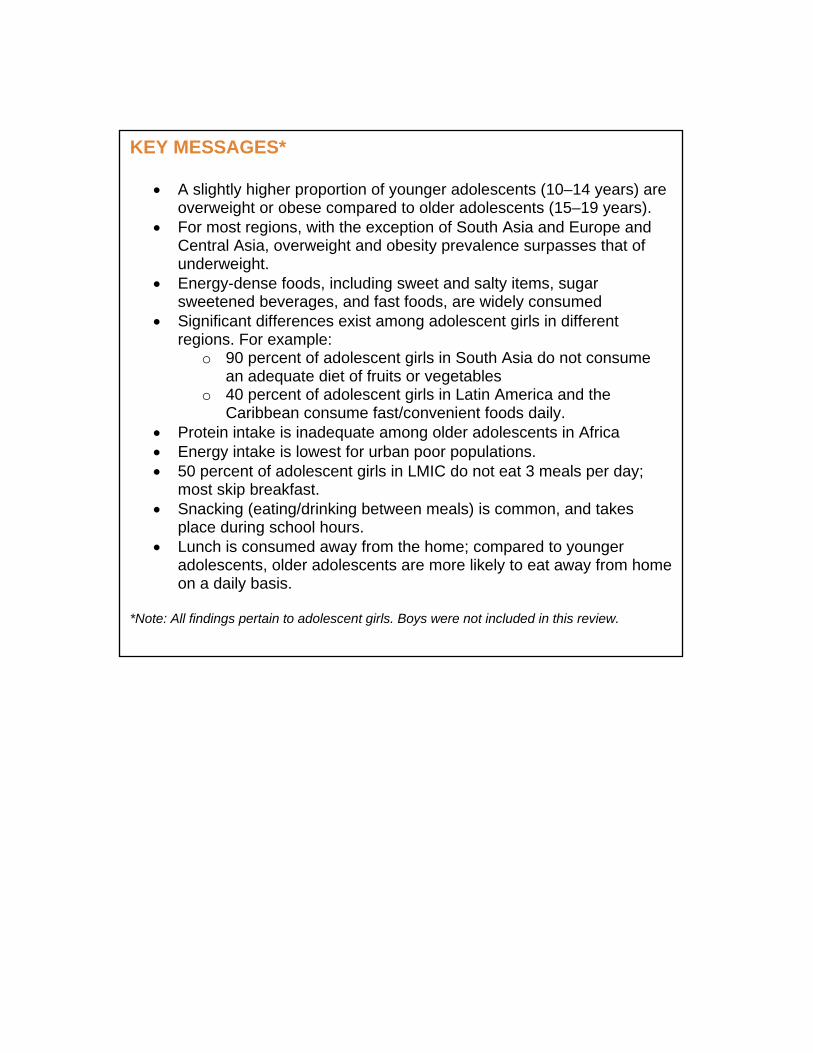
KEY MESSAGES*
• A slightly higher proportion of younger adolescents (10–14 years) areoverweight or obese compared to older adolescents (15–19 years).
• For most regions, with the exception of South Asia and Europe andCentral Asia, overweight and obesity prevalence surpasses that ofunderweight.
• Energy-dense foods, including sweet and salty items, sugarsweetened beverages, and fast foods, are widely consumed
• Significant differences exist among adolescent girls in differentregions. For example:
o 90 percent of adolescent girls in South Asia do not consumean adequate diet of fruits or vegetables
o 40 percent of adolescent girls in Latin America and theCaribbean consume fast/convenient foods daily.
• Protein intake is inadequate among older adolescents in Africa• Energy intake is lowest for urban poor populations.• 50 percent of adolescent girls in LMIC do not eat 3 meals per day;
most skip breakfast.• Snacking (eating/drinking between meals) is common, and takes
place during school hours.• Lunch is consumed away from the home; compared to younger
adolescents, older adolescents are more likely to eat away from homeon a daily basis.
*Note: All findings pertain to adolescent girls. Boys were not included in this review.
Diet & Eating Practices of Adolescents in LMIC
v
TABLE OF CONTENTS ACRONYMS ............................................................................................................. vii STUDY OVERVIEW ................................................................................................... 1 OBJECTIVES ............................................................................................................. 2 CONCEPTUAL FRAMEWORK .................................................................................. 2 OUTCOMES OF INTEREST ...................................................................................... 4 METHODS .................................................................................................................. 4 Search Strategy .......................................................................................................... 4 Study Selection ........................................................................................................... 4 Data Synthesis and Analysis ...................................................................................... 5 BMI Status ................................................................................................................... 6 Energy and Macronutrient Intake ................................................................................ 7 Dietary Intake .............................................................................................................. 7 Meal Patterns .............................................................................................................. 8 Underlying Determinants ............................................................................................ 8 Quality Assessment .................................................................................................... 9 BMI Status ................................................................................................................. 15 Macronutrient Status ................................................................................................. 18 Energy Intake ............................................................................................................ 22 Dietary Intake of All Food Groups ............................................................................. 25 Place of Meal Consumption ...................................................................................... 57 Meal Patterns ............................................................................................................ 60 Macronutrient Status and Urban/Rural Residence, Socioeconomic Status, and Gender Inequality ...................................................................................................... 66 DISCUSSION ............................................................................................................ 66 Study Limitations ....................................................................................................... 66 Study Implications ..................................................................................................... 68 RECOMMENDATIONS ............................................................................................ 74 CONCLUSIONS ....................................................................................................... 76 ACKNOWLEDGEMENTS ........................................................................................ 76 REFERENCES ......................................................................................................... 77 APPENDIX I .............................................................................................................. 99 APPENDIX II ........................................................................................................... 154 Figures Figure 1. Conceptual Framework for Adolescent Girls’ Nutrition ................................ 3 Figure 2. PRISMA Flow Diagram for Study Selection .............................................. 10 Figure 3. Countries Represented by Our Included Studies (N=number of studies) . 12 Figure 4. Mean BMI for Adolescents (10–19), by Region ......................................... 16 Figure 5a. BMI Status for Adolescents (10–19) ........................................................ 16 Figure 5b. BMI Status among Adolescents (10–19), by Region ............................... 17
Diet & Eating Practices of Adolescents in LMIC
vi
Figure 6. Prevalence of Inadequate Fruit and Vegetable Consumption among Adolescent Girls (10–19) .......................................................................................... 42 Figure 7. Common Foods Consumed by Brazilian Adolescent Girls (Ages 12-17 Years) ................................................................................................... 55 Figure 8. Proportion of Adolescents (10–19) Consuming Various Foods and Daily Consumption (of Those Who Reported Consuming the Food) ................ 56 Figure 9. Frequency of Consumption of Energy-Dense Foods among Adolescents (10–19) ................................................................................................. 56 Figure 10. Proportion of Girls (10–19) Who Eat Breakfast, Lunch, and Dinner Outside the Home .................................................................................. 58 Figure 11. Proportion of Adolescent Girls (10–19 Years) Who Reported Skipping Breakfast, by Region .................................................................................. 63
Tables Table 1. Inclusion and Exclusion Criteria .................................................................... 5 Table 2. Abridged Summary Table of Study Demographics ..................................... 13 Table 3. Protein Intake (grams/day) for Adolescents (10–19), by Region ................ 18 Table 4. Fat Intake (grams/day) for Adolescents (10–19), by Region ...................... 20 Table 5. Carbohydrate Intake (grams/day) for All Adolescents (10–19), by Region .................................................................................................................. 21 Table 6. Energy Intake (kcal/day) for Adolescents (10–19), by Region ................... 23 Table 7. Energy Intake (kcal/day) for Adolescents (10–19) by Urban/Rural Residence ................................................................................................................. 24 Table 8. Consumption of Grains, Roots, Tubers, and Plantains............................... 26 Table 9. Consumption of Pulses (Beans, Peas, and Lentils) .................................... 28 Table 10. Consumption of Dairy Products ................................................................ 31 Table 11. Consumption of Meat, Poultry, and Fish ................................................... 33 Table 12. Consumption of Fruits ............................................................................... 37 Table 13. Consumption of Vegetables ...................................................................... 39 Table 14. Consumption of Sweet Food Items ........................................................... 43 Table 15. Consumption of Salty/Fried Food Items ................................................... 46 Table 16. Consumption of Fast Foods ...................................................................... 48 Table 17. Consumption of Sugar-Sweetened Beverages ......................................... 51 Table 18. Proportion of Adolescent Girls (10–19) Who Eat Breakfast, Lunch, and Dinner Outside the Home ...................................................................... 58 Table 19. Proportion of Adolescent Girls (10–19) from All Regions Who Eat Meals Outside the Home (by Frequency) .................................................. 59 Table 20. Prevalence of Breakfast Skipping among Adolescent Girls, by Region ... 61 Table 21. Prevalence of Snacking among Adolescents (10–19) .............................. 63 Table 22. Prevalence of Snacking, by Time of Day, Snack Taken, and Prevalence of Adolescents who Consume Snacks Daily ......................................... 64 Table 23. Prevalence of Vegetarianism among Adolescent Girls (10–19), by Region .................................................................................................................. 65 Table 24. Summary Comparing Younger ( 10–14) and Older (15–19) Adolescents across Various Outcomes ......................................................................................... 72
vii
ACRONYMS AA-HA! Global Accelerated Action for the Health of Adolescents AI adequate intake BMI body mass index FANTA Food and Nutrition Technical Assistance FFQ food frequency questionnaire GBD Global Burden of Disease GII Gender Inequality Index HIC high-income country IAP Independent Accountability Panel IOM Institute of Medicine IOTF International Obesity Task Force IQR interquartile range LMIC low- and middle-income countries NCD noncommunicable disease NIH National Institutes of Health RCT randomized controlled trials RDA recommended daily allowance SD standard deviation SE standard error SSB sugar-sweetened beverages WHO World Health Organization

Diet & Eating Practices of Adolescents in LMIC
viii
Diet & Eating Practices of Adolescents in LMIC
1
A Systematic Review of Diet and Eating Practices among Adolescent Girls in Low- and Middle-income Countries February 2018
STUDY OVERVIEW Adolescence marks a critical period of biological and psychosocial growth and development that is unique among phases in the life cycle. The nutrient needs of adolescents are higher than those of prepubescent children and adults. P
1P Given
the increasing autonomy in diet and eating habits that adolescents experience as parental control lessens, adolescence can be a key entry point for interventions that will underlie good health practices in adulthood. The 2013 Lancet series on maternal and child undernutrition highlighted adolescence as a priority on the global health agenda and underscored the need for a life-cycle approach that promotes nutrition-related policies, programming, and interventions for this group specifically. P
2P
Adolescent girls in low- and middle-income countries (LMIC) have poorer nutritional profiles compared to their counterparts in high-income countries (HICs), including greater risks for undernutrition, overweight/obesity, and micronutrient deficiencies. P
3-5P In many LMICs, the prevalence of
overweight/obesity surpasses that of underweight, aligning with the nutrition transition that is now sweeping the globe. P
6, 7P Moreover, poor diet is a key risk
factor for noncommunicable diseases (NCDs), which have been of growing concern in many LMIC. P
6P Additionally, given the high number of pregnancies
among adolescent girls, combatting malnutrition is important to improve reproductive and birth outcomes. Undernutrition in adolescent mothers, also has an intergeneration effect P
1P. Often represented by stunting, undernutrition can lead
to fetal growth restriction, low birthweight, and preterm birth, which, in turn, increase the chances of childhood stunting. P
3, 8, 9P Additionally, maternal overweight
and obesity has been shown to increase the risk of infants developing obesity and metabolic diseases later in life.P
10, 11P Both points highlight the role that
adolescent nutrition plays in perpetuating an intergenerational cycle of malnutrition. Adolescents comprise one in six of the global population today;P
12P the health and
wellbeing of this population is critical to achieving the Sustainable Development Goals (SDGs). A recent report from the United Nation’s Independent Accountability Panel (IAP) for the 2015 Global Strategy for Women’s, Children’s, and Adolescents’ Health—a group appointed to provide an independent assessment of progress and challenges in implementing this strategy—focused on the importance of improving accountability for adolescents to achieve the SDGs. P
12P The IAP provided specific recommendations, including improving the
visibility of adolescents, ensuring universal health care reaches them, and fostering government accountability to combat chronic conditions, such as malnutrition and NCDs, in adolescent girls. P
12P The IAP acknowledges that
investing in adolescents now will have enormous impact for generations to come.
Diet & Eating Practices of Adolescents in LMIC
2
However, the nutrition status of adolescents has been neglected. Evidence syntheses on diets and eating practices of adolescents are very limited and are mostly based on adolescents living in high-income settings. Therefore, the objectives of this review are to summarize the current dietary intake, patterns, and practices of adolescent girls in LMIC.
OBJECTIVES The aim of this systematic review is to summarize current dietary intakes, patterns, and practices of adolescent girls (ages 10–19 years) in LMIC. The objectives are to—
1. synthesize and critically appraise current literature on dietary intake(e.g., types of foods consumed, quality of food), eating practices (e.g.,time, place, and frequency of consumption) and patterns (e.g.,snacking, skipping meals) of adolescent girls in LMIC.
2. summarize available information to develop a call to action and keyrecommendations for policies, programming, advocacy, or furtheraction.
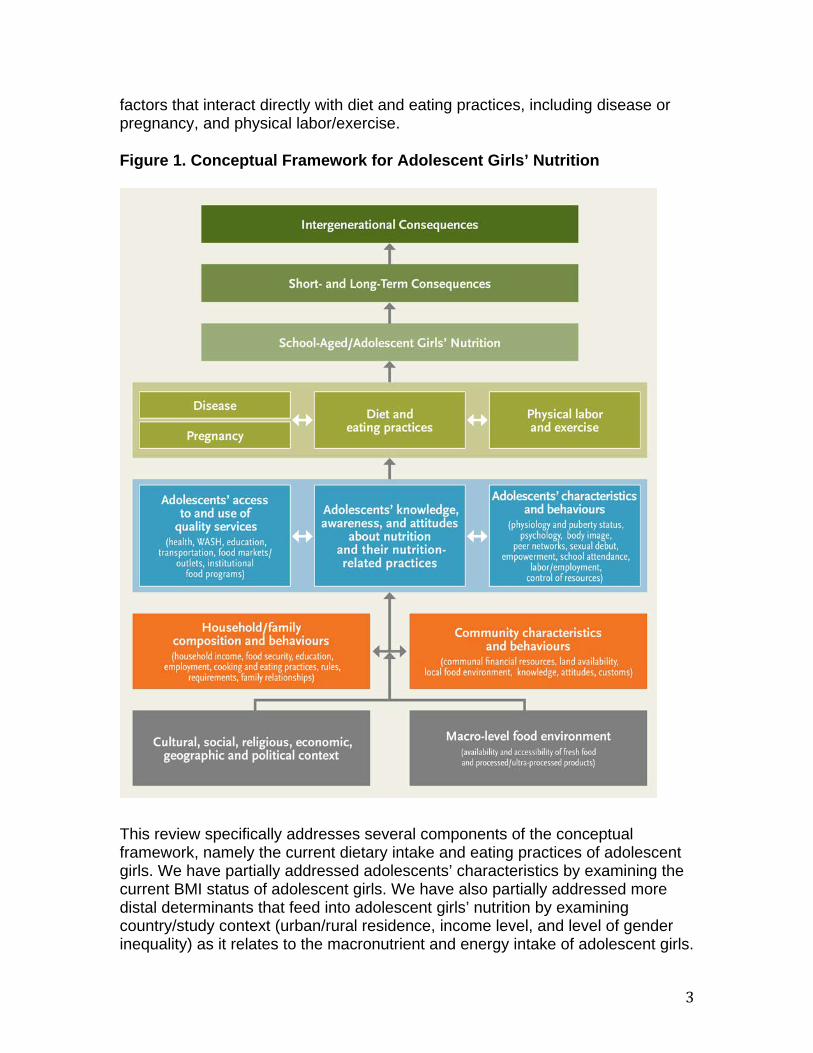
CONCEPTUAL FRAMEWORK The conceptual framework for adolescent girls’ nutrition (figure 1) is an overarching guide developed to understand the determinants of adolescent girls’ dietary intake, and the short-term, long-term, and intergenerational impacts of diet and eating practices. The framework was developed by the review authors and a technical advisory group formed by the United States Agency for International Development (USAID)-funded Strengthening Partnerships, Results, and Innovations in Nutrition Globally (SPRING) project.
The most distal determinants are macro-level factors [grey boxes] that can impact food choices and food security, and may include circumstances such as conflict and displacement—two situations that can significantly affect a food system. Other underlying determinants include country-level policies, agriculture and food production, cultural beliefs, and economics relating to food systems. Next are factors at the community and the household/family level [orange boxes], such as household income, gender equity, emotional and physical safety, engagement in learning, family cohesion, and other such socio-economic factors that influence cooking and eating practices. Each of these factors comprises the household/community food environment that will impact an individual’s food choices. Finally, there are factors that are specific to adolescents [blue boxes], including physiological and psychosocial characteristics, such as puberty status, social networks, sense of wellbeing, and decision-making skills, in addition to access to quality services. Determinants at each of these levels potentially influence adolescents’ diet and eating practices. The framework also highlights
3
factors that interact directly with diet and eating practices, including disease or pregnancy, and physical labor/exercise. Figure 1. Conceptual Framework for Adolescent Girls’ Nutrition
This review specifically addresses several components of the conceptual framework, namely the current dietary intake and eating practices of adolescent girls. We have partially addressed adolescents’ characteristics by examining the current BMI status of adolescent girls. We have also partially addressed more distal determinants that feed into adolescent girls’ nutrition by examining country/study context (urban/rural residence, income level, and level of gender inequality) as it relates to the macronutrient and energy intake of adolescent girls.
Diet & Eating Practices of Adolescents in LMIC
4
OUTCOMES OF INTEREST Primary Outcomes:
• Types of food consumed• Frequency of consumption• Place of consumption• Meal patterns• Macronutrient intake• Energy intake
Secondary Outcomes: • BMI status
METHODS Search Strategy We used an adapted PICO methodology (Appendix I, table 1) to transform our research question into a searchable query. For the “intervention” bracket, we specified, “diet and eating practices/patterns,” to capture the main content of the review. We did not restrict our search by outcome to broaden the scope of evidence retrieved. Using the search strategy and terms outlined in table 2 of the Appendix, we adapted and ran the search in seven databases: Medline, Embase, CAB Abstracts, CINAHL, Cochrane (CENTRAL Register of Controlled Trials and Database of Systematic Reviews), 3ie Databases of Impact Evaluations, WHO regional databases (WHOLIS). The date of the last search was March 31, 2017 for Medline, Embase, CAB, and CINAHL, and April 27, 2017 for all remaining databases.
Study Selection All titles and abstracts were independently screened, applying the specific inclusion/exclusion criteria outline below (table 1). All full-text screening and data abstraction were completed in duplicate.
5
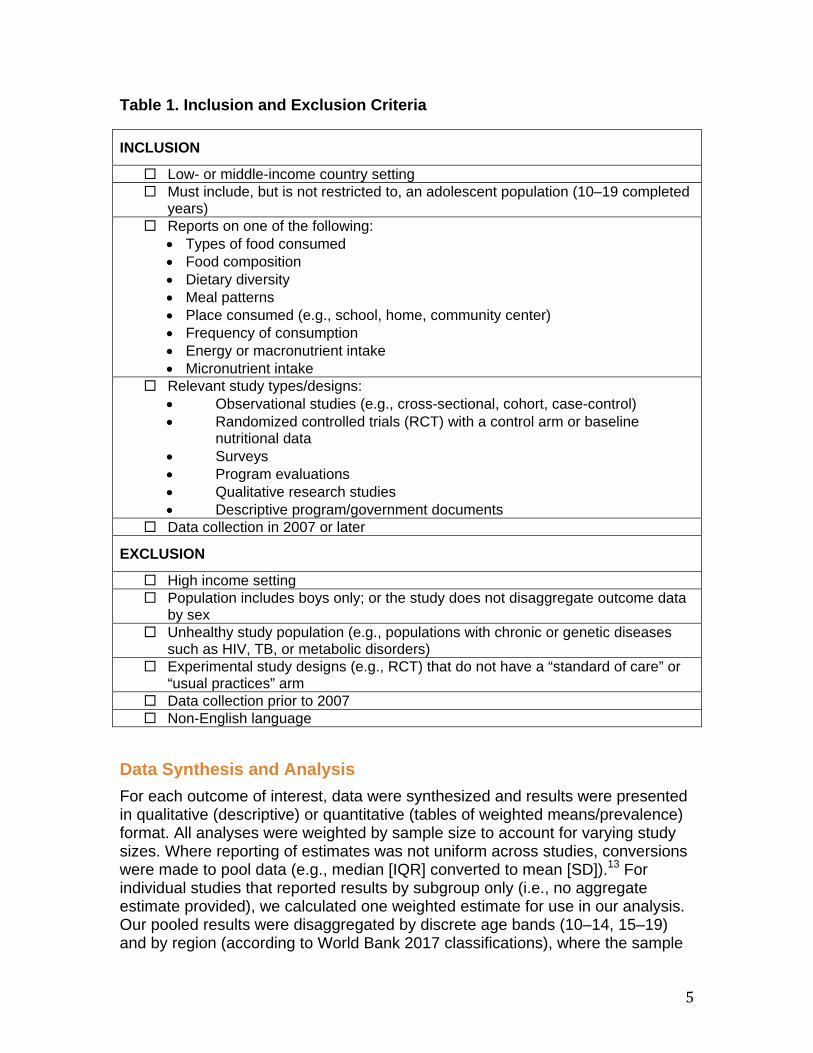
Table 1. Inclusion and Exclusion Criteria
INCLUSION
Low- or middle-income country setting Must include, but is not restricted to, an adolescent population (10–19 completed
years) Reports on one of the following:
• Types of food consumed • Food composition • Dietary diversity • Meal patterns • Place consumed (e.g., school, home, community center) • Frequency of consumption • Energy or macronutrient intake • Micronutrient intake
Relevant study types/designs: • Observational studies (e.g., cross-sectional, cohort, case-control) • Randomized controlled trials (RCT) with a control arm or baseline
nutritional data • Surveys • Program evaluations • Qualitative research studies • Descriptive program/government documents
Data collection in 2007 or later
EXCLUSION
High income setting Population includes boys only; or the study does not disaggregate outcome data
by sex Unhealthy study population (e.g., populations with chronic or genetic diseases
such as HIV, TB, or metabolic disorders) Experimental study designs (e.g., RCT) that do not have a “standard of care” or
“usual practices” arm Data collection prior to 2007 Non-English language
Data Synthesis and Analysis For each outcome of interest, data were synthesized and results were presented in qualitative (descriptive) or quantitative (tables of weighted means/prevalence) format. All analyses were weighted by sample size to account for varying study sizes. Where reporting of estimates was not uniform across studies, conversions were made to pool data (e.g., median [IQR] converted to mean [SD]).P
13P For
individual studies that reported results by subgroup only (i.e., no aggregate estimate provided), we calculated one weighted estimate for use in our analysis. Our pooled results were disaggregated by discrete age bands (10–14, 15–19) and by region (according to World Bank 2017 classifications), where the sample
Diet & Eating Practices of Adolescents in LMIC
6
was large enough to provide meaningful results. To categorize adolescents into either the 10–14 or 15–19 age groups, the mean participant age of the study sample must have fallen within that bracket. If the mean age was not provided, we assumed a normal distribution of the study sample and determined the age grouping based on the majority of ages (by year) that were represented in the study population. For example, a study population that was 12–15 years would be re-categorized as 10–14, and a sample that was 13–18 years would be placed in the 15–19 category. If there was an even split of participants by age (e.g., 13–16 years), then this study was analyzed in the overall (10–19) group only. Consolidated totals were provided at the bottom of every table to reflect outcomes for adolescents across all regions. A summary table, including details of study design, study population, and outcomes available per study, can be found in Appendix II - Summary of Study Characteristics.
BMI Status For our analysis of BMI status, all BMI data were converted and categorized according to WHO, Extended International Obesity Task Force (IOTF), or Centers for Disease Control (CDC) cutoff points, depending on how the study data were presented. Using the WHO BMI-for-age growth chart for girls ages 5 to 19 years, P
14P proportions of severely underweight (<-3 SD), underweight (<-2 SD),
normal weight, overweight (>+1 SD, equivalent to BMI 25 kg/mP
2P at 19 years), and
obese (>+2 SD, equivalent to BMI 30 kg/mP
2P at 19 years) were determined for
each study. IOTF uses age and sex specific cutoffs to determine BMI for girls 2–18 years. The revised cutoffs equivalent to BMI at 18 years were categorized as follows: underweight (<16 kg/m P
2P), normal weight, overweight (>25 kg/mP
2P) and obese (>30
kg/mP
2P).
For studies that reported weight status according to the CDC BMI-for-age percentiles for girls, status was categorized as follows: underweight: <5P
thP
percentile; normal weight: 5P
thP–85P
thP percentile; overweight: 85P
thP–95P
thP percentile;
and obese: >95P
thP percentile.
Some studies reported the proportion of sample by weight category (e.g., proportion of girls who were overweight). Study estimates were then weighted by sample size to produce an average proportion by age band and region. Where overweight and obesity prevalence were grouped together (i.e., data could not be disaggregated), data were excluded from analysis. Additionally, where data allowed, we determined mean BMI by age and region. To evaluate the hypothesis that intake of fast foods is associated with increased BMI in adolescent girls, we pulled out studies that reported on both outcomes. We then ran ordinary least squares regression on the x (fast food intake) and y (mean BMI) variables to estimate the line of best fit and determine the associated beta coefficient. The same analysis was conducted to determine the association between fast food intake and the proportion of adolescents who are overweight and obese.
7
Energy and Macronutrient Intake All energy intake data were reported as kcal per day, and presented as weighted means. Macronutrient intakes are reported for carbohydrate, fat, and protein. Data on both energy and macronutrient intake were classified as being adequate or inadequate based on guidelines outlined by the Institute of Medicine (IOM), which are age and sex-specific. P
15P The recommended dietary allowance (RDA) for
carbohydrates for adolescent girls ages 9–19 years is 130 g/d.P
15P The RDA for
protein differs for younger and older adolescents and is set at 34 g/d (for girls 9–13 years) and 46 g/d (for girls 14–19 years).P
15P Currently, there is no Adequate
Intake (AI), Estimated Average Requirement (EAR), or RDA for fat intake. However, the Acceptable Macronutrient Distribution Range (AMDR) for adolescents 10–18 years is 25–35 percent and for age 19 years is 20–35 percent of total energy coming from fat.P
15P
Dietary Intake Food items were categorized according to an adapted version of FANTA’s Minimum Dietary Diversity for Women: A Guide for Measurement. P
16P These
categories included 1) grains, white roots, tubers, and plantains; 2) pulses (beans, peas, lentils); 3) nuts and seeds; 4) dairy; 5) meat, poultry, and fish; 6) eggs; 7) oils and fats; 8) fruits; 9) vegetables; 10) condiments and seasonings; 11) snack foods; 12) sugar-sweetened beverages (SSB); and 13) alcohol. We omitted categories for green leafy vegetables and vitamin A-rich fruits and vegetables because of data limitations. “Snack foods” were subdivided into two categories to capture their variation and to help distinguish snack foods from snacking as a meal pattern. These categories were 11a) sweet food items (including confectionary) and 11b) salty and fried food items.P
17P We also added a
category specific to fast food, which included foods that are typically low in quality and nutritional value. Common examples include burgers (hamburger, chicken burger), fried chicken, french fries, and pizza. Additional terms that authors may have used to describe fast foods were “junk foods” or “high fat foods.” We made assumptions about fast foods where items were grouped with similar products. For example, if hamburger, chicken burger, pizza, and spring roll were grouped together and beef, fish, lamb, and chicken were grouped separately, we would assume the former to be fast foods. Such assumptions were made only when distinctions were clear. When a food item was reported as “consumed with” another food item (e.g., lentils eaten with bread), the proportion was applied to both food groups (i.e., grains and pulses). To determine the main ingredient of any unfamiliar food (e.g., traditional dishes) we performed a Google search using the name of the food/meal and the country in which the study was conducted. Dietary intake was measured and reported variably across all studies. We analyzed and presented consumption data in two categories: mean general consumption (for all studies) and frequency of consumption (for the subset of studies that reported frequency data). Both are presented in one table, per food group. For example, one study may have reported that 46 percent of adolescent

Diet & Eating Practices of Adolescents in LMIC
8
girls consumed fast food. Another study may have reported that 70 percent of adolescent girls consumed fast food within the last 7 days and, of this 70 percent, 6 percent consumed it daily, 24 percent consumed it two to three times per week, and 65 percent consumed it weekly. These two measures of consumption (with and without frequency data) were not pooled. Due to the inconsistent use of frequencies across studies, we standardized categories into: daily, two to three times per week, four to six times per week, weekly, or monthly. In addition to reporting mean general consumption and frequency of consumption for fruits and vegetables, we also determined whether consumption could be considered adequate for these food groups. To be included in this analysis, a study must have reported daily intake of fruits and vegetables, along with serving size data (i.e., daily intake in grams/day). We utilized WHO recommendations of >400 grams of fruits and vegetables daily (based on five servings per day of 80 grams each), which is equivalent to two servings of fruit and three servings of vegetables per day. P
18P Where studies reported fruit and vegetable consumption
without associated serving size data, we could not determine adequacy. For other food groups, comparisons to daily adequacy recommendations were not reported, due to the lack of available information specific to adolescents per region. A sensitivity analysis was conducted to determine whether the method of primary data collection had an impact on dietary intake results. To do this, we re-analyzed mean general consumption of grains, dairy products, flesh foods, fruits and vegetables disaggregated by method of data collection (food frequency questionnaire, 24-hour recall, food records, or other non-validated tools). We chose these food groups based on their robust sample sizes for consumption data.
Meal Patterns Breakfast skipping was defined as anything other than daily consumption of breakfast. Where a frequency was not reported (e.g., the respondent stated only “I don’t eat breakfast”), we assumed these estimates to represent frequent breakfast skipping and included them in our analysis. We defined “snacking” as eating between meals, whether mid-morning, mid-afternoon, or evening. We excluded studies where authors defined snacking based on the type of food being consumed (e.g., chips, biscuits, fruit) rather than as a meal pattern. To be included, data must have indicated that foods were consumed between meals or as a meal replacement.
Underlying Determinants The underlying determinants of the conceptual framework were examined by disaggregating the macronutrient and energy intake data by country-level socioeconomic status, based on national income levels specified by the World Bank as of September 2017. Data were also disaggregated by urban/rural residence. If details regarding residence of the study population were not
9
provided, the study was excluded from this analysis. Lastly, macronutrient and energy intake were stratified by country-level gender inequality, based on the UNDP’s Gender Inequality Index (GII).P
19P Considering the importance of social
constructs regarding the position of young women and how they play into dietary intake and practices in many LMIC, we wanted to examine a composite measure of gender equality to determine if diet patterns changed among countries that ranked low versus high on the index. To form the index, the GII combines three main areas of human development: 1) reproductive health (measured by maternal mortality ratio and adolescent birth rates); 2) empowerment (measured by the proportion of parliamentary seats occupied by females and the proportion of adult (≥25 years) males and females who have secondary education); and 3) economic status (measured by the labor market participation rates between males and females aged 15 years or older)P
1.9P Higher GII values indicate greater
disparities and inequalities between genders in that country. For our analysis, countries were divided into quintiles based on their GII ranking and macronutrient intake was determined per age group and per quintile.
Quality Assessment Individual studies were critically appraised according to a set of criteria based on study type, using the Cochrane Guidelines and the National Institutes of Health quality assessment tools. P
20, 21P For randomized controlled trials, non-randomized
controlled trials, and controlled before-after studies, we considered the following domains: sequence generation, allocation sequence concealment, blinding, incomplete outcome data, selective outcome reporting, and other sources of bias. For all study types, we considered the domains listed above (where applicable), and assessed the risk of bias due to confounding, attrition, and reverse causality. We considered whether the study population had been clearly defined (e.g., age range of population provided), the representatives of the population (e.g., what selection criteria were used), whether the study methods were clearly defined (e.g., was a validated tool used for dietary intake data), completeness of data collection, and validity of data collected (e.g., were height and weight measured or reported). Study quality was used to perform an additional sensitivity analysis, whereby all low-quality studies were removed and dietary intake data (for grains, dairy products, flesh floods, fruits and vegetables) were re-analyzed. Additionally, we have linked sample size to each of our results statements. The majority of studies were low quality (64 percent) or medium quality (35 percent), based on small sample size, cross-sectional study design, purposive sampling, and completeness and validity of data collected. RESULTS The search produced 49,392 unique records, after removal of duplicates (figure 2).Following title and abstract screening, 44,403 records were excluded, leaving 4,455 articles to be assessed for eligibility through full text screening. Six hundred and twenty-six (626) studies met the inclusion and exclusion criteria, and of these, 338 studies (54 percent) did not disaggregate their data by sex. In
Diet & Eating Practices of Adolescents in LMIC
10
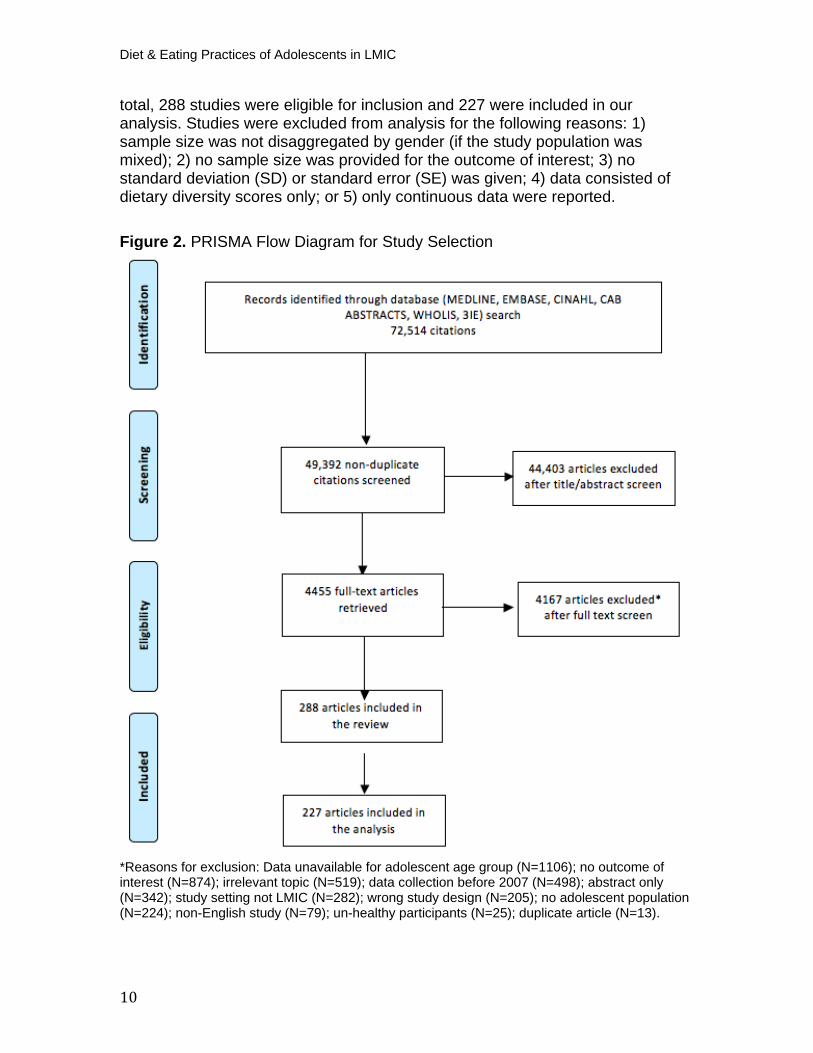
total, 288 studies were eligible for inclusion and 227 were included in our analysis. Studies were excluded from analysis for the following reasons: 1) sample size was not disaggregated by gender (if the study population was mixed); 2) no sample size was provided for the outcome of interest; 3) no standard deviation (SD) or standard error (SE) was given; 4) data consisted of dietary diversity scores only; or 5) only continuous data were reported.
Figure 2. PRISMA Flow Diagram for Study Selection
*Reasons for exclusion: Data unavailable for adolescent age group (N=1106); no outcome ofinterest (N=874); irrelevant topic (N=519); data collection before 2007 (N=498); abstract only (N=342); study setting not LMIC (N=282); wrong study design (N=205); no adolescent population (N=224); non-English study (N=79); un-healthy participants (N=25); duplicate article (N=13).
11
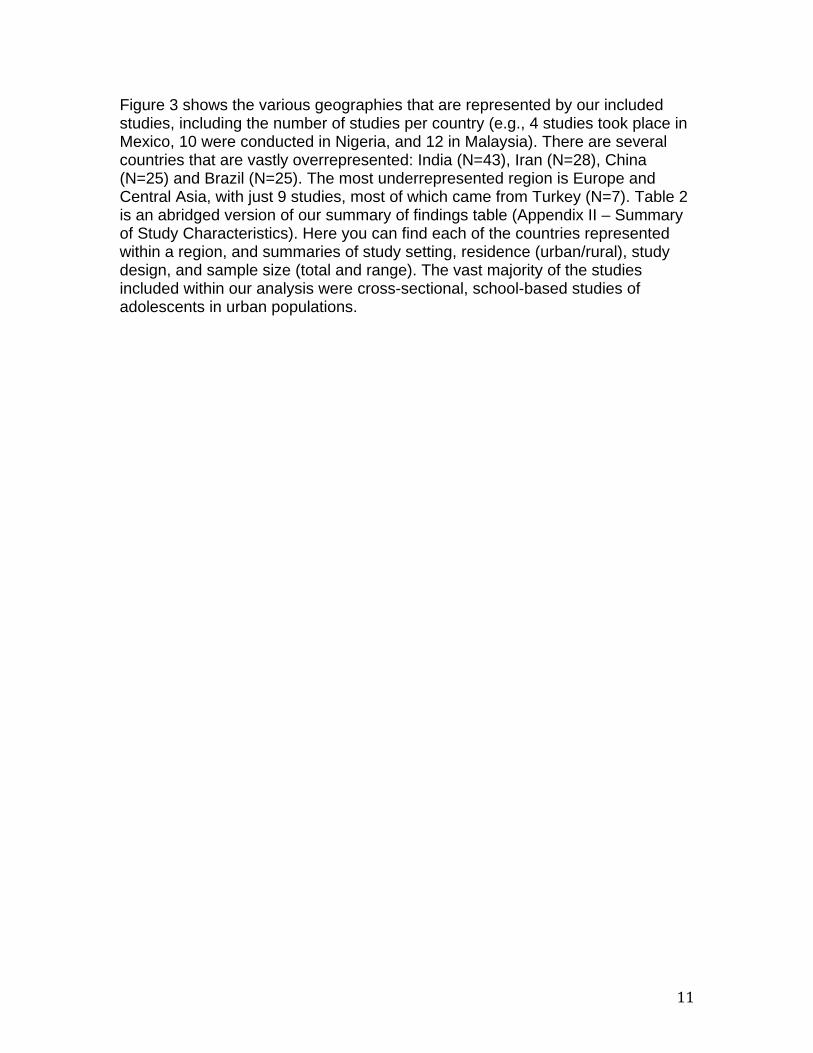
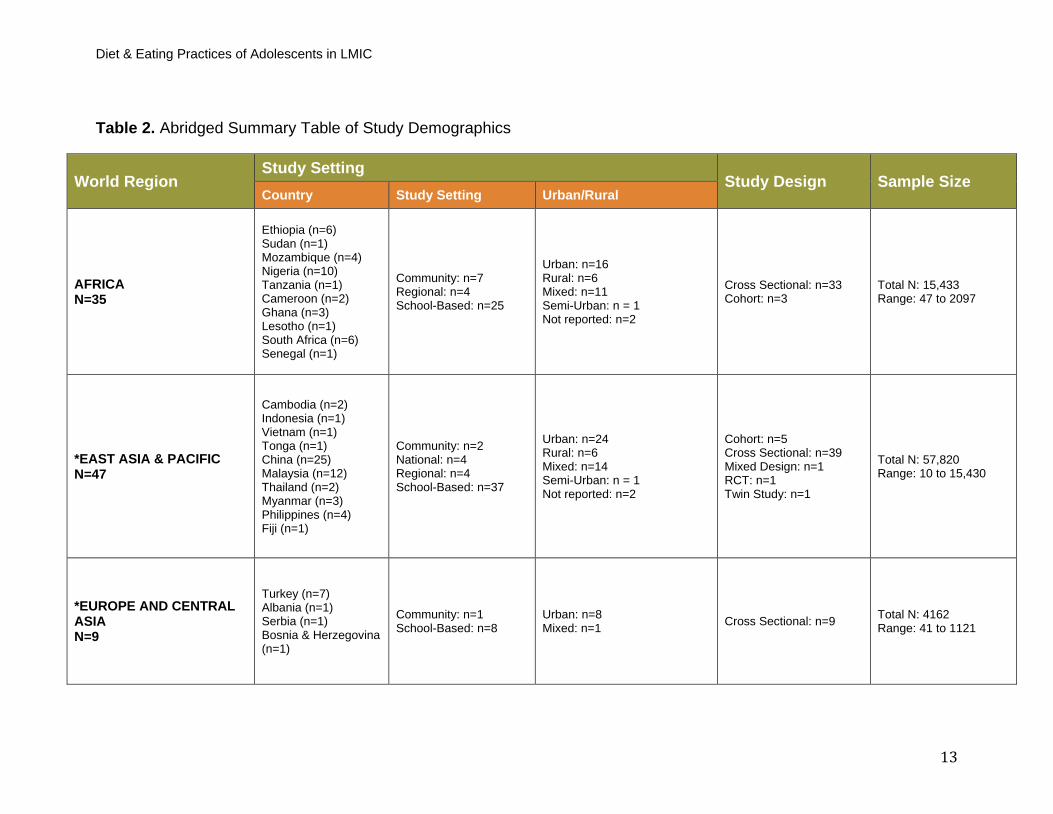
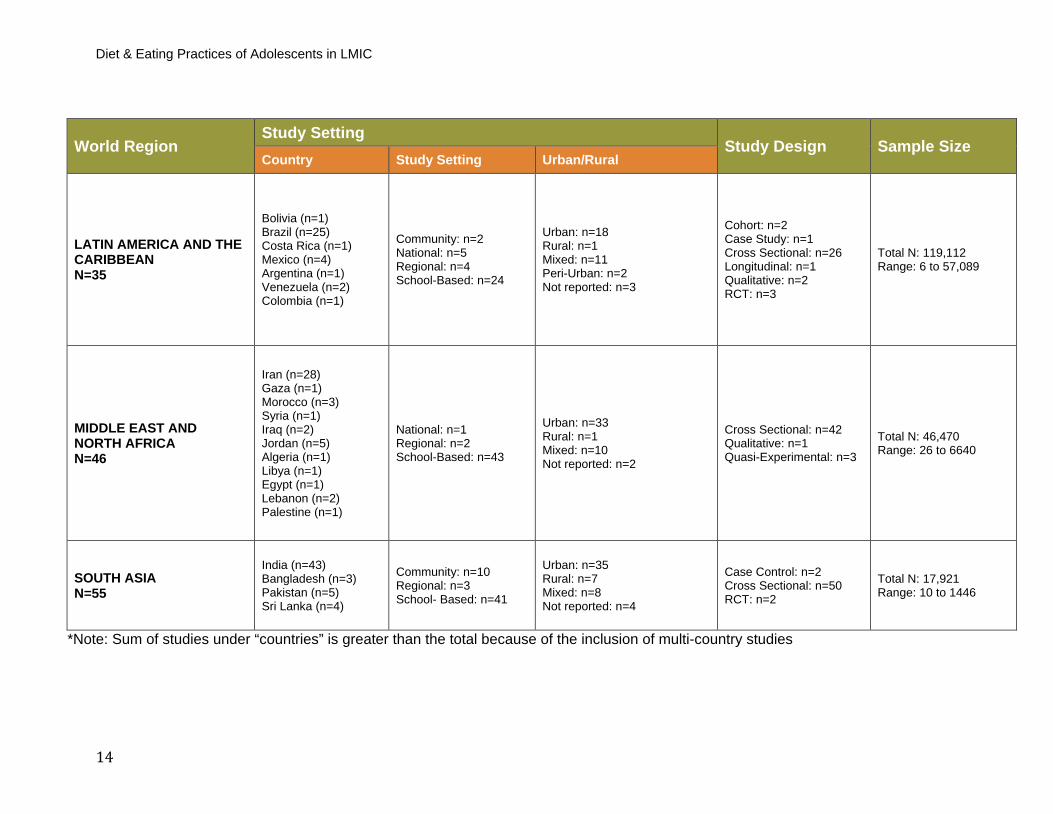
Figure 3 shows the various geographies that are represented by our included studies, including the number of studies per country (e.g., 4 studies took place in Mexico, 10 were conducted in Nigeria, and 12 in Malaysia). There are several countries that are vastly overrepresented: India (N=43), Iran (N=28), China (N=25) and Brazil (N=25). The most underrepresented region is Europe and Central Asia, with just 9 studies, most of which came from Turkey (N=7). Table 2 is an abridged version of our summary of findings table (Appendix II – Summary of Study Characteristics). Here you can find each of the countries represented within a region, and summaries of study setting, residence (urban/rural), study design, and sample size (total and range). The vast majority of the studies included within our analysis were cross-sectional, school-based studies of adolescents in urban populations.
Diet & Eating Practices of Adolescents in LMIC
12
Figure 3. Countries Represented by Our Included Studies (N=number of studies)
Note: Shading of a country does not indicate nationally representative data. It signifies that we have included a study (or studies) within our review that has taken place in that country.
Diet & Eating Practices of Adolescents in LMIC
13
Table 2. Abridged Summary Table of Study Demographics
World Region Study Setting
Study Design Sample Size Country Study Setting Urban/Rural
AFRICA N=35
Ethiopia (n=6) Sudan (n=1) Mozambique (n=4) Nigeria (n=10) Tanzania (n=1) Cameroon (n=2) Ghana (n=3) Lesotho (n=1) South Africa (n=6) Senegal (n=1)
Community: n=7 Regional: n=4 School-Based: n=25
Urban: n=16 Rural: n=6 Mixed: n=11 Semi-Urban: n = 1 Not reported: n=2
Cross Sectional: n=33 Cohort: n=3
Total N: 15,433 Range: 47 to 2097
*EAST ASIA & PACIFIC N=47
Cambodia (n=2) Indonesia (n=1) Vietnam (n=1) Tonga (n=1) China (n=25) Malaysia (n=12) Thailand (n=2) Myanmar (n=3) Philippines (n=4) Fiji (n=1)
Community: n=2 National: n=4 Regional: n=4 School-Based: n=37
Urban: n=24 Rural: n=6 Mixed: n=14 Semi-Urban: n = 1 Not reported: n=2
Cohort: n=5 Cross Sectional: n=39 Mixed Design: n=1 RCT: n=1 Twin Study: n=1
Total N: 57,820 Range: 10 to 15,430
*EUROPE AND CENTRAL ASIA N=9
Turkey (n=7) Albania (n=1) Serbia (n=1) Bosnia & Herzegovina (n=1)
Community: n=1 School-Based: n=8
Urban: n=8 Mixed: n=1 Cross Sectional: n=9 Total N: 4162
Range: 41 to 1121
Diet & Eating Practices of Adolescents in LMIC
14
World Region Study Setting
Study Design Sample Size Country Study Setting Urban/Rural
LATIN AMERICA AND THE CARIBBEAN N=35
Bolivia (n=1) Brazil (n=25) Costa Rica (n=1) Mexico (n=4) Argentina (n=1) Venezuela (n=2) Colombia (n=1)
Community: n=2 National: n=5 Regional: n=4 School-Based: n=24
Urban: n=18 Rural: n=1 Mixed: n=11 Peri-Urban: n=2 Not reported: n=3
Cohort: n=2 Case Study: n=1 Cross Sectional: n=26 Longitudinal: n=1 Qualitative: n=2 RCT: n=3
Total N: 119,112 Range: 6 to 57,089
MIDDLE EAST AND NORTH AFRICA N=46
Iran (n=28) Gaza (n=1) Morocco (n=3) Syria (n=1) Iraq (n=2) Jordan (n=5) Algeria (n=1) Libya (n=1) Egypt (n=1) Lebanon (n=2) Palestine (n=1)
National: n=1 Regional: n=2 School-Based: n=43
Urban: n=33 Rural: n=1 Mixed: n=10 Not reported: n=2
Cross Sectional: n=42 Qualitative: n=1 Quasi-Experimental: n=3
Total N: 46,470 Range: 26 to 6640
SOUTH ASIA N=55
India (n=43) Bangladesh (n=3) Pakistan (n=5) Sri Lanka (n=4)
Community: n=10 Regional: n=3 School- Based: n=41
Urban: n=35 Rural: n=7 Mixed: n=8 Not reported: n=4
Case Control: n=2 Cross Sectional: n=50 RCT: n=2
Total N: 17,921 Range: 10 to 1446
*Note: Sum of studies under “countries” is greater than the total because of the inclusion of multi-country studies
15
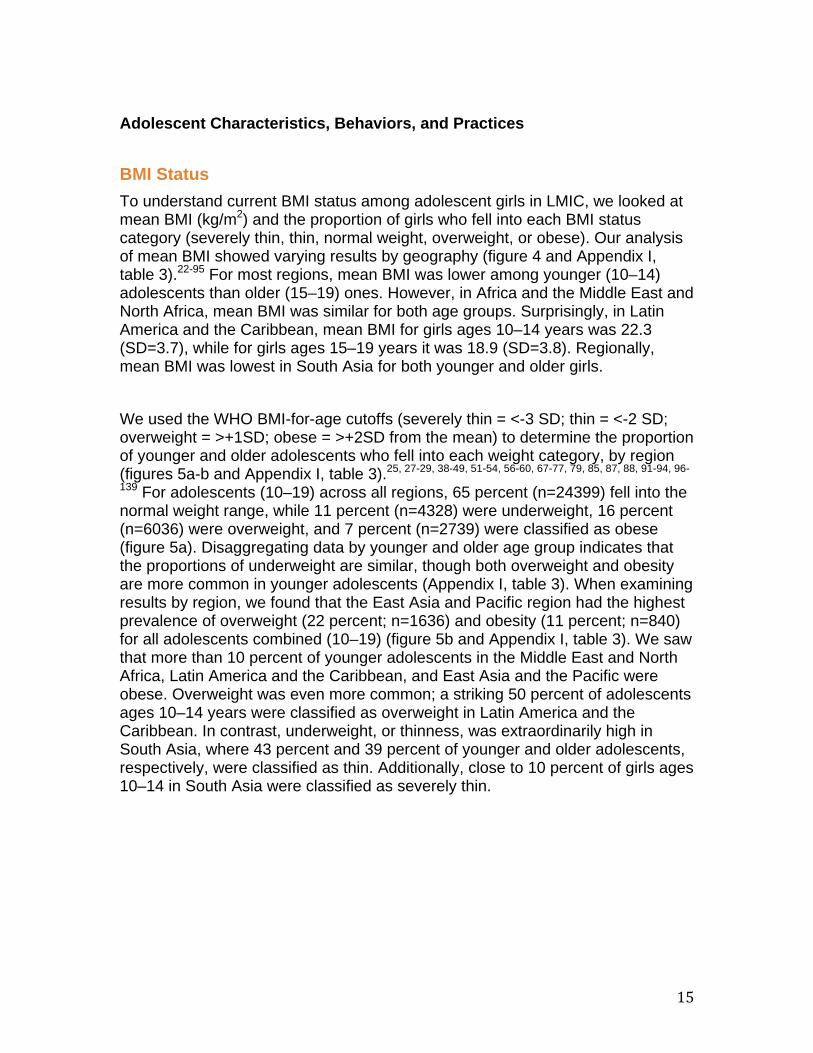
Adolescent Characteristics, Behaviors, and Practices
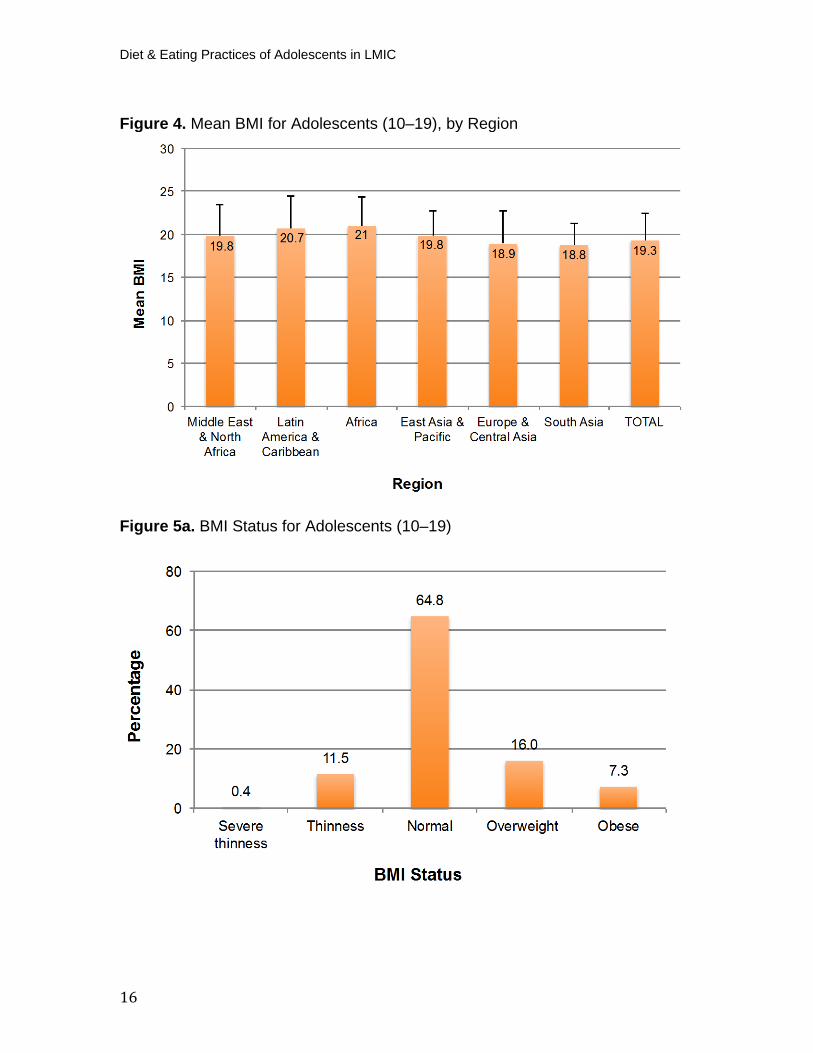
BMI Status To understand current BMI status among adolescent girls in LMIC, we looked at mean BMI (kg/mP
2P) and the proportion of girls who fell into each BMI status
category (severely thin, thin, normal weight, overweight, or obese). Our analysis of mean BMI showed varying results by geography (figure 4 and Appendix I, table 3). P
22-95P For most regions, mean BMI was lower among younger (10–14)
adolescents than older (15–19) ones. However, in Africa and the Middle East and North Africa, mean BMI was similar for both age groups. Surprisingly, in Latin America and the Caribbean, mean BMI for girls ages 10–14 years was 22.3 (SD=3.7), while for girls ages 15–19 years it was 18.9 (SD=3.8). Regionally, mean BMI was lowest in South Asia for both younger and older girls. We used the WHO BMI-for-age cutoffs (severely thin = <-3 SD; thin = <-2 SD; overweight = >+1SD; obese = >+2SD from the mean) to determine the proportion of younger and older adolescents who fell into each weight category, by region (figures 5a-b and Appendix I, table 3).P
25, 27-29, 38-49, 51-54, 56-60, 67-77, 79, 85, 87, 88, 91-94, 96-
139P For adolescents (10–19) across all regions, 65 percent (n=24399) fell into the
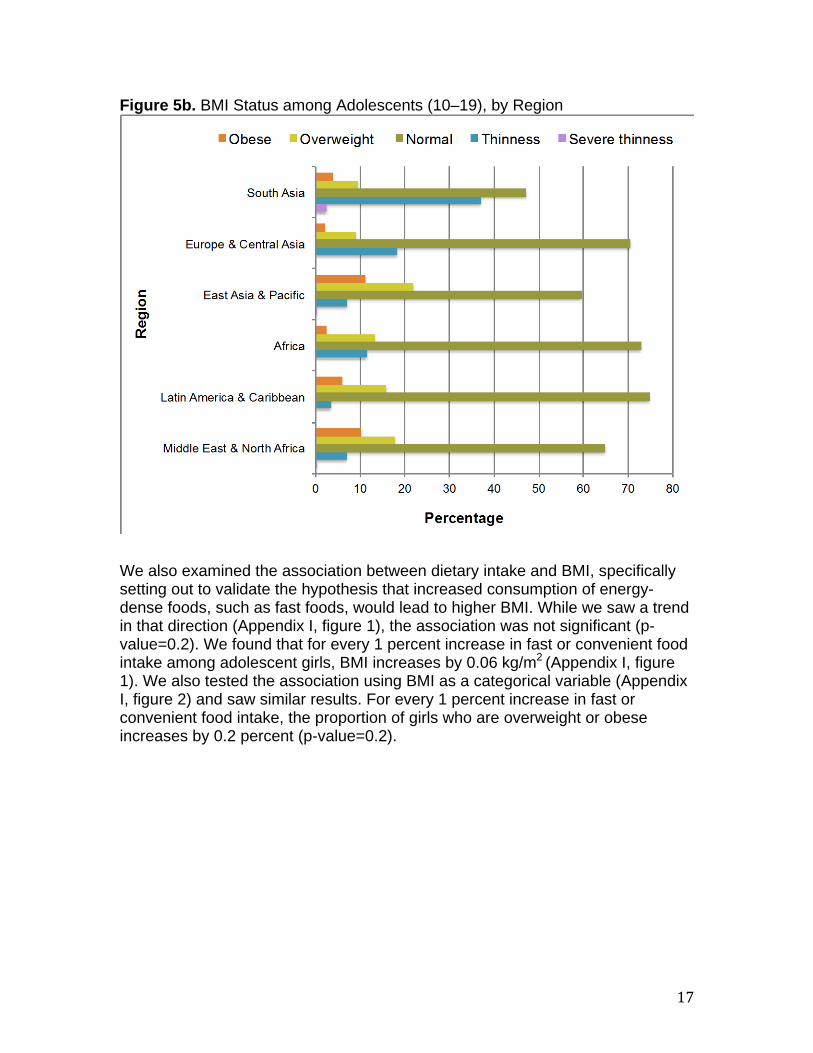
normal weight range, while 11 percent (n=4328) were underweight, 16 percent (n=6036) were overweight, and 7 percent (n=2739) were classified as obese (figure 5a). Disaggregating data by younger and older age group indicates that the proportions of underweight are similar, though both overweight and obesity are more common in younger adolescents (Appendix I, table 3). When examining results by region, we found that the East Asia and Pacific region had the highest prevalence of overweight (22 percent; n=1636) and obesity (11 percent; n=840) for all adolescents combined (10–19) (figure 5b and Appendix I, table 3). We saw that more than 10 percent of younger adolescents in the Middle East and North Africa, Latin America and the Caribbean, and East Asia and the Pacific were obese. Overweight was even more common; a striking 50 percent of adolescents ages 10–14 years were classified as overweight in Latin America and the Caribbean. In contrast, underweight, or thinness, was extraordinarily high in South Asia, where 43 percent and 39 percent of younger and older adolescents, respectively, were classified as thin. Additionally, close to 10 percent of girls ages 10–14 in South Asia were classified as severely thin.
Diet & Eating Practices of Adolescents in LMIC
16
Figure 4. Mean BMI for Adolescents (10–19), by Region
Figure 5a. BMI Status for Adolescents (10–19)
17
Figure 5b. BMI Status among Adolescents (10–19), by Region
We also examined the association between dietary intake and BMI, specifically setting out to validate the hypothesis that increased consumption of energy-dense foods, such as fast foods, would lead to higher BMI. While we saw a trend in that direction (Appendix I, figure 1), the association was not significant (p-value=0.2). We found that for every 1 percent increase in fast or convenient food intake among adolescent girls, BMI increases by 0.06 kg/mP
2 P(Appendix I, figure
1). We also tested the association using BMI as a categorical variable (Appendix I, figure 2) and saw similar results. For every 1 percent increase in fast or convenient food intake, the proportion of girls who are overweight or obese increases by 0.2 percent (p-value=0.2).
Diet & Eating Practices of Adolescents in LMIC
18
Dietary Intake and Eating Practices
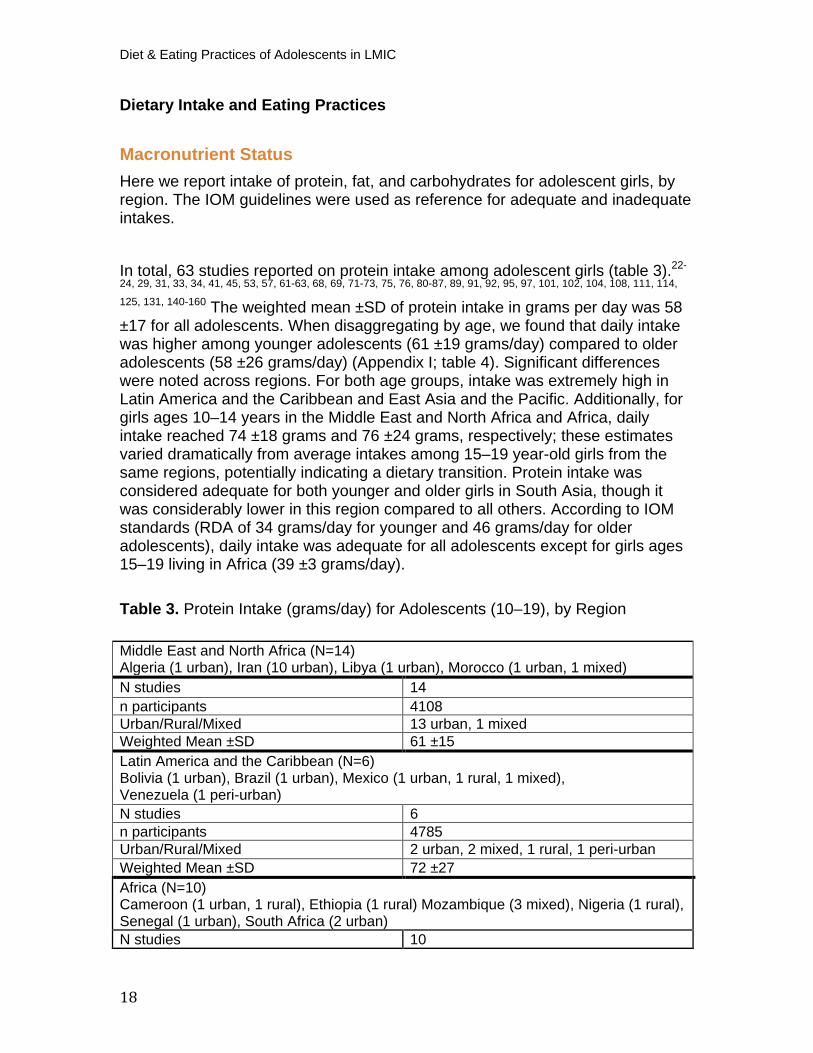
Macronutrient Status Here we report intake of protein, fat, and carbohydrates for adolescent girls, by region. The IOM guidelines were used as reference for adequate and inadequate intakes.
In total, 63 studies reported on protein intake among adolescent girls (table 3).P
22-
24, 29, 31, 33, 34, 41, 45, 53, 57, 61-63, 68, 69, 71-73, 75, 76, 80-87, 89, 91, 92, 95, 97, 101, 102, 104, 108, 111, 114,
125, 131, 140-160P The weighted mean ±SD of protein intake in grams per day was 58
±17 for all adolescents. When disaggregating by age, we found that daily intake was higher among younger adolescents (61 ±19 grams/day) compared to older adolescents (58 ±26 grams/day) (Appendix I; table 4). Significant differences were noted across regions. For both age groups, intake was extremely high in Latin America and the Caribbean and East Asia and the Pacific. Additionally, for girls ages 10–14 years in the Middle East and North Africa and Africa, daily intake reached 74 ±18 grams and 76 ±24 grams, respectively; these estimates varied dramatically from average intakes among 15–19 year-old girls from the same regions, potentially indicating a dietary transition. Protein intake was considered adequate for both younger and older girls in South Asia, though it was considerably lower in this region compared to all others. According to IOM standards (RDA of 34 grams/day for younger and 46 grams/day for older adolescents), daily intake was adequate for all adolescents except for girls ages 15–19 living in Africa (39 ±3 grams/day).
Table 3. Protein Intake (grams/day) for Adolescents (10–19), by Region
Middle East and North Africa (N=14) Algeria (1 urban), Iran (10 urban), Libya (1 urban), Morocco (1 urban, 1 mixed) N studies 14 n participants 4108 Urban/Rural/Mixed 13 urban, 1 mixed Weighted Mean ±SD 61 ±15 Latin America and the Caribbean (N=6)Bolivia (1 urban), Brazil (1 urban), Mexico (1 urban, 1 rural, 1 mixed), Venezuela (1 peri-urban) N studies 6 n participants 4785 Urban/Rural/Mixed 2 urban, 2 mixed, 1 rural, 1 peri-urban Weighted Mean ±SD 72 ±27 Africa (N=10)Cameroon (1 urban, 1 rural), Ethiopia (1 rural) Mozambique (3 mixed), Nigeria (1 rural), Senegal (1 urban), South Africa (2 urban) N studies 10
19
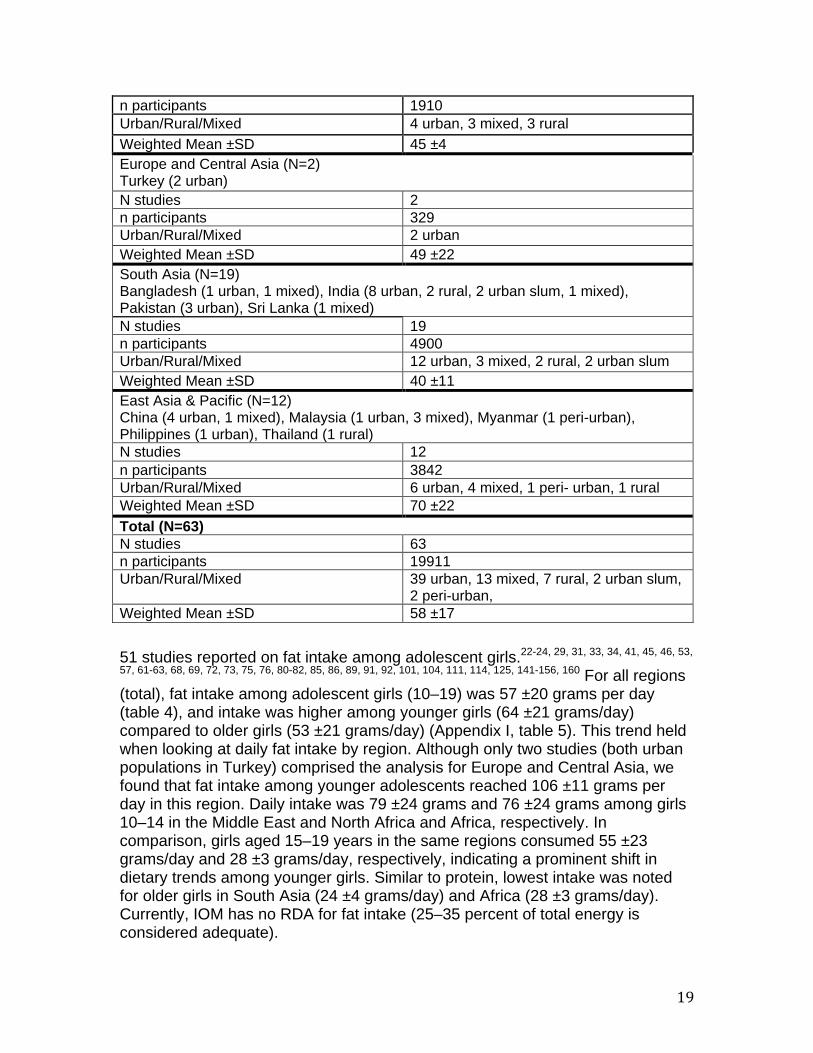
51 studies reported on fat intake among adolescent girls. P
22-24, 29, 31, 33, 34, 41, 45, 46, 53,
57, 61-63, 68, 69, 72, 73, 75, 76, 80-82, 85, 86, 89, 91, 92, 101, 104, 111, 114, 125, 141-156, 160P For all regions
(total), fat intake among adolescent girls (10–19) was 57 ±20 grams per day (table 4), and intake was higher among younger girls (64 ±21 grams/day) compared to older girls (53 ±21 grams/day) (Appendix I, table 5). This trend held when looking at daily fat intake by region. Although only two studies (both urban populations in Turkey) comprised the analysis for Europe and Central Asia, we found that fat intake among younger adolescents reached 106 ±11 grams per day in this region. Daily intake was 79 ±24 grams and 76 ±24 grams among girls 10–14 in the Middle East and North Africa and Africa, respectively. In comparison, girls aged 15–19 years in the same regions consumed 55 ±23 grams/day and 28 ±3 grams/day, respectively, indicating a prominent shift in dietary trends among younger girls. Similar to protein, lowest intake was noted for older girls in South Asia (24 ±4 grams/day) and Africa (28 ±3 grams/day). Currently, IOM has no RDA for fat intake (25–35 percent of total energy is considered adequate).
n participants 1910 Urban/Rural/Mixed 4 urban, 3 mixed, 3 rural Weighted Mean ±SD 45 ±4 Europe and Central Asia (N=2)
Turkey (2 urban) N studies 2 n participants 329 Urban/Rural/Mixed 2 urban Weighted Mean ±SD 49 ±22 South Asia (N=19)
Bangladesh (1 urban, 1 mixed), India (8 urban, 2 rural, 2 urban slum, 1 mixed), Pakistan (3 urban), Sri Lanka (1 mixed) N studies 19 n participants 4900 Urban/Rural/Mixed 12 urban, 3 mixed, 2 rural, 2 urban slum Weighted Mean ±SD 40 ±11 East Asia & Pacific (N=12) China (4 urban, 1 mixed), Malaysia (1 urban, 3 mixed), Myanmar (1 peri-urban), Philippines (1 urban), Thailand (1 rural) N studies 12 n participants 3842 Urban/Rural/Mixed 6 urban, 4 mixed, 1 peri- urban, 1 rural Weighted Mean ±SD 70 ±22 Total (N=63) N studies 63 n participants 19911 Urban/Rural/Mixed 39 urban, 13 mixed, 7 rural, 2 urban slum,
2 peri-urban, Weighted Mean ±SD 58 ±17
Diet & Eating Practices of Adolescents in LMIC
20
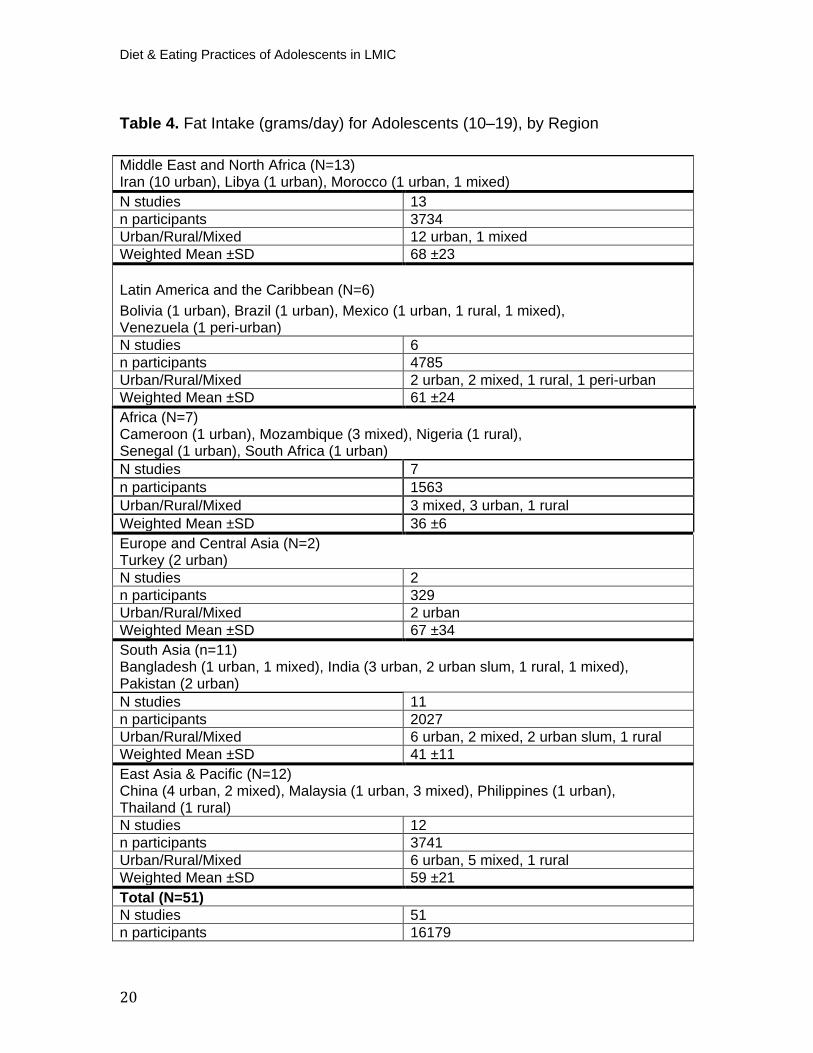
Table 4. Fat Intake (grams/day) for Adolescents (10–19), by Region
Middle East and North Africa (N=13) Iran (10 urban), Libya (1 urban), Morocco (1 urban, 1 mixed) N studies 13 n participants 3734 Urban/Rural/Mixed 12 urban, 1 mixed Weighted Mean ±SD 68 ±23
Latin America and the Caribbean (N=6)Bolivia (1 urban), Brazil (1 urban), Mexico (1 urban, 1 rural, 1 mixed), Venezuela (1 peri-urban) N studies 6 n participants 4785 Urban/Rural/Mixed 2 urban, 2 mixed, 1 rural, 1 peri-urban Weighted Mean ±SD 61 ±24 Africa (N=7)Cameroon (1 urban), Mozambique (3 mixed), Nigeria (1 rural), Senegal (1 urban), South Africa (1 urban) N studies 7 n participants 1563 Urban/Rural/Mixed 3 mixed, 3 urban, 1 rural Weighted Mean ±SD 36 ±6 Europe and Central Asia (N=2)Turkey (2 urban) N studies 2 n participants 329 Urban/Rural/Mixed 2 urban Weighted Mean ±SD 67 ±34 South Asia (n=11)Bangladesh (1 urban, 1 mixed), India (3 urban, 2 urban slum, 1 rural, 1 mixed), Pakistan (2 urban) N studies 11 n participants 2027 Urban/Rural/Mixed 6 urban, 2 mixed, 2 urban slum, 1 rural Weighted Mean ±SD 41 ±11 East Asia & Pacific (N=12) China (4 urban, 2 mixed), Malaysia (1 urban, 3 mixed), Philippines (1 urban), Thailand (1 rural) N studies 12 n participants 3741 Urban/Rural/Mixed 6 urban, 5 mixed, 1 rural Weighted Mean ±SD 59 ±21 Total (N=51) N studies 51 n participants 16179
21
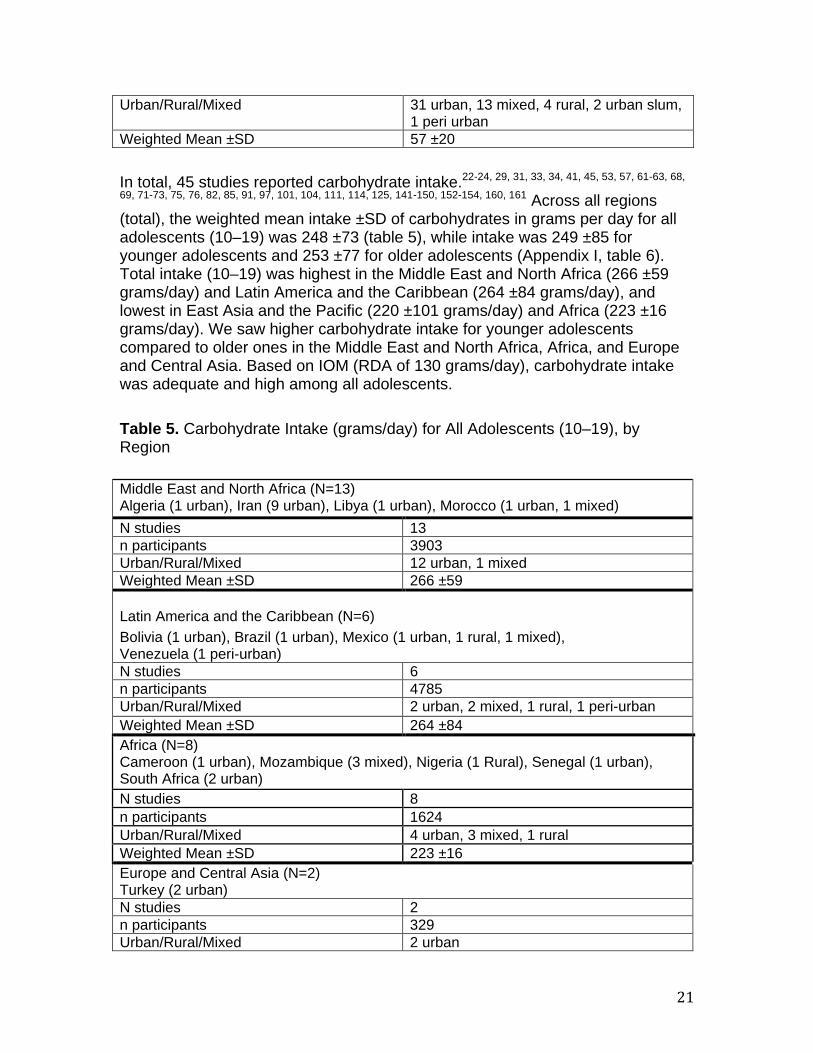
In total, 45 studies reported carbohydrate intake. P
22-24, 29, 31, 33, 34, 41, 45, 53, 57, 61-63, 68,
69, 71-73, 75, 76, 82, 85, 91, 97, 101, 104, 111, 114, 125, 141-150, 152-154, 160, 161P Across all regions
(total), the weighted mean intake ±SD of carbohydrates in grams per day for all adolescents (10–19) was 248 ±73 (table 5), while intake was 249 ±85 for younger adolescents and 253 ±77 for older adolescents (Appendix I, table 6). Total intake (10–19) was highest in the Middle East and North Africa (266 ±59 grams/day) and Latin America and the Caribbean (264 ±84 grams/day), and lowest in East Asia and the Pacific (220 ±101 grams/day) and Africa (223 ±16 grams/day). We saw higher carbohydrate intake for younger adolescents compared to older ones in the Middle East and North Africa, Africa, and Europe and Central Asia. Based on IOM (RDA of 130 grams/day), carbohydrate intake was adequate and high among all adolescents. Table 5. Carbohydrate Intake (grams/day) for All Adolescents (10–19), by Region
Urban/Rural/Mixed 31 urban, 13 mixed, 4 rural, 2 urban slum, 1 peri urban
Weighted Mean ±SD 57 ±20
Middle East and North Africa (N=13) Algeria (1 urban), Iran (9 urban), Libya (1 urban), Morocco (1 urban, 1 mixed) N studies 13 n participants 3903 Urban/Rural/Mixed 12 urban, 1 mixed Weighted Mean ±SD 266 ±59
Latin America and the Caribbean (N=6)
Bolivia (1 urban), Brazil (1 urban), Mexico (1 urban, 1 rural, 1 mixed), Venezuela (1 peri-urban) N studies 6 n participants 4785 Urban/Rural/Mixed 2 urban, 2 mixed, 1 rural, 1 peri-urban Weighted Mean ±SD 264 ±84 Africa (N=8)
Cameroon (1 urban), Mozambique (3 mixed), Nigeria (1 Rural), Senegal (1 urban), South Africa (2 urban) N studies 8 n participants 1624 Urban/Rural/Mixed 4 urban, 3 mixed, 1 rural Weighted Mean ±SD 223 ±16 Europe and Central Asia (N=2)
Turkey (2 urban) N studies 2 n participants 329 Urban/Rural/Mixed 2 urban
Diet & Eating Practices of Adolescents in LMIC
22
Energy Intake Seventy-seven studies reported on energy intake among adolescent girls (table 6).P
22-24, 29, 31-34, 36, 40, 41, 45, 46, 48, 53, 56, 57, 60-63, 68, 69, 71-73, 75, 76, 80-89, 91, 95, 97, 101, 102, 104,
108, 111, 112, 114, 120, 125, 131, 140, 142-157, 159-167P Energy intake for all adolescents was
1809 ±507 kcal/day In line with our protein and fat analysis, we found that calories per day were slightly higher for younger (1844 ±578 kcal/day) than older (1834 ±496) girls across all regions (Appendix I, table 7). Our findings also show that significant regional variations exist. Energy intake for adolescent girls (10–19 years) was lowest in South Asia (1494 ±384 kcal/day) and highest in Latin America and the Caribbean (1989 ±608 kcal/day). In some populations, daily caloric intake of younger girls vastly exceeds that of older girls. For example, in urban populations in the Middle East and North Africa (mostly Iran), kcal/day for younger adolescents was 2276 ±484, while for older adolescents it was 1498 ±434. Similarly, in Africa, mean energy intake was 2248 ±534 kcal/day for girls ages 10–14 compared to 1598 ±315 kcal/day for older girls.
We stratified energy intake by urban and rural residence (table 7) and, although rural regions were underrepresented, we saw some differences emerge between urban and rural areas. Overall, energy intake was lowest for urban slum populations (1512 kcal/day; n=292), though only two studies from India comprised this analysis. Rural populations had lower mean intakes than urban (1614 kcal/day versus 1908 kcal/day), a finding that was reflected in each regional analysis except for East Asia and the Pacific. Across all regions, the lowest energy intake was for rural populations in South Asia (1420 kcal/day;
Weighted Mean ±SD 231 ±86 South Asia (N=4) Bangladesh (1 urban, 1 mixed), India (1 urban), Pakistan (1 urban) N studies 4 n participants 1064 Urban/Rural/Mixed 3 urban, 1 mixed Weighted Mean ±SD 247 ±49 East Asia & Pacific (N=12) China (4 urban, 2 mixed), Malaysia (1 urban, 3 mixed), Philippines (1 urban), Thailand (1 rural) N studies 12 n participants 3901 Urban/Rural/Mixed 6 urban, 5 mixed, 1 rural Weighted Mean ±SD 220 ±101 Total (N=45) N studies 45 n participants 15643 Urban/Rural/Mixed 29 urban, 12 mixed, 3 rural, 1 peri urban Weighted Mean ±SD 248 ±73
23
n=1044) while the highest energy intake was for urban populations of Latin America and the Caribbean (2226 kcal/day; n=1624). Table 6. Energy Intake (kcal/day) for Adolescents (10–19), by Region
Middle East and North Africa (N=15) Algeria (1 urban), Iran (11 urban), Libya (1 urban) Morocco (1 urban, 1 mixed) N studies 15 n participants 4349 Urban/Rural/Mixed 14 urban, 1 mixed Weighted Mean ±SD 1905.5 ±422.8
Latin America and the Caribbean (N=10) Bolivia (1 urban), Brazil (3 urban, 1 mixed), Mexico (1 urban, 1 rural, 1 mixed, 1 NR), Venezuela (1 peri-urban) N studies 10 n participants 5513 Urban/Rural/Mixed 5 urban, 2 mixed, 1 rural, 1 peri-urban, 1
NR Weighted Mean ±SD 1987.4 ±527.0 Africa (N=11)
Cameroon (1 urban, 1 rural), Ethiopia (1 rural), Mozambique (3 mixed), Nigeria (2 rural), South Africa (3 urban) N studies 11 n participants 1881 Urban/Rural/Mixed 4 urban, 4 rural, 3 mixed Weighted Mean ±SD 1585.4 ±297.9 Europe and Central Asia (N=2)
Turkey (2 urban) N studies 2 n participants 323 Urban/Rural/Mixed 2 urban Weighted Mean ±SD 1763.2 ±775.1 South Asia (N=19)
Bangladesh (1 urban, 1 mixed), India (7 urban, 3 rural, 1 mixed, 2 urban slum), Pakistan (2 urban), Sri Lanka (1 mixed, 1 NR) N studies 19 n participants 4748 Urban/Rural/Mixed 10 urban, 4 rural, 2 mixed, 2 urban slum,
1 NR Weighted Mean ±SD 1526.4 ±380.9 East Asia & Pacific (N=20) Cambodia (1 urban), China (7 urban, 4 mixed), Malaysia (3 mixed, 1 urban, 1 rural), Myanmar (1 peri-urban), Philippines (1 urban), Thailand (1 rural) N studies 20 n participants 7798
Diet & Eating Practices of Adolescents in LMIC
24
Table 7. Energy Intake (kcal/day) for Adolescents (10–19) by Urban/Rural Residence
Urban Urban slum Peri-urban Rural Mixed Middle East and North Africa (N=15) Algeria (1 urban), Iran (11 urban), Libya (1 urban) Morocco (1 urban, 1 mixed) N studies 14 0 0 0 1 n participants 4157 0 0 0 192 Weighted Mean ±SD
1905 ±421 N/A N/A N/A 1918 ±471
Latin America and the Caribbean (N=10) P
1*
Bolivia (1 urban), Brazil (3 urban, 1 mixed), Mexico (1 urban, 1 rural, 1 mixed, 1 NR), Venezuela (1 peri-urban) N studies 6 0 1 2 1 n participants 1624 0 63 363 3377 Weighted Mean ±SD
2226 ±467 N/A 2353 ±1004
1980 ±46 1884 ±609
Africa (N=11)Cameroon (1 urban, 1 rural), Ethiopia (1 rural), Mozambique (3 mixed), Nigeria (2 rural), South Africa (3 urban) N studies 4 0 0 4 3 n participants 460 0 0 463 958 Weighted Mean ±SD
2004 ±446 N/A N/A 1738 ±451 1311 ±153
Europe and Central Asia (N=2)Turkey (2 urban) N studies 2 0 0 0 0 n participants 323 0 0 0 0 Weighted Mean ±SD
1763 ±775 N/A N/A N/A N/A
South Asia (N=19) P
1
Bangladesh (1 urban, 1 mixed), India (7 urban, 3 rural, 2 urban slum, 1 mixed), Pakistan (2 urban), Sri Lanka (1 mixed, 1 NR) N studies 12 2 0 5 1 n participants 2953 292 0 1044 259 Weighted Mean ±SD
1522 ±428 1512 ±404 N/A 1420 ±230 1589 ±432
East Asia & Pacific (N=20) Cambodia (1 urban), China (7 urban, 4 mixed), Malaysia (3 mixed, 1 urban, 1 rural),
Urban/Rural/Mixed 10 urban, 7 mixed, 2 rural, 1 peri-urban Weighted Mean ±SD 1880.3 ±597.0 Total (N=77) N studies 78 n participants 24785 Urban/Rural/Mixed 47 urban, 15 mixed, 11 rural, 2 peri-urban,
1 NR, 1 urban slum Weighted Mean ±SD 1809.1 ±506.7
25
Myanmar (1 peri-urban), Philippines (1 urban), Thailand (1 rural) N studies 10 0 1 2 7 n participants 4765 0 391 189 2453 Weighted Mean ±SD
1988 ±494
N/A 1778 ±83 2016 ±507
1676 ±885
Total (N=78) P
2
N studies 45 2 2 12 15 n participants 13371 292 454 1911 6734 Weighted Mean ±SD
1908 ±468 1512 ±404 1858 ±211 1614 ±349 1683 ±579
P
1POne study excluded from analysis, as urban/rural was not reported
P
2PTwo studies in total were excluded
P
*POne study stratifies data by urban and rural residence
Dietary Intake of All Food Groups Note: Consumption data was summarized into one table per food group. Within each table, consumption is broken down by mean general consumption (for all studies) and frequency of consumption (for the subset of studies that reported frequency data). Note: These results are not regionally representative. They are representative only of the populations captured within each analysis. Intake of Grains, Roots, Tubers and Plantains (Grains) This food group is otherwise referred to as “starchy staples” and is largely comprised of foods derived from cereal crops. These foods provide energy and can be a good source of B vitamins, depending on the grain. P
16P Common
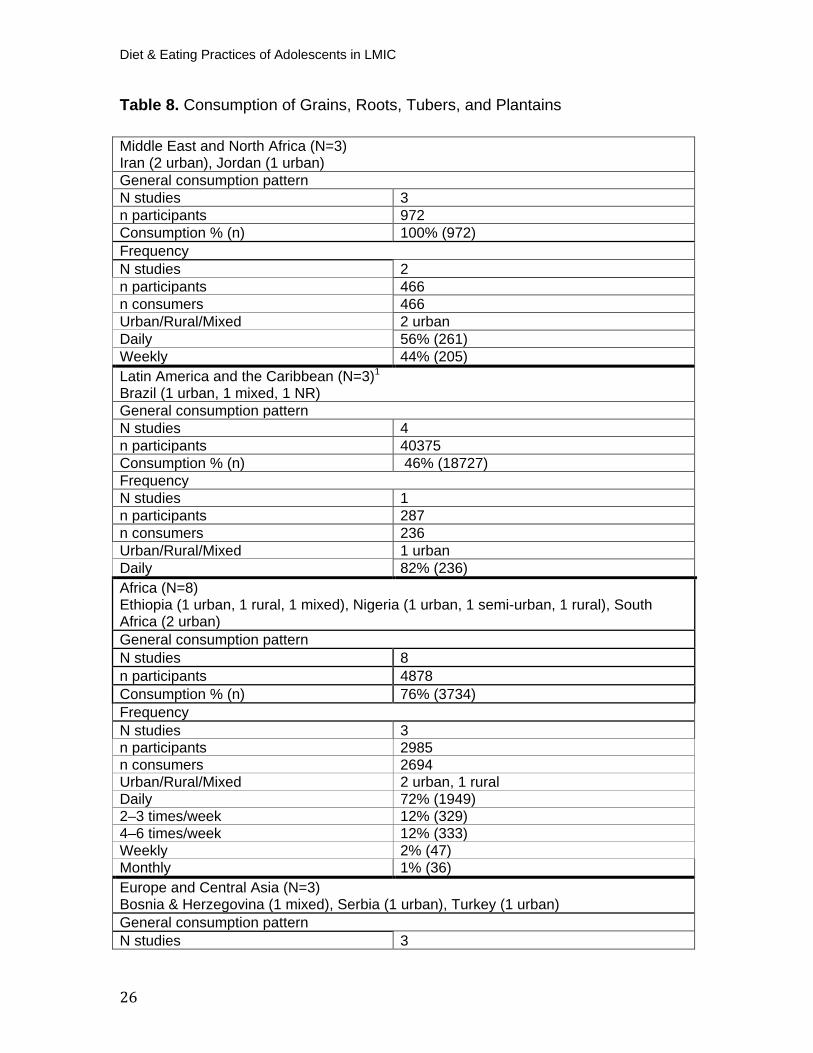
examples include staple products, such as bread, porridge, noodles, rice, and potatoes. Plantains (a fruit) are included in this group because of their similar nutrient composition to starchy staples. However, items such as biscuits, cakes, and other nutrient-poor, sugary starches are not. In total, 31 studies (n=53066) reported on grain consumption (table 8).P
40, 48, 52, 79, 80,
90, 97, 99, 102, 103, 106, 116, 132, 133, 151, 154, 168-182P We found that the mean general
consumption for all adolescent girls (10–19) was 51 percent (n=27277). According to the studies that reported frequency data, 76 percent (n=4397) of adolescents consumed grains daily. Across all regions (total), general consumption was similar for younger (10–14) and older (15–19) adolescents (Appendix I, table 8). However, of adolescent girls who consumed grains, younger ones are more likely to consume them daily (81 percent; n=1879 versus 71 percent; n=2282). This result was largely derived from studies in Africa, where consumption among younger girls was significantly higher than in older girls. Frequency data by region and by age was too sparse to draw any additional conclusions. We found significant regional variation in grain consumption. In the Middle East and North Africa, 100 percent (n=972) of adolescents (10–19) consumed grains; however, this regional analysis was comprised only of three studies, two of which were from Iran and all of which were from urban populations. High consumption was also noted for Africa (76 percent; n=3734) and South Asia (75 percent; n=1795).
Diet & Eating Practices of Adolescents in LMIC
26
Table 8. Consumption of Grains, Roots, Tubers, and Plantains
Middle East and North Africa (N=3) Iran (2 urban), Jordan (1 urban) General consumption pattern N studies 3 n participants 972 Consumption % (n) 100% (972) Frequency N studies 2 n participants 466 n consumers 466 Urban/Rural/Mixed 2 urban Daily 56% (261) Weekly 44% (205) Latin America and the Caribbean (N=3) P
1
Brazil (1 urban, 1 mixed, 1 NR) General consumption pattern N studies 4 n participants 40375 Consumption % (n) 46% (18727) Frequency N studies 1 n participants 287 n consumers 236 Urban/Rural/Mixed 1 urban Daily 82% (236) Africa (N=8)Ethiopia (1 urban, 1 rural, 1 mixed), Nigeria (1 urban, 1 semi-urban, 1 rural), South Africa (2 urban) General consumption pattern N studies 8 n participants 4878 Consumption % (n) 76% (3734) Frequency N studies 3 n participants 2985 n consumers 2694 Urban/Rural/Mixed 2 urban, 1 rural Daily 72% (1949) 2–3 times/week 12% (329) 4–6 times/week 12% (333) Weekly 2% (47) Monthly 1% (36) Europe and Central Asia (N=3) Bosnia & Herzegovina (1 mixed), Serbia (1 urban), Turkey (1 urban) General consumption pattern N studies 3
27
n participants 1142 Consumption % (n) 28% (326) Frequency N studies NR South Asia (N=9) Bangladesh (1 urban, 1 mixed), India (6 urban), Sri Lanka (1 rural) General consumption pattern N studies 9 n participants 2384 Consumption % (n) 75% (1795) Frequency N studies 6 n participants 1720 n consumers 924 Urban/Rural/Mixed 5 urban, 1 mixed Daily 63% (765) 2–3 times/week 14% (235) 4–6 times/week 10% (173) Weekly 3% (33) East Asia & Pacific (N=5) China (1 urban, 1 rural), Malaysia (1 urban, 2 mixed) General consumption pattern N studies 5 n participants 3315 Consumption % (n) 52% (1723) Frequency N studies 1 n participants 1186 n consumers 1186 Urban/Rural/Mixed 1 urban Daily 100% (1186) Total (N=31) General consumption pattern N studies 31 n participants 53066 Consumption % (n) 51% (27277) Frequency N studies 13 n participants 6644 n consumers 5506 Urban/Rural/Mixed 11 urban, 1 rural, 1 mixed Daily 76% (4397) 2–3 times/week 10% (564) 4–6 times/week 10% (506) Weekly 5% (285) Monthly 1% (36)
Diet & Eating Practices of Adolescents in LMIC
28
Intake of Pulses
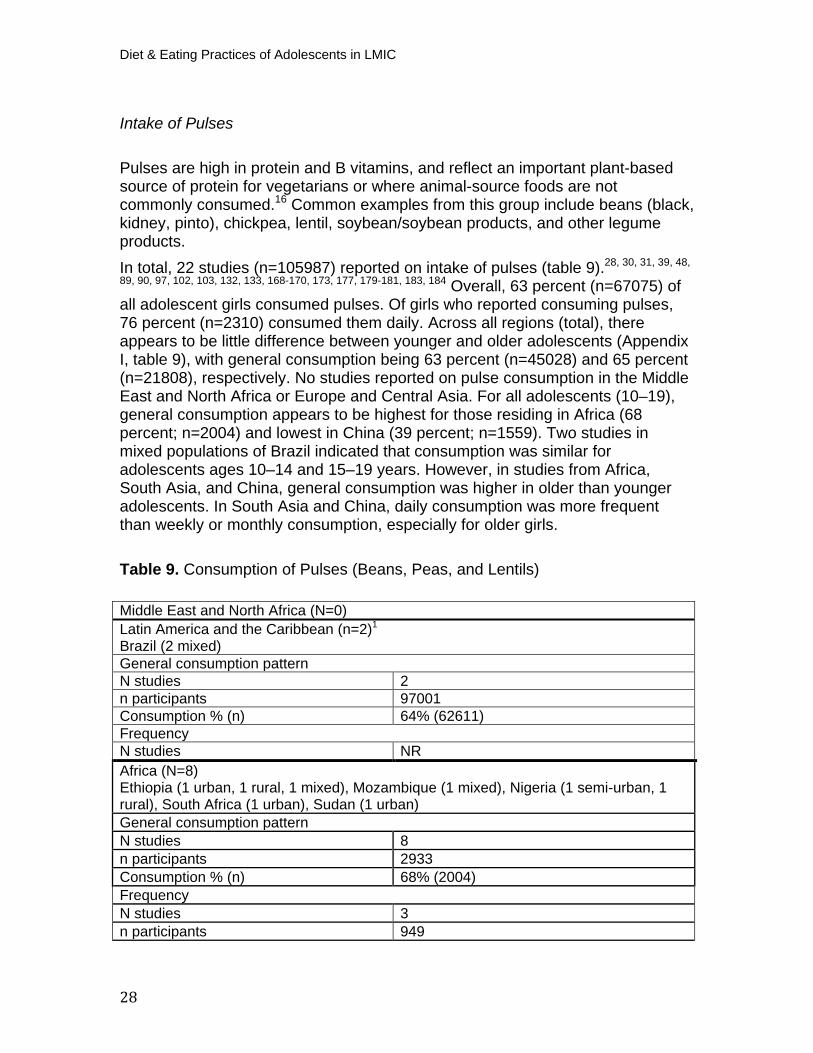
Pulses are high in protein and B vitamins, and reflect an important plant-based source of protein for vegetarians or where animal-source foods are not commonly consumed. P
16P Common examples from this group include beans (black,
kidney, pinto), chickpea, lentil, soybean/soybean products, and other legume products. In total, 22 studies (n=105987) reported on intake of pulses (table 9).P
28, 30, 31, 39, 48,
89, 90, 97, 102, 103, 132, 133, 168-170, 173, 177, 179-181, 183, 184P Overall, 63 percent (n=67075) of
all adolescent girls consumed pulses. Of girls who reported consuming pulses, 76 percent (n=2310) consumed them daily. Across all regions (total), there appears to be little difference between younger and older adolescents (Appendix I, table 9), with general consumption being 63 percent (n=45028) and 65 percent (n=21808), respectively. No studies reported on pulse consumption in the Middle East and North Africa or Europe and Central Asia. For all adolescents (10–19), general consumption appears to be highest for those residing in Africa (68 percent; n=2004) and lowest in China (39 percent; n=1559). Two studies in mixed populations of Brazil indicated that consumption was similar for adolescents ages 10–14 and 15–19 years. However, in studies from Africa, South Asia, and China, general consumption was higher in older than younger adolescents. In South Asia and China, daily consumption was more frequent than weekly or monthly consumption, especially for older girls.
Table 9. Consumption of Pulses (Beans, Peas, and Lentils)
Middle East and North Africa (N=0) Latin America and the Caribbean (n=2) P
1
Brazil (2 mixed) General consumption pattern N studies 2 n participants 97001 Consumption % (n) 64% (62611) Frequency N studies NR Africa (N=8)Ethiopia (1 urban, 1 rural, 1 mixed), Mozambique (1 mixed), Nigeria (1 semi-urban, 1 rural), South Africa (1 urban), Sudan (1 urban) General consumption pattern N studies 8 n participants 2933 Consumption % (n) 68% (2004) Frequency N studies 3 n participants 949
29
n consumers 864 Urban/Rural/Mixed 2 urban, 1 rural Daily 36% (312) Weekly 32% (280) Monthly 31% (272) Europe and Central Asia (N=0) South Asia (N=7) Bangladesh (1 urban), India (5 urban), Sri Lanka (1 rural) General consumption pattern N studies 7 n participants 2090 Consumption % (n) 43% (901) Frequency N studies 6 n participants 2030 n consumers 849 Urban/Rural/Mixed 5 urban, 1 rural Daily 84% (718) 2–3 times/week 13% (110) Weekly 2% (21) East Asia & Pacific (N=5) China (4 urban, 1 rural) General consumption pattern N studies 5 n participants 3963 Consumption % (n) 39% (1559) Frequency N studies 2 n participants 2155 n consumers 1328 Urban/Rural/Mixed 2 urban Daily 96% (1280) Weekly 3% (36) Monthly 0.9% (12) Total (N=22) General consumption pattern N studies 22 n participants 105987 Consumption % (n) 63% (67075) Frequency N studies 10 n participants 5134 n consumers 3041 Urban/Rural/Mixed 9 urban, 1 rural Daily 76% (2310) 2–3 times/week 4% (110) Weekly 11% (337) Monthly 9% (284)
Diet & Eating Practices of Adolescents in LMIC
30
Intake of Nuts and Seeds The nuts and seeds group includes tree nuts, groundnut (peanut), and seeds when they are consumed in substantial quantities (i.e., they comprise one of the main ingredients of a meal or a snack). Nut and seed “butters,” such as peanut butter, cashew paste, and tahini, are also included in this group. Nuts and certain seeds typically have a high fat content. They are also rich in vegetable protein, fiber, and minerals. P
16P Common examples of tree nuts include almonds, walnuts,
cashews, and Brazil nuts. Common examples of seeds include sesame, sunflower, and pine nuts. Only four studies reported on intake of nuts and seeds. P
28, 171, 182, 185P Two studies
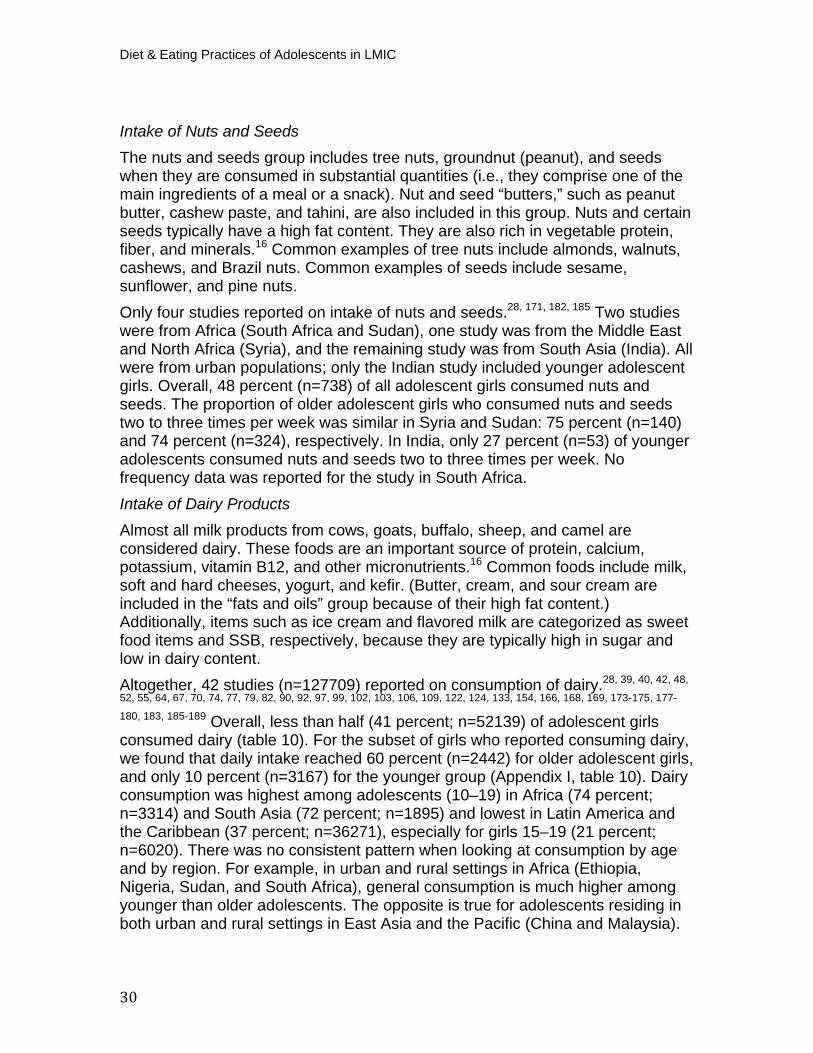
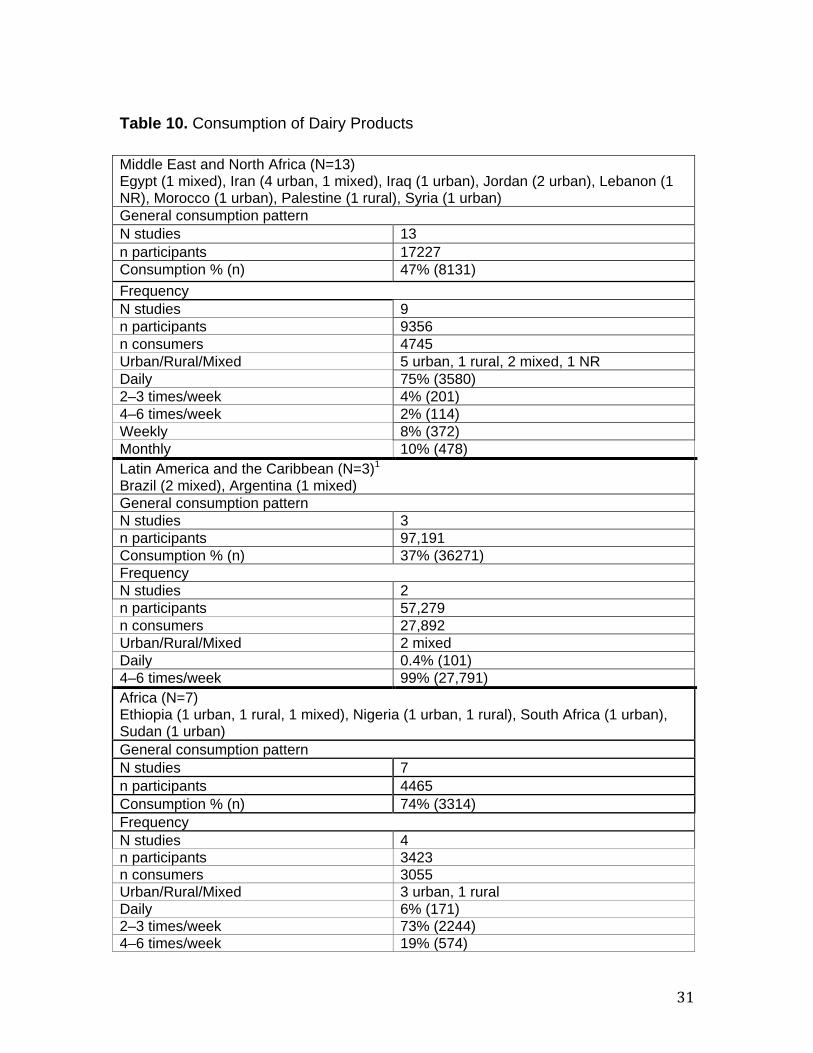
were from Africa (South Africa and Sudan), one study was from the Middle East and North Africa (Syria), and the remaining study was from South Asia (India). All were from urban populations; only the Indian study included younger adolescent girls. Overall, 48 percent (n=738) of all adolescent girls consumed nuts and seeds. The proportion of older adolescent girls who consumed nuts and seeds two to three times per week was similar in Syria and Sudan: 75 percent (n=140) and 74 percent (n=324), respectively. In India, only 27 percent (n=53) of younger adolescents consumed nuts and seeds two to three times per week. No frequency data was reported for the study in South Africa. Intake of Dairy Products
Almost all milk products from cows, goats, buffalo, sheep, and camel are considered dairy. These foods are an important source of protein, calcium, potassium, vitamin B12, and other micronutrients. P
16P Common foods include milk,
soft and hard cheeses, yogurt, and kefir. (Butter, cream, and sour cream are included in the “fats and oils” group because of their high fat content.) Additionally, items such as ice cream and flavored milk are categorized as sweet food items and SSB, respectively, because they are typically high in sugar and low in dairy content. Altogether, 42 studies (n=127709) reported on consumption of dairy.P
28, 39, 40, 42, 48,
52, 55, 64, 67, 70, 74, 77, 79, 82, 90, 92, 97, 99, 102, 103, 106, 109, 122, 124, 133, 154, 166, 168, 169, 173-175, 177-
180, 183, 185-189P Overall, less than half (41 percent; n=52139) of adolescent girls
consumed dairy (table 10). For the subset of girls who reported consuming dairy, we found that daily intake reached 60 percent (n=2442) for older adolescent girls, and only 10 percent (n=3167) for the younger group (Appendix I, table 10). Dairy consumption was highest among adolescents (10–19) in Africa (74 percent; n=3314) and South Asia (72 percent; n=1895) and lowest in Latin America and the Caribbean (37 percent; n=36271), especially for girls 15–19 (21 percent; n=6020). There was no consistent pattern when looking at consumption by age and by region. For example, in urban and rural settings in Africa (Ethiopia, Nigeria, Sudan, and South Africa), general consumption is much higher among younger than older adolescents. The opposite is true for adolescents residing in both urban and rural settings in East Asia and the Pacific (China and Malaysia).
31
Table 10. Consumption of Dairy Products
Middle East and North Africa (N=13) Egypt (1 mixed), Iran (4 urban, 1 mixed), Iraq (1 urban), Jordan (2 urban), Lebanon (1 NR), Morocco (1 urban), Palestine (1 rural), Syria (1 urban) General consumption pattern N studies 13 n participants 17227 Consumption % (n) 47% (8131) Frequency N studies 9 n participants 9356 n consumers 4745 Urban/Rural/Mixed 5 urban, 1 rural, 2 mixed, 1 NR Daily 75% (3580) 2–3 times/week 4% (201) 4–6 times/week 2% (114) Weekly 8% (372) Monthly 10% (478) Latin America and the Caribbean (N=3) P
1
Brazil (2 mixed), Argentina (1 mixed) General consumption pattern N studies 3 n participants 97,191 Consumption % (n) 37% (36271) Frequency N studies 2 n participants 57,279 n consumers 27,892 Urban/Rural/Mixed 2 mixed Daily 0.4% (101) 4–6 times/week 99% (27,791) Africa (N=7) Ethiopia (1 urban, 1 rural, 1 mixed), Nigeria (1 urban, 1 rural), South Africa (1 urban), Sudan (1 urban) General consumption pattern N studies 7 n participants 4465 Consumption % (n) 74% (3314) Frequency N studies 4 n participants 3423 n consumers 3055 Urban/Rural/Mixed 3 urban, 1 rural Daily 6% (171) 2–3 times/week 73% (2244) 4–6 times/week 19% (574)
Diet & Eating Practices of Adolescents in LMIC
32
Weekly 1% (30) Monthly 1% (36) Europe and Central Asia (N=3) Bosnia & Herzegovina (1 mixed), Serbia (1 urban), Turkey (1 urban) General consumption pattern N studies 3 n participants 1142 Consumption % (n) 40% (457) Frequency N studies NR South Asia (N=9) Bangladesh (2 urban, 1 mixed), India (3 urban, 1 mixed, 1 NR), Pakistan (1 urban) General consumption pattern N studies 9 n participants 2618 Consumption % (n) 72% (1895) Frequency N studies 8 n participants 2472 n consumers 1483 Urban/Rural/Mixed 6 urban, 2 mixed Daily 71% (1250) 2–3 times/week 20% (355) 4–6 times/week 6% (112) Weekly 3% (48) East Asia & Pacific (N=7) China (3 urban, 2 rural), Malaysia (1 urban, 1 rural) General consumption pattern N studies 7 n participants 5066 Consumption % (n) 41% (2071) Frequency N studies 3 n participants 2733 n consumers 1365 Urban/Rural/Mixed 1 urban, 2 rural Daily 88% (1205) 4–6 times/week 12% (160) Total (N=42) General consumption pattern N studies 42 n participants 127709 Consumption % (n) 41% (52139) Frequency N studies 26 n participants 75,263 n consumers 38,540 Urban/Rural/Mixed 15 urban, 5 rural, 5 mixed, 1 NR

33
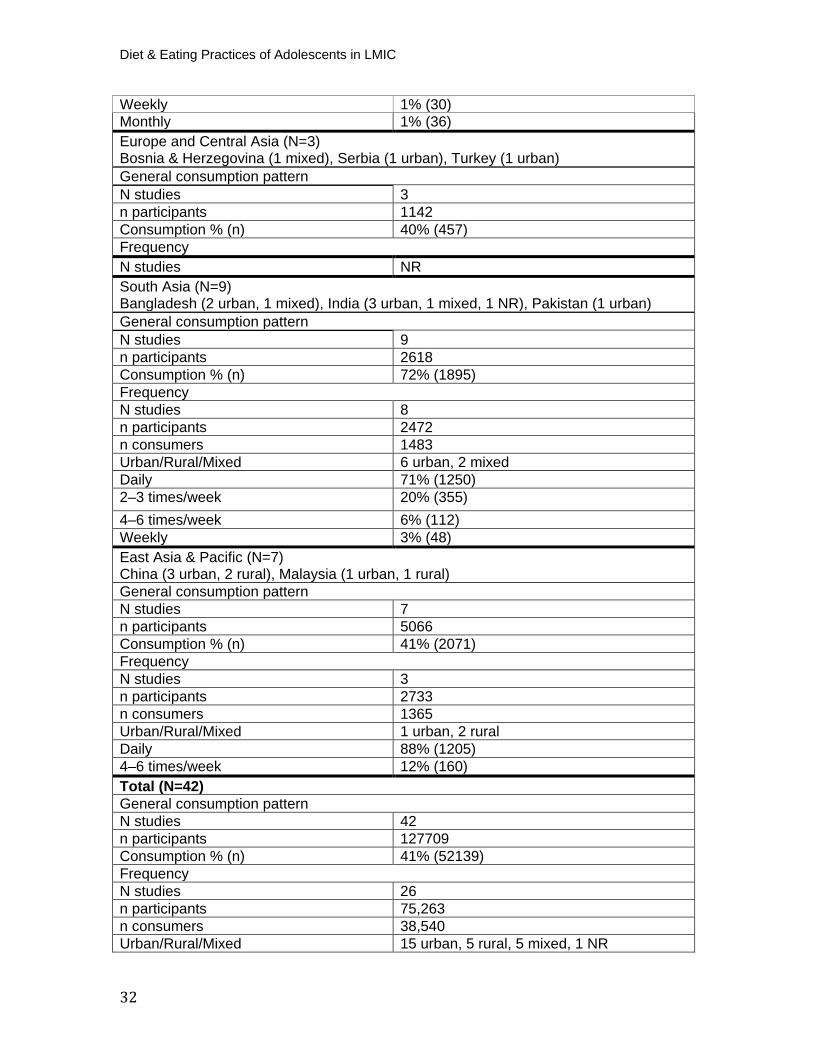
Intake of Meat, Poultry, and Fish Sometimes called “flesh foods,” the meat, poultry, and fish group includes all meats, organ meats, poultry and other birds, fish, seafood/shellfish, other wild birds and mammals (“bush meat”), frogs and other reptiles or amphibians. Flesh foods provide an important source of high quality protein and bioavailable iron, zinc, and vitamin B12. P
16P Consumption of flesh foods tends to vary considerably
by setting; in some instances consumption is too low to fulfill dietary requirements, whereas in other settings it is consumed in excess. P
16P Excessive
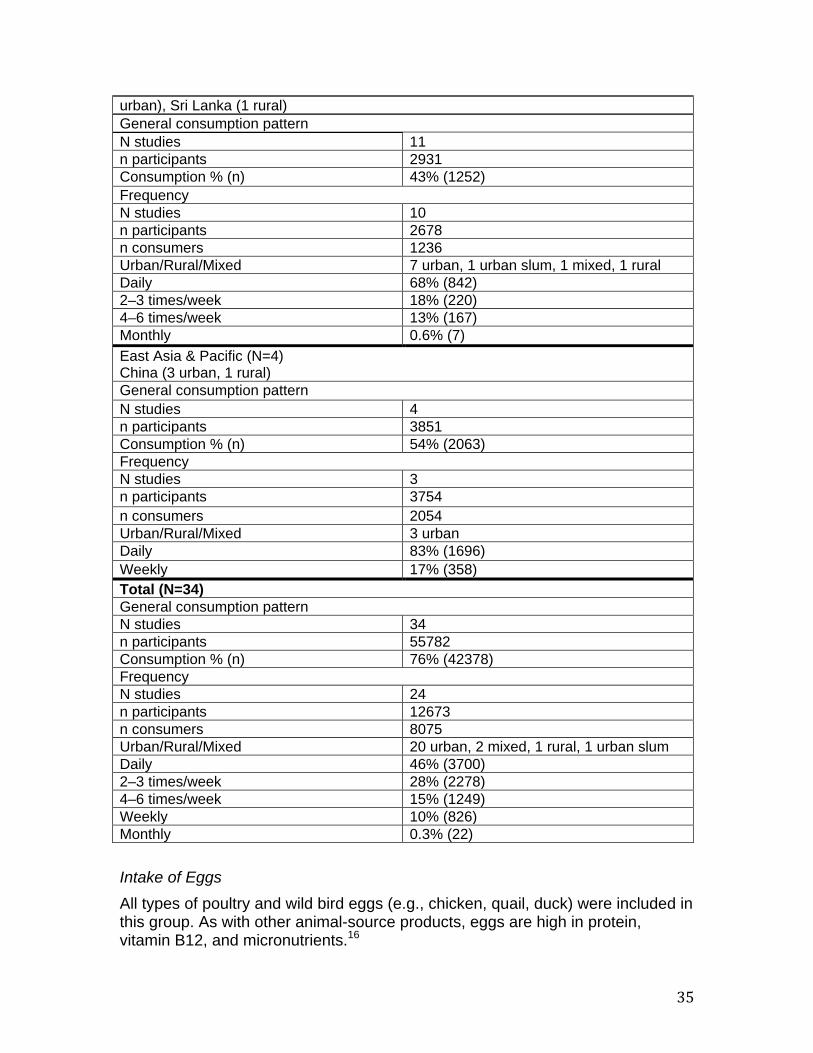
consumption is often linked specifically to red meats and processed/fatty meats. (Many processed/fatty meat items have been captured within the fast food category; e.g., fried chicken, hamburger, hot dog.) Thirty-four studies (n=55782) reported on intake of flesh foods.P
28, 30, 39, 48, 50, 70, 79,
82, 85, 90, 92, 97, 99, 102, 103, 113, 132-134, 154, 168-171, 173-175, 177-180, 184, 185, 190P Overall, 76
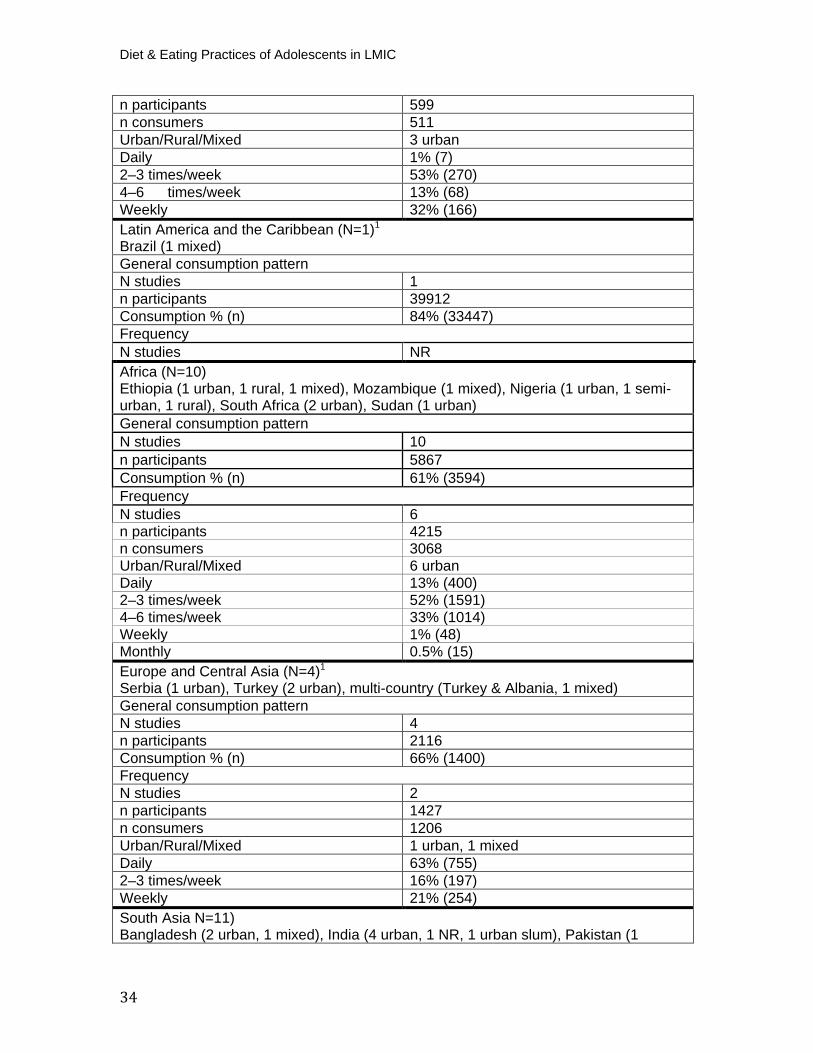
percent (n=42378) of all adolescent girls consumed flesh foods and, of them, 46 percent (n=3700) consumed them daily (table 11). Daily consumption was higher for older adolescents (50 percent; n=1790) than younger adolescents (33 percent; n=1155) across all regions (Appendix I, table 11). For all adolescents (10–19 years), general consumption was highest in Latin America and the Caribbean (84 percent; n=33447), though this region is represented only by one large study in Brazil. Consumption of flesh foods was lowest in South Asia (43 percent, n=1252), indicating that risks for iron deficiencies may be greater in this region. Daily intake was highest for adolescents in Europe and Central Asia (53 percent; n=755) and East Asia and the Pacific (45 percent; n=1696), though there was no comparable frequency data reported for the Brazilian study. Trends by age group were difficult to compare across regions. However, in Africa (which had comparable sample sizes for the 10–14 and 15–19 groups) there was significantly higher consumption of meats, poultry, and fish among younger girls (91 percent; n=2169) than older girls (43 percent; n=1260). Table 11. Consumption of Meat, Poultry, and Fish
Daily 16% (6307) 2–3 times/week 7% (2800) 4–6 times/week 74% (28751) Weekly 1% (450) Monthly 1% (514)
Middle East and North Africa (N=4) Iran (1 urban), Jordan (2 urban), Syria (1 urban) General consumption pattern N studies 4 n participants 1105 Consumption % (n) 56% (622) Frequency N studies 3
Diet & Eating Practices of Adolescents in LMIC
34
n participants 599 n consumers 511 Urban/Rural/Mixed 3 urban Daily 1% (7) 2–3 times/week 53% (270) 4–6 times/week 13% (68) Weekly 32% (166) Latin America and the Caribbean (N=1) P
1
Brazil (1 mixed) General consumption pattern N studies 1 n participants 39912 Consumption % (n) 84% (33447) Frequency N studies NR Africa (N=10)Ethiopia (1 urban, 1 rural, 1 mixed), Mozambique (1 mixed), Nigeria (1 urban, 1 semi-urban, 1 rural), South Africa (2 urban), Sudan (1 urban) General consumption pattern N studies 10 n participants 5867 Consumption % (n) 61% (3594) Frequency N studies 6 n participants 4215 n consumers 3068 Urban/Rural/Mixed 6 urban Daily 13% (400) 2–3 times/week 52% (1591) 4–6 times/week 33% (1014) Weekly 1% (48) Monthly 0.5% (15) Europe and Central Asia (N=4) P
1
Serbia (1 urban), Turkey (2 urban), multi-country (Turkey & Albania, 1 mixed) General consumption pattern N studies 4 n participants 2116 Consumption % (n) 66% (1400) Frequency N studies 2 n participants 1427 n consumers 1206 Urban/Rural/Mixed 1 urban, 1 mixed Daily 63% (755) 2–3 times/week 16% (197) Weekly 21% (254) South Asia N=11) Bangladesh (2 urban, 1 mixed), India (4 urban, 1 NR, 1 urban slum), Pakistan (1
35
Intake of Eggs All types of poultry and wild bird eggs (e.g., chicken, quail, duck) were included in this group. As with other animal-source products, eggs are high in protein, vitamin B12, and micronutrients. P
16P
urban), Sri Lanka (1 rural) General consumption pattern N studies 11 n participants 2931 Consumption % (n) 43% (1252) Frequency N studies 10 n participants 2678 n consumers 1236 Urban/Rural/Mixed 7 urban, 1 urban slum, 1 mixed, 1 rural Daily 68% (842) 2–3 times/week 18% (220) 4–6 times/week 13% (167) Monthly 0.6% (7) East Asia & Pacific (N=4) China (3 urban, 1 rural) General consumption pattern N studies 4 n participants 3851 Consumption % (n) 54% (2063) Frequency N studies 3 n participants 3754 n consumers 2054 Urban/Rural/Mixed 3 urban Daily 83% (1696) Weekly 17% (358) Total (N=34) General consumption pattern N studies 34 n participants 55782 Consumption % (n) 76% (42378) Frequency N studies 24 n participants 12673 n consumers 8075 Urban/Rural/Mixed 20 urban, 2 mixed, 1 rural, 1 urban slum Daily 46% (3700) 2–3 times/week 28% (2278) 4–6 times/week 15% (1249) Weekly 10% (826) Monthly 0.3% (22)
Diet & Eating Practices of Adolescents in LMIC
36
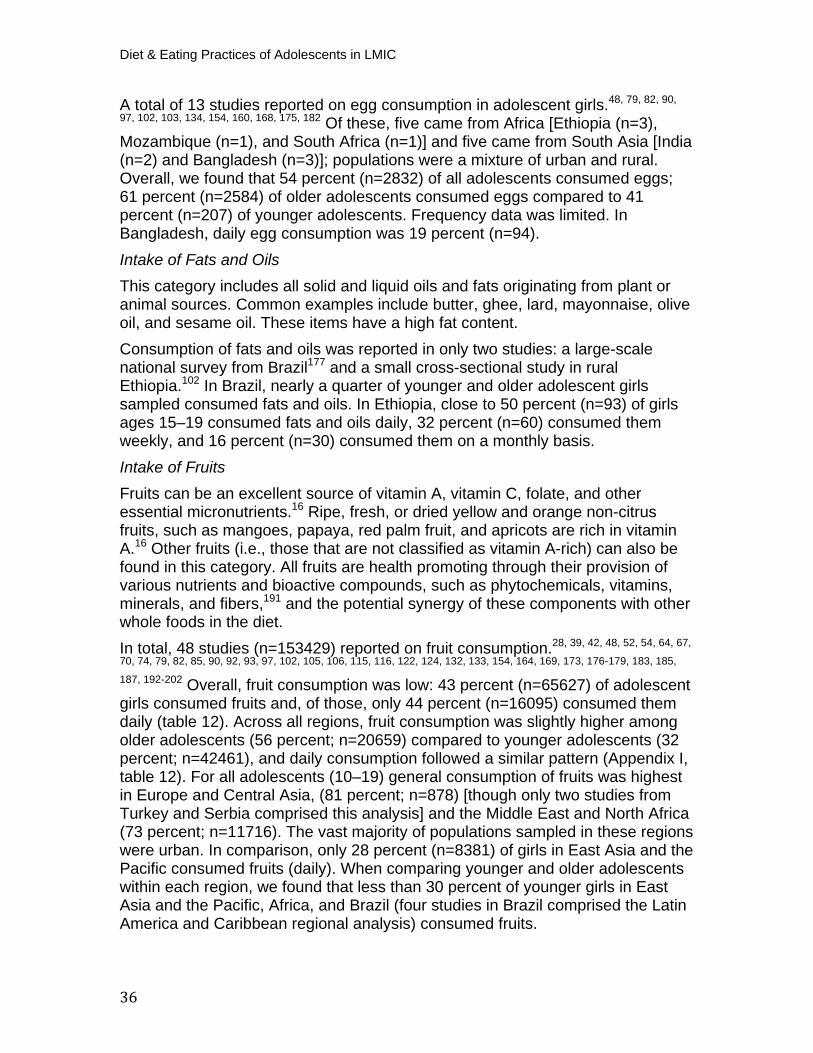
A total of 13 studies reported on egg consumption in adolescent girls. P
48, 79, 82, 90,
97, 102, 103, 134, 154, 160, 168, 175, 182P Of these, five came from Africa [Ethiopia (n=3),
Mozambique (n=1), and South Africa (n=1)] and five came from South Asia [India (n=2) and Bangladesh (n=3)]; populations were a mixture of urban and rural. Overall, we found that 54 percent (n=2832) of all adolescents consumed eggs; 61 percent (n=2584) of older adolescents consumed eggs compared to 41 percent (n=207) of younger adolescents. Frequency data was limited. In Bangladesh, daily egg consumption was 19 percent (n=94). Intake of Fats and Oils This category includes all solid and liquid oils and fats originating from plant or animal sources. Common examples include butter, ghee, lard, mayonnaise, olive oil, and sesame oil. These items have a high fat content. Consumption of fats and oils was reported in only two studies: a large-scale national survey from BrazilP
177P and a small cross-sectional study in rural
Ethiopia. P
102P In Brazil, nearly a quarter of younger and older adolescent girls
sampled consumed fats and oils. In Ethiopia, close to 50 percent (n=93) of girls ages 15–19 consumed fats and oils daily, 32 percent (n=60) consumed them weekly, and 16 percent (n=30) consumed them on a monthly basis. Intake of Fruits Fruits can be an excellent source of vitamin A, vitamin C, folate, and other essential micronutrients. P
16P Ripe, fresh, or dried yellow and orange non-citrus
fruits, such as mangoes, papaya, red palm fruit, and apricots are rich in vitamin A. P
16P Other fruits (i.e., those that are not classified as vitamin A-rich) can also be
found in this category. All fruits are health promoting through their provision of various nutrients and bioactive compounds, such as phytochemicals, vitamins, minerals, and fibers, P
191P and the potential synergy of these components with other
whole foods in the diet. In total, 48 studies (n=153429) reported on fruit consumption. P
28, 39, 42, 48, 52, 54, 64, 67,
70, 74, 79, 82, 85, 90, 92, 93, 97, 102, 105, 106, 115, 116, 122, 124, 132, 133, 154, 164, 169, 173, 176-179, 183, 185,
187, 192-202P Overall, fruit consumption was low: 43 percent (n=65627) of adolescent
girls consumed fruits and, of those, only 44 percent (n=16095) consumed them daily (table 12). Across all regions, fruit consumption was slightly higher among older adolescents (56 percent; n=20659) compared to younger adolescents (32 percent; n=42461), and daily consumption followed a similar pattern (Appendix I, table 12). For all adolescents (10–19) general consumption of fruits was highest in Europe and Central Asia, (81 percent; n=878) [though only two studies from Turkey and Serbia comprised this analysis] and the Middle East and North Africa (73 percent; n=11716). The vast majority of populations sampled in these regions were urban. In comparison, only 28 percent (n=8381) of girls in East Asia and the Pacific consumed fruits (daily). When comparing younger and older adolescents within each region, we found that less than 30 percent of younger girls in East Asia and the Pacific, Africa, and Brazil (four studies in Brazil comprised the Latin America and Caribbean regional analysis) consumed fruits.
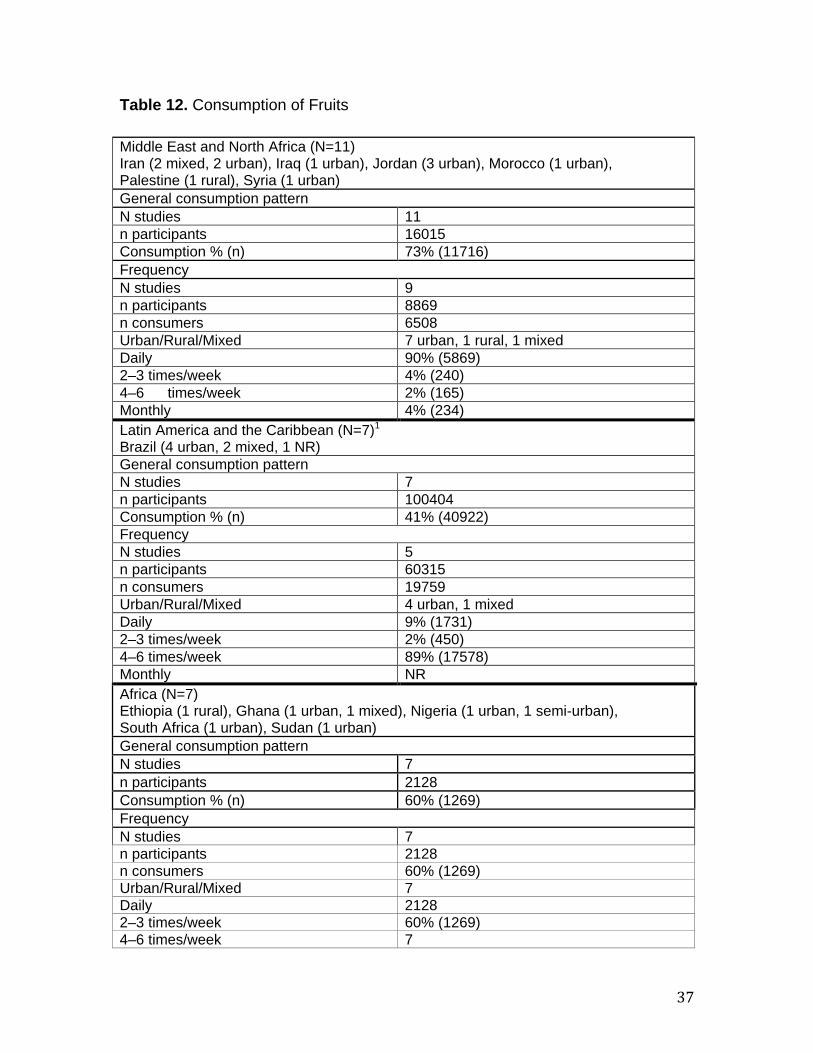
37
Table 12. Consumption of Fruits
Middle East and North Africa (N=11) Iran (2 mixed, 2 urban), Iraq (1 urban), Jordan (3 urban), Morocco (1 urban), Palestine (1 rural), Syria (1 urban) General consumption pattern N studies 11 n participants 16015 Consumption % (n) 73% (11716) Frequency N studies 9 n participants 8869 n consumers 6508 Urban/Rural/Mixed 7 urban, 1 rural, 1 mixed Daily 90% (5869) 2–3 times/week 4% (240) 4–6 times/week 2% (165) Monthly 4% (234) Latin America and the Caribbean (N=7) P
1
Brazil (4 urban, 2 mixed, 1 NR) General consumption pattern N studies 7 n participants 100404 Consumption % (n) 41% (40922) Frequency N studies 5 n participants 60315 n consumers 19759 Urban/Rural/Mixed 4 urban, 1 mixed Daily 9% (1731) 2–3 times/week 2% (450) 4–6 times/week 89% (17578) Monthly NR Africa (N=7)
Ethiopia (1 rural), Ghana (1 urban, 1 mixed), Nigeria (1 urban, 1 semi-urban), South Africa (1 urban), Sudan (1 urban) General consumption pattern N studies 7 n participants 2128 Consumption % (n) 60% (1269) Frequency N studies 7 n participants 2128 n consumers 60% (1269) Urban/Rural/Mixed 7 Daily 2128 2–3 times/week 60% (1269) 4–6 times/week 7
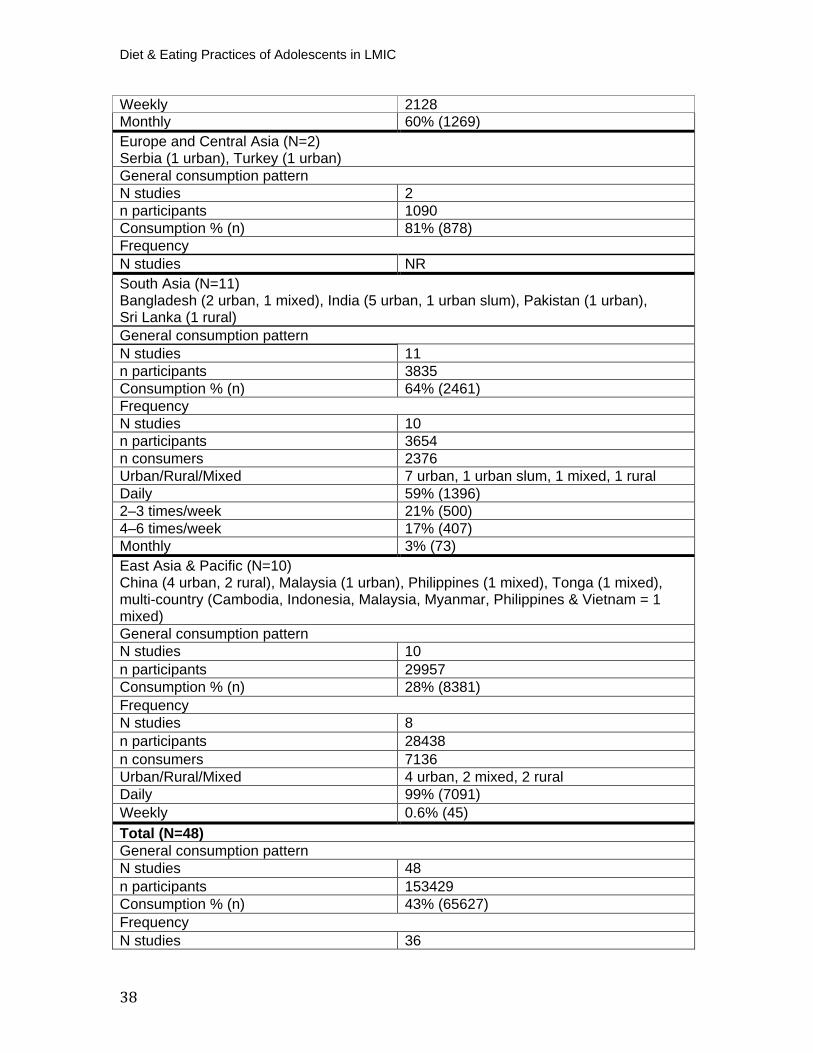
Diet & Eating Practices of Adolescents in LMIC
38
Weekly 2128 Monthly 60% (1269) Europe and Central Asia (N=2)Serbia (1 urban), Turkey (1 urban) General consumption pattern N studies 2 n participants 1090 Consumption % (n) 81% (878) Frequency N studies NR South Asia (N=11) Bangladesh (2 urban, 1 mixed), India (5 urban, 1 urban slum), Pakistan (1 urban), Sri Lanka (1 rural) General consumption pattern N studies 11 n participants 3835 Consumption % (n) 64% (2461) Frequency N studies 10 n participants 3654 n consumers 2376 Urban/Rural/Mixed 7 urban, 1 urban slum, 1 mixed, 1 rural Daily 59% (1396) 2–3 times/week 21% (500) 4–6 times/week 17% (407) Monthly 3% (73) East Asia & Pacific (N=10) China (4 urban, 2 rural), Malaysia (1 urban), Philippines (1 mixed), Tonga (1 mixed), multi-country (Cambodia, Indonesia, Malaysia, Myanmar, Philippines & Vietnam = 1 mixed) General consumption pattern N studies 10 n participants 29957 Consumption % (n) 28% (8381) Frequency N studies 8 n participants 28438 n consumers 7136 Urban/Rural/Mixed 4 urban, 2 mixed, 2 rural Daily 99% (7091) Weekly 0.6% (45) Total (N=48) General consumption pattern N studies 48 n participants 153429 Consumption % (n) 43% (65627) Frequency N studies 36
39
Intake of Vegetables Any medium to dark green leafy vegetable is considered vitamin A-rich.P
16P These
vegetables typically also contain folate and other essential micronutrients. P
16P
Along with leafy greens, other vitamin A-rich vegetables include orange-fleshed sweet potato, carrot, pumpkin, and yellow/orange fleshed squash. High vegetable consumption has been linked to several positive health outcomes, including a reduced risk of cancer at several sites, due to high intake of micronutrients, as well as proanthocyanidins, flavonoids, and fiber.P
191, 203P
Forty-seven studies (n=151407) reported on vegetable consumption in adolescent girls. P
25, 28, 39, 42, 48, 50, 52, 54, 64, 67, 70, 74, 79, 82, 90, 92, 102, 115, 116, 122, 124, 133, 154,
164, 168, 169, 173, 176-180, 182-185, 187, 189, 192, 194, 196, 198-202P As with fruits, vegetable
consumption was low. Half of all adolescents (53 percent; n=80716) consumed vegetables, and only 37 percent (n=15561) consumed them daily (table 13). We found that, among girls who consumed vegetables, daily vegetable consumption was higher among the older girls (53 percent, n=2422 versus 33 percent, n=11557) (Appendix I, table 13). For all adolescents (10–19), consumption was highest in South Asia (80 percent; n=3032) and lowest in East Asia and the Pacific (34 percent, n=9622). There were significant variations in daily vegetable consumption by region: 82 percent (n=3571) of adolescents in the Middle East and North Africa and 72 percent (n=2064) of adolescents in South Asia consumed vegetables daily, while 5 percent (n=40) and 1 percent (n=287) of girls in Africa and Latin America and the Caribbean, respectively, demonstrated daily intake. There was no frequency data reported for Europe and Central Asia. Mean general consumption was higher among older adolescents than the younger group for all regions except Latin America and the Caribbean, where differences were negligible. Table 13. Consumption of Vegetables
n participants 103776 n consumers 36583 Urban/Rural/Mixed 25 urban, 5 rural, 5 mixed, 1 urban slum Daily 44% (16095) 2–3 times/week 4% (1486) 4–6 times/week 50% (18292) Weekly 0.3% (124) Monthly 2% (586)
Middle East and North Africa (N=11) Iran (2 mixed, 2 urban), Iraq (1 urban), Jordan (3 urban), Morocco (1 urban), Palestine (1 rural), Syria (1 urban) General consumption pattern N studies 11 n participants 16015 Consumption % (n) 46% (7436)
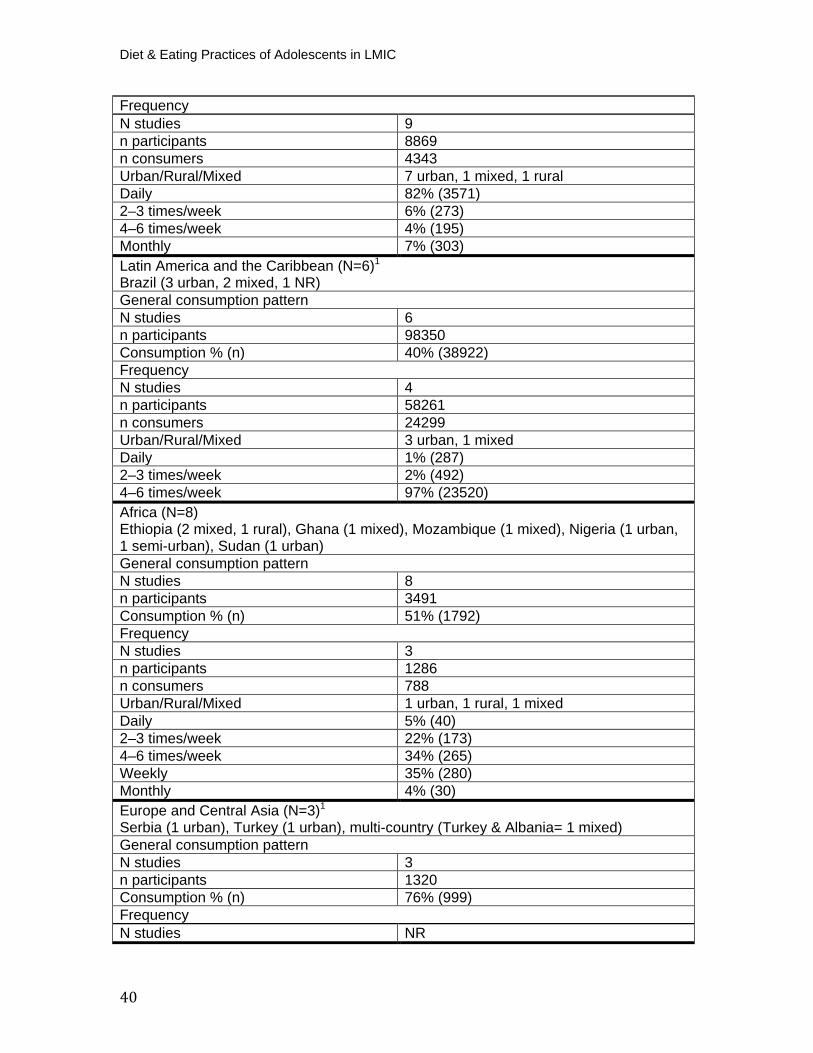
Diet & Eating Practices of Adolescents in LMIC
40
Frequency N studies 9 n participants 8869 n consumers 4343 Urban/Rural/Mixed 7 urban, 1 mixed, 1 rural Daily 82% (3571) 2–3 times/week 6% (273) 4–6 times/week 4% (195) Monthly 7% (303) Latin America and the Caribbean (N=6) P
1
Brazil (3 urban, 2 mixed, 1 NR) General consumption pattern N studies 6 n participants 98350 Consumption % (n) 40% (38922) Frequency N studies 4 n participants 58261 n consumers 24299 Urban/Rural/Mixed 3 urban, 1 mixed Daily 1% (287) 2–3 times/week 2% (492) 4–6 times/week 97% (23520) Africa (N=8)
Ethiopia (2 mixed, 1 rural), Ghana (1 mixed), Mozambique (1 mixed), Nigeria (1 urban, 1 semi-urban), Sudan (1 urban) General consumption pattern N studies 8 n participants 3491 Consumption % (n) 51% (1792) Frequency N studies 3 n participants 1286 n consumers 788 Urban/Rural/Mixed 1 urban, 1 rural, 1 mixed Daily 5% (40) 2–3 times/week 22% (173) 4–6 times/week 34% (265) Weekly 35% (280) Monthly 4% (30) Europe and Central Asia (N=3) P
1
Serbia (1 urban), Turkey (1 urban), multi-country (Turkey & Albania= 1 mixed) General consumption pattern N studies 3 n participants 1320 Consumption % (n) 76% (999) Frequency N studies NR

41
South Asia (N=11) Bangladesh (2 urban, 1 mixed), India (6 urban, 1 mixed), Pakistan (1 urban) General consumption pattern N studies 11 n participants 3793 Consumption % (n) 80% (3032) Frequency N studies 10 n participants 3612 n consumers 2878 Urban/Rural/Mixed 7 urban, 2 mixed, 1 NR Daily 72% (2064) 2–3 times/week 9% (248) 4–6 times/week 17% (495) Weekly 1% (31) Monthly 1% (40) East Asia & Pacific (N=8) China (3 urban, 2 rural), Philippines (1 mixed), Tonga (1 mixed), multi-country (Cambodia, Indonesia, Malaysia, Myanmar, Philippines & Vietnam = 1 mixed) General consumption pattern N studies 8 n participants 28438 Consumption % (n) 34% (9622) Frequency N studies 8 n participants 28535 n consumers 9622 Urban/Rural/Mixed 4 urban, 2 mixed, 2 rural Daily 100% (9599) Weekly 0.2% (23) Total (N=47) General consumption pattern N studies 47 n participants 151407 Consumption % (n) 53% (80716) Frequency N studies 34 n participants 100563 n consumers 41930 Urban/Rural/Mixed 22 urban, 7 mixed, 4 rural Daily 37% (15561) 2–3 times/week 3% (1186) 4–6 times/week 58% (24475) Weekly 0.7% (334) Monthly 0.8% (373)

Diet & Eating Practices of Adolescents in LMIC
42
Adequacy of Fruit and Vegetable Consumption Twenty-five studies were included in our analysis of adequacy. P
25, 31, 33, 37, 48, 52, 54,
58, 60, 69, 85, 89, 97, 105, 116, 143, 159, 164, 166, 192, 194, 197, 201, 204, 205P We determined if
adolescent girls had adequate intake of fruits and vegetables using WHO recommendations of over 400 grams per day (equivalent to two servings of fruit and three servings of vegetables that are 80 grams each). In contrast to the above analyses that used discrete data to determine the proportion of adolescents who consumed fruits and vegetables, studies comprising this analysis must have reported continuous serving size data (i.e., daily intake of fruits or vegetables in grams per day). We found that inadequate intake of both fruits and vegetables is widespread (figure 6). Inadequate fruit intake was highest in South Asia (97 percent; n=850) and lowest in the Middle East and North Africa (32 percent; n=647). It should be noted that all South Asian studies looking at servings of daily fruit took place in India. Inadequate vegetable intake ranged from 48 percent (n=4792) in East Asia and the Pacific to 90 percent (n=14478) in South Asia. The South Asian analysis also comprised a large, multi-country study.
Figure 6. Prevalence of Inadequate Fruit and Vegetable Consumption among Adolescent Girls (10–19)
43
Intake of Condiments and Seasonings Condiments and seasonings are typically added to meals for flavor or garnish. They may be incorporated at any stage of cooking or when serving food, and include items such as salt, herbs, chili peppers, bouillon cubes, and soy sauce. Condiments and seasonings are generally consumed in very small quantities. However, they are included in FANTA’s food groups for methodological reasons, because studies have shown that exclusion of these small quantity items falsely inflates a woman’s dietary diversity (by strengthening the association between micronutrient adequacy and improved dietary diversity).P
16P
Only one study reported on consumption of condiments and seasonings. P
182P This
study took place in India, and found that 34 percent (n=65) of adolescents ages 10–14 consumed condiments or seasonings two to three times per week. Intake of Sweet Food Items Categories for sweet and salty/fried items were included to better understand consumption of foods that are generally energy-dense and nutrient-poor. Sweet items are typically high in fat, sugar, and simple carbohydrates and include foods such as cakes, cookies, jelly, doughnuts and other sweet pastries, ice cream, and condensed milk. P
16P Confectionary and chocolate are included in this category.
Thirty-six studies reported on sweet items.P
26, 28, 40, 42, 52, 54, 64, 67, 70, 74, 77, 80, 97, 99, 103,
105, 106, 115, 124, 133, 168, 171, 177, 178, 180, 182, 183, 185, 187, 195, 206-211P Overall, consumption of
these foods among adolescents was high (58 percent; n=109040) (table 14). Of girls who reported consuming sweet items, only 4 percent (n=3767) ate them on a daily basis while 63 percent (n=58316) ate them four to six times per week. There were significant differences in daily consumption of sweet items between younger and older adolescents, with almost 75 percent (n=2751) of girls ages 10–14 eating them daily compared to 30 percent (n=749) of older girls (Appendix I, table 14). The lowest general consumption was found among adolescents in Europe and Central Asia (10 percent; n=106), though studies from this region were lacking. The highest general consumption was found in South Asia (66 percent; n=1130) based on a regional analysis comprised mostly of urban populations in India. We saw no clear pattern when comparing younger and older adolescents by region. In the Middle East and North Africa and Africa, older adolescents consumed more sweet foods than younger adolescents, though in Europe and Central Asia, South Asia, and East Asia and the Pacific the reverse was true. Table 14. Consumption of Sweet Food Items
Middle East and North Africa (N=9) Iran (2 mixed), Iraq (1 urban), Jordan (3 urban), Lebanon (1 NR), Morocco (1 urban), Syria (1 urban) General consumption pattern N studies 9 n participants 15913 Consumption % (n) 43% (6795)
Diet & Eating Practices of Adolescents in LMIC
44
Frequency N studies 6 n participants 8580 n consumers 4024 Urban/Rural/Mixed 7 urban, 1 mixed Daily 64% (2594) 2–3 times/week 15% (603) 4–6 times/week 21% (827) Latin America and the Caribbean (N=5) P
1
Brazil (2 urban, 3 mixed) General consumption pattern N studies 5 n participants 159077 Consumption % (n) 61% (97591) Frequency N studies 4 n participants 159077 n consumers 85,504 Urban/Rural/Mixed 2 urban, 2 mixed 2–3 times/week 33% (28623) 4–6 times/week 67% (56881) Africa (N=9)
Ethiopia (1 rural, 1 mixed), Ghana (1 urban), Nigeria (2 urban), South Africa (3 urban), Sudan (1 urban) General consumption pattern N studies 9 n participants 6227 Consumption % (n) 37% (2284) Frequency N studies 4 n participants 1852 n consumers 1303 Urban/Rural/Mixed 3 urban, 1 rural Daily 34% (437) 2–3 times/week 35% (458) 4–6 times/week 31% (408) Europe and Central Asia (N=2) Serbia (1 urban), Turkey (1 urban) General consumption pattern N studies 2 n participants 1090 Consumption % (n) 10% (106) Frequency N studies NR South Asia (N=6) India (5 urban), Pakistan (1 urban) General consumption pattern N studies 6
45
Intake of Salty/Fried Food Items Like sweet foods, salty and fried items are typically high in fat and simple carbohydrates, and they are also laden with salt.P
16P This category includes foods
such as chips, crisps, puffs, and other low-cost items. It also includes fried foods that are more substantial, such as french fries, instant noodles, samosas, and other “street foods.” Fewer studies (N=20) reported on salty/fried food items.P
30, 52, 54, 64, 67, 74, 77, 80, 97, 105,
106, 124, 151, 168, 171, 177, 180, 183, 187, 206P Overall, consumption of salty or fried items was
20 percent (n=24005) (table 15). We found the same pattern that was noted for sweet food items, whereby daily consumption was low (8 percent; n=1004), but
n participants 1710 Consumption % (n) 66% (1130) Frequency N studies 3 n participants 1377 n consumers 1064 Urban/Rural/Mixed 3 urban Daily 38% (401) 2–3 times/week 44% (463) 4–6 times/week 19% (200) East Asia & Pacific (N=5) China (1 urban, 1 rural), Malaysia (1 urban), Thailand (1 urban), Tonga (1 Mixed) General consumption pattern N studies 5 n participants 3563 Consumption % (n) 32% (1134) Frequency N studies 1 n participants 1450 n consumers 335 Urban/Rural/Mixed 1 rural Daily 100% (335) Total (N=36) General consumption pattern N studies 36 n participants 187580 Consumption % (n) 58% (109040) Frequency N studies 18 n participants 132424 n consumers 92230 Urban/Rural/Mixed 16 urban, 3 mixed, 2 rural Daily 4% (3767) 2–3 times/week 33% (30147) 4–6 times/week 63% (58316)
Diet & Eating Practices of Adolescents in LMIC
46
consumption four to six times per week was high (78 percent; n=9903). Additionally, we found that daily consumption for younger adolescents was significantly higher than for older adolescents (49 percent; n=997 versus 1 percent; n=3) (Appendix I, table 15). By region, intake was highest for girls living in urban areas of South Asia (India and Pakistan) and East Asia and the Pacific (China, Thailand, and Tonga). Frequency data was reported inconsistently, so we could not accurately compare habits among younger and older adolescents by region. Table 15. Consumption of Salty/Fried Food Items
Middle East and North Africa (N=7) Iran (1 urban, 2 mixed), Iraq (1 urban), Jordan (1 urban), Lebanon (1 NR), Morocco (1 urban) General consumption pattern N studies 7 n participants 15,519 Consumption % (n) 23% (3526) Frequency N studies 5 n participants 8535 n consumers 2466 Urban/Rural/Mixed 4 urban, 1 mixed Daily 37% (917) 2–3 times/week 31% (777) 4–6 times/week 27% (681) Weekly 4% (91) Latin America and the Caribbean (N=2) P
1
Brazil (2 mixed) General consumption pattern N studies 2 n participants 97,001 Consumption % (n) 12% (11,592) Frequency N studies 1 n participants 57,089 n consumers 9222 Urban/Rural/Mixed 1 mixed 4–6 times/week 100% (9222) Africa (N=3)Ethiopia (1 mixed), South Africa (2 urban) General consumption pattern N studies 3 n participants 1620 Consumption % (n) 20% (329) Frequency N studies 1 n participants 61 n consumers 3
47
Urban/Rural/Mixed 1 urban Daily 100% (3) Europe and Central Asia (N=2) Serbia (1 urban), Turkey (1 urban) General consumption pattern N studies 2 n participants 1090 Consumption % (n) 22% (237) Frequency N studies NR South Asia (N=3) India (2 urban), Pakistan (1 urban) General consumption pattern N studies 3 n participants 278 Consumption % (n) 57% (158) Frequency N studies 1 n participants 138 n consumers 84 Urban/Rural/Mixed 1 urban Daily 100% (84) East Asia & Pacific (N=3) China (1 urban), Thailand (1 urban), Tonga (1 mixed) General consumption pattern N studies 3 n participants 2488 Consumption % (n) 56% (1440) Frequency N studies 1 n participants 969 n consumers 848 Urban/Rural/Mixed 1 urban Weekly 100% (848) Total (N=20) General consumption pattern N studies 20 n participants 117996 Consumption % (n) 20% (24005) Frequency N studies 9 n participants 66792 n consumers 12623 Urban/Rural/Mixed 7 urban, 2 mixed Daily 8% (1004) 2–3 times/week 6% (777) 4–6 times/week 78% (9903) Weekly 7% (939)
Diet & Eating Practices of Adolescents in LMIC
48
Intake of Fast Foods Fast foods are meals purchased outside of the home, often as pre-prepared or “take-away” items from fast food restaurants, bars, or vendors. These foods contribute substantial amounts to daily energy intake, often have poor nutrient content, and are typically largely portioned and highly processed. P
212, 213P Studies
in high-income countries have shown fast foods to be high in sugar, sodium, unsaturated fat and total fat, and low in health promoting micronutrients. P
214, 215P
These foods have been implicated in the rising global rates of obesity and associated noncommunicable diseases. P
18P Common fast food items include
burgers (beef, vegetarian, chicken, fish), fried chicken, french fries, chicken wings, pizza, and tacos. Fifty studies (n=152424) reported on the intake of fast foods.P
26, 28, 39, 50, 52, 64, 67, 70,
74, 75, 77, 79, 80, 93, 96, 97, 99, 103, 113, 115, 118, 124, 133, 134, 137, 138, 159, 168, 169, 171, 174, 177-180, 183, 185,
187, 189, 192, 198, 199, 201, 207, 210, 216-220P Overall, 21 percent (n=32685) of all adolescent
girls consumed these items, and 20 percent (n=2617) consumed them daily (table 16). Across all regions (total), there appears to be some differences between younger and older adolescents, with general consumption at 15 percent (n=16037) and 29 percent (n=12905), respectively (Appendix I, table 16). However, daily intake is far greater among girls ages 10–14 than 15–19. (24 percent; n=1174 versus 8 percent; n=369). For all adolescents (10–19 years), general consumption appears to be highest for those residing in South Asia (84 percent; n=6060) and Africa (52 percent; n=3108) and lowest in East Asia and the Pacific (8 percent; n=1452). However, in Latin America and the Caribbean daily consumption was greatest, reaching nearly 40 percent (n=487). All studies comprising the regional analysis for South Asia took place in India, with the clear majority representing urban areas. Additionally, only two studies contributed to the East Asia and Pacific regional analysis, and both were in younger adolescents. Table 16. Consumption of Fast Foods
Middle East and North Africa (N=13) Iran (3 urban, 2 mixed), Iraq (1 mixed), Jordan (2 urban), Lebanon (1 NR), Morocco (1 urban) General consumption pattern N studies 13 n participants 18458 Consumption % (n) 16% (3014) Frequency N studies 8 n participants 9273 n consumers 1880 Urban/Rural/Mixed 6 urban, 1 mixed, 1 NR Daily 8% (153) 2–3 times/week 67% (1259) 4–6 times/week 18% (342)
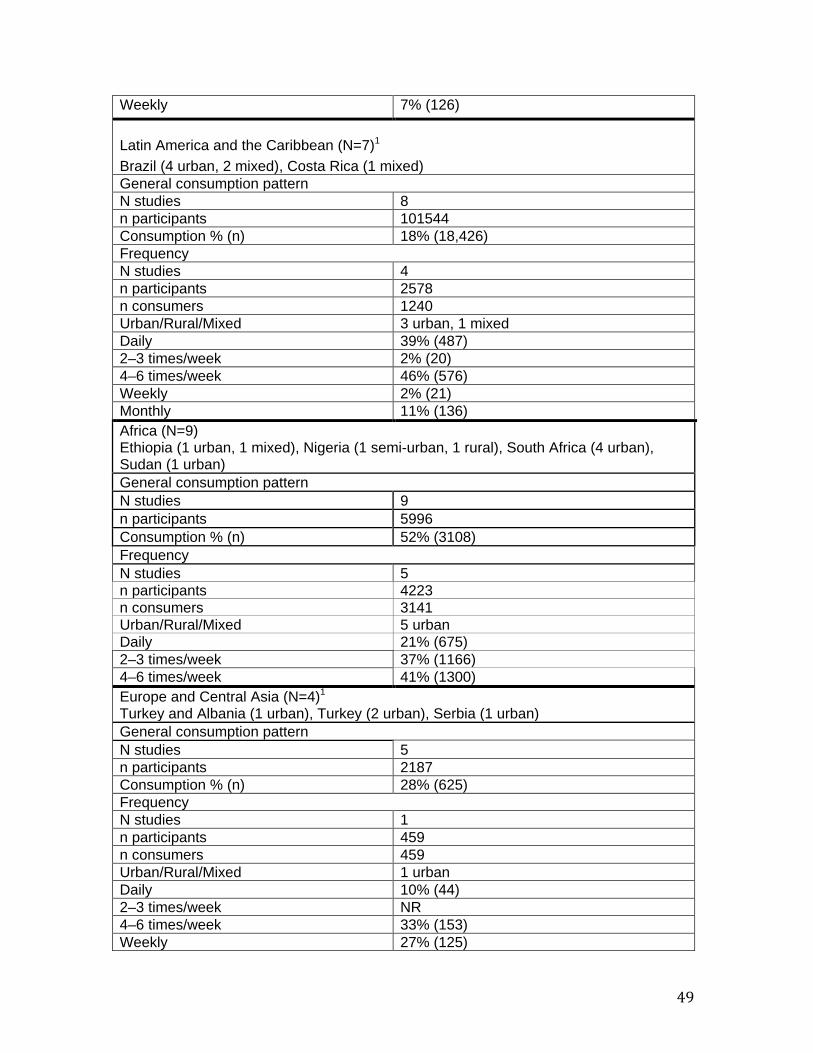
49
Weekly 7% (126)
Latin America and the Caribbean (N=7) P
1
Brazil (4 urban, 2 mixed), Costa Rica (1 mixed) General consumption pattern N studies 8 n participants 101544 Consumption % (n) 18% (18,426) Frequency N studies 4 n participants 2578 n consumers 1240 Urban/Rural/Mixed 3 urban, 1 mixed Daily 39% (487) 2–3 times/week 2% (20) 4–6 times/week 46% (576) Weekly 2% (21) Monthly 11% (136) Africa (N=9)
Ethiopia (1 urban, 1 mixed), Nigeria (1 semi-urban, 1 rural), South Africa (4 urban), Sudan (1 urban) General consumption pattern N studies 9 n participants 5996 Consumption % (n) 52% (3108) Frequency N studies 5 n participants 4223 n consumers 3141 Urban/Rural/Mixed 5 urban Daily 21% (675) 2–3 times/week 37% (1166) 4–6 times/week 41% (1300) Europe and Central Asia (N=4) P
1 Turkey and Albania (1 urban), Turkey (2 urban), Serbia (1 urban) General consumption pattern N studies 5 n participants 2187 Consumption % (n) 28% (625) Frequency N studies 1 n participants 459 n consumers 459 Urban/Rural/Mixed 1 urban Daily 10% (44) 2–3 times/week NR 4–6 times/week 33% (153) Weekly 27% (125)
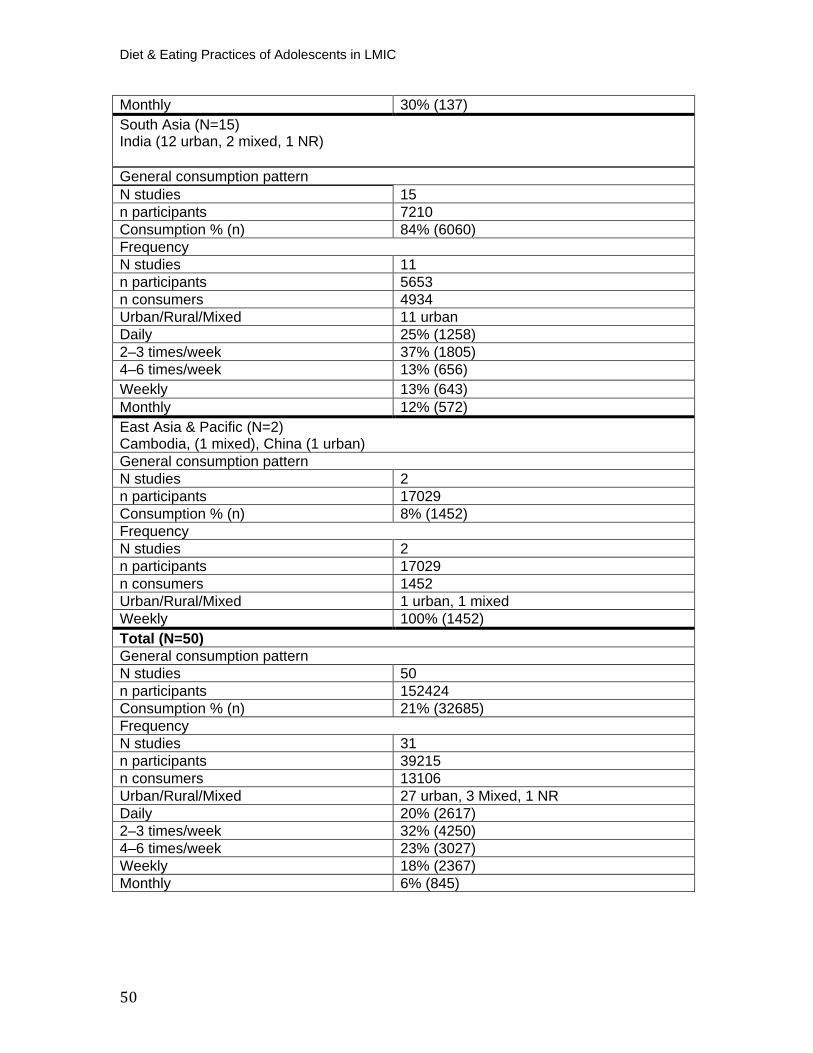
Diet & Eating Practices of Adolescents in LMIC
50
Monthly 30% (137) South Asia (N=15) India (12 urban, 2 mixed, 1 NR)
General consumption pattern N studies 15 n participants 7210 Consumption % (n) 84% (6060) Frequency N studies 11 n participants 5653 n consumers 4934 Urban/Rural/Mixed 11 urban Daily 25% (1258) 2–3 times/week 37% (1805) 4–6 times/week 13% (656) Weekly 13% (643) Monthly 12% (572) East Asia & Pacific (N=2) Cambodia, (1 mixed), China (1 urban) General consumption pattern N studies 2 n participants 17029 Consumption % (n) 8% (1452) Frequency N studies 2 n participants 17029 n consumers 1452 Urban/Rural/Mixed 1 urban, 1 mixed Weekly 100% (1452) Total (N=50) General consumption pattern N studies 50 n participants 152424 Consumption % (n) 21% (32685) Frequency N studies 31 n participants 39215 n consumers 13106 Urban/Rural/Mixed 27 urban, 3 Mixed, 1 NR Daily 20% (2617) 2–3 times/week 32% (4250) 4–6 times/week 23% (3027) Weekly 18% (2367) Monthly 6% (845)
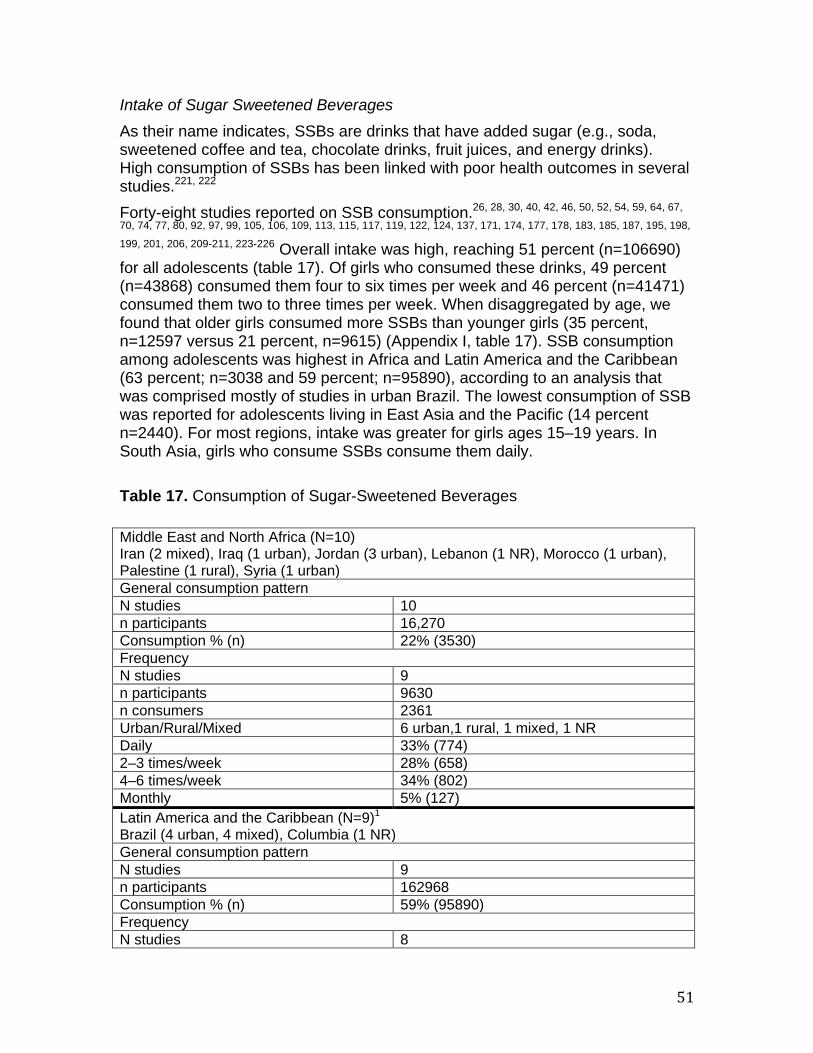
51
Intake of Sugar Sweetened Beverages
As their name indicates, SSBs are drinks that have added sugar (e.g., soda, sweetened coffee and tea, chocolate drinks, fruit juices, and energy drinks). High consumption of SSBs has been linked with poor health outcomes in several studies. P
221, 222P
Forty-eight studies reported on SSB consumption. P
26, 28, 30, 40, 42, 46, 50, 52, 54, 59, 64, 67,
70, 74, 77, 80, 92, 97, 99, 105, 106, 109, 113, 115, 117, 119, 122, 124, 137, 171, 174, 177, 178, 183, 185, 187, 195, 198,
199, 201, 206, 209-211, 223-226P Overall intake was high, reaching 51 percent (n=106690)
for all adolescents (table 17). Of girls who consumed these drinks, 49 percent (n=43868) consumed them four to six times per week and 46 percent (n=41471) consumed them two to three times per week. When disaggregated by age, we found that older girls consumed more SSBs than younger girls (35 percent, n=12597 versus 21 percent, n=9615) (Appendix I, table 17). SSB consumption among adolescents was highest in Africa and Latin America and the Caribbean (63 percent; n=3038 and 59 percent; n=95890), according to an analysis that was comprised mostly of studies in urban Brazil. The lowest consumption of SSB was reported for adolescents living in East Asia and the Pacific (14 percent n=2440). For most regions, intake was greater for girls ages 15–19 years. In South Asia, girls who consume SSBs consume them daily. Table 17. Consumption of Sugar-Sweetened Beverages
Middle East and North Africa (N=10) Iran (2 mixed), Iraq (1 urban), Jordan (3 urban), Lebanon (1 NR), Morocco (1 urban), Palestine (1 rural), Syria (1 urban) General consumption pattern N studies 10 n participants 16,270 Consumption % (n) 22% (3530) Frequency N studies 9 n participants 9630 n consumers 2361 Urban/Rural/Mixed 6 urban,1 rural, 1 mixed, 1 NR Daily 33% (774) 2–3 times/week 28% (658) 4–6 times/week 34% (802) Monthly 5% (127) Latin America and the Caribbean (N=9) P
1
Brazil (4 urban, 4 mixed), Columbia (1 NR) General consumption pattern N studies 9 n participants 162968 Consumption % (n) 59% (95890) Frequency N studies 8
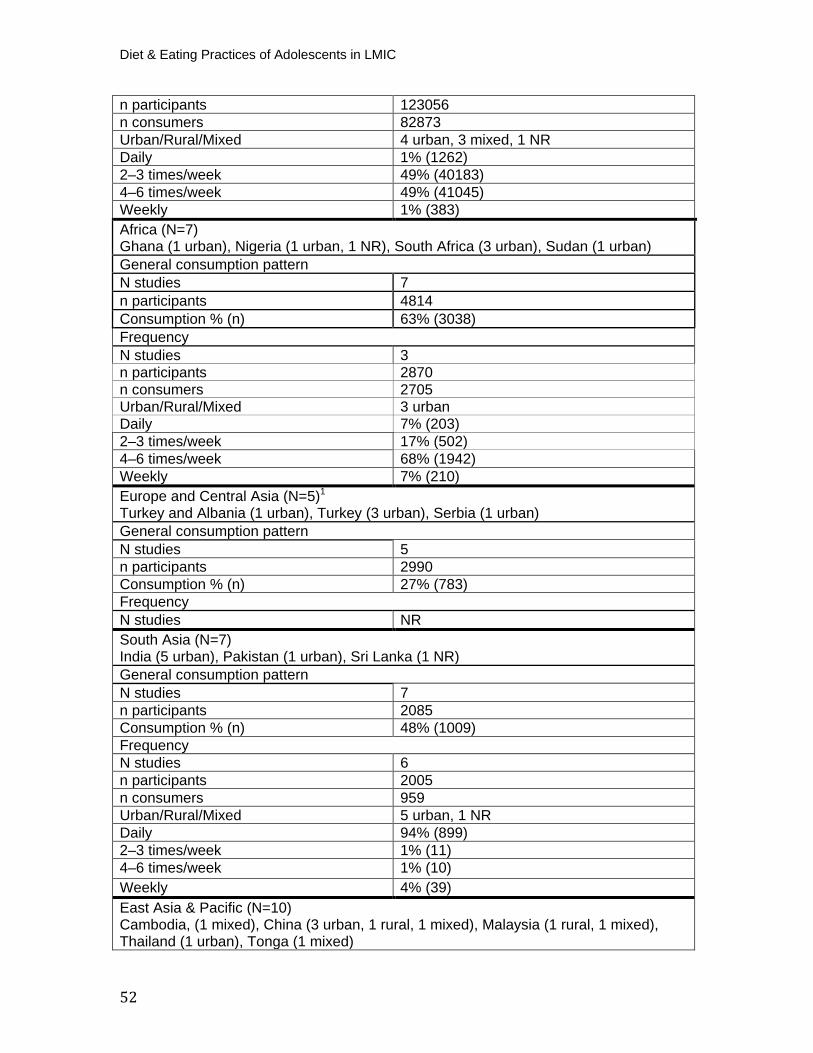
Diet & Eating Practices of Adolescents in LMIC
52
n participants 123056 n consumers 82873 Urban/Rural/Mixed 4 urban, 3 mixed, 1 NR Daily 1% (1262) 2–3 times/week 49% (40183) 4–6 times/week 49% (41045) Weekly 1% (383) Africa (N=7)Ghana (1 urban), Nigeria (1 urban, 1 NR), South Africa (3 urban), Sudan (1 urban) General consumption pattern N studies 7 n participants 4814 Consumption % (n) 63% (3038) Frequency N studies 3 n participants 2870 n consumers 2705 Urban/Rural/Mixed 3 urban Daily 7% (203) 2–3 times/week 17% (502) 4–6 times/week 68% (1942) Weekly 7% (210) Europe and Central Asia (N=5) P
1
Turkey and Albania (1 urban), Turkey (3 urban), Serbia (1 urban) General consumption pattern N studies 5 n participants 2990 Consumption % (n) 27% (783) Frequency N studies NR South Asia (N=7) India (5 urban), Pakistan (1 urban), Sri Lanka (1 NR) General consumption pattern N studies 7 n participants 2085 Consumption % (n) 48% (1009) Frequency N studies 6 n participants 2005 n consumers 959 Urban/Rural/Mixed 5 urban, 1 NR Daily 94% (899) 2–3 times/week 1% (11) 4–6 times/week 1% (10) Weekly 4% (39) East Asia & Pacific (N=10) Cambodia, (1 mixed), China (3 urban, 1 rural, 1 mixed), Malaysia (1 rural, 1 mixed), Thailand (1 urban), Tonga (1 mixed)
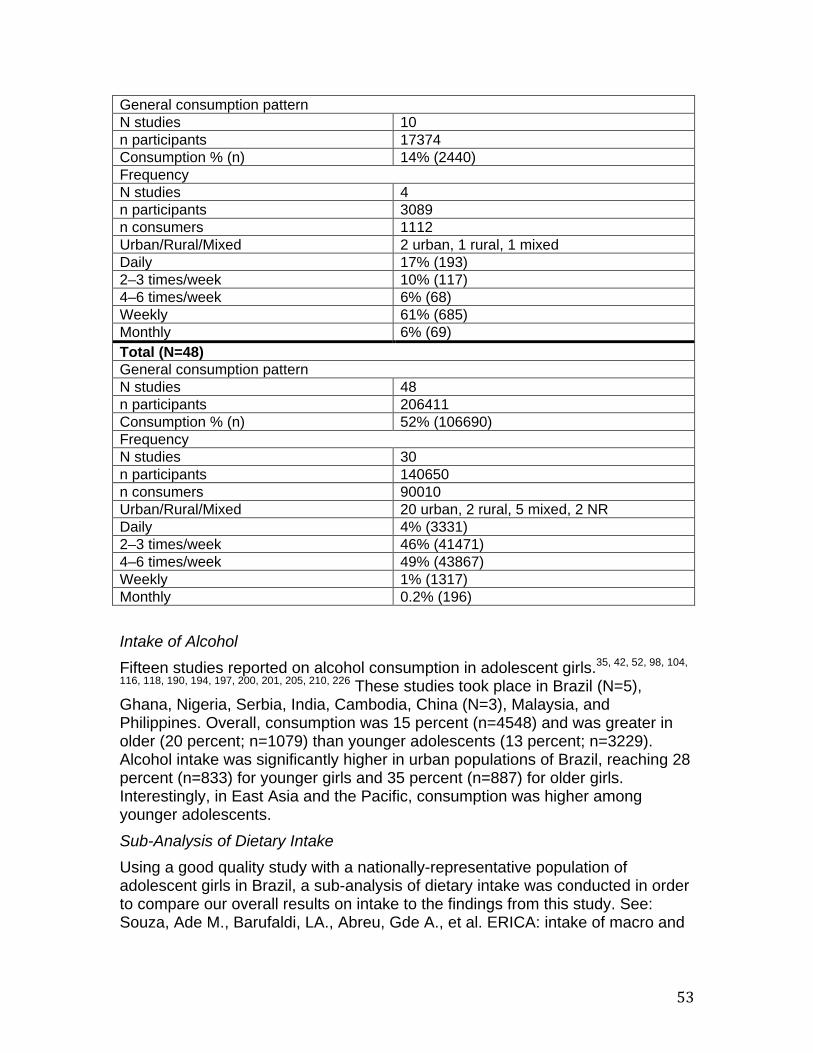
53
Intake of Alcohol Fifteen studies reported on alcohol consumption in adolescent girls. P
35, 42, 52, 98, 104,
116, 118, 190, 194, 197, 200, 201, 205, 210, 226P These studies took place in Brazil (N=5),
Ghana, Nigeria, Serbia, India, Cambodia, China (N=3), Malaysia, and Philippines. Overall, consumption was 15 percent (n=4548) and was greater in older (20 percent; n=1079) than younger adolescents (13 percent; n=3229). Alcohol intake was significantly higher in urban populations of Brazil, reaching 28 percent (n=833) for younger girls and 35 percent (n=887) for older girls. Interestingly, in East Asia and the Pacific, consumption was higher among younger adolescents. Sub-Analysis of Dietary Intake Using a good quality study with a nationally-representative population of adolescent girls in Brazil, a sub-analysis of dietary intake was conducted in order to compare our overall results on intake to the findings from this study. See: Souza, Ade M., Barufaldi, LA., Abreu, Gde A., et al. ERICA: intake of macro and
General consumption pattern N studies 10 n participants 17374 Consumption % (n) 14% (2440) Frequency N studies 4 n participants 3089 n consumers 1112 Urban/Rural/Mixed 2 urban, 1 rural, 1 mixed Daily 17% (193) 2–3 times/week 10% (117) 4–6 times/week 6% (68) Weekly 61% (685) Monthly 6% (69) Total (N=48) General consumption pattern N studies 48 n participants 206411 Consumption % (n) 52% (106690) Frequency N studies 30 n participants 140650 n consumers 90010 Urban/Rural/Mixed 20 urban, 2 rural, 5 mixed, 2 NR Daily 4% (3331) 2–3 times/week 46% (41471) 4–6 times/week 49% (43867) Weekly 1% (1317) Monthly 0.2% (196)
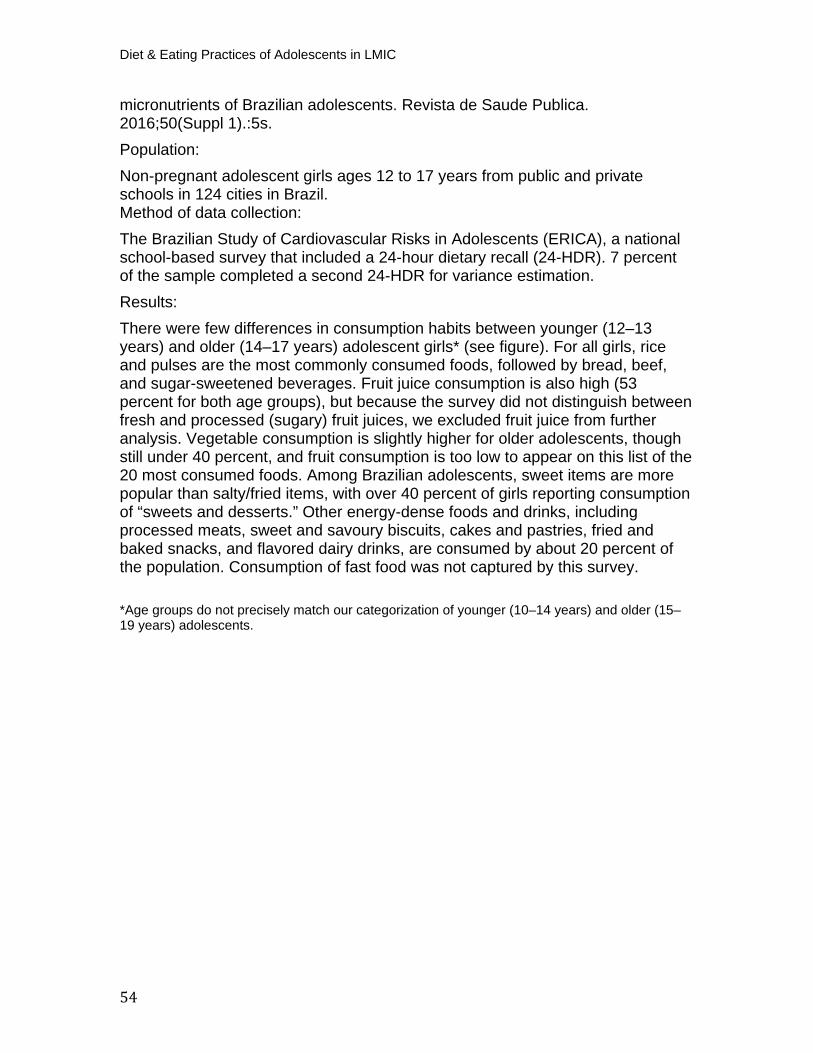
Diet & Eating Practices of Adolescents in LMIC
54
micronutrients of Brazilian adolescents. Revista de Saude Publica. 2016;50(Suppl 1).:5s. Population: Non-pregnant adolescent girls ages 12 to 17 years from public and private schools in 124 cities in Brazil. Method of data collection: The Brazilian Study of Cardiovascular Risks in Adolescents (ERICA), a national school-based survey that included a 24-hour dietary recall (24-HDR). 7 percent of the sample completed a second 24-HDR for variance estimation. Results: There were few differences in consumption habits between younger (12–13 years) and older (14–17 years) adolescent girls* (see figure). For all girls, rice and pulses are the most commonly consumed foods, followed by bread, beef, and sugar-sweetened beverages. Fruit juice consumption is also high (53 percent for both age groups), but because the survey did not distinguish between fresh and processed (sugary) fruit juices, we excluded fruit juice from further analysis. Vegetable consumption is slightly higher for older adolescents, though still under 40 percent, and fruit consumption is too low to appear on this list of the 20 most consumed foods. Among Brazilian adolescents, sweet items are more popular than salty/fried items, with over 40 percent of girls reporting consumption of “sweets and desserts.” Other energy-dense foods and drinks, including processed meats, sweet and savoury biscuits, cakes and pastries, fried and baked snacks, and flavored dairy drinks, are consumed by about 20 percent of the population. Consumption of fast food was not captured by this survey.
*Age groups do not precisely match our categorization of younger (10–14 years) and older (15–19 years) adolescents.
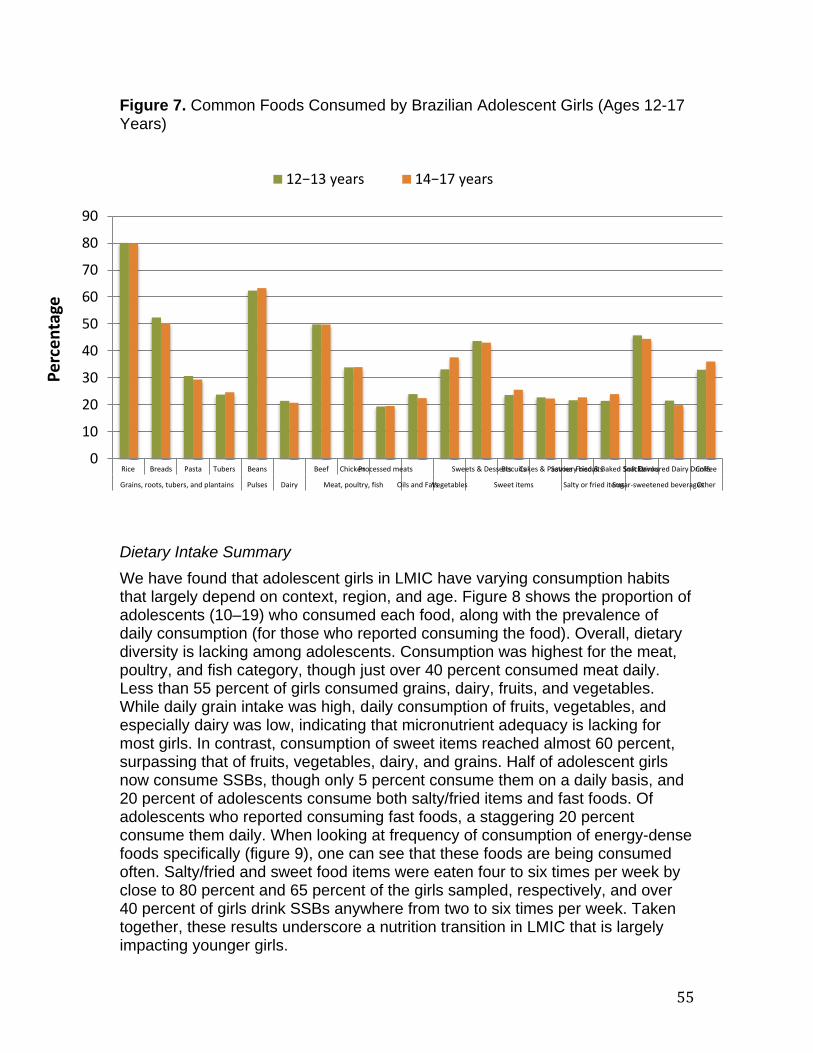
55
Figure 7. Common Foods Consumed by Brazilian Adolescent Girls (Ages 12-17 Years)
Dietary Intake Summary We have found that adolescent girls in LMIC have varying consumption habits that largely depend on context, region, and age. Figure 8 shows the proportion of adolescents (10–19) who consumed each food, along with the prevalence of daily consumption (for those who reported consuming the food). Overall, dietary diversity is lacking among adolescents. Consumption was highest for the meat, poultry, and fish category, though just over 40 percent consumed meat daily. Less than 55 percent of girls consumed grains, dairy, fruits, and vegetables. While daily grain intake was high, daily consumption of fruits, vegetables, and especially dairy was low, indicating that micronutrient adequacy is lacking for most girls. In contrast, consumption of sweet items reached almost 60 percent, surpassing that of fruits, vegetables, dairy, and grains. Half of adolescent girls now consume SSBs, though only 5 percent consume them on a daily basis, and 20 percent of adolescents consume both salty/fried items and fast foods. Of adolescents who reported consuming fast foods, a staggering 20 percent consume them daily. When looking at frequency of consumption of energy-dense foods specifically (figure 9), one can see that these foods are being consumed often. Salty/fried and sweet food items were eaten four to six times per week by close to 80 percent and 65 percent of the girls sampled, respectively, and over 40 percent of girls drink SSBs anywhere from two to six times per week. Taken together, these results underscore a nutrition transition in LMIC that is largely impacting younger girls.
0
10
20
30
40
50
60
70
80
90
Rice Breads Pasta Tubers Beans Beef ChickenProcessed meats Sweets & DessertsBiscuitsCakes & PastriesSavoury biscuitsFried & Baked SnacksSoft DrinksFlavoured Dairy DrinksCoffee
Grains, roots, tubers, and plantains Pulses Dairy Meat, poultry, fish Oils and FatsVegetables Sweet items Salty or fried itemsSugar-sweetened beveragesOther
Perc
enta
ge
12−13 years 14−17 years
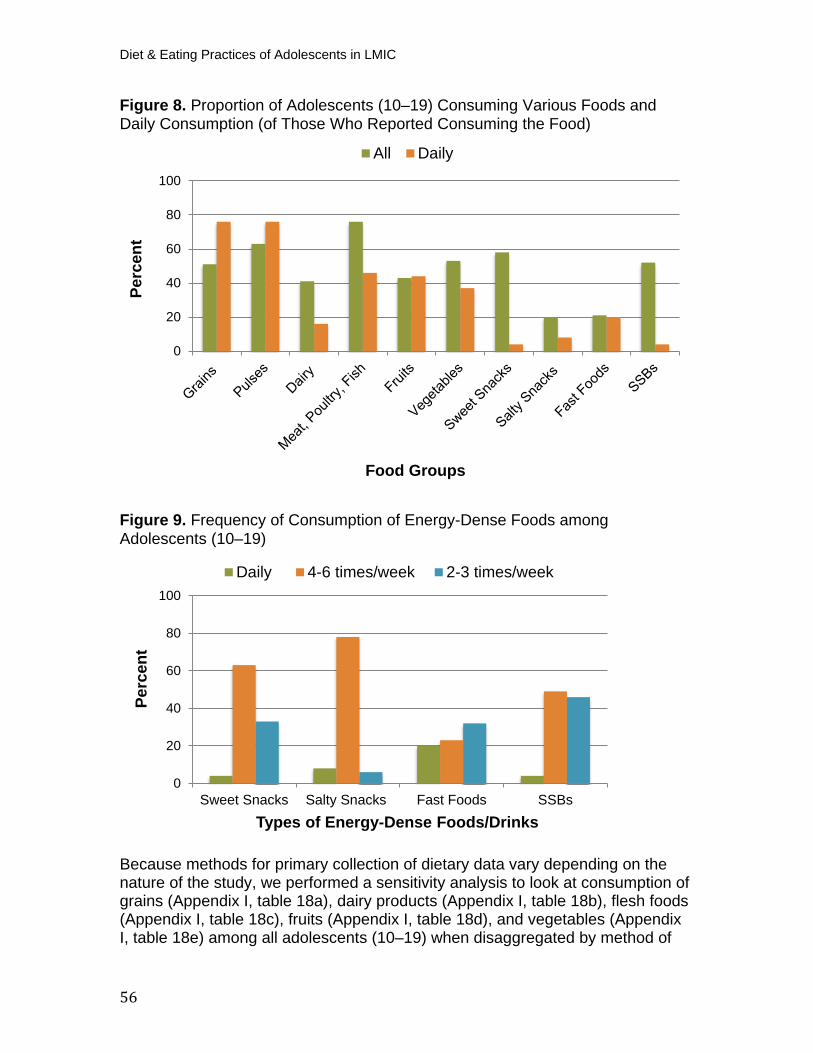
Diet & Eating Practices of Adolescents in LMIC
56
Figure 8. Proportion of Adolescents (10–19) Consuming Various Foods and Daily Consumption (of Those Who Reported Consuming the Food)
Figure 9. Frequency of Consumption of Energy-Dense Foods among Adolescents (10–19)
Because methods for primary collection of dietary data vary depending on the nature of the study, we performed a sensitivity analysis to look at consumption of grains (Appendix I, table 18a), dairy products (Appendix I, table 18b), flesh foods (Appendix I, table 18c), fruits (Appendix I, table 18d), and vegetables (Appendix I, table 18e) among all adolescents (10–19) when disaggregated by method of
0
20
40
60
80
100
Perc
ent
Food Groups
All Daily
0
20
40
60
80
100
Sweet Snacks Salty Snacks Fast Foods SSBs
Perc
ent
Types of Energy-Dense Foods/Drinks
Daily 4-6 times/week 2-3 times/week
57
data collection. Overall, consumption tended to vary by region and we found no consistent pattern when comparing results by food frequency questionnaire (FFQ), 24-hour recall, food records, or other non-validated tools. For example, grain consumption in Africa was highest using 24-hour recall (92 percent; n=933), followed by non-validated tools (74 percent; n=2106), followed by FFQ (67 percent; n=695). In contrast, grain consumption in South Asia was highest using 24-hour recall (82 percent; n=769), followed by FFQ (96 percent; n=1265), followed by non-validated tools (56 percent; n=226). Similar findings were noted for the other food groups examined, allowing us to infer that one method did not systematically over- or underrepresent results. As such, we can assume that it was acceptable to pool dietary intake data from all diet measurement sources. Similarly, we performed a sensitivity analysis by study quality to assess whether the removal of low quality studies would significantly alter our dietary intake results (10–19 years) for grains (Appendix I, table 19a), dairy products (Appendix I, table 19b), flesh foods (Appendix I, table 19c), fruits (Appendix I, table 19d), and vegetables (Appendix I, table 19e). The proportion of adolescents who consumed fruits, vegetables, and flesh foods was lower for all regions, with the exception of Europe and Central Asia, after taking low quality studies out of the analysis. However, we found no consistent pattern for grains or dairy.
Place of Meal Consumption We aimed to determine whether adolescent girls consume meals inside or outside of their homes, and which meal is more likely to be consumed elsewhere. Eight studies looked specifically at the proportion of girls who eat breakfast, lunch, and dinner away from the home. P
26, 39, 40, 64, 105, 156, 196, 227P We found that the
majority of adolescent girls across all regions consume lunch outside of their home (60 percent; n=2517), a finding that aligns with the notion that most of these studies were school-based (table 18 and figure 10). Two studies asked specifically about lunch box usage at school, one of which specified that data collection occurred during a time when meals were not provided to students.P
26, 156P
Authors found that 86 percent of girls in an urban center of South Africa used a lunchbox at school less than two times per week and almost 50 percent of girls in rural India never carried their lunch from home, indicating that most adolescent girls purchase their lunch at or near school. We found that over one quarter of all girls eat breakfast outside of the home (33 percent; n=1254), while dinner is more likely to be consumed inside the home (table 18 and figure 10).
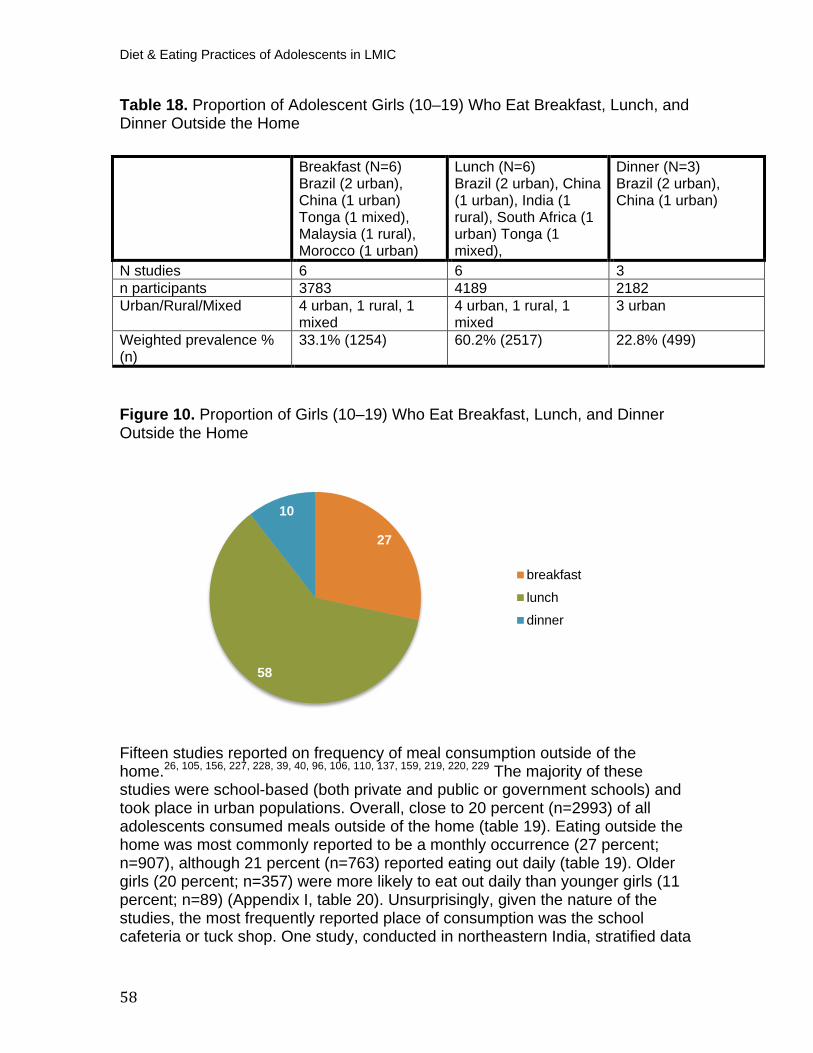
Diet & Eating Practices of Adolescents in LMIC
58
Table 18. Proportion of Adolescent Girls (10–19) Who Eat Breakfast, Lunch, and Dinner Outside the Home
Figure 10. Proportion of Girls (10–19) Who Eat Breakfast, Lunch, and Dinner Outside the Home
Fifteen studies reported on frequency of meal consumption outside of the home. P
26, 105, 156, 227, 228, 39, 40, 96, 106, 110, 137, 159, 219, 220, 229P The majority of these
studies were school-based (both private and public or government schools) and took place in urban populations. Overall, close to 20 percent (n=2993) of all adolescents consumed meals outside of the home (table 19). Eating outside the home was most commonly reported to be a monthly occurrence (27 percent; n=907), although 21 percent (n=763) reported eating out daily (table 19). Older girls (20 percent; n=357) were more likely to eat out daily than younger girls (11 percent; n=89) (Appendix I, table 20). Unsurprisingly, given the nature of the studies, the most frequently reported place of consumption was the school cafeteria or tuck shop. One study, conducted in northeastern India, stratified data
27
58
10
breakfast
lunch
dinner
Breakfast (N=6) Brazil (2 urban), China (1 urban) Tonga (1 mixed), Malaysia (1 rural), Morocco (1 urban)
Lunch (N=6) Brazil (2 urban), China (1 urban), India (1 rural), South Africa (1 urban) Tonga (1 mixed),
Dinner (N=3) Brazil (2 urban), China (1 urban)
N studies 6 6 3 n participants 3783 4189 2182 Urban/Rural/Mixed 4 urban, 1 rural, 1
mixed 4 urban, 1 rural, 1 mixed
3 urban
Weighted prevalence % (n)
33.1% (1254) 60.2% (2517) 22.8% (499)
59
by rural, suburban, and urban populations. Of the rural group, about half of the girls were in school and half were out of school. P
220P While proportions were less
than those for the suburban and urban populations, 3 percent, 14 percent, and 41 percent of rural girls still reported eating outside the home daily, weekly, and monthly, respectively. Three studies reported on the frequency of meal consumption at a fast food restaurant or outlet specificallyP
96, 106, 122P. Of these, two populations were school
going, older adolescent girls in urban Malaysia and rural Palestine, respectively. The third study was not school-based, and likely included both in-school and out-of-school, older adolescents in the Soweto-Johannesburg region of South Africa. Pooled analysis shows that 3 percent of girls eat at a fast food restaurant daily, while 18 percent visit a fast food restaurant four to six times per week and 26 percent of girls eat meals there one to three times per week. When comparing results by region, it appears that girls in Malaysia frequent fast food restaurants less than girls in South Africa and Palestine (0.7 percent of girls eat at fast food restaurants four to six times per week compared to almost 40 percent in South Africa and 20 percent in Palestine). Table 19. Proportion of Adolescent Girls (10–19) from All Regions Who Eat Meals Outside the Home (by Frequency)
Daily (N=7) India (1 urban, 1 mixed), Malaysia (1 urban, 1 rural, 1 NR), South Africa (1 urban) N studies 7 n participants 3174 Urban/Rural/Mixed 4 urban, 1 mixed, 1 NR, 1 rural Weighted prevalence % (n) 23.8% (757) 1-3 times/week (N=7)
India (2 urban), Malaysia (1 urban, 1 rural, 1 NR), Pakistan (1 mixed), South Africa (1 urban) N studies 7 n participants 3563 Urban/Rural/Mixed 4 urban, 1 rural, 1 mixed, 1 NR Weighted prevalence % (n) 21.4% (763) 4–6 times/week (N=8)
China (1 urban), India (2 urban), Malaysia (1 urban, 1 rural, 1 NR), Pakistan (1 mixed), South Africa (1 urban) N studies 9 n participants 5458 Urban/Rural/Mixed 5 urban, 2 rural, 1 mixed, 1 NR Weighted prevalence % (n) 10.4% (568) Monthly (N=5)
India (2 urban, 1 mixed), Malaysia (1 urban, 1 NR) N studies 5 n participants 3313 Urban/Rural/Mixed 3 urban, 1 mixed, 1 NR
Diet & Eating Practices of Adolescents in LMIC
60
P
1PNote that total eating out of the home does not include “never” category.
Meal Patterns We looked at several meal patterns of adolescent girls, including the number of full meals consumed per day (whether two or less) and, more specifically, the prevalence of breakfast skipping. We also determined the prevalence of snacking, and the prevalence of vegetarian diets among adolescent girls. All but three studies that investigated meal frequency were conducted in school-going adolescents. P
25, 70, 80, 99, 106, 113, 123, 132, 156, 181, 195, 228-231P Public and private
schools were evenly represented, based on the studies that provided such information. Overall, we found that almost half of adolescent girls consume two meals or less per day (40 percent, n=4010), and there are no differences between younger and older adolescents. Only four studies (n=3481) asked specifically about consumption of less than one of two meals per day. Three of these studies took place in the Middle East and North Africa (Gaza, Jordan, Iran) and one took place in Africa (Ghana). Pooled analyses revealed that 12 percent of all adolescents (10–19 years) sampled from these regions eat only one full meal per day. When comparing studies that specifically targeted adolescents coming from low- and high-income families, results differed. Half (50 percent) of girls in low-income and rural settings consumed two meals per day and 31 percent ate three meals per day. In comparison, only 11 percent of girls from wealthier, urban families ate two meals per day, while 38 percent ate three and the majority (51 percent) consumed four full meals per day. Another study by Kelishadi et al. found similar results when looking at the proportion of girls classified as low, medium, and high socio/economic status who consume ≤3 meals per day. P
232P
Forty-two studies looked specifically at breakfast skipping, , of which 39 were school-based studiesP
28, 37-40, 42, 43, 47, 52, 70, 80, 99, 105, 106, 110, 115, 120, 122, 123, 126, 133, 156,
169, 173, 175, 178, 181, 195, 199, 208, 217, 218, 220, 227, 230, 233-239P. Most (N=19) did not report
whether included school were public or private, though 13 studies were conducted in public schools, 2 in private schools, and 6 in both public and private
Weighted prevalence % (n) 27.4% (907) Never (N=6) India (2 urban), Malaysia (1 urban, 1 NR), Pakistan (1 mixed), South Africa (1 urban) N studies 6 n participants 3927 Urban/Rural/Mixed 4 urban, 1 mixed, 1 NR Weighted prevalence % (n) 24.5% (962) Total P
1 N studies 28 n participants 15508 Urban/Rural/Mixed 16 urban, 4 NR, 4 mixed, 4 rural Weighted prevalence % (n) 19.3 (2993)
61
schools. In one study, taking place in Tarqumiyah, Palestine, there are no private schools. Five studies included technical/vocational schools within their sampling frame, and only one study in India mentioned an active school feeding programme that provided students free lunch at school. Overall, we found that 40 percent (n=18129) of adolescent girls skip breakfast (table 20).P
239P We noted
some regional differences in breakfast skipping; it is most common among adolescents residing in Africa (47 percent, n=1486) and East Asia and the Pacific (41 percent, n=8679), while only 17 percent (n=354) of girls in Latin America and the Caribbean skip the first meal of the day (figure 11). Additionally, there are significant differences within each region by age (Appendix I, table 21). For example, in Brazil, only 11 percent (n=193) of younger adolescents skip breakfast compared to 55 percent (n=161) of older adolescents. This situation contrasts with the situation in Africa (Ghana and Nigeria), where the prevalence of breakfast skipping was 66 percent (n=1481) and 21 percent (n=79) for younger and older girls, respectively. Several studies investigated the reasons for skipping breakfast among adolescent girls. P
99, 122, 123, 218P Across all geographies
where these studies took place (Nigeria, Gaza, Iraq, and Palestine), the reason most often cited was lack of appetite in the morning followed by lack of time. Dieting behaviors, unavailability of easy-to-prepare foods, and fasting for religious reasons were also cited. One study in urban and rural areas of Zhejiang province, China looked at the association of breakfast consumption with health-related behaviors and found that consumption of breakfast either daily or sometimes was significantly associated with consuming vegetables two or more times per day and protected against soft drink consumption one or more times per day. P
233P Daily consumption was also shown to protect against consuming fast
food two or more days per week. Similarly, a study in an urban center of southern Brazil identified certain unhealthy eating patterns (e.g., consumption of fried foods, sweets, and soft drinks) as being positively associated with skipping breakfast among adolescent girls. P
196P Taken together, this underscores the
importance of promoting healthy eating patterns alongside food choices. Table 20. Prevalence of Breakfast Skipping among Adolescent Girls, by Region
Middle East and North Africa (N=10) Egypt (1 mixed), Iran (2 mixed, 1 urban), Iraq (1 urban, 1 mixed), Gaza (1 NR), Jordan (2 urban), Palestine (1 rural) N studies 10 n participants 15407 Urban/Rural/Mixed 4 urban, 4 mixed, 1 rural, 1 NR Skipping % (n) 43.3% (6667) Latin America and the Caribbean (N=4) Brazil (4 urban) N studies 4 n participants 2108 Urban/Rural/Mixed 4 urban Skipping % (n) 16.8% (354)
Diet & Eating Practices of Adolescents in LMIC
62
Africa (N=5)Ghana (1 mixed, 1 NR), Nigeria (2 urban, 1 semi-urban) N studies 5 n participants 3147 Urban/Rural/Mixed 2 urban, 1 semi-urban, 1 mixed, 1 NR Skipping % (n) 47.2% (1486) Europe and Central Asia (N=2)Bosnia & Herzegovina (1 mixed), Serbia (1 urban) N studies 2 n participants 683 Urban/Rural/Mixed 1 urban, 1 mixed Skipping % (n) 45.5% (311) South Asia (N=8) India (6 urban, 1 rural, 1 mixed) N studies 8 n participants 2291 Urban/Rural/Mixed 6 urban, 1 rural, 1 mixed Skipping % (n) 27.6% (632) East Asia & Pacific (N=13) China (4 rural, 2 urban, 1 mixed), Fiji (1 mixed), Malaysia (2 urban, 1 rural, 1 NR), Tonga (1 mixed) N studies 13 n participants 21354 Urban/Rural/Mixed 5 rural, 4 urban, 3 mixed, 1 NR Skipping % (n) 40.6% (8679) Total (N=42) N studies 42 n participants 44990 Urban/Rural/Mixed 21 urban, 10 mixed, 7 rural, 3 NR, 1 semi-
urban Skipping % (n) 40.3% (18,129)
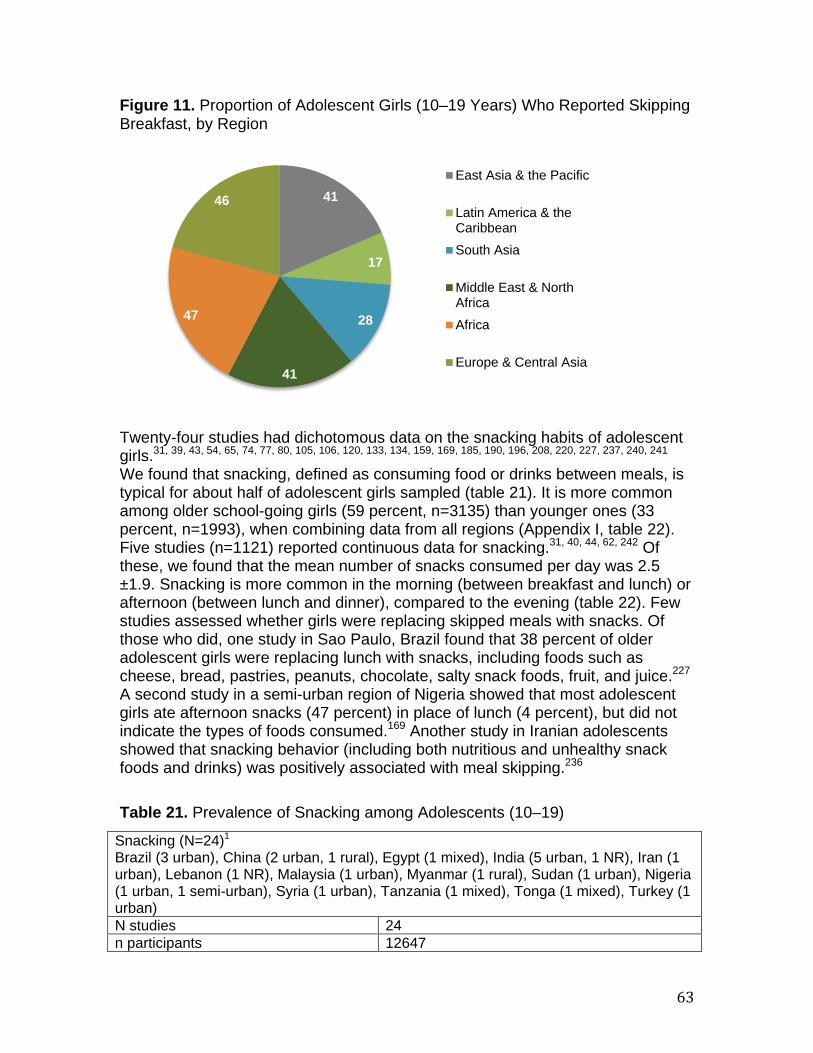
63
Figure 11. Proportion of Adolescent Girls (10–19 Years) Who Reported Skipping Breakfast, by Region
Twenty-four studies had dichotomous data on the snacking habits of adolescent girls. P
31, 39, 43, 54, 65, 74, 77, 80, 105, 106, 120, 133, 134, 159, 169, 185, 190, 196, 208, 220, 227, 237, 240, 241P
We found that snacking, defined as consuming food or drinks between meals, is typical for about half of adolescent girls sampled (table 21). It is more common among older school-going girls (59 percent, n=3135) than younger ones (33 percent, n=1993), when combining data from all regions (Appendix I, table 22). Five studies (n=1121) reported continuous data for snacking. P
31, 40, 44, 62, 242P Of
these, we found that the mean number of snacks consumed per day was 2.5 ±1.9. Snacking is more common in the morning (between breakfast and lunch) or afternoon (between lunch and dinner), compared to the evening (table 22). Few studies assessed whether girls were replacing skipped meals with snacks. Of those who did, one study in Sao Paulo, Brazil found that 38 percent of older adolescent girls were replacing lunch with snacks, including foods such as cheese, bread, pastries, peanuts, chocolate, salty snack foods, fruit, and juice. P
227P
A second study in a semi-urban region of Nigeria showed that most adolescent girls ate afternoon snacks (47 percent) in place of lunch (4 percent), but did not indicate the types of foods consumed. P
169P Another study in Iranian adolescents
showed that snacking behavior (including both nutritious and unhealthy snack foods and drinks) was positively associated with meal skipping. P
236P
Table 21. Prevalence of Snacking among Adolescents (10–19)
41
17
28
41
47
46
East Asia & the Pacific
Latin America & theCaribbeanSouth Asia
Middle East & NorthAfricaAfrica
Europe & Central Asia
Snacking (N=24) P
1
Brazil (3 urban), China (2 urban, 1 rural), Egypt (1 mixed), India (5 urban, 1 NR), Iran (1 urban), Lebanon (1 NR), Malaysia (1 urban), Myanmar (1 rural), Sudan (1 urban), Nigeria (1 urban, 1 semi-urban), Syria (1 urban), Tanzania (1 mixed), Tonga (1 mixed), Turkey (1 urban) N studies 24 n participants 12647
Diet & Eating Practices of Adolescents in LMIC
64
Table 22. Prevalence of Snacking, by Time of Day, Snack Taken, and Prevalence of Adolescents who Consume Snacks Daily
P
1PSome studies report multiple snacking patterns
Because morning and afternoon snacks are most common, adolescents are likely to be purchasing their snacks from school or near school grounds. Qualitative data from Tonga revealed that students purchased their morning snack from school, and these foods and drinks were typically unhealthy (e.g., deep-fried pancakes, dried noodles, and sweetened drinks).P
105P Several studies
investigated the relationship between snacking and the prevalence of overweight and obesity. One study in Delhi, IndiaP
159P found that snacking was much more
common in overweight or obese girls (96 percent) than in normal weight girls (53 percent), while another study in rural ChinaP
43P demonstrated borderline
significance for the association between snacking on four or more days per week and overweight/obesity. Interestingly, a third study in Turkey showed that more non-obese adolescents snack in the morning, while snacking in the afternoon is significantly associated with obesity. P
54P Taken together, it is not clear that
“snacking” should be considered an unhealthy behavior, especially where it is a culturally relevant practice and an important contributor to daily energy intake. Given that adolescents today commonly snack in between meals, it is important to ensure that healthy snack options are available at schools and in other community settings. Vegetarianism Of the 18 studies that reported on vegetarianism (table 23), 16 were from South Asia (15 from India and 1 from Sri Lanka). P
80, 93, 94, 130, 132, 133, 135, 136, 139, 156, 158, 159,
180, 198, 219, 220, 243, 244P The two additional studies were from an urban population in
Iran and a population in Brazil where urban/rural status was not reported. Within South Asia, we found that the majority of girls eat meat (59 percent non-vegetarian, n=3676 versus 29 percent vegetarian, n=1823). Additionally, 68 percent (n=717) of younger adolescents are non-vegetarian compared to 62 percent (n=2165) of older adolescents (Appendix I, table 23). Within Iran and
Urban/Rural/Mixed 16 urban, 3 mixed, 2 rural, 1 semi-urban, 2 NR Consumption % (n) 48.5% (6134)
Morning Afternoon Evening Daily Snacking (N=12) P
1
Brazil (3 urban), China (1 urban), Egypt (1 mixed), India (1 urban), Malaysia (1 urban), Nigeria (1 semi-urban), Sudan (1 urban), Syria (1 urban), Tonga (1 mixed), Turkey (1 urban) N studies 7 6 5 6 n participants 3585 2438 2263 1901 Urban/Rural/Mixed 5 urban, 1
mixed, 1 semi-urban
5 urban, 1 semi-urban
4 urban, 1 semi-urban
6 urban
Consumption % (n) 64.1% (2298) 61.2% (1492) 33.3% (754) 25.9% (492)
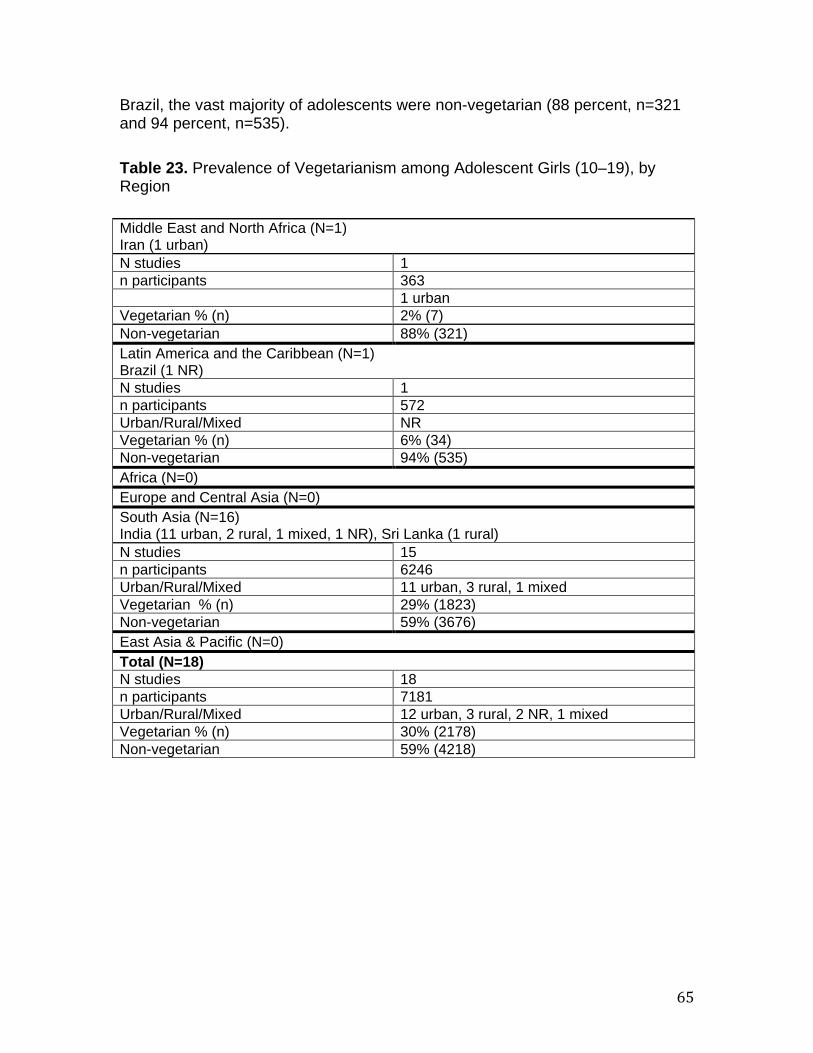
65
Brazil, the vast majority of adolescents were non-vegetarian (88 percent, n=321 and 94 percent, n=535). Table 23. Prevalence of Vegetarianism among Adolescent Girls (10–19), by Region
Middle East and North Africa (N=1) Iran (1 urban) N studies 1 n participants 363 1 urban Vegetarian % (n) 2% (7) Non-vegetarian 88% (321) Latin America and the Caribbean (N=1)
Brazil (1 NR) N studies 1 n participants 572 Urban/Rural/Mixed NR Vegetarian % (n) 6% (34) Non-vegetarian 94% (535) Africa (N=0) Europe and Central Asia (N=0) South Asia (N=16) India (11 urban, 2 rural, 1 mixed, 1 NR), Sri Lanka (1 rural) N studies 15 n participants 6246 Urban/Rural/Mixed 11 urban, 3 rural, 1 mixed Vegetarian % (n) 29% (1823) Non-vegetarian 59% (3676) East Asia & Pacific (N=0) Total (N=18) N studies 18 n participants 7181 Urban/Rural/Mixed 12 urban, 3 rural, 2 NR, 1 mixed Vegetarian % (n) 30% (2178) Non-vegetarian 59% (4218)

Diet & Eating Practices of Adolescents in LMIC
66
Social, Demographic, and Economic Context
Macronutrient Status and Urban/Rural Residence, Socioeconomic Status, and Gender Inequality When disaggregating data by factors more distal to the individual, including place of residence, country-level socioeconomic status, and gender inequality, we saw some striking differences in macronutrient intake. Protein, fat, and carbohydrate intake was lower among girls in rural areas (Appendix I, figures 3a and 3b). When considering macronutrient intake among low versus low-middle and upper-middle income countries, we saw a distinct linear trend whereby protein, fat, and carbohydrate intake increased alongside income level (Appendix I, figures 4a and 4b). To incorporate a measure of female empowerment, we sorted countries by their ranking on the GII (GII ranges from 0–1; higher GII values indicate greater disparities and inequalities between genders in that country) and disaggregated macronutrient intake based on GII quintiles (e.g., 0.100–0.199 to 0.5–0.599), because no country within the macronutrient analysis ranked higher than 0.6. There was no consistent pattern noted for carbohydrates (Appendix I, table 24), though the highest intakes were seen among those living in the most equitable countries with GII from 0.100–0.199. Protein intake was highest for adolescents who live in the most equitable countries (0.100–0.199) and protein intake was lowest for those in the most inequitable countries (0.5–0.599) (Appendix I, table 25). Fat intake ranged from 59 to 64 grams per day among the first and fourth quintiles (0.100-0.499), and was less for the fifth quintile (0.5-0.599) (Appendix I, table 26).
DISCUSSION Study Limitations There were several limitations to our study. Firstly, there was a lack of available nationally representative data on diet and eating practices of adolescents in LMIC. Therefore, we acknowledge the difficulty in interpreting how representative the data are for different populations within a given region. For example, studies among affluent urban African populations would presumably yield slightly different results from assessments among poor rural ones, and our data did not always capture this. Additionally, certain countries are over or under-represented within these regional analyses. For example, studies from Brazil, India, and China made up 71 percent, 81 percent, and 53 percent of the Latin America and the Caribbean, South Asia, and East Asia and the Pacific region analyses, respectively. In contrast, studies from countries in Europe and Central Asia were lacking in most analyses. We have attempted to minimize this limitation by providing a table and a map to show the various geographies that are captured by our data. Additionally, we have linked sample size to each of our results statements. The majority of studies were low quality (64 percent) or medium
67
quality (35 percent), based on small sample size, cross-sectional study design, purposive sampling and completeness and validity of data collected. Primary methods used to collect data on consumption also varied by study; as such, we have pooled data from 24-hour recalls, food frequency questionnaires, food records, and other methods (e.g., un-validated questionnaires created for the purpose of the primary study). A sensitivity analysis was conducted to determine whether the method of data collection had the potential to bias results, and we found no indication of this. We had to make several assumptions about traditional foods consumed because of lack of detailed information that was reported in the study. Generally, we classified these foods according to their main ingredient, though this varies by region and country. We found that we were unable to classify foods into staple foods or processed versus unprocessed foods, which we had initially set out to do. Doing so would rely heavily on context and would, in most cases, require seeking additional information that was not available within the studies themselves, such as information pertaining to purchasing and food/meal preparation. We also found inconsistent use of frequencies for food intake. To overcome this, we standardized intake categories into daily, two to three times per week, four to six times per week, monthly, or never, based on what was reported within the study. However, the majority of studies did not report on frequency of consumption, making it challenging to accurately compare how often a certain food was consumed across age groups and across regions. Many studies that investigated consumption habits of school children and adolescents did not disaggregate their data by sex. As such, a substantial amount of data had to be excluded from our analysis. We used the IOM guidelines to determine adequate/inadequate intake of macronutrients, though these standards are based on healthy adolescents and do not take into account underlying nutritional deficiencies that are common in LMIC settings. Additionally, it was challenging to interpret the relevance of our results on protein, fat, and energy intake, as many of the studies did not report this in relation to body size and activity at an individual level. Future studies that triangulate data on macronutrient and energy intake, diet, and physical activity would be beneficial. Our decision to look at macronutrient intake, but not micronutrient intake, was also pragmatic given data availability and some of the aforementioned considerations. Because of our interest in the nutrition transition, we focused on macronutrients to determine whether imbalances in fat, protein, or carbohydrate intake were aligned with consumption of certain foods or eating patterns. With further time and resources, investigating micronutrient deficiencies as they relate to dietary intake is an important next step and might require access to individual-level data. There were additional limitations when analyzing weight status of adolescents from the studies themselves. Several studies reported only mean BMI for the total study sample, which may have included a wide age range and did not allow us to disaggregate BMI by smaller age bands. The measure used in reporting BMI status also varied between studies (i.e., IOTF or CDC cutoff points). We came across many studies that did not mention which method, if any, was used
Diet & Eating Practices of Adolescents in LMIC
68
to classify their participants into weight status categories. For studies that did not disaggregate data by age and did not specify their reference cutoff points (e.g., BMI <16.5 or -2 SD), we were unable to re-categorize data according to WHO standards. Anthropometric measurements were not always taken for the total sample, limiting the units available for our analysis. In some cases, studies only reported on a single BMI outcome category (typically overweight), which may have led to overestimation. Finally, the majority of the included studies (almost 70 percent) were conducted in a school setting, hence limiting their extrapolation to practices and patterns at household level and their generalizability overall. This might have had important implications for meal patterns and choice. The remaining studies were community or regionally based (e.g., household sampling), meaning the study population was likely to be a mixture of girls who were in and out of school. Given that many girls in LMIC lack the opportunity to attend school, and many will drop out of school, future studies should be population based or use sampling methods that ensure that non-school going children and adolescents are also included in dietary intake assessments.
Study Implications This is the first large-scale systematic review to explore the current dietary intake and practices of adolescent girls from various low- and middle-income geographies. Our findings clearly depict some “Westernized” patterns that include consumption of processed, sugary, and high-fat items. Overall, we found that adolescent girls in LMIC have diets that are limited in diversity and typically do not meet global food-based dietary guidelines. On average, less than half of adolescent girls reported eating grains, dairy, fruits, and vegetables, and only about 60 percent consumed pulses. Even where fruits and vegetables are consumed daily, servings per day or portions are not sufficient to meet recommended intakes in most cases. We found that 90 percent of adolescent girls in South Asia did not consume an adequate diet of fruits or vegetables. Current consumption of flesh foods is high and may be replacing other important plant-based sources of protein. Intake of nuts and seeds, eggs, and fats and oils were underreported in the literature. Along with insufficient nutrient intakes due to diets lacking in fruits and vegetables, legumes, and dairy, calorie-rich foods, including sweet and salty items, SSBs, and fast foods, are popular among adolescent girls. Across all regions, these foods/beverages are being consumed regularly. Overall, consumption of sweet items among girls 10–19 was higher than consumption of grains, dairy, fruits and vegetables. We found that 74 percent and 49 percent of younger adolescents are consuming sweet and salty items, respectively, on a daily basis. Additionally, we found important regional variations in consumption; 40 percent of adolescents in Latin America and the Caribbean and 25 percent in South Asia are eating fast foods daily. Adolescent diets that are low in nutritious foods and high in processed and other energy-dense foods will have many direct and indirect impacts on health. The Global Burden of Disease (GBD), Injuries,

69
and Risk Factor study 2016 found that poor dietary habits are a leading risk factor for mortality, accounting for close to one in five deaths globally. P
245P From
the period 2006 to 2016, the percentage of deaths attributable to diet increased by 11.2 percent. Within specific components of diet, low fruit consumption, low whole grain intake, and high sodium were among the most important contributors. Additionally, GBD has shown that diets high in red meat, SSB, and low in milk, respectively accounted for the greatest increase in attributable deaths and disability-adjusted life years between 1990 and 2016. Considering our dietary intake findings, this places adolescent girls at serious risk. When looking at macronutrient and energy intake, we also found variations by region and by age. Based on IOM, protein intake was inadequate among older adolescents in Africa. Both fat and protein intake were higher among 10 to 14 year olds compared to older adolescents. Overall, fat intake was lowest for older adolescents living in South Asia and Africa. Similarly, energy intake overall (10–19 years) was lowest for girls living in South Asia (1494 kcal/day) and Africa (1585 kcal/day). When stratifying energy intake by place of residence, we found that girls residing in urban slums and rural regions had lower mean energy intake compared to those living in urban areas. Based on our analysis of underlying determinants, we noted some trends in macronutrient intake. For all macronutrients, average intake was highest among adolescents residing in upper middle-income countries. Additionally, there appear to be differences between urban and rural adolescents with urban girls achieving above the optimal macronutrient intake. Others have also shown increasing dual burden in urban areas where the food environment is more obesogenic. P
7, 246, 247P Taken together,
it would appear that nutrient requirements are not being met through dietary practices, and this has contributed to the dual burden of malnutrition that is driven by widespread micronutrient deficiencies and imbalanced macronutrient intakes. We found that meal patterns among adolescent girls tended to be fairly consistent across regions. Almost half the adolescent girls in LMIC do not eat three full meals per day; similar proportions were noted for adolescents who skip breakfast, with the exception of girls in South Asia (28 percent) and Latin America and the Caribbean (17 percent). Lunch is typically consumed away from home. Whether lunch is provided at school or purchased from school canteens/cafeterias or nearby vendors or food stalls, schools (and their surrounding perimeters) represent potential arenas to intervene with nutrition-specific programming or policy. Similarly, we found that many adolescents snack during school hours (mid-morning or mid-afternoon). The data indicate that there could be a potential link between skipping breakfast and snacking in the morning. Further studies are required to both quantify this link and elucidate the types of mid-morning snacks that are being consumed, to ascertain whether this snack could be considered breakfast for some girls. Our analysis has revealed that younger adolescents disproportionately consume meals away from the home compared to older adolescents. This finding warrants further investigation, especially if meals away from the home consist mainly of fast and convenient foods that are relatively accessible and inexpensive.
Diet & Eating Practices of Adolescents in LMIC
70
Although this systematic review included few studies representative of the overall population, the results of our analysis of BMI status by age are consistent with recent epidemiological trends.P
7P Overall, we found higher proportions of younger
girls to be overweight or obese than older girls. For example, in Latin America and the Caribbean, 50 percent of girls ages 10 to 14 years were overweight and 11 percent were obese, while only 14 percent and 6 percent of girls 15 to 19 years were overweight and obese, respectively. Similarly, in Europe and Central Asia, 17 percent of younger adolescents were overweight and 5 percent were obese, compared to 5 percent and 1 percent of older adolescents who were overweight and obese, respectively. This surge in overweight and obesity in the younger age group may reflect shifts in the LMIC food environment, including penetration of globalized and accessible chain restaurants and superstores, extensive marketing, and widespread mass media, P
248P which could adversely
affect dietary habits even before adolescence is reached. These findings should be interpreted with caution given that certain groups or regions might be under or overrepresented within our analyses. For instance, these trends contrast with recent findings from The Gambia, P
249P where, as one
might expect, younger adolescents were notably lighter and leaner than their older counterparts. The fact that this study was conducted only in rural areas could account for some of these differences. Harmonizing methods will require standardized definitions for investigating childhood overweight and obesity, along with a consensus on age ranges and related terminology. P
250P
Ng and colleagues have demonstrated that nutritional status has shifted over time, with reductions in the prevalence of underweight, and shifts from normal weight to overweight and obese in both developed and developing countries. P
251P
Another recent, pooled analysis from the NCD Risk Factor Collaboration (NCD-RisC) looked at global trends in BMI for children ages 5–19 years, and has presented slightly different results from Ng.P
7P Though authors similarly conclude
that overweight and obesity is continuing to rise in LMIC, they also stress that the number of children who are moderately or severely underweight surpasses the number who are obese. We too found that underweight is still widely prevalent among adolescent girls. For example, in Europe and Central Asia we found that nearly 20 percent of adolescent girls (10–19) were underweight and in South Asia, this number reaches 40 percent. Though estimates of underweight are slightly smaller, NCD-RisC has found similar regional trends. Specifically, authors report that 63 percent of the 75 million moderately and severely underweight girls worldwide reside in South Asia. Taken together, these statistics highlights the double burden of malnutrition that is becoming increasingly evident in LMIC today, and the urgent need to focus on specific regions, like South Asia. When comparing younger and older adolescents across all outcomes (table 24), some distinct patterns emerge. Younger adolescents had a slightly greater mean energy intake, and higher daily intakes of fat and protein compared to older adolescents. Although we do not have physical expenditure data, one could assume that these higher intakes are contributing to the inflated proportion of
71
young adolescents who are overweight and obese. These findings align with dietary patterns among younger adolescents, which demonstrate higher consumption of calorie-dense foods, including fast foods and sweet and salty/fried items, and low consumption of nutritious foods like fruits and vegetables compared to older adolescents. In terms of meal patterns, we found that older adolescents are more likely to eat meals away from the home on a daily basis and, for all adolescents, lunch is the meal most often consumed outside the home. However, it is challenging to accurately interpret results on place of consumption considering that most of the adolescents sampled were school-going and it is therefore reasonably likely that girls consume their lunch at school. For the majority of studies, we were not able to determine whether girls who consume their lunch at school bring food from home or purchase food at school or from nearby shops/vendors. While snacking appears to be more common among older adolescents, we found that breakfast skipping is typical at any age. Whether snacking is replacing regular meals for adolescents remains to be determined.

Diet & Eating Practices of Adolescents in LMIC
72
Table 24. Summary Comparing Younger ( 10–14) and Older (15–19) Adolescents across Various Outcomes BMI BMI status Energy
Intake Carbohydrate Protein Fat POC Breakfast
skipping Snacking
10–14y 18.6 ±2.9 Severely thin: 0.5% Thin: 11% Normal: 63% Overweight: 16% Obese: 9%
1844 kcal/d
249 g/d 61 g/d
64 g/d
11% eat outside the home daily
40% 33%
15–19y 20.1 ±3.4 Severely thin: 0.3% Thin: 11% Normal: 70% Overweight: 14% Obese: 5%
1834 kcal/d
253 g/d
58 g/d
53 g/d
20% eat outside the home daily
47% 59%
Pulses Dairy Flesh foods Vegetables Fruit SSB Sweet and
salty items Fast foods Alcohol
10–14y Consumption was lower for most regions
10% consumed dairy daily
In MENA, Africa, and SA, intake was higher
33% consumed vegetables daily
32% consumed fruit; of these, 42% consumed them daily
21% consumed SSBs
74% and 49% consumed sweet and salty items daily
24% consumed FF daily, and 20% consumed FF on ≥ 4 days/week
13% consumed alcohol
15–19y Higher consumption (except in LAC)
60% consumed dairy daily
Intake was higher in EAP and EUR/CA
53% consumed vegetables daily
56% consumed fruit; of these, 49% consumed them daily
35% consumed SSBs
31% and 1% consumed sweet and salty items daily
8% consumed FF daily, and 29% consumed FF on ≥ 4 days/week
20% consumed alcohol
LAC=Latin America and the Caribbean; MENA=Middle East and North Africa; SA=South Asia; EAP=East Asia & Pacific; EUR/CA=Europe and Central Asia; SSB=sugar sweetened beverages; FF=fast foods
73
Eating patterns, diet quality, and physical activity levels are important predictors of obesity, indicating that social and environmental factors may outweigh genetic predispositions. P
212, 252, 253P We found that increased consumption of fast foods and
the proportion of adolescents who are overweight and obese were positively associated in our study sample, though results were not statistically significant. There were several limitations to this analysis that likely contributed to this null finding, including small sample size and a lack of specificity in the characterization of fast foods. Nevertheless, the trend suggests a linear association. Other studies from high-income settings have convincingly demonstrated this association, P
254-256P pointing to the reduction of fast food intake a
as priority area for policy and programming. These data have many important implications for adolescent girls who will become pregnant. Pregnancy in adolescence is associated with greater risks for anemia, prematurity, stillbirth, and mortality.P
257P Adolescent girls are two to five
times more likely to die from a pregnancy-related cause than women ages 20 to 29 years old. P
257P These risks are compounded by increase in overweight and
obesity—risk factors linked to chronic diseases, including hypertension, diabetes, and cardiovascular disease. In fact, results from GBD studies have reported increases in fasting plasma glucose, mean total cholesterol, mean blood pressure, and an increased prevalence of type 2 diabetes in LMIC.P
258-260P As
such, pregnancy in adolescence has become even more risky due to the exacerbation of pregnancy complications by underlying chronic diseases. For many, appropriate management throughout gestation, labor, and delivery will be critical. Though the impact of weight normalization on adolescent pregnancy has not been quantified, achieving normal weight and improving diet quality are two critical nutrition goals for the preconception period. Other recent studies in the field of diet and nutrition have shown comparable findings. A cross-cohort comparison of adolescents’ diets found changes consistent with the nutrition transition among the younger cohort, including increased consumption of sugar, processed foods, dairy and other animal-source foods at the expense of plant-based foods that are high in protein. P
261P A 2014
review looking at dietary intake of school-aged children and adolescents in developing countries also found an increase in the consumption of energy-dense foods that contribute to overweight and obesity, with an overall lack in dietary diversity and inadequate nutrient intake. P
247P This same study noted that breakfast
skipping was common among children and adolescents, P
247P a finding that has
negative implications for learning and achievement, and potentially, for policymakers. The evidence for the impact of school breakfast programs in LMIC is limited but highlights some important findings. A randomized control trial conducted in Jamaica saw improvements in height, weight, school attendance, and arithmetic following the provision of breakfast, though these benefits were realized only for students who were undernourished at baseline. P
262P Similarly, a
crossover study conducted in Jamaica found that verbal fluency was improved with breakfast in the undernourished group only. P
263P Among students from rural
schools in Peru, vocabulary was significantly better among heavier children. P
264P
Diet & Eating Practices of Adolescents in LMIC
74
The authors suggest that initially, heavier children were more malnourished (had higher weight-for-height scores) and performed worse on tests, indicating that their potential to respond to feeding programmes was greater than those who were not malnourished at baseline. Another study in South Africa compared children from two matched schools, where breakfast was provided in one school but not the other.P
265P Results demonstrated improved cognitive and behavioral
performance, including positive peer interaction and class participation among children who were given breakfast. Recent findings from high-income settings are mixedP
266-268P and suggest improved enrolment and reduced absenteeism,
though less robust links to health and nutrition outcomes with breakfast provision. Taken together, it appears that breakfast programs might be beneficial in LMIC, where malnutrition is high. More long-term RCTs are needed in developing countries to determine how age and nutrition status at baseline may affect the impacts of school breakfast programs. Although the nutrition transition has been long underway, P
269P few countries have
taken measures to stem the negative changes that are rapidly taking place. Support can be garnered from global initiatives, such as the Global Accelerated Action for the Health of Adolescents (AA-HA!), which provides a range of recommended actions and interventions for improving adolescent health. P
270P
Additionally, there are tools that are specific to the promotion of healthy diets and reduction of obesity and NCD. For example, the WHO ECHO report provides nine recommendations to promote healthy diets and minimize the intake of unhealthy foods and SSBs. P
271P These include recommendations such as taxing
SSBs, reducing the exposure of children to marketing of unhealthy foods, developing a standardized global nutrient labeling system, ensuring that certain settings (e.g., child-care) are incentivized to create healthy food environments, and improving access to healthy foods for disadvantaged populations. P
271P
The NOURISHING framework highlights areas for evidence-based action across the domains of the food environment, food system, and behavior change communication. P
272P The NOURISHING framework is accompanied by a policy
database, where one can find a regularly updated list of implemented policies to promote healthy diets, by country.P
272P Such a list is important to highlight gaps in
policy and programmatic areas for a specific country. Overweight and obesity in childhood or adolescence is an increasing concern, both because of its growing prevalence and its important link to NCDs. Moving forward, it is clear that mutli-sectoral efforts will be required, through the work of global bodies, policymakers, civil society, and researchers, to improve undernutrition, reduce obesity, and combat chronic disease.
RECOMMENDATIONS Although we did not conduct a systematic research prioritization exercise, our review provides insights into gaps in the current evidence. The following are some key research areas that might help to better understand diets and food systems among school-age children and adolescents in various settings. One
75
priority is the need to conduct a global and regionally representative standardized survey of school-age and adolescent nutrition status and food environments. Following the list of research gaps, we have provided policy and implementation recommendations.
RESEARCH o Multi-country or global survey on adolescent diet and nutrition
o Incorporates consistent definitions, indicators, and measurementtools to allow better pooling of data
o Clearly defines younger and older adolescents, and includes boyso Sufficiently powered to capture various populations:
Rural, urban, and urban poor populations In-school and out-of-school adolescents Pregnant adolescents Displaced adolescents Adolescents in conflict zones
o Understanding the underlying determinants of dietary intake and foodchoice at the individual, household, community, and national level
o The role of media and information sources in impacting adolescentbehaviors
o Qualitative researcho Randomized controlled trials
o Comparing impact of interventions (e.g., marketing, legislative orother) on dietary patterns and intake between areas withobesogenic food environments and those without
o Including behavior change communication interventions to improveadolescents’ diets, including those that take into accountadolescents’ values and motivationsP
273P
o Local and international research and collaboration in the area of dietarypractices
POLICY o Contextually-relevant, healthy school policies and/or regulations. For
example:o School-feeding or school-meal programs for low income areaso Incentivizing cafeteria or tuck shop vendors to provide healthier
retail environmentso Limiting the number of vendors or food stalls that sell cheap,
nutrient-poor and energy-dense products on school groundso Food advertisement regulation
IMPLEMENTATION o Obesity-prevention initiatives (including physical activity components)
targeted toward school-age childreno Program designs that take into account adolescents’ behavior and
common practices (e.g., breakfast skipping and snacking)
Diet & Eating Practices of Adolescents in LMIC
76
o Engaging adolescents themselves in the adolescent agendao In research, programming, and policy initiatives
CONCLUSIONS Our review provides further evidence from studies in LMIC that the nutrition transition is occurring at a global scale and that, while regional differences exist, the diet quality and diversity of adolescent girls in LMIC is generally poor. Not enough girls are consuming nutritious foods like plant-sourced proteins, milk, healthy fats, and fruits and vegetables, and processed, sugary, and other calorie-dense foods are being added to usual diets. These factors are contributing to the rise in overweight and obesity, especially among younger adolescents. On the other hand, the diets of some adolescent girls lack adequate protein and many girls are underweight, especially in South Asia and Africa, highlighting the prevailing double burden of malnutrition. Taken together, more action is needed. The specific interventions and timing of such strategies need to be defined. Considering that behaviors and habits have already formed by early adolescence, targeted nutrition interventions for school-age children are needed to reverse current dietary trends. A multi-sectoral effort should be encouraged, whereby regulated food systems, nutrition policies, and educational initiatives are put in place to promote healthy diets and protect young girls throughout their reproductive years. Additionally, context-specific programming will be fundamental to manage the double burden of malnutrition prevalent in many LMIC.
ACKNOWLEDGEMENTS We would like to acknowledge the support and feedback provided by members of USAID-supported SPRING project’s technical advisory group (TAG). TAG members include: Jeniece Alvey, Gilles Bergeron, Gwyneth Cotes, Luz Maria De-Regil, Marcia Griffiths, Laura Itzkowitz, Peggy Koniz-Booher, Roland Kupka, Sascha Lamstein, Chessa Lutter, Rafael Perez-Escamilla, Abigail Kaplan Ramage, Maria Pura Solon, and Florencia Vasta. This report is made possible by the generous support of the American people through the United States Agency for International Development (USAID) under the terms of the Cooperative Agreement AID-OAA-A-11-00031, SPRING, managed by JSI Research & Training Institute, Inc. (JSI). The contents are the responsibility of JSI and do not necessarily reflect the views of USAID or the U.S. Government.
77
REFERENCES
1. Bhutta ZA, Lassi ZS, Bergeron G, Koletzko B, Salam R, Diaz A, et al.Delivering an action agenda for nutrition interventions addressing adolescent girls and young women: priorities for implementation and research. Ann N Y Acad Sci. 2017;1393(1):61–71. 2. The Maternal and Child Nutrition Study Group. Maternal and ChildNutrition: Executive Summary of The Lancet Maternal and Child Nutrition Series. The Lancet. 2013;382(9890). 3. Black RE, Victora CG, Walker SP, Bhutta ZA, Christian P, de Onis M, etal. Maternal and child undernutrition and overweight in low-income and middle-income countries. Lancet. 2013;382(9890):427–51. 4. Stevens GA, Finucane MM, De-Regil LM, Paciorek CJ, Flaxman SR,Branca F, et al. Global, regional, and national trends in haemoglobin concentration and prevalence of total and severe anaemia in children and pregnant and non-pregnant women for 1995-2011: a systematic analysis of population-representative data. Lancet Glob Health. 2013;1(1):e16–25. 5. Andersson M, Karumbunathan V, Zimmermann MB. Global iodine statusin 2011 and trends over the past decade. J Nutr. 2012;142(4):744–50. 6. Akseer N, Al-Gashm S, Mehta S, Mokdad A, Bhutta ZA. Global andregional trends in the nutritional status of young people: a critical and neglected age group. Ann N Y Acad Sci. 2017;1393(1):3–20. 7. NCD Risk Factor Collaboration (NCD-RisC). Worldwide trends in body-mass index, underweight, overweight, and obesity from 1975 to 2016: a pooled analysis of 2416 population-based measurement studies in 128.9 million children, adolescents, and adults. The Lancet. 2017. 8. Institute for Health Metrics and Evaluation. Global burden of diseasestudy, 2015. 2016. 9. Khara T, Mates E. Adolescent nutrition: policy and programming in SUN+countries. London: Save the Children; 2015. 10. Catalano PM, Ehrenberg HM. The short- and long-term implications ofmaternal obesity on the mother and her offspring. BJOG. 2006;113(10):1126–33. 11. Dodd JM, Grivell RM, Nguyen AM, Chan A, Robinson JS. Maternal andperinatal health outcomes by body mass index category. Aust N Z J Obstet Gynaecol. 2011;51(2):136–40. 12. Independent Accountability Panel for Every Woman, Every Child, EveryAdolescent. Transformative accountability for adolescents: accountability for the health and human rights of women, children and adoelscents in the 2030 agenda Geneva: World Health Organization; 2017. Contract No.: Licence: CC BY-NC-SA 3.0 IGO.
Diet & Eating Practices of Adolescents in LMIC
78
13. Hozo SP, Djulbegovic B, Hozo I. Estimating the mean and variance fromthe median, range, and the size of a sample. BMC Med Res Methodol. 2005;5:13. 14. WHO. World Health Organization Child Growth Standards World HealthOrganization; 2007 [Available from: 35Thttp://www.who.int/childgrowth/en/35T. 15. Institute of Medicine. Dietary Reference Intakes for Energy, Carbohydrate,Fat, Fatty Acids, Cholesterol, Protein, and Amino Acids . Washington, D.C.: World Health Organization 2017; 2005. 16. FAO and FHI 360. Minimum Dietary Diversity for Women: A Guide forMeasurement. Rome: FAO; 2016. 17. Friel S, Hattersley L, Snowdon W, Thow AM, Lobstein T, Sanders D, et al.Monitoring the impacts of trade agreements on food environments. Obes Rev. 2013;14 Suppl 1:120–34. 18. WHO. Diet, nutrition and the prevention of chronic diseaes: report of ajoint WHO/FAO expert consultation. Geneva; 2003. 19. United Nations Development Programme. Human Development Report2016. 2016. 20. Higgins J, Green S. Cochrane Handbook for Systematic Reviews ofInterventions Version 5.1.0 [updated March 2011]: The Cochrane Collaboration 2011. Available from: 35Thttp://www.cochrane-handbook.org 35T. 21. National Institute of Health. Study Quality Assessment Tools U.S.Department of Health & Human Service [Available from: 35Thttps://www.nhlbi.nih.gov/health-topics/study-quality-assessment-tools35T. 22. Dapi LN, Hornell A, Janlert U, Stenlund H, Larsson C. Energy and nutrientintakes in relation to sex and socio-economic status among school adolescents in urban Cameroon, Africa. Public Health Nutrition. 2011;14(5):904–13. 23. Freese R, Korkalo L, Vessby B, Tengblad S, Vaara EM, Hauta-alus H, etal. Essential fatty acid intake and serum fatty acid composition among adolescent girls in central Mozambique. British Journal of Nutrition. 2015;113(7):1086–95. 24. Mutanen M, Freese R, Vessby B, Korkalo L, Selvester K, Kulathinal S.Determinants of plasma phospholipid arachidonic and docosahexaenoic acids among adolescent girls in central Mozambique - possible roles of iron and zinc. Prostaglandins Leukotrienes & Essential Fatty Acids. 2016;115:1–7. 25. Ayele E, Berhan Y. Age at menarche among in-school adolescents inSawla Town, South Ethiopia. Ethiopian Journal of Health Sciences. 2013;23(3):189–200. 26. Feeley AB, Musenge E, Pettifor JM, Norris SA. Investigation intolongitudinal dietary behaviours and household socio-economic indicators and their association with BMI Z-score and fat mass in South African adolescents: the Birth to Twenty (Bt20) cohort. Public Health Nutrition. 2013;16(4):693–703.
79
27. Henry-Unaeze HN, Okonkwo CN. Food consumption pattern and calciumstatus of adolescents in Nnewi, Nigeria. Pakistan Journal of Nutrition. 2011;10(4):317–21. 28. Musaiger AO, Nabag FO, Al-Mannai M. Obesity, Dietary Habits, andSedentary Behaviors Among Adolescents in Sudan: Alarming Risk Factors for Chronic Diseases in a Poor Country. Food & Nutrition Bulletin. 2016;37(1):65–72. 29. Onabanjo OO, Balogun OL. Anthropometric and iron status of adolescentsfrom selected secondary schools in Ogun State, Nigeria. ICAN: Infant, Child & Adolescent Nutrition. 2014;6(2):109–18. 30. Dong H, Yan Y, Liu J, Zhao X, Cheng H, Hou D, et al. Alarming trends inideal cardiovascular health among children and adolescents in Beijing, China, 2004 to 2014. International Journal of Cardiology. 2017;231:264–70. 31. Li J, Liu H, Beaty TH, Chen H, Caballero B, Wang Y. Heritability ofchildren's dietary intakes: A population-based twin study in China. Twin Research and Human Genetics. 2016;19(5):472–84. 32. Shikanai S, Koung Ry L, Takeichi H, Emiko S, San P, Sarukura N, et al.Sugar intake and body weight in Cambodian and Japanese children. Journal of Medical Investigation. 2014;61(1-2):72–8. 33. Sun C, Wang H, Wang D, Chen Y, Zhao Y, Xia W. Using an FFQ toassess intakes of dietary flavonols and flavones among female adolescents in the Suihua area of northern China. Public Health Nutrition. 2015;18(4):632–9. 34. Xia W, Sun C, Zhang L, Zhang X, Wang J, Wang H, et al. Reproducibilityand relative validity of a food frequency questionnaire developed for female adolescents in Suihua, North China. PLoS ONE [Electronic Resource]. 2011;6(5):e19656. 35. Ye YL, Wang PG, Qu GC, Yuan S, Phongsavan P, He QQ. Associationsbetween multiple health risk behaviors and mental health among Chinese college students. Psychology Health & Medicine. 2016;21(3):377–85. 36. Zhang J, Xue H, Cheng X, Wang Z, Zhai F, Wang Y, et al. Influence ofproximities to food establishments on body mass index among children in China. Asia Pacific Journal of Clinical Nutrition. 2016;25(1):134–41. 37. Zhu Y, Shao Z, Jing J, Ma J, Chen Y, Li X, et al. Body Mass Index IsBetter than Other Anthropometric Indices for Identifying Dyslipidemia in Chinese Children with Obesity. PLoS ONE [Electronic Resource]. 2016;11(3):e0149392. 38. Thompson-McCormick JJ, Thomas JJ, Bainivualiku A, Khan AN, BeckerAE. Breakfast skipping as a risk correlate of overweight and obesity in school-going ethnic Fijian adolescent girls. Asia Pacific Journal of Clinical Nutrition. 2010;19(3):372–82. 39. Wang L, Zhang Z, Chang Y, Wang X, Hou M, Wei J, et al. Comparison ofdietary habits between migrant and local adolescents in Shenzhen, China. Asia Pacific Journal of Clinical Nutrition. 2011;20(4):624–31.
Diet & Eating Practices of Adolescents in LMIC
80
40. Abdullah N-f, Teo P, Huybrechts I, Foo L. Infrequent breakfast consumption is associated with higher body adiposity and abdominal obesity in Malaysian school-aged adolescents. PLoS ONE [Electronic Resource]. 2013;8(3). 41. Cynthia J, Zalilah MS, Lim MY. Meals away from home and nutritional status of adolescents 25 relationship between family meals away from home and nutritional status of adolescents. Malaysian Journal of Nutrition. 2013;19(1):25–35. 42. Gao Y, Li LP, Kim JH, Congdon N, Lau J, Griffiths S. The impact of parental migration on health status and health behaviours among left behind adolescent school children in China. BMC Public Health. 2010;10:56. 43. Guo X, Zheng L, Li Y, Zhang X, Yu S, Yang H, et al. Prevalence and risk factors of being overweight or obese among children and adolescents in northeast China. Pediatric Research. 2013;74(4):443–9. 44. Gonzalez-Suarez CB, Lee-Pineda K, Caralipio ND, Grimmer-Somers K, Sibug EO, Velasco ZF. Is what Filipino children eat between meals associated with body mass index? Asia-Pacific Journal of Public Health. 2015;27(2):NP650-61. 45. Gonzalez-Suarez CB, Lee-Pineda K, Zamora MTG, Sibug EO, Velasco ZF, Grimmer-Somers K. Cardiovascular fitness and caloric intake in Filipino obese children: an observational study. Asian Journal of Clinical Nutrition. 2012;4(3):88–97. 46. Seo DC, Niu J. Trends in underweight and overweight/obesity prevalence in Chinese youth, 2004-2009. International Journal of Behavioral Medicine. 2014;21(4):682–90. 47. Zarei M, Msl H, Mohd Taib MN, Zarei F. Nutritional status of adolescents attending the Iranian secondary school in Kuala Lumpur, Malaysia. Global Journal of Health Science. 2014;6(6):185–97. 48. Zhang C, Chen Y, Chen W, Su Y, Wang C, Wu J. Food group intake among adolescents in Guangzhou city compared with the Chinese dietary guidelines. Asia Pacific Journal of Clinical Nutrition. 2012;21(3):450–6. 49. Cao M, Zhu Y, He B, Yang W, Chen Y, Ma J, et al. Association between sleep duration and obesity is age- and gender-dependent in Chinese urban children aged 6-18 years: a cross-sectional study. BMC Public Health. 2015;15:1029. 50. Borici S, Agaoglu NB, Baykan OA, Agirbasli M. Blood pressure and anthropometric measurements in Albanian versus Turkish children and adolescents. Acta Cardiologica. 2009;64(6):747–54. 51. Akbulut G, Yildirim M, Sanlier N, van Stralen MM, Acar-Tek N, Bilici S, et al. Comparison of energy balance-related behaviours and measures of body composition between Turkish adolescents in Turkey and Turkish immigrant adolescents in the Netherlands. Public Health Nutrition. 2014;17(12):2692–9.
81
52. Djordjevic-Nikic M, Dopsaj M. Characteristics of eating habits and physical activity in relation to body mass index among adolescents. Journal of the American College of Nutrition. 2013;32(4):224–33. 53. Giannopoulou D, Grammatikopoulou MG, Poulimeneas D, Maraki M, Dimitrakopoulos L, Tsigga M. Nutritional Surveillance of Christian Orthodox Minority Adolescents in Istanbul. Journal of Immigrant & Minority Health. 2017;19(2):333–40. 54. Erenoglu N, Ayranci U, Son O. Eating habits and lifestyle in a group Turkish primary education children. Health (1949-4998). 2013;5(3):486–95. 55. Hirschler V, Oestreicher K, Beccaria M, Hidalgo M, Maccallini G. Inverse association between insulin resistance and frequency of milk consumption in low-income argentinean school children. Journal of Pediatrics. 2009;154(1):101–5. 56. Tijerina-Saenz A, Martinez-Garza NE, Ramirez-Lopez E, Solis-Perez E, Martinez-Baez AZ. Iron status and dietary intakes of iron in normal-weight and obese young Mexican women. Nutricion Hospitalaria. 2015;31(6):2412–8. 57. Barbosa-Cortes L, Villasis-Keever MA, Del Prado-Manriquez M, Lopez-Alarcon M. Adiposity and Insulin Resistance in Children from a Rural Community in Mexico. Archives of Medical Research. 2015;46(3):214–20. 58. Enes CC, Slater B. Dietary intake of adolescents compared with the Brazilian Food Guide and their differences according to anthropometric data and physical activity. Revista Brasileira de Epidemiologia. 2015;18(4):798–808. 59. Forero-Bogota MA, Ojeda-Pardo ML, Garcia-Hermoso A, Correa-Bautista JE, Gonzalez-Jimenez E, Schmidt-RioValle J, et al. Body Composition, Nutritional Profile and Muscular Fitness Affect Bone Health in a Sample of Schoolchildren from Colombia: The Fuprecol Study. Nutrients. 2017;9(2):03. 60. Leme AC, Lubans DR, Guerra PH, Dewar D, Toassa EC, Philippi ST. Preventing obesity among Brazilian adolescent girls: Six-month outcomes of the Healthy Habits, Healthy Girls-Brazil school-based randomized controlled trial. Preventive Medicine. 2016;86:77–83. 61. Mendez RO, Galdamez K, Grijalva MI, Quihui L, Garcia HS, de la Barca AM. Effect of micronutrient-fortified milk on zinc intake and plasma concentration in adolescent girls. Journal of the American College of Nutrition. 2012;31(6):408–14. 62. Azadbakht L, Hajishafiee M, Golshahi J, Esmaillzadeh A. Snacking Behavior and Obesity among Female Adolescents in Isfahan, Iran. Journal of the American College of Nutrition. 2016;35(5):405–12. 63. Bahreynian M, Paknahad Z, Maracy MR. Major dietary patterns and their associations with overweight and obesity among Iranian children. International Journal of Preventive Medicine. 2013;4(4):448–58. 64. Hamrani A, Mehdad S, El Kari K, El Hamdouchi A, El Menchawy I, Belghiti H, et al. Physical activity and dietary habits among Moroccan adolescents. Public Health Nutrition. 2015;18(10):1793–800.
Diet & Eating Practices of Adolescents in LMIC
82
65. Mirkarimi K, Mansourian M, Kabir MJ, Ozouni-Davaji RB, Eri M, Hosseini SG, et al. Fast food consumption behaviors in high-school students based on the Theory of Planned Behavior (TPB). International Journal of Pediatrics. 2016;4(7):2131–42. 66. Shafiee S, Mesgarani M, Begum K. Assessment of nutritional status among adolescent boys in an urban population of South India. Global Journal of Health Science. 2015;7(3):335–44. 67. Abu-Mweis SS, Tayyem RF, Bawadi HA, Musaiger AO, Al-Hazzaa HM. Eating habits, physical activity, and sedentary behaviors of Jordanian adolescents' residents of Amman. Mediterranean Journal of Nutrition and Metabolism. 2014;7(1):67–74. 68. Alizadeh M, Didarloo A, Esmaillzadeh A. Dietary Patterns of Young Females and Their Association With Waist Circumference as a Health Index in Northwest of Iran, 2007. Iranian Red Crescent Medical Journal. 2015;17(5):e17594. 69. Azadbakht L, Haghighatdoost F, Esmaillzadeh A. White Rice Consumption, Body Mass Index, and Waist Circumference among Iranian Female Adolescents. Journal of the American College of Nutrition. 2016;35(6):491–9. 70. El-Qudah JM. Food habits and physical activity patterns among Jordanian adolescents aged 11–18 years. World Applied Sciences Journal. 2014;29(10):1213–9. 71. Allioua M, Djaziri R, Mahdad MY, Gaouar SBS, Derradji H, Boudjemaa BM, et al. Dietary fat intake, micronutrient and obesity among adolescent in Tlemcen (western Algeria). Food and Nutrition Sciences. 2015;6(10):860–8. 72. Heydari ST, Ahmadi SM, Lankarani KB, Joulaei H, Hoseinzadeh A. Relationship between energy, macronutrient and micronutrient consumption with obesity among school aged students in Shiraz, Fars. Shiraz E Medical Journal. 2013;14(3). 73. Mirhosseini NZ, Yusoff NA, Shahar S, Parizadeh SM, Mobarhen MG, Shakery MT. Prevalence of the metabolic syndrome and its influencing factors among adolescent girls in Mashhad, Iran. Asia Pacific Journal of Clinical Nutrition. 2009;18(1):131–6. 74. Musaiger AO, Al-Mufty BA, Al-Hazzaa HM. Eating habits, inactivity, and sedentary behavior among adolescents in Iraq: sex differences in the hidden risks of noncommunicable diseases. Food & Nutrition Bulletin. 2014;35(1):12–9. 75. Rouhani MH, Mirseifinezhad M, Omrani N, Esmaillzadeh A, Azadbakht L. Fast Food Consumption, Quality of Diet, and Obesity among Isfahanian Adolescent Girls. Journal of Obesity. 2012;2012:597924. 76. Rafraf M, Hasanabad SK, Jafarabadi MA. Vitamin D status and its relationship with metabolic syndrome risk factors among adolescent girls in Boukan, Iran. Public Health Nutrition. 2014;17(4):803–9.
83
77. Salameh P, Barbour B, Issa C, Rachidi S. Obesity associated behavior in adolescents of private schools in Lebanon. Journal Medical Libanais - Lebanese Medical Journal. 2011;59(4):179–90. 78. Tayyem RF, Al-Hazzaa HM, Abu-Mweis SS, Bawadi HA, Hammad SS, Musaiger AO. Dietary habits and physical activity levels in Jordanian adolescents attending private versus public schools. Eastern Mediterranean Health Journal. 2014;20(7):416–23. 79. Vakili M, Abedi P, Sharifi M, Hosseini M. Dietary diversity and its related factors among adolescents: a survey in Ahvaz-Iran. Global Journal of Health Science. 2013;5(2):181–6. 80. Goel S, Kaur T, Gupta M. Increasing proclivity for junk food among overweight adolescent girls in District Kurukshetra, India. International Research Journal of Biological Sciences. 2013;2(3):80–4. 81. Gupta N, Kochar GK. Pervasiveness of anemia In adolescent girls of low socio-economic group of The District Of Kurukshetra (Haryana). Internet Journal of Nutrition & Wellness. 2009;7(1). 82. Kabir Y, Shahjalal HM, Saleh F, Obaid W. Dietary pattern, nutritional status, anaemia and anaemia-related knowledge in urban adolescent college girls of Bangladesh. Journal of the Pakistan Medical Association. 2010;60(8):633–8. 83. Ranathunga RMTK, Silva KDRR, Balasuriya KN, Sivakanesan R, Mahawithanage STC. Calcium intake and bone mineral variables among adolescent schoolgirls in rural and urban areas of Sri Lanka. Tropical Agricultural Research. 2009;20:143–54. 84. Sanwalka NJ, Khadilkar AV, Mughal MZ, Sayyad MG, Khadilkar VV, Shirole SC, et al. A study of calcium intake and sources of calcium in adolescent boys and girls from two socioeconomic strata, in Pune, India. Asia Pacific Journal of Clinical Nutrition. 2010;19(3):324–9. 85. Tupe R, Chiplonkar SA, Kapadia-Kundu N. Influence of dietary and socio-demographic factors on the iron status of married adolescent girls from Indian urban slums. International Journal of Food Sciences & Nutrition. 2009;60(1):51–9. 86. Tupe RP, Chiplonkar SA. Zinc supplementation improved cognitive performance and taste acuity in Indian adolescent girls. Journal of the American College of Nutrition. 2009;28(4):388–96. 87. Beena S, Idris MZ, Savita J, Reema K, Ashutosh S. Nutrient intake among school going adolescent girls in Lucknow district, India. Journal of Biomedical and Pharmaceutical Research. 2013;2(4):20–5. 88. Rathnayake KM, Roopasingam T, Wickramasighe VP. Nutritional and behavioral determinants of adolescent obesity: a case-control study in Sri Lanka. BMC Public Health. 2014;14:1291.
Diet & Eating Practices of Adolescents in LMIC
84
89. Tupe R, Chiplonkar SA. Diet patterns of lactovegetarian adolescent girls:need for devising recipes with high zinc bioavailability. Nutrition. 2010;26(4):390–8. 90. Islam, R.,, Hoque M. Perception and practice of food habit and nutritionalstatus of adolescent girls: a comparative study between garment workers and school going girls. Journal of Natural Sciences Research. 2015;5:88–97. 91. Rifat uz Z, Iqbal Z, Ali U. Dietary intakes of urban adolescents of Sialkot,Pakistan do not meet the standards of adequacy. Pakistan Journal of Nutrition. 2013;12(5):460–7. 92. Sadia M, Tabinda Z, Suresh K, Khan SA. Prevalence of malnutritionamong adolescent girls: a study of public sector colleges of Islamabad. Pakistan Journal of Public Health. 2016;6(1):23–7. 93. Madhuri T, Sanghamitra P, Dash AK, Nikhat Y, Siddiqui ARO, Sarada T.Comparison of the body composition parameters in the adolescent medical and paramedical students in South India. International Journal of Medical Science and Public Health. 2016;5(4):610–4. 94. Vijayeta P. Knowledge regarding anaemia among adolescent girls ofKeonjhar city, Odisha. International Journal of Medical Sciences. 2016;9(1):27–32. 95. Chiplonkar S, Khadilkar A, Pandit-Agrawal D, Kawade R, Kadam N,Ekbote V, et al. Influence of micronutrient status and socioeconomic gradient on growth indices of 2-18-year-old Indian girls. Journal of Pediatric Endocrinology & Metabolism. 2013;26(9-10):825–32. 96. Feeley A, Pettifor JM, Norris SA. Fast-food consumption among 17-year-olds in the Birth to Twenty cohort. SAJCN South African Journal of Clinical Nutrition. 2009;22(3):118–23. 97. Napier CE, Hlambelo N. Contribution of school lunchboxes to the dailyfood intake of adolescent girls in Durban. SAJCH South African Journal of Child Health. 2014;8(2):59–63. 98. Odunaiya NA, Louw QA, Grimmer KA. Are lifestyle cardiovascular diseaserisk factors associated with pre-hypertension in 15-18 years rural Nigerian youth? A cross sectional study. BMC Cardiovascular Disorders. 2015;15:144. 99. Onyiriuka AN, Umoru DD, Ibeawuchi AN. Weight status and eating habitsof adolescent Nigerian urban secondary school girls. SAJCH South African Journal of Child Health. 2013;7(3):108–12. 100. Teji K, Dessie Y, Assebe T, Abdo M. Anaemia and nutritional status of adolescent girls in Babile District, Eastern Ethiopia. The Pan African medical journal. 2016;24:62. 101. van den Berg VL, Seheri L, Raubenheimer J. Body mass index of 16-year olds in urban Maseru, Lesotho. African journal of primary health care & family medicine. 2014;6(1):E1–E14.
85
102. Roba AC, Gabriel-Micheal K, Zello GA, Jaffe J, Whiting SJ, Henry CJ. A low pulse food intake may contribute to the poor nutritional status and low dietary intakes of adolescent girls in rural southern Ethiopia. Ecology of Food & Nutrition. 2015;54(3):240–54. 103. Roba KT, Abdo M, Wakayo T. Nutritional status and its associated factors among school adolescent girls in Adama city, central Ethiopia. Journal of Nutrition and Food Sciences. 2016;6(3). 104. Abdul Majid H, Ramli L, Ying SP, Su TT, Jalaludin MY, Abdul Mohsein NA. Dietary Intake among Adolescents in a Middle-Income Country: An Outcome from the Malaysian Health and Adolescents Longitudinal Research Team Study (the MyHeARTs Study). PLoS ONE [Electronic Resource]. 2016;11(5):e0155447. 105. Cacavas K, Mavoa H, Kremer P, Malakellis M, Fotu K, Swinburn B, et al. Tongan adolescents' eating patterns: opportunities for intervention. Asia-Pacific Journal of Public Health. 2011;23(1):24–33. 106. Chin YS, Mohd Nasir MT. Eating behaviors among female adolescents in Kuantan district, Pahang, Malaysia. Pakistan Journal of Nutrition. 2009;8(4):425–32. 107. Chongwatpol P, Gates GE. Differences in body dissatisfaction, weight-management practices and food choices of high-school students in the Bangkok metropolitan region by gender and school type. Public Health Nutrition. 2016;19(7):1222–32. 108. Htet MK, Fahmida U, Thurnham DI, Hlaing LM, Akib A, Utomo B, et al. Folate and vitamin B12 status and dietary intake of anaemic adolescent schoolgirls in the delta region of Myanmar. British Journal of Nutrition. 2016;116 Suppl 1:S36–41. 109. Jia M, Wang C, Zhang Y, Zheng Y, Zhang L, Huang Y, et al. Sugary beverage intakes and obesity prevalence among junior high school students in Beijing - a cross-sectional research on SSBs intake. Asia Pacific Journal of Clinical Nutrition. 2012;21(3):425–30. 110. Tajik E, Latiffah AL, Awang H, Siti Nur'Asyura A, Chin YS, Azrin Shah AB, et al. Unhealthy diet practice and symptoms of stress and depression among adolescents in Pasir Gudang, Malaysia. Obesity Research & Clinical Practice. 2016;10(2):114–23. 111. Woon FC, Chin YS, Mohd Nasir MT. Association between behavioural factors and BMI-for-age among early adolescents in Hulu Langat district, Selangor, Malaysia. Obesity Research & Clinical Practice. 2015;9(4):346–56. 112. Xue H, Tian G, Duan R, Quan L, Zhao L, Yang M, et al. Sedentary Behavior Is Independently Related to Fat Mass among Children and Adolescents in South China. Nutrients. 2016;8(11):25. 113. Ayranci U, Erenoglu N, Son O. Eating habits, lifestyle factors, and body weight status among Turkish private educational institution students. Nutrition. 2010;26(7-8):772–8.
Diet & Eating Practices of Adolescents in LMIC
86
114. Köksal E, Karadag MG, Yildiran H, Akbulut G, Tek NA, Bilici S, et al. Dietary Glycemic Index, Glycemic Load and Anthropometric Measurements in Adolescents. Turkiye Klinikleri Journal of Medical Sciences. 2011;31(4):960–8. 115. Geremia R, Cimadon HM, de Souza WB, Pellanda LC. Childhood overweight and obesity in a region of Italian immigration in Southern Brazil: a cross-sectional study. Italian Journal of Pediatrics. 2015;41:28. 116. Rieth MA, Moreira MB, Fuchs FD, Moreira LB, Fuchs SC. Fruits and vegetables intake and characteristics associated among adolescents from Southern Brazil. Nutrition Journal. 2012;11:95. 117. Santana ML, Silva Rde C, Assis AM, Raich RM, Machado ME, de JPE, et al. Factors associated with body image dissatisfaction among adolescents in public schools students in Salvador, Brazil. Nutricion Hospitalaria. 2013;28(3):747–55. 118. Schneider BC, Dumith Sde C, Lopes C, Severo M, Assuncao MC. How Do Tracking and Changes in Dietary Pattern during Adolescence Relate to the Amount of Body Fat in Early Adulthood? PLoS ONE [Electronic Resource]. 2016;11(2):e0149299. 119. Silva FM, Smith-Menezes A, Duarte Mde F. Consumption of fruits and vegetables associated with other risk behaviors among adolescents in Northeast Brazil. Revista Paulista de Pediatria. 2016;34(3):309–15. 120. Philippi ST, Leme ACB. Dietary intake and meal frequency of Brazilian girls attending a school-based randomized controlled trial. Nutrition & Food Science. 2015;45(6):954–68. 121. Bagherniya M, Sharma M, Mostafavi F, Keshavarz SA. Application of social cognitive theory in predicting childhood obesity prevention behaviors in overweight and obese Iranian adolescents. International Quarterly of Community Health Education. 2015;35(2):133–47. 122. Ghrayeb FAW, Mohamed Rusli A, Al Rifai A, Mohd Ismail I. PUBLIC HEALTH. Prevalence of Lifestyle-Related Risk Factors Contributing to Non-Communicable Diseases among Adolescents in Tarqumia, Palestine. International Medical Journal. 2014;21(3):272–6. 123. Jalambo MO, Hamad A, Abed Y. Anemia and risk factors among female secondary students in the Gaza Strip. Journal of Public Health (Germany). 2013;21(3):271–8. 124. Kelishadi R, Qorbani M, Motlagh ME, Ardalan G, Heshmat R, Hovsepian S. Socioeconomic Disparities in Dietary and Physical Activity Habits of Iranian Children and Adolescents: the CASPIAN-IV Study. Archives of Iranian Medicine. 2016;19(8):530–7. 125. Lopez PM, Anzid K, Cherkaoui M, Baali A, Lopez SR. Nutritional status of adolescents in the context of the Moroccan nutritional transition: the role of parental education. Journal of Biosocial Science. 2012;44(4):481–94.
87
126. Maddah M, Nikooyeh B. Obesity among Iranian adolescent girls: location of residence and parental obesity. Journal of Health, Population & Nutrition. 2010;28(1):61–6. 127. Tayyem RF, Ai-Hazzaa HM, Abu-Mweis SS, Bawadi HA, Qatatsheh A, Musaiger AO. Association of lifestyle factors with obesity indices among adolescents in Amman, Jordan. Malaysian Journal of Nutrition. 2014;20(1):51–62. 128. Gavaravarapu SM, Rao KM, Balakrishna N, Laxmaiah A. Assessing differences in risk perceptions about obesity among "normal-weight" and "overweight" adolescents - a qualitative study. Journal of nutrition education and behavior. 2015;47(6):488–97. 129. Islam RM, Bloomquist JR. A method for assessing chemically-induced paralysis in headless mosquito larvae. MethodsX. 2015;2:19–23. 130. Jaisheeba AA, Sornaraj R, Gayathri K. Influence of westernized culture and changed dietary habits on the BMI status of the school children of Tirunelveli. International Journal of PharmTech Research. 2012;4(3):1065–77. 131. Maliye CH, Deshmukh PR, Gupta SS, Kaur S, Mehendale AM, Garg BS. Nutrient intake amongst rural adolescent girls of Wardha. Indian Journal of Community Medicine. 2010;35(3):400–2. 132. Niranjala AMS, Gunawardena NS. Nutritional status of adolescent females in estates in Haliela, Sri Lanka. ICAN: Infant, Child & Adolescent Nutrition. 2011;3(5):260–7. 133. Omidvar S, Khyrunnisa B. Dietary pattern, food habits and preferences among adolescent and adult student girls from an urban area, South India. Indian Journal of Fundamental and Applied Life Sciences. 2014;4(2):465–73. 134. Paul B, Nayaki V, Sen M, Isaac R. Prevalence of cardiovascular disease risk among medical students in South India. Indian Journal of Community Health. 2015;27(2):211–5. 135. Prahlad G, Nidhi G, Singh HP. Prevalence of dental caries in relation to body mass index, daily sugar intake, and oral hygiene status in 12-year-old school children in Mathura city: a pilot study. International Journal of Pediatrics. 2014;921823(24). 136. Jasmin P, Jitendra P, Rajesh D, Ravi T. Correlation of body mass index, dietary habits, and family history with hypertension in adolescents. International Journal of Medical Science and Public Health. 2015;4(6):849–52. 137. Shah TA, Bhatt RJ, Mitesh P, Patel PG. Body mass index, dietary habits and physical exercise among school going adolescent: a cross sectional study in Ahmedabad. National Journal of Community Medicine. 2013;4(2):314–7. 138. Vani KR, K SV, L S, Kumar VRH, A B. Menstrual abnormalities in school going girls - are they related to dietary and exercise pattern? Journal of Clinical and Diagnostic Research JCDR. 2013;7(11):2537–40.
Diet & Eating Practices of Adolescents in LMIC
88
139. Choudhary S, Mishra CP, Shukla KP. Correlates of nutritional status of adolescent girls in the rural area of Varanasi. Internet Journal of Nutrition & Wellness. 2009;7(2). 140. Ponka R, Fokou E. Dietary intake, zincemia and cupremia of Cameroonian schoolchildren of Ngali II. International Journal of Food Sciences & Nutrition. 2011;62(4):377–84. 141. Fiorentino M, Landais E, Bastard G, Carriquiry A, Wieringa FT, Berger J. Nutrient Intake Is Insufficient among Senegalese Urban School Children and Adolescents: Results from Two 24 h Recalls in State Primary Schools in Dakar. Nutrients. 2016;8(10):20. 142. Zhang R, Wang Z, Fei Y, Zhou B, Zheng S, Wang L, et al. The Difference in Nutrient Intakes between Chinese and Mediterranean, Japanese and American Diets. Nutrients. 2015;7(6):4661–88. 143. Woon F, Chin Y, Kaartina S, Fara Wahida R, Hiew C, Mohd Nasir MT. Association between Home Environment, Dietary Practice, and Physical Activity among Primary School Children in Selangor, Malaysia. Malaysian Journal of Nutrition. 2014;20(1):1–14. 144. Kwanbunjan K, Thepouyporn A, Songmuaeng K, Nakosiri W, Cheeramakara C, Chusongsang Y, et al. Food behavior and folate status of hill-tribe schoolchildren and women of childbearing age on the northern border of Thailand. Southeast Asian Journal of Tropical Medicine & Public Health. 2008;39(2):353–61. 145. Zhou X, Xue H, Duan R, Liu Y, Zhang L, Harvey L, et al. The Cross-Sectional Association of Energy Intake and Dietary Energy Density with Body Composition of Children in Southwest China. Nutrients. 2015;7(7):5396–412. 146. Masuet-Aumatell C, Ramon-Torrell JM, Banque-Navarro M, Davalos-Gamboa Mdel R, Montano-Rodriguez SL. Nutritional status of children from Cochabamba, Bolivia: a cross-sectional study. Pan American Journal of Public Health. 2015;38(6):487–94. 147. Bernal J, Frongillo EA, Herrera H, Rivera J. Children live, feel, and respond to experiences of food insecurity that compromise their development and weight status in peri-urban Venezuela. Journal of Nutrition. 2012;142(7):1343–9. 148. Lopez-Olmedo N, Carriquiry AL, Rodriguez-Ramirez S, Ramirez-Silva I, Espinosa-Montero J, Hernandez-Barrera L, et al. Usual Intake of Added Sugars and Saturated Fats Is High while Dietary Fiber Is Low in the Mexican Population. Journal of Nutrition. 2016;146(9):1856S–65S. 149. Souza RA, Yokoo EM, Sichieri R, Pereira RA. Energy and macronutrient intakes in Brazil: results of the first nationwide individual dietary survey. Public Health Nutrition. 2015;18(17):3086–95. 150. Azadbakht L, Akbari F, Esmaillzadeh A. Diet quality among Iranian adolescents needs improvement. Public Health Nutrition. 2015;18(4):615–21.
89
151. Heidari-Beni M, Golshahi J, Esmaillzadeh A, Azadbakht L. Potato consumption as high glycemic index food, blood pressure, and body mass index among Iranian adolescent girls. Arya Atherosclerosis. 2015;11(Suppl 1):81–7. 152. Huew R, Waterhouse PJ, Moynihan PJ, Kometa S, Maguire A. Dental erosion and its association with diet in Libyan schoolchildren. European Archives of Paediatric Dentistry: Official Journal of the European Academy of Paediatric Dentistry. 2011;12(5):234–40. 153. Montero MD, Mora-Urda AI, Anzid K, Cherkaoui M, Marrodan MD. Diet Quality of Moroccan Adolescents Living in Morocco and in Spain. Journal of Biosocial Science. 2017;49(2):173–86. 154. Akhter N, Sondhya FY. Nutritional status of adolescents in Bangladesh: Comparison of severe thinness status of a low-income family's adolescents between urban and rural Bangladesh. 2013;2:27. 155. Kadam NS, Chiplonkar SA, Khadilkar AV, Fischer PR, Hanumante NM, Khadilkar VV. Modifiable factors associated with low bone mineral content in underprivileged premenarchal Indian girls. Journal of Pediatric Endocrinology & Metabolism. 2011;24(11/12):975–81. 156. Kaur T, Kaur M. Anaemia a health burden among rural adolescent girls in district Karnal: prevalence and coorelates. International Research Journal of Biological Sciences. 2015;4(7):34–41. 157. Ruqayya S, Alam K. Nutrient intakes of pregnant women in comparison to the reference intake. Pakistan Journal of Nutrition. 2012;11(2):166–71. 158. Nivedita P, Leena R. Effect of quantity and quality of proteins on age at menarche: a study of Maharashtrian girls of 11 to 15 years. Online International Interdisciplinary Research Journal. 2012;2(6):48–54. 159. Gupta AT, Pushpa S, Suvira K. Overweight/obesity and physical work capacity of affluent adolescent girls (13–15 years) studying in selected public schools of Delhi. International Journal of Medical Science and Public Health. 2016;5(1):50–4. 160. Korkalo L, Freese R, Alfthan G, Fidalgo L, Mutanen M. Poor micronutrient intake and status is a public health problem among adolescent Mozambican girls. Nutrition Research. 2015;35(8):664–73. 161. Cui Z, Dibley MJ. Trends in dietary energy, fat, carbohydrate and protein intake in Chinese children and adolescents from 1991 to 2009. British Journal of Nutrition. 2012;108(7):1292–9. 162. Banerjee S, Dias A, Shinkre R, Patel V. Under-nutrition among adolescents: A survey in five secondary schools in rural Goa. National Medical Journal of India. 2011;24(1):8–11. 163. Ibe SNO. Anthropometric indices and energy intakes of alcoholic adolescent students in Abia State University. Journal of Agriculture and Social Research. 2010;10(2):24–30.
Diet & Eating Practices of Adolescents in LMIC
90
164. Li JJ, Huang ZW, Wang RQ, Ma XM, Zhang ZQ, Liu Z, et al. Fruit and vegetable intake and bone mass in Chinese adolescents, young and postmenopausal women. Public Health Nutrition. 2013;16(1):78–86. 165. Naude CE, Carey PD, Laubscher R, Fein G, Senekal M. Vitamin D and calcium status in South African adolescents with alcohol use disorders. Nutrients. 2012;4(8):1076–94. 166. Omidvar N, Neyestani TR, Hajifaraji M, Eshraghian MR, Rezazadeh A, Armin S, et al. Calcium intake, major dietary sources and bone health indicators in Iranian primary school children. Iranian Journal of Pediatrics. 2015;25(1). 167. Sales CH, Fontanelli MdM, Vieira DAS, Marchioni DM, Fisberg RM. Inadequate dietary intake of minerals: prevalence and association with socio-demographic and lifestyle factors. British Journal of Nutrition. 2017;117(2):267–77. 168. Mulugeta A, Tessema M, K HS, Seid O, Kidane G, Kebede A. Examining Means of Reaching Adolescent Girls for Iron Supplementation in Tigray, Northern Ethiopia. Nutrients. 2015;7(11):9033–45. 169. Ogunkunle MO, Oludele AS. Food intake and meal pattern of adolescents in school in Ila Orangun, south-west Nigeria. South African Journal of Clinical Nutrition. 2013;26(4):188–93. 170. Olumakaiye MF. Adolescent girls with low dietary diversity score are predisposed to iron deficiency in Southwestern Nigeria. ICAN: Infant, Child & Adolescent Nutrition. 2013;5(2):85–91. 171. Feeley AB, Norris SA. Added sugar and dietary sodium intake from purchased fast food, confectionery, sweetened beverages and snacks among Sowetan adolescents. SAJCH South African Journal of Child Health. 2014;8(3):88–91. 172. Norimah AK, Koo HC, Hamid Jan JM, Mohd Nasir MT, Tan SY, Appukutty M, et al. Whole grain intakes in the diets of Malaysian children and adolescents-findings from the MyBreakfast study. PLoS ONE [Electronic Resource]. 2015;10 (10) (no pagination)(e0138247). 173. Wang D, Shi Y, Chang C, Stewart D, Ji Y, Wang Y, et al. Knowledge, attitudes and behaviour regarding nutrition and dietary intake of seventh-grade students in rural areas of Mi Yun County, Beijing, China. Environmental Health & Preventive Medicine. 2014;19(3):179–86. 174. Kayisoglu S, Icoz A. Effect of gender on fast-food consumption habits of high school and university students in Tekirdag, Turkey. Acta Alimentaria. 2014;43(1):53–60. 175. Taljic I, Toroman A. Comparison of dietary habits among adolescent boys and girls according to the place of residence in Canton Sarajevo. Radovi Poljoprivrednog Fakulteta Univerziteta u Sarajevu. 2016;61(66(1):168–72.

91
176. Miranda AC, Marciniak A, Santos LD, Barretta C, Nesello LAN. Factors associated withconsumptionof fruits and vegetables by teenagers in penha, Brazil. Acta Scientiarum - Health Sciences. 2015;37(2):197–203. 177. Souza AdM, Barufaldi LA, Abreu GdA, Giannini DT, Oliveira CLd, Santos MMd, et al. ERICA: intake of macro and micronutrients of Brazilian adolescents. (Special Issue: ERICA: Study of Cardiovascular Risk Factors in Adolescents.). Revista de Saude Publica. 2016;50(Suppl. 1). 178. Haddad LG, Owies A, Mansour A. Wellness appraisal among adolescents in Jordan: a model from a developing country: a cross-sectional questionnaire survey. Health Promotion International. 2009;24(2):130–9. 179. Som N, Mishra SK, Mukhopadhyay S. Weight concerns and food habits of adolescent girls in two contrasting ecological regions: A comparative study in India. Eating Behaviors. 2016;20:21–6. 180. Singla P, Dhillon PK. Study on dietary practices among adolescent girls of working mothers. Asian Journal of Dairy and Food Research. 2013;32(4):305–11. 181. Singla P, Sachdeva R, Kochhar A. Impact of nutrition counseling on consumption pattern of junk foods and knowledge, attitudes and practices among adolescent girls of working mothers. Journal of Human Ecology. 2012;39(3):221–7. 182. Sabale RV, Kowli SS, Chowdary PH. Prevalence of anemia and its determinants in urban school-going children of Mumbai. International Journal of Medicine and Public Health. 2013;3(4):325–9. 183. Azeredo CM, de Rezende LF, Canella DS, Moreira Claro R, de Castro IR, Luiz Odo C, et al. Dietary intake of Brazilian adolescents. Public Health Nutrition. 2015;18(7):1215–24. 184. Korkalo L, Erkkola M, Heinonen AE, Freese R, Selvester K, Mutanen M. Associations of dietary diversity scores and micronutrient status in adolescent Mozambican girls. European Journal of Nutrition. 2017;56(3):1179–89. 185. Musaiger A, Kalam F. Dietary habits and lifestyle among adolescents in Damascus, Syria. Annals of Agricultural & Environmental Medicine. 2014;21(2):416–9. 186. Shokrvash B, Salehi L, Hariri Akbari M, Ebrahimi Mamagani M, Nedjat S, Asghari M, et al. Social support and dairy products intake among adolescents: a study from Iran. BMC Public Health. 2015;15:1078. 187. Bahreynian M, Qorbani M, Heshmat R, Motlagh ME, Djalalinia S, Ardalan G, et al. Snack consumption among Iranian children and adolescents: the CASPIAN-IV study. Iranian Journal of Public Health. 2015;44(1 Suppl):62–75. 188. Mishra M, Ali S, Das M. Analysis of oxytocin in milk samples and intake pattern in different age groups of Indian population. Toxicology Mechanisms & Methods. 2014;24(5):342–6.
Diet & Eating Practices of Adolescents in LMIC
92
189. Singh AP, Girishwar M. Gender differences in lifestyle: results of a survey among Indian school-going adolescents. Social Change. 2016;46(3):428–43. 190. Peltzer K, Pengpid S, Mohan K. Prevalence of health behaviors and their associated factors among a sample of university students in India. International Journal of Adolescent Medicine & Health. 2014;26(4):531–40. 191. Liu RH. Health-promoting components of fruits and vegetables in the diet. Adv Nutr. 2013;4(3):384S–92S. 192. Shokrvash B, Majlessi F, Montazeri A, Nedjat S, Shojaeezadeh D, Rahimi A, et al. Fruit and vegetables consumption among adolescents: a study from a developing country. World Applied Sciences Journal. 2013;21(10):1502–11. 193. Ilesanmi OS, Ilesanmi FF, Ijarotimi IT. Determinants of fruit consumption among in-school adolescents in Ibadan, South West Nigeria. European Journal of Nutrition and Food Safety. 2014;4(2):100–9. 194. Doku D, Koivusilta L, Rimpela A. Sleep and its association with socioeconomic status, health, and risky behaviors among Ghanaian school children. Journal of Research on Adolescence. 2013;23(4):706–15. 195. Buxton CNA. Ghanaian Junior High School adolescents dietary practices and food preferences: implications for public health concern. Journal of Nutrition and Food Sciences. 2014;4(5). 196. de Moraes AC, Adami F, Falcao MC. Understanding the correlates of adolescents' dietary intake patterns. A multivariate analysis. Appetite. 2012;58(3):1057–62. 197. Dumith SC, Muniz LC, Tassitano RM, Hallal PC, Menezes AM. Clustering of risk factors for chronic diseases among adolescents from Southern Brazil. Preventive Medicine. 2012;54(6):393–6. 198. Rani MA, Sathiyasekaran BW. Behavioural determinants for obesity: a cross-sectional study among urban adolescents in India. Journal of Preventive Medicine & Public Health / Yebang Uihakhoe Chi. 2013;46(4):192–200. 199. Rahul S, Grover VL, Sanjay C. Recipe for diabetes disaster: a study of dietary behaviors among adolescent students in south Delhi, India. International Journal of Diabetes in Developing Countries. 2011;31(1):4–8. 200. Chen X, Lau M, Kan M, Chiang IC, Hu Y-J, Gong J, et al. Lifestyle and Addictive Behaviors Among Chinese Adolescents in Hong Kong, Macau, Taipei, Wuhan, and Zhuhai-a First Cross-subculture Assessment. International Journal of Behavioral Medicine. 2016;23(5):561–70. 201. Pengpid S, Peltzer K. Overweight, Obesity and Associated Factors among 13-15 Years Old Students in the Association of Southeast Asian Nations Member Countries, 2007-2014. Southeast Asian Journal of Tropical Medicine & Public Health. 2016;47(2):250–62. 202. Peltzer K, Pengpid S. Leisure Time Physical Inactivity and Sedentary Behaviour and Lifestyle Correlates among Students Aged 13–15 in the Association of Southeast Asian Nations (ASEAN) Member States, 2007-2013.
93
International Journal of Environmental Research & Public Health [Electronic Resource]. 2016;13(2):217. 203. Turati F, Rossi M, Pelucchi C, Levi F, La Vecchia C. Fruit and vegetables and cancer risk: a review of southern European studies. Br J Nutr. 2015;113 Suppl 2:S102–10. 204. Kilani H, Al-Hazzaa H, Waly MI, Musaiger A. Lifestyle habits diet, physical activity and sleep duration among Omani adolescents. Sultan Qaboos University Medical Journal. 2013;13(4):510–9. 205. Peltzer K, Pengpid S. Health Risk Behaviour among In-School Adolescents in the Philippines: Trends between 2003, 2007 and 2011, A Cross-Sectional Study. International Journal of Environmental Research & Public Health [Electronic Resource]. 2015;13(1):73. 206. Anum I, Muneeza Z, Kalar MU. The relationship between snacking habits and dental caries in school children. International Journal of Collaborative Research on Internal Medicine and Public Health. 2012;4(12):1943–51. 207. Shrivastav M, Thomas S. Snack consumption among underprivileged adolescent girls. Indian Pediatrics. 2010;47(10):888–90. 208. Omuemu VO, Oko-Oboh AG. Meal pattern and soft drink consumption among in-school adolescents in Benin-city, Edo state, nigeria. Journal of Medicine and Biomedical Research. 2015;14(1):72–81. 209. Zhang Y, Wang Y, Ji Y. Gender differences in the pathways of family factors influencing children's oral health behaviours: a cross-sectional study of primary school students in Beijing, China. Acta Odontologica Scandinavica. 2016;74(7):570–5. 210. De Moraes ACF, Falcao MC. Lifestyle factors and socioeconomic variables associated with abdominal obesity in Brazilian adolescents. Annals of Human Biology. 2013;40(1):1–8. 211. Freire MdCM, Jordao LMR, Malta DC, Andrade SSCdA, Peres MA. Socioeconomic inequalities and changes in oral health behaviors among Brazilian adolescents from 2009 to 2012. Revista de Saude Publica. 2015;49(50). 212. Ebbeling CB, Pawlak DB, Ludwig DS. Childhood obesity: public-health crisis, common sense cure. Lancet. 2002;360(9331):473–82. 213. French SA, Story M, Neumark-Sztainer D, Fulkerson JA, Hannan P. Fast food restaurant use among adolescents: associations with nutrient intake, food choices and behavioral and psychosocial variables. Int J Obes Relat Metab Disord. 2001;25(12):1823–33. 214. Dunford E, Webster J, Barzi F, Neal B. Nutrient content of products served by leading Australian fast food chains. Appetite. 2010;55(3):484–9. 215. O'Donnell SI, Hoerr SL, Mendoza JA, Tsuei Goh E. Nutrient quality of fast food kids meals. Am J Clin Nutr. 2008;88(5):1388–95.
Diet & Eating Practices of Adolescents in LMIC
94
216. Monge-Rojas R, Smith-Castro V, Colon-Ramos U, Aragon MC, Herrera-Raven F. Psychosocial factors influencing the frequency of fast-food consumption among urban and rural Costa Rican adolescents. Nutrition. 2013;29(7-8):1007–12. 217. Bernardo Cde O, Vasconcelos Fde A. Association of parents' nutritional status, and sociodemographic and dietary factors with overweight/obesity in schoolchildren 7 to 14 years old. Cadernos de Saude Publica. 2012;28(2):291–304. 218. Kadhum MJ, Kadhum IU. Peer health education and unhealthy eating habits among students in Babel Governorate. Journal of the Dow University of Health Sciences. 2014;8(2):54–8. 219. Uma C, Koushik A, Radhika MS, Balakrishna N. Neophobic tendencies and dietary behavior in a cohort of female college students from Southern India. Journal of Sensory Studies. 2016;31(1):70–7. 220. Swati D, Singh JV, Surya K, Agarwal GG, Abhishek D, Nilam K. A cross-sectional study on predictors and significance of eating behavior of adolescent girls. Vulnerable Children and Youth Studies. 2014;9(1):10–6. 221. Malik VS, Pan A, Willett WC, Hu FB. Sugar-sweetened beverages and weight gain in children and adults: a systematic review and meta-analysis. Am J Clin Nutr. 2013;98(4):1084–102. 222. Xi B, Huang Y, Reilly KH, Li S, Zheng R, Barrio-Lopez MT, et al. Sugar-sweetened beverages and risk of hypertension and CVD: a dose-response meta-analysis. Br J Nutr. 2015;113(5):709–17. 223. Ratnayake N, Ekanayake L. Soft drink consumption in Sri Lankan adolescents. Public Health Nutrition. 2012;15(8):1333–7. 224. Ansa VO, Anah MU, Ndifon WO. Soft drink consumption and overweight/obesity among Nigerian adolescents. CVD Prevention and Control. 2008;3(4):191–6. 225. Jan Mohamed HJ, Loy SL, Mohd Taib MN, Karim NA, Tan SY, Appukutty M, et al. Characteristics associated with the consumption of malted drinks among Malaysian primary school children: findings from the MyBreakfast study.[Erratum appears in BMC Public Health. 2016;16:162; PMID: 26883422]. BMC Public Health. 2015;15:1322. 226. Barbosa Filho VC, de Campos W, Bozza R, Lopes Ada S. The prevalence and correlates of behavioral risk factors for cardiovascular health among Southern Brazil adolescents: a cross-sectional study. BMC Pediatrics. 2012;12:130. 227. Araki EL, Philippi ST, Martinez MF, Estima CCP, Leal GVS, Alvarenga MS. Pattern of meals eaten by adolescents from technical schools of Sao Paulo, SP, Brazil. Revista Paulista de Pediatria. 2011;29(2):164–70.
95
228. Mishra SK, Mukhopadhyay S. Eating and weight concerns among Sikkimese adolescent girls and their biocultural correlates: an exploratory study. Public Health Nutrition. 2011;14(5):853–9. 229. Adeel FFA, Awan MA, Anjum N, Ahmed H, Ahmed Z, Afreen A. DIETARY PRACTICES AMONG ADOLESCENTS: DO BOYS EAT BETTER THAN GIRLS? NURTURE: Journal of Pakistan Home Economics Association. 2012;6(1):1–8. 230. Baygi F, Heshmat R, Kelishadi R, Mohammadi F, Motlagh ME, Ardalan G, et al. Regional Disparities in Sedentary Behaviors and Meal Frequency in Iranian Adolescents: The CASPIAN-III Study. Iranian Journal of Pediatrics. 2015;25(2):e182. 231. Belete Y, Negga B, Firehiwot M. Under nutrition and associated factors among adolescent pregnant women in Shashemenne district, West Arsi Zone, Ethiopia: a community-based study. Journal of Nutrition and Food Sciences. 2016;6(1). 232. Kelishadi R, Qorbani M, Motlagh ME, Heshmat R, Ardalan G, Bahreynian M. Association of eating frequency with anthropometric indices and blood pressure in children and adolescents: the CASPIAN-IV Study. Jornal de Pediatria. 2016;92(2):156–67. 233. Wang M, Zhong JM, Wang H, Zhao M, Gong WW, Pan J, et al. Breakfast Consumption and Its Associations with Health-Related Behaviors among School-Aged Adolescents: A Cross-Sectional Study in Zhejiang Province, China. International Journal of Environmental Research & Public Health [Electronic Resource]. 2016;13(8):27. 234. Guo X, Zhang X, Li Y, Zhou X, Yang H, Ma H, et al. Differences in healthy lifestyles between prehypertensive and normotensive children and adolescents in Northern China. Pediatric Cardiology. 2012;33(2):222–8. 235. Kotecha PV, Patel SV, Baxi RK, Mazumdar VS, Shobha M, Mehta KG, et al. Dietary pattern of schoolgoing adolescents in urban Baroda, India. Journal of Health, Population & Nutrition. 2013;31(4):490–6. 236. Kelishadi R, Mozafarian N, Qorbani M, Motlagh ME, Safiri S, Ardalan G, et al. Is snack consumption associated with meal skipping in children and adolescents? The CASPIAN-IV study. 2017;27:27. 237. El-Gilany AH, Elkhawaga G. Socioeconomic determinants of eating pattern of adolescent students in Mansoura, Egypt. The Pan African medical journal. 2012;13:22. 238. Intiful FD, Lartey A. Breakfast habits among school children in selected communities in the eastern region of Ghana. Ghana Medical Journal. 2014;48(2):71–7. 239. Garg M, Rajesh V, Kumar P. Effect of Breakfast Skipping on Nutritional Status and School Performance of 10-16 Years Old Children of Udupi District Health and Population Perspectives and Issues. 2014;37(3 & 4):98–117.
Diet & Eating Practices of Adolescents in LMIC
96
240. Chu CH, Chau AM, Wong ZS, Hui BS, Lo EC. Oral health status and behaviours of children in Myanmar - a pilot study in four villages in rural areas. Oral Health & Preventive Dentistry. 2012;10(4):365–71. 241. Astrom AN, Mbawalla H. Factor structure of health and oral health-related behaviors among adolescents in Arusha, northern Tanzania. Acta Odontologica Scandinavica. 2011;69(5):299–309. 242. Naja F, Hwalla N, Itani L, Karam S, Sibai AM, Nasreddine L. A Western dietary pattern is associated with overweight and obesity in a national sample of Lebanese adolescents (13–19 years): a cross-sectional study. British Journal of Nutrition. 2015;114(11):1909–19. 243. Estima CCP, Philippi ST, Leal GVS, Pimentel CVMB, Alvarenga MS. Vegetarianism and eating disorder risk behavior in adolescents from Sao Paulo, Brazil. Revista Espanola de Nutricion Humana y Dietetica. 2012;16(3):94–9. 244. Ramzi M, Haghpanah S, Malekmakan L, Cohan N, Baseri A, Alamdari A, et al. Anemia and iron deficiency in adolescent school girls in Kavar urban area, southern Iran. Iranian Red Crescent Medical Journal. 2011;13(2):128–33. 245. G. B. D. Risk Factors Collaborators. Global, regional, and national comparative risk assessment of 84 behavioural, environmental and occupational, and metabolic risks or clusters of risks, 1990-2016: a systematic analysis for the Global Burden of Disease Study 2016. Lancet. 2017;390(10100):1345–422. 246. Jaacks LM, Slining MM, Popkin BM. Recent trends in the prevalence of under- and overweight among adolescent girls in low- and middle-income countries. Pediatr Obes. 2015;10(6):428–35. 247. Ochola S, Masibo PK. Dietary intake of schoolchildren and adolescents in developing countries. Ann Nutr Metab. 2014;64 Suppl 2:24–40. 248. Popkin BM, Adair LS, Ng SW. Global nutrition transition and the pandemic of obesity in developing countries. Nutr Rev. 2012;70(1):3–21. 249. Schoenbuchner SM, Moore SE, Johnson W. Do rural Gambian adolescents have increased nutritional vulnerability? Annals of the New York Academy of Sciences 2017;In press. 250. Marie Francoise Rolland-Cachera for the European Childhood Obesity Group. Childhood obesity: current definitions and recommendations for their use. International Journal of Pediatric Obesity 2011;6:325–31. 251. Ng M, Fleming T, Robinson M, Thomson B, Graetz N, Margono C, et al. Global, regional, and national prevalence of overweight and obesity in children and adults during 1980-2013: a systematic analysis for the Global Burden of Disease Study 2013. Lancet. 2014;384(9945):766–81. 252. Daniels SR, Arnett DK, Eckel RH, Gidding SS, Hayman LL, Kumanyika S, et al. Overweight in children and adolescents: pathophysiology, consequences, prevention, and treatment. Circulation. 2005;111(15):1999–2012. 253. Shroff MR, Perng W, Baylin A, Mora-Plazas M, Marin C, Villamor E. Adherence to a snacking dietary pattern and soda intake are related to the
97
development of adiposity: a prospective study in school-age children. Public Health Nutr. 2014;17(7):1507–13. 254. Braithwaite I, Stewart AW, Hancox RJ, Beasley R, Murphy R, Mitchell EA, et al. Fast-food consumption and body mass index in children and adolescents: an international cross-sectional study. BMJ Open. 2014;4(12):e005813. 255. Rosenheck R. Fast food consumption and increased caloric intake: a systematic review of a trajectory towards weight gain and obesity risk. Obes Rev. 2008;9(6):535–47. 256. Almuhanna MA, Alsaif M, Alsaadi M, Almajwal A. Fast food intake and prevalence of obesity in school children in Riyadh City. Sudan J Paediatr. 2014;14(1):71–80. 257. WHO. Adolescent pregnancy Geneva: World Health Organization; 2014 [Available from: 35Thttp://www.who.int/mediacentre/factsheets/fs364/en/]35T. 258. Danaei G, Finucane MM, Lu Y, Singh GM, Cowan MJ, Paciorek CJ, et al. National, regional, and global trends in fasting plasma glucose and diabetes prevalence since 1980: systematic analysis of health examination surveys and epidemiological studies with 370 country-years and 2.7 million participants. Lancet. 2011;378(9785):31–40. 259. Danaei G, Finucane MM, Lin JK, Singh GM, Paciorek CJ, Cowan MJ, et al. National, regional, and global trends in systolic blood pressure since 1980: systematic analysis of health examination surveys and epidemiological studies with 786 country-years and 5.4 million participants. Lancet. 2011;377(9765):568–77. 260. Farzadfar F, Finucane MM, Danaei G, Pelizzari PM, Cowan MJ, Paciorek CJ, et al. National, regional, and global trends in serum total cholesterol since 1980: systematic analysis of health examination surveys and epidemiological studies with 321 country-years and 3.0 million participants. Lancet. 2011;377(9765):578–86. 261. Aurino E, Fernandes M, Penny ME. The nutrition transition and adolescents' diets in low- and middle-income countries: a cross-cohort comparison. Public Health Nutr. 2017;20(1):72–81. 262. Powell CA, Walker SP, Chang SM, Grantham-McGregor SM. Nutrition and education: a randomized trial of the effects of breakfast in rural primary school children. Am J Clin Nutr. 1998;68(4):873–9. 263. Chandler AM, Walker SP, Connolly K, Grantham-McGregor SM. School breakfast improves verbal fluency in undernourished Jamaican children. J Nutr. 1995;125(4):894–900. 264. Pollitt E, Jacoby E, Cueto S. School breakfast and cognition among nutritionally at-risk children in the Peruvian Andes. Nutr Rev. 1996;54(4 Pt 2):S22–6. 265. Richter LM, Rose C, Griesel RD. Cognitive and behavioural effects of a school breakfast. S Afr Med J. 1997;87(1 Suppl):93–100.
Diet & Eating Practices of Adolescents in LMIC
98
266. Ptomey LT, Steger FL, Schubert MM, Lee J, Willis EA, Sullivan DK, et al. Breakfast Intake and Composition Is Associated with Superior Academic Achievement in Elementary Schoolchildren. J Am Coll Nutr. 2016;35(4):326-33. 267. Anzman-Frasca S, Djang HC, Halmo MM, Dolan PR, Economos CD. Estimating impacts of a breakfast in the classroom program on school outcomes. JAMA Pediatr. 2015;169(1):71–7. 268. Mhurchu CN, Gorton D, Turley M, Jiang Y, Michie J, Maddison R, et al. Effects of a free school breakfast programme on children's attendance, academic achievement and short-term hunger: results from a stepped-wedge, cluster randomised controlled trial. J Epidemiol Community Health. 2013;67(3):257–64. 269. Drewnowski A, Popkin BM. The nutrition transition: new trends in the global diet. Nutr Rev. 1997;55(2):31–43. 270. WHO. Global Accelerated Action for the Health of Adolescents (AA-HA!): guidance to support country implementation Geneva: World Health Organization; 2017 [Available from: 35Thttp://www.who.int/maternal_child_adolescent/topics/adolescence/framework-accelerated-action/en/]35T. 271. WHO. Report on the Commission on Ending Childhood Obesity. Geneva, Switzerland: World Health Organization. 2016. 272. World Cancer Research Fund International. NOURISHING Framework London: WCRF International; 2017 [Available from: 35Thttp://www.wcrf.org/int/policy/nourishing-framework35T]. 273. Bryan CJ, Yeager DS, Hinojosa CP, Chabot A, Bergen H, Kawamura M, et al. Harnessing adolescent values to motivate healthier eating. Proc Natl Acad Sci U S A. 2016;113(39):10830–5. 274. Bhutta ZA. Global child nutrition and the Sustainable Development Goals. The Lancet. 2017;In press.
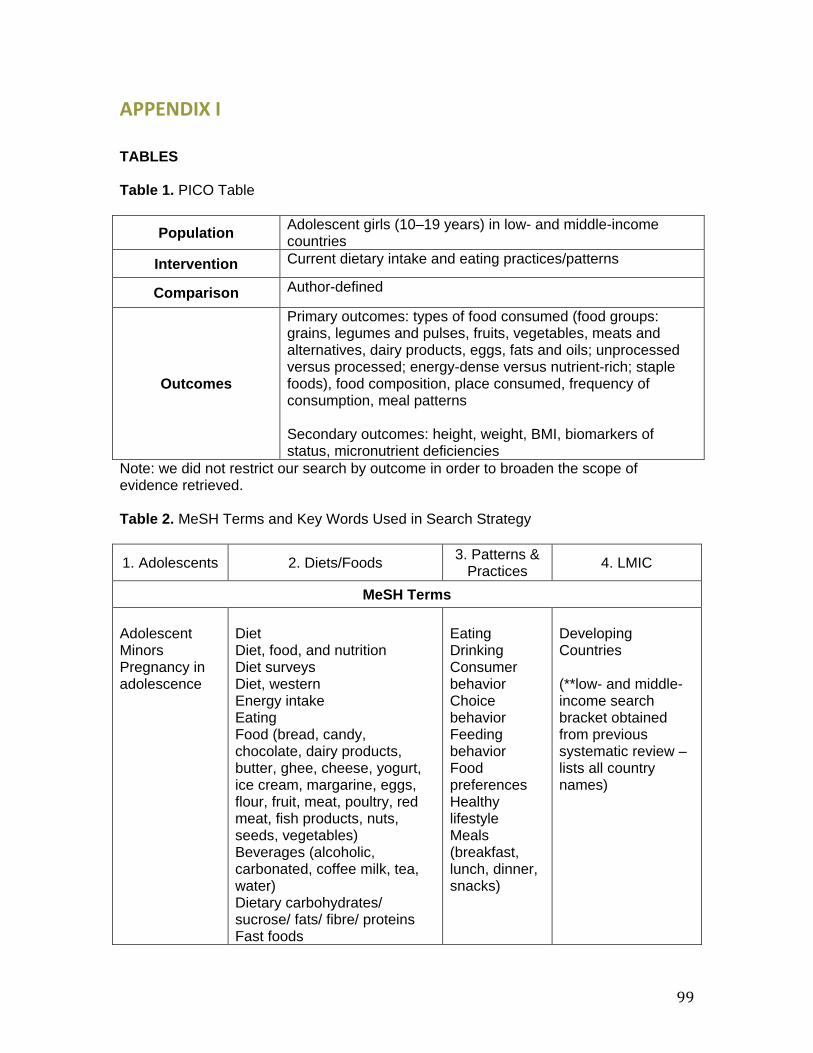
99
APPENDIX I TABLES Table 1. PICO Table
Population Adolescent girls (10–19 years) in low- and middle-income countries
Intervention Current dietary intake and eating practices/patterns
Comparison Author-defined
Outcomes
Primary outcomes: types of food consumed (food groups: grains, legumes and pulses, fruits, vegetables, meats and alternatives, dairy products, eggs, fats and oils; unprocessed versus processed; energy-dense versus nutrient-rich; staple foods), food composition, place consumed, frequency of consumption, meal patterns Secondary outcomes: height, weight, BMI, biomarkers of status, micronutrient deficiencies
Note: we did not restrict our search by outcome in order to broaden the scope of evidence retrieved. Table 2. MeSH Terms and Key Words Used in Search Strategy
1. Adolescents 2. Diets/Foods 3. Patterns & Practices 4. LMIC
MeSH Terms Adolescent Minors Pregnancy in adolescence
Diet Diet, food, and nutrition Diet surveys Diet, western Energy intake Eating Food (bread, candy, chocolate, dairy products, butter, ghee, cheese, yogurt, ice cream, margarine, eggs, flour, fruit, meat, poultry, red meat, fish products, nuts, seeds, vegetables) Beverages (alcoholic, carbonated, coffee milk, tea, water) Dietary carbohydrates/ sucrose/ fats/ fibre/ proteins Fast foods
Eating Drinking Consumer behavior Choice behavior Feeding behavior Food preferences Healthy lifestyle Meals (breakfast, lunch, dinner, snacks)
Developing Countries (**low- and middle-income search bracket obtained from previous systematic review – lists all country names)
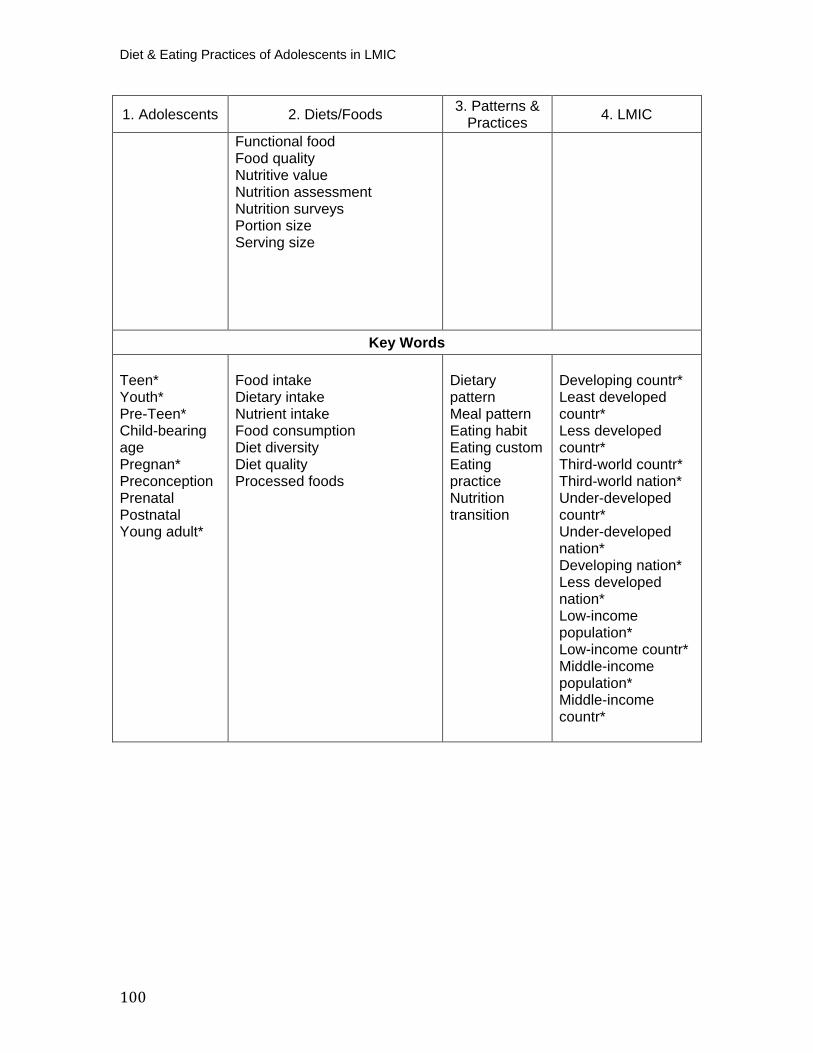
Diet & Eating Practices of Adolescents in LMIC
100
1. Adolescents 2. Diets/Foods 3. Patterns &Practices 4. LMIC
Functional food Food quality Nutritive value Nutrition assessment Nutrition surveys Portion size Serving size
Key Words
Teen* Youth* Pre-Teen* Child-bearing age Pregnan* Preconception Prenatal Postnatal Young adult*
Food intake Dietary intake Nutrient intake Food consumption Diet diversity Diet quality Processed foods
Dietary pattern Meal pattern Eating habit Eating custom Eating practice Nutrition transition
Developing countr* Least developed countr* Less developed countr* Third-world countr* Third-world nation* Under-developed countr* Under-developed nation* Developing nation* Less developed nation* Low-income population* Low-income countr* Middle-income population* Middle-income countr*
101
Table 3. Mean BMI and BMI Status among Adolescent Girls, by Age Band and Region 10–14 15–19 10–19
Middle East & North Africa Iran (13 urban, 2 mixed), Iraq (1 urban), Jordan (3 urban), Algeria (1 urban), Palestine (1 rural, 1
NR), Lebanon (1 NR), Morocco (1 urban, 1 mixed) Mean BMI Mean ±SD
N studies 9 11 19 n participants 5052 4588 9640 Mean BMI 19.3 ±3.9 19.4 ±3.7 19.8 ±3.7
BMI Status N (%)
N studies 8 12 19 n participants 7863 4129 11992 Severe thinness 0 (0) 34 (0.82) 34 (0.28) Thinness 792 (10.07) 50 (1.21) 842 (7.02) Normal weight 4855 (61.74) 2923 (70.79) 7778 (64.86) Overweight 1242 (15.80) 878 (21.26) 2120 (17.68) Obese 974 (12.39) 244 (5.91) 1218 (10.16)
Latin America & Caribbean Argentina (1 mixed), Brazil (5 urban, 3 mixed), Columbia (1 NR), Mexico (1 urban, 1 rural, 1 NR)
Mean BMI Mean ±SD
N studies 4 3 7 n participants 722 703 1533 Mean BMI 22.3 ±3.7 18.9 ±3.8 20.7 ±3.8
BMI Status N (%)
N studies 4 6 10 n participants 417 3925 5481 Severe thinness 0 (0) 0 (0) 0 (0) Thinness 43 (10.31) 60 (1.51) 189 (3.45) Normal weight 119 (28.54) 3099 (78.96) 4096 (74.73) Overweight 209 (50.12) 531 (13.53) 871 (15.89) Obese 46 (11.03) 235 (5.99) 325 (5.93)
Africa Cameroon (1 urban), Ethiopia (1 urban, 1 rural, 2 mixed), Mozambique (2 mixed), Nigeria (1 urban,
2 rural, 1 mixed), South Africa (3 urban), Sudan (1 urban) Mean BMI Mean ±SD
N studies 2 6 8 n participants 779 1635 2414 Mean BMI 21.1 ±2.6 20.9 ±3.8 21.0 ±3.4
Diet & Eating Practices of Adolescents in LMIC
102
10–14 15–19 10–19 BMI Status
N (%) N studies 3 11 12 n participants 2944 2679 5677 Severe thinness 0 (0) 0 (0) 0 (0) Thinness 288 (9.78) 365 (13.36) 653 (11.50) Normal weight 2167 (73.61) 1969 (72.05) 4136 (72.86) Overweight 452 (15.35) 302 (11.05) 754 (13.28) Obese 37 (1.26) 97 (3.55) 134 (2.36)
Europe & Central Asia Turkey (6 urban), Albania (1 urban), Serbia (1 urban)
Mean BMI Mean ±SD
N studies 4 2 5 n participants 1264 543 1807 Mean BMI 19.1 ±3.0 20.7 ±2.8 19.8 ±3.0
BMI Status N (%)
N studies 4 4 6 n participants 872 1764 2636 Severe thinness 0 (0) 0 (0) 0 (0) Thinness 1 (0.11) 481 (27.27) 482 (18.29) Normal weight 683 (78.33) 1176 (66.67) 1859 (70.52) Overweight 146 (16.74) 91 (5.16) 237 (8.99) Obese 42 (4.82) 16 (0.91) 58 (2.20)
South Asia Bangladesh (2 urban), India (12 urban, 2 urban slum, 2 rural, 2 mixed, 1 NR), Pakistan (2 urban),
Sri Lanka (1 rural, 1 mixed, 1 NR) Mean BMI Mean ±SD
N studies 6 7 16 n participants 2505 1546 5418 Mean BMI 17.7 ±3.1 18.9 ±3.2 18.9 ±3.8
BMI Status N (%)
N studies 7 11 21 n participants 895 1910 4392 Severe thinness 76 (8.49) 8 (0.42) 111 (2.53) Thinness 387 (43.24) 745 (39.01) 1627 (37.04) Normal weight 355 (39.66) 970 (50.79) 2072 (47.18) Overweight 71 (7.93) 160 (8.38) 418 (9.52) Obese 6 (0.67) 27 (1.41) 164 (3.73)
103
10–14 15–19 10–19 East Asia & Pacific
Cambodia (1 urban), China (11 urban, 2 rural, 2 mixed), Fiji (1 mixed), Malaysia (3 urban, 1 rural, 2 mixed, 1 NR), Myanmar (1 peri-urban), Philippines (2 urban), Thailand (1 urban), Tonga (1 mixed)
Mean BMI Mean ±SD
N studies 12 6 22 n participants 11202 3885 16832 Mean BMI 18.1 ±2.4 21.1 ±2.9 18.8 ±2.5
BMI Status N (%)
N studies 14 6 19 n participants 4501 1894 7482 Severe thinness 6 (0.13) 7 (0.37) 13 (0.17) Thinness 335 (7.44) 140 (7.39) 535 (7.15) Normal weight 2875 (63.87) 1251 (66.05) 4458 (59.58) Overweight 754 (16.75) 356 (18.80) 1636 (21.87) Obese 531 (11.80) 140 (7.39) 840 (11.23)
Total P
P
1PMean BMI Mean ±SD
N studies 37 35 77 n participants 21,524 12,900 37,644 Mean BMI 18.6 ±2.92 20.1 ±3.38 19.3 ±3.13
P
2PBMI Status
N (%) N studies 48 56 109 n participants 17,492 16,355 37,660 Severe thinness 82 (0.47) 49 (0.30) 158 (0.42) Thinness 1846 (10.55) 1841 (11.26) 4328 (11.49) Normal weight 11054 (63.19) 11388 (69.63) 24399 (64.79) Overweight 2874 (16.43) 2318 (14.17) 6036 (16.03) Obese 1636 (9.35) 759 (4.64) 2739 (7.27) P
1P3 studies stratified mean BMI data by younger (10–14) and older (15–19) age groups.
P
2P5 studies stratified BMI status by younger and older age groups.
Diet & Eating Practices of Adolescents in LMIC
104
Table 4. Protein Intake (Grams/Day), by Age Group and Region 10–14 15–19 10–19 Middle East & North Africa (n=14)
Algeria (1 urban), Iran (10 urban), Libya (1 urban), Morocco (1 urban, 1 mixed) N studies 8 5 14 n participants 1946 1788 4108 Urban/Rural/Mixed 8 urban 4 urban, 1 mixed 13 urban, 1 mixed Weighted Mean ±SD 74 ±18 48 ±14 61 ±15
Latin America & Caribbean (n=6) P
1
Bolivia (1 urban), Brazil (1 urban), Mexico (1 urban, 1 rural, 1 mixed), Venezuela (1 peri-urban) N studies 3 2 6 n participants 1655 1919 4785 Urban/Rural/Mixed 1 rural, 1 mixed, 1
peri-urban 1 urban, 1 mixed 2 urban, 2 mixed, 1 rural,
1 peri-urban Weighted Mean ±SD 74 ±27 73 ±28 72 ±27
Africa (n=10)Cameroon (1 urban, 1 rural), Ethiopia (1 rural) Mozambique (3 mixed), Nigeria (1 rural), Senegal
(1 urban), South Africa (2 urban) N studies 1 6 10 n participants 119 853 1910 Urban/Rural/Mixed 1 urban 2 urban, 2 rural, 2
mixed 4 urban, 3 mixed, 3 rural
Weighted Mean ±SD 76 ±24 39 ±3 45 ±4 Europe & Central Asia (n=2)
Turkey (2 urban) N studies 1 1 2 n participants 41 288 329 Urban/Rural/Mixed 1 urban 1 urban 2 urban Weighted Mean ±SD 41 ±28 52 ±24 49 ±22
South Asia (n=19) P
2
Bangladesh (1 urban, 1 mixed), India (8 urban, 2 rural, 2 urban slum, 1 mixed), Pakistan (3 urban), Sri Lanka (1 mixed)
N studies 11 7 19 n participants 2826 944 4900 Urban/Rural/Mixed 7 urban, 2 rural, 1
urban slum, 1 mixed
5 urban, 1 mixed, 1 rural
12 urban, 3 mixed, 2 rural, 2 urban slum
Weighted Mean ±SD 37 ±12 51 ±12 40 ±11 East Asia & Pacific (n=12)
China (4 urban, 1 mixed), Malaysia (1 urban, 3 mixed), Myanmar (1 peri-urban), Philippines (1 urban), Thailand (1 rural)
N studies 8 3 12 n participants 2321 1446 3842 Urban/Rural/Mixed 4 urban, 3 mixed, 1
rural 2 urban, 1 peri-urban 6 urban, 4 mixed, 1 peri-
urban, 1 rural Weighted Mean ±SD 72 ±23 70 ±22 70 ±22
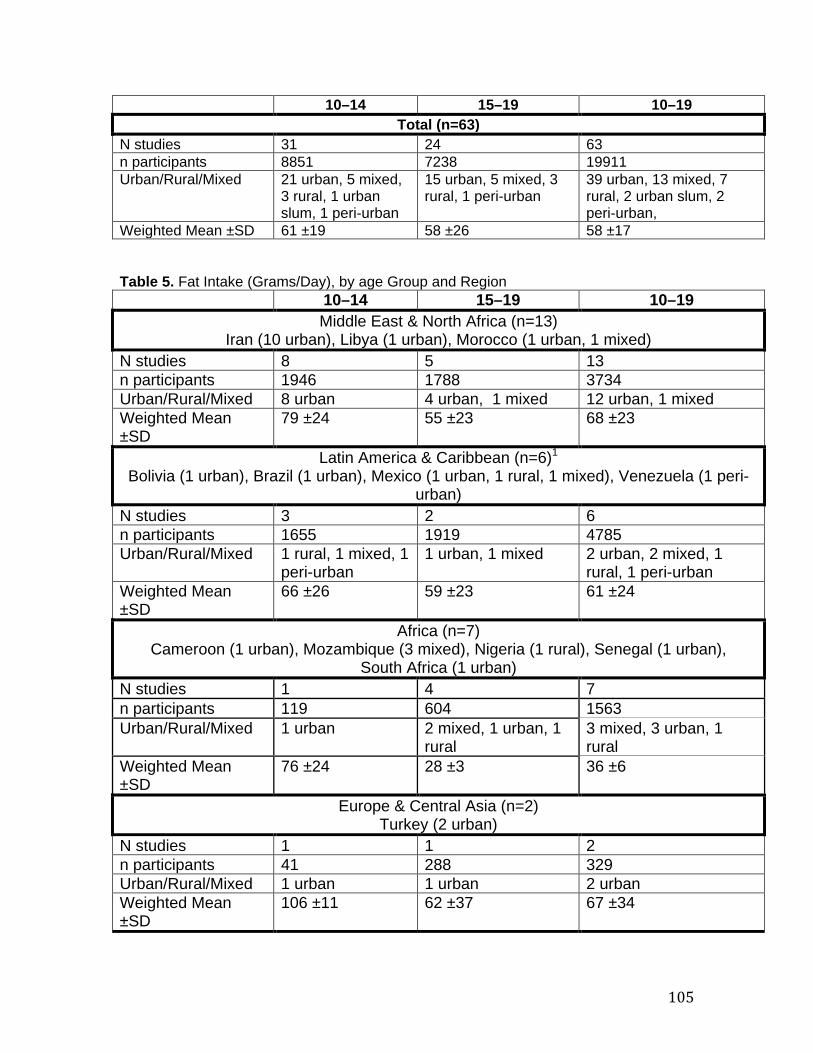
105
10–14 15–19 10–19 Total (n=63)
N studies 31 24 63 n participants 8851 7238 19911 Urban/Rural/Mixed 21 urban, 5 mixed,
3 rural, 1 urban slum, 1 peri-urban
15 urban, 5 mixed, 3 rural, 1 peri-urban
39 urban, 13 mixed, 7 rural, 2 urban slum, 2 peri-urban,
Weighted Mean ±SD 61 ±19 58 ±26 58 ±17 Table 5. Fat Intake (Grams/Day), by age Group and Region
10–14 15–19 10–19 Middle East & North Africa (n=13)
Iran (10 urban), Libya (1 urban), Morocco (1 urban, 1 mixed) N studies 8 5 13 n participants 1946 1788 3734 Urban/Rural/Mixed 8 urban 4 urban, 1 mixed 12 urban, 1 mixed Weighted Mean ±SD
79 ±24 55 ±23 68 ±23
Latin America & Caribbean (n=6) P
1
Bolivia (1 urban), Brazil (1 urban), Mexico (1 urban, 1 rural, 1 mixed), Venezuela (1 peri-urban)
N studies 3 2 6 n participants 1655 1919 4785 Urban/Rural/Mixed 1 rural, 1 mixed, 1
peri-urban 1 urban, 1 mixed 2 urban, 2 mixed, 1
rural, 1 peri-urban Weighted Mean ±SD
66 ±26 59 ±23 61 ±24
Africa (n=7)
Cameroon (1 urban), Mozambique (3 mixed), Nigeria (1 rural), Senegal (1 urban), South Africa (1 urban)
N studies 1 4 7 n participants 119 604 1563 Urban/Rural/Mixed 1 urban 2 mixed, 1 urban, 1
rural 3 mixed, 3 urban, 1 rural
Weighted Mean ±SD
76 ±24 28 ±3 36 ±6
Europe & Central Asia (n=2)
Turkey (2 urban) N studies 1 1 2 n participants 41 288 329 Urban/Rural/Mixed 1 urban 1 urban 2 urban Weighted Mean ±SD
106 ±11 62 ±37 67 ±34

Diet & Eating Practices of Adolescents in LMIC
106
10–14 15–19 10–19 South Asia (n=11)
Bangladesh (1 urban, 1 mixed), India (3 urban, 2 urban slum, 1 rural, 1 mixed), Pakistan (2 urban)
N studies 5 3 11 n participants 1255 359 2027 Urban/Rural/Mixed 2 urban, 1 urban
slum, 1 rural, 1 mixed
2 urban, 1 mixed 6 urban, 2 mixed, 2 urban slum, 1 rural
Weighted Mean ±SD
46 ±13 24 ±4 41 ±11
East Asia & Pacific (n=12) China (4 urban, 2 mixed), Malaysia (1 urban, 3 mixed), Philippines (1 urban), Thailand (1
rural) N studies 9 2 12 n participants 2611 1055 3741 Urban/Rural/Mixed 4 urban, 4 mixed,
1 rural 1 urban, 1 mixed 6 urban, 5 mixed, 1
rural Weighted Mean ±SD
58 ±19 63 ±25 59 ±21
Total (n=51) N studies 27 17 51 n participants 7627 6013 16179 Urban/Rural/Mixed 16 urban, 6
mixed, 3 rural, 1 peri-urban, 1 urban slum
10 urban, 6 mixed, 1 rural
31 urban, 13 mixed, 4 rural, 2 urban slum, 1 peri-urban
Weighted Mean ±SD
64 ±21 53 ±21 57 ±20
Table 6. Carbohydrate Intake (Grams/Day), by Age Group and Region 10–14 15–19 10–19 Middle East & North Africa (n=13)
Algeria (1 urban), Iran (9 urban), Libya (1 urban), Morocco (1 urban, 1 mixed) N studies 7 5 13 n participants 1741 1788 3903 Urban/Rural/Mixed 7 urban 4 urban, 1 mixed 12 urban, 1 mixed Weighted Mean ±SD
347 ±72 202 ±59 266 ±59
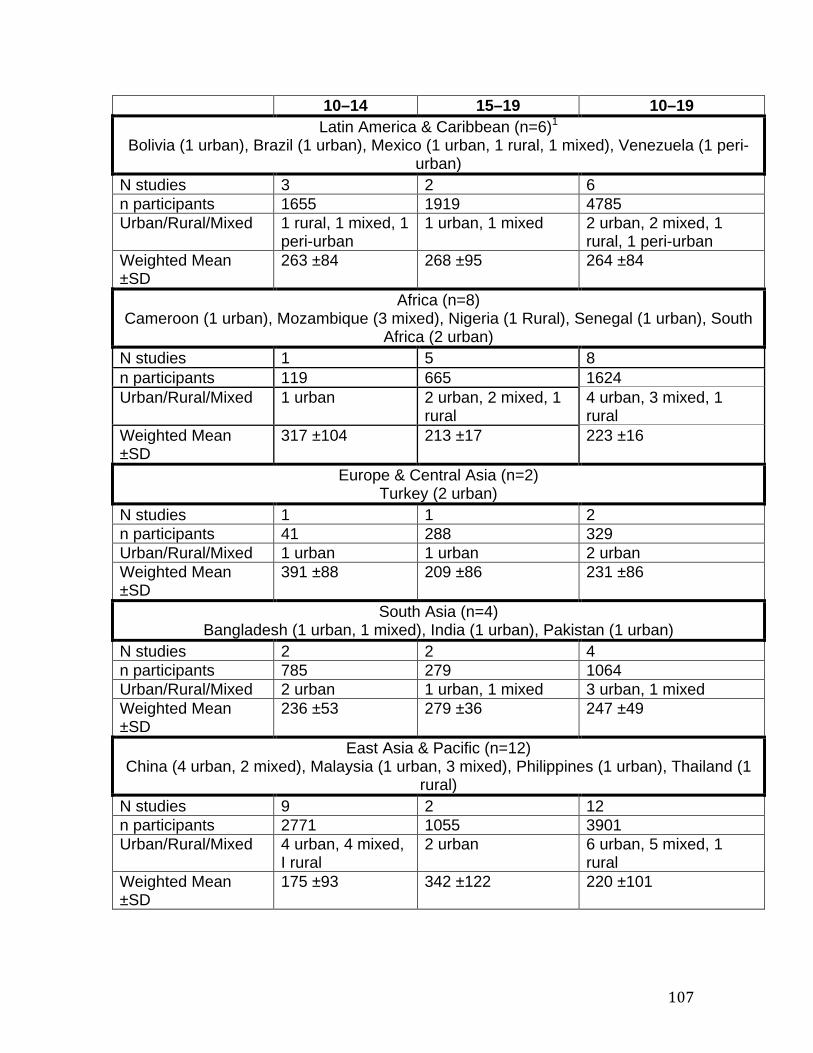
107
10–14 15–19 10–19 Latin America & Caribbean (n=6) P
1
Bolivia (1 urban), Brazil (1 urban), Mexico (1 urban, 1 rural, 1 mixed), Venezuela (1 peri-urban)
N studies 3 2 6 n participants 1655 1919 4785 Urban/Rural/Mixed 1 rural, 1 mixed, 1
peri-urban 1 urban, 1 mixed 2 urban, 2 mixed, 1
rural, 1 peri-urban Weighted Mean ±SD
263 ±84 268 ±95 264 ±84
Africa (n=8)
Cameroon (1 urban), Mozambique (3 mixed), Nigeria (1 Rural), Senegal (1 urban), South Africa (2 urban)
N studies 1 5 8 n participants 119 665 1624 Urban/Rural/Mixed 1 urban 2 urban, 2 mixed, 1
rural 4 urban, 3 mixed, 1 rural
Weighted Mean ±SD
317 ±104 213 ±17 223 ±16
Europe & Central Asia (n=2)
Turkey (2 urban) N studies 1 1 2 n participants 41 288 329 Urban/Rural/Mixed 1 urban 1 urban 2 urban Weighted Mean ±SD
391 ±88 209 ±86 231 ±86
South Asia (n=4) Bangladesh (1 urban, 1 mixed), India (1 urban), Pakistan (1 urban)
N studies 2 2 4 n participants 785 279 1064 Urban/Rural/Mixed 2 urban 1 urban, 1 mixed 3 urban, 1 mixed Weighted Mean ±SD
236 ±53 279 ±36 247 ±49
East Asia & Pacific (n=12) China (4 urban, 2 mixed), Malaysia (1 urban, 3 mixed), Philippines (1 urban), Thailand (1
rural) N studies 9 2 12 n participants 2771 1055 3901 Urban/Rural/Mixed 4 urban, 4 mixed,
I rural 2 urban 6 urban, 5 mixed, 1
rural Weighted Mean ±SD
175 ±93 342 ±122 220 ±101
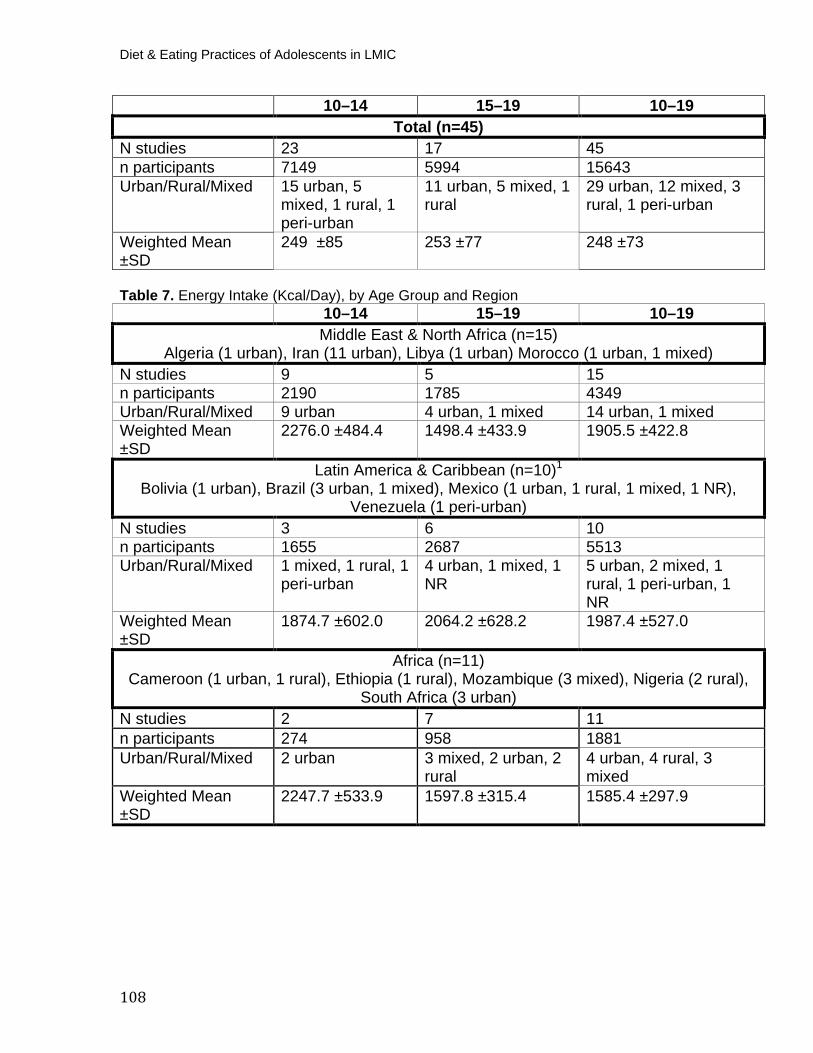
Diet & Eating Practices of Adolescents in LMIC
108
10–14 15–19 10–19 Total (n=45)
N studies 23 17 45 n participants 7149 5994 15643 Urban/Rural/Mixed 15 urban, 5
mixed, 1 rural, 1 peri-urban
11 urban, 5 mixed, 1 rural
29 urban, 12 mixed, 3 rural, 1 peri-urban
Weighted Mean ±SD
249 ±85 253 ±77 248 ±73
Table 7. Energy Intake (Kcal/Day), by Age Group and Region
10–14 15–19 10–19 Middle East & North Africa (n=15)
Algeria (1 urban), Iran (11 urban), Libya (1 urban) Morocco (1 urban, 1 mixed) N studies 9 5 15 n participants 2190 1785 4349 Urban/Rural/Mixed 9 urban 4 urban, 1 mixed 14 urban, 1 mixed Weighted Mean ±SD
2276.0 ±484.4 1498.4 ±433.9 1905.5 ±422.8
Latin America & Caribbean (n=10) P
1
Bolivia (1 urban), Brazil (3 urban, 1 mixed), Mexico (1 urban, 1 rural, 1 mixed, 1 NR), Venezuela (1 peri-urban)
N studies 3 6 10 n participants 1655 2687 5513 Urban/Rural/Mixed 1 mixed, 1 rural, 1
peri-urban 4 urban, 1 mixed, 1 NR
5 urban, 2 mixed, 1 rural, 1 peri-urban, 1 NR
Weighted Mean ±SD
1874.7 ±602.0 2064.2 ±628.2 1987.4 ±527.0
Africa (n=11)
Cameroon (1 urban, 1 rural), Ethiopia (1 rural), Mozambique (3 mixed), Nigeria (2 rural), South Africa (3 urban)
N studies 2 7 11 n participants 274 958 1881 Urban/Rural/Mixed 2 urban 3 mixed, 2 urban, 2
rural 4 urban, 4 rural, 3 mixed
Weighted Mean ±SD
2247.7 ±533.9 1597.8 ±315.4 1585.4 ±297.9
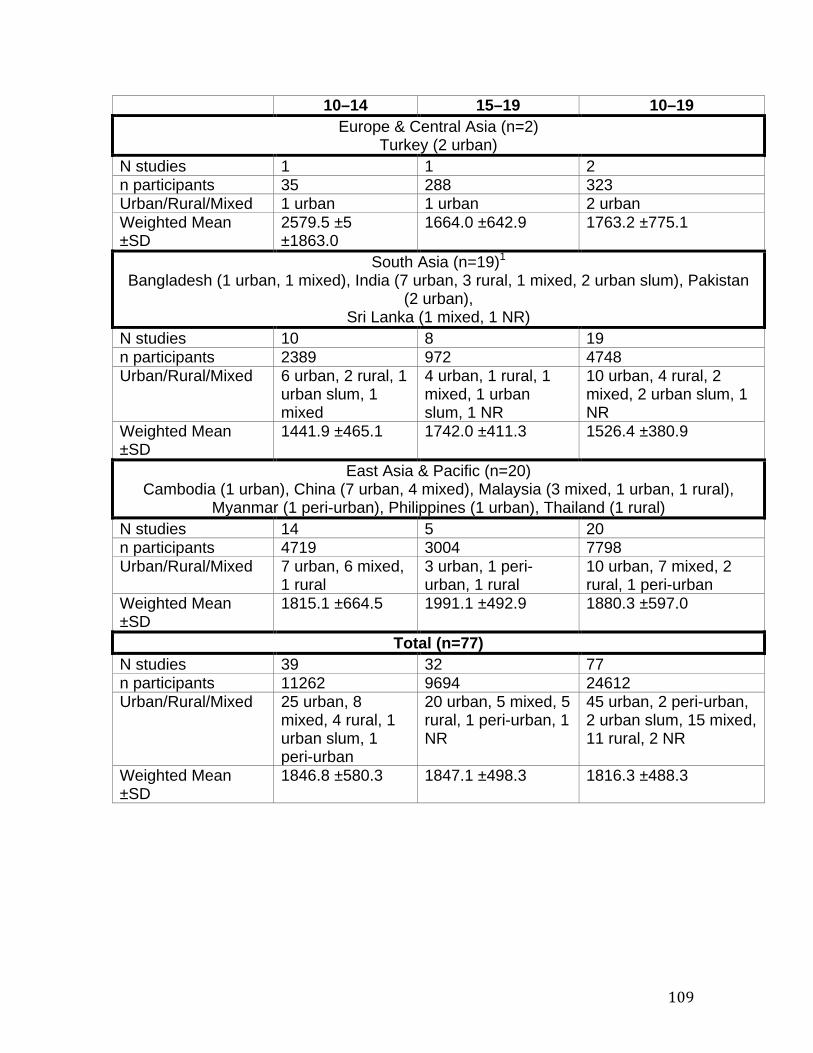
109
10–14 15–19 10–19 Europe & Central Asia (n=2)
Turkey (2 urban) N studies 1 1 2 n participants 35 288 323 Urban/Rural/Mixed 1 urban 1 urban 2 urban Weighted Mean ±SD
2579.5 ±5 ±1863.0
1664.0 ±642.9 1763.2 ±775.1
South Asia (n=19) P
1
Bangladesh (1 urban, 1 mixed), India (7 urban, 3 rural, 1 mixed, 2 urban slum), Pakistan (2 urban),
Sri Lanka (1 mixed, 1 NR) N studies 10 8 19 n participants 2389 972 4748 Urban/Rural/Mixed 6 urban, 2 rural, 1
urban slum, 1 mixed
4 urban, 1 rural, 1 mixed, 1 urban slum, 1 NR
10 urban, 4 rural, 2 mixed, 2 urban slum, 1 NR
Weighted Mean ±SD
1441.9 ±465.1 1742.0 ±411.3 1526.4 ±380.9
East Asia & Pacific (n=20) Cambodia (1 urban), China (7 urban, 4 mixed), Malaysia (3 mixed, 1 urban, 1 rural),
Myanmar (1 peri-urban), Philippines (1 urban), Thailand (1 rural) N studies 14 5 20 n participants 4719 3004 7798 Urban/Rural/Mixed 7 urban, 6 mixed,
1 rural 3 urban, 1 peri-urban, 1 rural
10 urban, 7 mixed, 2 rural, 1 peri-urban
Weighted Mean ±SD
1815.1 ±664.5 1991.1 ±492.9 1880.3 ±597.0
Total (n=77) N studies 39 32 77 n participants 11262 9694 24612 Urban/Rural/Mixed 25 urban, 8
mixed, 4 rural, 1 urban slum, 1 peri-urban
20 urban, 5 mixed, 5 rural, 1 peri-urban, 1 NR
45 urban, 2 peri-urban, 2 urban slum, 15 mixed, 11 rural, 2 NR
Weighted Mean ±SD
1846.8 ±580.3 1847.1 ±498.3 1816.3 ±488.3
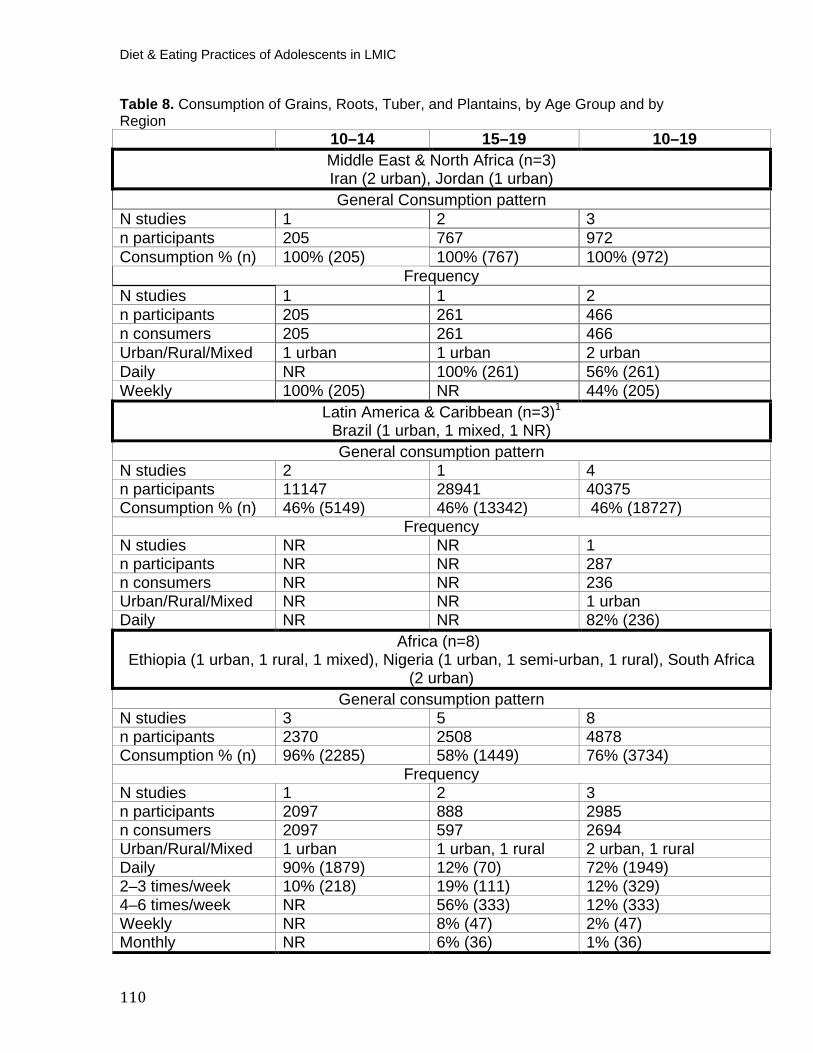
Diet & Eating Practices of Adolescents in LMIC
110
Table 8. Consumption of Grains, Roots, Tuber, and Plantains, by Age Group and by Region
10–14 15–19 10–19 Middle East & North Africa (n=3) Iran (2 urban), Jordan (1 urban) General Consumption pattern
N studies 1 2 3 n participants 205 767 972 Consumption % (n) 100% (205) 100% (767) 100% (972)
Frequency N studies 1 1 2 n participants 205 261 466 n consumers 205 261 466 Urban/Rural/Mixed 1 urban 1 urban 2 urban Daily NR 100% (261) 56% (261) Weekly 100% (205) NR 44% (205)
Latin America & Caribbean (n=3) P
1
Brazil (1 urban, 1 mixed, 1 NR) General consumption pattern
N studies 2 1 4 n participants 11147 28941 40375 Consumption % (n) 46% (5149) 46% (13342) 46% (18727)
Frequency N studies NR NR 1 n participants NR NR 287 n consumers NR NR 236 Urban/Rural/Mixed NR NR 1 urban Daily NR NR 82% (236) Africa (n=8)
Ethiopia (1 urban, 1 rural, 1 mixed), Nigeria (1 urban, 1 semi-urban, 1 rural), South Africa (2 urban)
General consumption pattern N studies 3 5 8 n participants 2370 2508 4878 Consumption % (n) 96% (2285) 58% (1449) 76% (3734)
Frequency N studies 1 2 3 n participants 2097 888 2985 n consumers 2097 597 2694 Urban/Rural/Mixed 1 urban 1 urban, 1 rural 2 urban, 1 rural Daily 90% (1879) 12% (70) 72% (1949) 2–3 times/week 10% (218) 19% (111) 12% (329) 4–6 times/week NR 56% (333) 12% (333) Weekly NR 8% (47) 2% (47) Monthly NR 6% (36) 1% (36)
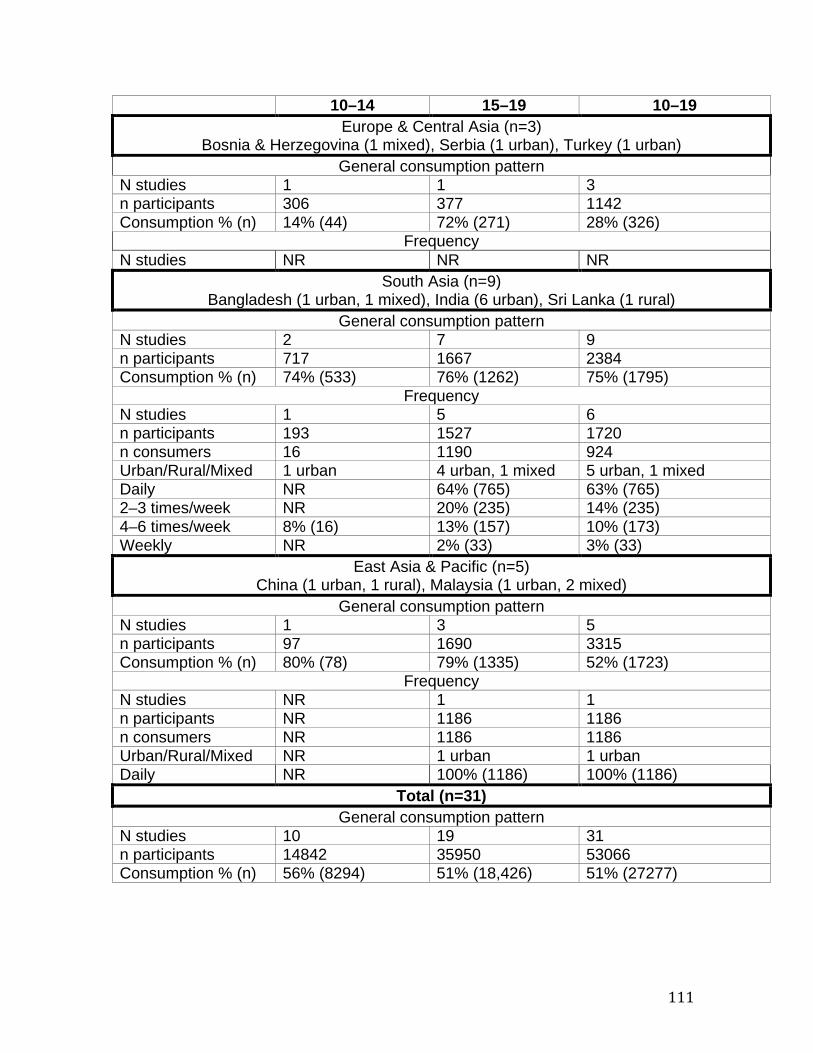
111
10–14 15–19 10–19 Europe & Central Asia (n=3)
Bosnia & Herzegovina (1 mixed), Serbia (1 urban), Turkey (1 urban) General consumption pattern
N studies 1 1 3 n participants 306 377 1142 Consumption % (n) 14% (44) 72% (271) 28% (326)
Frequency N studies NR NR NR
South Asia (n=9) Bangladesh (1 urban, 1 mixed), India (6 urban), Sri Lanka (1 rural)
General consumption pattern N studies 2 7 9 n participants 717 1667 2384 Consumption % (n) 74% (533) 76% (1262) 75% (1795)
Frequency N studies 1 5 6 n participants 193 1527 1720 n consumers 16 1190 924 Urban/Rural/Mixed 1 urban 4 urban, 1 mixed 5 urban, 1 mixed Daily NR 64% (765) 63% (765) 2–3 times/week NR 20% (235) 14% (235) 4–6 times/week 8% (16) 13% (157) 10% (173) Weekly NR 2% (33) 3% (33)
East Asia & Pacific (n=5) China (1 urban, 1 rural), Malaysia (1 urban, 2 mixed)
General consumption pattern N studies 1 3 5 n participants 97 1690 3315 Consumption % (n) 80% (78) 79% (1335) 52% (1723)
Frequency N studies NR 1 1 n participants NR 1186 1186 n consumers NR 1186 1186 Urban/Rural/Mixed NR 1 urban 1 urban Daily NR 100% (1186) 100% (1186) Total (n=31) P
General consumption pattern
N studies 10 19 31 n participants 14842 35950 53066 Consumption % (n) 56% (8294) 51% (18,426) 51% (27277)
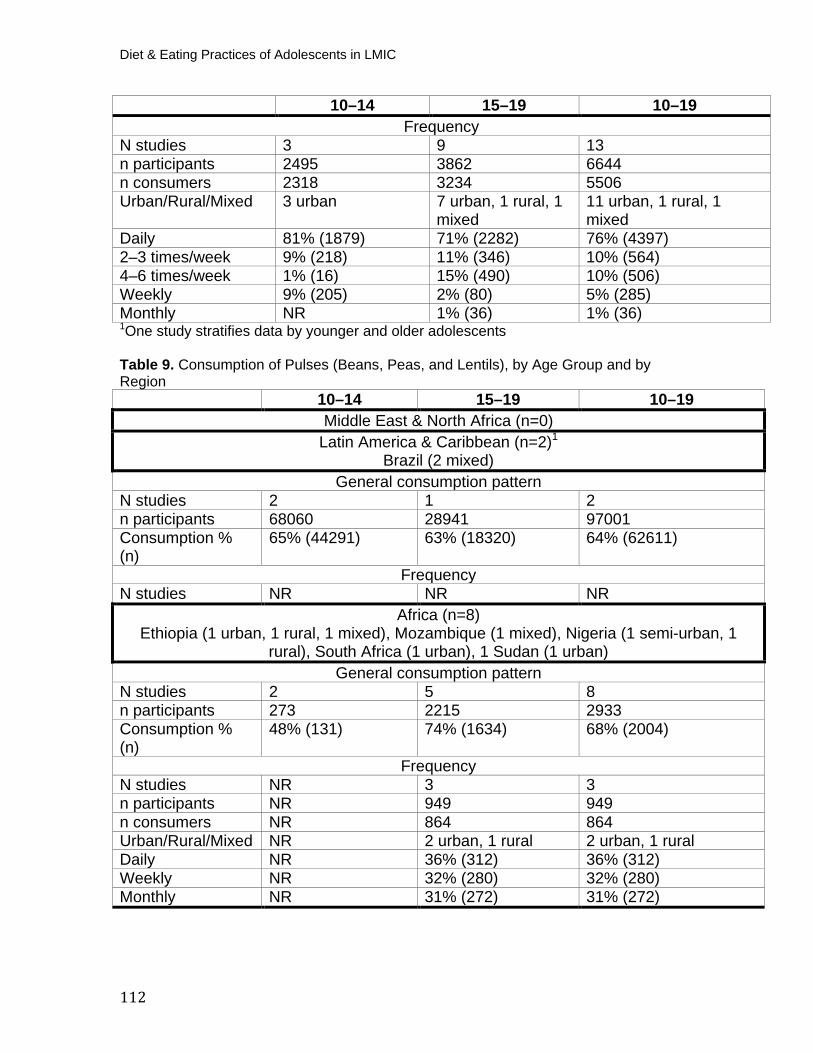
Diet & Eating Practices of Adolescents in LMIC
112
10–14 15–19 10–19 Frequency
N studies 3 9 13 n participants 2495 3862 6644 n consumers 2318 3234 5506 Urban/Rural/Mixed 3 urban 7 urban, 1 rural, 1
mixed 11 urban, 1 rural, 1 mixed
Daily 81% (1879) 71% (2282) 76% (4397) 2–3 times/week 9% (218) 11% (346) 10% (564) 4–6 times/week 1% (16) 15% (490) 10% (506) Weekly 9% (205) 2% (80) 5% (285) Monthly NR 1% (36) 1% (36) P
1POne study stratifies data by younger and older adolescents
Table 9. Consumption of Pulses (Beans, Peas, and Lentils), by Age Group and by Region
10–14 15–19 10–19 Middle East & North Africa (n=0)
Latin America & Caribbean (n=2) P
1
Brazil (2 mixed) General consumption pattern
N studies 2 1 2 n participants 68060 28941 97001 Consumption % (n)
65% (44291) 63% (18320) 64% (62611)
Frequency N studies NR NR NR
Africa (n=8)Ethiopia (1 urban, 1 rural, 1 mixed), Mozambique (1 mixed), Nigeria (1 semi-urban, 1
rural), South Africa (1 urban), 1 Sudan (1 urban) General consumption pattern
N studies 2 5 8 n participants 273 2215 2933 Consumption % (n)
48% (131) 74% (1634) 68% (2004)
Frequency N studies NR 3 3 n participants NR 949 949 n consumers NR 864 864 Urban/Rural/Mixed NR 2 urban, 1 rural 2 urban, 1 rural Daily NR 36% (312) 36% (312) Weekly NR 32% (280) 32% (280) Monthly NR 31% (272) 31% (272)
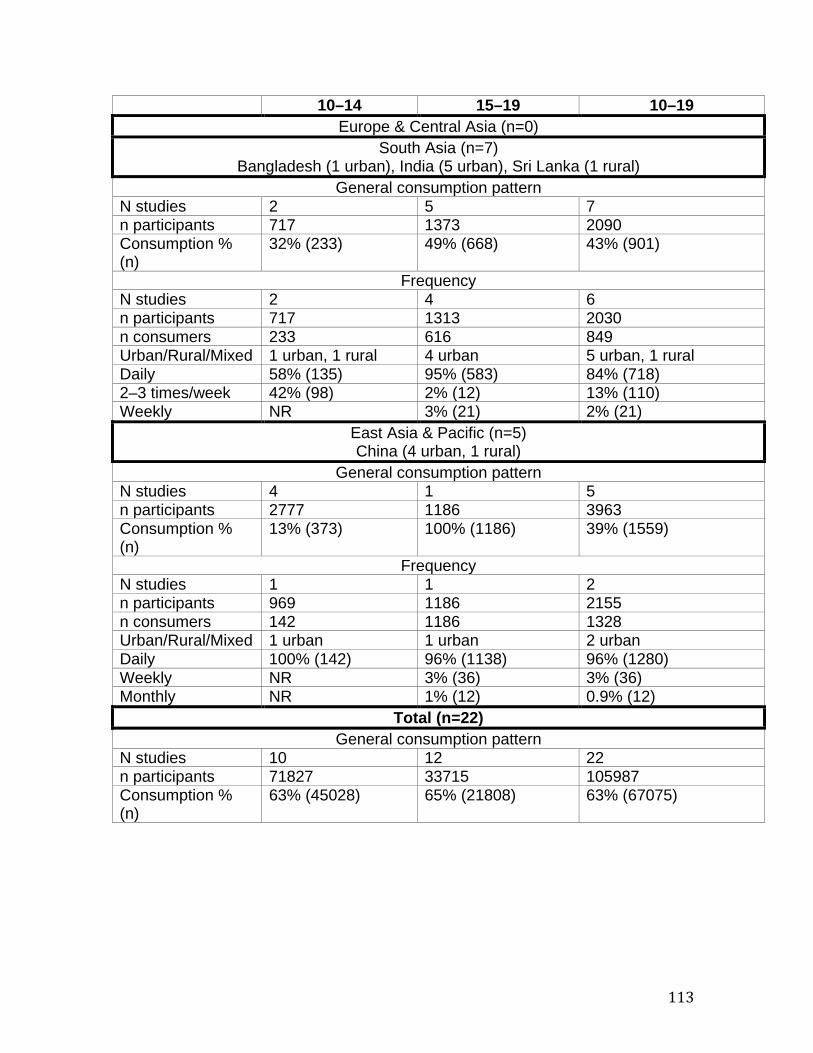
113
10–14 15–19 10–19 Europe & Central Asia (n=0)
South Asia (n=7) Bangladesh (1 urban), India (5 urban), Sri Lanka (1 rural)
General consumption pattern N studies 2 5 7 n participants 717 1373 2090 Consumption % (n)
32% (233) 49% (668) 43% (901)
Frequency N studies 2 4 6 n participants 717 1313 2030 n consumers 233 616 849 Urban/Rural/Mixed 1 urban, 1 rural 4 urban 5 urban, 1 rural Daily 58% (135) 95% (583) 84% (718) 2–3 times/week 42% (98) 2% (12) 13% (110) Weekly NR 3% (21) 2% (21)
East Asia & Pacific (n=5) China (4 urban, 1 rural)
General consumption pattern N studies 4 1 5 n participants 2777 1186 3963 Consumption % (n)
13% (373) 100% (1186) 39% (1559)
Frequency N studies 1 1 2 n participants 969 1186 2155 n consumers 142 1186 1328 Urban/Rural/Mixed 1 urban 1 urban 2 urban Daily 100% (142) 96% (1138) 96% (1280) Weekly NR 3% (36) 3% (36) Monthly NR 1% (12) 0.9% (12)
Total (n=22) General consumption pattern
N studies 10 12 22 n participants 71827 33715 105987 Consumption % (n)
63% (45028) 65% (21808) 63% (67075)
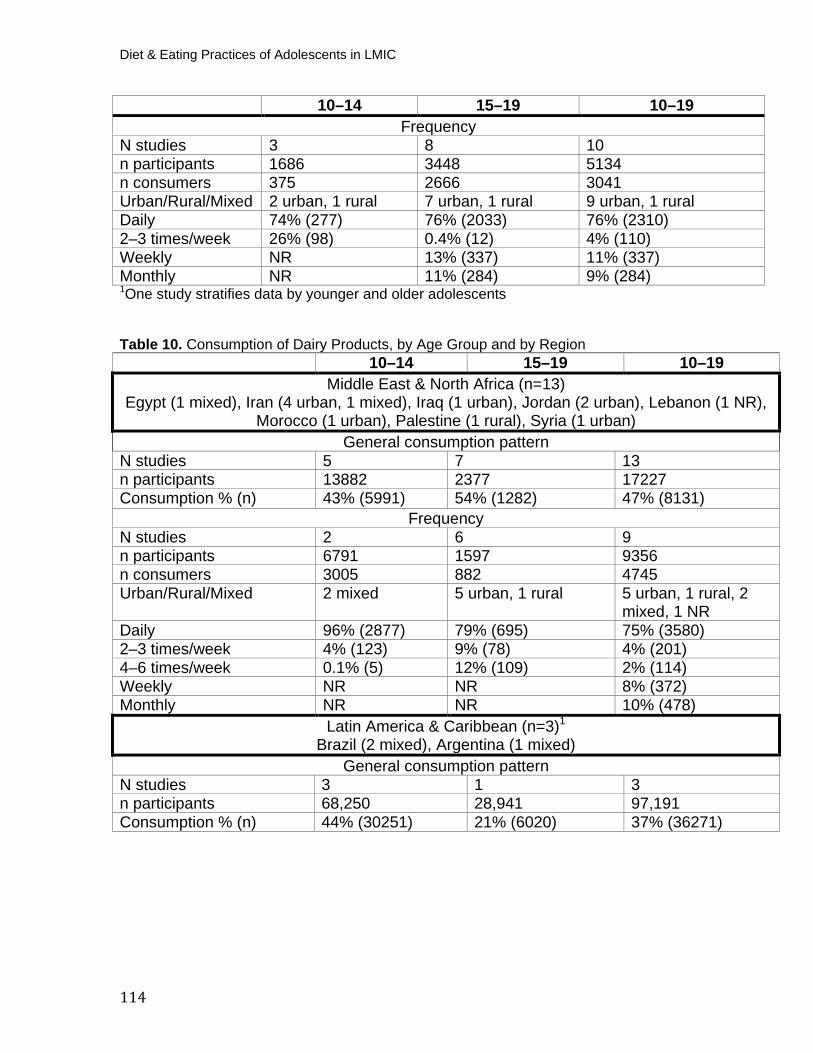
Diet & Eating Practices of Adolescents in LMIC
114
10–14 15–19 10–19 Frequency
N studies 3 8 10 n participants 1686 3448 5134 n consumers 375 2666 3041 Urban/Rural/Mixed 2 urban, 1 rural 7 urban, 1 rural 9 urban, 1 rural Daily 74% (277) 76% (2033) 76% (2310) 2–3 times/week 26% (98) 0.4% (12) 4% (110) Weekly NR 13% (337) 11% (337) Monthly NR 11% (284) 9% (284) P
1POne study stratifies data by younger and older adolescents
Table 10. Consumption of Dairy Products, by Age Group and by Region 10–14 15–19 10–19
Middle East & North Africa (n=13) Egypt (1 mixed), Iran (4 urban, 1 mixed), Iraq (1 urban), Jordan (2 urban), Lebanon (1 NR),
Morocco (1 urban), Palestine (1 rural), Syria (1 urban) General consumption pattern
N studies 5 7 13 n participants 13882 2377 17227 Consumption % (n) 43% (5991) 54% (1282) 47% (8131)
Frequency N studies 2 6 9 n participants 6791 1597 9356 n consumers 3005 882 4745 Urban/Rural/Mixed 2 mixed 5 urban, 1 rural 5 urban, 1 rural, 2
mixed, 1 NR Daily 96% (2877) 79% (695) 75% (3580) 2–3 times/week 4% (123) 9% (78) 4% (201) 4–6 times/week 0.1% (5) 12% (109) 2% (114) Weekly NR NR 8% (372) Monthly NR NR 10% (478)
Latin America & Caribbean (n=3) P
1
Brazil (2 mixed), Argentina (1 mixed) General consumption pattern
N studies 3 1 3 n participants 68,250 28,941 97,191 Consumption % (n) 44% (30251) 21% (6020) 37% (36271)
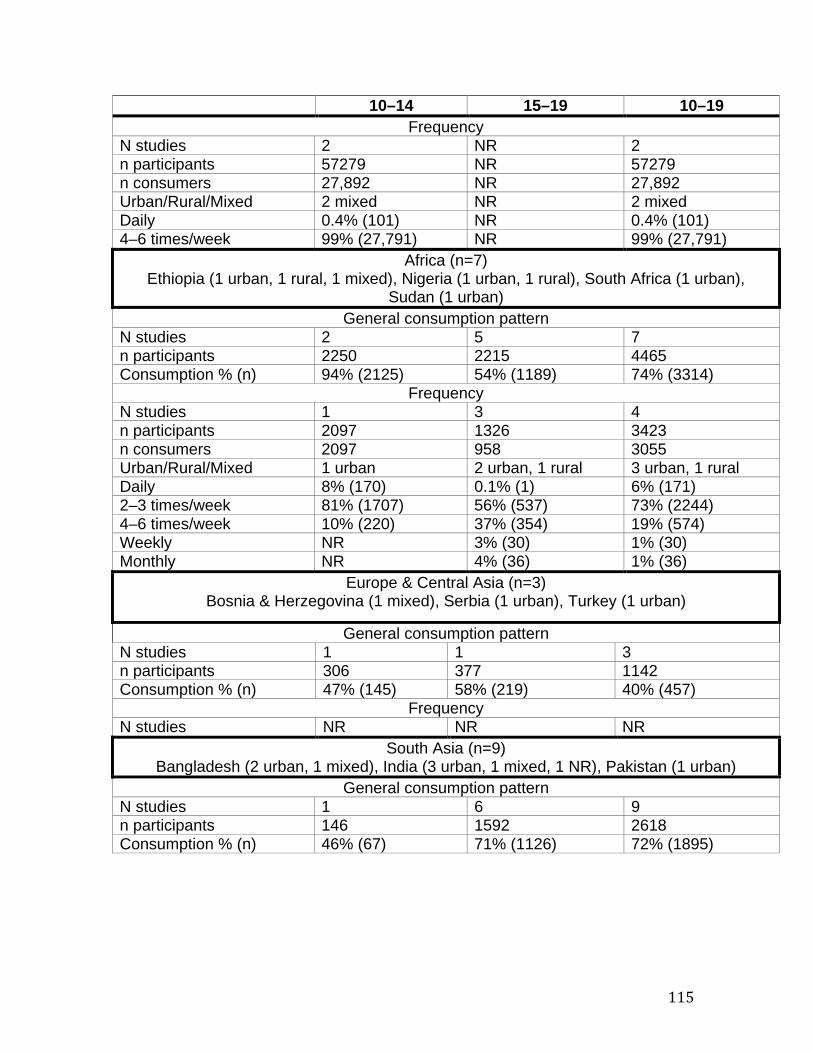
115
10–14 15–19 10–19 Frequency
N studies 2 NR 2 n participants 57279 NR 57279 n consumers 27,892 NR 27,892 Urban/Rural/Mixed 2 mixed NR 2 mixed Daily 0.4% (101) NR 0.4% (101) 4–6 times/week 99% (27,791) NR 99% (27,791)
Africa (n=7) Ethiopia (1 urban, 1 rural, 1 mixed), Nigeria (1 urban, 1 rural), South Africa (1 urban),
Sudan (1 urban) General consumption pattern
N studies 2 5 7 n participants 2250 2215 4465 Consumption % (n) 94% (2125) 54% (1189) 74% (3314)
Frequency N studies 1 3 4 n participants 2097 1326 3423 n consumers 2097 958 3055 Urban/Rural/Mixed 1 urban 2 urban, 1 rural 3 urban, 1 rural Daily 8% (170) 0.1% (1) 6% (171) 2–3 times/week 81% (1707) 56% (537) 73% (2244) 4–6 times/week 10% (220) 37% (354) 19% (574) Weekly NR 3% (30) 1% (30) Monthly NR 4% (36) 1% (36)
Europe & Central Asia (n=3) Bosnia & Herzegovina (1 mixed), Serbia (1 urban), Turkey (1 urban)
General consumption pattern N studies 1 1 3 n participants 306 377 1142 Consumption % (n) 47% (145) 58% (219) 40% (457)
Frequency N studies NR NR NR
South Asia (n=9) Bangladesh (2 urban, 1 mixed), India (3 urban, 1 mixed, 1 NR), Pakistan (1 urban)
General consumption pattern N studies 1 6 9 n participants 146 1592 2618 Consumption % (n) 46% (67) 71% (1126) 72% (1895)

Diet & Eating Practices of Adolescents in LMIC
116
10–14 15–19 10–19 Frequency
N studies NR 6 8 n participants NR 1592 2472 n consumers NR 1063 1483 Urban/Rural/Mixed NR 5 urban, 1 mixed 6 urban, 2 mixed Daily NR 53% (561) 71% (1250) 2–3 times/week NR 33% (348) 20% (355) 4–6 times/week NR 10% (106) 6% (112) Weekly NR 5% (48) 3% (48)
East Asia & Pacific (n=7) China (3 urban, 2 rural), Malaysia (1 urban, 1 rural)
General consumption pattern N studies 4 3 7 n participants 3526 1540 5066 Consumption % (n) 24% (851) 79% (1220) 41% (2071)
Frequency N studies 2 1 3 n participants 1547 1186 2733 n consumers 179 1186 1365 Urban/Rural/Mixed 2 rural 1 urban 1 urban, 2 rural Daily 11% (19) 100% (1186) 88% (1205) 4–6 times/week 89% (160) NR 12% (160)
Total (n=42) General consumption pattern
N studies 16 23 42 n participants 88360 37042 127709 Consumption % (n) 45% (39430) 30% (11056) 41% (52139)
Frequency N studies 7 16 26 n participants 67,714 5701 38540 n consumers 33,173 4089 Urban/Rural/Mixed 1 urban, 2 rural, 4
mixed 13 urban, 3 rural 15 urban, 5 rural, 5
mixed, 1 NR Daily 10% (3167) 60% (2443) 16% (6307) 2–3 times/week 6%% (1830) 24% (963) 7% (2800) 4–6 times/week 85% (28176) 14% (569) 74% (28751) Weekly NR 2% (78) 1% (450) Monthly NR 1% (36) 1% (514) P
1POne study stratifies data by younger and older adolescents
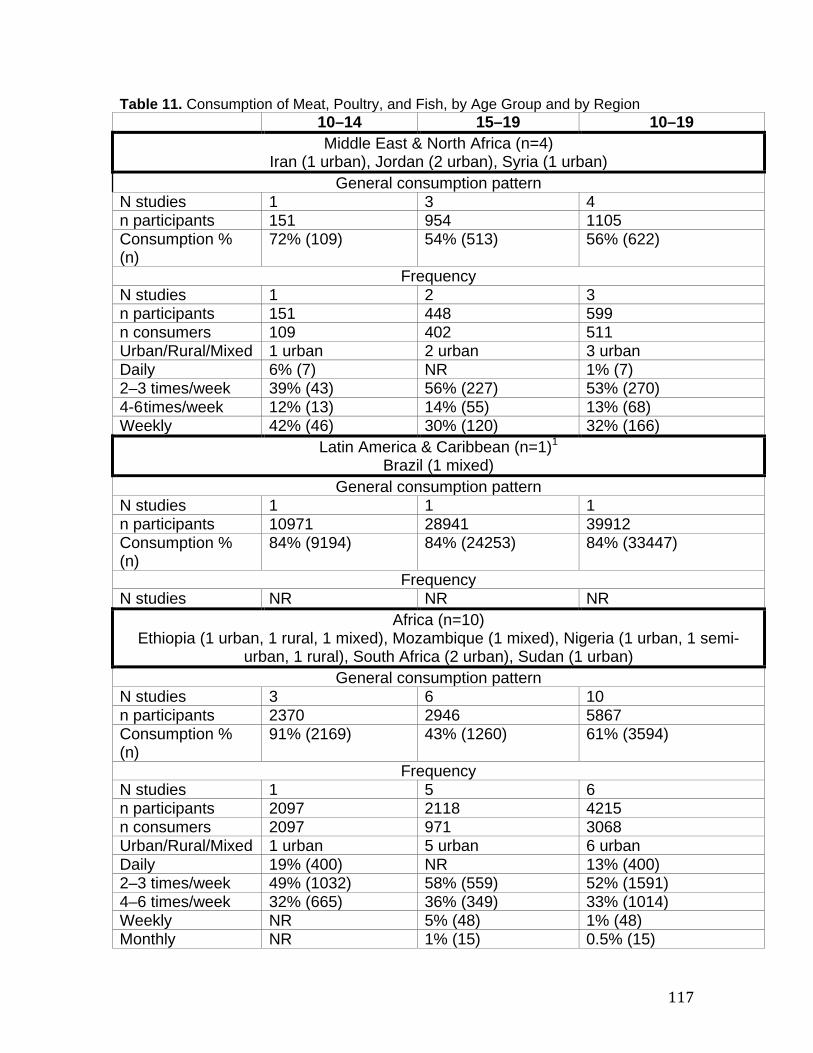
117
Table 11. Consumption of Meat, Poultry, and Fish, by Age Group and by Region 10–14 15–19 10–19
Middle East & North Africa (n=4) Iran (1 urban), Jordan (2 urban), Syria (1 urban)
General consumption pattern N studies 1 3 4 n participants 151 954 1105 Consumption % (n)
72% (109) 54% (513) 56% (622)
Frequency N studies 1 2 3 n participants 151 448 599 n consumers 109 402 511 Urban/Rural/Mixed 1 urban 2 urban 3 urban Daily 6% (7) NR 1% (7) 2–3 times/week 39% (43) 56% (227) 53% (270) 4-6 times/week 12% (13) 14% (55) 13% (68) Weekly 42% (46) 30% (120) 32% (166)
Latin America & Caribbean (n=1) P
1
Brazil (1 mixed) General consumption pattern
N studies 1 1 1 n participants 10971 28941 39912 Consumption % (n)
84% (9194) 84% (24253) 84% (33447)
Frequency N studies NR NR NR
Africa (n=10)
Ethiopia (1 urban, 1 rural, 1 mixed), Mozambique (1 mixed), Nigeria (1 urban, 1 semi-urban, 1 rural), South Africa (2 urban), Sudan (1 urban)
General consumption pattern N studies 3 6 10 n participants 2370 2946 5867 Consumption % (n)
91% (2169) 43% (1260) 61% (3594)
Frequency N studies 1 5 6 n participants 2097 2118 4215 n consumers 2097 971 3068 Urban/Rural/Mixed 1 urban 5 urban 6 urban Daily 19% (400) NR 13% (400) 2–3 times/week 49% (1032) 58% (559) 52% (1591) 4–6 times/week 32% (665) 36% (349) 33% (1014) Weekly NR 5% (48) 1% (48) Monthly NR 1% (15) 0.5% (15)

Diet & Eating Practices of Adolescents in LMIC
118
10–14 15–19 10–19 Europe & Central Asia (n=4)P
1
Serbia (1 urban), Turkey (2 urban), multi-country (Turkey and Albania, 1 mixed) General consumption pattern
N studies 2 2 4 n participants 370 1287 2116 Consumption % (n)
58% (218) 89% (1140) 66% (1400)
Frequency N studies 1 NR 2 n participants 306 NR 1427 n consumers 197 NR 1206 Urban/Rural/Mixed 1 mixed NR 1 urban, 1 mixed Daily NR NR 63% (755) 2–3 times/week 100% (197) NR 16% (197) Weekly NR NR 21% (254)
South Asia (n=11) Bangladesh (2 urban, 1 mixed), India (4 urban, 1 NR, 1 urban slum), Pakistan (1 urban),
Sri Lanka (1 rural) General consumption pattern
N studies 1 10 11 n participants 524 2407 2931 Consumption % (n)
45% (238) 42% (1014) 43% (1252)
Frequency N studies 1 9 10 n participants 524 2154 2678 n consumers 238 998 1236 Urban/Rural/Mixed 1 rural 7 urban, 1 urban
slum, 1 mixed 7 urban, 1 urban slum, 1 mixed, 1 rural
Daily 100% (238) 60% (604) 68% (842) 2–3 times/week NR 22% (220) 18% (220) 4–6 times/week NR 17% (167) 13% (167) Monthly NR 0.7% (7) 0.6% (7)
East Asia & Pacific (n=4) China (3 urban, 1 rural)
General consumption pattern N studies 3 1 4 n participants 2665 1186 3851 Consumption % (n)
33% (877) 100% (1186) 54% (2063)
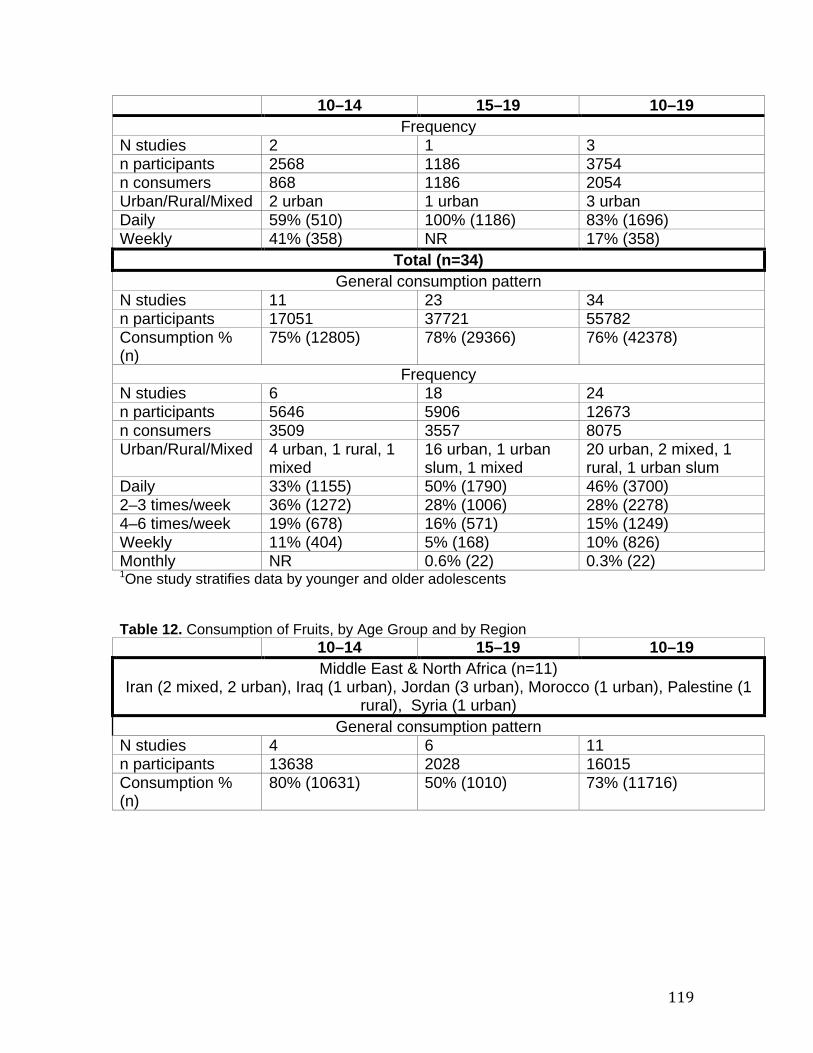
119
10–14 15–19 10–19 Frequency
N studies 2 1 3 n participants 2568 1186 3754 n consumers 868 1186 2054 Urban/Rural/Mixed 2 urban 1 urban 3 urban Daily 59% (510) 100% (1186) 83% (1696) Weekly 41% (358) NR 17% (358)
Total (n=34) General consumption pattern
N studies 11 23 34 n participants 17051 37721 55782 Consumption % (n)
75% (12805) 78% (29366) 76% (42378)
Frequency N studies 6 18 24 n participants 5646 5906 12673 n consumers 3509 3557 8075 Urban/Rural/Mixed 4 urban, 1 rural, 1
mixed 16 urban, 1 urban slum, 1 mixed
20 urban, 2 mixed, 1 rural, 1 urban slum
Daily 33% (1155) 50% (1790) 46% (3700) 2–3 times/week 36% (1272) 28% (1006) 28% (2278) 4–6 times/week 19% (678) 16% (571) 15% (1249) Weekly 11% (404) 5% (168) 10% (826) Monthly NR 0.6% (22) 0.3% (22) P
1POne study stratifies data by younger and older adolescents
Table 12. Consumption of Fruits, by Age Group and by Region 10–14 15–19 10–19 Middle East & North Africa (n=11)
Iran (2 mixed, 2 urban), Iraq (1 urban), Jordan (3 urban), Morocco (1 urban), Palestine (1 rural), Syria (1 urban)
General consumption pattern N studies 4 6 11 n participants 13638 2028 16015 Consumption % (n)
80% (10631) 50% (1010) 73% (11716)
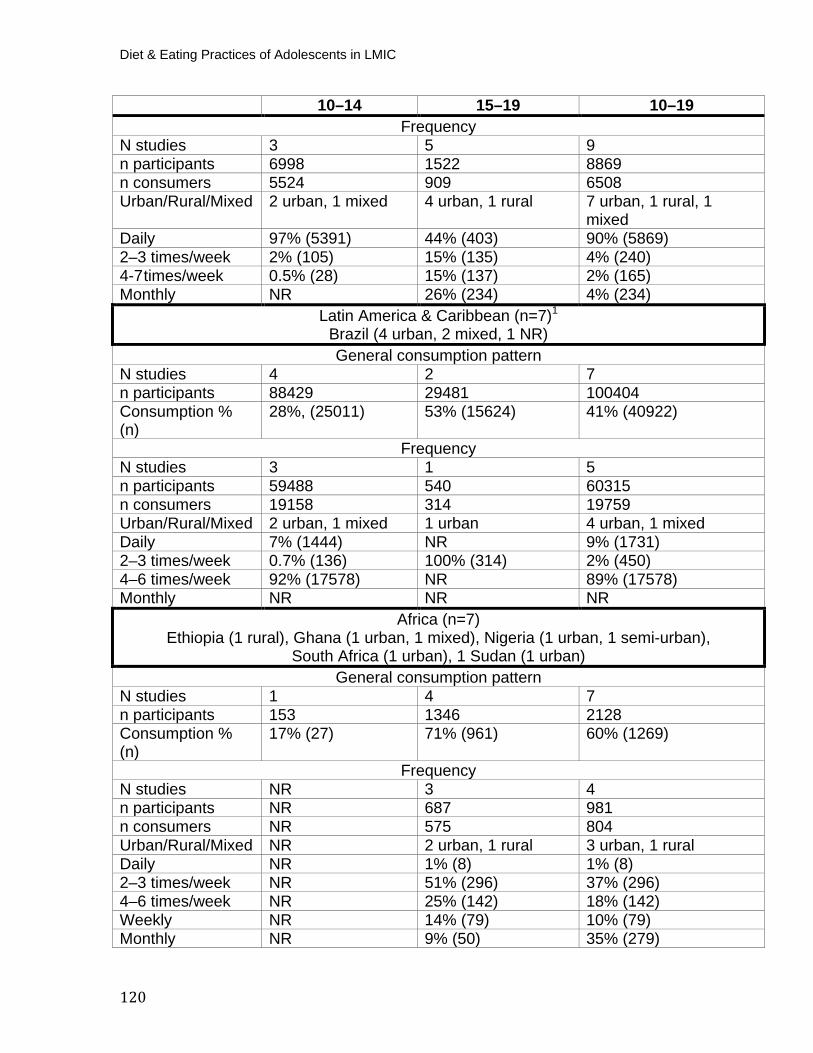
Diet & Eating Practices of Adolescents in LMIC
120
10–14 15–19 10–19 Frequency
N studies 3 5 9 n participants 6998 1522 8869 n consumers 5524 909 6508 Urban/Rural/Mixed 2 urban, 1 mixed 4 urban, 1 rural 7 urban, 1 rural, 1
mixed Daily 97% (5391) 44% (403) 90% (5869) 2–3 times/week 2% (105) 15% (135) 4% (240) 4-7 times/week 0.5% (28) 15% (137) 2% (165) Monthly NR 26% (234) 4% (234)
Latin America & Caribbean (n=7) P
1
Brazil (4 urban, 2 mixed, 1 NR) General consumption pattern
N studies 4 2 7 n participants 88429 29481 100404 Consumption % (n)
28%, (25011) 53% (15624) 41% (40922)
Frequency N studies 3 1 5 n participants 59488 540 60315 n consumers 19158 314 19759 Urban/Rural/Mixed 2 urban, 1 mixed 1 urban 4 urban, 1 mixed Daily 7% (1444) NR 9% (1731) 2–3 times/week 0.7% (136) 100% (314) 2% (450) 4–6 times/week 92% (17578) NR 89% (17578) Monthly NR NR NR
Africa (n=7)Ethiopia (1 rural), Ghana (1 urban, 1 mixed), Nigeria (1 urban, 1 semi-urban),
South Africa (1 urban), 1 Sudan (1 urban) General consumption pattern
N studies 1 4 7 n participants 153 1346 2128 Consumption % (n)
17% (27) 71% (961) 60% (1269)
Frequency N studies NR 3 4 n participants NR 687 981 n consumers NR 575 804 Urban/Rural/Mixed NR 2 urban, 1 rural 3 urban, 1 rural Daily NR 1% (8) 1% (8) 2–3 times/week NR 51% (296) 37% (296) 4–6 times/week NR 25% (142) 18% (142) Weekly NR 14% (79) 10% (79) Monthly NR 9% (50) 35% (279)
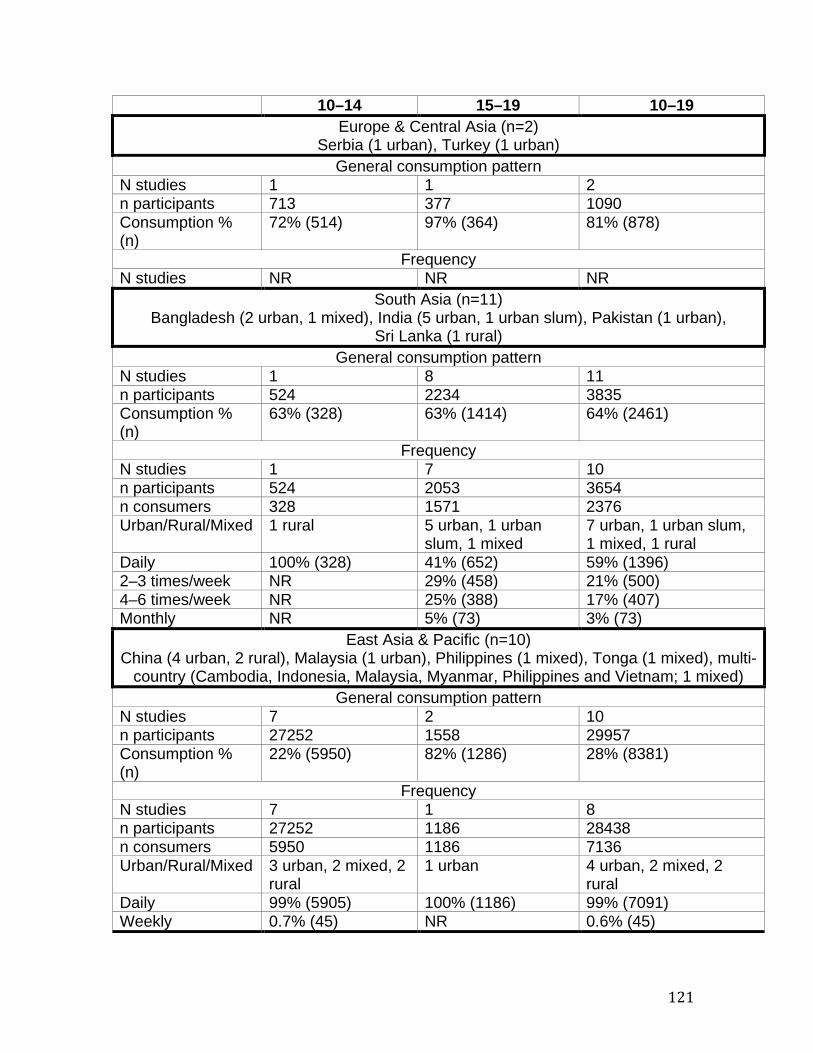
121
10–14 15–19 10–19 Europe & Central Asia (n=2)
Serbia (1 urban), Turkey (1 urban) General consumption pattern
N studies 1 1 2 n participants 713 377 1090 Consumption % (n)
72% (514) 97% (364) 81% (878)
Frequency N studies NR NR NR
South Asia (n=11) Bangladesh (2 urban, 1 mixed), India (5 urban, 1 urban slum), Pakistan (1 urban),
Sri Lanka (1 rural) General consumption pattern
N studies 1 8 11 n participants 524 2234 3835 Consumption % (n)
63% (328) 63% (1414) 64% (2461)
Frequency N studies 1 7 10 n participants 524 2053 3654 n consumers 328 1571 2376 Urban/Rural/Mixed 1 rural 5 urban, 1 urban
slum, 1 mixed 7 urban, 1 urban slum, 1 mixed, 1 rural
Daily 100% (328) 41% (652) 59% (1396) 2–3 times/week NR 29% (458) 21% (500) 4–6 times/week NR 25% (388) 17% (407) Monthly NR 5% (73) 3% (73)
East Asia & Pacific (n=10) China (4 urban, 2 rural), Malaysia (1 urban), Philippines (1 mixed), Tonga (1 mixed), multi-
country (Cambodia, Indonesia, Malaysia, Myanmar, Philippines and Vietnam; 1 mixed) General consumption pattern
N studies 7 2 10 n participants 27252 1558 29957 Consumption % (n)
22% (5950) 82% (1286) 28% (8381)
Frequency N studies 7 1 8 n participants 27252 1186 28438 n consumers 5950 1186 7136 Urban/Rural/Mixed 3 urban, 2 mixed, 2
rural 1 urban 4 urban, 2 mixed, 2
rural Daily 99% (5905) 100% (1186) 99% (7091) Weekly 0.7% (45) NR 0.6% (45)
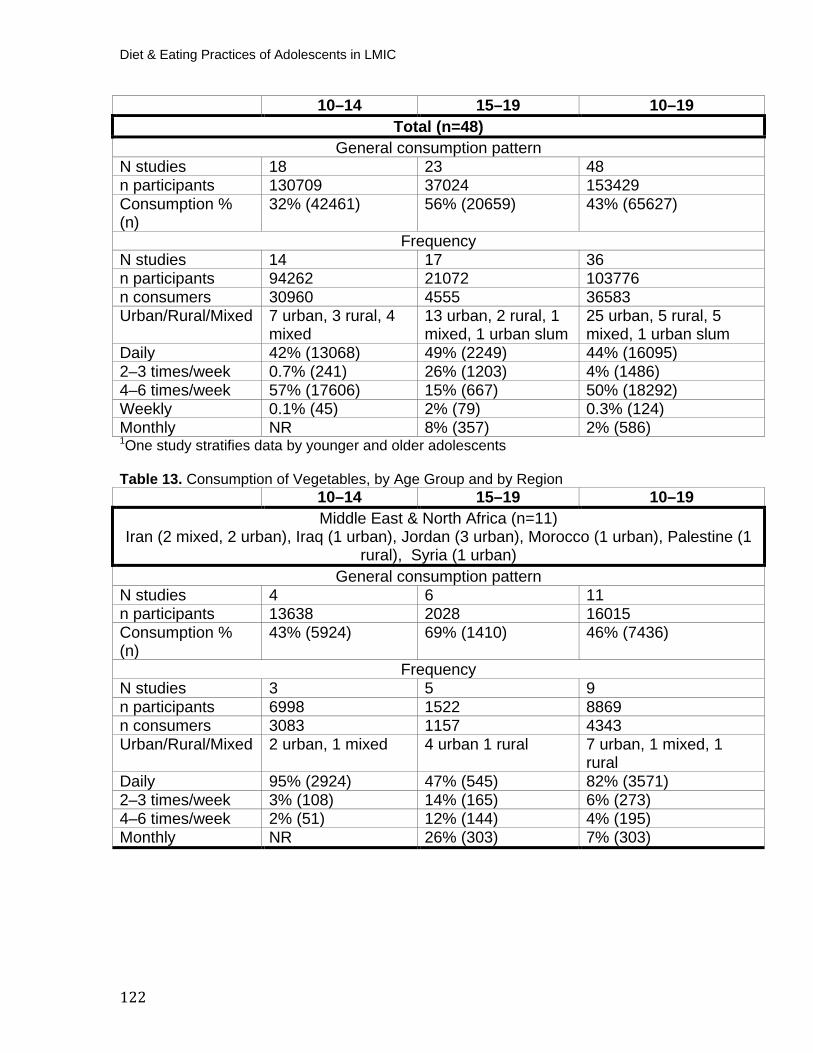
Diet & Eating Practices of Adolescents in LMIC
122
10–14 15–19 10–19 Total (n=48)
General consumption pattern N studies 18 23 48 n participants 130709 37024 153429 Consumption % (n)
32% (42461) 56% (20659) 43% (65627)
Frequency N studies 14 17 36 n participants 94262 21072 103776 n consumers 30960 4555 36583 Urban/Rural/Mixed 7 urban, 3 rural, 4
mixed 13 urban, 2 rural, 1 mixed, 1 urban slum
25 urban, 5 rural, 5 mixed, 1 urban slum
Daily 42% (13068) 49% (2249) 44% (16095) 2–3 times/week 0.7% (241) 26% (1203) 4% (1486) 4–6 times/week 57% (17606) 15% (667) 50% (18292) Weekly 0.1% (45) 2% (79) 0.3% (124) Monthly NR 8% (357) 2% (586) P
1POne study stratifies data by younger and older adolescents
Table 13. Consumption of Vegetables, by Age Group and by Region
10–14 15–19 10–19 Middle East & North Africa (n=11)
Iran (2 mixed, 2 urban), Iraq (1 urban), Jordan (3 urban), Morocco (1 urban), Palestine (1 rural), Syria (1 urban)
General consumption pattern N studies 4 6 11 n participants 13638 2028 16015 Consumption % (n)
43% (5924) 69% (1410) 46% (7436)
Frequency N studies 3 5 9 n participants 6998 1522 8869 n consumers 3083 1157 4343 Urban/Rural/Mixed 2 urban, 1 mixed 4 urban 1 rural 7 urban, 1 mixed, 1
rural Daily 95% (2924) 47% (545) 82% (3571) 2–3 times/week 3% (108) 14% (165) 6% (273) 4–6 times/week 2% (51) 12% (144) 4% (195) Monthly NR 26% (303) 7% (303)

123
10–14 15–19 10–19 Latin America & Caribbean (n=6) P
1
Brazil (3 urban, 2 mixed, 1 NR) General consumption pattern
N studies 1 2 6 n participants 68582 29481 98350 Consumption % (n)
40% (27431) 38% (11204) 40% (38922)
Frequency N studies 2 1 4 n participants 57434 540 58261 n consumers 23690 322 24299 Urban/Rural/Mixed 1 urban, 1 mixed 1 urban 3 urban, 1 mixed Daily NR NR 1% (287) 2–3 times/week 0.7% (170) 100% (322) 2% (492) 4–6 times/week 99% (23520) NR 97% (23520)
Africa (n=8)
Ethiopia (2 mixed, 1 rural), Ghana (1 mixed), Mozambique (1 mixed), Nigeria (1 urban, 1 semi-urban), 1 Sudan (1 urban) General consumption pattern
N studies 3 4 8 n participants 933 2113 3491 Consumption % (n)
30% (281) 59% (1249) 51% (1792)
Frequency N studies 1 2 3 n participants 660 626 1286 n consumers 220 568 788 Urban/Rural/Mixed 1 mixed 1 urban, 1 rural 1 urban, 1 rural, 1
mixed Daily 100% (220) 7% (40) 5% (40) 2–3 times/week NR 30% (173) 22% (173) 4–6 times/week NR 47% (265) 34% (265) Weekly NR 5% (60) 35% (280) Monthly NR 10% (30) 4% (30)
Europe & Central Asia (n=3)P
1
Serbia (1 urban), Turkey (1 urban), multi-country (Turkey and Albania, 1 mixed) General consumption pattern
N studies 2 2 3 n participants 777 543 1320 Consumption % (n)
64% (500) 92% (499) 76% (999)
Frequency N studies NR NR NR
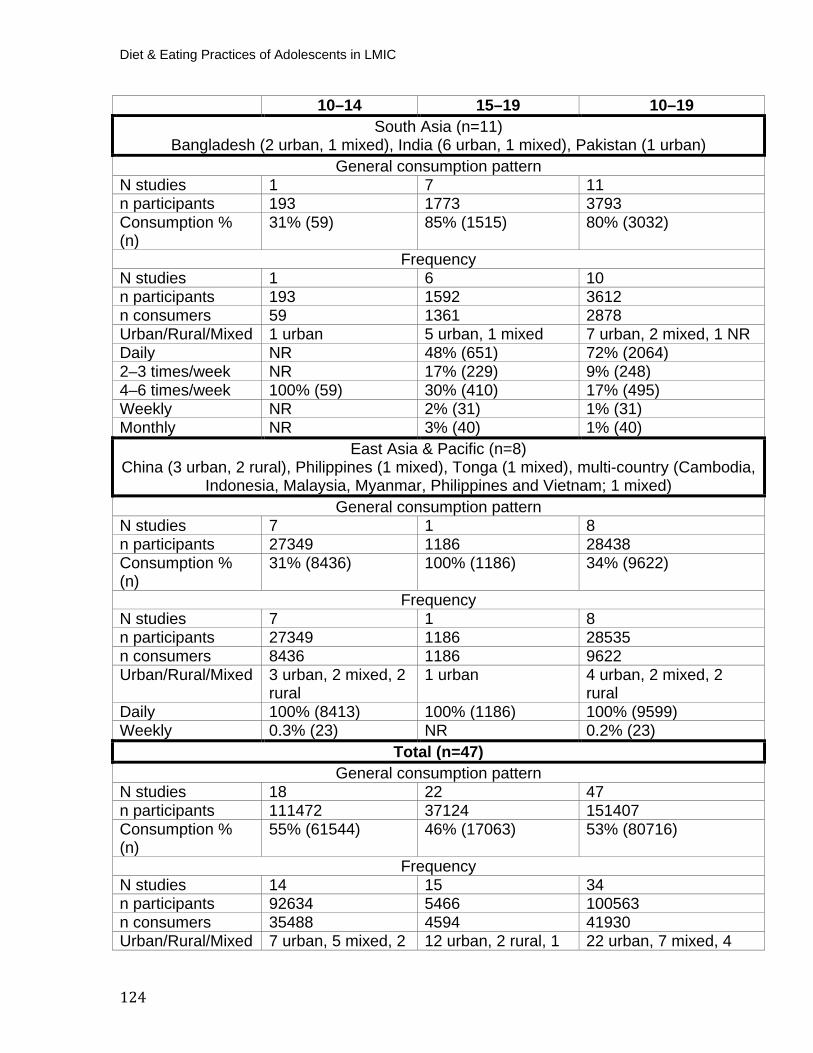
Diet & Eating Practices of Adolescents in LMIC
124
10–14 15–19 10–19 South Asia (n=11)
Bangladesh (2 urban, 1 mixed), India (6 urban, 1 mixed), Pakistan (1 urban) General consumption pattern
N studies 1 7 11 n participants 193 1773 3793 Consumption % (n)
31% (59) 85% (1515) 80% (3032)
Frequency N studies 1 6 10 n participants 193 1592 3612 n consumers 59 1361 2878 Urban/Rural/Mixed 1 urban 5 urban, 1 mixed 7 urban, 2 mixed, 1 NR Daily NR 48% (651) 72% (2064) 2–3 times/week NR 17% (229) 9% (248) 4–6 times/week 100% (59) 30% (410) 17% (495) Weekly NR 2% (31) 1% (31) Monthly NR 3% (40) 1% (40)
East Asia & Pacific (n=8) China (3 urban, 2 rural), Philippines (1 mixed), Tonga (1 mixed), multi-country (Cambodia,
Indonesia, Malaysia, Myanmar, Philippines and Vietnam; 1 mixed) General consumption pattern
N studies 7 1 8 n participants 27349 1186 28438 Consumption % (n)
31% (8436) 100% (1186) 34% (9622)
Frequency N studies 7 1 8 n participants 27349 1186 28535 n consumers 8436 1186 9622 Urban/Rural/Mixed 3 urban, 2 mixed, 2
rural 1 urban 4 urban, 2 mixed, 2
rural Daily 100% (8413) 100% (1186) 100% (9599) Weekly 0.3% (23) NR 0.2% (23)
Total (n=47) General consumption pattern
N studies 18 22 47 n participants 111472 37124 151407 Consumption % (n)
55% (61544) 46% (17063) 53% (80716)
Frequency N studies 14 15 34 n participants 92634 5466 100563 n consumers 35488 4594 41930 Urban/Rural/Mixed 7 urban, 5 mixed, 2 12 urban, 2 rural, 1 22 urban, 7 mixed, 4
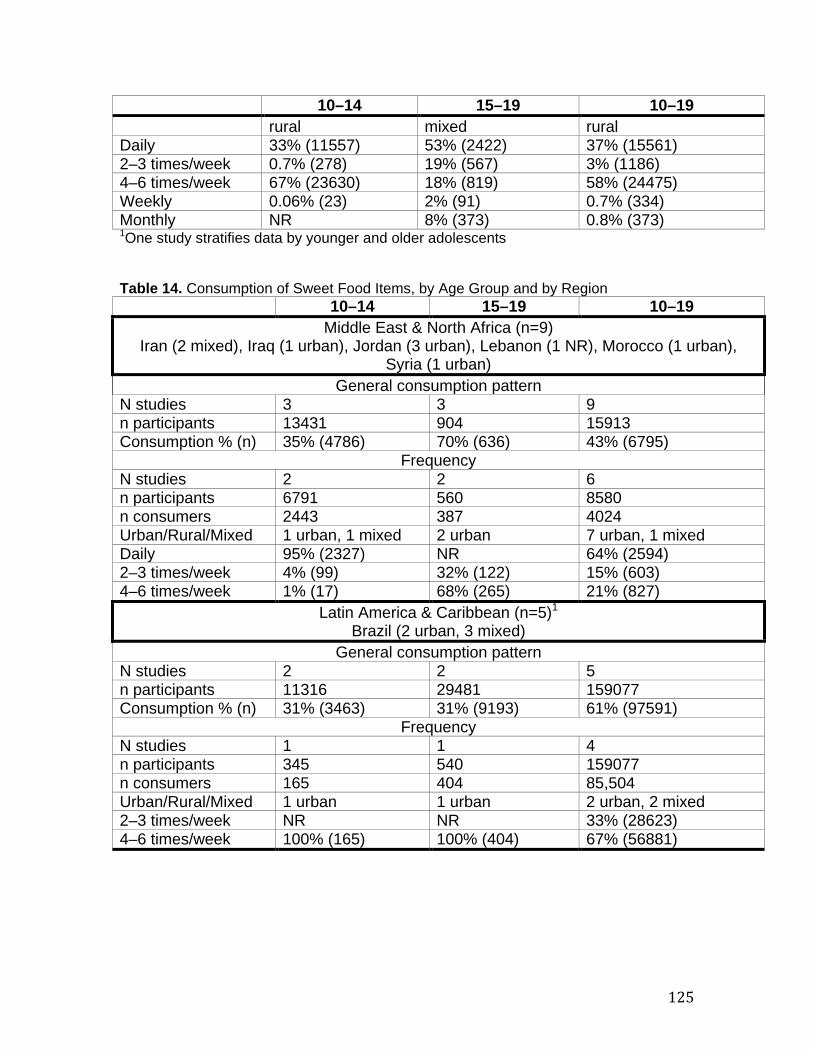
125
10–14 15–19 10–19 rural mixed rural
Daily 33% (11557) 53% (2422) 37% (15561) 2–3 times/week 0.7% (278) 19% (567) 3% (1186) 4–6 times/week 67% (23630) 18% (819) 58% (24475) Weekly 0.06% (23) 2% (91) 0.7% (334) Monthly NR 8% (373) 0.8% (373) P
1POne study stratifies data by younger and older adolescents
Table 14. Consumption of Sweet Food Items, by Age Group and by Region
10–14 15–19 10–19 Middle East & North Africa (n=9)
Iran (2 mixed), Iraq (1 urban), Jordan (3 urban), Lebanon (1 NR), Morocco (1 urban), Syria (1 urban)
General consumption pattern N studies 3 3 9 n participants 13431 904 15913 Consumption % (n) 35% (4786) 70% (636) 43% (6795)
Frequency N studies 2 2 6 n participants 6791 560 8580 n consumers 2443 387 4024 Urban/Rural/Mixed 1 urban, 1 mixed 2 urban 7 urban, 1 mixed Daily 95% (2327) NR 64% (2594) 2–3 times/week 4% (99) 32% (122) 15% (603) 4–6 times/week 1% (17) 68% (265) 21% (827)
Latin America & Caribbean (n=5) P
1
Brazil (2 urban, 3 mixed) General consumption pattern
N studies 2 2 5 n participants 11316 29481 159077 Consumption % (n) 31% (3463) 31% (9193) 61% (97591)
Frequency N studies 1 1 4 n participants 345 540 159077 n consumers 165 404 85,504 Urban/Rural/Mixed 1 urban 1 urban 2 urban, 2 mixed 2–3 times/week NR NR 33% (28623) 4–6 times/week 100% (165) 100% (404) 67% (56881)
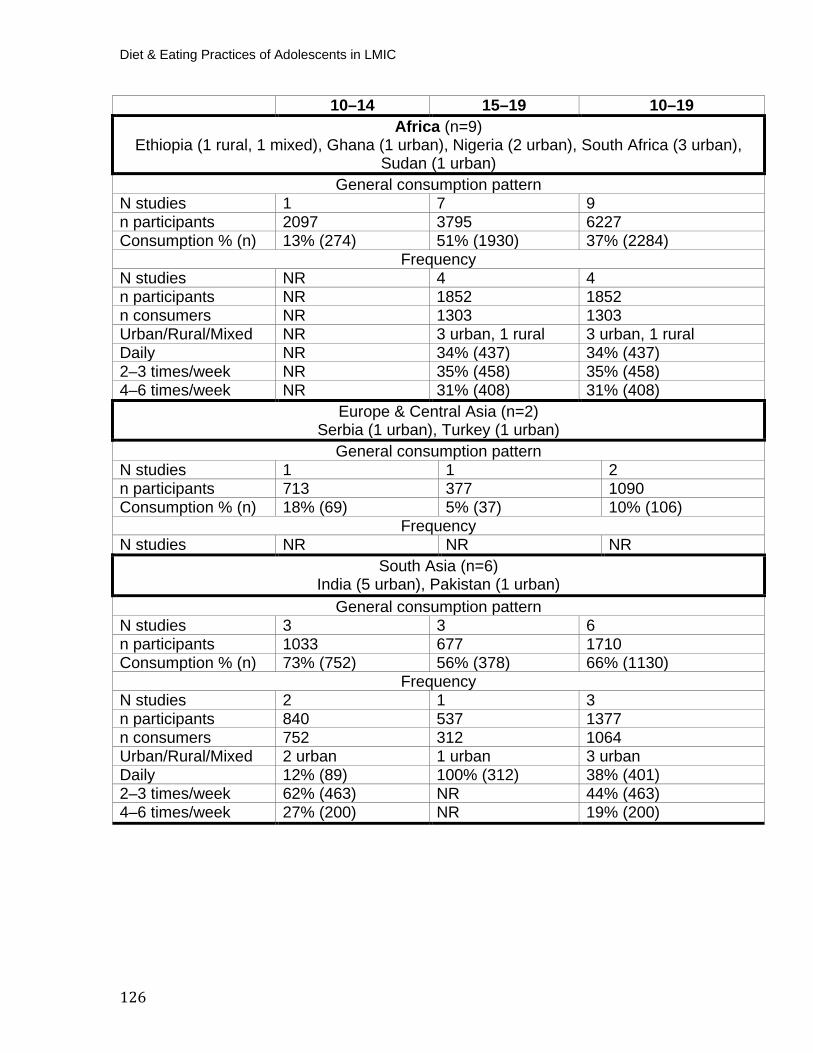
Diet & Eating Practices of Adolescents in LMIC
126
10–14 15–19 10–19 Africa (n=9)
Ethiopia (1 rural, 1 mixed), Ghana (1 urban), Nigeria (2 urban), South Africa (3 urban), Sudan (1 urban)
General consumption pattern N studies 1 7 9 n participants 2097 3795 6227 Consumption % (n) 13% (274) 51% (1930) 37% (2284)
Frequency N studies NR 4 4 n participants NR 1852 1852 n consumers NR 1303 1303 Urban/Rural/Mixed NR 3 urban, 1 rural 3 urban, 1 rural Daily NR 34% (437) 34% (437) 2–3 times/week NR 35% (458) 35% (458) 4–6 times/week NR 31% (408) 31% (408)
Europe & Central Asia (n=2) Serbia (1 urban), Turkey (1 urban)
General consumption pattern N studies 1 1 2 n participants 713 377 1090 Consumption % (n) 18% (69) 5% (37) 10% (106)
Frequency N studies NR NR NR
South Asia (n=6) India (5 urban), Pakistan (1 urban)
General consumption pattern N studies 3 3 6 n participants 1033 677 1710 Consumption % (n) 73% (752) 56% (378) 66% (1130)
Frequency N studies 2 1 3 n participants 840 537 1377 n consumers 752 312 1064 Urban/Rural/Mixed 2 urban 1 urban 3 urban Daily 12% (89) 100% (312) 38% (401) 2–3 times/week 62% (463) NR 44% (463) 4–6 times/week 27% (200) NR 19% (200)
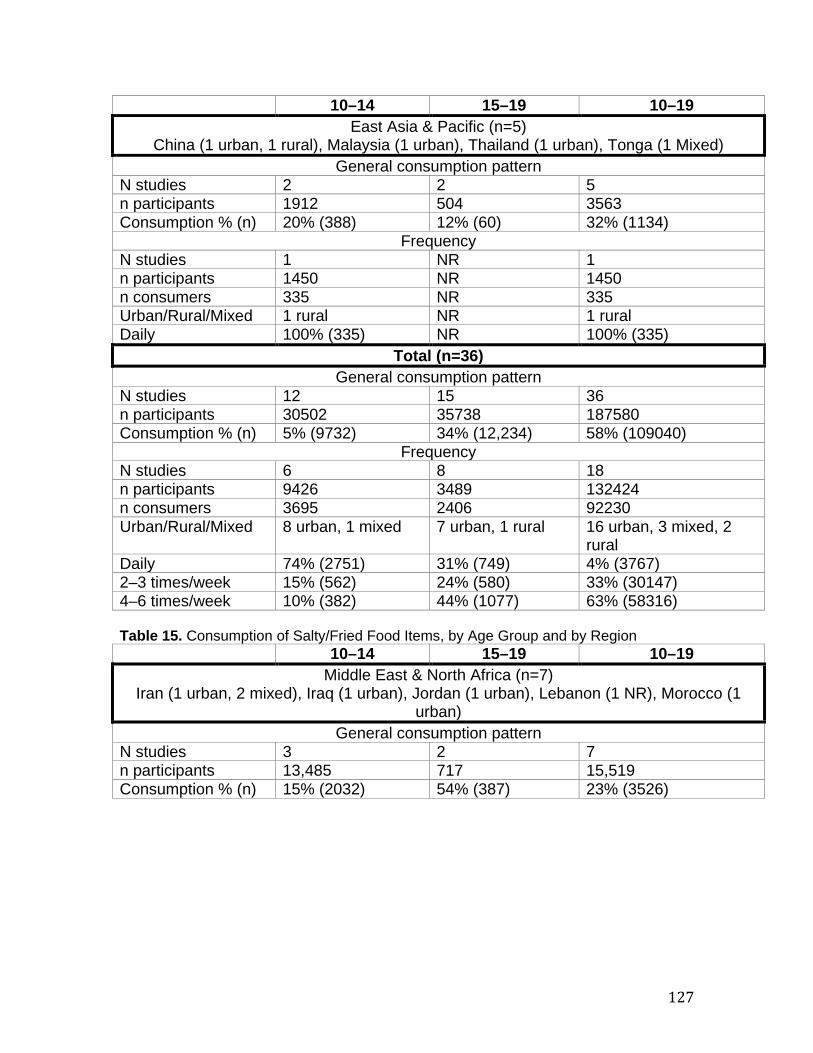
127
10–14 15–19 10–19 East Asia & Pacific (n=5)
China (1 urban, 1 rural), Malaysia (1 urban), Thailand (1 urban), Tonga (1 Mixed) General consumption pattern
N studies 2 2 5 n participants 1912 504 3563 Consumption % (n) 20% (388) 12% (60) 32% (1134)
Frequency N studies 1 NR 1 n participants 1450 NR 1450 n consumers 335 NR 335 Urban/Rural/Mixed 1 rural NR 1 rural Daily 100% (335) NR 100% (335)
Total (n=36) General consumption pattern
N studies 12 15 36 n participants 30502 35738 187580 Consumption % (n) 5% (9732) 34% (12,234) 58% (109040)
Frequency N studies 6 8 18 n participants 9426 3489 132424 n consumers 3695 2406 92230 Urban/Rural/Mixed 8 urban, 1 mixed 7 urban, 1 rural 16 urban, 3 mixed, 2
rural Daily 74% (2751) 31% (749) 4% (3767) 2–3 times/week 15% (562) 24% (580) 33% (30147) 4–6 times/week 10% (382) 44% (1077) 63% (58316) Table 15. Consumption of Salty/Fried Food Items, by Age Group and by Region
10–14 15–19 10–19 Middle East & North Africa (n=7)
Iran (1 urban, 2 mixed), Iraq (1 urban), Jordan (1 urban), Lebanon (1 NR), Morocco (1 urban)
General consumption pattern N studies 3 2 7 n participants 13,485 717 15,519 Consumption % (n) 15% (2032) 54% (387) 23% (3526)
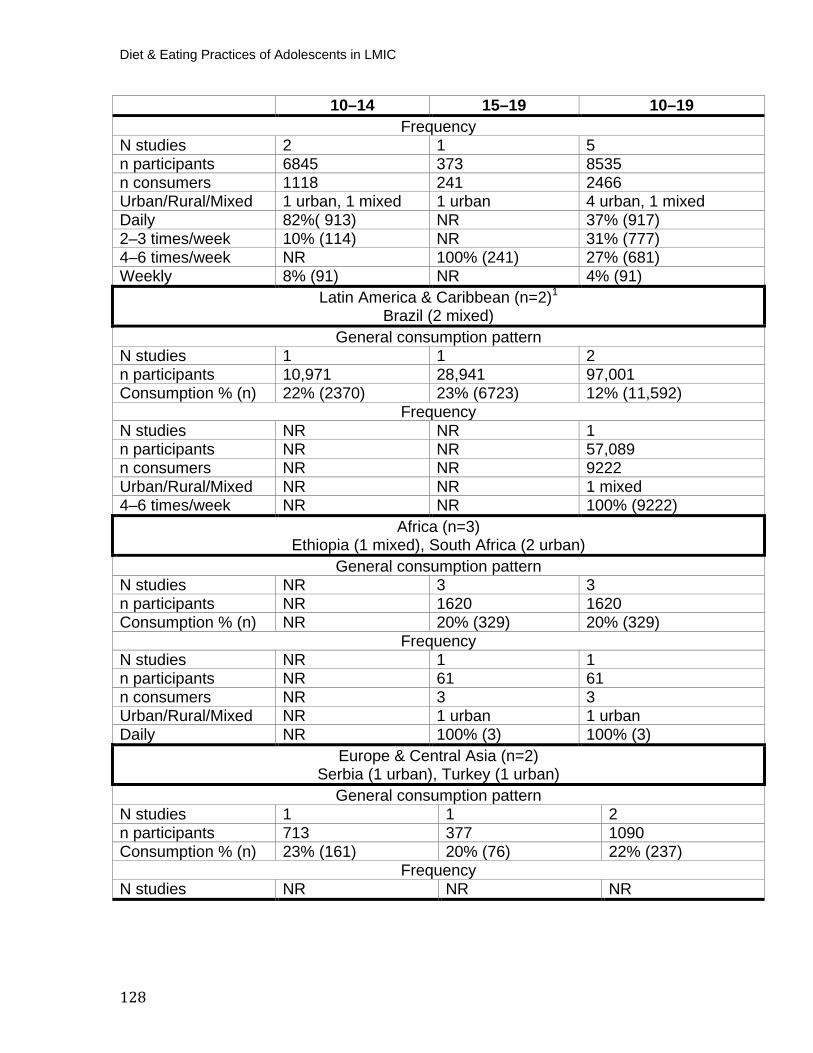
Diet & Eating Practices of Adolescents in LMIC
128
10–14 15–19 10–19 Frequency
N studies 2 1 5 n participants 6845 373 8535 n consumers 1118 241 2466 Urban/Rural/Mixed 1 urban, 1 mixed 1 urban 4 urban, 1 mixed Daily 82%( 913) NR 37% (917) 2–3 times/week 10% (114) NR 31% (777) 4–6 times/week NR 100% (241) 27% (681) Weekly 8% (91) NR 4% (91)
Latin America & Caribbean (n=2) P
1
Brazil (2 mixed) General consumption pattern
N studies 1 1 2 n participants 10,971 28,941 97,001 Consumption % (n) 22% (2370) 23% (6723) 12% (11,592)
Frequency N studies NR NR 1 n participants NR NR 57,089 n consumers NR NR 9222 Urban/Rural/Mixed NR NR 1 mixed 4–6 times/week NR NR 100% (9222)
Africa (n=3)Ethiopia (1 mixed), South Africa (2 urban)
General consumption pattern N studies NR 3 3 n participants NR 1620 1620 Consumption % (n) NR 20% (329) 20% (329)
Frequency N studies NR 1 1 n participants NR 61 61 n consumers NR 3 3 Urban/Rural/Mixed NR 1 urban 1 urban Daily NR 100% (3) 100% (3)
Europe & Central Asia (n=2) Serbia (1 urban), Turkey (1 urban)
General consumption pattern N studies 1 1 2 n participants 713 377 1090 Consumption % (n) 23% (161) 20% (76) 22% (237)
Frequency N studies NR NR NR
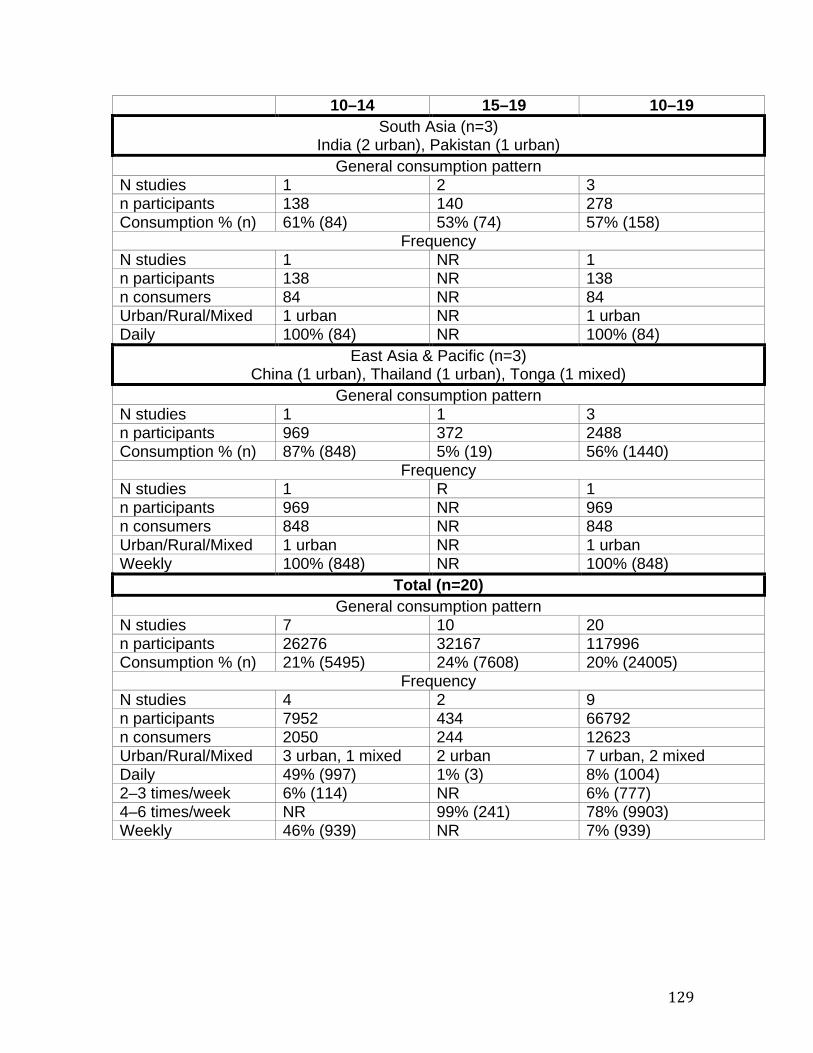
129
10–14 15–19 10–19 South Asia (n=3)
India (2 urban), Pakistan (1 urban) General consumption pattern
N studies 1 2 3 n participants 138 140 278 Consumption % (n) 61% (84) 53% (74) 57% (158)
Frequency N studies 1 NR 1 n participants 138 NR 138 n consumers 84 NR 84 Urban/Rural/Mixed 1 urban NR 1 urban Daily 100% (84) NR 100% (84)
East Asia & Pacific (n=3) China (1 urban), Thailand (1 urban), Tonga (1 mixed)
General consumption pattern N studies 1 1 3 n participants 969 372 2488 Consumption % (n) 87% (848) 5% (19) 56% (1440)
Frequency N studies 1 R 1 n participants 969 NR 969 n consumers 848 NR 848 Urban/Rural/Mixed 1 urban NR 1 urban Weekly 100% (848) NR 100% (848)
Total (n=20) General consumption pattern
N studies 7 10 20 n participants 26276 32167 117996 Consumption % (n) 21% (5495) 24% (7608) 20% (24005)
Frequency N studies 4 2 9 n participants 7952 434 66792 n consumers 2050 244 12623 Urban/Rural/Mixed 3 urban, 1 mixed 2 urban 7 urban, 2 mixed Daily 49% (997) 1% (3) 8% (1004) 2–3 times/week 6% (114) NR 6% (777) 4–6 times/week NR 99% (241) 78% (9903) Weekly 46% (939) NR 7% (939)
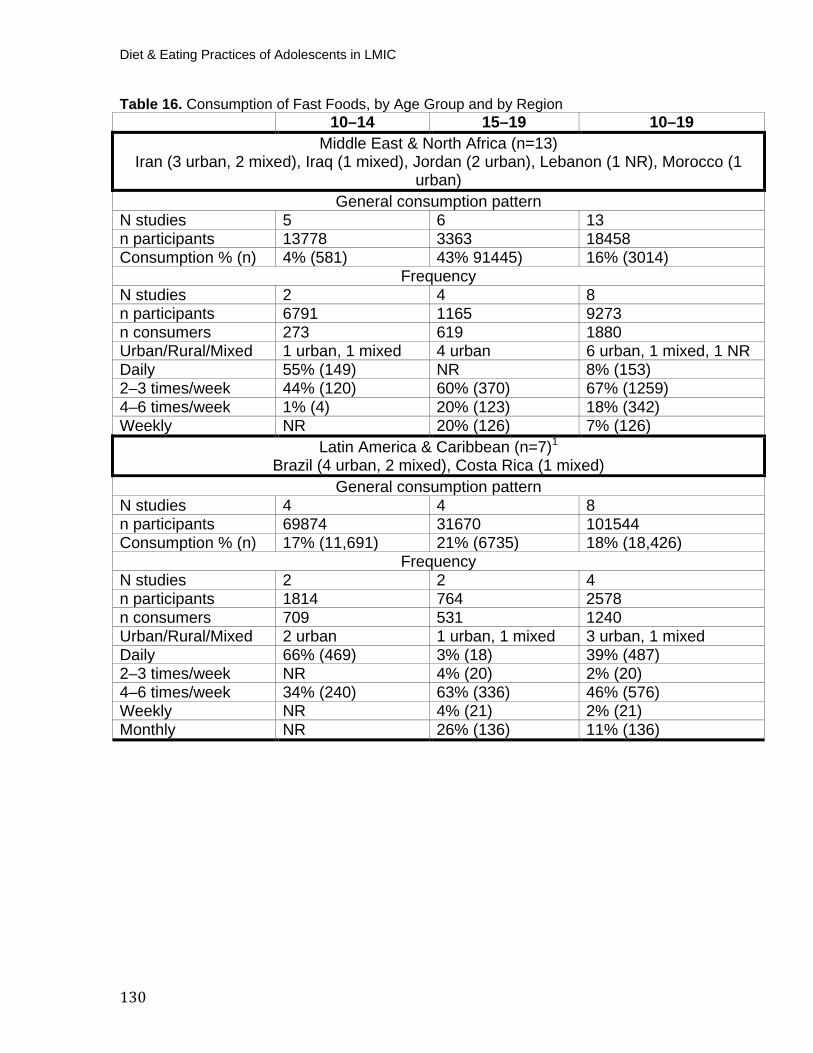
Diet & Eating Practices of Adolescents in LMIC
130
Table 16. Consumption of Fast Foods, by Age Group and by Region 10–14 15–19 10–19
Middle East & North Africa (n=13) Iran (3 urban, 2 mixed), Iraq (1 mixed), Jordan (2 urban), Lebanon (1 NR), Morocco (1
urban) General consumption pattern
N studies 5 6 13 n participants 13778 3363 18458 Consumption % (n) 4% (581) 43% 91445) 16% (3014)
Frequency N studies 2 4 8 n participants 6791 1165 9273 n consumers 273 619 1880 Urban/Rural/Mixed 1 urban, 1 mixed 4 urban 6 urban, 1 mixed, 1 NR Daily 55% (149) NR 8% (153) 2–3 times/week 44% (120) 60% (370) 67% (1259) 4–6 times/week 1% (4) 20% (123) 18% (342) Weekly NR 20% (126) 7% (126)
Latin America & Caribbean (n=7) P
1
Brazil (4 urban, 2 mixed), Costa Rica (1 mixed) General consumption pattern
N studies 4 4 8 n participants 69874 31670 101544 Consumption % (n) 17% (11,691) 21% (6735) 18% (18,426)
Frequency N studies 2 2 4 n participants 1814 764 2578 n consumers 709 531 1240 Urban/Rural/Mixed 2 urban 1 urban, 1 mixed 3 urban, 1 mixed Daily 66% (469) 3% (18) 39% (487) 2–3 times/week NR 4% (20) 2% (20) 4–6 times/week 34% (240) 63% (336) 46% (576) Weekly NR 4% (21) 2% (21) Monthly NR 26% (136) 11% (136)
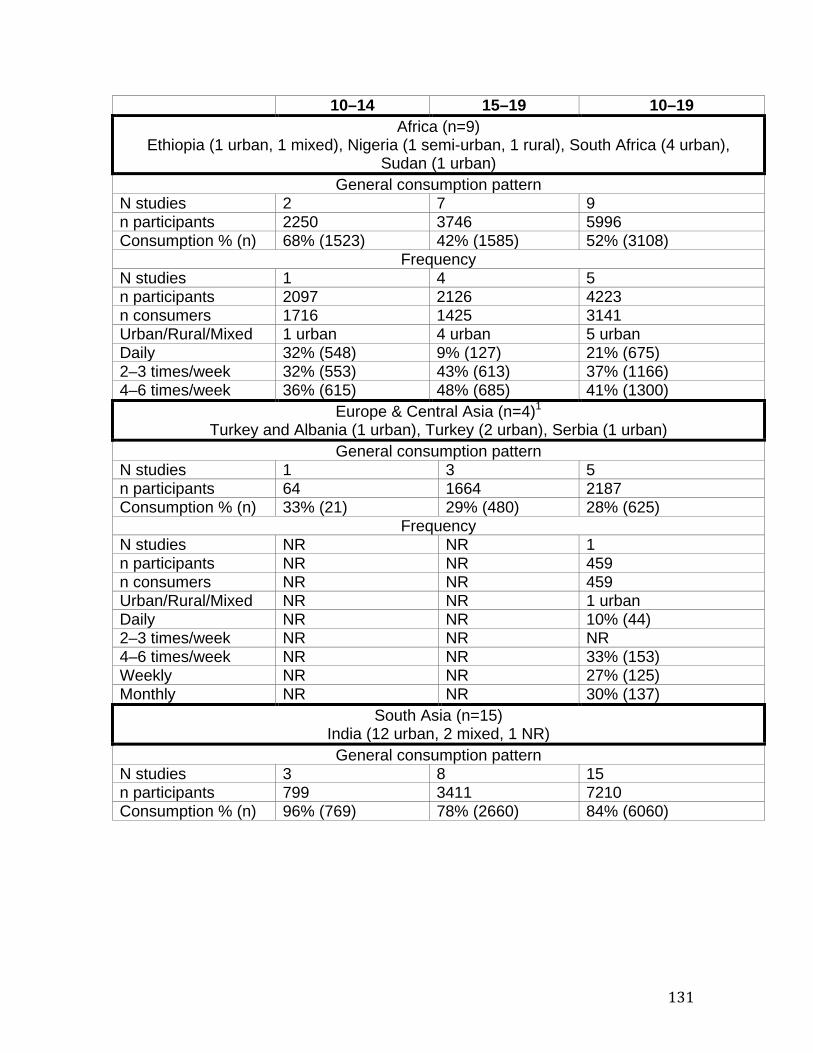
131
10–14 15–19 10–19 Africa (n=9)
Ethiopia (1 urban, 1 mixed), Nigeria (1 semi-urban, 1 rural), South Africa (4 urban), Sudan (1 urban)
General consumption pattern N studies 2 7 9 n participants 2250 3746 5996 Consumption % (n) 68% (1523) 42% (1585) 52% (3108)
Frequency N studies 1 4 5 n participants 2097 2126 4223 n consumers 1716 1425 3141 Urban/Rural/Mixed 1 urban 4 urban 5 urban Daily 32% (548) 9% (127) 21% (675) 2–3 times/week 32% (553) 43% (613) 37% (1166) 4–6 times/week 36% (615) 48% (685) 41% (1300)
Europe & Central Asia (n=4)P
1 Turkey and Albania (1 urban), Turkey (2 urban), Serbia (1 urban)
General consumption pattern N studies 1 3 5 n participants 64 1664 2187 Consumption % (n) 33% (21) 29% (480) 28% (625)
Frequency N studies NR NR 1 n participants NR NR 459 n consumers NR NR 459 Urban/Rural/Mixed NR NR 1 urban Daily NR NR 10% (44) 2–3 times/week NR NR NR 4–6 times/week NR NR 33% (153) Weekly NR NR 27% (125) Monthly NR NR 30% (137)
South Asia (n=15) India (12 urban, 2 mixed, 1 NR) General consumption pattern
N studies 3 8 15 n participants 799 3411 7210 Consumption % (n) 96% (769) 78% (2660) 84% (6060)
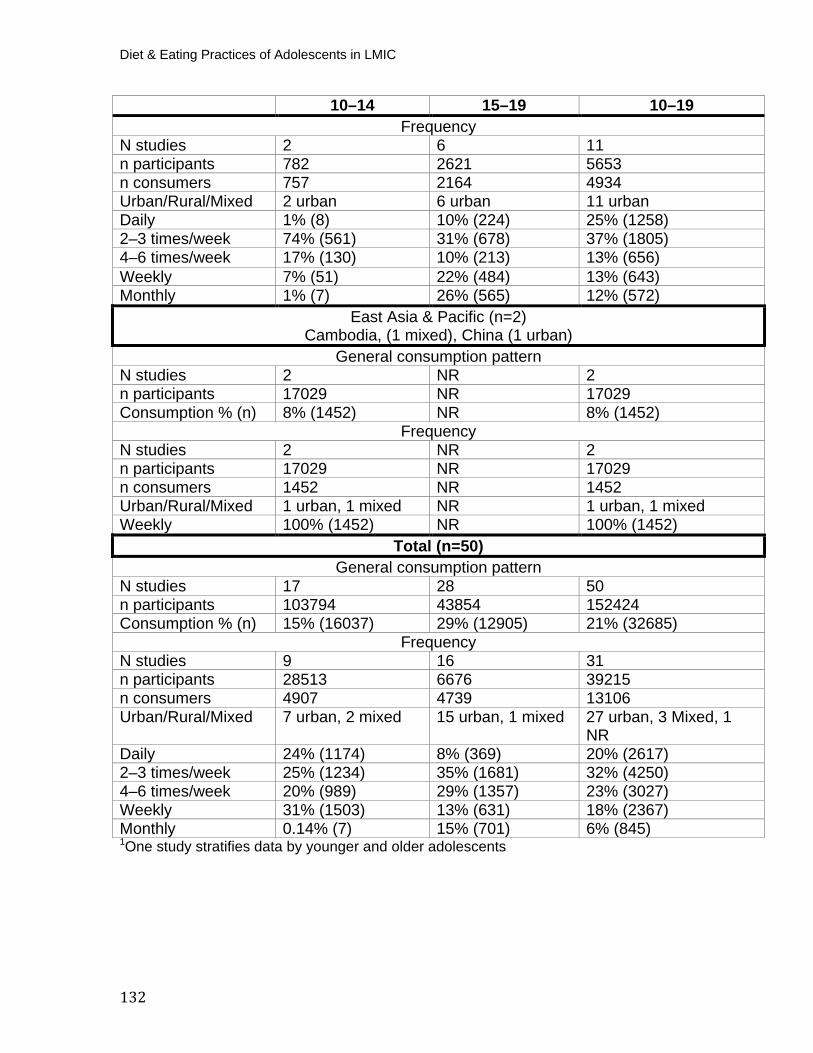
Diet & Eating Practices of Adolescents in LMIC
132
10–14 15–19 10–19 Frequency
N studies 2 6 11 n participants 782 2621 5653 n consumers 757 2164 4934 Urban/Rural/Mixed 2 urban 6 urban 11 urban Daily 1% (8) 10% (224) 25% (1258) 2–3 times/week 74% (561) 31% (678) 37% (1805) 4–6 times/week 17% (130) 10% (213) 13% (656) Weekly 7% (51) 22% (484) 13% (643) Monthly 1% (7) 26% (565) 12% (572)
East Asia & Pacific (n=2) Cambodia, (1 mixed), China (1 urban)
General consumption pattern N studies 2 NR 2 n participants 17029 NR 17029 Consumption % (n) 8% (1452) NR 8% (1452)
Frequency N studies 2 NR 2 n participants 17029 NR 17029 n consumers 1452 NR 1452 Urban/Rural/Mixed 1 urban, 1 mixed NR 1 urban, 1 mixed Weekly 100% (1452) NR 100% (1452)
Total (n=50) General consumption pattern
N studies 17 28 50 n participants 103794 43854 152424 Consumption % (n) 15% (16037) 29% (12905) 21% (32685)
Frequency N studies 9 16 31 n participants 28513 6676 39215 n consumers 4907 4739 13106 Urban/Rural/Mixed 7 urban, 2 mixed 15 urban, 1 mixed 27 urban, 3 Mixed, 1
NR Daily 24% (1174) 8% (369) 20% (2617) 2–3 times/week 25% (1234) 35% (1681) 32% (4250) 4–6 times/week 20% (989) 29% (1357) 23% (3027) Weekly 31% (1503) 13% (631) 18% (2367) Monthly 0.14% (7) 15% (701) 6% (845) P
1POne study stratifies data by younger and older adolescents
133
Table 17. Consumption of Sugar-Sweetened Beverages, by Age Group and by Region 10–14 15–19 10–19
Middle East & North Africa (n=10) Iran (2 mixed), Iraq (1 urban), Jordan (3 urban), Lebanon (1 NR), Morocco (1 urban),
Palestine (1 rural), Syria (1 urban) General consumption pattern
N studies 3 4 10 n participants 13,431 1261 16,270 Consumption % (n) 13% (1717) 42% (528) 22% (3530)
Frequency N studies 2 4 9 n participants 6791 1261 9630 n consumers 548 528 2361 Urban/Rural/Mixed 1 urban, 1 mixed 3 urban, 1 rural 6 urban,1 rural, 1
mixed, 1 NR Daily 92% (507) NR 33% (774) 2–3 times/week 2% (10) 30% (159) 28% (658) 4–6 times/week 6% (31) 46% (242) 34% (802) Monthly NR 24% (127) 5% (127)
Latin America & Caribbean (n=9) P
1
Brazil (4 urban, 4 mixed), Columbia (1 NR) General consumption pattern
N studies 4 3 9 n participants 12477 29845 162968 Consumption % (n) 36% (4487) 33% (9742) 59% (95890)
Frequency N studies 3 2 8 n participants 1382 904 123056 n consumers 789 423 82873 Urban/Rural/Mixed 2 urban, 1 NR 1 urban, 1 NR 4 urban, 3 mixed, 1 NR Daily 49% (388) 7% (31) 1% (1262) 2–3 times/week NR NR 49% (40183) 4–6 times/week 32% (251) 38% (159) 49% (41045) Weekly 19% (150) 55% (233) 1% (383)
Africa (n=7)
Ghana (1 urban), Nigeria (1 urban, 1 NR), South Africa (3 urban), Sudan (1 urban) General consumption pattern
N studies 1 4 7 n participants 2097 1883 4814 Consumption % (n) 59% (1231) 52% (976) 63% (3038)
Diet & Eating Practices of Adolescents in LMIC
134
10–14 15–19 10–19 Frequency
N studies 1 1 3 n participants 2097 438 2870 n consumers 2097 276 2705 Urban/Rural/Mixed 1 urban 1 urban 3 urban Daily 4% (91) NR 7% (203) 2–3 times/week 11% (226) 63% (276) 17% (502) 4–6 times/week 85% (1780) 37% (162) 68% (1942) Weekly NR NR 7% (210)
Europe & Central Asia (n=5)P
1
Turkey and Albania (1 urban), Turkey (3 urban), Serbia (1 urban) General consumption pattern
N studies 2 3 5 n participants 777 1664 2990 Consumption % (n) 27% (207) 28% (458) 27% (783)
Frequency N studies NR NR NR
South Asia (n=7) India (5 urban), Pakistan (1 urban), Sri Lanka (1 NR)
General consumption pattern N studies 1 4 7 n participants 138 983 2085 Consumption % (n) 70% (97) 80% (789) 48% (1009)
Frequency N studies 1 3 6 n participants 138 903 2005 n consumers 97 739 959 Urban/Rural/Mixed 1 urban 3 urban, 1 NR 5 urban, 1 NR Daily 100% (97) 94% (696) 94% (899) 2–3 times/week NR 1% (11) 1% (11) 4–6 times/week NR 1% (10) 1% (10) Weekly NR 3% (22) 4% (39)
East Asia & Pacific (n=10) Cambodia, (1 mixed), China (3 urban, 1 rural, 1 mixed), Malaysia (1 rural, 1 mixed),
Thailand (1 urban), Tonga (1 mixed) General consumption pattern
N studies 7 2 10 n participants 15873 354 17374 Consumption % (n) 12% (1876) 24% (86) 14% (2440)
135
10–14 15–19 10–19 Frequency
N studies 4 NR 4 n participants 3089 NR 3089 n consumers 1112 NR 1112 Urban/Rural/Mixed 2 urban, 1 rural, 1
mixed NR 2 urban, 1 rural, 1
mixed Daily 17% (193) NR 17% (193) 2–3 times/week 10% (117) NR 10% (117) 4–6 times/week 6% (68) NR 6% (68) Weekly 61% (685) NR 61% (685) Monthly 6% (69) NR 6% (69)
Total (n=48) General consumption pattern
N studies 18 20 48 n participants 44763 35990 206411 Consumption % (n) 21% (9615) 35% (12579) 52% (106690)
Frequency N studies 11 10 30 n participants 13591 3506 140650 n consumers 4643 1966 90010 Urban/Rural/Mixed 7 urban, 1 rural, 2
mixed, 1 NR 8 urban, 1 rural, 2 NR
20 urban, 2 rural, 5 mixed, 2 NR
Daily 27% (1276) 34% (727) 4% (3331) 2–3 times/week 7% (353) 21% (466) 46% (41471) 4–6 times/week 46% (2130) 27% (573) 49% (43867) Weekly 18% (835) 12% (255) 1% (1317) Monthly 1% (69) 6% (127) 0.2% (196) Table 18a. Grain Consumption by Diet Measurement Source (Adolescents 10–19 Years)
Grains FFQ 24 hour recall Food records Non-validated tool
Middle East & North Africa (n=3) Iran (2 urban), Jordan (1 urban)
N studies 1 1 NR 1 n participants 205 506 NR 261 Consumption % (n)
100% (205) 100% (506) NR 100% (261)
Latin America & Caribbean (n=3) Brazil (1 urban, 1 mixed, 1 NR)
N studies 2 NR 1 NR n participants 463 NR 39912 NR Consumption % (n)
55% (256) NR 46% (18471) NR
Diet & Eating Practices of Adolescents in LMIC
136
Grains FFQ 24 hour recall Food records Non-validated tool
Africa (n=8) Ethiopia (1 urban, 1 rural, 1 mixed), Nigeria (1 urban, 1 semi-urban, 1 rural), South Africa (2 urban)
N studies 3 3 NR 2 n participants 1041 1009 NR 2828 Consumption % (n)
67% (695) 92% (933) NR 74% (2106)
Europe & Central Asia (n=3) Bosnia & Herzegovina (1 mixed), Serbia (1 urban), Turkey (1 urban)
N studies 1 NR NR 2 n participants 306 NR NR 836 Consumption % (n)
14% (44) NR NR 34% (282)
South Asia (n=9) Bangladesh (1 urban, 1 mixed), India (6 urban), Sri Lanka (1 rural)
N studies 2 5 NR 2 n participants 1043 938 NR 403 Consumption % (n)
77% (800) 82% (769) NR 56% (226)
East Asia & Pacific (n=5) China (1 urban, 1 rural), Malaysia (1 urban, 2 mixed)
N studies 2 1 NR 2 n participants 1318 1528 NR 469 Consumption % (n)
96% (1265) 20% (310) NR 32% (148)
Total (n=31) N studies 11 10 1 9 n participants 4376 3981 39912 4797 Consumption % (n)
75% (3265) 63% (2518) 46% (18471) 63% (3023)
Table 18b. Dairy Product Consumption by Diet Measurement Source (Adolescents 10–19 Years)
Dairy FFQ 24 hour recall Food records Non-validated
tool Middle East & North Africa (n=13)
Egypt (1 mixed), Iran (4 urban, 1 mixed), Iraq (1 urban), Jordan (2 urban), Lebanon (1 NR), Morocco (1 urban), Palestine (1 rural), Syria (1 urban)
N studies 5 1 NR 7 n participants 8210 506 NR 8511 Consumption % (n)
48% (3976) 79% (400) NR 44% (3755)
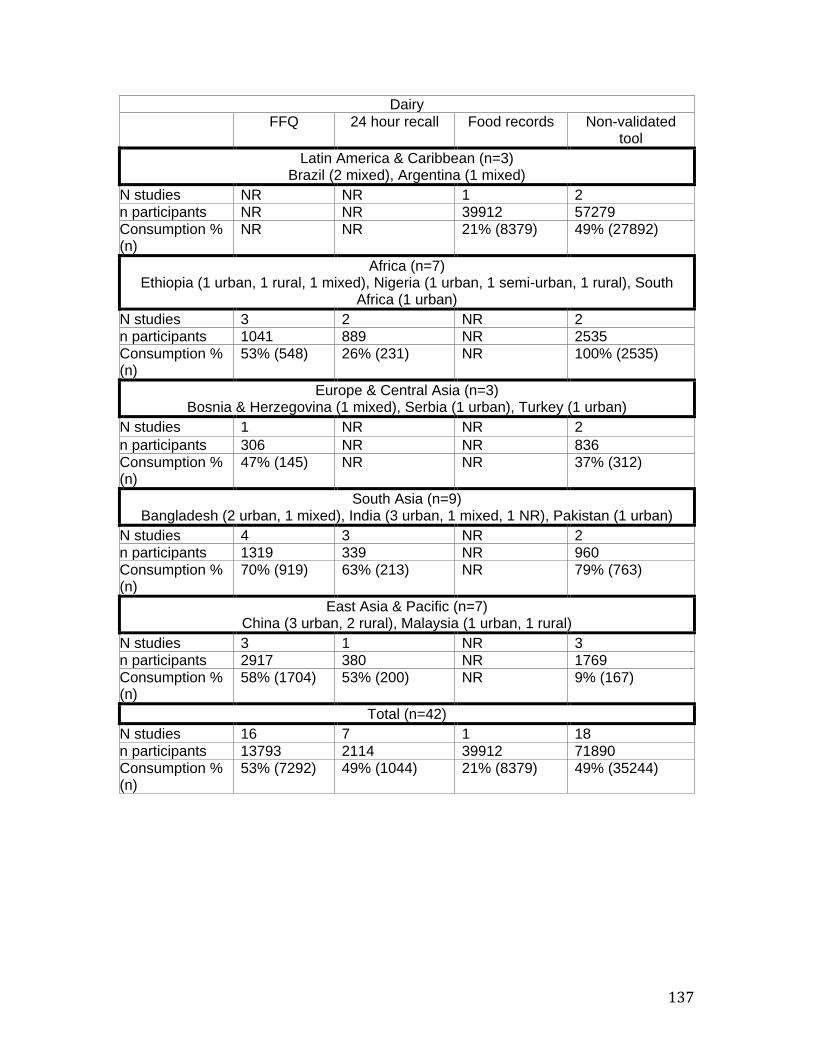
137
Dairy FFQ 24 hour recall Food records Non-validated
tool Latin America & Caribbean (n=3)
Brazil (2 mixed), Argentina (1 mixed) N studies NR NR 1 2 n participants NR NR 39912 57279 Consumption % (n)
NR NR 21% (8379) 49% (27892)
Africa (n=7) Ethiopia (1 urban, 1 rural, 1 mixed), Nigeria (1 urban, 1 semi-urban, 1 rural), South
Africa (1 urban) N studies 3 2 NR 2 n participants 1041 889 NR 2535 Consumption % (n)
53% (548) 26% (231) NR 100% (2535)
Europe & Central Asia (n=3) Bosnia & Herzegovina (1 mixed), Serbia (1 urban), Turkey (1 urban)
N studies 1 NR NR 2 n participants 306 NR NR 836 Consumption % (n)
47% (145) NR NR 37% (312)
South Asia (n=9) Bangladesh (2 urban, 1 mixed), India (3 urban, 1 mixed, 1 NR), Pakistan (1 urban)
N studies 4 3 NR 2 n participants 1319 339 NR 960 Consumption % (n)
70% (919) 63% (213) NR 79% (763)
East Asia & Pacific (n=7) China (3 urban, 2 rural), Malaysia (1 urban, 1 rural)
N studies 3 1 NR 3 n participants 2917 380 NR 1769 Consumption % (n)
58% (1704) 53% (200) NR 9% (167)
Total (n=42) N studies 16 7 1 18 n participants 13793 2114 39912 71890 Consumption % (n)
53% (7292) 49% (1044) 21% (8379) 49% (35244)
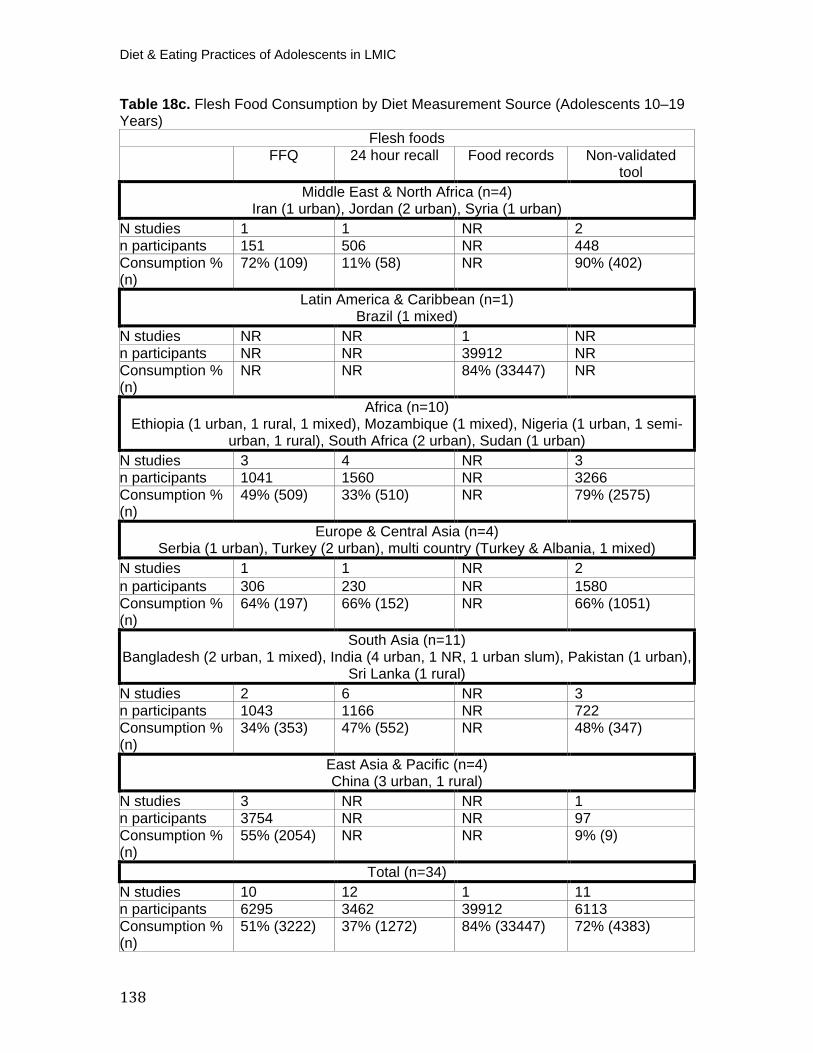
Diet & Eating Practices of Adolescents in LMIC
138
Table 18c. Flesh Food Consumption by Diet Measurement Source (Adolescents 10–19 Years)
Flesh foods FFQ 24 hour recall Food records Non-validated
tool Middle East & North Africa (n=4)
Iran (1 urban), Jordan (2 urban), Syria (1 urban) N studies 1 1 NR 2 n participants 151 506 NR 448 Consumption % (n)
72% (109) 11% (58) NR 90% (402)
Latin America & Caribbean (n=1) Brazil (1 mixed)
N studies NR NR 1 NR n participants NR NR 39912 NR Consumption % (n)
NR NR 84% (33447) NR
Africa (n=10) Ethiopia (1 urban, 1 rural, 1 mixed), Mozambique (1 mixed), Nigeria (1 urban, 1 semi-
urban, 1 rural), South Africa (2 urban), Sudan (1 urban) N studies 3 4 NR 3 n participants 1041 1560 NR 3266 Consumption % (n)
49% (509) 33% (510) NR 79% (2575)
Europe & Central Asia (n=4) Serbia (1 urban), Turkey (2 urban), multi country (Turkey & Albania, 1 mixed)
N studies 1 1 NR 2 n participants 306 230 NR 1580 Consumption % (n)
64% (197) 66% (152) NR 66% (1051)
South Asia (n=11) Bangladesh (2 urban, 1 mixed), India (4 urban, 1 NR, 1 urban slum), Pakistan (1 urban),
Sri Lanka (1 rural) N studies 2 6 NR 3 n participants 1043 1166 NR 722 Consumption % (n)
34% (353) 47% (552) NR 48% (347)
East Asia & Pacific (n=4) China (3 urban, 1 rural)
N studies 3 NR NR 1 n participants 3754 NR NR 97 Consumption % (n)
55% (2054) NR NR 9% (9)
Total (n=34) N studies 10 12 1 11 n participants 6295 3462 39912 6113 Consumption % (n)
51% (3222) 37% (1272) 84% (33447) 72% (4383)
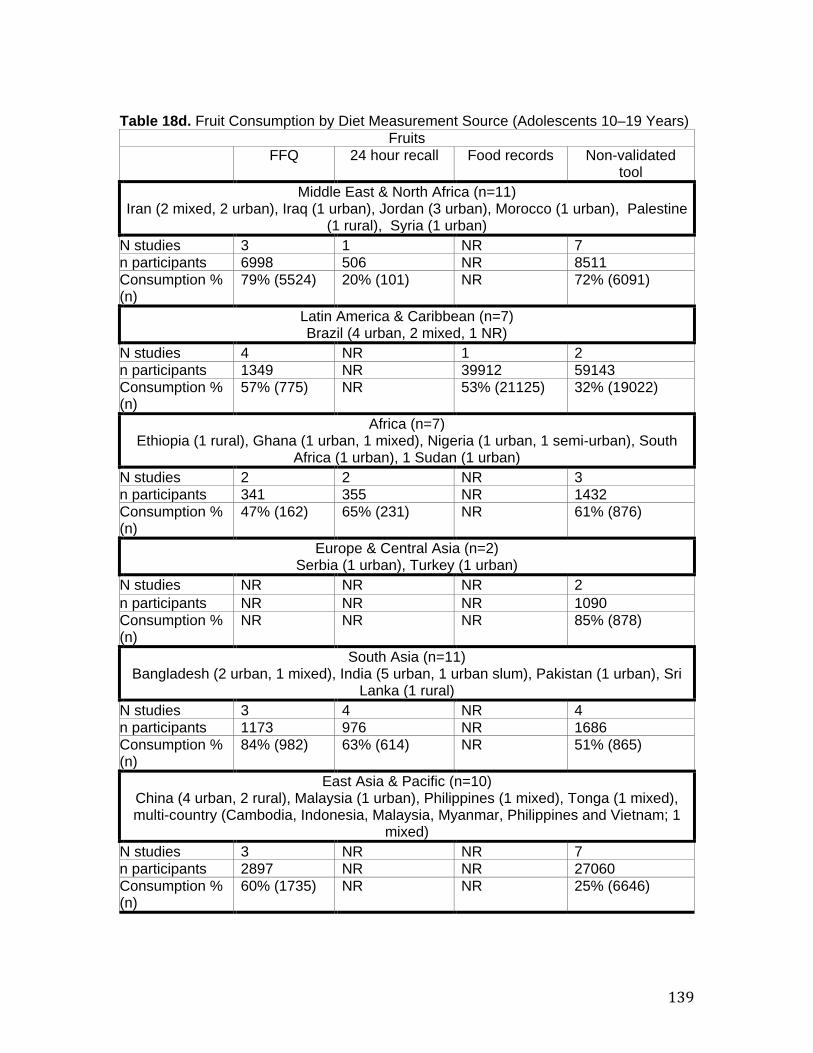
139
Table 18d. Fruit Consumption by Diet Measurement Source (Adolescents 10–19 Years)
Fruits FFQ 24 hour recall Food records Non-validated
tool Middle East & North Africa (n=11)
Iran (2 mixed, 2 urban), Iraq (1 urban), Jordan (3 urban), Morocco (1 urban), Palestine (1 rural), Syria (1 urban)
N studies 3 1 NR 7 n participants 6998 506 NR 8511 Consumption % (n)
79% (5524) 20% (101) NR 72% (6091)
Latin America & Caribbean (n=7) Brazil (4 urban, 2 mixed, 1 NR)
N studies 4 NR 1 2 n participants 1349 NR 39912 59143 Consumption % (n)
57% (775) NR 53% (21125) 32% (19022)
Africa (n=7) Ethiopia (1 rural), Ghana (1 urban, 1 mixed), Nigeria (1 urban, 1 semi-urban), South
Africa (1 urban), 1 Sudan (1 urban) N studies 2 2 NR 3 n participants 341 355 NR 1432 Consumption % (n)
47% (162) 65% (231) NR 61% (876)
Europe & Central Asia (n=2) Serbia (1 urban), Turkey (1 urban)
N studies NR NR NR 2 n participants NR NR NR 1090 Consumption % (n)
NR NR NR 85% (878)
South Asia (n=11) Bangladesh (2 urban, 1 mixed), India (5 urban, 1 urban slum), Pakistan (1 urban), Sri
Lanka (1 rural) N studies 3 4 NR 4 n participants 1173 976 NR 1686 Consumption % (n)
84% (982) 63% (614) NR 51% (865)
East Asia & Pacific (n=10) China (4 urban, 2 rural), Malaysia (1 urban), Philippines (1 mixed), Tonga (1 mixed), multi-country (Cambodia, Indonesia, Malaysia, Myanmar, Philippines and Vietnam; 1
mixed) N studies 3 NR NR 7 n participants 2897 NR NR 27060 Consumption % (n)
60% (1735) NR NR 25% (6646)
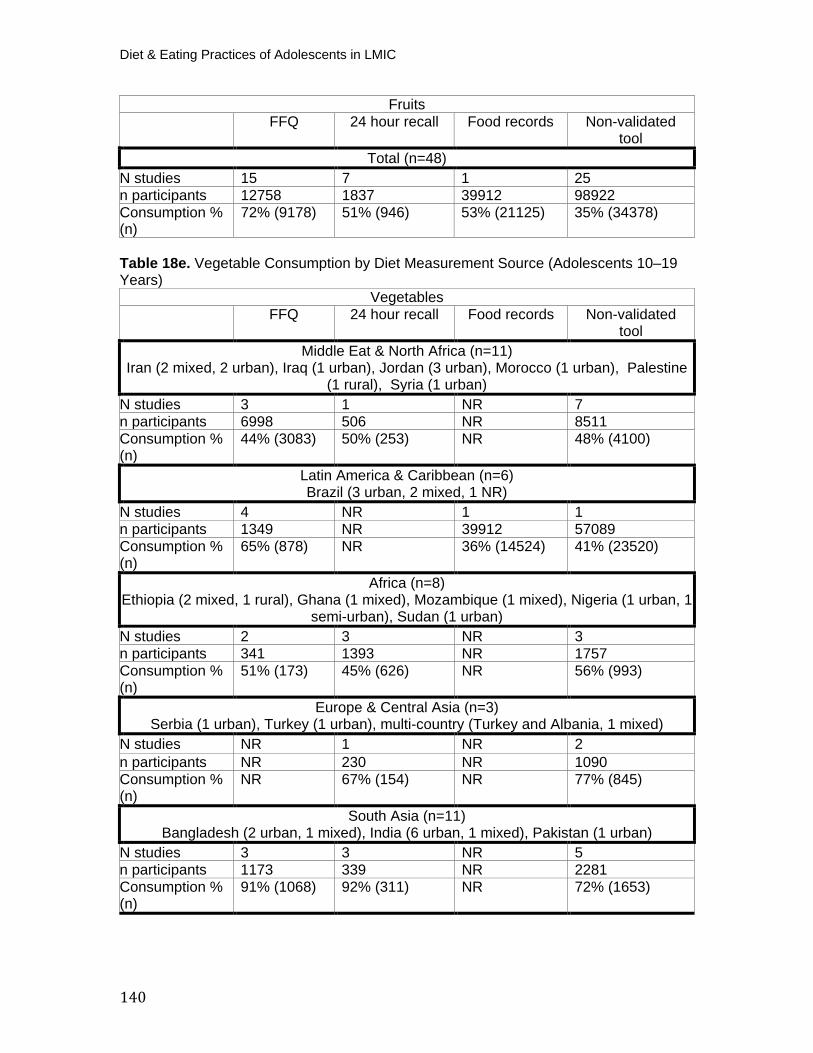
Diet & Eating Practices of Adolescents in LMIC
140
Fruits FFQ 24 hour recall Food records Non-validated
tool Total (n=48)
N studies 15 7 1 25 n participants 12758 1837 39912 98922 Consumption % (n)
72% (9178) 51% (946) 53% (21125) 35% (34378)
Table 18e. Vegetable Consumption by Diet Measurement Source (Adolescents 10–19 Years)
Vegetables FFQ 24 hour recall Food records Non-validated
tool Middle Eat & North Africa (n=11)
Iran (2 mixed, 2 urban), Iraq (1 urban), Jordan (3 urban), Morocco (1 urban), Palestine (1 rural), Syria (1 urban)
N studies 3 1 NR 7 n participants 6998 506 NR 8511 Consumption % (n)
44% (3083) 50% (253) NR 48% (4100)
Latin America & Caribbean (n=6) Brazil (3 urban, 2 mixed, 1 NR)
N studies 4 NR 1 1 n participants 1349 NR 39912 57089 Consumption % (n)
65% (878) NR 36% (14524) 41% (23520)
Africa (n=8) Ethiopia (2 mixed, 1 rural), Ghana (1 mixed), Mozambique (1 mixed), Nigeria (1 urban, 1
semi-urban), Sudan (1 urban) N studies 2 3 NR 3 n participants 341 1393 NR 1757 Consumption % (n)
51% (173) 45% (626) NR 56% (993)
Europe & Central Asia (n=3) Serbia (1 urban), Turkey (1 urban), multi-country (Turkey and Albania, 1 mixed)
N studies NR 1 NR 2 n participants NR 230 NR 1090 Consumption % (n)
NR 67% (154) NR 77% (845)
South Asia (n=11) Bangladesh (2 urban, 1 mixed), India (6 urban, 1 mixed), Pakistan (1 urban)
N studies 3 3 NR 5 n participants 1173 339 NR 2281 Consumption % (n)
91% (1068) 92% (311) NR 72% (1653)
141
Vegetables FFQ 24 hour recall Food records Non-validated
tool East Asia & Pacific (n=8)
China (3 urban, 2 rural), Philippines (1 mixed), Tonga (1 mixed), multi-country (Cambodia, Indonesia, Malaysia, Myanmar, Philippines and Vietnam; 1 mixed)
N studies 3 NR NR 5 n participants 2897 NR NR 25541 Consumption % (n)
79% (2297) NR NR 29% (7325)
Total (n=47) N studies 15 8 1 23 n participants 12758 2468 39912 96269 Consumption % (n)
59% (7499) 54% (1344) 36% (14524) 40% (38436)
Table 19a. Consumption of Grains among Adolescents Ages 10–19 Years (Low Quality Studies Removed) Middle East & North Africa N studies=0 NR Latin America & Caribbean N studies=1
n participants=287 Consumption % (n): 82.2% (236)
Africa N studies=4 n participants=3716
Consumption % (n): 34% (1276)
East Asia & Pacific N studies=1 n participants=97
Consumption % (n): 80.4% (78)
Europe & Central Asia N studies=1 n participants=377
Consumption % (n): 72% (271)
South Asia N studies=2 n participants=586
Consumption % (n): 42.3% (248)
Table 19b: Consumption of dairy products among adolescents aged 10 to 19 years (low quality studies removed) Middle East & North Africa N studies=3
n participants=13487 Consumption % (n): 20% (2829)
Latin America & Caribbean N studies=1 n participants=190
Consumption % (n): 53% (101)
Africa N studies=3 n participants=985
Consumption % (n): 53% (1584)
East Asia & Pacific N studies=3 n participants=3146
Consumption % (n): 9% (303)
Europe & Central Asia N studies=1 n participants=377
Consumption % (n): 58% (219)
South Asia N studies: 1 n participants=506
Consumption % (n): 56% (282)
Diet & Eating Practices of Adolescents in LMIC
142
Table 19c: Consumption of meats, poultry, and fish among adolescents aged 10 to 19 years (low quality studies removed) Middle East & North Africa N studies=0 NR Latin America & Caribbean N studies=0 NR Africa N studies=4
n participants= 3716 Consumption % (n): 34.5% (1280)
East Asia & Pacific N studies=4 n participants=3851
Consumption % (n): 17.3% (667)
Europe & Central Asia N studies=1 n participants=230
Consumption % (n): 43.6% (100)
South Asia N studies=4 n participants=1191
Consumption % (n): 15% (180)
Table 19d: Consumption of fruits among adolescents aged 10 to 19 years (low quality studies removed). Middle East & North Africa N studies=3
n participants=13487 Consumption % (n): 38% (5130)
Latin America & Caribbean N studies=2 n participants=632
Consumption % (n): 32.3% (204)
Africa N studies=3 n participants=1182
Consumption % (n): 22% (261)
East Asia & Pacific N studies=7 n participants=26147
Consumption % (n): 4% (1214)
Europe & Central Asia N studies=1 n participants=377
Consumption % (n): 96.5% (364)
South Asia N studies=4 n participants=1807
Consumption % (n): 19% (342)
Table 19e. Consumption of Vegetables among Adolescents Ages 10–19 Years (Low Quality Studies Removed) Middle East & North Africa N studies=3
n participants=13487 Consumption % (n): 20.7% (2798)
Latin America & Caribbean N studies=2 n participants=632
Consumption % (n): 35% (223)
Africa N studies=2 n participants=847
Consumption % (n): 34.2% (290)
East Asia & Pacific N studies=7 n participants=26147
Consumption % (n): 6% (1732)
Europe & Central Asia N studies=2 n participants= 607
Consumption % (n): 43% (266)
South Asia N studies=3 n participants=1634
Consumption % (n): 34% (563)

143
Table 20. Frequency of Eating Meals Outside Of The Home, Disaggregated By Region And By Age.
10–14 15–19 10–19 Daily (n=7)
India (1 urban, 1 mixed), Malaysia (1 urban, 1 rural, 1 NR), Morocco (1 urban), South Africa (1 urban)
N studies 1 5 7 n participants 803 1795 3174 Urban/Rural/Mixed 1 NR 3 urban, 1 rural, 1
mixed 4 urban, 1 mixed, 1 NR, 1 rural
Weighted prevalence % (n)
11.1% (89) 19.9% (357) 23.8% (757)
1–3 times/week (n=7)
India (2 urban), Malaysia (1 urban, 1 rural, 1 NR), Pakistan (1 mixed), South Africa (1 urban)
N studies 2 5 7 n participants 883 2680 3563 Urban/Rural/Mixed 1 urban, 1 NR 3 urban, 1 rural, 1
mixed 4 urban, 1 rural, 1 mixed, 1 NR
Weighted prevalence % (n)
32.5% (287) 17.7% (476) 21.4% (763)
4–6 times/week (n=9)
China (1 urban), India (2 urban), Malaysia (1 urban, 1 rural, 1 NR), Palestine (1 rural), Pakistan (1 mixed), South Africa (1 urban)
N studies 3 6 9 n participants 2421 3037 5458 Urban/Rural/Mixed 2 urban, 1 NR 3 urban, 2 rural, 1
mixed 5 urban, 2 rural, 1 mixed, 1 NR
Weighted prevalence % (n)
10.3% (250) 10.5% (320) 10.4% (568)
Monthly (n=5)
India (2 urban, 1 mixed), Malaysia (1 urban, 1 NR) N studies 2 3 5 n participants 883 2430 3313 Urban/Rural/Mixed 1 urban, 1 NR 2 urban, 1 mixed 3 urban, 1 mixed, 1 NR Weighted prevalence % (n)
33.3% (291) 25.4% (616) 27.4% (907)
Never (n=6) India (2 urban), Malaysia (1 urban, 1 NR), Pakistan (1 mixed), South Africa (1 urban)
N studies 1 4 6 n participants 803 2548 3927 Urban/Rural/Mixed 1 NR 3 urban, 1 mixed 4 urban, 1 mixed, 1 NR Weighted prevalence % (n)
12% (97) 26.7% (680) 24.5% (962)
Diet & Eating Practices of Adolescents in LMIC
144
10–14 15–19 10–19 Total P
1
N studies 8 19 28 n participants 4990 9942 15508 Urban/Rural/Mixed 4 NR, 3 urban 11 urban, 4 mixed, 4
rural 16 urban, 4 NR, 4 mixed, 4 rural
Weighted prevalence % (n)
21.8% (1089) 17.8% (1768) 19.3% (2993)
P
1PNote that total eating out of the home doesn’t include ‘never’ category
Table 21. Prevalence of Breakfast Skipping, Disaggregated by Region and by Age 10–14 15–19 10–19 Middle East & North Africa (n=10)
Egypt (1 mixed), Iran (2 mixed, 1 urban), Iraq (1 urban, 1 mixed), Gaza (1 NR), Jordan (2 urban), Palestine (1 rural)
N studies 2 6 10 n participants 6791 3260 15407 Urban/Rural/Mixed 1 urban, 1 mixed 3 mixed, 2 urban, 1
NR 4 urban, 4 mixed, 1 rural, 1 NR
Skipping % (n) 36.5% (2478) 53.3% (1739) 43.3% (6667) Latin America & Caribbean (n=4)
Brazil (4 urban) N studies 2 2 4 n participants 1814 294 2108 Urban/Rural/Mixed 2 urban 2 urban 4 urban Skipping % (n) 10.6% (193) 54.8% (161) 16.8% (354)
Africa (n=5)Ghana (1 mixed, 1 NR), Nigeria (2 urban, 1 semi-urban)
N studies 2 1 5 n participants 2250 384 3147 Urban/Rural/Mixed 1 urban, 1 semi-
urban 1 urban 2 urban, 1 semi-urban,
1 mixed, 1 NR Skipping % (n) 65.8% (1481) 20.6% (79) 47.2% (1486)
Europe & Central Asia (n=2)Bosnia & Herzegovina (1 mixed), Serbia (1 urban)
N studies 1 1 2 n participants 306 377 683 Urban/Rural/Mixed 1 mixed 1 urban 1 urban, 1 mixed Skipping % (n) 58.5% (179) 35.0% (132) 45.5% (311)
145
10–14 15–19 10–19 South Asia (n=8)
India (6 urban, 1 rural, 1 mixed) N studies 2 4 8 n participants 913 858 2291 Urban/Rural/Mixed 1 urban, 1 rural 4 urban 6 urban, 1 rural, 1
mixed Skipping % (n) 41.9% (383) 22.5% (193) 27.6% (632)
East Asia & Pacific (n=13) China (4 rural, 2 urban, 1 mixed), Fiji (1 mixed), Malaysia (2 urban, 1 rural, 1 NR), Tonga
(1 mixed) N studies 9 3 13 n participants 10479 1056 21354 Urban/Rural/Mixed 4 rural, 3 urban, 1
mixed, 1 NR 1 urban, 1 rural, 1 mixed
5 rural, 4 urban, 3 mixed, 1 NR
Skipping % (n) 41.1% (4310) 56.2% (594) 40.6% (8679) Total (n=42)
N studies 18 17 42 n participants 22553 6229 44990 Urban/Rural/Mixed 8 urban, 5 rural, 3
mixed, 1 semi-urban, 1 NR
11 urban, 4 mixed, 1 rural, 1 NR
21 urban, 10 mixed, 7 rural, 3 NR, 1 semi-urban
Skipping % (n) 40.0% (9024) 46.5% (2898) 40.3% (18129) P
1POne study stratifies data by younger and older adolescents
Table 22. Prevalence of Snacking, Disaggregated by Age
10–14 15–19 10–19 Snacking (n=24) P
1
Brazil (3 urban), China (2 urban, 1 rural), Egypt (1 mixed), India (5 urban, 1 NR), Iran (1 urban), Lebanon (1 NR), Malaysia (1 urban), Myanmar (1 rural), Sudan (1 urban), Nigeria (1 urban, 1 semi-urban), Syria (1 urban), Tanzania (1 mixed), Tonga (1 mixed), Turkey (1
urban) N studies 8 14 24 n participants 5995 5234 12647 Urban/Rural/Mixed 4 urban, 2 rural, 1
mixed, 1 semi-urban 11 urban, 2 mixed, 1 NR
16 urban, 3 mixed, 2 rural, 1 semi-urban, 2 NR
Consumption % (n) 33.2% (1993) 58.9% (3135) 48.5% (6134)
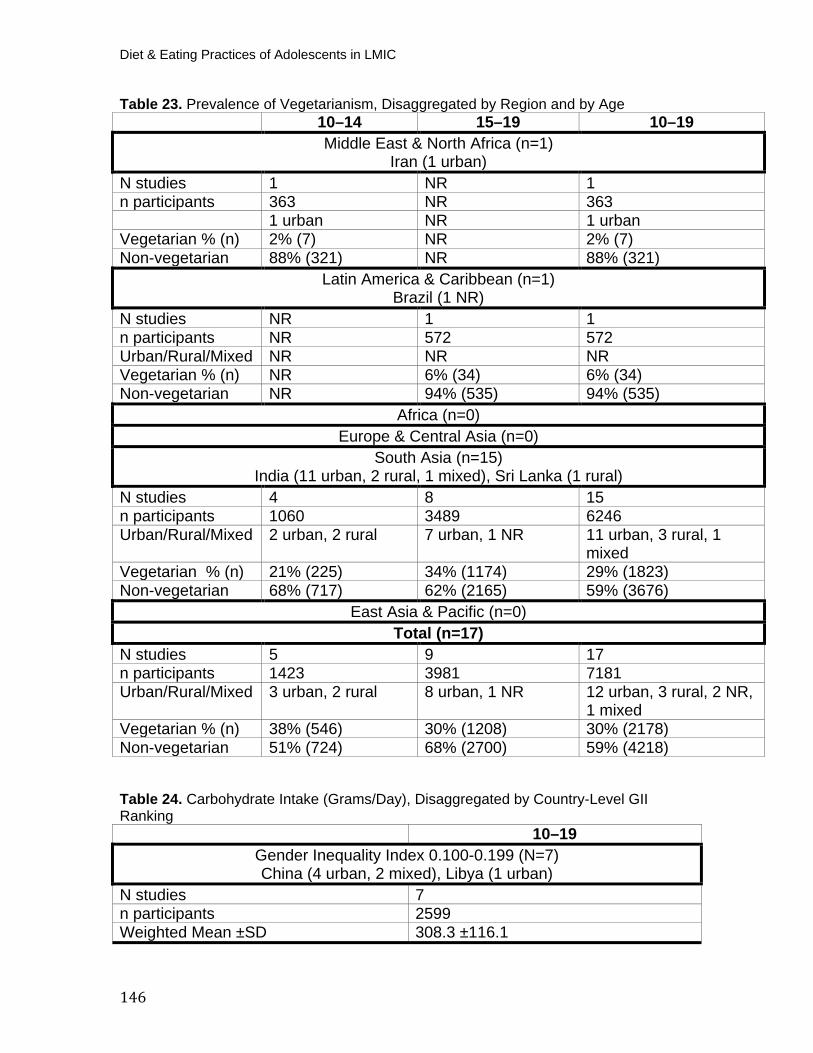
Diet & Eating Practices of Adolescents in LMIC
146
Table 23. Prevalence of Vegetarianism, Disaggregated by Region and by Age 10–14 15–19 10–19 Middle East & North Africa (n=1)
Iran (1 urban) N studies 1 NR 1 n participants 363 NR 363
1 urban NR 1 urban Vegetarian % (n) 2% (7) NR 2% (7) Non-vegetarian 88% (321) NR 88% (321)
Latin America & Caribbean (n=1)Brazil (1 NR)
N studies NR 1 1 n participants NR 572 572 Urban/Rural/Mixed NR NR NR Vegetarian % (n) NR 6% (34) 6% (34) Non-vegetarian NR 94% (535) 94% (535)
Africa (n=0)Europe & Central Asia (n=0)
South Asia (n=15) India (11 urban, 2 rural, 1 mixed), Sri Lanka (1 rural)
N studies 4 8 15 n participants 1060 3489 6246 Urban/Rural/Mixed 2 urban, 2 rural 7 urban, 1 NR 11 urban, 3 rural, 1
mixed Vegetarian % (n) 21% (225) 34% (1174) 29% (1823) Non-vegetarian 68% (717) 62% (2165) 59% (3676)
East Asia & Pacific (n=0) Total (n=17)
N studies 5 9 17 n participants 1423 3981 7181 Urban/Rural/Mixed 3 urban, 2 rural 8 urban, 1 NR 12 urban, 3 rural, 2 NR,
1 mixed Vegetarian % (n) 38% (546) 30% (1208) 30% (2178) Non-vegetarian 51% (724) 68% (2700) 59% (4218)
Table 24. Carbohydrate Intake (Grams/Day), Disaggregated by Country-Level GII Ranking
10–19 Gender Inequality Index 0.100-0.199 (N=7) China (4 urban, 2 mixed), Libya (1 urban)
N studies 7 n participants 2599 Weighted Mean ±SD 308.3 ±116.1
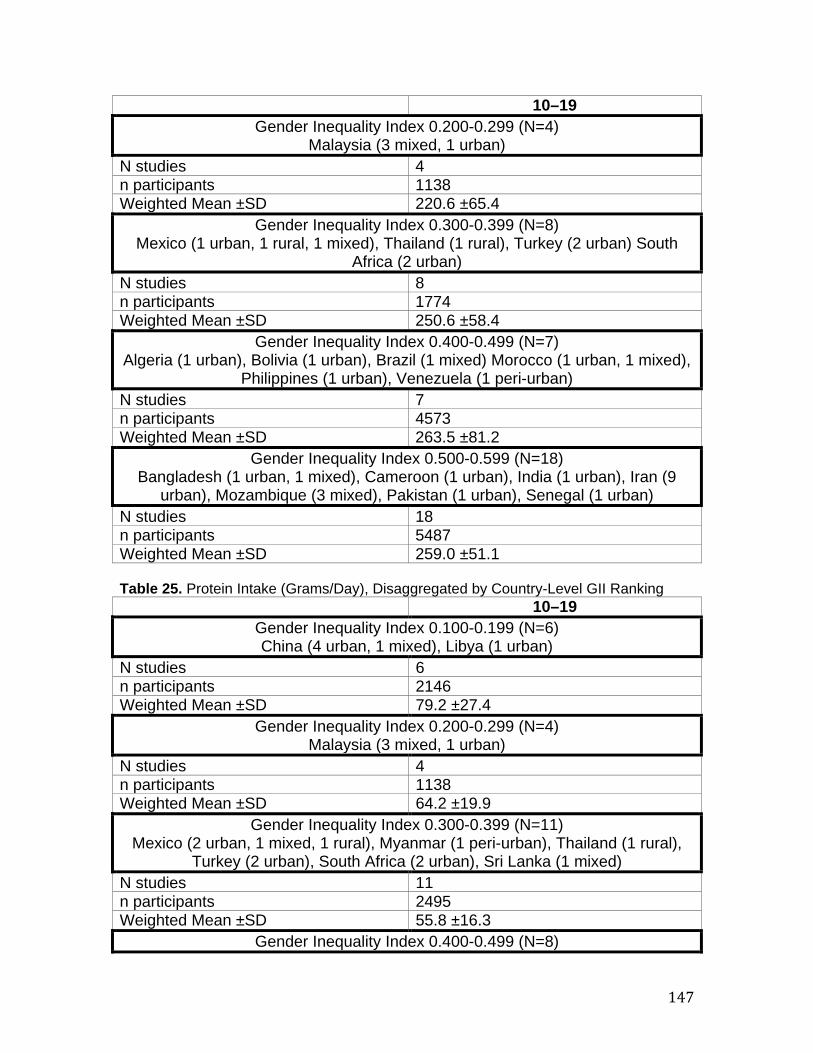
147
10–19 Gender Inequality Index 0.200-0.299 (N=4)
Malaysia (3 mixed, 1 urban) N studies 4 n participants 1138 Weighted Mean ±SD 220.6 ±65.4
Gender Inequality Index 0.300-0.399 (N=8) Mexico (1 urban, 1 rural, 1 mixed), Thailand (1 rural), Turkey (2 urban) South
Africa (2 urban) N studies 8 n participants 1774 Weighted Mean ±SD 250.6 ±58.4
Gender Inequality Index 0.400-0.499 (N=7) Algeria (1 urban), Bolivia (1 urban), Brazil (1 mixed) Morocco (1 urban, 1 mixed),
Philippines (1 urban), Venezuela (1 peri-urban) N studies 7 n participants 4573 Weighted Mean ±SD 263.5 ±81.2
Gender Inequality Index 0.500-0.599 (N=18) Bangladesh (1 urban, 1 mixed), Cameroon (1 urban), India (1 urban), Iran (9
urban), Mozambique (3 mixed), Pakistan (1 urban), Senegal (1 urban) N studies 18 n participants 5487 Weighted Mean ±SD 259.0 ±51.1 Table 25. Protein Intake (Grams/Day), Disaggregated by Country-Level GII Ranking 10–19
Gender Inequality Index 0.100-0.199 (N=6) China (4 urban, 1 mixed), Libya (1 urban)
N studies 6 n participants 2146 Weighted Mean ±SD 79.2 ±27.4
Gender Inequality Index 0.200-0.299 (N=4) Malaysia (3 mixed, 1 urban)
N studies 4 n participants 1138 Weighted Mean ±SD 64.2 ±19.9
Gender Inequality Index 0.300-0.399 (N=11) Mexico (2 urban, 1 mixed, 1 rural), Myanmar (1 peri-urban), Thailand (1 rural),
Turkey (2 urban), South Africa (2 urban), Sri Lanka (1 mixed) N studies 11 n participants 2495 Weighted Mean ±SD 55.8 ±16.3
Gender Inequality Index 0.400-0.499 (N=8)
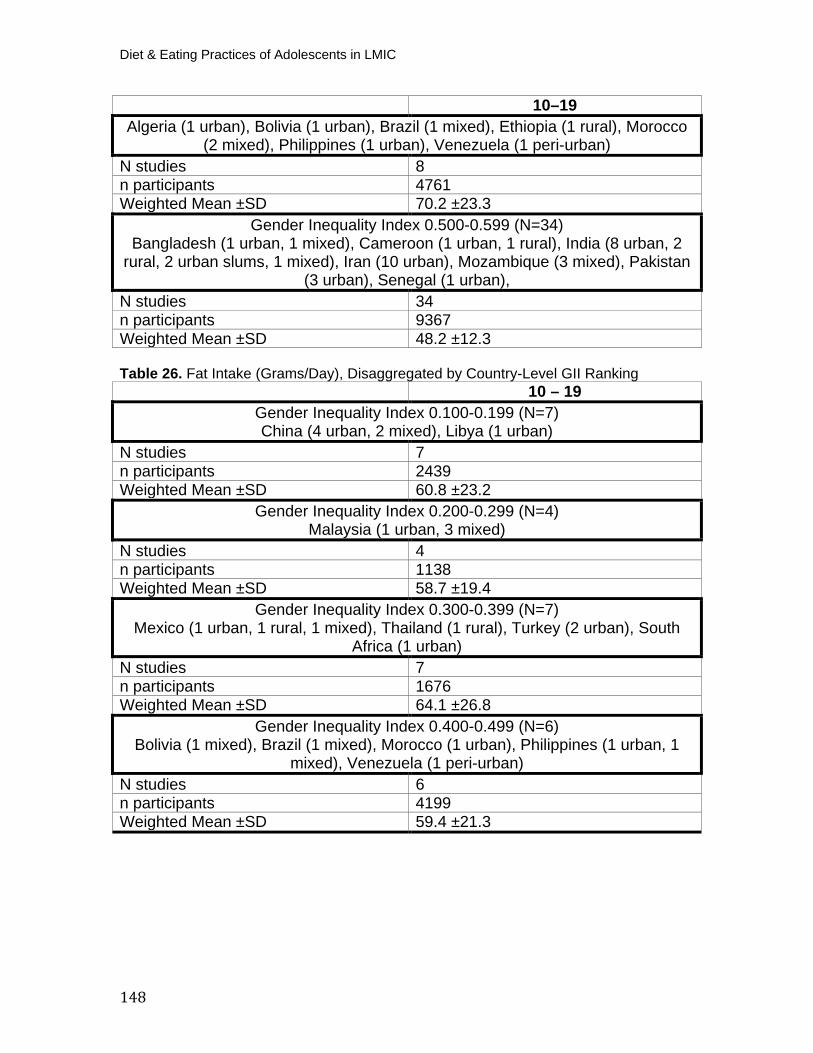
Diet & Eating Practices of Adolescents in LMIC
148
10–19 Algeria (1 urban), Bolivia (1 urban), Brazil (1 mixed), Ethiopia (1 rural), Morocco
(2 mixed), Philippines (1 urban), Venezuela (1 peri-urban) N studies 8 n participants 4761 Weighted Mean ±SD 70.2 ±23.3
Gender Inequality Index 0.500-0.599 (N=34) Bangladesh (1 urban, 1 mixed), Cameroon (1 urban, 1 rural), India (8 urban, 2
rural, 2 urban slums, 1 mixed), Iran (10 urban), Mozambique (3 mixed), Pakistan (3 urban), Senegal (1 urban),
N studies 34 n participants 9367 Weighted Mean ±SD 48.2 ±12.3
Table 26. Fat Intake (Grams/Day), Disaggregated by Country-Level GII Ranking 10 – 19
Gender Inequality Index 0.100-0.199 (N=7) China (4 urban, 2 mixed), Libya (1 urban)
N studies 7 n participants 2439 Weighted Mean ±SD 60.8 ±23.2
Gender Inequality Index 0.200-0.299 (N=4) Malaysia (1 urban, 3 mixed)
N studies 4 n participants 1138 Weighted Mean ±SD 58.7 ±19.4
Gender Inequality Index 0.300-0.399 (N=7) Mexico (1 urban, 1 rural, 1 mixed), Thailand (1 rural), Turkey (2 urban), South
Africa (1 urban) N studies 7 n participants 1676 Weighted Mean ±SD 64.1 ±26.8
Gender Inequality Index 0.400-0.499 (N=6) Bolivia (1 mixed), Brazil (1 mixed), Morocco (1 urban), Philippines (1 urban, 1
mixed), Venezuela (1 peri-urban) N studies 6 n participants 4199 Weighted Mean ±SD 59.4 ±21.3
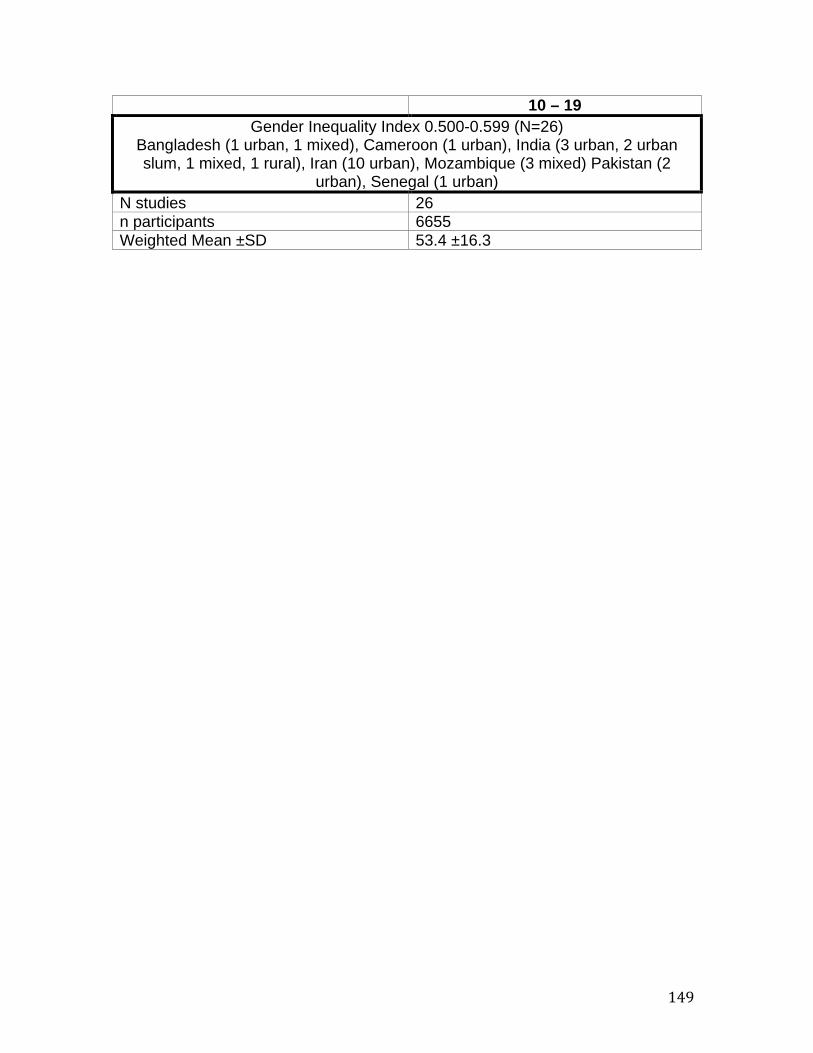
149
10 – 19 Gender Inequality Index 0.500-0.599 (N=26)
Bangladesh (1 urban, 1 mixed), Cameroon (1 urban), India (3 urban, 2 urban slum, 1 mixed, 1 rural), Iran (10 urban), Mozambique (3 mixed) Pakistan (2
urban), Senegal (1 urban) N studies 26 n participants 6655 Weighted Mean ±SD 53.4 ±16.3
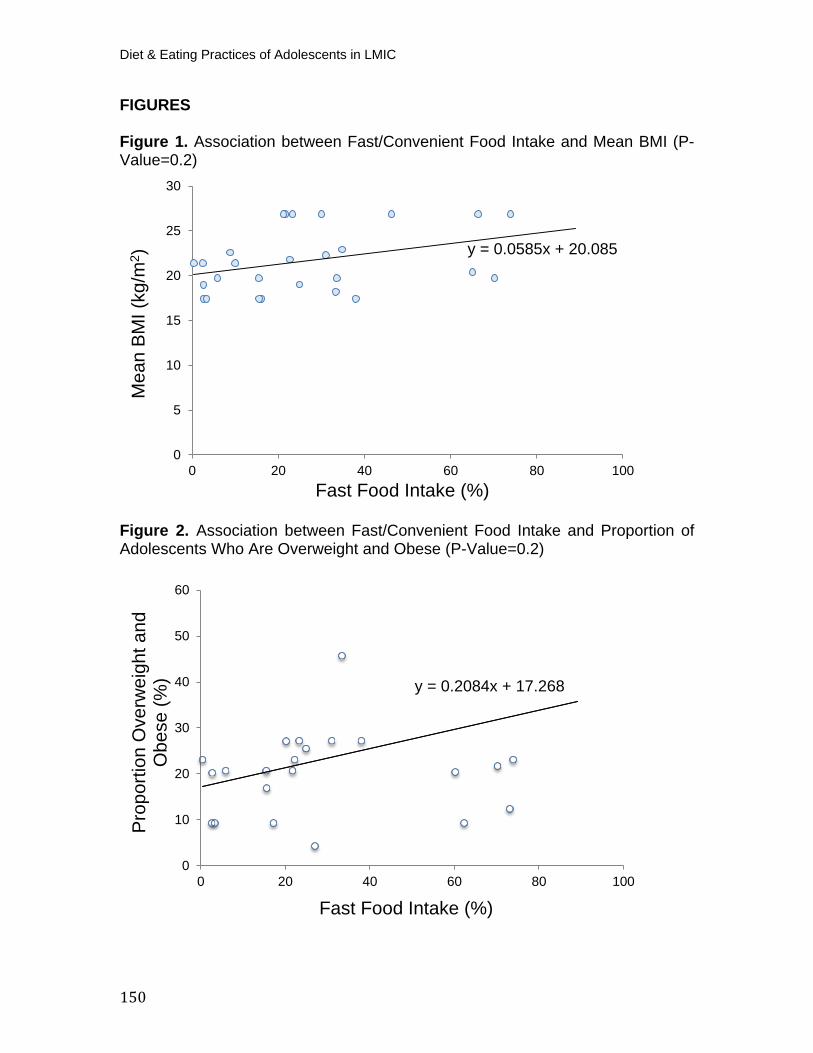
Diet & Eating Practices of Adolescents in LMIC
150
FIGURES
Figure 1. Association between Fast/Convenient Food Intake and Mean BMI (P-Value=0.2)
Figure 2. Association between Fast/Convenient Food Intake and Proportion of Adolescents Who Are Overweight and Obese (P-Value=0.2)
y = 0.0585x + 20.085
0
5
10
15
20
25
30
0 20 40 60 80 100
Mea
n BM
I (kg
/m2 )
Fast Food Intake (%)
y = 0.2084x + 17.268
0
10
20
30
40
50
60
0 20 40 60 80 100
Prop
ortio
n O
verw
eigh
t and
O
bese
(%)
Fast Food Intake (%)
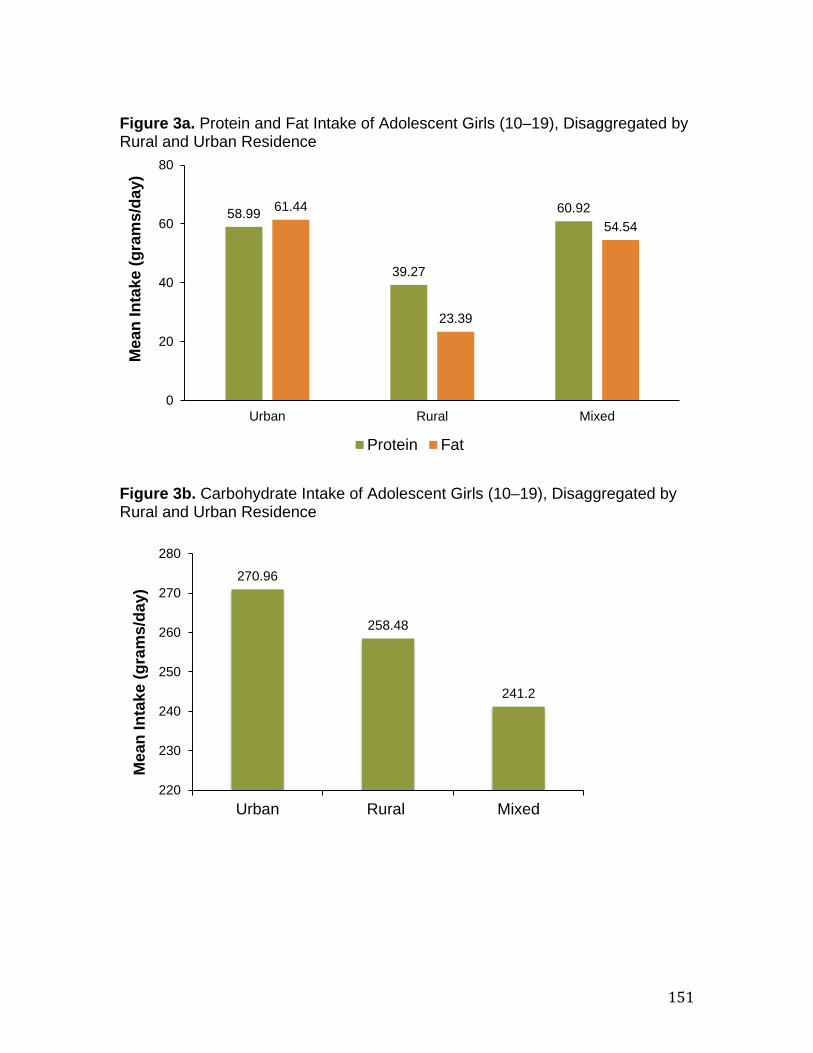
151
Figure 3a. Protein and Fat Intake of Adolescent Girls (10–19), Disaggregated by Rural and Urban Residence
Figure 3b. Carbohydrate Intake of Adolescent Girls (10–19), Disaggregated by Rural and Urban Residence
58.99
39.27
60.92 61.44
23.39
54.54
0
20
40
60
80
Urban Rural Mixed
Mea
n In
take
(gra
ms/
day)
Protein Fat
270.96
258.48
241.2
220
230
240
250
260
270
280
Urban Rural Mixed
Mea
n In
take
(gra
ms/
day)
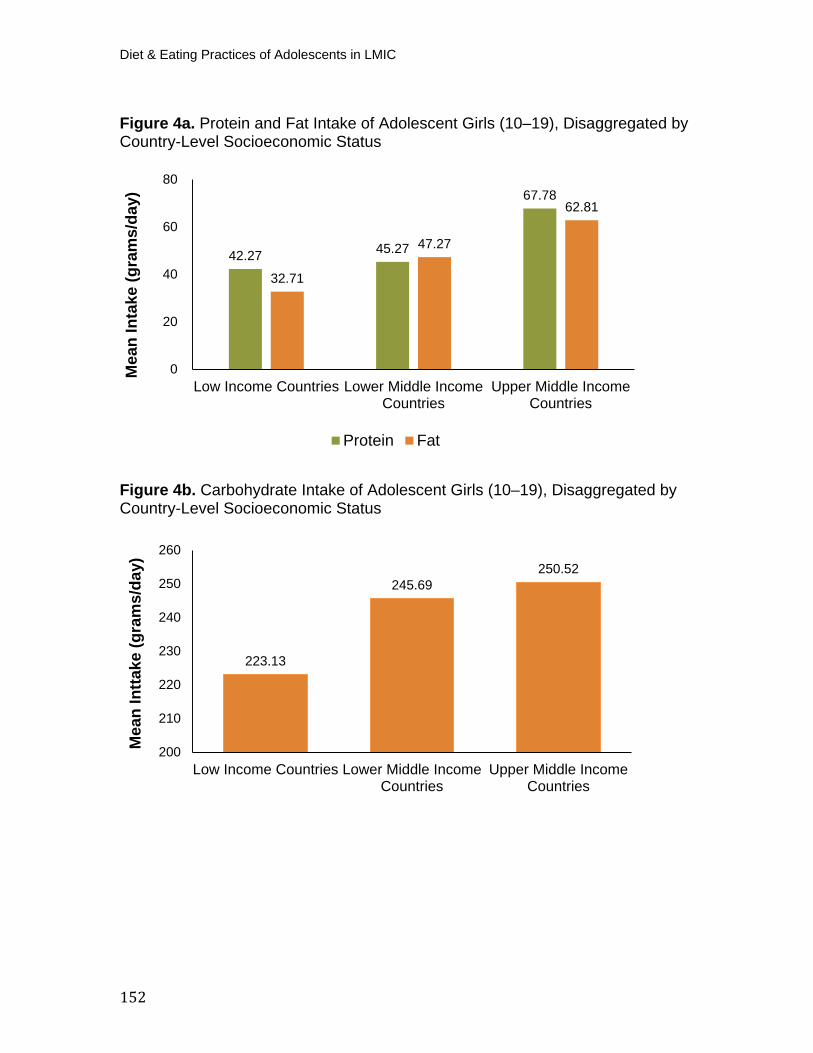
Diet & Eating Practices of Adolescents in LMIC
152
Figure 4a. Protein and Fat Intake of Adolescent Girls (10–19), Disaggregated by Country-Level Socioeconomic Status
Figure 4b. Carbohydrate Intake of Adolescent Girls (10–19), Disaggregated by Country-Level Socioeconomic Status
42.27 45.27
67.78
32.71
47.27
62.81
0
20
40
60
80
Low Income Countries Lower Middle IncomeCountries
Upper Middle IncomeCountries
Mea
n In
take
(gra
ms/
day)
Protein Fat
223.13
245.69 250.52
200
210
220
230
240
250
260
Low Income Countries Lower Middle IncomeCountries
Upper Middle IncomeCountries
Mea
n In
ttake
(gra
ms/
day)

153
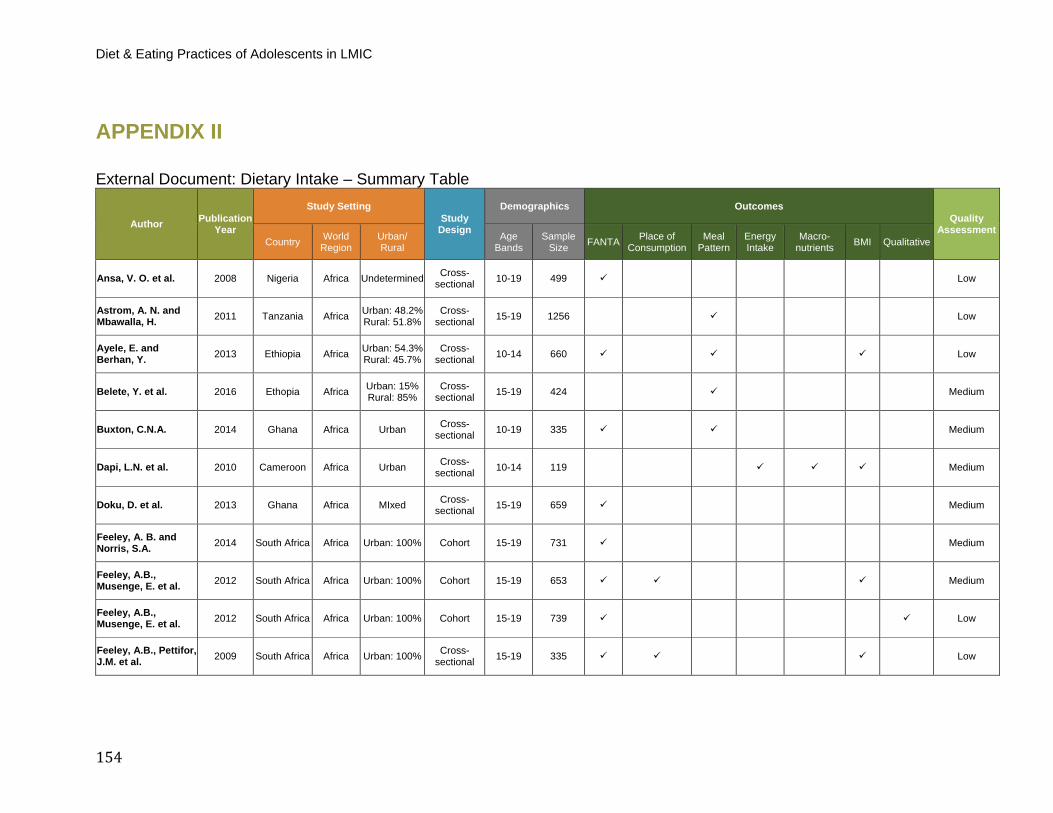
Diet & Eating Practices of Adolescents in LMIC
154
APPENDIX II
External Document: Dietary Intake – Summary Table
Author Publication Year
Study Setting Study
Design
Demographics Outcomes Quality
Assessment Country World
Region Urban/ Rural
Age Bands
Sample Size FANTA Place of
Consumption Meal
Pattern Energy Intake
Macro- nutrients BMI Qualitative
Ansa, V. O. et al. 2008 Nigeria Africa Undetermined Cross-sectional 10-19 499 Low
Astrom, A. N. and Mbawalla, H. 2011 Tanzania Africa Urban: 48.2%
Rural: 51.8% Cross-
sectional 15-19 1256 Low
Ayele, E. and Berhan, Y. 2013 Ethiopia Africa Urban: 54.3%
Rural: 45.7% Cross-
sectional 10-14 660 Low
Belete, Y. et al. 2016 Ethopia Africa Urban: 15% Rural: 85%
Cross-sectional 15-19 424 Medium
Buxton, C.N.A. 2014 Ghana Africa Urban Cross-sectional 10-19 335 Medium
Dapi, L.N. et al. 2010 Cameroon Africa Urban Cross-sectional 10-14 119 Medium
Doku, D. et al. 2013 Ghana Africa MIxed Cross-sectional 15-19 659 Medium
Feeley, A. B. and Norris, S.A. 2014 South Africa Africa Urban: 100% Cohort 15-19 731 Medium
Feeley, A.B., Musenge, E. et al. 2012 South Africa Africa Urban: 100% Cohort 15-19 653 Medium
Feeley, A.B., Musenge, E. et al. 2012 South Africa Africa Urban: 100% Cohort 15-19 739 Low
Feeley, A.B., Pettifor, J.M. et al. 2009 South Africa Africa Urban: 100% Cross-
sectional 15-19 335 Low
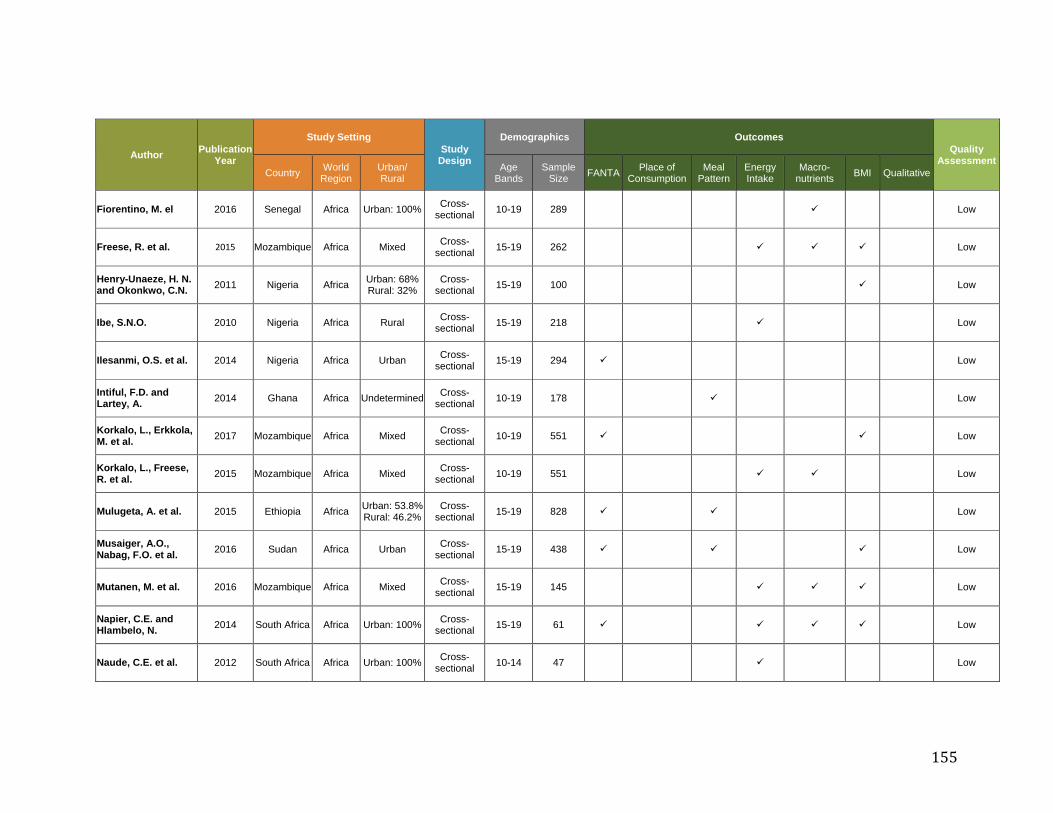
155
Author Publication Year
Study Setting Study
Design
Demographics Outcomes Quality
Assessment Country World
Region Urban/ Rural
Age Bands
Sample Size FANTA Place of
Consumption Meal
Pattern Energy Intake
Macro- nutrients BMI Qualitative
Fiorentino, M. el 2016 Senegal Africa Urban: 100% Cross-sectional 10-19 289 Low
Freese, R. et al. 2015 Mozambique Africa Mixed Cross-sectional 15-19 262 Low
Henry-Unaeze, H. N. and Okonkwo, C.N. 2011 Nigeria Africa Urban: 68%
Rural: 32% Cross-
sectional 15-19 100 Low
Ibe, S.N.O. 2010 Nigeria Africa Rural Cross-sectional 15-19 218 Low
Ilesanmi, O.S. et al. 2014 Nigeria Africa Urban Cross-sectional 15-19 294 Low
Intiful, F.D. and Lartey, A. 2014 Ghana Africa Undetermined Cross-
sectional 10-19 178 Low
Korkalo, L., Erkkola, M. et al. 2017 Mozambique Africa Mixed Cross-
sectional 10-19 551 Low
Korkalo, L., Freese, R. et al. 2015 Mozambique Africa Mixed Cross-
sectional 10-19 551 Low
Mulugeta, A. et al. 2015 Ethiopia Africa Urban: 53.8% Rural: 46.2%
Cross-sectional 15-19 828 Low
Musaiger, A.O., Nabag, F.O. et al. 2016 Sudan Africa Urban Cross-
sectional 15-19 438 Low
Mutanen, M. et al. 2016 Mozambique Africa Mixed Cross-sectional 15-19 145 Low
Napier, C.E. and Hlambelo, N. 2014 South Africa Africa Urban: 100% Cross-
sectional 15-19 61 Low
Naude, C.E. et al. 2012 South Africa Africa Urban: 100% Cross-sectional 10-14 47 Low
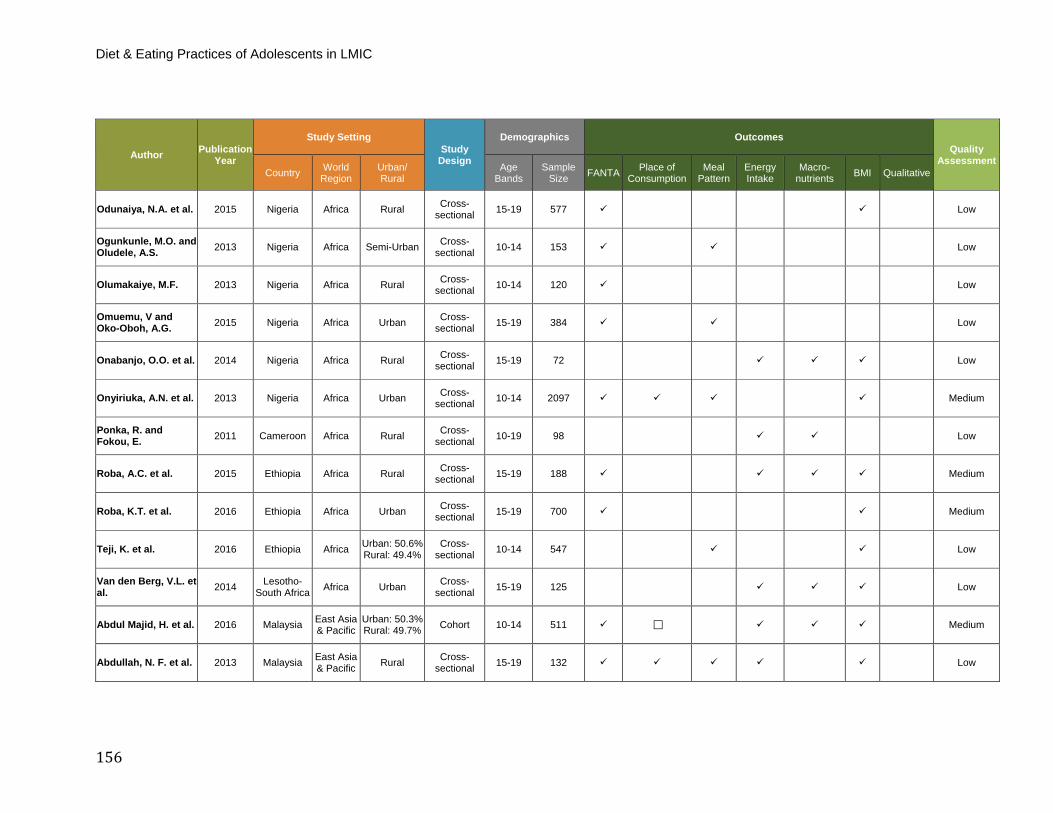
Diet & Eating Practices of Adolescents in LMIC
156
Author Publication Year
Study Setting Study
Design
Demographics Outcomes Quality
Assessment Country World
Region Urban/ Rural
Age Bands
Sample Size FANTA Place of
Consumption Meal
Pattern Energy Intake
Macro- nutrients BMI Qualitative
Odunaiya, N.A. et al. 2015 Nigeria Africa Rural Cross-sectional 15-19 577 Low
Ogunkunle, M.O. and Oludele, A.S. 2013 Nigeria Africa Semi-Urban Cross-
sectional 10-14 153 Low
Olumakaiye, M.F. 2013 Nigeria Africa Rural Cross-sectional 10-14 120 Low
Omuemu, V and Oko-Oboh, A.G. 2015 Nigeria Africa Urban Cross-
sectional 15-19 384 Low
Onabanjo, O.O. et al. 2014 Nigeria Africa Rural Cross-sectional 15-19 72 Low
Onyiriuka, A.N. et al. 2013 Nigeria Africa Urban Cross-sectional 10-14 2097 Medium
Ponka, R. and Fokou, E. 2011 Cameroon Africa Rural Cross-
sectional 10-19 98 Low
Roba, A.C. et al. 2015 Ethiopia Africa Rural Cross-sectional 15-19 188 Medium
Roba, K.T. et al. 2016 Ethiopia Africa Urban Cross-sectional 15-19 700 Medium
Teji, K. et al. 2016 Ethiopia Africa Urban: 50.6% Rural: 49.4%
Cross-sectional 10-14 547 Low
Van den Berg, V.L. et al. 2014 Lesotho-
South Africa Africa Urban Cross-sectional 15-19 125 Low
Abdul Majid, H. et al. 2016 Malaysia East Asia & Pacific
Urban: 50.3% Rural: 49.7% Cohort 10-14 511 Medium
Abdullah, N. F. et al. 2013 Malaysia East Asia & Pacific Rural Cross-
sectional 15-19 132 Low
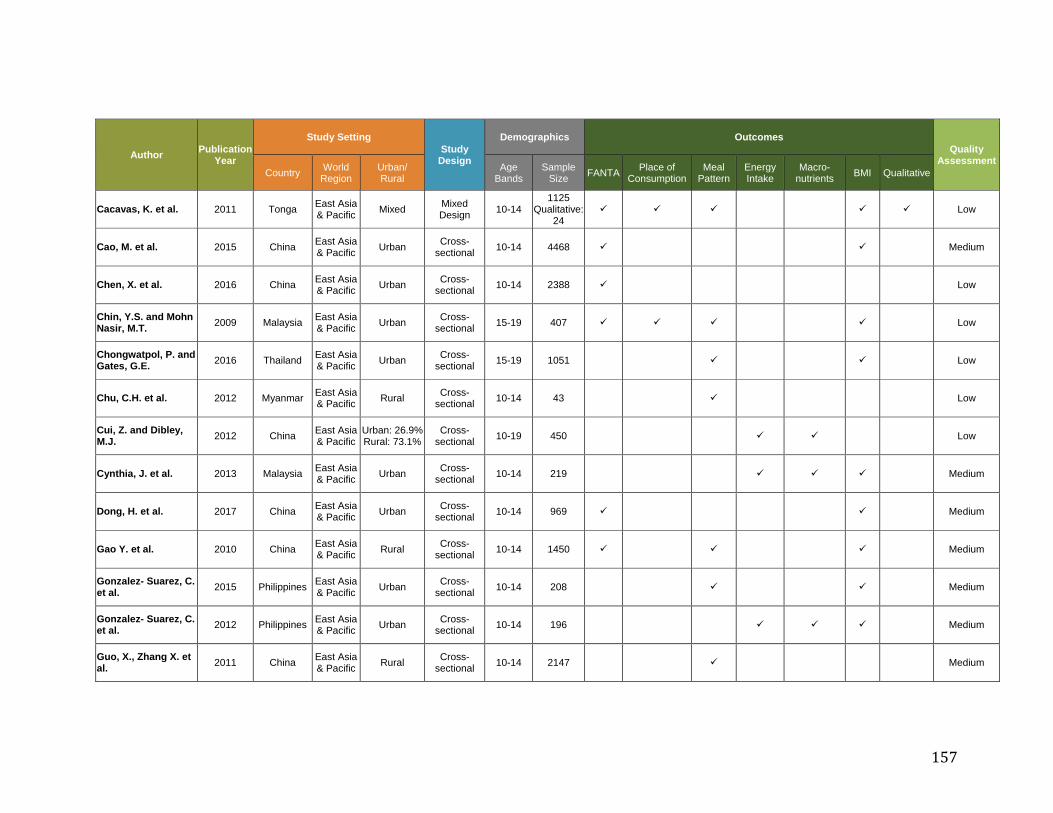
157
Author Publication Year
Study Setting Study
Design
Demographics Outcomes Quality
Assessment Country World
Region Urban/ Rural
Age Bands
Sample Size FANTA Place of
Consumption Meal
Pattern Energy Intake
Macro- nutrients BMI Qualitative
Cacavas, K. et al. 2011 Tonga East Asia & Pacific Mixed Mixed
Design 10-14 1125
Qualitative: 24
Low
Cao, M. et al. 2015 China East Asia & Pacific Urban Cross-
sectional 10-14 4468 Medium
Chen, X. et al. 2016 China East Asia & Pacific Urban Cross-
sectional 10-14 2388 Low
Chin, Y.S. and Mohn Nasir, M.T. 2009 Malaysia East Asia
& Pacific Urban Cross-sectional 15-19 407 Low
Chongwatpol, P. and Gates, G.E. 2016 Thailand East Asia
& Pacific Urban Cross-sectional 15-19 1051 Low
Chu, C.H. et al. 2012 Myanmar East Asia & Pacific Rural Cross-
sectional 10-14 43 Low
Cui, Z. and Dibley, M.J. 2012 China East Asia
& Pacific Urban: 26.9% Rural: 73.1%
Cross-sectional 10-19 450 Low
Cynthia, J. et al. 2013 Malaysia East Asia & Pacific Urban Cross-
sectional 10-14 219 Medium
Dong, H. et al. 2017 China East Asia & Pacific Urban Cross-
sectional 10-14 969 Medium
Gao Y. et al. 2010 China East Asia & Pacific Rural Cross-
sectional 10-14 1450 Medium
Gonzalez- Suarez, C. et al. 2015 Philippines East Asia
& Pacific Urban Cross-sectional 10-14 208 Medium
Gonzalez- Suarez, C. et al. 2012 Philippines East Asia
& Pacific Urban Cross-sectional 10-14 196 Medium
Guo, X., Zhang X. et al. 2011 China East Asia
& Pacific Rural Cross-sectional 10-14 2147 Medium
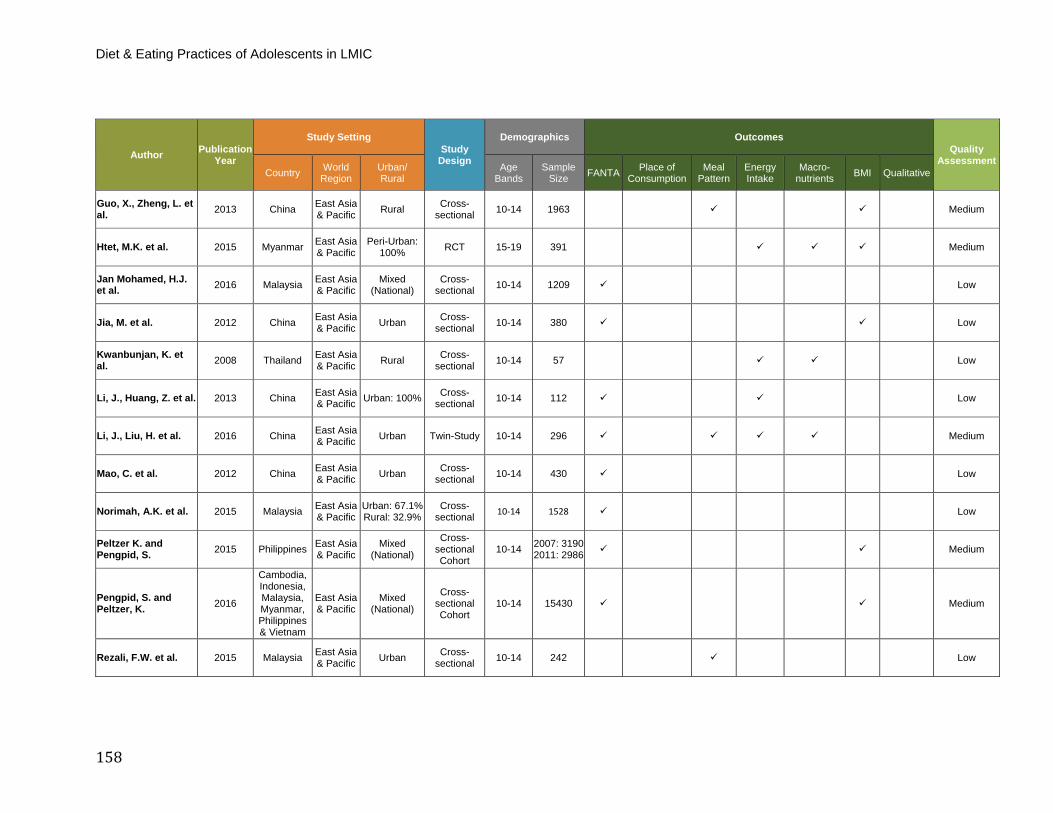
Diet & Eating Practices of Adolescents in LMIC
158
Author Publication Year
Study Setting Study
Design
Demographics Outcomes Quality
Assessment Country World
Region Urban/ Rural
Age Bands
Sample Size FANTA Place of
Consumption Meal
Pattern Energy Intake
Macro- nutrients BMI Qualitative
Guo, X., Zheng, L. et al. 2013 China East Asia
& Pacific Rural Cross-sectional 10-14 1963 Medium
Htet, M.K. et al. 2015 Myanmar East Asia & Pacific
Peri-Urban: 100% RCT 15-19 391 Medium
Jan Mohamed, H.J. et al. 2016 Malaysia East Asia
& Pacific Mixed
(National) Cross-
sectional 10-14 1209 Low
Jia, M. et al. 2012 China East Asia & Pacific Urban Cross-
sectional 10-14 380 Low
Kwanbunjan, K. et al. 2008 Thailand East Asia
& Pacific Rural Cross-sectional 10-14 57 Low
Li, J., Huang, Z. et al. 2013 China East Asia & Pacific Urban: 100% Cross-
sectional 10-14 112 Low
Li, J., Liu, H. et al. 2016 China East Asia & Pacific Urban Twin-Study 10-14 296 Medium
Mao, C. et al. 2012 China East Asia & Pacific Urban Cross-
sectional 10-14 430 Low
Norimah, A.K. et al. 2015 Malaysia East Asia & Pacific
Urban: 67.1% Rural: 32.9%
Cross-sectional 10-14 1528 Low
Peltzer K. and Pengpid, S. 2015 Philippines East Asia
& Pacific Mixed
(National)
Cross-sectional Cohort
10-14 2007: 3190 2011: 2986 Medium
Pengpid, S. and Peltzer, K. 2016
Cambodia, Indonesia, Malaysia, Myanmar, Philippines & Vietnam
East Asia & Pacific
Mixed (National)
Cross-sectional Cohort
10-14 15430 Medium
Rezali, F.W. et al. 2015 Malaysia East Asia & Pacific Urban Cross-
sectional 10-14 242 Low
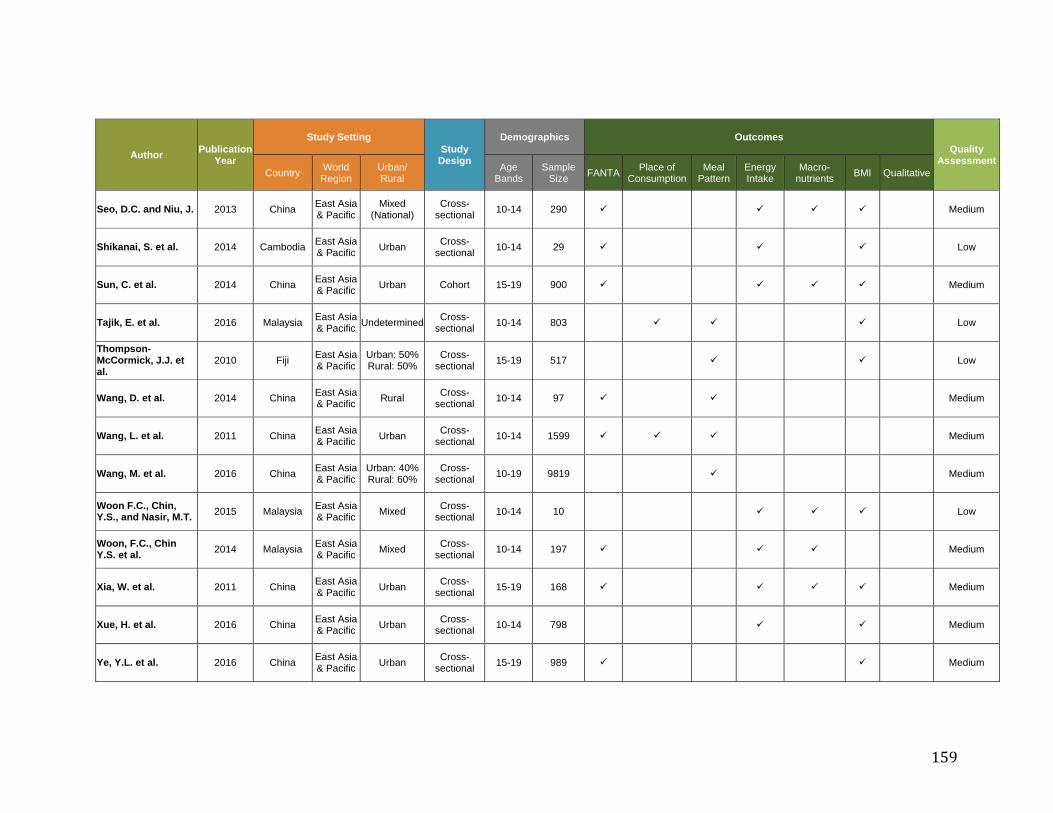
159
Author Publication Year
Study Setting Study
Design
Demographics Outcomes Quality
Assessment Country World
Region Urban/ Rural
Age Bands
Sample Size FANTA Place of
Consumption Meal
Pattern Energy Intake
Macro- nutrients BMI Qualitative
Seo, D.C. and Niu, J. 2013 China East Asia & Pacific
Mixed (National)
Cross-sectional 10-14 290 Medium
Shikanai, S. et al. 2014 Cambodia East Asia & Pacific Urban Cross-
sectional 10-14 29 Low
Sun, C. et al. 2014 China East Asia & Pacific Urban Cohort 15-19 900 Medium
Tajik, E. et al. 2016 Malaysia East Asia & Pacific Undetermined Cross-
sectional 10-14 803 Low
Thompson-McCormick, J.J. et al.
2010 Fiji East Asia & Pacific
Urban: 50% Rural: 50%
Cross-sectional 15-19 517 Low
Wang, D. et al. 2014 China East Asia & Pacific Rural Cross-
sectional 10-14 97 Medium
Wang, L. et al. 2011 China East Asia & Pacific Urban Cross-
sectional 10-14 1599 Medium
Wang, M. et al. 2016 China East Asia & Pacific
Urban: 40% Rural: 60%
Cross-sectional 10-19 9819 Medium
Woon F.C., Chin, Y.S., and Nasir, M.T. 2015 Malaysia East Asia
& Pacific Mixed Cross-sectional 10-14 10 Low
Woon, F.C., Chin Y.S. et al. 2014 Malaysia East Asia
& Pacific Mixed Cross-sectional 10-14 197 Medium
Xia, W. et al. 2011 China East Asia & Pacific Urban Cross-
sectional 15-19 168 Medium
Xue, H. et al. 2016 China East Asia & Pacific Urban Cross-
sectional 10-14 798 Medium
Ye, Y.L. et al. 2016 China East Asia & Pacific Urban Cross-
sectional 15-19 989 Medium

Diet & Eating Practices of Adolescents in LMIC
160
Author Publication Year
Study Setting Study
Design
Demographics Outcomes Quality
Assessment Country World
Region Urban/ Rural
Age Bands
Sample Size FANTA Place of
Consumption Meal
Pattern Energy Intake
Macro- nutrients BMI Qualitative
Zarei, M. et al. 2014 Malaysia East Asia & Pacific Urban Cross-
sectional 10-14 146 Low
Zhang, C.X. et al. 2012 China East Asia & Pacific Urban Cross-
sectional 15-19 1186 Low
Zhang, J. et al. 2016 China East Asia & Pacific
Mixed (National) Cohort 10-14 173 Medium
Zhang, R. et al. 2015 China East Asia & Pacific
Mixed (Regional)
Cross-sectional 10-19 75 Medium
Zhang, Y. et al. 2016 China East Asia & Pacific Urban Cross-
sectional 10-14 462 Low
Zhou, X. et al. 2015 China East Asia & Pacific Urban Cross-
sectional 10-14 635 Medium
Zhu, Y. et al. 2016 China East Asia & Pacific Urban Cross-
sectional 10-14 1125 Medium
Akbulut, G. et al. 2014 Turkey Europe & Central
Asia Urban Cross-
sectional 10-14 446 Low
Ayranci, U. et al. 2010 Turkey Europe & Central
Asia Urban Cross-
sectional 15-19 1121 Low
Borici, S. et al. 2009 Turkey & Albania
Europe & Central
Asia Urban Cross-
sectional 10-14, 15-
19 230 Medium
Djordjevic-Nikic, M. and Dopsaj, M. 2013 Serbia
Europe & Central
Asia Urban Cross-
sectional 15-19 377 Medium
Erenoglu, N. et al. 2013 Turkey Europe & Central
Asia Urban Cross-
sectional 10-14 713 Low
Giannopoulou, D. et al. 2017 Turkey
Europe & Central
Asia Urban Cross-
sectional 10-14 41 Medium
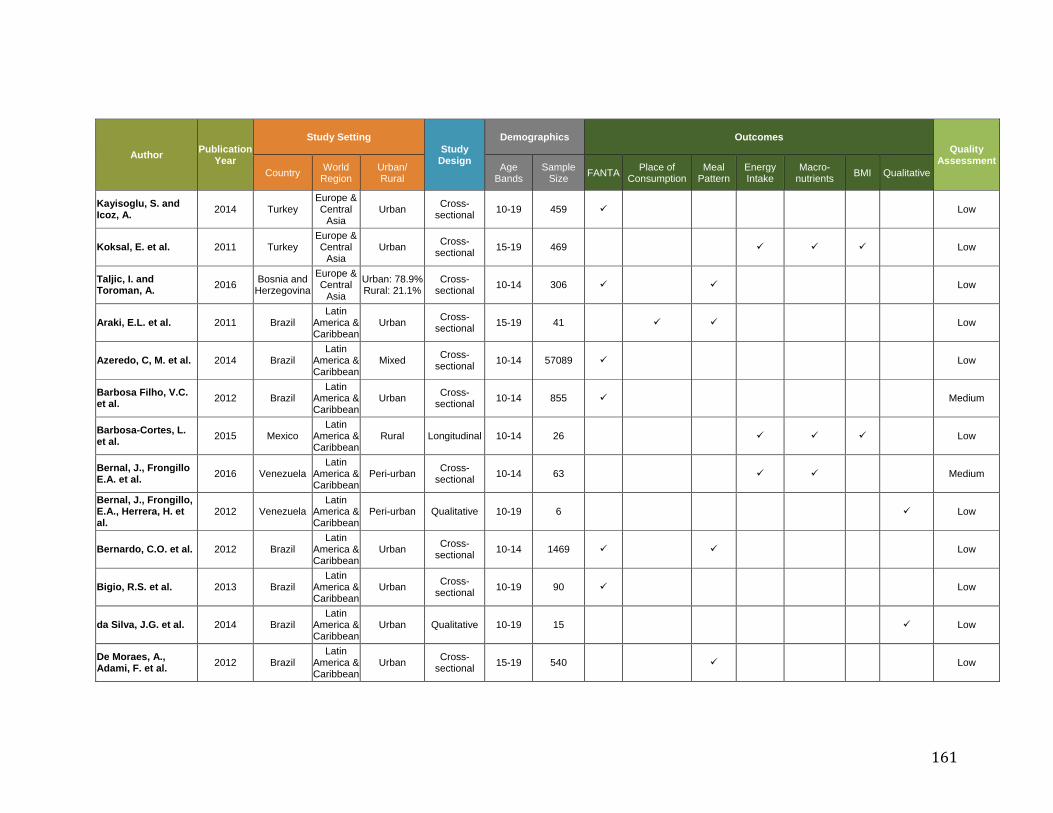
161
Author Publication Year
Study Setting Study
Design
Demographics Outcomes Quality
Assessment Country World
Region Urban/ Rural
Age Bands
Sample Size FANTA Place of
Consumption Meal
Pattern Energy Intake
Macro- nutrients BMI Qualitative
Kayisoglu, S. and Icoz, A. 2014 Turkey
Europe & Central
Asia Urban Cross-
sectional 10-19 459 Low
Koksal, E. et al. 2011 Turkey Europe & Central
Asia Urban Cross-
sectional 15-19 469 Low
Taljic, I. and Toroman, A. 2016 Bosnia and
Herzegovina
Europe & Central
Asia
Urban: 78.9% Rural: 21.1%
Cross-sectional 10-14 306 Low
Araki, E.L. et al. 2011 Brazil Latin
America & Caribbean
Urban Cross-sectional 15-19 41 Low
Azeredo, C, M. et al. 2014 Brazil Latin
America & Caribbean
Mixed Cross-sectional 10-14 57089 Low
Barbosa Filho, V.C. et al. 2012 Brazil
Latin America & Caribbean
Urban Cross-sectional 10-14 855 Medium
Barbosa-Cortes, L. et al. 2015 Mexico
Latin America & Caribbean
Rural Longitudinal 10-14 26 Low
Bernal, J., Frongillo E.A. et al. 2016 Venezuela
Latin America & Caribbean
Peri-urban Cross-sectional 10-14 63 Medium
Bernal, J., Frongillo, E.A., Herrera, H. et al.
2012 Venezuela Latin
America & Caribbean
Peri-urban Qualitative 10-19 6 Low
Bernardo, C.O. et al. 2012 Brazil Latin
America & Caribbean
Urban Cross-sectional 10-14 1469 Low
Bigio, R.S. et al. 2013 Brazil Latin
America & Caribbean
Urban Cross-sectional 10-19 90 Low
da Silva, J.G. et al. 2014 Brazil Latin
America & Caribbean
Urban Qualitative 10-19 15 Low
De Moraes, A., Adami, F. et al. 2012 Brazil
Latin America & Caribbean
Urban Cross-sectional 15-19 540 Low
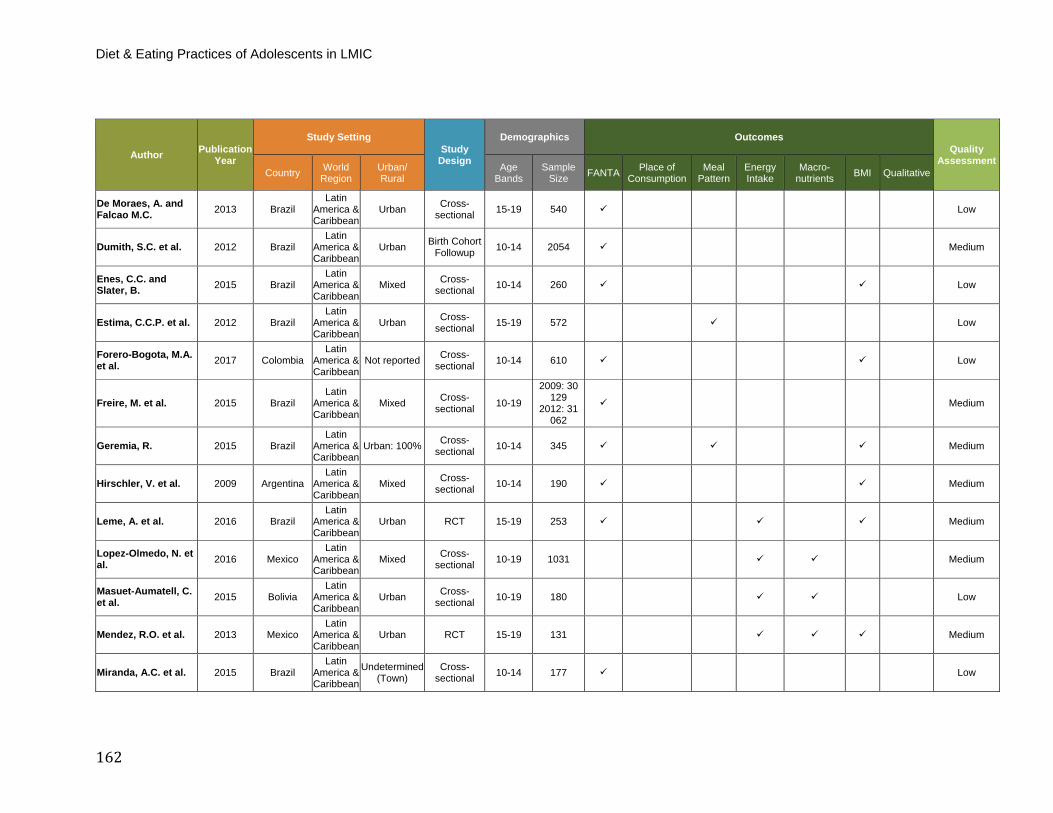
Diet & Eating Practices of Adolescents in LMIC
162
Author Publication Year
Study Setting Study
Design
Demographics Outcomes Quality
Assessment Country World
Region Urban/ Rural
Age Bands
Sample Size FANTA Place of
Consumption Meal
Pattern Energy Intake
Macro- nutrients BMI Qualitative
De Moraes, A. and Falcao M.C. 2013 Brazil
Latin America & Caribbean
Urban Cross-sectional 15-19 540 Low
Dumith, S.C. et al. 2012 Brazil Latin
America & Caribbean
Urban Birth Cohort Followup 10-14 2054 Medium
Enes, C.C. and Slater, B. 2015 Brazil
Latin America & Caribbean
Mixed Cross-sectional 10-14 260 Low
Estima, C.C.P. et al. 2012 Brazil Latin
America & Caribbean
Urban Cross-sectional 15-19 572 Low
Forero-Bogota, M.A. et al. 2017 Colombia
Latin America & Caribbean
Not reported Cross-sectional 10-14 610 Low
Freire, M. et al. 2015 Brazil Latin
America & Caribbean
Mixed Cross-sectional 10-19
2009: 30 129
2012: 31 062
Medium
Geremia, R. 2015 Brazil Latin
America & Caribbean
Urban: 100% Cross-sectional 10-14 345 Medium
Hirschler, V. et al. 2009 Argentina Latin
America & Caribbean
Mixed Cross-sectional 10-14 190 Medium
Leme, A. et al. 2016 Brazil Latin
America & Caribbean
Urban RCT 15-19 253 Medium
Lopez-Olmedo, N. et al. 2016 Mexico
Latin America & Caribbean
Mixed Cross-sectional 10-19 1031 Medium
Masuet-Aumatell, C. et al. 2015 Bolivia
Latin America & Caribbean
Urban Cross-sectional 10-19 180 Low
Mendez, R.O. et al. 2013 Mexico Latin
America & Caribbean
Urban RCT 15-19 131 Medium
Miranda, A.C. et al. 2015 Brazil Latin
America & Caribbean
Undetermined (Town)
Cross-sectional 10-14 177 Low
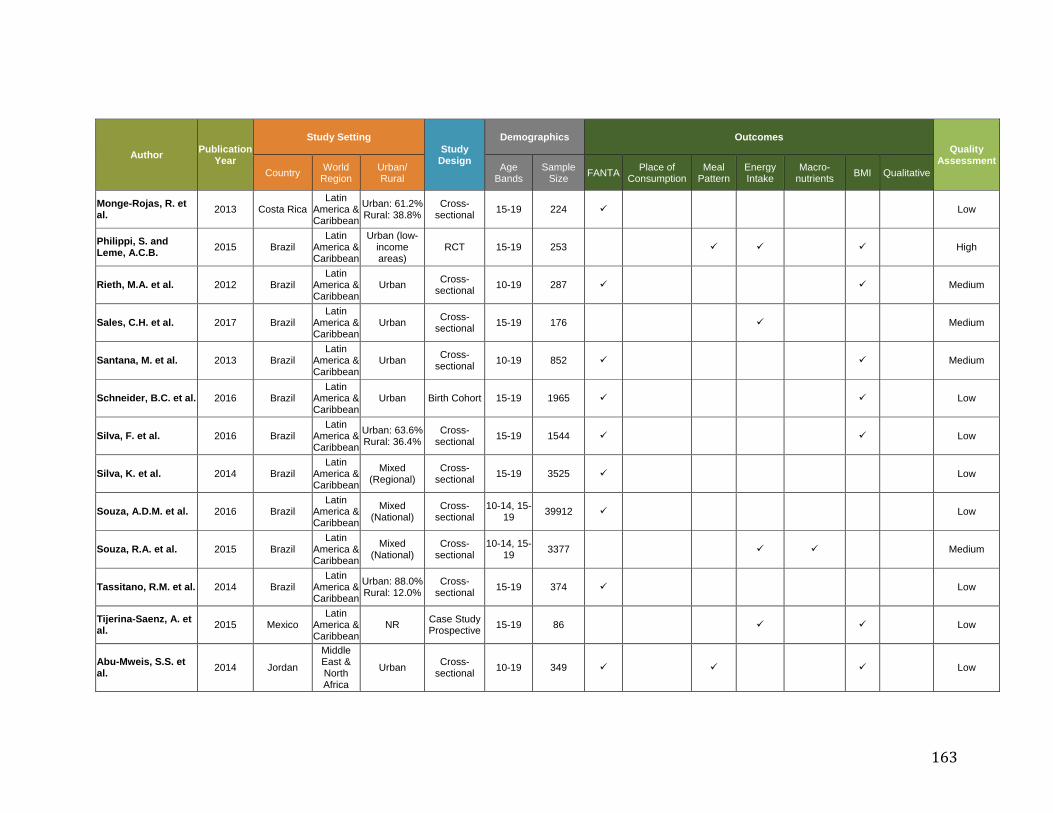
163
Author Publication Year
Study Setting Study
Design
Demographics Outcomes Quality
Assessment Country World
Region Urban/ Rural
Age Bands
Sample Size FANTA Place of
Consumption Meal
Pattern Energy Intake
Macro- nutrients BMI Qualitative
Monge-Rojas, R. et al. 2013 Costa Rica
Latin America & Caribbean
Urban: 61.2% Rural: 38.8%
Cross-sectional 15-19 224 Low
Philippi, S. and Leme, A.C.B. 2015 Brazil
Latin America & Caribbean
Urban (low-income areas)
RCT 15-19 253 High
Rieth, M.A. et al. 2012 Brazil Latin
America & Caribbean
Urban Cross-sectional 10-19 287 Medium
Sales, C.H. et al. 2017 Brazil Latin
America & Caribbean
Urban Cross-sectional 15-19 176 Medium
Santana, M. et al. 2013 Brazil Latin
America & Caribbean
Urban Cross-sectional 10-19 852 Medium
Schneider, B.C. et al. 2016 Brazil Latin
America & Caribbean
Urban Birth Cohort 15-19 1965 Low
Silva, F. et al. 2016 Brazil Latin
America & Caribbean
Urban: 63.6% Rural: 36.4%
Cross-sectional 15-19 1544 Low
Silva, K. et al. 2014 Brazil Latin
America & Caribbean
Mixed (Regional)
Cross-sectional 15-19 3525 Low
Souza, A.D.M. et al. 2016 Brazil Latin
America & Caribbean
Mixed (National)
Cross-sectional
10-14, 15-19 39912 Low
Souza, R.A. et al. 2015 Brazil Latin
America & Caribbean
Mixed (National)
Cross-sectional
10-14, 15-19 3377 Medium
Tassitano, R.M. et al. 2014 Brazil Latin
America & Caribbean
Urban: 88.0% Rural: 12.0%
Cross-sectional 15-19 374 Low
Tijerina-Saenz, A. et al. 2015 Mexico
Latin America & Caribbean
NR Case Study Prospective 15-19 86 Low
Abu-Mweis, S.S. et al. 2014 Jordan
Middle East & North Africa
Urban Cross-sectional 10-19 349 Low
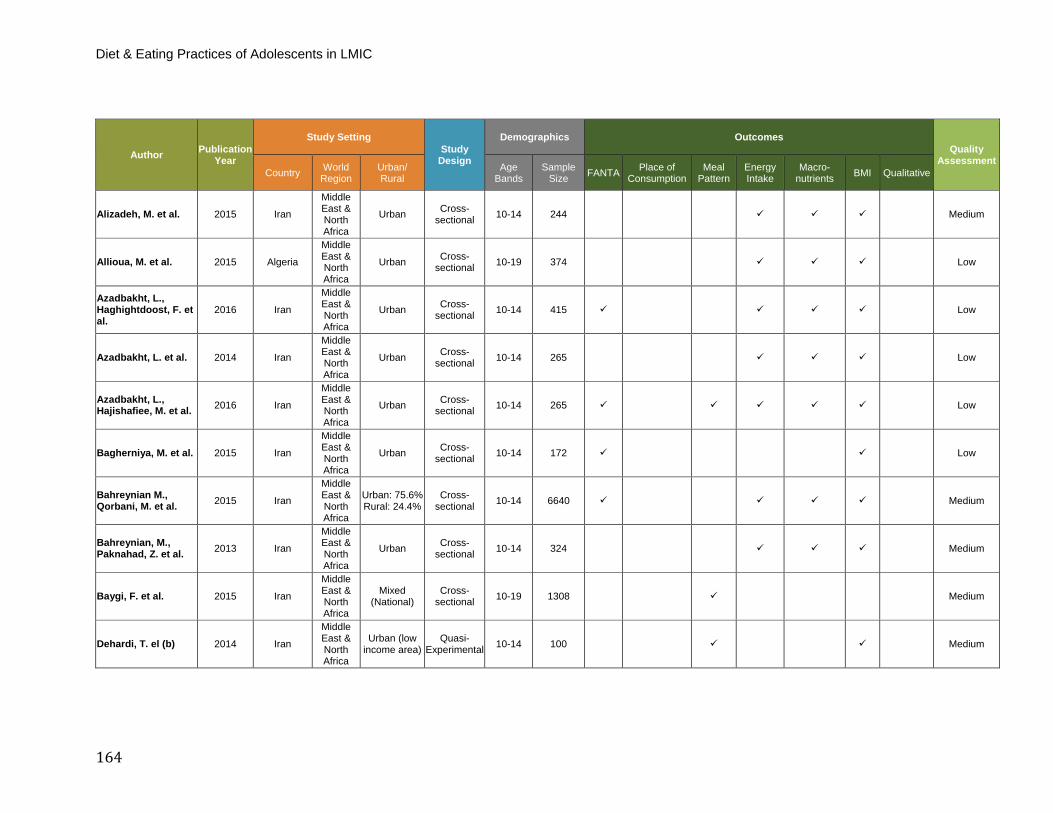
Diet & Eating Practices of Adolescents in LMIC
164
Author Publication Year
Study Setting Study
Design
Demographics Outcomes Quality
Assessment Country World
Region Urban/ Rural
Age Bands
Sample Size FANTA Place of
Consumption Meal
Pattern Energy Intake
Macro- nutrients BMI Qualitative
Alizadeh, M. et al. 2015 Iran
Middle East & North Africa
Urban Cross-sectional 10-14 244 Medium
Allioua, M. et al. 2015 Algeria
Middle East & North Africa
Urban Cross-sectional 10-19 374 Low
Azadbakht, L., Haghightdoost, F. et al.
2016 Iran
Middle East & North Africa
Urban Cross-sectional 10-14 415 Low
Azadbakht, L. et al. 2014 Iran
Middle East & North Africa
Urban Cross-sectional 10-14 265 Low
Azadbakht, L., Hajishafiee, M. et al. 2016 Iran
Middle East & North Africa
Urban Cross-sectional 10-14 265 Low
Bagherniya, M. et al. 2015 Iran
Middle East & North Africa
Urban Cross-sectional 10-14 172 Low
Bahreynian M., Qorbani, M. et al. 2015 Iran
Middle East & North Africa
Urban: 75.6% Rural: 24.4%
Cross-sectional 10-14 6640 Medium
Bahreynian, M., Paknahad, Z. et al. 2013 Iran
Middle East & North Africa
Urban Cross-sectional 10-14 324 Medium
Baygi, F. et al. 2015 Iran
Middle East & North Africa
Mixed (National)
Cross-sectional 10-19 1308 Medium
Dehardi, T. el (b) 2014 Iran
Middle East & North Africa
Urban (low income area)
Quasi-Experimental 10-14 100 Medium

165
Author Publication Year
Study Setting Study
Design
Demographics Outcomes Quality
Assessment Country World
Region Urban/ Rural
Age Bands
Sample Size FANTA Place of
Consumption Meal
Pattern Energy Intake
Macro- nutrients BMI Qualitative
Dehdari, T. et al. (a) 2013 Iran
Middle East & North Africa
Urban Quasi-Experimental 10-14 100 Medium
El-Gilany, A.H. and Elkhawaga, G. 2012 Egypt
Middle East & North Africa
Urban: 56.9% Rural: 43.1%
Cross-sectional 15-19 448 Low
El-Qudah, J.M. 2014 Jordan
Middle East & North Africa
Urban Cross-sectional 10-14 151 Low
Ghrayeb, F. et al. 2014 Palestine
Middle East & North Africa
Rural: 100% Cross-sectional 15-19 357 Low
Haddad, L.G. et al. 2009 Jordan
Middle East & North Africa
Urban Cross-sectional 15-19 261 Low
Hamrani, A. et al. 2014 Moroccan
Middle East & North Africa
Urban Cross-sectional 15- 19 344 Low
Heidari-Beni, M. et al. 2015 Iran
Middle East & North Africa
Urban Cross-sectional 10-14 205 Low
Heydari, S.T. et al. 2013 Iran
Middle East & North Africa
Urban: 100% Cross-sectional 15-19 887 Low
Huew, R. et al. 2011 Libya
Middle East & North Africa
Urban Cross-sectional 10-14 88 Low
Jalambo, M.O. et al. 2013 Gaza
Middle East & North Africa
Undetermined Cross-sectional 15-19 316 Low
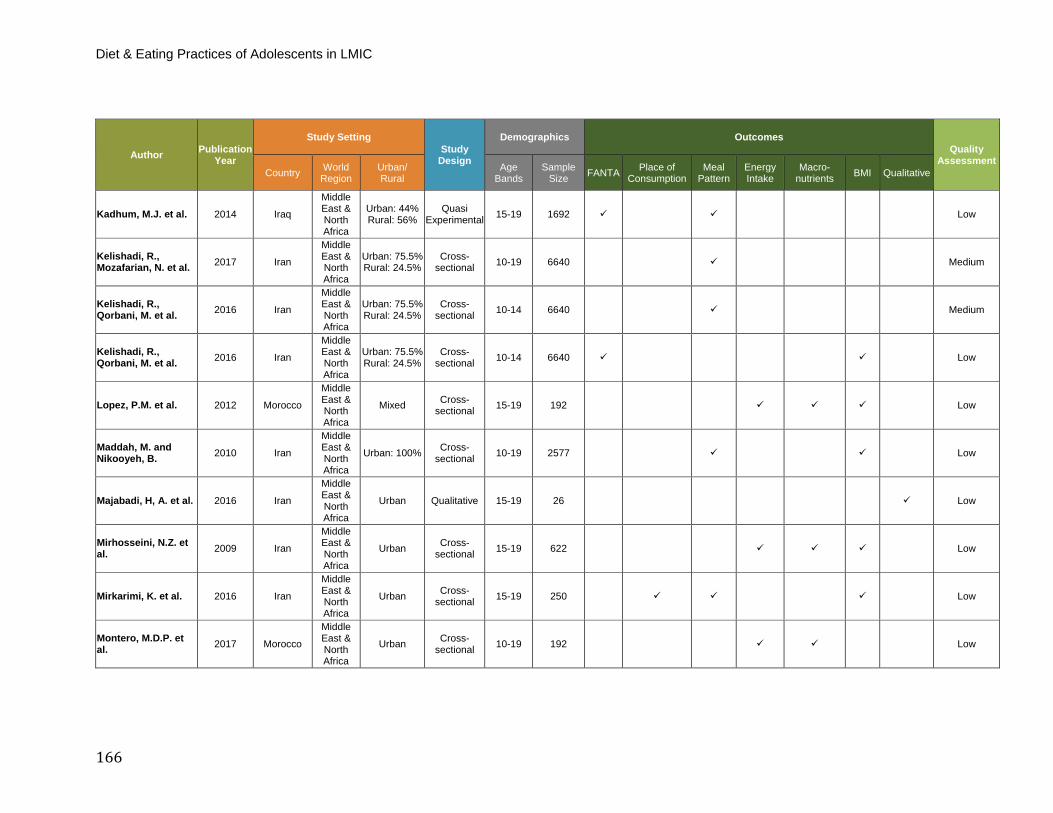
Diet & Eating Practices of Adolescents in LMIC
166
Author Publication Year
Study Setting Study
Design
Demographics Outcomes Quality
Assessment Country World
Region Urban/ Rural
Age Bands
Sample Size FANTA Place of
Consumption Meal
Pattern Energy Intake
Macro- nutrients BMI Qualitative
Kadhum, M.J. et al. 2014 Iraq
Middle East & North Africa
Urban: 44% Rural: 56%
Quasi Experimental 15-19 1692 Low
Kelishadi, R., Mozafarian, N. et al. 2017 Iran
Middle East & North Africa
Urban: 75.5% Rural: 24.5%
Cross-sectional 10-19 6640 Medium
Kelishadi, R., Qorbani, M. et al. 2016 Iran
Middle East & North Africa
Urban: 75.5% Rural: 24.5%
Cross-sectional 10-14 6640 Medium
Kelishadi, R., Qorbani, M. et al. 2016 Iran
Middle East & North Africa
Urban: 75.5% Rural: 24.5%
Cross-sectional 10-14 6640 Low
Lopez, P.M. et al. 2012 Morocco
Middle East & North Africa
Mixed Cross-sectional 15-19 192 Low
Maddah, M. and Nikooyeh, B. 2010 Iran
Middle East & North Africa
Urban: 100% Cross-sectional 10-19 2577 Low
Majabadi, H, A. et al. 2016 Iran
Middle East & North Africa
Urban Qualitative 15-19 26 Low
Mirhosseini, N.Z. et al. 2009 Iran
Middle East & North Africa
Urban Cross-sectional 15-19 622 Low
Mirkarimi, K. et al. 2016 Iran
Middle East & North Africa
Urban Cross-sectional 15-19 250 Low
Montero, M.D.P. et al. 2017 Morocco
Middle East & North Africa
Urban Cross-sectional 10-19 192 Low
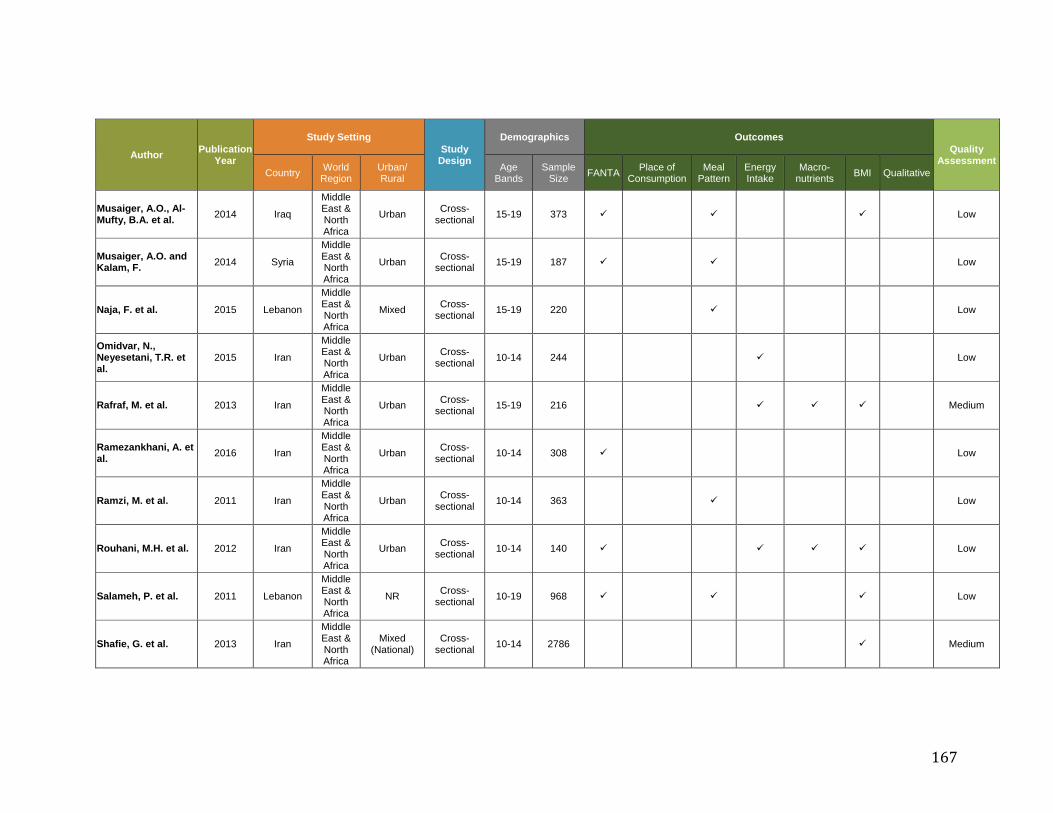
167
Author Publication Year
Study Setting Study
Design
Demographics Outcomes Quality
Assessment Country World
Region Urban/ Rural
Age Bands
Sample Size FANTA Place of
Consumption Meal
Pattern Energy Intake
Macro- nutrients BMI Qualitative
Musaiger, A.O., Al-Mufty, B.A. et al. 2014 Iraq
Middle East & North Africa
Urban Cross-sectional 15-19 373 Low
Musaiger, A.O. and Kalam, F. 2014 Syria
Middle East & North Africa
Urban Cross-sectional 15-19 187 Low
Naja, F. et al. 2015 Lebanon
Middle East & North Africa
Mixed Cross-sectional 15-19 220 Low
Omidvar, N., Neyesetani, T.R. et al.
2015 Iran
Middle East & North Africa
Urban Cross-sectional 10-14 244 Low
Rafraf, M. et al. 2013 Iran
Middle East & North Africa
Urban Cross-sectional 15-19 216 Medium
Ramezankhani, A. et al. 2016 Iran
Middle East & North Africa
Urban Cross-sectional 10-14 308 Low
Ramzi, M. et al. 2011 Iran
Middle East & North Africa
Urban Cross-sectional 10-14 363 Low
Rouhani, M.H. et al. 2012 Iran
Middle East & North Africa
Urban Cross-sectional 10-14 140 Low
Salameh, P. et al. 2011 Lebanon
Middle East & North Africa
NR Cross-sectional 10-19 968 Low
Shafie, G. et al. 2013 Iran
Middle East & North Africa
Mixed (National)
Cross-sectional 10-14 2786 Medium
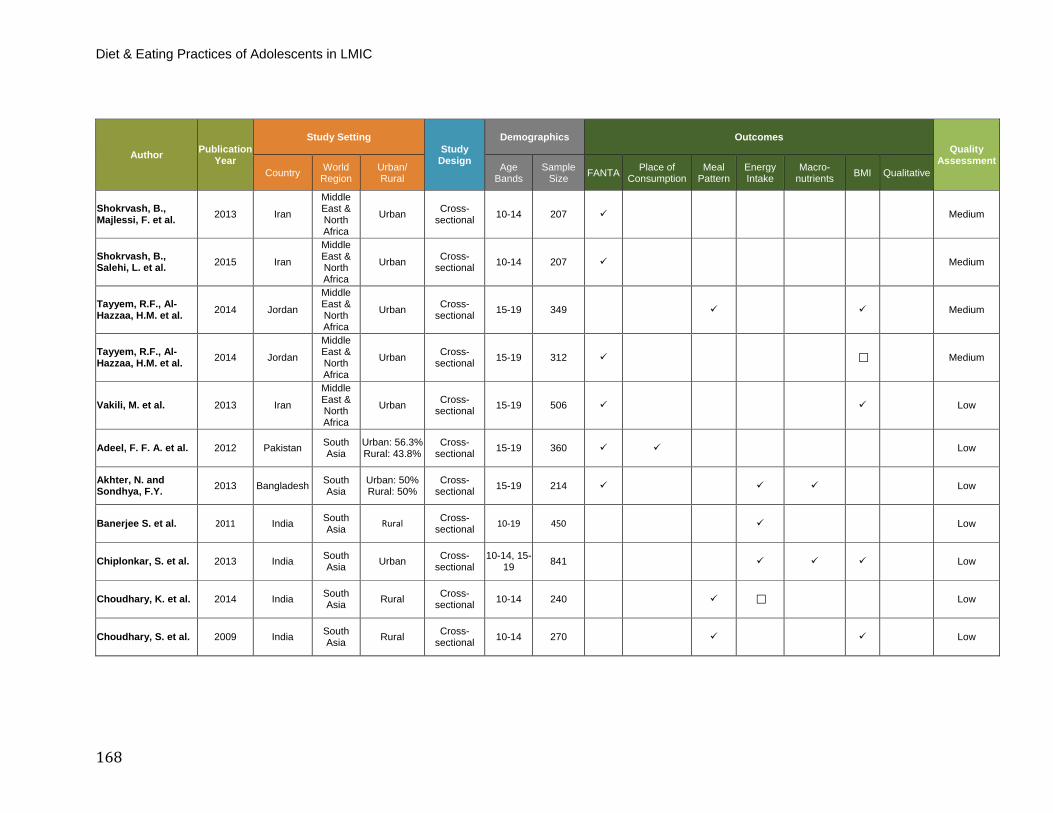
Diet & Eating Practices of Adolescents in LMIC
168
Author Publication Year
Study Setting Study
Design
Demographics Outcomes Quality
Assessment Country World
Region Urban/ Rural
Age Bands
Sample Size FANTA Place of
Consumption Meal
Pattern Energy Intake
Macro- nutrients BMI Qualitative
Shokrvash, B., Majlessi, F. et al. 2013 Iran
Middle East & North Africa
Urban Cross-sectional 10-14 207 Medium
Shokrvash, B., Salehi, L. et al. 2015 Iran
Middle East & North Africa
Urban Cross-sectional 10-14 207 Medium
Tayyem, R.F., Al-Hazzaa, H.M. et al. 2014 Jordan
Middle East & North Africa
Urban Cross-sectional 15-19 349 Medium
Tayyem, R.F., Al-Hazzaa, H.M. et al. 2014 Jordan
Middle East & North Africa
Urban Cross-sectional 15-19 312 Medium
Vakili, M. et al. 2013 Iran
Middle East & North Africa
Urban Cross-sectional 15-19 506 Low
Adeel, F. F. A. et al. 2012 Pakistan South Asia
Urban: 56.3% Rural: 43.8%
Cross-sectional 15-19 360 Low
Akhter, N. and Sondhya, F.Y. 2013 Bangladesh South
Asia Urban: 50% Rural: 50%
Cross-sectional 15-19 214 Low
Banerjee S. et al. 2011 India South Asia Rural Cross-
sectional 10-19 450 Low
Chiplonkar, S. et al. 2013 India South Asia Urban Cross-
sectional 10-14, 15-
19 841 Low
Choudhary, K. et al. 2014 India South Asia Rural Cross-
sectional 10-14 240 Low
Choudhary, S. et al. 2009 India South Asia Rural Cross-
sectional 10-14 270 Low
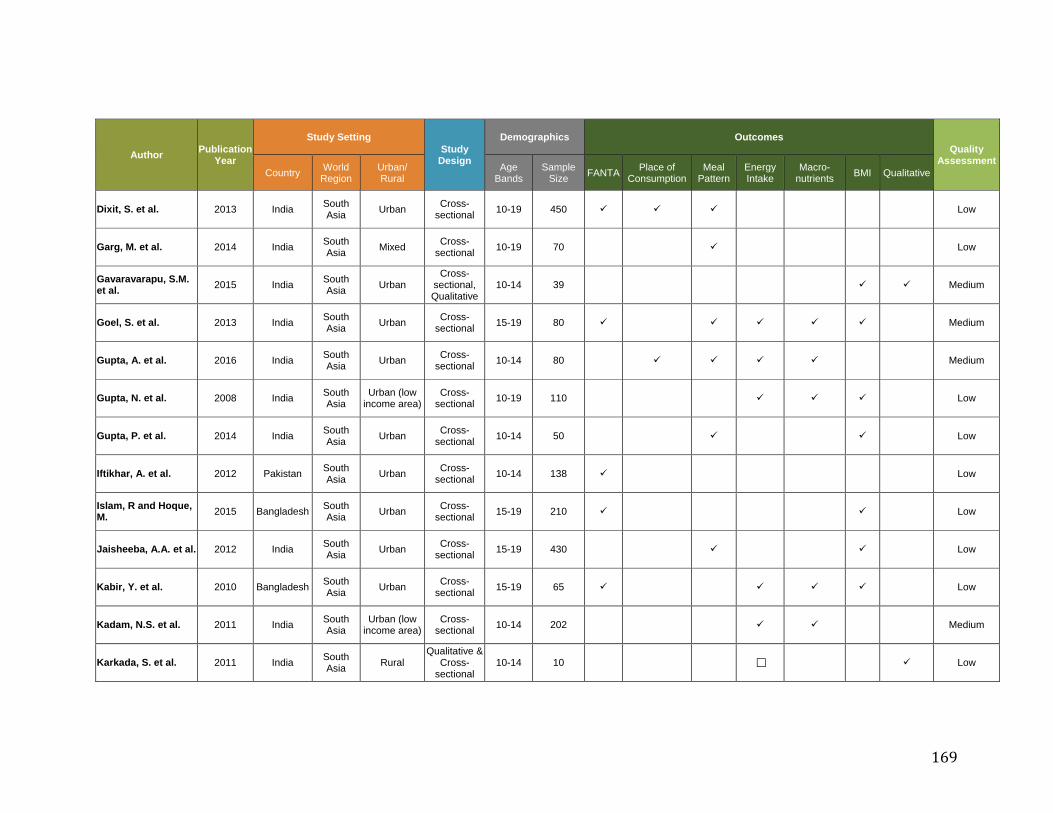
169
Author Publication Year
Study Setting Study
Design
Demographics Outcomes Quality
Assessment Country World
Region Urban/ Rural
Age Bands
Sample Size FANTA Place of
Consumption Meal
Pattern Energy Intake
Macro- nutrients BMI Qualitative
Dixit, S. et al. 2013 India South Asia Urban Cross-
sectional 10-19 450 Low
Garg, M. et al. 2014 India South Asia Mixed Cross-
sectional 10-19 70 Low
Gavaravarapu, S.M. et al. 2015 India South
Asia Urban Cross-
sectional, Qualitative
10-14 39 Medium
Goel, S. et al. 2013 India South Asia Urban Cross-
sectional 15-19 80 Medium
Gupta, A. et al. 2016 India South Asia Urban Cross-
sectional 10-14 80 Medium
Gupta, N. et al. 2008 India South Asia
Urban (low income area)
Cross-sectional 10-19 110 Low
Gupta, P. et al. 2014 India South Asia Urban Cross-
sectional 10-14 50 Low
Iftikhar, A. et al. 2012 Pakistan South Asia Urban Cross-
sectional 10-14 138 Low
Islam, R and Hoque, M. 2015 Bangladesh South
Asia Urban Cross-sectional 15-19 210 Low
Jaisheeba, A.A. et al. 2012 India South Asia Urban Cross-
sectional 15-19 430 Low
Kabir, Y. et al. 2010 Bangladesh South Asia Urban Cross-
sectional 15-19 65 Low
Kadam, N.S. et al. 2011 India South Asia
Urban (low income area)
Cross-sectional 10-14 202 Medium
Karkada, S. et al. 2011 India South Asia Rural
Qualitative & Cross-
sectional 10-14 10 Low
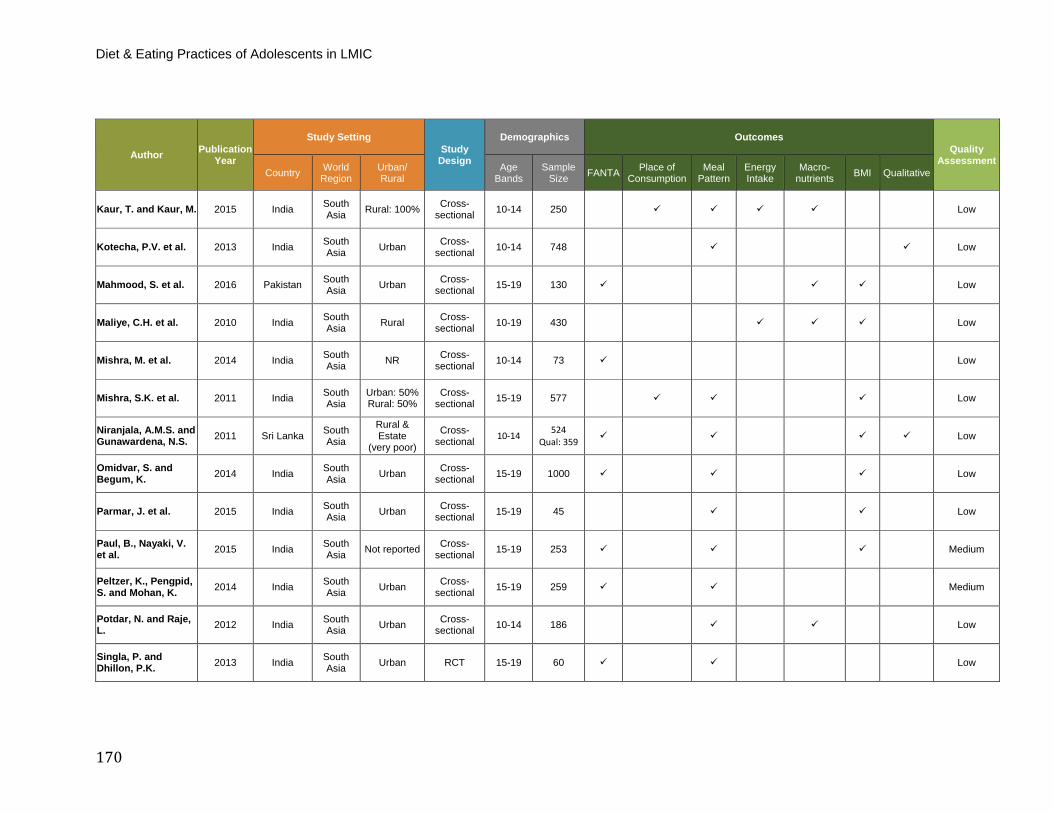
Diet & Eating Practices of Adolescents in LMIC
170
Author Publication Year
Study Setting Study
Design
Demographics Outcomes Quality
Assessment Country World
Region Urban/ Rural
Age Bands
Sample Size FANTA Place of
Consumption Meal
Pattern Energy Intake
Macro- nutrients BMI Qualitative
Kaur, T. and Kaur, M. 2015 India South Asia Rural: 100% Cross-
sectional 10-14 250 Low
Kotecha, P.V. et al. 2013 India South Asia Urban Cross-
sectional 10-14 748 Low
Mahmood, S. et al. 2016 Pakistan South Asia Urban Cross-
sectional 15-19 130 Low
Maliye, C.H. et al. 2010 India South Asia Rural Cross-
sectional 10-19 430 Low
Mishra, M. et al. 2014 India South Asia NR Cross-
sectional 10-14 73 Low
Mishra, S.K. et al. 2011 India South Asia
Urban: 50% Rural: 50%
Cross-sectional 15-19 577 Low
Niranjala, A.M.S. and Gunawardena, N.S. 2011 Sri Lanka South
Asia
Rural & Estate
(very poor)
Cross-sectional 10-14 524
Qual: 359 Low
Omidvar, S. and Begum, K. 2014 India South
Asia Urban Cross-sectional 15-19 1000 Low
Parmar, J. et al. 2015 India South Asia Urban Cross-
sectional 15-19 45 Low
Paul, B., Nayaki, V. et al. 2015 India South
Asia Not reported Cross-sectional 15-19 253 Medium
Peltzer, K., Pengpid, S. and Mohan, K. 2014 India South
Asia Urban Cross-sectional 15-19 259 Medium
Potdar, N. and Raje, L. 2012 India South
Asia Urban Cross-sectional 10-14 186 Low
Singla, P. and Dhillon, P.K. 2013 India South
Asia Urban RCT 15-19 60 Low
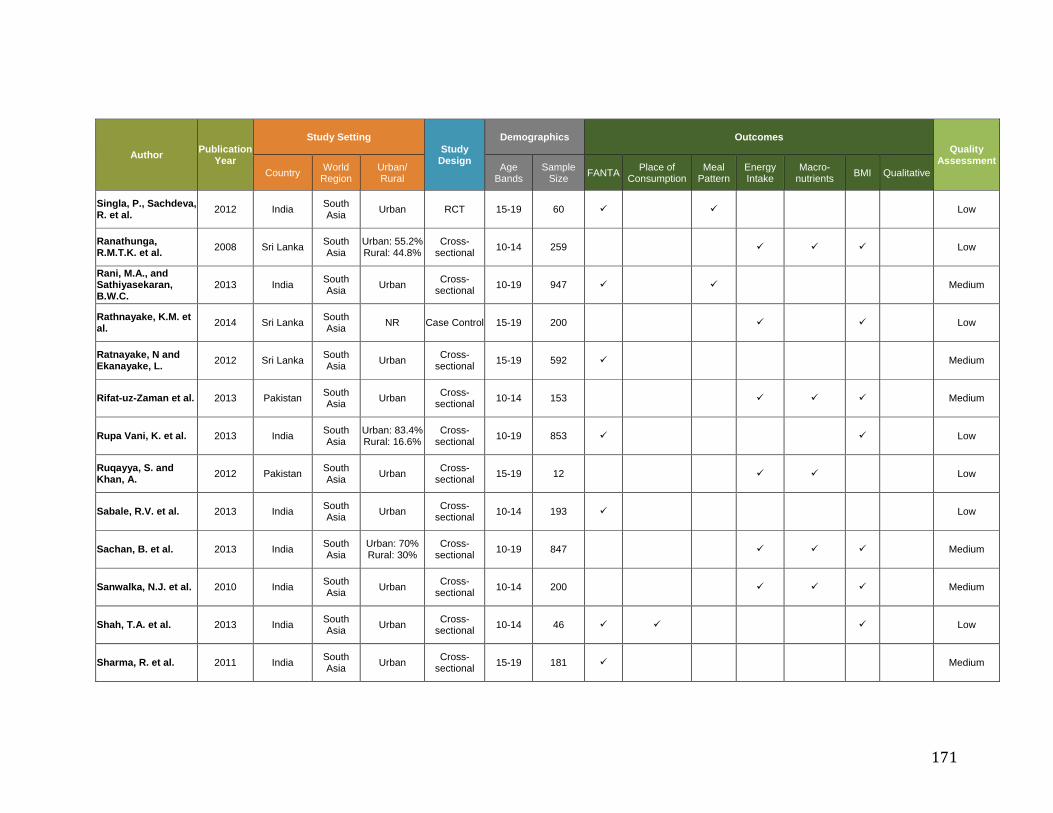
171
Author Publication Year
Study Setting Study
Design
Demographics Outcomes Quality
Assessment Country World
Region Urban/ Rural
Age Bands
Sample Size FANTA Place of
Consumption Meal
Pattern Energy Intake
Macro- nutrients BMI Qualitative
Singla, P., Sachdeva, R. et al. 2012 India South
Asia Urban RCT 15-19 60 Low
Ranathunga, R.M.T.K. et al. 2008 Sri Lanka South
Asia Urban: 55.2% Rural: 44.8%
Cross-sectional 10-14 259 Low
Rani, M.A., and Sathiyasekaran, B.W.C.
2013 India South Asia Urban Cross-
sectional 10-19 947 Medium
Rathnayake, K.M. et al. 2014 Sri Lanka South
Asia NR Case Control 15-19 200 Low
Ratnayake, N and Ekanayake, L. 2012 Sri Lanka South
Asia Urban Cross-sectional 15-19 592 Medium
Rifat-uz-Zaman et al. 2013 Pakistan South Asia Urban Cross-
sectional 10-14 153 Medium
Rupa Vani, K. et al. 2013 India South Asia
Urban: 83.4% Rural: 16.6%
Cross-sectional 10-19 853 Low
Ruqayya, S. and Khan, A. 2012 Pakistan South
Asia Urban Cross-sectional 15-19 12 Low
Sabale, R.V. et al. 2013 India South Asia Urban Cross-
sectional 10-14 193 Low
Sachan, B. et al. 2013 India South Asia
Urban: 70% Rural: 30%
Cross-sectional 10-19 847 Medium
Sanwalka, N.J. et al. 2010 India South Asia Urban Cross-
sectional 10-14 200 Medium
Shah, T.A. et al. 2013 India South Asia Urban Cross-
sectional 10-14 46 Low
Sharma, R. et al. 2011 India South Asia Urban Cross-
sectional 15-19 181 Medium
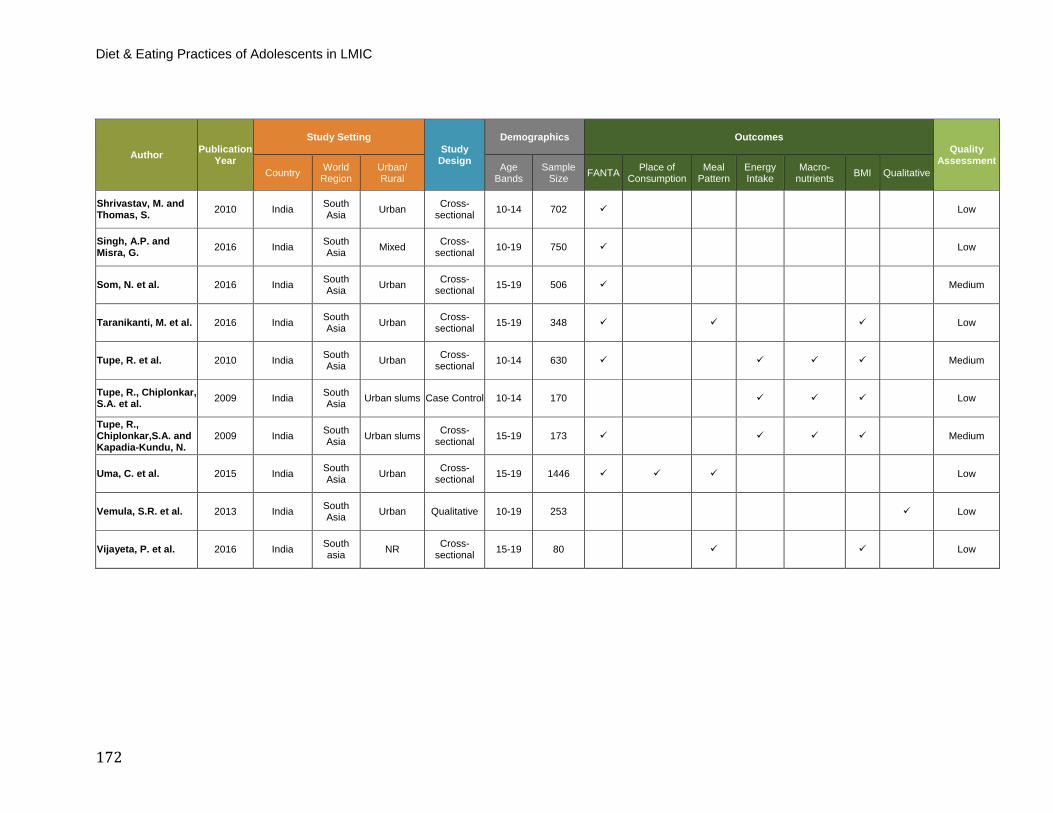
Diet & Eating Practices of Adolescents in LMIC
172
Author Publication Year
Study Setting Study
Design
Demographics Outcomes Quality
Assessment Country World
Region Urban/ Rural
Age Bands
Sample Size FANTA Place of
Consumption Meal
Pattern Energy Intake
Macro- nutrients BMI Qualitative
Shrivastav, M. and Thomas, S. 2010 India South
Asia Urban Cross-sectional 10-14 702 Low
Singh, A.P. and Misra, G. 2016 India South
Asia Mixed Cross-sectional 10-19 750 Low
Som, N. et al. 2016 India South Asia Urban Cross-
sectional 15-19 506 Medium
Taranikanti, M. et al. 2016 India South Asia Urban Cross-
sectional 15-19 348 Low
Tupe, R. et al. 2010 India South Asia Urban Cross-
sectional 10-14 630 Medium
Tupe, R., Chiplonkar, S.A. et al. 2009 India South
Asia Urban slums Case Control 10-14 170 Low
Tupe, R., Chiplonkar,S.A. and Kapadia-Kundu, N.
2009 India South Asia Urban slums Cross-
sectional 15-19 173 Medium
Uma, C. et al. 2015 India South Asia Urban Cross-
sectional 15-19 1446 Low
Vemula, S.R. et al. 2013 India South Asia Urban Qualitative 10-19 253 Low
Vijayeta, P. et al. 2016 India South asia NR Cross-
sectional 15-19 80 Low