
Diesel Gensets F– iring up - motilaloswalgroup.com · MNCs such as Perkins ... In our view,...
40
India Strategy | Get on track please ! Ankur Sharma ([email protected]); +91 22 3982 5449 Amit Shah ([email protected]); +91 22 3029 5126 Thematic | July 2017 Capital Goods Diesel Gensets – Firing up Investors are advised to refer through important disclosures made at the last page of the Research Report. Motilal Oswal research is available on www.motilaloswal.com/Institutional-Equities, Bloomberg, Thomson Reuters, Factset and S&P Capital.
Transcript of Diesel Gensets F– iring up - motilaloswalgroup.com · MNCs such as Perkins ... In our view,...
India Strategy | Get on track please !
Ankur Sharma ([email protected]); +91 22 3982 5449
Amit Shah ([email protected]); +91 22 3029 5126
Thematic | July 2017
Capital Goods
Diesel Gensets – Firing up
Investors are advised to refer through important disclosures made at the last page of the Research Report.Motilal Oswal research is available on www.motilaloswal.com/Institutional-Equities, Bloomberg, Thomson Reuters, Factset and S&P Capital.

18 July 2017 2
Capital Goods | Diesel Gensets
Contents | Capital Goods: Diesel Gensets – Firing up
Summary .............................................................................................................................. 3
On the road to recovery ........................................................................................................ 4
Do lower power deficits imply lower DG demand? ............................................................... 7
So what drives the revival in DG demand over FY18-20? ...................................................... 8
Brand, Distribution, Service, Product range key factors ...................................................... 13
Competitive pressure intensifies ........................................................................................ 19
Diesel Genset industry back on growth track ...................................................................... 23
Key players in the Indian DG set market ............................................................................. 26
What goes into making a DG set? ....................................................................................... 31
Cummins India .................................................................................................................... 32
Financials and Valuations ................................................................................................... 36
Kirloskar Oil Engines ........................................................................................................... 38
18 July 2017 3
Capital Goods | Diesel Gensets
Capital Goods Diesel Gensets
+91 22 6129 1556 Ankur Sharma
Please click here for Video Link
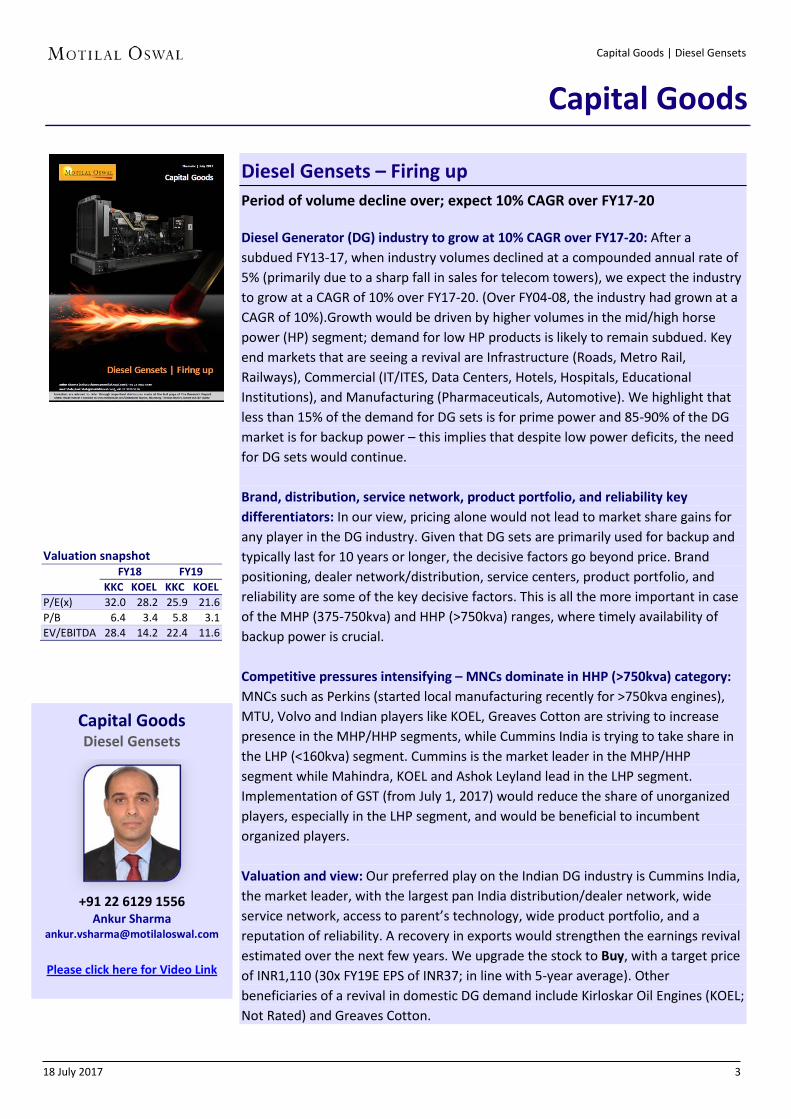
Diesel Gensets – Firing up Period of volume decline over; expect 10% CAGR over FY17-20
Diesel Generator (DG) industry to grow at 10% CAGR over FY17-20: After a subdued FY13-17, when industry volumes declined at a compounded annual rate of 5% (primarily due to a sharp fall in sales for telecom towers), we expect the industry to grow at a CAGR of 10% over FY17-20. (Over FY04-08, the industry had grown at a CAGR of 10%).Growth would be driven by higher volumes in the mid/high horse power (HP) segment; demand for low HP products is likely to remain subdued. Key end markets that are seeing a revival are Infrastructure (Roads, Metro Rail, Railways), Commercial (IT/ITES, Data Centers, Hotels, Hospitals, Educational Institutions), and Manufacturing (Pharmaceuticals, Automotive). We highlight that less than 15% of the demand for DG sets is for prime power and 85-90% of the DG market is for backup power – this implies that despite low power deficits, the need for DG sets would continue. Brand, distribution, service network, product portfolio, and reliability key differentiators: In our view, pricing alone would not lead to market share gains for any player in the DG industry. Given that DG sets are primarily used for backup and typically last for 10 years or longer, the decisive factors go beyond price. Brand positioning, dealer network/distribution, service centers, product portfolio, and reliability are some of the key decisive factors. This is all the more important in case of the MHP (375-750kva) and HHP (>750kva) ranges, where timely availability of backup power is crucial. Competitive pressures intensifying – MNCs dominate in HHP (>750kva) category: MNCs such as Perkins (started local manufacturing recently for >750kva engines), MTU, Volvo and Indian players like KOEL, Greaves Cotton are striving to increase presence in the MHP/HHP segments, while Cummins India is trying to take share in the LHP (<160kva) segment. Cummins is the market leader in the MHP/HHP segment while Mahindra, KOEL and Ashok Leyland lead in the LHP segment. Implementation of GST (from July 1, 2017) would reduce the share of unorganized players, especially in the LHP segment, and would be beneficial to incumbent organized players. Valuation and view: Our preferred play on the Indian DG industry is Cummins India, the market leader, with the largest pan India distribution/dealer network, wide service network, access to parent’s technology, wide product portfolio, and a reputation of reliability. A recovery in exports would strengthen the earnings revival estimated over the next few years. We upgrade the stock to Buy, with a target price of INR1,110 (30x FY19E EPS of INR37; in line with 5-year average). Other beneficiaries of a revival in domestic DG demand include Kirloskar Oil Engines (KOEL; Not Rated) and Greaves Cotton.
Capital Goods
Valuation snapshot
FY18 FY19
KKC KOEL KKC KOEL P/E(x) 32.0 28.2 25.9 21.6 P/B 6.4 3.4 5.8 3.1 EV/EBITDA 28.4 14.2 22.4 11.6

18 July 2017 4
Capital Goods | Diesel Gensets
On the road to recovery Key end markets witnessing a recovery
For the last five years, DG industry volumes have been subdued. During FY13-17,volumes declined at 5% CAGR, driven by (a) lower power deficits, as demand forpower declined with macroeconomic slowdown, (b) weak demand from key endmarkets – Industrial/Manufacturing, Real Estate and Infrastructure, and (c)collapse in demand from telecom towers from a peak of 100,000 DG sets inFY11 to 30,000 units in FY17.
Exhibit 1: DG industry volumes and growth (%)
Source: MOSL, Industry
Exhibit 2: DG industry sales and growth (%)
Source: MOSL, Industry
One of the key reasons for the decline in DG industry volumes has been thesharp fall in demand from the Telecom sector. From a peak of 100,000 DG setsin FY11, demand from the telecom sector declined to 30,000 in FY17. Mahindra,which has 60% share in telecom industry DG sets, was the worst affected. 15-75kva DG sets are primarily used in telecom towers and constitute 55-60% ofTelecom sector demand. The share of 15-75kva DG sets, which was 78% ofoverall DG set sales in FY10, fell to 56% in FY17.
115
,000
132
,250
148
,120
156
,110
161
,500
153
,305
153
,830
168
,243
149
,800
168
,697
124
,544
101
,378
99,
968
110
,321
121
,215
132
,738
10% 15% 12% 5% 3%-5% 0%
9%
-11%
13%
-26%-19%
-1%10% 10% 10%
FY04
FY05
FY06
FY07
FY08
FY09
FY10
FY11
FY12
FY13
FY14
FY15
FY16
FY17
FY18
FY19
Diesel Genset volumes YoY growth(%)
60,484 70,920 64,345 78,260
60,438
56,882 56,364 63,679 71,600 80,433 90,578
5%
17%
-9%
22%
-23%
-6%-1%
13% 12% 12% 13%
FY10
FY11
FY12
FY13
FY14
FY15
FY16
FY17
FY18
FY19
FY20
DG Industry sales (INRm) YoY (%)

18 July 2017 5
Capital Goods | Diesel Gensets
Exhibit 3: Industry DG volumes – fall during FY13-17 driven by weak demand from telecom towers
Source: MOSL, Industry
Exhibit 4: Weak telecom towers sales lead to decline in industry DG sales
Source: MOSL, Industry
Exhibit 5: Key end markets for 15-75kva DG sets – Telecom accounts for 55-60% of sales
Source: MOSL, Industry
Exhibit 6: Key end markets for 75-375kva DG sets
Source: MOSL, Industry
Exhibit 7: Key end markets for 375-750kva DG sets – Manufacturing, Hotels and Hospitality at ~80% of sales
Source: MOSL, Industry
Exhibit 8: Key end markets for >750kva DG sets – 50% of Cummins India’s sales from this segment
Source: MOSL, Industry
- 20,000 40,000 60,000 80,000
100,000 120,000 140,000 160,000 180,000
FY08
FY09
FY10
FY11
FY12
FY13
FY14
FY15
FY16
FY17
FY18
FY19
FY20
15-75kva 75-375kva 375-750kva 750kva and above
-5%
0%
5%
10%
15%
20%
-30%
-20%
-10%
0%
10%
20%
FY11
FY12
FY13
FY14
FY15
FY16
FY17
DG Industry sales growth(%) LHS Telecom tower growth(%) RHS
55.9%
10.4%
9.8%
5.8% 4.7%
4.5% 8.9%
Telecom
Hospitality
Commercial complex
Small Restaurants
Small scale Industries
Petrol Station
Others
25.0%
24.3% 20.9%
19.6%
3.5% 6.7% Real Estate
Large Industries
Healthcare
Hospitality
Infrastructure
Others
31.2%
30.2%
18.7%
15.9% 4.0% Large Industries
Hospitality
Healthcare
IT/ITES
Others
56.1% 33.9%
0.8% 9.2% IT/ITES
Large Industries
Real Estate
Others
18 July 2017 6
Capital Goods | Diesel Gensets
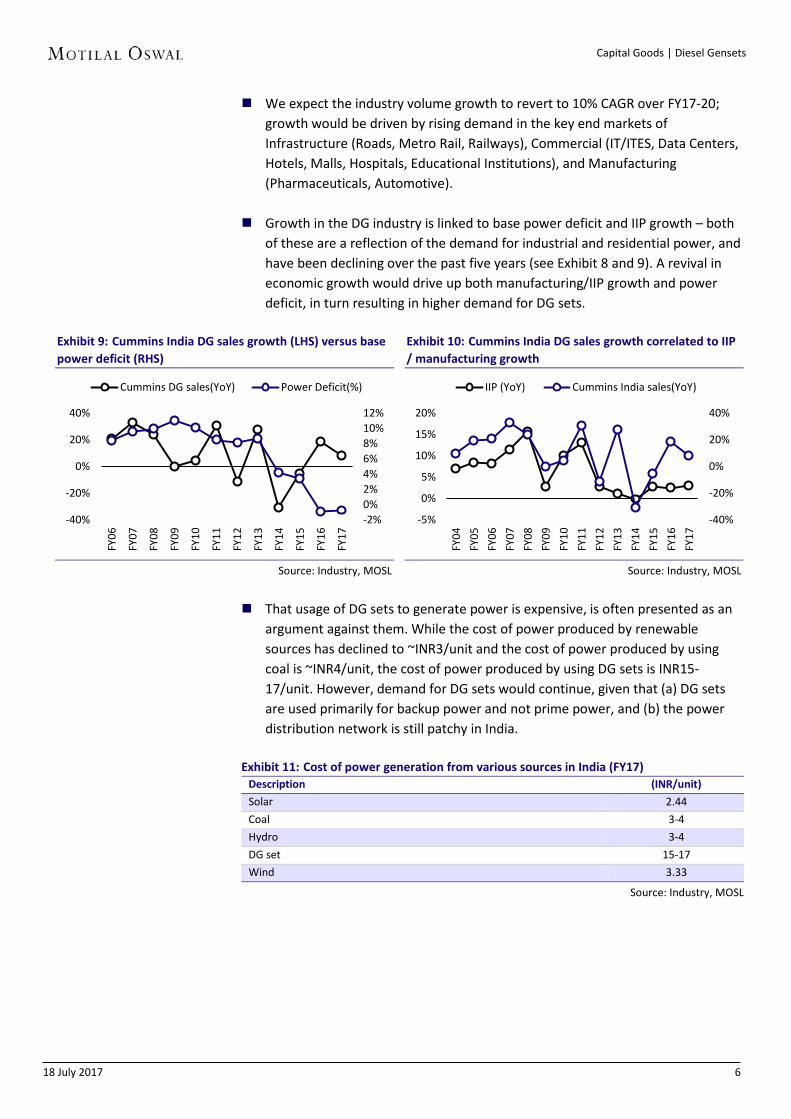
We expect the industry volume growth to revert to 10% CAGR over FY17-20;growth would be driven by rising demand in the key end markets ofInfrastructure (Roads, Metro Rail, Railways), Commercial (IT/ITES, Data Centers,Hotels, Malls, Hospitals, Educational Institutions), and Manufacturing(Pharmaceuticals, Automotive).
Growth in the DG industry is linked to base power deficit and IIP growth – bothof these are a reflection of the demand for industrial and residential power, andhave been declining over the past five years (see Exhibit 8 and 9). A revival ineconomic growth would drive up both manufacturing/IIP growth and powerdeficit, in turn resulting in higher demand for DG sets.
Exhibit 9: Cummins India DG sales growth (LHS) versus base power deficit (RHS)
Source: Industry, MOSL
Exhibit 10: Cummins India DG sales growth correlated to IIP / manufacturing growth
Source: Industry, MOSL
That usage of DG sets to generate power is expensive, is often presented as anargument against them. While the cost of power produced by renewablesources has declined to ~INR3/unit and the cost of power produced by usingcoal is ~INR4/unit, the cost of power produced by using DG sets is INR15-17/unit. However, demand for DG sets would continue, given that (a) DG setsare used primarily for backup power and not prime power, and (b) the powerdistribution network is still patchy in India.
Exhibit 11: Cost of power generation from various sources in India (FY17) Description (INR/unit)
Solar 2.44 Coal 3-4Hydro 3-4DG set 15-17Wind 3.33
Source: Industry, MOSL
-2%0%2%4%6%8%10%12%
-40%
-20%
0%
20%
40%
FY06
FY07
FY08
FY09
FY10
FY11
FY12
FY13
FY14
FY15
FY16
FY17
Cummins DG sales(YoY) Power Deficit(%)
-40%
-20%
0%
20%
40%
-5%
0%
5%
10%
15%
20%
FY04
FY05
FY06
FY07
FY08
FY09
FY10
FY11
FY12
FY13
FY14
FY15
FY16
FY17
IIP (YoY) Cummins India sales(YoY)

18 July 2017 7
Capital Goods | Diesel Gensets
Do lower power deficits imply lower DG demand? Industrial production and capacity building key drivers, in our view
One of the key push backs we have always received from investors is that with afall in power deficits, there would also be a fall in the requirement of dieselgensets.
In our view, genset demand is driven by higher capacity building/capex in theeconomy which in turn triggers a demand for backup power. As in developedeconomies, India too is witnessing a shift of genset demand to back up powerthan standby - ~85-90% of genset usage is currently for back- up power.
To illustrate our point, we cite the example of the diesel genset markets in USand China (the largest markets for gensets globally). As seen in the chart below,despite a power surplus situation in both the countries, genset demandcontinue to grow and has a high correlation to IIP – higher industrial capexideally should lead to higher demand for backup power.
Exhibit 12: Low correlation between US power deficits and Cummins US power generation sales
Source: MOSL, Industry
Exhibit 13: High correlation between IIP growth and Cummins Power Generation sales in the US
Source: MOSL, Industry
Exhibit 14: No significant correlation between China power deficits and Cummins China power generation sales
Source: MOSL, Industry
Exhibit 15: China IIP growth and Cummins Power Generation sales in China are highly correlated
Source: MOSL, Industry
While reported power deficits in India may have come down, the reliability ofpower is still a concern – in turn, gensets are installed as an ‘insurance’ againstpower cuts.
-6.0%
-5.5%
-5.0%
-4.5%
-4.0%
-40%
-20%
0%
20%
40%
2009
2010
2011
2012
2013
2014
2015
2016
Cummins US sales(YoY) Power deficit(%)
-15%
-10%
-5%
0%
5%
10%
-40%
-20%
0%
20%
40%
2009
2010
2011
2012
2013
2014
2015
2016
Cummins US sales growth(%) US IIP growth(%)
-1.6%
-1.2%
-0.8%
-0.4%
0.0%
-50%
-25%
0%
25%
50%
75%
2010
2011
2012
2013
2014
2015
2016
Cummins China sales(YoY) Power deficit(%)
-6.0%
-4.0%
-2.0%
0.0%
2.0%
4.0%
6.0%
-40%
-20%
0%
20%
40%
60%
80%
2010
2011
2012
2013
2014
2015
2016
Cummins China sales(YoY) China IIP growth(%)
18 July 2017 8
Capital Goods | Diesel Gensets
So what drives the revival in DG demand over FY18-20?
We believe there are multiple drivers for a pick-up in demand for DG sets, goingforward. With >85% of DG sets being used for backup power, low power deficitsdo not directly translate into lower demand for DG sets. In our view, the biggerdemand driver for DG sets is industrial, infrastructure and real estate capex. Arevival in these three end markets is critical for a recovery in DG demand.
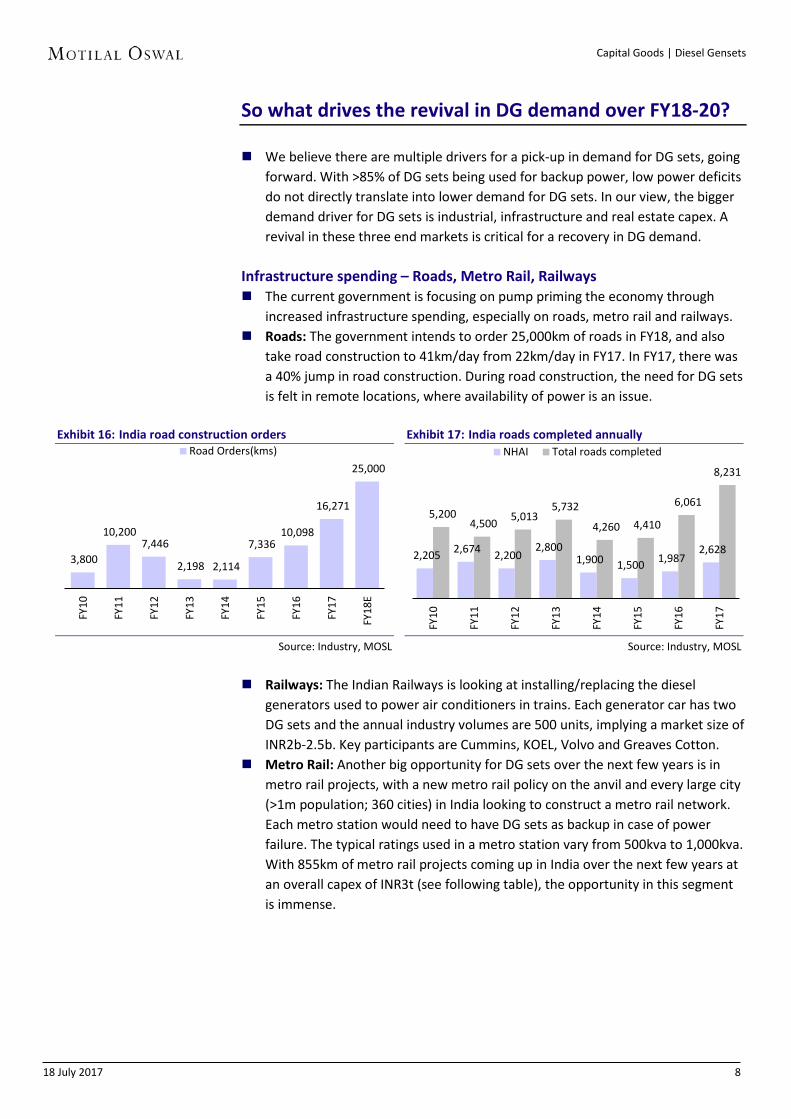
Infrastructure spending – Roads, Metro Rail, Railways The current government is focusing on pump priming the economy through
increased infrastructure spending, especially on roads, metro rail and railways. Roads: The government intends to order 25,000km of roads in FY18, and also
take road construction to 41km/day from 22km/day in FY17. In FY17, there wasa 40% jump in road construction. During road construction, the need for DG setsis felt in remote locations, where availability of power is an issue.
Exhibit 16: India road construction orders
Source: Industry, MOSL
Exhibit 17: India roads completed annually
Source: Industry, MOSL
Railways: The Indian Railways is looking at installing/replacing the dieselgenerators used to power air conditioners in trains. Each generator car has twoDG sets and the annual industry volumes are 500 units, implying a market size ofINR2b-2.5b. Key participants are Cummins, KOEL, Volvo and Greaves Cotton.
Metro Rail: Another big opportunity for DG sets over the next few years is inmetro rail projects, with a new metro rail policy on the anvil and every large city(>1m population; 360 cities) in India looking to construct a metro rail network.Each metro station would need to have DG sets as backup in case of powerfailure. The typical ratings used in a metro station vary from 500kva to 1,000kva.With 855km of metro rail projects coming up in India over the next few years atan overall capex of INR3t (see following table), the opportunity in this segmentis immense.
3,800
10,200 7,446
2,198 2,114
7,336 10,098
16,271
25,000
FY10
FY11
FY12
FY13
FY14
FY15
FY16
FY17
FY18
E
Road Orders(kms)
2,205 2,674 2,200 2,800
1,900 1,500 1,987 2,628
5,200 4,500 5,013
5,732
4,260 4,410
6,061
8,231
FY10
FY11
FY12
FY13
FY14
FY15
FY16
FY17
NHAI Total roads completed

18 July 2017 9
Capital Goods | Diesel Gensets
Exhibit 18: Upcoming and planned metro rail projects in India Planned Metro projects Phase Planned length Cost
(km) (INR b)
Chennai Metro Phase II 63.0 360.0 Bengaluru Metro Phase II 72.1 264.0 Jaipur Metro Phase II 23.1 65.8 Pune Metro Phase I 31.5 101.8 Kochi Metro Phase II - 15.0 Ludhiana Metro - 28.8 103.0 Chandigarh Metro - 37.6 109.0 Lucknow Metro - 22.9 70.0 Nagpur Metro - 42.0 80.0 Bhopal Metro - 28.0 60.0 Indore Metro - 32.2 75.0 Ahmedadabad Metro (East –West) 37.7 107 Delhi Phase IV 104.0 550.0 Vishakapatnam Metro 43.0 130.0 Vijaywada Metro 26.0 68.0 Thiruvantapuram Metro 42.0 36.0 Mumbai Metro Dahisar-DN Nagar Phase IIA 18.5 64.0 Mumbai Metro DN Nagar-BKC-Mankurd Phase IIB 23.5 100.0 Mumbai Metro Colaba –BKC – SEEPZ Phase III 33.5 244.0 Mumbai Metro Wadala-Ghatpkopar-Thane-Kasarvadali Phase IV 32.0 120.0 Mumbai Metro Thane – Bhiwandi – Kalyan(17 stations) Phase V 24.0 84.1 Mumbai Metro Jogeshwari-Vikhroli Link Road (13 stationss) Phase VI 14.5 66.7 Mumbai Metro Andheri€ to Dahisar € – Elevated Phase VII 16.5 62.1 Total 854. 3,031.3
Source: Industry, MOSL
Real Estate – commercial segment recovering Residential Real Estate The residential market of the top eight cities in India started off on a positive
note in CY16. Sales volume grew 7% YoY in 1HCY16; over 135,000 units weresold in 1HCY16 as compared to 126,620 units in 1HCY15. However, followingdemonetization in November 2017, transactions came to a complete standstill.Developers refrained from announcing any new launches and buyers turnedextremely cautious.
Sales volume dropped 44% YoY in 4QCY16. New launches declined 61% YoYduring the same period. At 40,940 units, 4QCY16 sales volume was the lowest ina quarter since CY10. The average quarterly sales used to be in excess of 90,000units in CY10. The new launches number was much worse in 4QCY16 at just24,300 units, not even one-fifth of the peak quarterly level observed in CY10.
All cities witnessed a crash in 4QCY16, including the usually resilient Bengaluru.As a result, CY16 replaced CY15 as the worst performing year in terms of salesvolume in recent history. Sales volume in the top eight cities dropped 9% from267,960 units in CY15 to 244,680 units in CY16.
Strict implementation of the Real Estate (Regulation and Development) Act,2016 within the stipulated timeframe could be a major factor in bringing backthe confidence of homebuyers. Timely implementation of this Act across thecountry would not only make the sector more transparent but would also helpattract institutional participation.
During January-March 2017 (1QCY17), residential project launches fell 8% YoY,with the fall most severe decline being in the NCR. New launches are expectedto remain muted over the next 2-3 quarters, as developers make changes totheir business structure to align with the RERA norms.
18 July 2017 10
Capital Goods | Diesel Gensets
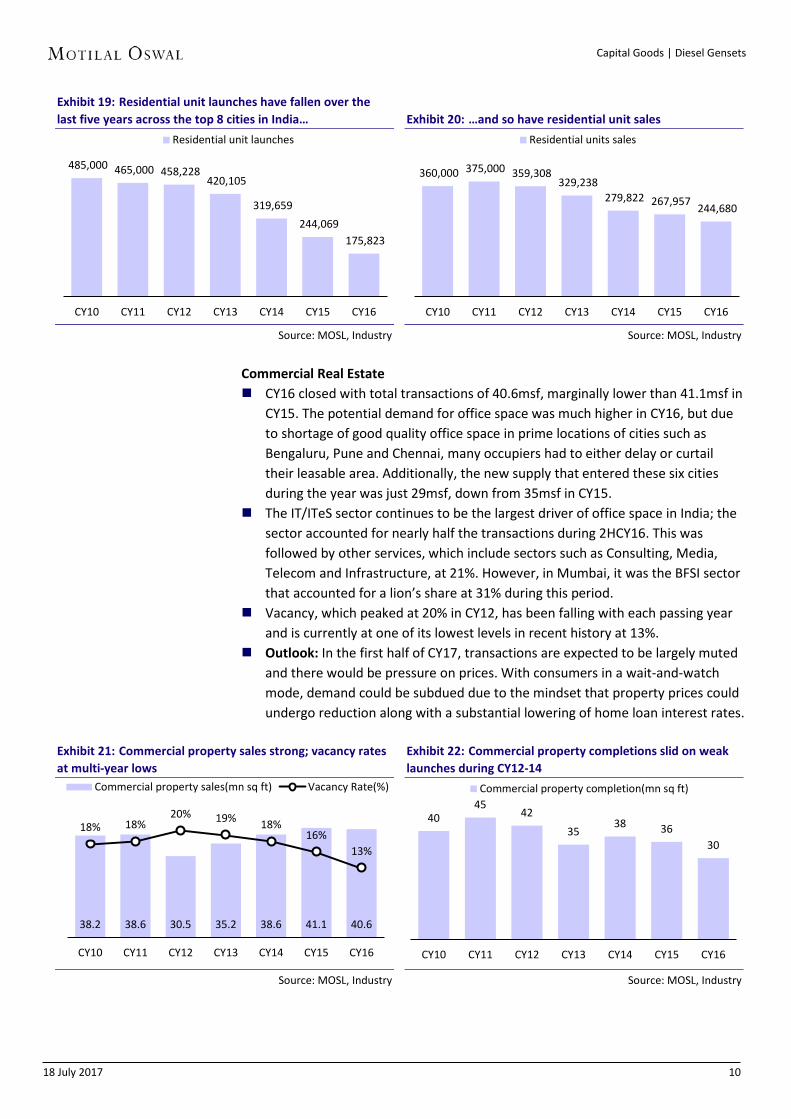
Exhibit 19: Residential unit launches have fallen over the last five years across the top 8 cities in India…
Source: MOSL, Industry
Exhibit 20: …and so have residential unit sales
Source: MOSL, Industry
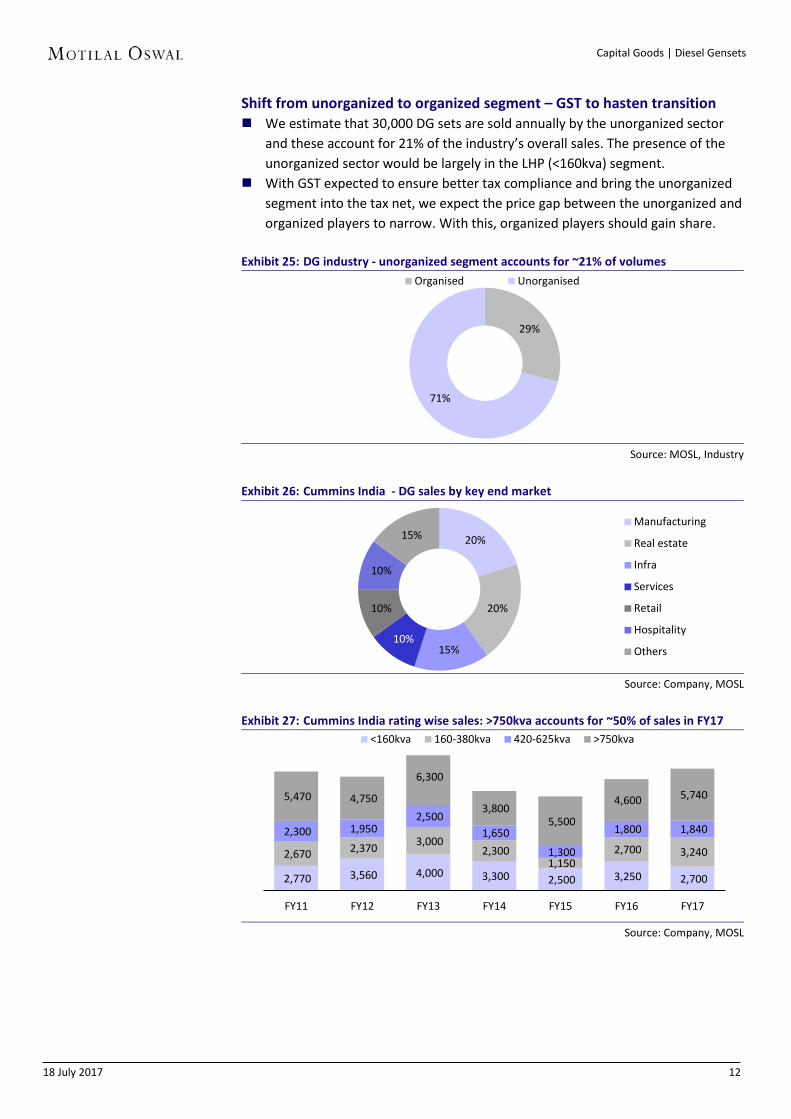
Commercial Real Estate CY16 closed with total transactions of 40.6msf, marginally lower than 41.1msf in
CY15. The potential demand for office space was much higher in CY16, but dueto shortage of good quality office space in prime locations of cities such asBengaluru, Pune and Chennai, many occupiers had to either delay or curtailtheir leasable area. Additionally, the new supply that entered these six citiesduring the year was just 29msf, down from 35msf in CY15.
The IT/ITeS sector continues to be the largest driver of office space in India; thesector accounted for nearly half the transactions during 2HCY16. This wasfollowed by other services, which include sectors such as Consulting, Media,Telecom and Infrastructure, at 21%. However, in Mumbai, it was the BFSI sectorthat accounted for a lion’s share at 31% during this period.
Vacancy, which peaked at 20% in CY12, has been falling with each passing yearand is currently at one of its lowest levels in recent history at 13%.
Outlook: In the first half of CY17, transactions are expected to be largely mutedand there would be pressure on prices. With consumers in a wait-and-watchmode, demand could be subdued due to the mindset that property prices couldundergo reduction along with a substantial lowering of home loan interest rates.
Exhibit 21: Commercial property sales strong; vacancy rates at multi-year lows
Source: MOSL, Industry
Exhibit 22: Commercial property completions slid on weak launches during CY12-14
Source: MOSL, Industry
485,000 465,000 458,228 420,105
319,659 244,069
175,823
CY10 CY11 CY12 CY13 CY14 CY15 CY16
Residential unit launches
360,000 375,000 359,308 329,238
279,822 267,957 244,680
CY10 CY11 CY12 CY13 CY14 CY15 CY16
Residential units sales
38.2 38.6 30.5 35.2 38.6 41.1 40.6
18% 18% 20% 19% 18%
16% 13%
CY10 CY11 CY12 CY13 CY14 CY15 CY16
Commercial property sales(mn sq ft) Vacancy Rate(%)
40 45
42
35 38 36
30
CY10 CY11 CY12 CY13 CY14 CY15 CY16
Commercial property completion(mn sq ft)

18 July 2017 11
Capital Goods | Diesel Gensets
Datacenters – a huge opportunity for DG set manufacturers A data center (or datacenter) is a facility composed of networked computers
and storage that businesses or other organizations use to organize, process,store and disseminate large amounts of data.
A large datacenter uses as much electricity as a small town. Every datacenterincludes backup power supplies in the form of HHP DG sets. This power usuallyrequires multiple 750kVA-and-above DG sets. Key sectors looking at putting updatacenters are BFSI, Social Media, Entertainment, Ecommerce and Telecom.
Exhibit 23: Investment in datacenters (USD b)
Source: Industry, MOSL
According to a report by IAMAI (2016), the Indian datacenter market showspromising growth over the next few years due to increased usage of datathrough smartphones, social networking platforms, e-commerce platforms, andgovernment projects. The Indian datacenter infrastructure market was valued atUSD2.2b in CY16 and is expected to touch USD4.5b by CY18. It is predicted thatIndia would move to be the second-largest market for datacenters in the AsiaPacific by 2020, with investments reaching USD7b or 4.5% of the globalinvestments.
Hotel occupancy at 9-year high – to drive new supply growth For branded hotels in India, occupancy (in FY17) has risen to a 9-year high of
65%. The growth in occupancy and tariff is projected to continue in FY18 andFY19, driven by macroeconomic growth, which has led to pick-up in travel andaccommodation needs. The last time Indian hotels saw their rooms this full wasin FY08.
Hotel room supply in India grew 7-8% in FY17 and HVS expects growth to remainin this range for the next three years. However, demand is growing at 11-14%.With demand outweighing supply and outlook for travel remaining positive, theupward trend in occupancy rate is likely to continue.
Exhibit 24: Hotel occupancy rate at 9-year high
Source: HVS India, MOSL
141 152 178
200
30 37 44 55
2 3 5 7
FY14 FY16 FY18 FY20
Global APAC India
60.9 60.4 60.4
61.3 62.1
65.0
FY12 FY13 FY14 FY15 FY16 FY17
Occupancy rate
18 July 2017 12
Capital Goods | Diesel Gensets
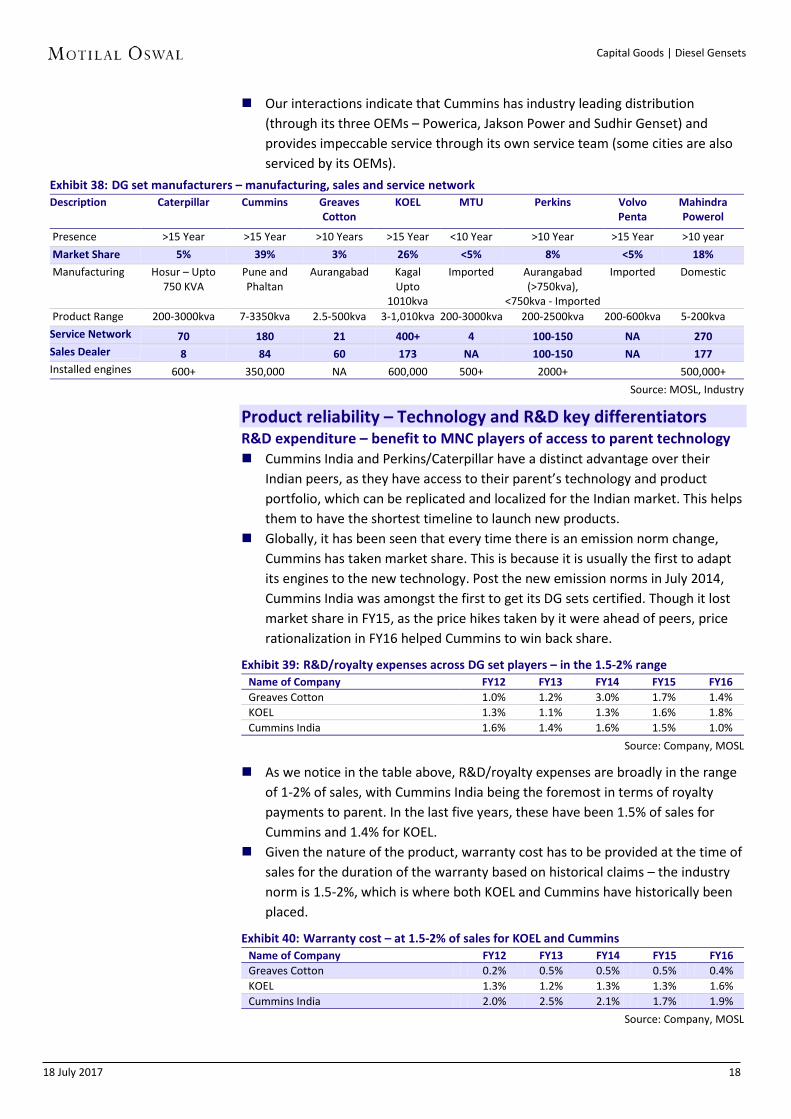
Shift from unorganized to organized segment – GST to hasten transition We estimate that 30,000 DG sets are sold annually by the unorganized sector
and these account for 21% of the industry’s overall sales. The presence of theunorganized sector would be largely in the LHP (<160kva) segment.
With GST expected to ensure better tax compliance and bring the unorganizedsegment into the tax net, we expect the price gap between the unorganized andorganized players to narrow. With this, organized players should gain share.
Exhibit 25: DG industry - unorganized segment accounts for ~21% of volumes
Source: MOSL, Industry
Exhibit 26: Cummins India - DG sales by key end market
Source: Company, MOSL
Exhibit 27: Cummins India rating wise sales: >750kva accounts for ~50% of sales in FY17
Source: Company, MOSL
29%
71%
Organised Unorganised
20%
20%
15% 10%
10%
10%
15% Manufacturing
Real estate
Infra
Services
Retail
Hospitality
Others
2,770 3,560 4,000 3,300 2,500 3,250 2,700
2,670 2,370 3,000 2,300
1,150 2,700 3,240
2,300 1,950 2,500
1,650
1,300
1,800 1,840
5,470 4,750
6,300
3,800 5,500
4,600 5,740
FY11 FY12 FY13 FY14 FY15 FY16 FY17
<160kva 160-380kva 420-625kva >750kva

18 July 2017 13
Capital Goods | Diesel Gensets
Brand, Distribution, Service, Product range key factors Low pricing not enough to take market share
In the Indian DG market, while pricing is an important factor influencing the finalpurchase decision, it is not the foremost reason. The key drivers for selecting aparticular manufacturer are: (a) brand, (b) distribution reach, (c) service andspare part availability, and (d) product reliability and portfolio depth.
Increasingly, customers are looking at the life cycle cost of owning a DG setrather than just the initial capital cost while making the purchase decision.Capital cost constitutes only ~6% of the overall cost of ownership.
Exhibit 28: Breakup of various components in the operating costs of DG sets Description % of total Diesel 85-90%Capital costs 6% Spares 4%
Source: MOSL, Industry
Exhibit 29: Market share in the Indian DG industry (by value)
Source: MOSL, Industry
Fuel cost – no meaningful difference across brands We compared the fuel consumption across brands for the most common nodes
in the industry, namely 15, 62.5, 200, 750 and 2,000kva-rated DG sets based onthe brochures available on the company websites.
We find no noticeable difference between the fuel consumption across Indianand MNC brands – this is true across nodes. Clearly, fuel consumption is not thedifferentiating factor in a customer’s decision to buy a DG set.
Exhibit 30: Fuel consumption by brand and kva ranges (Litres consumed per hour @75% load) Name of Company 15kVA 62.5kVA 200kVA 750kVA 2000kVA Mahindra Powerol 2.7 11.3 33.3 NA NA Greaves Cotton 2.8 11.1 35.4 NA NA Ashok Leyland 3.0 11.3 34.0 NA NA Kirloskar Oil 3.0 11.3 34.4 126 NA Caterpillar NA NA NA NA NA Cummins India 3.4 11.5 34.6 132 291 MTU NA NA NA NA NA Perkins NA NA NA 125 293
Source: Company, MOSL ** at 75% load
37%
25%
16%
7%
15%
Cummins KOEL Mahindra Perkins Others

18 July 2017 14
Capital Goods | Diesel Gensets
Brand positioning/ranking – Caterpillar best placed We understand that Caterpillar has the highest brand equity in the DG market –
it is the customers’ first choice in areas having critical usage. While pricing plays an important role in the LHP segment, in the MHP/HHP
ranges, it is the brand perception on reliability, performance, dealers and aftersales that determines the decision to purchase a particular brand.
Exhibit 31: Brand positioning/hierarchy in the Indian DG industry
Source: Company, MOSL
Product range – a key factor Companies like Cummins and KOEL have a distinct advantage over their peers in
terms of product range offered. Cummins, which offers 44 nodes ranging from7kva to 3,350kva, has the most comprehensive portfolio. KOEL comes a distantsecond, with 27 nodes ranging from 3kva to 1,010kva (it launched its 750kvaofferings in FY16 and 900/1,010kva offerings in FY17). None of the other brandsin the Indian market have offerings spanning across the LHP, MHP and HHPsegments.
Exhibit 32: Company wise nodes on offers for the genset range Name of company No of nodes CAT 12 Cummins 44 Greaves Cotton 23 KOEL 27 MTU 18 Perkins 10 Volvo Penta 9 Mahindra 19 Ashok Leyland 19
Source: Company, MOSL
CAT
MTU, Perkins
Cummins
KOEL
Mahindra, Ashok Leyland, Eicher

18 July 2017 15
Capital Goods | Diesel Gensets
Exhibit 33: Product range of key players in the Indian DG industry Description Caterpillar Cummins Greaves
Cotton KOEL MTU Perkins Volvo Mahindra Powerol Ashok Leyland
Penta KVA range 200-3000 7.5-3350 2.5-500kva 3-1010kva 200-3100kva400-2250kva 250-650kva 5-200kva 5-250kva
2.5 N N Y N N N N N N 3 N N N Y N N N N N
3.5 N N Y N N N N N N 5 N N Y Y N N N Y Y
7.5 N Y Y Y N N N Y N 10 N N Y Y N N N Y Y
12.5 N N N Y N N N Y N 15 N Y Y Y N N N Y Y 20 N Y Y Y N N N Y Y
22.5 N N N N N N N Y N 25 N Y Y Y N N N Y Y 30 N Y Y Y N N N Y Y 35 N Y N N N N N N Y 40 N Y Y Y N N N Y Y 45 N N Y N N N N N Y 50 N Y Y N N N N Y Y
62.5 N Y Y Y N N N Y Y 70 N Y N N N N N N N 75 N N Y N N N N Y Y
82.5 N Y Y Y N N N Y Y 100 N Y Y Y N N N Y Y 125 N Y Y Y N N N Y Y 140 N Y N N N N N N Y 160 N Y Y Y N N N Y Y 180 N Y Y Y N N N Y N 200 Y Y Y Y N N N Y Y 225 N Y N N N N N N N 250 Y Y Y Y N N Y N Y 275 N Y N N N N N N N 300 N Y N N N N N N N 320 Y Y Y Y N N Y N N 350 N N N N N N Y N N 365 Y Y N N N N N N N 380 N Y N Y N N Y N N 400 N Y Y Y N Y N N N 415 N N N N N N Y N N 450 N N N N N N Y N N 500 Y Y Y Y N Y Y N N 520 N Y N N N N N N N 600 Y Y N Y N Y Y N N 625 N Y N Y N N N N N 650 N Y N N N N Y N N 725 Y N N N N N N N N 750 N Y N Y N Y N N N 810 N Y N N N N N N N 910 N N N Y N N N N N
1010 Y Y N Y Y Y N N N 1050 N N N N Y N N N N 1135 N N N N Y N N N N 1185 N N N N Y N N N N 1250 N Y N N N Y N N N 1500 Y Y N N N Y N N N 1650 N N N N Y N N N N 1700 N N N N Y N N N N 1750 N Y N N N N N N N 1800 N Y N N N N N N N 1815 N N N N Y N N N N 1850 N N N N N Y N N N

18 July 2017 16
Capital Goods | Diesel Gensets
Description Caterpillar Cummins Greaves Cotton
KOEL MTU Perkins Volvo Mahindra Powerol Ashok Leyland Penta
1875 N Y N N Y N N N N 2000 Y Y N N N Y N N N 2050 N N N N Y N N N N 2125 N N N N Y N N N N 2250 N Y N N N Y N N N 2275 Y N N N Y N N N N 2350 N N N N Y N N N N 2500 N Y N N N N N N N 2550 N N N N Y N N N N 2625 N N N N Y N N N N 2725 Y N N N N N N N N 2750 N Y N N N N N N N 2800 N N N N Y N N N N 2900 N N N N Y N N N N 3000 Y N N N Y N N N N 3100 N N N N Y N N N N 3350 N N N N N N N N N 3500 N Y N N N N N N N 3750 N Y N N N N N N N
No. of nodes 12 44 23 27 18 10 9 19 19
Pricing not the key differentiator, especially in MHP and HHP segments Pricing is not the key determinant for the buying decision of a DG set. While it
plays a role in the overall purchase decision, our interactions with variousindustry players indicate that pricing gets a low weightage.
On comparing the price points of DG sets for manufacturers across nodes, wefind that: (a) in the higher kva nodes, KOEL products are priced at 2-4% discountto Cummins and Perkins, and (b) in the low kva (<160kva) nodes, Cummins’products are 2-3% more expensive than KOEL and Mahindra.
Exhibit 34: Price points across key nodes for players in the DG set industry Node Perkins Cummins KOEL Mahindra 15kva NA 200,000 200,000 195,000 62.5kva NA 355,000 345,000 345,000 125kva NA 560,000 560,000 560,000 160kva NA 750,000 745,000 740,000 200kva NA 980,000 945,000 940,000 500kva 2,250,000 2,300,000 2,200,000 NA 750kva 3,650,000 3,650,000 3,500,000 NA 1010kva 5,100,000 5,175,000 4,900,000 NA 1500kva 8,200,000 8,100,000 na NA 2000kva 11,200,000 11,400,000 NA NA
Source: MOSL, Industry
Our industry feedback suggests that Cummins has readjusted prices downwardsover the last few quarters – this is more so for the 750kva and above range,where KOEL has made an aggressive entry. Cummins has reduced the prices ofits 750kva DG sets from INR4m-4.2m to INR3.7m, marginally above KOEL’s. Thisis despite a sharp rise seen in pig iron pries over the last few quarters (see chartbelow)

18 July 2017 17
Capital Goods | Diesel Gensets
Exhibit 35: Cummins gross margins inversely related to rise in pig iron prices
Source: MOSL, Company
Exhibit 36: Pig iron wholesale price index (50% of Cummins India raw material cost is pig iron)
Source: MOSL, Industry
Distribution network, service touch points key to sustained market leadership With most DG sets used for standby power, it is of utmost importance that they
are in working condition when needed, primarily during a power cut. This is thereason why distribution/sales network and service plays the most importantrole in the customer’s decision making process.
Exhibit 37: Distribution model for key players in the Indian DG set industry Description Caterpillar Cummins Greaves Cotton KOEL MTU Perkins Volvo
Penta Mahindra Powerol
Scale of Ops National National National National National National Regional National Sales Model OEM, Dealer
Driven OEM
Driven, Service is Cummins
Procures engines to
make gensets, Service is Greaves
OEM Driven,
Service is KOEL
OEM, Dealer driven
OEM Driven for sales
and service
Direct Selling
OEM, Dealer driven,
Service is Mahindra
OEM’s 2 3 6 11 5 2 None 13 Sales to dealers
Fully Built gensets
Engines Fully Built Gensets
Engines Engines Engines Engines Gensets for telecom/Engines
for retail Engine Types
Electronically Mechanical/ Electronic
Mechanical Mechanical Electronic Mechanical/ Electronic
Electronic Mechanical
Source: Industry, MOSL
-10.0%
-5.0%
0.0%
5.0%
10.0%
-30.0%-20.0%-10.0%
0.0%10.0%20.0%30.0%40.0%50.0%
Q40
8
Q20
9
Q40
9
Q21
0
Q41
0
Q21
1
Q41
1
Q21
2
Q41
2
Q21
3
Q41
3
Q21
4
Q41
4
Q21
5
Q41
5
Q21
6
Q41
6
Q21
7
Q41
7
Pig Iron price(YoY)LHS Gross margin change (YoY) RHS
135.5
80
100
120
140
160
180
Jun-
05N
ov-0
5Ap
r-06
Sep-
06Fe
b-07
Jul-0
7De
c-07
May
-08
Oct
-08
Mar
-09
Aug-
09Ja
n-10
Jun-
10N
ov-1
0Ap
r-11
Sep-
11Fe
b-12
Jul-1
2De
c-12
May
-13
Oct
-13
Mar
-14
Aug-
14Ja
n-15
Jun-
15N
ov-1
5Ap
r-16
Sep-
16Fe
b-17
Pig Iron Wholesale Price India
18 July 2017 18
Capital Goods | Diesel Gensets
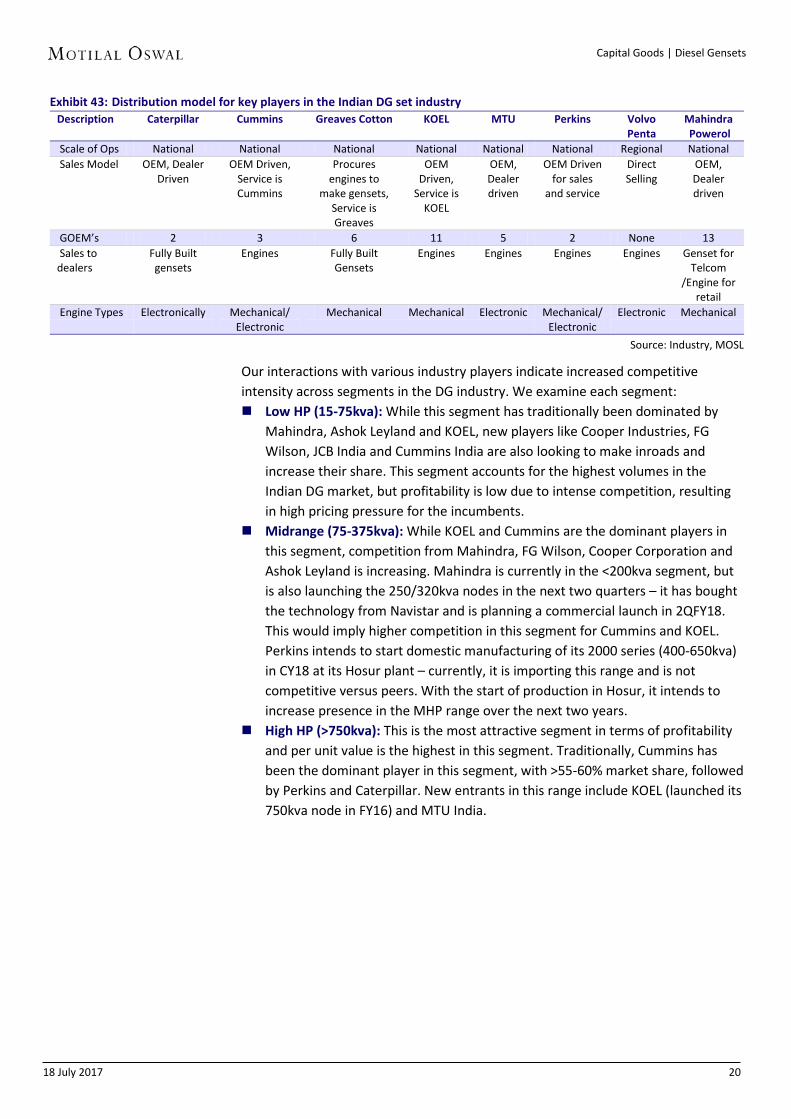
Our interactions indicate that Cummins has industry leading distribution(through its three OEMs – Powerica, Jakson Power and Sudhir Genset) andprovides impeccable service through its own service team (some cities are alsoserviced by its OEMs).
Exhibit 38: DG set manufacturers – manufacturing, sales and service network Description Caterpillar Cummins Greaves
Cotton KOEL MTU Perkins Volvo
Penta Mahindra Powerol
Presence >15 Year >15 Year >10 Years >15 Year <10 Year >10 Year >15 Year >10 year Market Share 5% 39% 3% 26% <5% 8% <5% 18%
Manufacturing Hosur – Upto 750 KVA
Pune and Phaltan
Aurangabad Kagal Upto
1010kva
Imported Aurangabad (>750kva),
<750kva - Imported
Imported Domestic
Product Range 200-3000kva 7-3350kva 2.5-500kva 3-1,010kva 200-3000kva 200-2500kva 200-600kva 5-200kvaService Network 70 180 21 400+ 4 100-150 NA 270 Sales Dealer 8 84 60 173 NA 100-150 NA 177 Installed engines 600+ 350,000 NA 600,000 500+ 2000+ 500,000+
Source: MOSL, Industry
Product reliability – Technology and R&D key differentiators R&D expenditure – benefit to MNC players of access to parent technology Cummins India and Perkins/Caterpillar have a distinct advantage over their
Indian peers, as they have access to their parent’s technology and productportfolio, which can be replicated and localized for the Indian market. This helpsthem to have the shortest timeline to launch new products.
Globally, it has been seen that every time there is an emission norm change,Cummins has taken market share. This is because it is usually the first to adaptits engines to the new technology. Post the new emission norms in July 2014,Cummins India was amongst the first to get its DG sets certified. Though it lostmarket share in FY15, as the price hikes taken by it were ahead of peers, pricerationalization in FY16 helped Cummins to win back share.
Exhibit 39: R&D/royalty expenses across DG set players – in the 1.5-2% range Name of Company FY12 FY13 FY14 FY15 FY16 Greaves Cotton 1.0% 1.2% 3.0% 1.7% 1.4% KOEL 1.3% 1.1% 1.3% 1.6% 1.8% Cummins India 1.6% 1.4% 1.6% 1.5% 1.0%
Source: Company, MOSL
As we notice in the table above, R&D/royalty expenses are broadly in the rangeof 1-2% of sales, with Cummins India being the foremost in terms of royaltypayments to parent. In the last five years, these have been 1.5% of sales forCummins and 1.4% for KOEL.
Given the nature of the product, warranty cost has to be provided at the time ofsales for the duration of the warranty based on historical claims – the industrynorm is 1.5-2%, which is where both KOEL and Cummins have historically beenplaced.
Exhibit 40: Warranty cost – at 1.5-2% of sales for KOEL and Cummins Name of Company FY12 FY13 FY14 FY15 FY16 Greaves Cotton 0.2% 0.5% 0.5% 0.5% 0.4% KOEL 1.3% 1.2% 1.3% 1.3% 1.6% Cummins India 2.0% 2.5% 2.1% 1.7% 1.9%
Source: Company, MOSL

18 July 2017 19
Capital Goods | Diesel Gensets
Competitive pressure intensifiesHHP segment being targeted as it is the most profitable
Within the Indian DG sets market, the LHP (<160kva) segment is the mostcompetitive, with the presence of 8-10 organized (primarily Indian) playersalong with Chinese and local players. Price is the key criterion for decisionmaking, and therefore, margins are also the lowest in this segment.
Exhibit 41: End market usage by ratings of DG sets Ratings Segment End Use Industries <160 kVA (Low) Telecom(15-75kva), Retail sales, Small scale Industries Units 200-375 kVA (Mid) Real Estate(Residential and Commercial), Hospitals 375-750 kVA (Heavy) Large Industrial Applications, IT, ITES, Hospitals, Hotels, Healthcare 750-3,000 kVA (High) Data Centers, Metros, Hospitals, Educational Institutions
Source: Industry, Motilal Oswal
KOEL, Ashok Leyland and Mahindra have traditionally been very strong in thelow and medium horse power DG set market. However, in a change of strategyfrom CY10, KOEL launched its DV Series (320-625kva) and this was followed bythe launch of its 750kva DG sets in FY16. In FY17, KOEL has also launched its910kva/1,010kva DG sets. It has taken a ~5% share in the HHP segment, withsales of ~75 units in FY17. KOEL further intends to launch its 1,250kva and1,500kva DG sets over the next 24 months. The >750kva is dominated byCummins India, which has historically had >50% market share in this segment.
Perkins has recently started its plant to manufacture engines for the 4,000 series(>750kva) at Aurangabad. This would help to reduce the cost of manufacturingthe engines, which would have a greater proportion of localized components.We understand that Perkins has cut prices following increased localized contentin its DG sets. In the second phase of expansion, Perkins intends to expand itsrange to manufacture smaller (>200kva) engines as well.
Exhibit 42: Players in the Indian DG set market Players in the Indian DG market Low Mid Heavy Duty High horse power kVA 15 - 75 75-375 375-750 750 - 3,000 kVA
Mahindra KOEL Cummins Cummins KOEL Cummins KOEL CAT Perkins Eicher Greaves Cotton Greaves Cotton MTU
Cummins Ashok Leyland CAT Perkins KOEL Ashok Leyland Mahindra Volvo Penta
Escorts Cooper Corporation MTU Cooper Corporation FG Wilson
JCB India Volvo Penta FG Wilson
End Markets Telecom, Commercial
complex, Hospitality, Small restaurants
Large Industries, Real Estate, Healthcare,
Hospitality, Infra
Large industries, Real Estate, Healthcare, Hospitality,
IT&ITES, Roads, Metros
IT/ITES, Large industries, Real Estate, Metro, Rail,
Hospitals, Malls, Data centres
Source: Industry, Motilal Oswal
18 July 2017 20
Capital Goods | Diesel Gensets
Exhibit 43: Distribution model for key players in the Indian DG set industry Description Caterpillar Cummins Greaves Cotton KOEL MTU Perkins Volvo
Penta Mahindra Powerol
Scale of Ops National National National National National National Regional National Sales Model OEM, Dealer
Driven OEM Driven,
Service is Cummins
Procures engines to
make gensets, Service is Greaves
OEM Driven,
Service is KOEL
OEM, Dealer driven
OEM Driven for sales
and service
Direct Selling
OEM, Dealer driven
GOEM’s 2 3 6 11 5 2 None 13 Sales to dealers
Fully Built gensets
Engines Fully Built Gensets
Engines Engines Engines Engines Genset for Telcom
/Engine for retail
Engine Types Electronically Mechanical/ Electronic
Mechanical Mechanical Electronic Mechanical/ Electronic
Electronic Mechanical
Source: Industry, MOSL
Our interactions with various industry players indicate increased competitive intensity across segments in the DG industry. We examine each segment: Low HP (15-75kva): While this segment has traditionally been dominated by
Mahindra, Ashok Leyland and KOEL, new players like Cooper Industries, FGWilson, JCB India and Cummins India are also looking to make inroads andincrease their share. This segment accounts for the highest volumes in theIndian DG market, but profitability is low due to intense competition, resultingin high pricing pressure for the incumbents.
Midrange (75-375kva): While KOEL and Cummins are the dominant players inthis segment, competition from Mahindra, FG Wilson, Cooper Corporation andAshok Leyland is increasing. Mahindra is currently in the <200kva segment, butis also launching the 250/320kva nodes in the next two quarters – it has boughtthe technology from Navistar and is planning a commercial launch in 2QFY18.This would imply higher competition in this segment for Cummins and KOEL.Perkins intends to start domestic manufacturing of its 2000 series (400-650kva)in CY18 at its Hosur plant – currently, it is importing this range and is notcompetitive versus peers. With the start of production in Hosur, it intends toincrease presence in the MHP range over the next two years.
High HP (>750kva): This is the most attractive segment in terms of profitabilityand per unit value is the highest in this segment. Traditionally, Cummins hasbeen the dominant player in this segment, with >55-60% market share, followedby Perkins and Caterpillar. New entrants in this range include KOEL (launched its750kva node in FY16) and MTU India.
18 July 2017 21
Capital Goods | Diesel Gensets
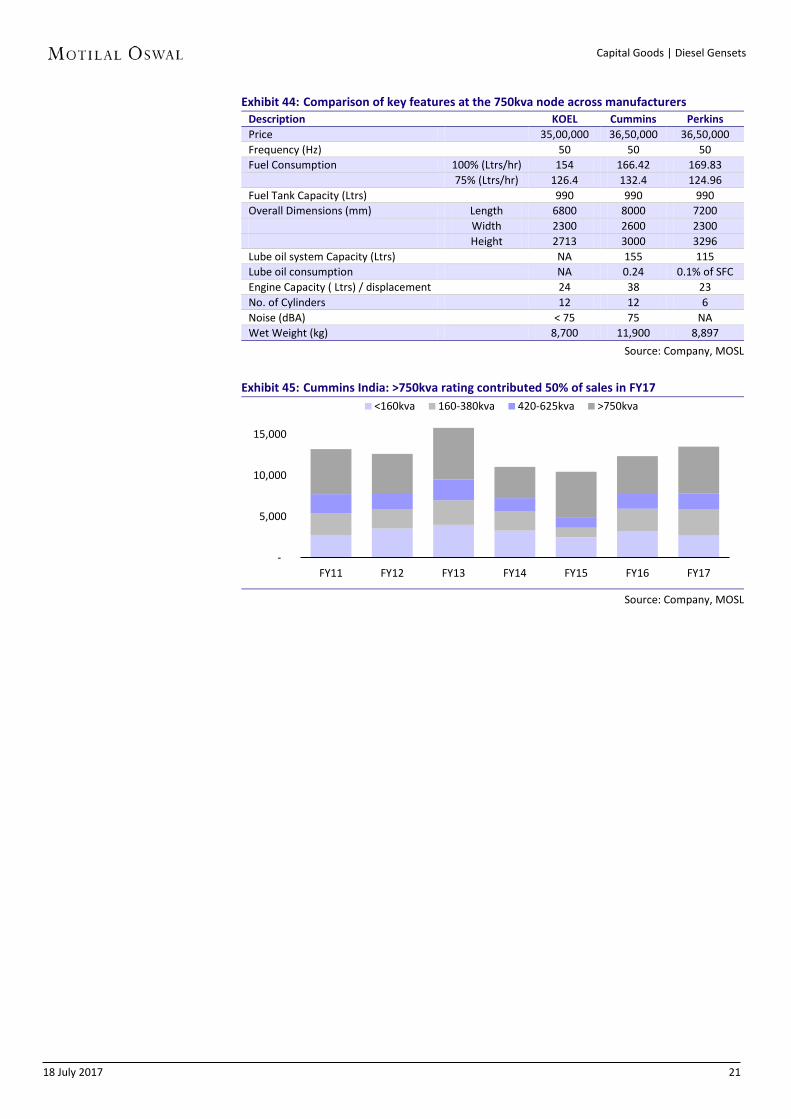
Exhibit 44: Comparison of key features at the 750kva node across manufacturers Description KOEL Cummins Perkins Price 35,00,000 36,50,000 36,50,000 Frequency (Hz) 50 50 50 Fuel Consumption 100% (Ltrs/hr) 154 166.42 169.83
75% (Ltrs/hr) 126.4 132.4 124.96 Fuel Tank Capacity (Ltrs) 990 990 990 Overall Dimensions (mm) Length 6800 8000 7200
Width 2300 2600 2300 Height 2713 3000 3296
Lube oil system Capacity (Ltrs) NA 155 115 Lube oil consumption NA 0.24 0.1% of SFC Engine Capacity ( Ltrs) / displacement 24 38 23 No. of Cylinders 12 12 6 Noise (dBA) < 75 75 NA Wet Weight (kg) 8,700 11,900 8,897
Source: Company, MOSL
Exhibit 45: Cummins India: >750kva rating contributed 50% of sales in FY17
Source: Company, MOSL
-
5,000
10,000
15,000
FY11 FY12 FY13 FY14 FY15 FY16 FY17
<160kva 160-380kva 420-625kva >750kva

18 July 2017 22
Capital Goods | Diesel Gensets
Market positioning (presence in each range) and change in positioning targeted
Name of company 15-75kva 75-375kva 375-750kva750kva and
above Brand
Cummins India Cummins
KOEL Kirloskar Green
Mahindra - - Mahindra Powerol
Ashok Leyland - - Leypower
Eicher - - Multi brand
Greaves Cotton - Greaves Power
Caterpillar - CAT
Perkins - - Perkins
MTU - - MTU
LOW HIGH LEADER MEDIUM - N.A.
Our analysis of Cummins’ pricing by segment reflects a significant fall only in thelow kva (<160kva) segment; in all other segments, pricing has remained flat orhigher (YoY). The improvement in the >750kva node could be due to (a) highershare of 1,010/1,500kva nodes in FY17, which has led to an improvement inpricing in this segment – our channel checks suggest that Cummins has taken a10% cut in prices for the 750kva node, and (b) price cuts taken only in 2HFY17 –would start reflecting FY18 onwards.
Exhibit 46: Cummins India – realization largely stable across nodes ex low kva range (INR m/unit)
Category FY16 FY17 Change (%) Low kva (< 160kva) 0.23 0.19 -18%Mid kva (160-380kva) 0.75 0.82 10% Heavy Duty (420-640kva 1.51 1.46 -3%High Kva (>750kva) 4.08 4.54 11%
Source: MOSL, Industry
18 July 2017 23
Capital Goods | Diesel Gensets
Diesel Genset industry back on growth track Infrastructure spending is the key driver
We highlight feedback from our extensive meetings across key genset manufacturers, Genset OEM’s and dealers over the past one month:
Cummins India Cummins expects to grow at a CAGR of 10-12% over the next few years. The key
end markets driving growth for Cummins are Manufacturing, Infrastructure,Datacenters, SEZs, Hotels, and Hospitals.
It has taken market share across product ranges and growth should pick up withrevival in Manufacturing and Infrastructure.
Real Estate demand has been weak for the last few years and RERA would nothave a material impact on Cummins’ sales to the segment.
Cummins is focused on market share; it is willing to accept lower margins tosustain and enhance market share.
The company has >60% share in the >750kva segment and has realigned priceswith competition in this segment.
Cummins expects a smooth transition to the GST regime. Demonetization hadalso not had a major impact on the company.
Cummins India GOEM The OEM expects the market to grow 10-15% in FY18. Key end markets driving
growth are Roads, Metros, Retail, MMSE, and Real Estate (affordable housing). Cummins gained share in FY17 despite KOEL entering the HHP (>750kva) range.
Cummins’ DG sets offer unmatched reliability and service. The company hasalways had competition in prices – earlier, it was Perkins, and now it is KOEL.
KOEL's HHP range likely to take share in government jobs (lowest bidder) andsmall real estate developers. Reputed developers are likely to prefer Cummins,especially since the price differential with KOEL has reduced.
Sales could weaken in the last week of June, given the impending GSTimplementation.
Unlike KOEL and Mahindra that took 2-5% price hikes recently, Cummins has notplanned any price increases.
Mahindra Powerol In FY18, Mahindra expects 3-4% growth in the low kva segment and 10-12%
growth in the higher kva segment. Mahindra is present primarily in the lower kva (15-200kva) segment. It intends
to launch its 250kva and 320kva products in July. It also imports and sellsScania/Perkins DG sets in the 200-400kva range.
The key segments that Mahindra targets are Real Estate, Education, Telecom,Shops, and Offices.
Its competitive advantages in the 250/320kva segment are: (a) service, (b)distribution, and (c) technology – has taken technology from Navistar.
18 July 2017 24
Capital Goods | Diesel Gensets
Currently, it sells 18,000 units per year to Telecom and 18,000 units per year toRetail and Infrastructure. It derives INR7.5b sales annually from DG sets(primarily to the telecom sector) and engines.
The company is planning tie-ups to get into the 625/750kva range as well. Sale of DG sets to the Telecom industry declined from 100,000 units in FY09 to
15,000 units in FY14/15. Mahindra being the leader in this segment wasimpacted the most. In FY17, the Telecom industry bought 30,000 DG sets – ofthese, Mahindra accounted for 18,000 units and Eicher for 5,500 units.
Cummins’ margins would be hit, as it has reduced prices after KOEL’s entry inthe >750kva range. Cummins sells its 750kva product at INR3.7m (down fromINR4.1m earlier) v/s KOEL’s INR3.6m.
Perkins sells 600-700 units annually in India. It also exports to China fromAurangabad, enabling it to gain economies of scale. The resultant reduction inits cost/unit could make it a threat to Cummins.
Kirloskar Oil Engines GOEM KOEL sells its 3-5kva range under the KOEL Chotta Chilli brand, and its 15-
1,010kva range under the KOEL Green brand. KOEL sold 30,000 units in FY16 and 36,000-38,000 units in FY17. It introduced
750kva and 1,010kva products in FY17. In FY18, growth is likely to be 5-10%. RERA will imply that existing projects get
completed on time, but new project launches will be delayed. FY19 could beweak.
KOEL is winning share in the 750kva range, given its brand and productreliability.
Within the 750kva node, prices have dropped 5-7%. Earlier, Cummins had amonopoly in the 750kva and higher ratings. Now, the customer has a choicebetween KOEL and Cummins.
Perkins has not done as well due to fewer GOEMs and service points, and also alimited product range.
Cummins has a good product range, reliable products, competitive pricing, andgood GOEMs.
Perkins India After three years of subdued demand (CY13-15), the HHP (>750kva) segment
saw a revival from CY16, with 3-4% growth. Perkins India expects a high single-digit growth in CY17.
Key end markets driving growth are Datacenters, Metros, Commercial RealEstate, Roads, and Manufacturing. Demand from Datacenters is likely to grow ata CAGR of 15% over the next 3-4 years. Demand from Metro Rail projects is seenat 200-300 units per year for the next few years.
Entry of a new competitor (KOEL) in the HHP segment has led to price cuts byCummins, which does not want to let go market share. Perkins has maintainedprices. KOEL has a credible product but larger developers (like Brigade andPrestige) are likely to stay with Cummins/Perkins.
Perkins will start manufacturing the 2000 series (400, 500, 625kva) at the Hosurplant in CY18. It will initially cater only to the power generation segment.Currently, it is not catering to the industrial engines market (60,000-70,000

18 July 2017 25
Capital Goods | Diesel Gensets
engines annually) as it does not manufacture the 2000 series (entirely imported). After start of production in Hosur and pick-up in volumes, it will begin producing industrial engines (2000 series) too. Industrial engines are doing well for Cummins and KOEL (Roads, Mining, Railways, Defense).
The Aurangabad plant is working at 60-70% capacity. Of the ~2,100 units itproduces, 30% are for domestic (500-600 units) and 70% for overseas markets.
Perkins India dealer The dealer was optimistic on the HHP (>750kva) segment, with high enquiry
levels and customers willing to convert enquiries into firm orders. Similar trendsare also being witnessed in the MHP (250-650kva) range.
Key end markets seeing a revival include: (a) Datacenters (>1,000kva), (b)IT/ITES, (c) Roads (200/500/600kva), (c) Metros (500/750kva), (d) Malls, (e)Hospitals, (f) Hotels, (g) Educational Institutions, and (h) Rail (500/750kva).
The dealer expects 10-15% growth in MHP/HHP sales in FY18 for the industrywhile LHP (<160kva) sales would remain subdued on lower sales to Telecom.
KOEL is a credible competitor in this range, where there were only four playersearlier – Cummins, MTU, Perkins and Caterpillar. Cummins, Perkins andCaterpillar together have 75-80% share in this segment. Annual size of thismarket is ~2,400 units, with Cummins having 60-70% of the market.
KOEL's 750kva and above range is primarily preferred by real estate developersand government tenders, where the lowest bidder wins. However, in case ofcritical applications, KOEL is unlikely to break in.
KOEL's pricing is quite aggressive, and due to this, Cummins was also forced toreduce prices. Perkins has, however, maintained its prices.
KOEL was also present in the MHP range, with its DV Series (325-650kva), butwas not able to significantly affect Cummins's share. It could face a similar issuein the HHP (>750kva) segment, as well.
In the HHP segment, product reliability, quality and service are paramount –Cummins, Caterpillar and Perkins are ahead of KOEL in this regard. For example,within Datacenters, customers are unlikely to go with KOEL.
The 750kva segment involves not just supplying a product, but putting up aproject – installation of exhaust systems, controls, and taking care of spacerequirements. KOEL might lose out on this.
The impact of GST is likely to be higher in the LHP segment. In the HHP segment,taxes are a pass-through, and so, GST is unlikely to have a material impact.

18 July 2017 26
Capital Goods | Diesel Gensets
Key players in the Indian DG set market India a key focus market for MNCs
Cummins India Cummins has been present in India for over 55 years and has built a reputation
founded on its strong dealer/distribution network, product quality, and after-sales support.
It supplies engines to three OEMs — Powerica, Jakson Power, and SudhirGensets. The OEMs assemble the DG sets by adding alternators, canopies, andcontrol panels — these are then sent to dealers across India for sale tocustomers.
Exhibit 47: Cummins Power Generation range
Source: Cummins India
Exhibit 48: Cummins India operates through three OEMs in India Partner Incorporation Areas of Operation Manufacturing Jacksons 1947 North and North-East
India Daman
Partner P /Powerica 1984 West and South Daman, Bangalore, Dadra and Nagar Haveli
Sudhir Gensets 1973 North and North-West India
Silvassa, Jammu, Gurgaon
Source: Industry, MOSL

18 July 2017 27
Capital Goods | Diesel Gensets
Exhibit 49: Cummins India engine range and litres kVA Series Displacement (Litres) 7.5 - 25 (Low range) X 1.3, 1.7, 2.5 30 - 62.5 ( Low range) S/B 3.8 140 - 225 (Low range) B /QSB 5.9 250 - 320 (Mid-range) C /L/QSL 8.3 320 - 400 (Heavy duty) N/QSN 14 500, 520-650, 750 K/QSK 19, 38 600-625 (High horse power) V 28
1500,1750-1800 QSK 50 1875-3350 (High horse power) QSK 23,60,78
Source: Company, MOSL
Caterpillar India In India, Caterpillar sells 200-3,000kva DG sets, gas-based generator sets, and
also rents out 200-2,000kva generator sets. Caterpillar has a manufacturingfacility in Hosur, Tamil Nadu. The unit specializes in the design and manufactureof internal combustion engines, genset packages, and components. The productrange includes diesel engines, gas-engine long blocks, and electric powergenerator sets. Product ratings range from 200kva to 2,000kva, covering familieslike 3300, 3400, C series, and 3500. The facility employs over 300 people.
Caterpillar’s Hosur facility has an extensive customer base across India, China,Indonesia, Australia, Europe, and North America. The unit assembles 200-3,000kva engines, makes DG engines of up to 750kva, and imports/assemblesengines >750kva. It has a machining shop for marking components that fit intothe engine. It produces ~400 engines a month, that is, ~5000 engines per annumusing a single shift. It has the capacity to double production by using two shifts.
Exhibit 50: Caterpillar distributor network in India
Source: Industry, MOSL
Caterpillar has also launched its FG Wilson brand in the 10-250kva segment totake on the likes of Cummins India, KOEL and Mahindra. It is using enginessupplied by Cooper Corporation. The range is used primarily at construction

18 July 2017 28
Capital Goods | Diesel Gensets
sites, by telecom networks, factories, hospitals, commercial premises, and residential properties.
Perkins India Perkins has recently started its manufacturing facility in Aurangabad, Shendra
Industrial Area. The facility will manufacture its 4000 Series engines, with poweroutputs of 700-2,000kva. The estimated cost is ~INR8b; initial productioncapacity of 3,000 units will be extended to 5,000 units. The new plant will helpmeet growing demand for engines from Asian markets. The 120,000 squaremeter site (including a 40,000 square meter manufacturing area) will alsoundertake machining, assembly and testing, and paint and packaging.
Exhibit 51: Perkins factory layout
Source: Industry, MOSL
In India, Perkins has two distribution partners – GMMCO Power and PowerpartsPrivate Limited. GMMCO mainly concentrates on the Southern and Westernstates, while Powerparts takes care of the Northern and Eastern regions.
GMMCO Power: Territories supported include Andaman and Nicobar Islands,Andhra Pradesh, Chhattisgarh, Dadra and Nagar Haveli, Daman and Diu, Goa,Gujarat, Karnataka, Kerala, Lakshadweep, Madhya Pradesh, Maharashtra,Pondicherry, and Tamil Nadu.
Powerparts: Territories supported include Arunachal Pradesh, Assam, Bihar,Chandigarh, Delhi, Haryana, Himachal Pradesh, Jammu and Kashmir, Jharkhand,Manipur, Meghalaya, Mizoram, Nagaland, Orissa, Punjab, Rajasthan, Sikkim,Tripura, Uttar Pradesh, Uttarakhand, and West Bengal.
18 July 2017 29
Capital Goods | Diesel Gensets
Kirloskar Oil Engines KOEL is one of the major DG set manufacturers in India, especially in the low-to-
mid-end segment; recently, it has also entered the HHP segment. It has apresence in the power generation sector and caters to the agriculture andindustrial segments. It also exports engines to the Middle East and Africanmarkets. KOEL has four manufacturing facilities — one each in Nasik, Pune,Rajkot, and Kolhapur.
KOEL had a tie up with Cummins in the 1990s; since they parted ways, KOEL hasbeen selling gensets under its own brand. KOEL has a very strong market sharein the LHP/MHP segment, and is a close number-2 to Cummins and Mahindra.
It launched its 750kva DG sets in FY16 and managed to take 10-12% share in thissegment. Its recent launch of 910/1,010kva DG sets has also been received wellby customers and it intends to double its sales of >750kva DG sets in FY18. It hasalso started working on 1,500/2,400kva DG sets, which it intends to launch in 24months.
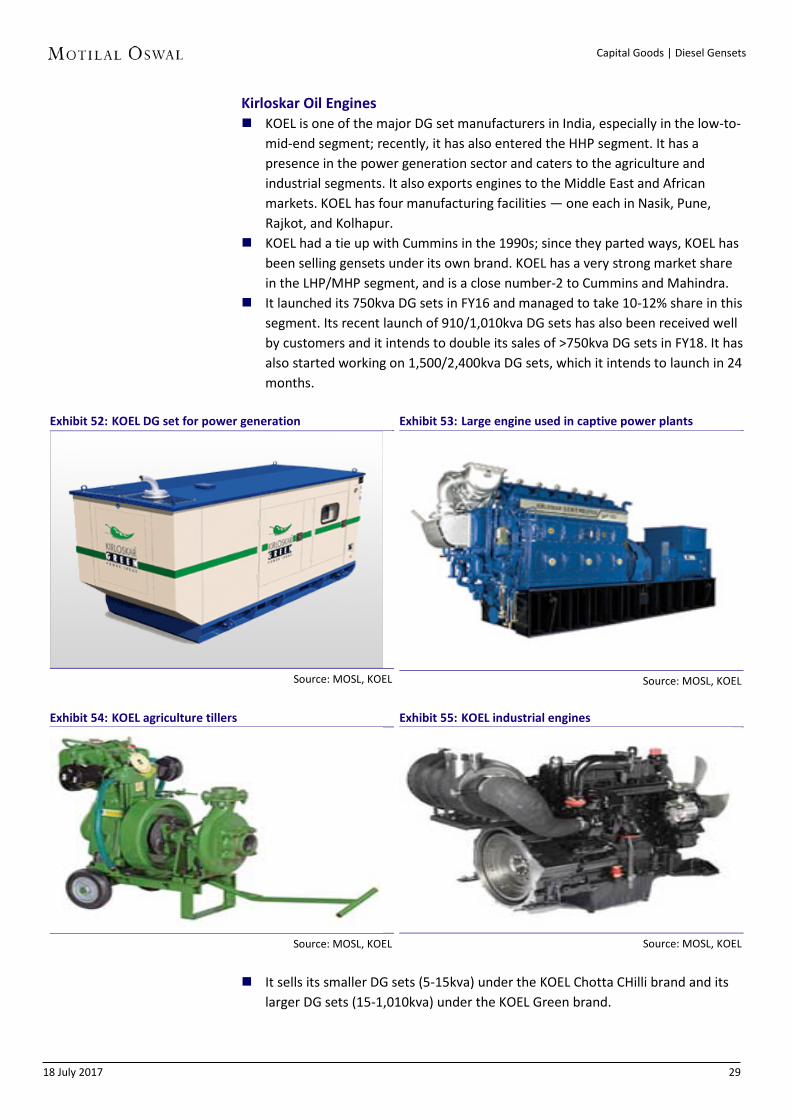
Exhibit 52: KOEL DG set for power generation
Source: MOSL, KOEL
Exhibit 53: Large engine used in captive power plants
Source: MOSL, KOEL
Exhibit 54: KOEL agriculture tillers
Source: MOSL, KOEL
Exhibit 55: KOEL industrial engines
Source: MOSL, KOEL
It sells its smaller DG sets (5-15kva) under the KOEL Chotta CHilli brand and itslarger DG sets (15-1,010kva) under the KOEL Green brand.
18 July 2017 30
Capital Goods | Diesel Gensets
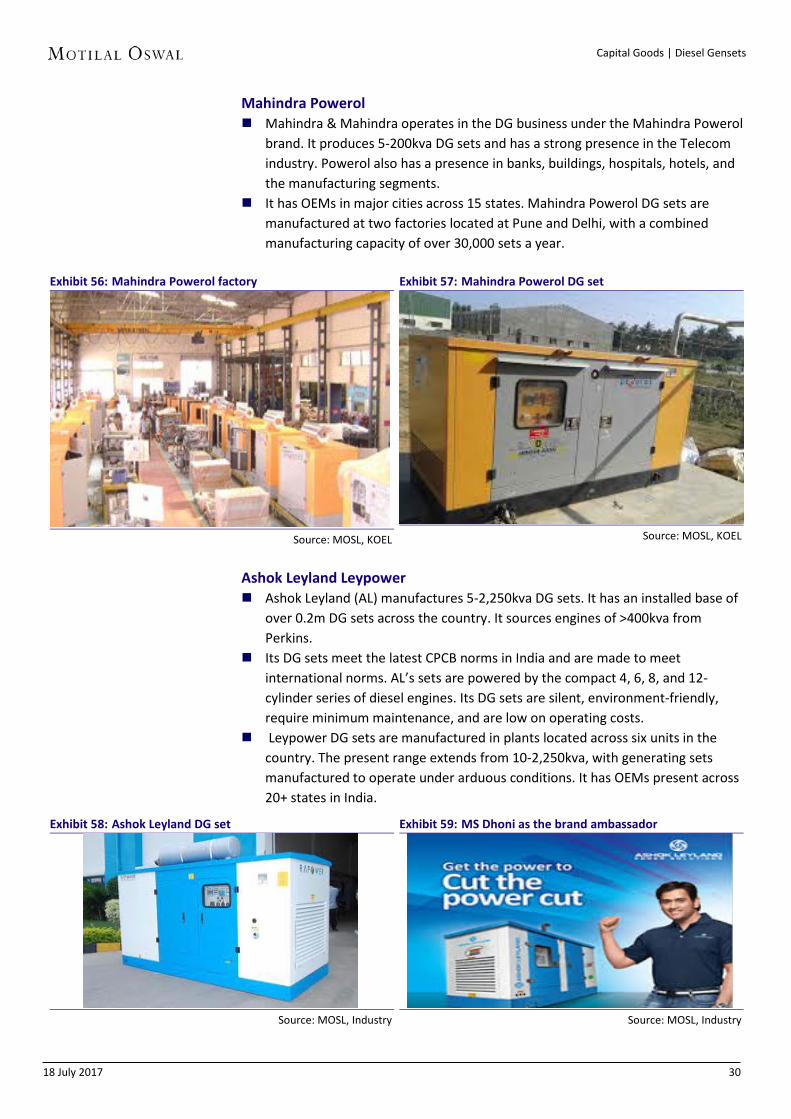
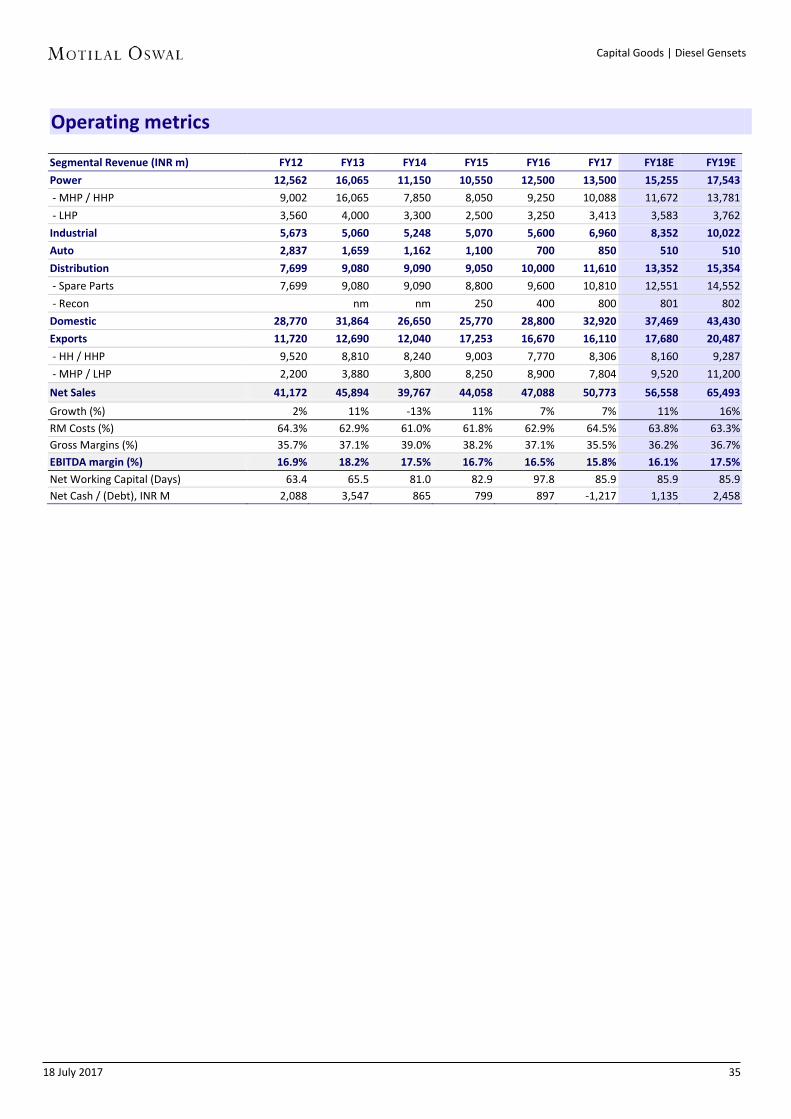
Mahindra Powerol Mahindra & Mahindra operates in the DG business under the Mahindra Powerol
brand. It produces 5-200kva DG sets and has a strong presence in the Telecomindustry. Powerol also has a presence in banks, buildings, hospitals, hotels, andthe manufacturing segments.
It has OEMs in major cities across 15 states. Mahindra Powerol DG sets aremanufactured at two factories located at Pune and Delhi, with a combinedmanufacturing capacity of over 30,000 sets a year.
Exhibit 56: Mahindra Powerol factory
Source: MOSL, KOEL
Exhibit 57: Mahindra Powerol DG set
Source: MOSL, KOEL
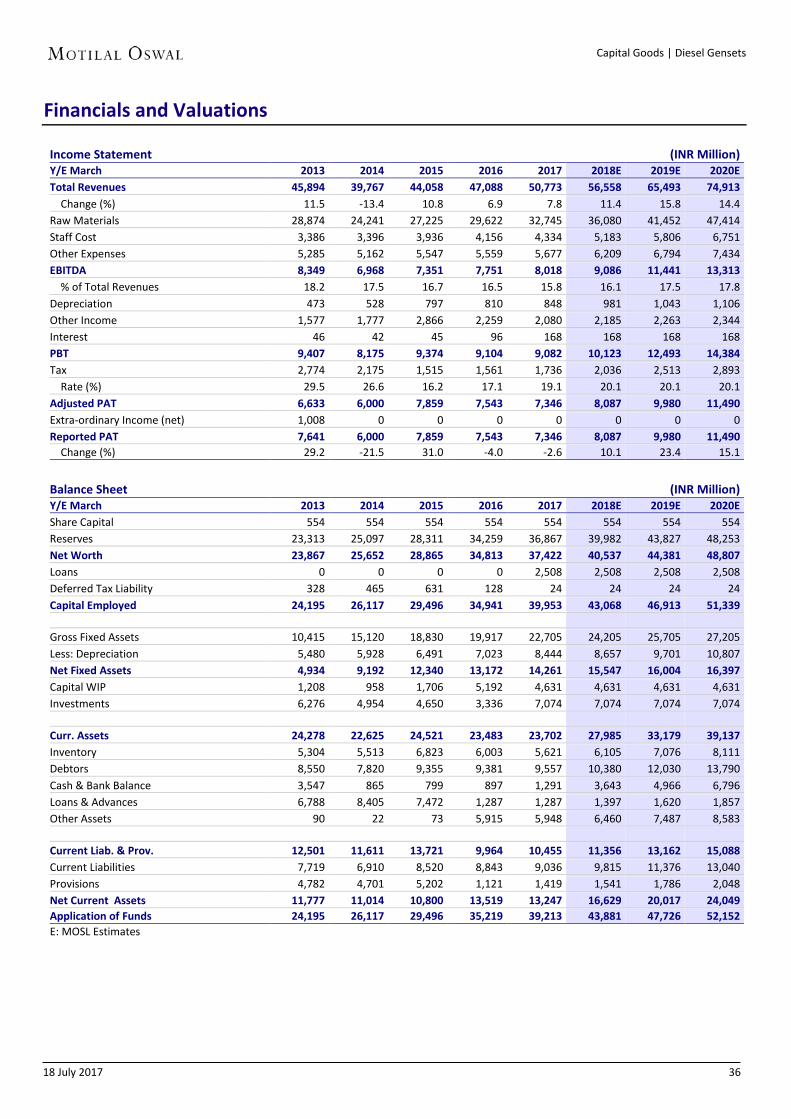
Ashok Leyland Leypower Ashok Leyland (AL) manufactures 5-2,250kva DG sets. It has an installed base of
over 0.2m DG sets across the country. It sources engines of >400kva fromPerkins.
Its DG sets meet the latest CPCB norms in India and are made to meetinternational norms. AL’s sets are powered by the compact 4, 6, 8, and 12-cylinder series of diesel engines. Its DG sets are silent, environment-friendly,require minimum maintenance, and are low on operating costs.
Leypower DG sets are manufactured in plants located across six units in thecountry. The present range extends from 10-2,250kva, with generating setsmanufactured to operate under arduous conditions. It has OEMs present across20+ states in India.
Exhibit 58: Ashok Leyland DG set
Source: MOSL, Industry
Exhibit 59: MS Dhoni as the brand ambassador
Source: MOSL, Industry

18 July 2017 31
Capital Goods | Diesel Gensets
What goes into making a DG set? The engine is the heart of the machine
Exhibit 60: The engine is the heart of the diesel generator set
Source: MOSL, Industry
Exhibit 61: Typical layout of a DG set assembly plant
Source: MOSL, Industry
Diesel Engine A.C. Generator Load
Fuel Control Foundation Accessories
Controls
Excitation Control

18 July 2017 32
Capital Goods | Diesel Gensets
BSE SENSEX S&P CNX CMP: INR933 TP: INR1,110 (+18%) Upgrade to Buy 31,711 9,827
Stock Info Bloomberg KKC IN Equity Shares (m) 277.2 52-Week Range (INR) 1096 / 748 1, 6, 12 Rel. Per (%) -1/-4/-1M.Cap. (INR b) 258.6 M.Cap. (USD b) 4.0 Avg Val, INRm 274 Free float (%) 49.0
Financials Snapshot (INR b)
Y/E MAR 2017 2018E 2019E
Net Sales 50.8 56.6 65.5 EBITDA 8.0 9.1 11.4 Adj PAT 7.3 8.1 10.0 EPS (INR) 26.5 29.2 36.0 EPS Gr. (%) -2.6 10.1 23.4 BV/Sh. (INR) 135.0 146.2 160.1 RoE (%) 21.2 20.7 23.5 RoCE (%) 20.0 19.8 22.5 P/E (x) 35.2 32.0 25.9 P/BV (x) 6.9 6.4 5.8
Shareholding pattern (%) As On Mar-17 Dec-16 Mar-16 Promoter 51.0 51.0 51.0 DII 20.9 20.3 18.3 FII 15.0 15.7 16.5 Others 13.2 13.0 14.2
FII Includes depository receipts
Stock Performance (1-year)
Infrastructure spend to drive domestic growth Exports to witness pickup in 2HFY18
Expects double-digit growth in domestic sales, driven by infrastructure spending Cummins India (KKC) has witnessed a pick-up in domestic demand, driven by strong infrastructure spending by the government. Over the medium term, the company expects domestic sales to register double-digit growth, given strong infrastructure spending and a pick-up in demand for backup power.
Growth in domestic sales is expected to be driven by: Industrial segment: Industrial segments such as road construction, railways
and mining provide strong opportunities, given the government’s focus oninfrastructure development. Over the medium term, KKC expects growth in the industrial genset segment to be better than in the power generation segment.
Power generation segment: Growth in this segment is expected to be directlycorrelated to domestic GDP growth, driven by back-up power installations byend-consumers. Revival is seen in the key end-markets of IT/ITES, hotels,hospitals, data centers.
Distribution segment.
Gains share in high horse power (HHP) segment, despite fierce competition Competition in DG sets remains intense, as demand has been subdued during the past few years. Despite this, KKC has been able to gain share, given its focus on (1) retaining market share (taken two price cuts in the last three quarters in response to rising competition), and (2) providing an improved product offering (via better-technology engines, strong service, OEM/dealer network, and spare part availability to ensure minimum downtime). KKC has also reduced product costs through value engineering.
Strong growth in distribution business, led by higher industrial contribution Distribution & Spares business is likely to perform well, given higher sales contribution from the industrial segment, where machine usage is intense (the consequent wear and tear augments the need for spares). Also, given the large installed base of machines, demand for spares is expected to remain robust.
Exports muted; revival expected from 2HFY18 Exports have been weak, given bleak demand from end-markets like Africa, LATAM and the Middle East. However, we expect demand to revive from 2HFY18, given the increase in commodity prices. In the long run, the company has guided for low-double-digit growth in exports.
700
800
900
1,000
1,100
Jul-1
6
Oct
-16
Jan-
17
Apr-
17
Jul-1
7
Cummins IndiaSensex - Rebased
18 July 2017Update | Sector: Capital Goods
Cummins India

18 July 2017 33
Capital Goods | Diesel Gensets
Margins to improve in 2HFY18, supported by export pick-up KKC’s gross margin contracted 160bp to 35.5% in FY17 due to (a) declining contribution from exports (33% of sales v/s 37% in FY16), which command better margins than domestic sales, (b) higher share of industrial sales, and (c) adverse product mix. We expect margin expansion in FY18, with pick-up in exports.
Valuation and view KKC has, over the years, developed (a) strong product portfolio with superior technology to meet domestic demand, (b) wide distribution network to provide superior after sales service to customers, and (c) cost-effective products to maintain leadership in a fiercely competitive market. Given strong infrastructure push, initial signs of pick-up in the power genset segment, and expected revival in the export segment from 2HFY18, we upgrade our rating to BUY. We also revise our target price to INR1,110 (30x June 2019E EPS; in line with 5-year average). The stock currently trades at 34x FY17E EPS of INR26.5, 31x FY18E EPS of INR30.9 and 25x FY19E EPS of 35.5. Key risks to our rating are: (a) weaker-than-expected revival in the domestic power generation market, and (b) persisting weakness in commodity prices, leading to a delay in pick-up of LHP exports.

18 July 2017 34
Capital Goods | Diesel Gensets
Exhibit 62: KKC’s market share in the power genset segment
Source: MOSL, Company
Exhibit 63: Market share by players
Source: MOSL, Company
Exhibit 64: Segment-wise revenue break-up (FY17)
Source: MOSL, Company
Exhibit 65: Sales expected to register double-digit growth, driven by pick-up in infrastructure segment
Source: MOSL, Company
Exhibit 66: EBIDTA margin to improve, with pick-up in exports segment
Source: MOSL, Company
Exhibit 67: Robust return ratios, despite weak business scenario
Source: MOSL, Company
6,0
62
8,0
73
9,9
90
10,
020
10,
460
13,
650
12,
562
16,
065
11,
150
10,
550
12,
500
13,
500
22% 27%
31% 31% 31% 35% 35% 37%
34% 35% 41% 39%
2006
2007
2008
2009
2010
2011
2012
2013
2014
2015
2016
2017
Cummins Power Gen sales Market share(%)
39%
26%
13%
8%
14% Cummins
KOEL
Mahindra
Perkins
Others
28%
14%
2%
24%
33%
Power Generation
Industrial
Automotive
Distribution and spares
Exports
41,172 45,894
39,767
44,058 47,088 50,773 56,624 65,457
1.8
11.5
-13.4
10.8 6.9 7.8
11.5 15.6
2012
2013
2014
2015
2016
2017
2018
E
2019
E
Sales (INR m) Growth YoY (%)
6,972 8,349 6,968 7,351 7,751 8,018 9,031 11,343
16.9
18.2 17.5
16.7 16.5 15.8 15.9
17.3
2012
2013
2014
2015
2016
2017
2018
E
2019
E
EBIDTA (INR m) EBIDTA margin (%)
18
23
28
33
38
2012
2013
2014
2015
2016
2017
2018
E
2019
E
RoE (%) RoCE (%)
18 July 2017 35
Capital Goods | Diesel Gensets
Operating metrics
Segmental Revenue (INR m) FY12 FY13 FY14 FY15 FY16 FY17 FY18E FY19E
Power 12,562 16,065 11,150 10,550 12,500 13,500 15,255 17,543
- MHP / HHP 9,002 16,065 7,850 8,050 9,250 10,088 11,672 13,781 - LHP 3,560 4,000 3,300 2,500 3,250 3,413 3,583 3,762
Industrial 5,673 5,060 5,248 5,070 5,600 6,960 8,352 10,022
Auto 2,837 1,659 1,162 1,100 700 850 510 510
Distribution 7,699 9,080 9,090 9,050 10,000 11,610 13,352 15,354
- Spare Parts 7,699 9,080 9,090 8,800 9,600 10,810 12,551 14,552 - Recon nm nm 250 400 800 801 802
Domestic 28,770 31,864 26,650 25,770 28,800 32,920 37,469 43,430
Exports 11,720 12,690 12,040 17,253 16,670 16,110 17,680 20,487
- HH / HHP 9,520 8,810 8,240 9,003 7,770 8,306 8,160 9,287 - MHP / LHP 2,200 3,880 3,800 8,250 8,900 7,804 9,520 11,200
Net Sales 41,172 45,894 39,767 44,058 47,088 50,773 56,558 65,493
Growth (%) 2% 11% -13% 11% 7% 7% 11% 16% RM Costs (%) 64.3% 62.9% 61.0% 61.8% 62.9% 64.5% 63.8% 63.3% Gross Margins (%) 35.7% 37.1% 39.0% 38.2% 37.1% 35.5% 36.2% 36.7% EBITDA margin (%) 16.9% 18.2% 17.5% 16.7% 16.5% 15.8% 16.1% 17.5%
Net Working Capital (Days) 63.4 65.5 81.0 82.9 97.8 85.9 85.9 85.9 Net Cash / (Debt), INR M 2,088 3,547 865 799 897 -1,217 1,135 2,458
18 July 2017 36
Capital Goods | Diesel Gensets
Financials and Valuations
Income Statement (INR Million) Y/E March 2013 2014 2015 2016 2017 2018E 2019E 2020E Total Revenues 45,894 39,767 44,058 47,088 50,773 56,558 65,493 74,913 Change (%) 11.5 -13.4 10.8 6.9 7.8 11.4 15.8 14.4 Raw Materials 28,874 24,241 27,225 29,622 32,745 36,080 41,452 47,414 Staff Cost 3,386 3,396 3,936 4,156 4,334 5,183 5,806 6,751 Other Expenses 5,285 5,162 5,547 5,559 5,677 6,209 6,794 7,434 EBITDA 8,349 6,968 7,351 7,751 8,018 9,086 11,441 13,313 % of Total Revenues 18.2 17.5 16.7 16.5 15.8 16.1 17.5 17.8 Depreciation 473 528 797 810 848 981 1,043 1,106 Other Income 1,577 1,777 2,866 2,259 2,080 2,185 2,263 2,344 Interest 46 42 45 96 168 168 168 168 PBT 9,407 8,175 9,374 9,104 9,082 10,123 12,493 14,384 Tax 2,774 2,175 1,515 1,561 1,736 2,036 2,513 2,893 Rate (%) 29.5 26.6 16.2 17.1 19.1 20.1 20.1 20.1 Adjusted PAT 6,633 6,000 7,859 7,543 7,346 8,087 9,980 11,490 Extra-ordinary Income (net) 1,008 0 0 0 0 0 0 0 Reported PAT 7,641 6,000 7,859 7,543 7,346 8,087 9,980 11,490 Change (%) 29.2 -21.5 31.0 -4.0 -2.6 10.1 23.4 15.1
Balance Sheet (INR Million) Y/E March 2013 2014 2015 2016 2017 2018E 2019E 2020E Share Capital 554 554 554 554 554 554 554 554 Reserves 23,313 25,097 28,311 34,259 36,867 39,982 43,827 48,253 Net Worth 23,867 25,652 28,865 34,813 37,422 40,537 44,381 48,807 Loans 0 0 0 0 2,508 2,508 2,508 2,508 Deferred Tax Liability 328 465 631 128 24 24 24 24 Capital Employed 24,195 26,117 29,496 34,941 39,953 43,068 46,913 51,339
Gross Fixed Assets 10,415 15,120 18,830 19,917 22,705 24,205 25,705 27,205 Less: Depreciation 5,480 5,928 6,491 7,023 8,444 8,657 9,701 10,807 Net Fixed Assets 4,934 9,192 12,340 13,172 14,261 15,547 16,004 16,397 Capital WIP 1,208 958 1,706 5,192 4,631 4,631 4,631 4,631 Investments 6,276 4,954 4,650 3,336 7,074 7,074 7,074 7,074
Curr. Assets 24,278 22,625 24,521 23,483 23,702 27,985 33,179 39,137 Inventory 5,304 5,513 6,823 6,003 5,621 6,105 7,076 8,111 Debtors 8,550 7,820 9,355 9,381 9,557 10,380 12,030 13,790 Cash & Bank Balance 3,547 865 799 897 1,291 3,643 4,966 6,796 Loans & Advances 6,788 8,405 7,472 1,287 1,287 1,397 1,620 1,857 Other Assets 90 22 73 5,915 5,948 6,460 7,487 8,583
Current Liab. & Prov. 12,501 11,611 13,721 9,964 10,455 11,356 13,162 15,088 Current Liabilities 7,719 6,910 8,520 8,843 9,036 9,815 11,376 13,040 Provisions 4,782 4,701 5,202 1,121 1,419 1,541 1,786 2,048 Net Current Assets 11,777 11,014 10,800 13,519 13,247 16,629 20,017 24,049 Application of Funds 24,195 26,117 29,496 35,219 39,213 43,881 47,726 52,152 E: MOSL Estimates

18 July 2017 37
Capital Goods | Diesel Gensets
Financials and Valuations
Ratios Y/E March 2013 2014 2015 2016 2017 2018E 2019E 2020E Basic (INR) Adj EPS 23.9 21.6 28.3 27.2 26.5 29.2 36.0 41.5 Cash EPS 25.6 23.5 31.2 30.1 29.6 32.7 39.8 45.4 Book Value 86.1 92.5 104.1 125.6 135.0 146.2 160.1 176.1 DPS 13.0 13.0 14.0 14.0 14.0 15.4 19.0 21.9 Payout (incl. Div. Tax.) 47.2 60.1 49.4 51.5 52.8 52.8 52.8 52.8 Valuation (x) P/E 43.1 32.9 34.3 35.2 32.0 25.9 22.5 Cash P/E 39.6 29.9 31.0 31.6 28.5 23.5 20.5 EV/EBITDA 37.0 35.1 33.3 32.4 28.3 22.4 19.1 EV/Sales 6.6 6.0 5.6 5.2 4.7 4.0 3.5 Price/Book Value 10.1 9.0 7.4 6.9 6.4 5.8 5.3 Dividend Yield (%) 1.4 1.5 1.5 1.5 1.7 2.0 2.3 Profitability Ratios (%) RoE 34.7 24.2 28.8 23.7 21.2 20.7 23.5 24.7 RoCE 30.0 24.4 29.0 23.9 20.0 19.8 22.5 23.7 RoIC 44.4 29.1 26.4 24.0 22.1 23.7 28.7 30.9 Turnover Ratios Debtors (Days) 68 72 78 73 69 69 69 69 Inventory (Days) 42 51 57 47 40 40 40 40 Creditors. (Days) 46 45 51 43 44 44 44 44 Asset Turnover (x) 1.9 1.5 1.5 1.3 1.3 1.3 1.4 1.4 Leverage Ratio Debt/Equity (x) 0.0 0.0 0.0 0.0 0.1 0.1 0.1 0.1
Cash Flow Statement (INR Million) Y/E March 2013 2014 2015 2016 2017E 2017E 2017E 2017E PBT before EO Items 9,407 8,175 9,374 9,104 9,082 10,123 12,493 14,384 Depreciation 473 528 797 810 848 981 1,043 1,106 Interest 46 -432 -172 96 168 168 168 168 Direct Taxes Paid -2,377 -2,308 -1,853 -1,561 -1,736 -2,036 -2,513 -2,893(Inc)/Dec in WC (1,562) (1,607) (815) (2,716) 498 (1,198) (2,233) (2,370) CF from Operations 5,987 4,356 7,331 5,732 8,860 8,037 8,958 10,395 EO Income 0 -746 -1,993 0 0 0 0 0 CF from Oper. Incl. EO Items 5,987 3,611 5,338 5,732 8,860 8,037 8,958 10,395 (Inc)/Dec in FA (1,469) (4,678) (3,304) (5,500) (2,446) (1,500) (1,500) (1,500) Free Cash Flow 4,518 -1,068 2,035 232 6,414 6,537 7,458 8,895 Investment & Others 138 5,528 2,458 2,151 (3,738) 45 0 0 CF from Investments -1,331 850 -846 -3,349 -6,185 -1,455 -1,500 -1,500(Inc)/Dec in Networth 998 0 0 2,922 (221) 0 (0) 0(Inc)/Dec in Debt 0 0 0 0 0 0 0 0 Interest Paid 0 -42 -45 0 0 0 0 0 Dividend Paid -4,195 -4,216 -4,216 -4,518 -4,516 -4,972 -6,135 -7,064Others -147 0 0 2,508 0 0 0 CF from Fin. Activity (3,344) (4,258) (4,261) (1,595) (2,230) (4,972) (6,135) (7,064) Inc/Dec of Cash 1,312 203 231 788 446 1,611 1,323 1,830 Add: Beginning Balance 2,235 662 568 799 1,587 2,032 3,643 4,966 Closing Balance 3,547 865 799 1,587 2,032 3,643 4,966 6,796 E: MOSL Estimates

18 July 2017 38
Capital Goods | Diesel Gensets
BSE SENSEX S&P CNX CMP: INR395 Not Rated 31,711 9,827
Stock Info Bloomberg KOEL IN Equity Shares (m) 145 52-Week Range (INR) 418 / 254 1,6,12 Rel Perf. (%) 2 / 20/ 73 M.Cap. (INR b) 56.2 M.Cap. (USD b) 0.9
New product launches to drive growth Providing credible competition in recently-entered HHP segment
Focus on new product launches to expand addressable market: KOEL has launched multiple products over the last three years with the intent to expand its product range and fill up existing gaps in the product portfolio. It now offers an entire range of high-performance DG sets (2.1kva to 1,010kva). It has launched high kVA DG sets (750kva and above), power tillers, portable gensets, fire-fighting pumps, and compact gensets for defense, which are expected to generate 15% additional sales by FY19. KOEL has laid out its FY18 product launch plan, where it plans to launch power tillers (5/8/12HP range), railway engines (INR2.3b market) and electric pumps in the agriculture segment.
Despite being a new entrant, providing credible competition in the HHP segment: KOEL has recently entered the HHP segment (750kva and above) and initial response to its products seems encouraging. KOEL's 750kva and above range is primarily preferred by real estate developers and in government tenders, where the lowest bidder gets to win the order. To penetrate the market, KOEL has priced its products very aggressively.
LGM acquisition to increase foothold in electric pump market: KOEL has signed a definitive agreement to acquire 76% stake in La-Gajjar Machiniries (LGM) at an EV of 7.9x FY18 EBITDA, with the intent to acquire the balance stake over the next five years. LGM is engaged in the manufacture and sale of electric pumps in both domestic and export markets. It is the market leader in UP and Odisha, and is among the top-5 in 12 states in India, through its brands ‘Varuna’ and ‘Raindrop’.
Strong balance sheet: Despite registering a muted 5% PAT growth in FY17, KOEL reported 22% increase in cash and investments to INR10b. Net working capital increased marginally from 29 days in FY16 to 35 days. KOEL continues to be a net cash company, with RoCE of 11.5% in FY17.
Valuation and view Over the last three years, KOEL has focused on new product development and launches to expand its addressable market and fill the prevailing product gaps. The company has completed its product portfolio expansion in the power genset segment (2.1kva to 1,010kva). KOEL has also acquired a company to expand its offerings in the electric pump segment. With the above mentioned initiatives, KOEL is expected to register revenue CAGR of 12% and PAT CAGR of 23% over FY17-19 (Bloomberg consensus). The stock trades at 28/22x its Bloomberg consensus EPS of INR14/18 for FY18/19. We do not have any rating on the stock.
18 July 2017Update | Sector: Capital Goods
Kirloskar Oil Engines

THEMATIC/STRATEGY RESEARCH GALLERY
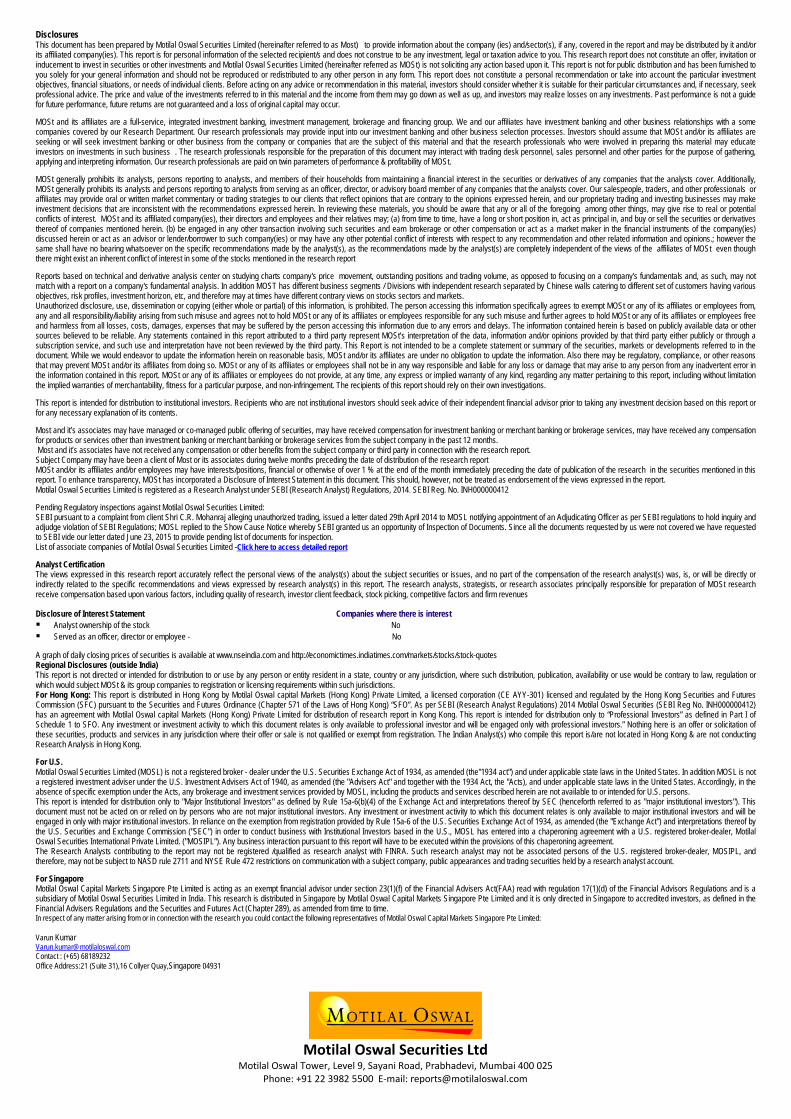
18 July 2017 40
Capital Goods | Diesel Gensets
Disclosures This document has been prepared by Motilal Oswal Securities Limited (hereinafter referred to as Most) to provide information about the company (ies) and/sector(s), if any, covered in the report and may be distributed by it and/or its affiliated company(ies). This report is for personal information of the selected recipient/s and does not construe to be any investment, legal or taxation advice to you. This research report does not constitute an offer, invitation or inducement to invest in securities or other investments and Motilal Oswal Securities Limited (hereinafter referred as MOSt) is not soliciting any action based upon it. This report is not for public distribution and has been furnished to you solely for your general information and should not be reproduced or redistributed to any other person in any form. This report does not constitute a personal recommendation or take into account the particular investment objectives, financial situations, or needs of individual clients. Before acting on any advice or recommendation in this material, investors should consider whether it is suitable for their particular circumstances and, if necessary, seek professional advice. The price and value of the investments referred to in this material and the income from them may go down as well as up, and investors may realize losses on any investments. Past performance is not a guide for future performance, future returns are not guaranteed and a loss of original capital may occur. MOSt and its affiliates are a full-service, integrated investment banking, investment management, brokerage and financing group. We and our affiliates have investment banking and other business relationships with a some companies covered by our Research Department. Our research professionals may provide input into our investment banking and other business selection processes. Investors should assume that MOSt and/or its affiliates are seeking or will seek investment banking or other business from the company or companies that are the subject of this material and that the research professionals who were involved in preparing this material may educate investors on investments in such business . The research professionals responsible for the preparation of this document may interact with trading desk personnel, sales personnel and other parties for the purpose of gathering, applying and interpreting information. Our research professionals are paid on twin parameters of performance & profitability of MOSt. MOSt generally prohibits its analysts, persons reporting to analysts, and members of their households from maintaining a financial interest in the securities or derivatives of any companies that the analysts cover. Additionally, MOSt generally prohibits its analysts and persons reporting to analysts from serving as an officer, director, or advisory board member of any companies that the analysts cover. Our salespeople, traders, and other professionals or affiliates may provide oral or written market commentary or trading strategies to our clients that reflect opinions that are contrary to the opinions expressed herein, and our proprietary trading and investing businesses may make investment decisions that are inconsistent with the recommendations expressed herein. In reviewing these materials, you should be aware that any or all of the foregoing among other things, may give rise to real or potential conflicts of interest. MOSt and its affiliated company(ies), their directors and employees and their relatives may; (a) from time to time, have a long or short position in, act as principal in, and buy or sell the securities or derivatives thereof of companies mentioned herein. (b) be engaged in any other transaction involving such securities and earn brokerage or other compensation or act as a market maker in the financial instruments of the company(ies) discussed herein or act as an advisor or lender/borrower to such company(ies) or may have any other potential conflict of interests with respect to any recommendation and other related information and opinions.; however the same shall have no bearing whatsoever on the specific recommendations made by the analyst(s), as the recommendations made by the analyst(s) are completely independent of the views of the affiliates of MOSt even though there might exist an inherent conflict of interest in some of the stocks mentioned in the research report Reports based on technical and derivative analysis center on studying charts company's price movement, outstanding positions and trading volume, as opposed to focusing on a company's fundamentals and, as such, may not match with a report on a company's fundamental analysis. In addition MOST has different business segments / Divisions with independent research separated by Chinese walls catering to different set of customers having various objectives, risk profiles, investment horizon, etc, and therefore may at times have different contrary views on stocks sectors and markets. Unauthorized disclosure, use, dissemination or copying (either whole or partial) of this information, is prohibited. The person accessing this information specifically agrees to exempt MOSt or any of its affiliates or employees from, any and all responsibility/liability arising from such misuse and agrees not to hold MOSt or any of its affiliates or employees responsible for any such misuse and further agrees to hold MOSt or any of its affiliates or employees free and harmless from all losses, costs, damages, expenses that may be suffered by the person accessing this information due to any errors and delays. The information contained herein is based on publicly available data or other sources believed to be reliable. Any statements contained in this report attributed to a third party represent MOSt’s interpretation of the data, information and/or opinions provided by that third party either publicly or through a subscription service, and such use and interpretation have not been reviewed by the third party. This Report is not intended to be a complete statement or summary of the securities, markets or developments referred to in the document. While we would endeavor to update the information herein on reasonable basis, MOSt and/or its affiliates are under no obligation to update the information. Also there may be regulatory, compliance, or other reasons that may prevent MOSt and/or its affiliates from doing so. MOSt or any of its affiliates or employees shall not be in any way responsible and liable for any loss or damage that may arise to any person from any inadvertent error in the information contained in this report. MOSt or any of its affiliates or employees do not provide, at any time, any express or implied warranty of any kind, regarding any matter pertaining to this report, including without limitation the implied warranties of merchantability, fitness for a particular purpose, and non-infringement. The recipients of this report should rely on their own investigations. This report is intended for distribution to institutional investors. Recipients who are not institutional investors should seek advice of their independent financial advisor prior to taking any investment decision based on this report or for any necessary explanation of its contents. Most and it’s associates may have managed or co-managed public offering of securities, may have received compensation for investment banking or merchant banking or brokerage services, may have received any compensation for products or services other than investment banking or merchant banking or brokerage services from the subject company in the past 12 months. Most and it’s associates have not received any compensation or other benefits from the subject company or third party in connection with the research report. Subject Company may have been a client of Most or its associates during twelve months preceding the date of distribution of the research report MOSt and/or its affiliates and/or employees may have interests/positions, financial or otherwise of over 1 % at the end of the month immediately preceding the date of publication of the research in the securities mentioned in this report. To enhance transparency, MOSt has incorporated a Disclosure of Interest Statement in this document. This should, however, not be treated as endorsement of the views expressed in the report. Motilal Oswal Securities Limited is registered as a Research Analyst under SEBI (Research Analyst) Regulations, 2014. SEBI Reg. No. INH000000412 Pending Regulatory inspections against Motilal Oswal Securities Limited: SEBI pursuant to a complaint from client Shri C.R. Mohanraj alleging unauthorized trading, issued a letter dated 29th April 2014 to MOSL notifying appointment of an Adjudicating Officer as per SEBI regulations to hold inquiry and adjudge violation of SEBI Regulations; MOSL replied to the Show Cause Notice whereby SEBI granted us an opportunity of Inspection of Documents. Since all the documents requested by us were not covered we have requested to SEBI vide our letter dated June 23, 2015 to provide pending list of documents for inspection. List of associate companies of Motilal Oswal Securities Limited -Click here to access detailed report Analyst Certification The views expressed in this research report accurately reflect the personal views of the analyst(s) about the subject securities or issues, and no part of the compensation of the research analyst(s) was, is, or will be directly or indirectly related to the specific recommendations and views expressed by research analyst(s) in this report. The research analysts, strategists, or research associates principally responsible for preparation of MOSt research receive compensation based upon various factors, including quality of research, investor client feedback, stock picking, competitive factors and firm revenues Disclosure of Interest Statement Companies where there is interest Analyst ownership of the stock No Served as an officer, director or employee - No
A graph of daily closing prices of securities is available at www.nseindia.com and http://economictimes.indiatimes.com/markets/stocks/stock-quotes Regional Disclosures (outside India) This report is not directed or intended for distribution to or use by any person or entity resident in a state, country or any jurisdiction, where such distribution, publication, availability or use would be contrary to law, regulation or which would subject MOSt & its group companies to registration or licensing requirements within such jurisdictions. For Hong Kong: This report is distributed in Hong Kong by Motilal Oswal capital Markets (Hong Kong) Private Limited, a licensed corporation (CE AYY-301) licensed and regulated by the Hong Kong Securities and Futures Commission (SFC) pursuant to the Securities and Futures Ordinance (Chapter 571 of the Laws of Hong Kong) “SFO”. As per SEBI (Research Analyst Regulations) 2014 Motilal Oswal Securities (SEBI Reg No. INH000000412) has an agreement with Motilal Oswal capital Markets (Hong Kong) Private Limited for distribution of research report in Kong Kong. This report is intended for distribution only to “Professional Investors” as defined in Part I of Schedule 1 to SFO. Any investment or investment activity to which this document relates is only available to professional investor and will be engaged only with professional investors.” Nothing here is an offer or solicitation of these securities, products and services in any jurisdiction where their offer or sale is not qualified or exempt from registration. The Indian Analyst(s) who compile this report is/are not located in Hong Kong & are not conducting Research Analysis in Hong Kong. For U.S. Motilal Oswal Securities Limited (MOSL) is not a registered broker - dealer under the U.S. Securities Exchange Act of 1934, as amended (the"1934 act") and under applicable state laws in the United States. In addition MOSL is not a registered investment adviser under the U.S. Investment Advisers Act of 1940, as amended (the "Advisers Act" and together with the 1934 Act, the "Acts), and under applicable state laws in the United States. Accordingly, in the absence of specific exemption under the Acts, any brokerage and investment services provided by MOSL, including the products and services described herein are not available to or intended for U.S. persons. This report is intended for distribution only to "Major Institutional Investors" as defined by Rule 15a-6(b)(4) of the Exchange Act and interpretations thereof by SEC (henceforth referred to as "major institutional investors"). This document must not be acted on or relied on by persons who are not major institutional investors. Any investment or investment activity to which this document relates is only available to major institutional investors and will be engaged in only with major institutional investors. In reliance on the exemption from registration provided by Rule 15a-6 of the U.S. Securities Exchange Act of 1934, as amended (the "Exchange Act") and interpretations thereof by the U.S. Securities and Exchange Commission ("SEC") in order to conduct business with Institutional Investors based in the U.S., MOSL has entered into a chaperoning agreement with a U.S. registered broker-dealer, Motilal Oswal Securities International Private Limited. ("MOSIPL"). Any business interaction pursuant to this report will have to be executed within the provisions of this chaperoning agreement. The Research Analysts contributing to the report may not be registered /qualified as research analyst with FINRA. Such research analyst may not be associated persons of the U.S. registered broker-dealer, MOSIPL, and therefore, may not be subject to NASD rule 2711 and NYSE Rule 472 restrictions on communication with a subject company, public appearances and trading securities held by a research analyst account. For Singapore Motilal Oswal Capital Markets Singapore Pte Limited is acting as an exempt financial advisor under section 23(1)(f) of the Financial Advisers Act(FAA) read with regulation 17(1)(d) of the Financial Advisors Regulations and is a subsidiary of Motilal Oswal Securities Limited in India. This research is distributed in Singapore by Motilal Oswal Capital Markets Singapore Pte Limited and it is only directed in Singapore to accredited investors, as defined in the Financial Advisers Regulations and the Securities and Futures Act (Chapter 289), as amended from time to time. In respect of any matter arising from or in connection with the research you could contact the following representatives of Motilal Oswal Capital Markets Singapore Pte Limited: Varun Kumar [email protected] Contact : (+65) 68189232 Office Address:21 (Suite 31),16 Collyer Quay,Singapore 04931
Motilal Oswal Securities Ltd
Motilal Oswal Tower, Level 9, Sayani Road, Prabhadevi, Mumbai 400 025 Phone: +91 22 3982 5500 E-mail: [email protected]


