Dielectric Imaging of Fixed HeLa Cells by In-Liquid ...
13
nanomaterials Article Dielectric Imaging of Fixed HeLa Cells by In-Liquid Scanning Dielectric Force Volume Microscopy Martí Checa 1, * ,† , Ruben Millan-Solsona 1,2 , Adrianna Glinkowska Mares 3 , Silvia Pujals 2,3 and Gabriel Gomila 1,2, * Citation: Checa, M.; Millan-Solsona, R.; Glinkowska Mares, A.; Pujals, S.; Gomila, G. Dielectric Imaging of Fixed HeLa Cells by In-Liquid Scanning Dielectric Force Volume Microscopy. Nanomaterials 2021, 11, 1402. https://doi.org/10.3390/ nano11061402 Academic Editor: Stefano Leporatti Received: 10 May 2021 Accepted: 23 May 2021 Published: 25 May 2021 Publisher’s Note: MDPI stays neutral with regard to jurisdictional claims in published maps and institutional affil- iations. Copyright: © 2021 by the authors. Licensee MDPI, Basel, Switzerland. This article is an open access article distributed under the terms and conditions of the Creative Commons Attribution (CC BY) license (https:// creativecommons.org/licenses/by/ 4.0/). 1 Nanoscale Bioelectric Characterization, Institut de Bioenginyeria de Catalunya (IBEC), The Barcelona Institute of Science and Technology (BIST), c/Baldiri I Reixac 11-15, 08028 Barcelona, Spain; [email protected] 2 Departament d’Enginyeria Electrònica i Biomèdica, Universitat de Barcelona, c/Martí i Franquès 1, 08028 Barcelona, Spain; [email protected] 3 Nanoscopy for Nanomedicine, Institut de Bioenginyeria de Catalunya (IBEC), The Barcelona Institute of Science and Technology (BIST), c/Baldiri I Reixac 11-15, 08028 Barcelona, Spain; [email protected] * Correspondence: [email protected] (M.C.); [email protected] (G.G.) † Present address: ICN2—Institut Català de Nanociència I Nanotecnologia (CERCA-BIST-CSIC), Campus Universitat Autònoma de Barcelona, Bellaterra, 08193 Barcelona, Spain. Abstract: Mapping the dielectric properties of cells with nanoscale spatial resolution can be an important tool in nanomedicine and nanotoxicity analysis, which can complement structural and mechanical nanoscale measurements. Recently we have shown that dielectric constant maps can be obtained on dried fixed cells in air environment by means of scanning dielectric force volume microscopy. Here, we demonstrate that such measurements can also be performed in the much more challenging case of fixed cells in liquid environment. Performing the measurements in liquid media contributes to preserve better the structure of the fixed cells, while also enabling accessing the local dielectric properties under fully hydrated conditions. The results shown in this work pave the way to address the nanoscale dielectric imaging of living cells, for which still further developments are required, as discussed here. Keywords: scanning probe microscopy (SPM); electrostatic force microscopy (EFM); scanning dielec- tric microscopy (SDM); atomic force microscopy (AFM); dielectric properties; functional microscopy 1. Introduction The dielectric properties of cells have been the subject of intense research over the years due to its relevance in many fundamental and applied biological problems. At the whole cell level, changes in the dielectric properties of cells have been studied as possible cancer markers [1] or cell apoptosis indicators [2,3], showing the relevance of such charac- terization in the medical field. At the subcellular level, changes in the dielectric properties of the cell membrane have been shown to play a crucial role in membrane charge storage and charge separation [4], crucial for many intra and inter cellular processes involving electrostatic interactions. The measurement of the dielectric properties at the whole cell level can be done through electrokinetic techniques, such as dielectrophoresis [5], electrorotation [6] or impedance cytometry [7]. Nevertheless, such techniques offer a limited description of the dielectric properties of cells at the local level and, hence, provide averaged values of the spatial variations that take place along the cell itself. Optical techniques involving polarization-dependent [8], voltage-dependent [9] or ionic-dependent [10] fluorescence labels enable obtaining local dielectric information on cells, overcoming the spatial resolu- tion limitation of the electrokinetic measurements. However, these images are difficult to analyze in terms of physical properties such as dielectric constant or conductivity since they generally lack models for its quantification. Nanomaterials 2021, 11, 1402. https://doi.org/10.3390/nano11061402 https://www.mdpi.com/journal/nanomaterials
Transcript of Dielectric Imaging of Fixed HeLa Cells by In-Liquid ...
nanomaterials
Article
Dielectric Imaging of Fixed HeLa Cells by In-Liquid ScanningDielectric Force Volume Microscopy
Martí Checa 1,*,† , Ruben Millan-Solsona 1,2 , Adrianna Glinkowska Mares 3 , Silvia Pujals 2,3
and Gabriel Gomila 1,2,*
�����������������
Citation: Checa, M.; Millan-Solsona,
R.; Glinkowska Mares, A.; Pujals, S.;
Gomila, G. Dielectric Imaging of
Fixed HeLa Cells by In-Liquid
Scanning Dielectric Force Volume
Microscopy. Nanomaterials 2021, 11,
1402. https://doi.org/10.3390/
nano11061402
Academic Editor: Stefano Leporatti
Received: 10 May 2021
Accepted: 23 May 2021
Published: 25 May 2021
Publisher’s Note: MDPI stays neutral
with regard to jurisdictional claims in
published maps and institutional affil-
iations.
Copyright: © 2021 by the authors.
Licensee MDPI, Basel, Switzerland.
This article is an open access article
distributed under the terms and
conditions of the Creative Commons
Attribution (CC BY) license (https://
creativecommons.org/licenses/by/
4.0/).
1 Nanoscale Bioelectric Characterization, Institut de Bioenginyeria de Catalunya (IBEC), The Barcelona Instituteof Science and Technology (BIST), c/Baldiri I Reixac 11-15, 08028 Barcelona, Spain; [email protected]
2 Departament d’Enginyeria Electrònica i Biomèdica, Universitat de Barcelona, c/Martí i Franquès 1,08028 Barcelona, Spain; [email protected]
3 Nanoscopy for Nanomedicine, Institut de Bioenginyeria de Catalunya (IBEC), The Barcelona Institute ofScience and Technology (BIST), c/Baldiri I Reixac 11-15, 08028 Barcelona, Spain;[email protected]
* Correspondence: [email protected] (M.C.); [email protected] (G.G.)† Present address: ICN2—Institut Català de Nanociència I Nanotecnologia (CERCA-BIST-CSIC),
Campus Universitat Autònoma de Barcelona, Bellaterra, 08193 Barcelona, Spain.
Abstract: Mapping the dielectric properties of cells with nanoscale spatial resolution can be animportant tool in nanomedicine and nanotoxicity analysis, which can complement structural andmechanical nanoscale measurements. Recently we have shown that dielectric constant maps canbe obtained on dried fixed cells in air environment by means of scanning dielectric force volumemicroscopy. Here, we demonstrate that such measurements can also be performed in the much morechallenging case of fixed cells in liquid environment. Performing the measurements in liquid mediacontributes to preserve better the structure of the fixed cells, while also enabling accessing the localdielectric properties under fully hydrated conditions. The results shown in this work pave the wayto address the nanoscale dielectric imaging of living cells, for which still further developments arerequired, as discussed here.
Keywords: scanning probe microscopy (SPM); electrostatic force microscopy (EFM); scanning dielec-tric microscopy (SDM); atomic force microscopy (AFM); dielectric properties; functional microscopy
1. Introduction
The dielectric properties of cells have been the subject of intense research over theyears due to its relevance in many fundamental and applied biological problems. At thewhole cell level, changes in the dielectric properties of cells have been studied as possiblecancer markers [1] or cell apoptosis indicators [2,3], showing the relevance of such charac-terization in the medical field. At the subcellular level, changes in the dielectric propertiesof the cell membrane have been shown to play a crucial role in membrane charge storageand charge separation [4], crucial for many intra and inter cellular processes involvingelectrostatic interactions.
The measurement of the dielectric properties at the whole cell level can be donethrough electrokinetic techniques, such as dielectrophoresis [5], electrorotation [6] orimpedance cytometry [7]. Nevertheless, such techniques offer a limited description ofthe dielectric properties of cells at the local level and, hence, provide averaged values ofthe spatial variations that take place along the cell itself. Optical techniques involvingpolarization-dependent [8], voltage-dependent [9] or ionic-dependent [10] fluorescencelabels enable obtaining local dielectric information on cells, overcoming the spatial resolu-tion limitation of the electrokinetic measurements. However, these images are difficult toanalyze in terms of physical properties such as dielectric constant or conductivity sincethey generally lack models for its quantification.
Nanomaterials 2021, 11, 1402. https://doi.org/10.3390/nano11061402 https://www.mdpi.com/journal/nanomaterials
Nanomaterials 2021, 11, 1402 2 of 13
Impedance-based measurements can provide also local dielectric information by re-ducing the measuring electrode size via patterned microelectrode array planar devices(MEAs) [11,12], in liquid working transistors [13] or micro positioned micro and nanoelec-trodes, like in scanning ion conductance or scanning electrochemical microscopy [14–16]or in scanning dielectric microscopy in current sensing mode [17,18]. However, achievingquantitative dielectric sub-micrometric spatial resolution still remains challenging, whichresults in a lack of complete studies of the subcellular dielectric mapping, especially forsmall and delicate cell structures, like axons in neurons or other cell appendages [19]. Theuse of microwaves (GHz) in the near field probed by small conductive antenna, as inscanning microwave microscopy (SMM), have also been explored for dielectric imaging ofcells in liquid environment. Nevertheless, such studies are sometimes restricted to the useof non-polar solvents [20] and/or lack of a quantitative analysis [21].
Electric force-based scanning probe microscopy (SPM techniques, such as scanningdielectric microscopy (SDM) in force detection mode [22], offer an alternative route tomap the dielectric properties of cells, as it has been demonstrated already for cells in dryconditions [23–27]. The extension of this approach to cells in liquid conditions; however, isnot immediate since SDM in liquids triggers a complex frequency and voltage dependentresponse in the system [28], involving phenomena such as ionic migration, surface stressor chemical reactions (especially when low frequency and high voltages are used in theiroperation). Ionic charge screening due to the formation of electrostatic double layers (EDL)is the main issue preventing SDM operation in polar solutions. In non-polar solvents, SDMis easier to apply [29], since ionic screening does not occur. However, these solvents areless relevant for biological applications. To shortcut these issues, smart novel methodswhere developed, like electrochemical force microscopy (EcFM) [30,31], open-loop KelvinProbe Force Microscopy (OL-KPFM) [32,33] or in-liquid SDM in force detection mode(in-liquid SDM) [34–39]. These techniques overcome ionic charge screening by usingdifferent strategies, such as by performing the measurement of the transient behavior afteran excitation, by positioning the tip at a very close distance from the sample (shorter thanthe characteristic Debye screening length, λD) or by applying a high frequency electricpotential, higher than the dielectric relaxation frequency of the electrolyte. Nevertheless, tothe best of our knowledge, such modes have not yet been applied to the challenging caseof the nanoscale dielectric imaging of cells in liquid environment.
In this paper we will show how in-liquid SDM, which has already been successfullyapplied to study the capacitive properties of self-assembled monolayers (SAMs) [36], lipidbilayer patches [38,39], liposomes [40] and functional organic thin film transistors [37]in electrolyte solutions, can be applied to map the dielectric properties of fixed cells inelectrolyte solutions. The measurements are done through the implementation of a fastforce-volumetric mode (in-liquid SDFVM [27,37]), which avoids the application of lateralforces (extremely important for weekly adhered, and soft samples like cells), and enables anaccurate mapping of the local dielectric properties. By using this approach, local equivalentdielectric constant maps of the fixed cells in the electrolyte solutions have been derived. Itis shown that the maps provide information on both the local water content of the cell andits biochemical composition.
2. Materials and Methods2.1. Sample Preparation
HeLa cells from a lab cell line seeded on top of gold-coated silicon substrates were usedin the present study. The protocol to prepare the sample was optimized from the differentoptions shown in [41], and it is similar to the one used in [26], except that the imaging isdone here under an electrolyte solution. In a nutshell, the cells (passage 10) were seeded at50k cells/mL onto the gold-coated silicon substrates (Arrandee metal GmbH, Westfalen,Germany) placed in a petri dish with Dulbecco’s modified Eagle medium (DMEM, asreceived with L-Glutamine, 4.5 g/L D-glucose and pyruvate, Gibco, Fisher Scientific, SL,Madrid, Spain) supplemented with Fetal Bovine Serum (FBS) 10% (Gibco, Fisher Scientific,

Nanomaterials 2021, 11, 1402 3 of 13
SL, Madrid, Spain) and penicillin/streptomycin 1% (Biowest SAS, Nuaillé, France). After24 h of incubation at 5% CO2 and 37 °C, the cells were observed and seemed completelyattached and spread on the gold substrate. Then, cells were fixed. The medium was washedwith PBS, and the cells were incubated with 2.5% glutaraldehyde in PBS for 10 min. Afterfixation, the cells were washed consecutively with different solutions: 75%, 50% and 25%PBS, ultrapure MilliQ water, and 10 mM 3-(N-morpholino)propanesulfonic acid (MOPS )buffer. Prior to the Atomic Force Microscopy (AFM) experiments, the cells and substratewere moved from the petri dish to the AFM sample holder and a drop of 10 mM MOPSbuffer was placed onto the sample to perform the experiments in fully hydrated conditions.
2.2. In-Liquid SDFVM
In-liquid SDFVM measurements were done following the methods of in-liquidSDM [34–36,38,39] extended to work in the force-volume mode [27] in liquid media [37].Figure 1 shows schematically the experimental setup used for in-liquid SDFVM appliedto the imaging of cells. An amplitude modulated high frequency voltage of the formV(t) = VAC
2 (1 + cos(ωmodt)) cos(ωelt), with fmod = 5 kHz and fel = 5 MHz, was appliedbetween a conductive tip (NSC19/Cr–Au MikroMasch, Tallinn, Estonia, k∼0.5–1.5 N m−1,fres∼68 kHz) and the metallic substrate. The value of k was determined by means of thethermal noise method. The relatively large uncertainties in the determination of k (upto a 20%) can affect the extracted geometric parameters of the tip but they do not affectremarkably the extracted homogeneous dielectric constants. The choice of fel was doneprior to the experiments by selecting a frequency above the critical relaxation frequencyof the solution [42], and below 500 MHz to avoid high-frequency impedance mismatchesproduced in the conventional non-shielded circuitry. The applied voltage induces the staticbending of the probe and oscillations at different harmonics of the modulation frequency(for further details see, for instance, [36]). Force-distance curves are acquired at eachpoint of the sample of interest, while both the static deflection of the cantilever D(X,Y;Z)and the amplitude of the first harmonic of the modulated electrical oscillation of the tipAωmod(X,Y;Z) are acquired.
Nanomaterials 2021, 11, 1402 3 of 13
were seeded at 50k cells/mL onto the gold-coated silicon substrates (Arrandee metal
GmbH, Westfalen, Germany) placed in a petri dish with Dulbecco’s modified Eagle me-
dium (DMEM, as received with L-Glutamine, 4.5 g/L D-glucose and pyruvate, Gibco,
Fisher Scientific, SL, Madrid, Spain) supplemented with Fetal Bovine Serum (FBS) 10%
(Gibco, Fisher Scientific, SL, Madrid, Spain) and penicillin/streptomycin 1% (Biowest SAS,
Nuaillé, France). After 24 h of incubation at 5% CO2 and 37 ℃, the cells were observed
and seemed completely attached and spread on the gold substrate. Then, cells were fixed.
The medium was washed with PBS, and the cells were incubated with 2.5% glutaralde-
hyde in PBS for 10 min. After fixation, the cells were washed consecutively with different
solutions: 75%, 50% and 25% PBS, ultrapure MilliQ water, and 10 mM 3-(N-morpho-
lino)propanesulfonic acid (MOPS ) buffer. Prior to the Atomic Force Microscopy (AFM)
experiments, the cells and substrate were moved from the petri dish to the AFM sample
holder and a drop of 10 mM MOPS buffer was placed onto the sample to perform the
experiments in fully hydrated conditions.
2.2. In-Liquid SDFVM
In-liquid SDFVM measurements were done following the methods of in-liquid SDM
[34–36,38,39] extended to work in the force-volume mode [27] in liquid media [37]. Figure
1 shows schematically the experimental setup used for in-liquid SDFVM applied to the
imaging of cells. An amplitude modulated high frequency voltage of the form V(t) =VAC
2(1 + cos(ωmodt))cos(ωelt), with fmod = 5 kHz and fel = 5 MHz, was applied between a
conductive tip (NSC19/Cr–Au MikroMasch, Tallinn, Estonia, k∼0.5–1.5 N m−1, fres∼68
kHz) and the metallic substrate. The value of k was determined by means of the thermal
noise method. The relatively large uncertainties in the determination of k (up to a 20%)
can affect the extracted geometric parameters of the tip but they do not affect remarkably
the extracted homogeneous dielectric constants. The choice of fel was done prior to the
experiments by selecting a frequency above the critical relaxation frequency of the solu-
tion [42], and below 500 MHz to avoid high-frequency impedance mismatches produced
in the conventional non-shielded circuitry. The applied voltage induces the static bending
of the probe and oscillations at different harmonics of the modulation frequency (for fur-
ther details see, for instance, [36]). Force-distance curves are acquired at each point of the
sample of interest, while both the static deflection of the cantilever D(X,Y;Z) and the am-
plitude of the first harmonic of the modulated electrical oscillation of the tip Aωmod(X,Y;Z)
are acquired.
Figure 1. Sketch of the experimental setup for in-liquid SDFVM for the dielectric imaging of fixed HeLa cells in electrolyte
solutions.
Figure 1. Sketch of the experimental setup for in-liquid SDFVM for the dielectric imaging of fixed HeLa cells in elec-trolyte solutions.
The deflection of the cantilever is used to determine the contact point with the sampleand hence determine the sample’s topography, while the oscillation amplitude is used

Nanomaterials 2021, 11, 1402 4 of 13
to measure the derivative of the capacitance of the system, dC/dz, referred to as thecapacitance gradient, through the following relationship dC
dz = 8k(Aωmod)
V2ACmG
, where k is the
cantilever equivalent spring constant, m the photodiode sensitivity and G the gain of theLockin Amplifier (for more details see Ref. [36]).
The operation of in-liquid SDM in the fast force-volumetric scan mode prevents theapplication of lateral forces to the sample, crucial in the case of weekly adhered samples likecells. Nevertheless, for the case of extremely soft samples (like living cells), this mode canadd an extra complication to the data processing, since the determination of the tip-samplecontact point is not straightforward, thus the unperturbed sample’s topography can bedifficult to reconstruct (see [43,44] and the Discussion section). This is not an issue in thecase of fixed cell samples, since the fixation induces cell hardening, which makes easy toidentify the tip-sample contact point and hence the unperturbed topography of the sample(while it preserves reasonably well the cell structure and composition).
A custom-made software written in Matlab (Mathworks) enables building up theso-called Data Cubes from the ensemble of acquired electrical deflection and oscillationcurves, from where, all the different classical electrostatic force microscopy (EFM) imagescan be retrieved (e.g., lift mode or constant plane images) [27].
2.3. Dielectric Constant Mapping
We determined the local equivalent homogeneous dielectric constant of the cells inelectrolyte media by using a local thick-film dielectric model [45]. This model is expectedto work better in liquid media than in air due to the broadening of the field lines in theliquid environment. The model consists of a tip in front of a laterally infinite homogeneousthick dielectric film with thickness hcell, equal to the local thickness of the cell, and dielectricconstant, εcell, to be determined (see Figure 2a). The environment is assumed to havedielectric constant εsol. Ionic conductivity effects are not included since the frequencyof the applied voltage (fel = 5 MHz) is larger than the dielectric relaxation frequency ofthe electrolyte solution (fRC = 0.5 MHz), that can be calculated via conductivity (σsol)measurements as: fRC = σsol
2πε0εsol. The tip is modeled as in previous works [22] by a cone
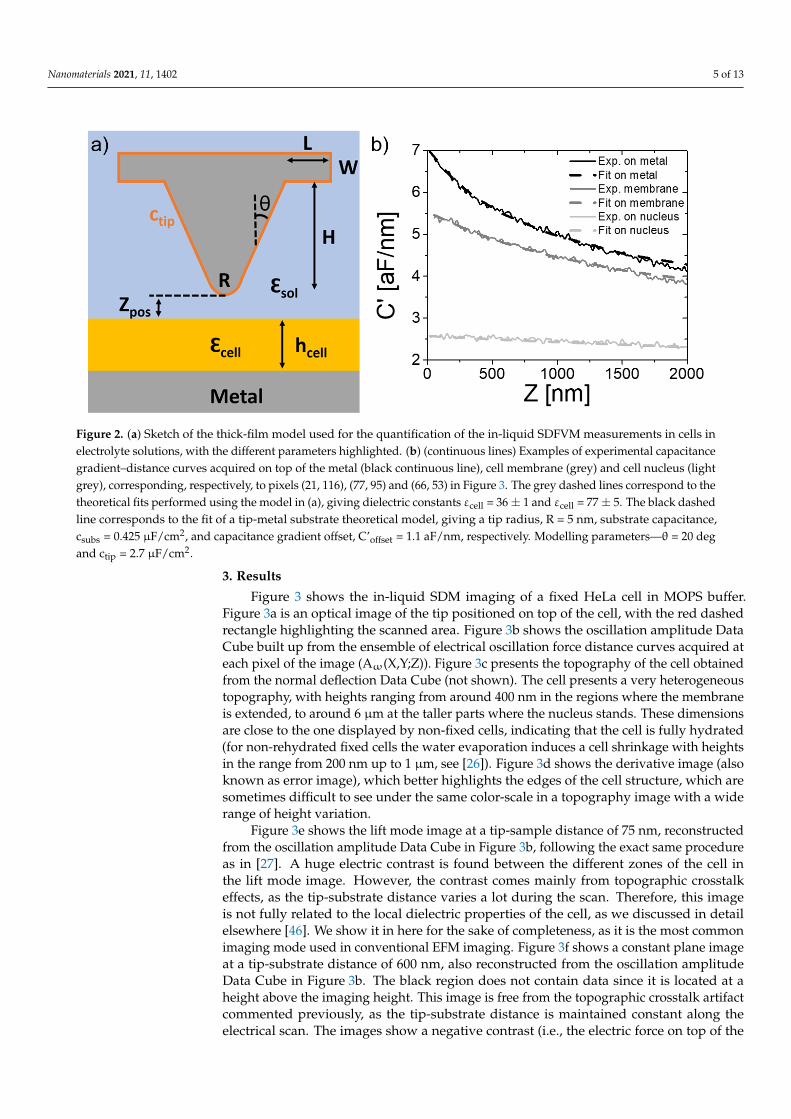
of height H and half angle θ ended with a tangent sphere of radius R and caped with adisc of thickness W and radius L+H·tan(θ). Interfacial capacitances, ctip = 2.7 µF/cm2 andcsubs are added to the tip and bare substrate parts to model interfacial effects in electrolytes,as described elsewhere [36]. The microscopic tip parameters are left to their nominalvalues H = 12.5 µm, W = 3 µm, L = 3 µm, θ = 20 ◦, while the radius and tip interfacialcapacitance (and the capacitance gradient offset) are determined from capacitance gradientapproach curves acquired on the bare substrate, as described earlier [22]. With this setof parameters, capacitance gradient–distance approach curves are calculated for differentvalues of the dielectric constant of the film and different thicknesses and are fitted tothe experimental capacitance–gradient approach curves acquired at each position in thecell, with the film dielectric constant as single fitting parameter. Examples of fitted andexperimental curves for three different positions in a sample (substrate, cell membrane, cellnucleus) are shown in Figure 2b. The theoretical capacitance gradient values are obtainedfrom the calculated electric force acting on the tip, which in turn is obtained by integrationof the Maxwell-stress tensor on the tip surface. The calculations were done by using theelectric currents module in COMSOL Multiphysics 5.4 (COMSOL Inc., Burlington, MAUSA), as explained elsewhere [36].
Nanomaterials 2021, 11, 1402 5 of 13Nanomaterials 2021, 11, 1402 5 of 13
Figure 2. (a) Sketch of the thick-film model used for the quantification of the in-liquid SDFVM meas-
urements in cells in electrolyte solutions, with the different parameters highlighted. (b) (continuous
lines) Examples of experimental capacitance gradient–distance curves acquired on top of the metal
(black continuous line), cell membrane (grey) and cell nucleus (light grey), corresponding, respec-
tively, to pixels (21, 116), (77, 95) and (66, 53) in Figure 3. The grey dashed lines correspond to the
theoretical fits performed using the model in (a), giving dielectric constants εcell = 36 ± 1 and εcell = 77
± 5. The black dashed line corresponds to the fit of a tip-metal substrate theoretical model, giving a
tip radius, R = 5 nm, substrate capacitance, csubs = 0.425 µF/cm2, and capacitance gradient offset, C’offset
= 1.1 aF/nm, respectively. Modelling parameters—θ = 20 deg and ctip = 2.7 µF/cm2.
3. Results
Figure 3 shows the in-liquid SDM imaging of a fixed HeLa cell in MOPS buffer. Fig-
ure 3a is an optical image of the tip positioned on top of the cell, with the red dashed
rectangle highlighting the scanned area. Figure 3b shows the oscillation amplitude Data
Cube built up from the ensemble of electrical oscillation force distance curves acquired at
each pixel of the image (Aω(X,Y;Z)). Figure 3c presents the topography of the cell obtained
from the normal deflection Data Cube (not shown). The cell presents a very heterogeneous
topography, with heights ranging from around 400 nm in the regions where the mem-
brane is extended, to around 6 µm at the taller parts where the nucleus stands. These di-
mensions are close to the one displayed by non-fixed cells, indicating that the cell is fully
hydrated (for non-rehydrated fixed cells the water evaporation induces a cell shrinkage
with heights in the range from 200 nm up to 1 µm, see [26]). Figure 3d shows the derivative
image (also known as error image), which better highlights the edges of the cell structure,
which are sometimes difficult to see under the same color-scale in a topography image
with a wide range of height variation.
Figure 3e shows the lift mode image at a tip-sample distance of 75 nm, reconstructed
from the oscillation amplitude Data Cube in Figure 3b, following the exact same proce-
dure as in [27]. A huge electric contrast is found between the different zones of the cell in
the lift mode image. However, the contrast comes mainly from topographic crosstalk ef-
fects, as the tip-substrate distance varies a lot during the scan. Therefore, this image is not
fully related to the local dielectric properties of the cell, as we discussed in detail elsewhere
[46]. We show it in here for the sake of completeness, as it is the most common imaging
mode used in conventional EFM imaging. Figure 3f shows a constant plane image at a tip-
substrate distance of 600 nm, also reconstructed from the oscillation amplitude Data Cube
in Figure 3b. The black region does not contain data since it is located at a height above
the imaging height. This image is free from the topographic crosstalk artifact commented
previously, as the tip-substrate distance is maintained constant along the electrical scan.
The images show a negative contrast (i.e., the electric force on top of the cell is smaller
than on top of the substrate at the same height). This fact implies that the equivalent ho-
mogeneous dielectric constant of the cell, cell, is lower than the dielectric constant of the
Figure 2. (a) Sketch of the thick-film model used for the quantification of the in-liquid SDFVM measurements in cells inelectrolyte solutions, with the different parameters highlighted. (b) (continuous lines) Examples of experimental capacitancegradient–distance curves acquired on top of the metal (black continuous line), cell membrane (grey) and cell nucleus (lightgrey), corresponding, respectively, to pixels (21, 116), (77, 95) and (66, 53) in Figure 3. The grey dashed lines correspond to thetheoretical fits performed using the model in (a), giving dielectric constants εcell = 36 ± 1 and εcell = 77 ± 5. The black dashedline corresponds to the fit of a tip-metal substrate theoretical model, giving a tip radius, R = 5 nm, substrate capacitance,csubs = 0.425 µF/cm2, and capacitance gradient offset, C’offset = 1.1 aF/nm, respectively. Modelling parameters—θ = 20 degand ctip = 2.7 µF/cm2.
3. Results
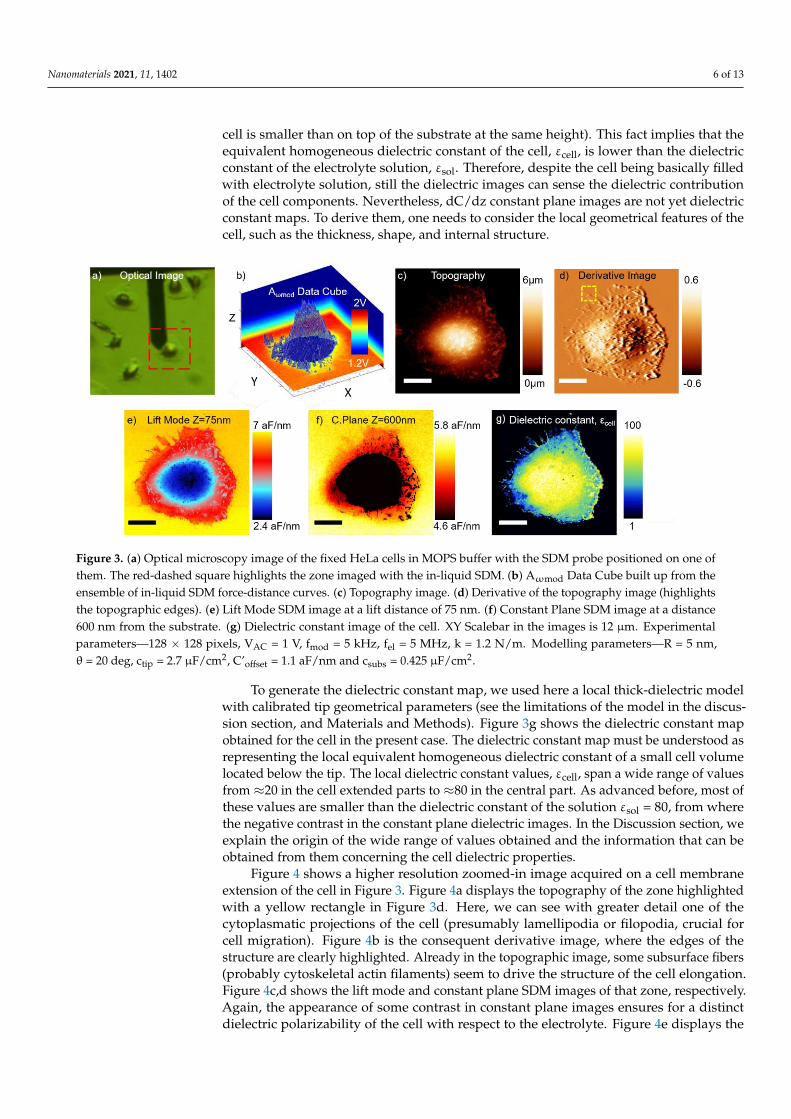
Figure 3 shows the in-liquid SDM imaging of a fixed HeLa cell in MOPS buffer.Figure 3a is an optical image of the tip positioned on top of the cell, with the red dashedrectangle highlighting the scanned area. Figure 3b shows the oscillation amplitude DataCube built up from the ensemble of electrical oscillation force distance curves acquired ateach pixel of the image (Aω(X,Y;Z)). Figure 3c presents the topography of the cell obtainedfrom the normal deflection Data Cube (not shown). The cell presents a very heterogeneoustopography, with heights ranging from around 400 nm in the regions where the membraneis extended, to around 6 µm at the taller parts where the nucleus stands. These dimensionsare close to the one displayed by non-fixed cells, indicating that the cell is fully hydrated(for non-rehydrated fixed cells the water evaporation induces a cell shrinkage with heightsin the range from 200 nm up to 1 µm, see [26]). Figure 3d shows the derivative image (alsoknown as error image), which better highlights the edges of the cell structure, which aresometimes difficult to see under the same color-scale in a topography image with a widerange of height variation.
Figure 3e shows the lift mode image at a tip-sample distance of 75 nm, reconstructedfrom the oscillation amplitude Data Cube in Figure 3b, following the exact same procedureas in [27]. A huge electric contrast is found between the different zones of the cell inthe lift mode image. However, the contrast comes mainly from topographic crosstalkeffects, as the tip-substrate distance varies a lot during the scan. Therefore, this imageis not fully related to the local dielectric properties of the cell, as we discussed in detailelsewhere [46]. We show it in here for the sake of completeness, as it is the most commonimaging mode used in conventional EFM imaging. Figure 3f shows a constant plane imageat a tip-substrate distance of 600 nm, also reconstructed from the oscillation amplitudeData Cube in Figure 3b. The black region does not contain data since it is located at aheight above the imaging height. This image is free from the topographic crosstalk artifactcommented previously, as the tip-substrate distance is maintained constant along theelectrical scan. The images show a negative contrast (i.e., the electric force on top of the
Nanomaterials 2021, 11, 1402 6 of 13
cell is smaller than on top of the substrate at the same height). This fact implies that theequivalent homogeneous dielectric constant of the cell, εcell, is lower than the dielectricconstant of the electrolyte solution, εsol. Therefore, despite the cell being basically filledwith electrolyte solution, still the dielectric images can sense the dielectric contributionof the cell components. Nevertheless, dC/dz constant plane images are not yet dielectricconstant maps. To derive them, one needs to consider the local geometrical features of thecell, such as the thickness, shape, and internal structure.
Nanomaterials 2021, 11, 1402 6 of 13
electrolyte solution, sol. Therefore, despite the cell being basically filled with electrolyte
solution, still the dielectric images can sense the dielectric contribution of the cell compo-
nents. Nevertheless, dC/dz constant plane images are not yet dielectric constant maps. To
derive them, one needs to consider the local geometrical features of the cell, such as the
thickness, shape, and internal structure.
Figure 3. (a) Optical microscopy image of the fixed HeLa cells in MOPS buffer with the SDM probe positioned on one of
them. The red-dashed square highlights the zone imaged with the in-liquid SDM. (b) Aωmod Data Cube built up from the
ensemble of in-liquid SDM force-distance curves. (c) Topography image. (d) Derivative of the topography image (high-
lights the topographic edges). (e) Lift Mode SDM image at a lift distance of 75 nm. (f) Constant Plane SDM image at a
distance 600 nm from the substrate. (g) Dielectric constant image of the cell. XY Scalebar in the images is 12 µm. Experi-
mental parameters—128·128 pixels, VAC = 1 V, fmod = 5 kHz, fel = 5 MHz, k = 1.2 N/m. Modelling parameters—R = 5 nm, θ =
20 deg, ctip = 2.7 µF/cm2, C’offset = 1.1 aF/nm and csubs = 0.425 µF/cm2.
To generate the dielectric constant map, we used here a local thick-dielectric model
with calibrated tip geometrical parameters (see the limitations of the model in the discus-
sion section, and Materials and Methods). Figure 3g shows the dielectric constant map
obtained for the cell in the present case. The dielectric constant map must be understood
as representing the local equivalent homogeneous dielectric constant of a small cell vol-
ume located below the tip. The local dielectric constant values, cell, span a wide range of
values from ≈20 in the cell extended parts to ≈80 in the central part. As advanced before,
most of these values are smaller than the dielectric constant of the solution sol = 80, from
where the negative contrast in the constant plane dielectric images. In the Discussion sec-
tion, we explain the origin of the wide range of values obtained and the information that
can be obtained from them concerning the cell dielectric properties.
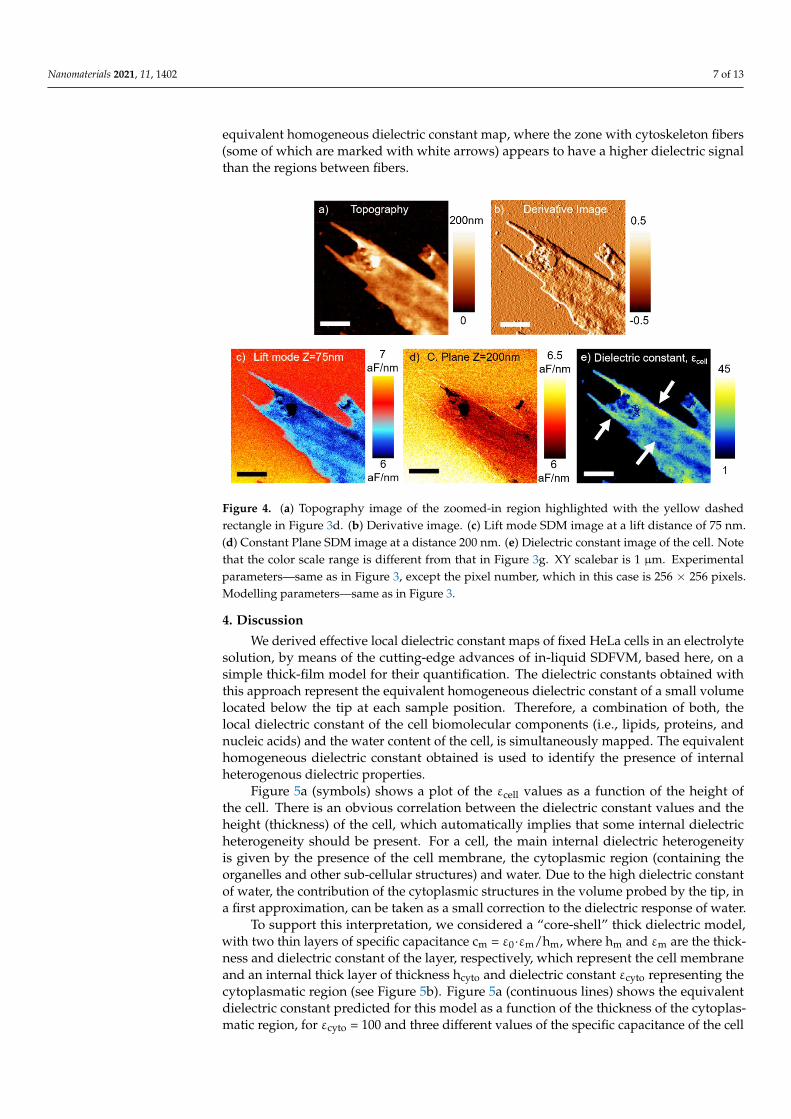
Figure 4 shows a higher resolution zoomed-in image acquired on a cell membrane
extension of the cell in Figure 3. Figure 4a displays the topography of the zone highlighted
with a yellow rectangle in Figure 3d. Here, we can see with greater detail one of the cyto-
plasmatic projections of the cell (presumably lamellipodia or filopodia, crucial for cell mi-
gration). Figure 4b is the consequent derivative image, where the edges of the structure
are clearly highlighted. Already in the topographic image, some subsurface fibers (prob-
ably cytoskeletal actin filaments) seem to drive the structure of the cell elongation. Figure
4c,d shows the lift mode and constant plane SDM images of that zone, respectively. Again,
the appearance of some contrast in constant plane images ensures for a distinct dielectric
polarizability of the cell with respect to the electrolyte. Figure 4e displays the equivalent
homogeneous dielectric constant map, where the zone with cytoskeleton fibers (some of
which are marked with white arrows) appears to have a higher dielectric signal than the
regions between fibers.
Figure 3. (a) Optical microscopy image of the fixed HeLa cells in MOPS buffer with the SDM probe positioned on one ofthem. The red-dashed square highlights the zone imaged with the in-liquid SDM. (b) Aωmod Data Cube built up from theensemble of in-liquid SDM force-distance curves. (c) Topography image. (d) Derivative of the topography image (highlightsthe topographic edges). (e) Lift Mode SDM image at a lift distance of 75 nm. (f) Constant Plane SDM image at a distance600 nm from the substrate. (g) Dielectric constant image of the cell. XY Scalebar in the images is 12 µm. Experimentalparameters—128 × 128 pixels, VAC = 1 V, fmod = 5 kHz, fel = 5 MHz, k = 1.2 N/m. Modelling parameters—R = 5 nm,θ = 20 deg, ctip = 2.7 µF/cm2, C’offset = 1.1 aF/nm and csubs = 0.425 µF/cm2.
To generate the dielectric constant map, we used here a local thick-dielectric modelwith calibrated tip geometrical parameters (see the limitations of the model in the discus-sion section, and Materials and Methods). Figure 3g shows the dielectric constant mapobtained for the cell in the present case. The dielectric constant map must be understood asrepresenting the local equivalent homogeneous dielectric constant of a small cell volumelocated below the tip. The local dielectric constant values, εcell, span a wide range of valuesfrom ≈20 in the cell extended parts to ≈80 in the central part. As advanced before, most ofthese values are smaller than the dielectric constant of the solution εsol = 80, from wherethe negative contrast in the constant plane dielectric images. In the Discussion section, weexplain the origin of the wide range of values obtained and the information that can beobtained from them concerning the cell dielectric properties.
Figure 4 shows a higher resolution zoomed-in image acquired on a cell membraneextension of the cell in Figure 3. Figure 4a displays the topography of the zone highlightedwith a yellow rectangle in Figure 3d. Here, we can see with greater detail one of thecytoplasmatic projections of the cell (presumably lamellipodia or filopodia, crucial forcell migration). Figure 4b is the consequent derivative image, where the edges of thestructure are clearly highlighted. Already in the topographic image, some subsurface fibers(probably cytoskeletal actin filaments) seem to drive the structure of the cell elongation.Figure 4c,d shows the lift mode and constant plane SDM images of that zone, respectively.Again, the appearance of some contrast in constant plane images ensures for a distinctdielectric polarizability of the cell with respect to the electrolyte. Figure 4e displays the
Nanomaterials 2021, 11, 1402 7 of 13
equivalent homogeneous dielectric constant map, where the zone with cytoskeleton fibers(some of which are marked with white arrows) appears to have a higher dielectric signalthan the regions between fibers.
Nanomaterials 2021, 11, 1402 7 of 13
Figure 4. (a) Topography image of the zoomed-in region highlighted with the yellow dashed rec-
tangle in Figure 3d. (b) Derivative image. (c) Lift mode SDM image at a lift distance of 75 nm. (d)
Constant Plane SDM image at a distance 200 nm. (e) Dielectric constant image of the cell. Note that
the color scale range is different from that in Figure 3g. XY scalebar is 1 µm. Experimental parame-
ters—same as in Figure 3, except the pixel number, which in this case is 256·256 pixels. Modelling
parameters—same as in Figure 3.
4. Discussion
We derived effective local dielectric constant maps of fixed HeLa cells in an electro-
lyte solution, by means of the cutting-edge advances of in-liquid SDFVM, based here, on
a simple thick-film model for their quantification. The dielectric constants obtained with
this approach represent the equivalent homogeneous dielectric constant of a small volume
located below the tip at each sample position. Therefore, a combination of both, the local
dielectric constant of the cell biomolecular components (i.e., lipids, proteins, and nucleic
acids) and the water content of the cell, is simultaneously mapped. The equivalent homo-
geneous dielectric constant obtained is used to identify the presence of internal hetero-
genous dielectric properties.
Figure 5a (symbols) shows a plot of the cell values as a function of the height of the
cell. There is an obvious correlation between the dielectric constant values and the height
(thickness) of the cell, which automatically implies that some internal dielectric heteroge-
neity should be present. For a cell, the main internal dielectric heterogeneity is given by
the presence of the cell membrane, the cytoplasmic region (containing the organelles and
other sub-cellular structures) and water. Due to the high dielectric constant of water, the
contribution of the cytoplasmic structures in the volume probed by the tip, in a first ap-
proximation, can be taken as a small correction to the dielectric response of water.
To support this interpretation, we considered a “core-shell” thick dielectric model,
with two thin layers of specific capacitance cm = 0·m/hm, where hm and m are the thickness
and dielectric constant of the layer, respectively, which represent the cell membrane and
an internal thick layer of thickness hcyto and dielectric constant cyto representing the cyto-
plasmatic region (see Figure 5b). Figure 5a (continuous lines) shows the equivalent die-
lectric constant predicted for this model as a function of the thickness of the cytoplasmatic
region, for cyto = 100 and three different values of the specific capacitance of the cell mem-
brane cm = 0.25, 0.5, 1 F/cm2. The theoretically calculated values (lines) follow nicely the
trend of the experimental values. The values obtained for both parameters are within the
range of values reported in the literature for eukaryotic cells, what is quite remarkable.
This result indicates that the dielectric constant maps can provide information on both the
dielectric properties of the cell content and of the cell membrane. We note that the cell
Figure 4. (a) Topography image of the zoomed-in region highlighted with the yellow dashedrectangle in Figure 3d. (b) Derivative image. (c) Lift mode SDM image at a lift distance of 75 nm.(d) Constant Plane SDM image at a distance 200 nm. (e) Dielectric constant image of the cell. Notethat the color scale range is different from that in Figure 3g. XY scalebar is 1 µm. Experimentalparameters—same as in Figure 3, except the pixel number, which in this case is 256 × 256 pixels.Modelling parameters—same as in Figure 3.
4. Discussion
We derived effective local dielectric constant maps of fixed HeLa cells in an electrolytesolution, by means of the cutting-edge advances of in-liquid SDFVM, based here, on asimple thick-film model for their quantification. The dielectric constants obtained withthis approach represent the equivalent homogeneous dielectric constant of a small volumelocated below the tip at each sample position. Therefore, a combination of both, thelocal dielectric constant of the cell biomolecular components (i.e., lipids, proteins, andnucleic acids) and the water content of the cell, is simultaneously mapped. The equivalenthomogeneous dielectric constant obtained is used to identify the presence of internalheterogenous dielectric properties.
Figure 5a (symbols) shows a plot of the εcell values as a function of the height ofthe cell. There is an obvious correlation between the dielectric constant values and theheight (thickness) of the cell, which automatically implies that some internal dielectricheterogeneity should be present. For a cell, the main internal dielectric heterogeneityis given by the presence of the cell membrane, the cytoplasmic region (containing theorganelles and other sub-cellular structures) and water. Due to the high dielectric constantof water, the contribution of the cytoplasmic structures in the volume probed by the tip, ina first approximation, can be taken as a small correction to the dielectric response of water.
To support this interpretation, we considered a “core-shell” thick dielectric model,with two thin layers of specific capacitance cm = ε0·εm/hm, where hm and εm are the thick-ness and dielectric constant of the layer, respectively, which represent the cell membraneand an internal thick layer of thickness hcyto and dielectric constant εcyto representing thecytoplasmatic region (see Figure 5b). Figure 5a (continuous lines) shows the equivalentdielectric constant predicted for this model as a function of the thickness of the cytoplas-matic region, for εcyto = 100 and three different values of the specific capacitance of the cell

Nanomaterials 2021, 11, 1402 8 of 13
membrane cm = 0.25, 0.5, 1 µF/cm2. The theoretically calculated values (lines) follow nicelythe trend of the experimental values. The values obtained for both parameters are withinthe range of values reported in the literature for eukaryotic cells, what is quite remarkable.This result indicates that the dielectric constant maps can provide information on boththe dielectric properties of the cell content and of the cell membrane. We note that thecell content is expected to be composed of electrolyte solution, but due to the crowdednature of the cell cytoplasm it may happen that its actual dielectric constant differs fromthat supposed for water and would resemble more to the dielectric constant of a biologicalsolution with proteins, lipids, DNA, etc., at the frequency of the measurements. The effectof the variations of εcyto predicted by the model is shown in the inset of Figure 5a.
Nanomaterials 2021, 11, 1402 8 of 13
content is expected to be composed of electrolyte solution, but due to the crowded nature
of the cell cytoplasm it may happen that its actual dielectric constant differs from that
supposed for water and would resemble more to the dielectric constant of a biological
solution with proteins, lipids, DNA, etc., at the frequency of the measurements. The effect
of the variations of cyto predicted by the model is shown in the inset of Figure 5a.
Figure 5. (a) (Symbols) Equivalent homogeneous dielectric constant values of the cell in Figure 3g
as a function of the height of the cytoplasm (which is assumed to be the height of the cell minus
twice the thickness of the membrane). (Lines) Equivalent homogeneous dielectric constant as a func-
tion of the cytoplasm height predicted for the core-shell tip-thick dielectric model in (b) for three
different values of the specific capacitance of the cell membrane (cm = 0.25, 0.5 and 1 F/cm2) and a
value of the dielectric constant of the cytoplasmatic region (cyto = 100). Inset: Equivalent homogene-
ous dielectric constant as a function of the height of the cytoplasm predicted by the model in (b) for
a membrane specific capacitance cm = 0.5 F/cm2 and three different values of the dielectric constant
of the cytoplasm (cyto = 60, 78, 100). (b) Tip-core-shell thick dielectric model, with the relevant pa-
rameters highlighted. Parameters of the tip used in the calculations—same as in Figure 3.
The previous analysis explains why, in Figure 3g, we observe a higher dielectric re-
sponse on the tall center of the cell and smaller ones towards the cell edges, where the cell
membrane is more stretched/extended. We assume that this is primarily a direct conse-
quence of the higher relative electrolyte volume (with respect to cell biomolecule volume)
found in the center of the cell with respect to the edges. Similarly, in Figure 4e, we observe
an overall lower dielectric response, because we are on top of the extended membrane
part of the cell which is thin and implies less solution volume beneath the tip than in the
nuclear zone, which is the main source of polarization. However, the better spatial reso-
lution of this image allows us to distinguish different polarization zones. Remarkably, a
higher dielectric response is found in the regions along the cytoskeleton fibers (marked
with white arrows), that are clearly distinguished already in the topography image. We
attribute this higher polarizability regions to a mixed solution-composition response. The
regions along the cytoskeleton fibers, display a higher topography, which means more
relative electrolyte volume beneath the cell at that points. In addition, cytoskeleton fibers
should have a higher proteinic composition with respect to pure membrane regions,
where lipids are expected to be predominant. Both reasons point towards a higher local
polarization of such structural cell parts (as found experimentally). Additional theoretical
models to disentangle each individual contribution would be required, which we consider
to be out of the scope of this work.
Contrary to what happens in the case of the dielectric mapping of fixed cells in dry
conditions [26], where the absence of water (highly polarizable) allows to directly corre-
late the dielectric maps with biochemical composition maps using the dielectric finger-
print of each cell biomolecular component separately, in the case of measuring in liquid
environment, such direct correlation is not as straightforward, and the analysis becomes
Figure 5. (a) (Symbols) Equivalent homogeneous dielectric constant values of the cell in Figure 3g as a function of theheight of the cytoplasm (which is assumed to be the height of the cell minus twice the thickness of the membrane). (Lines)Equivalent homogeneous dielectric constant as a function of the cytoplasm height predicted for the core-shell tip-thickdielectric model in (b) for three different values of the specific capacitance of the cell membrane (cm = 0.25, 0.5 and 1 µF/cm2)and a value of the dielectric constant of the cytoplasmatic region (εcyto = 100). Inset: Equivalent homogeneous dielectricconstant as a function of the height of the cytoplasm predicted by the model in (b) for a membrane specific capacitancecm = 0.5 µF/cm2 and three different values of the dielectric constant of the cytoplasm (εcyto = 60, 78, 100). (b) Tip-core-shellthick dielectric model, with the relevant parameters highlighted. Parameters of the tip used in the calculations—same asin Figure 3.
The previous analysis explains why, in Figure 3g, we observe a higher dielectric re-sponse on the tall center of the cell and smaller ones towards the cell edges, where the cellmembrane is more stretched/extended. We assume that this is primarily a direct conse-quence of the higher relative electrolyte volume (with respect to cell biomolecule volume)found in the center of the cell with respect to the edges. Similarly, in Figure 4e, we observean overall lower dielectric response, because we are on top of the extended membrane partof the cell which is thin and implies less solution volume beneath the tip than in the nuclearzone, which is the main source of polarization. However, the better spatial resolution ofthis image allows us to distinguish different polarization zones. Remarkably, a higherdielectric response is found in the regions along the cytoskeleton fibers (marked with whitearrows), that are clearly distinguished already in the topography image. We attribute thishigher polarizability regions to a mixed solution-composition response. The regions alongthe cytoskeleton fibers, display a higher topography, which means more relative electrolytevolume beneath the cell at that points. In addition, cytoskeleton fibers should have a higherproteinic composition with respect to pure membrane regions, where lipids are expected tobe predominant. Both reasons point towards a higher local polarization of such structuralcell parts (as found experimentally). Additional theoretical models to disentangle each

Nanomaterials 2021, 11, 1402 9 of 13
individual contribution would be required, which we consider to be out of the scope ofthis work.
Contrary to what happens in the case of the dielectric mapping of fixed cells in dry con-ditions [26], where the absence of water (highly polarizable) allows to directly correlate thedielectric maps with biochemical composition maps using the dielectric fingerprint of eachcell biomolecular component separately, in the case of measuring in liquid environment,such direct correlation is not as straightforward, and the analysis becomes more complex.Therefore, the effective dielectric maps are now easier to analyze in terms of polarizationdifferences with respect to the dielectric response of the electrolyte solution itself, assumedto be εsolution ≈ 80. Namely, if the dielectric response of a region is smaller than the oneof the solutions, that means that the detection of some low polarizable biocomponent ofthe cell is affecting the local polarizability. Likewise, if the dielectric response of a regionis higher than the one of the solutions, it implies some higher polarizability of the region.The main sources of change in the dielectric response can be identified as either differentlocal dielectric response of the different biochemical compounds or as different amountof solution volume in the region the tip is sensitive to. Other sources of changes in thedielectric response could also be assigned to local conductivity changes that can arisemixed resistive/capacitive response or different local adsorbates present in the cell surfaceas stated above. For the measurements reported here on fixed cells, for which the internaland external solution should have a similar ionic composition, we expect conductivityeffects to be neglectable (if any), since the measurements are made at frequencies largerthan the dielectric relaxation frequency of the electrolyte.
In addition to what is said above, we must consider at least three potential sourcesof error in the dielectric constant determination in the present work: The non-realisticgeometrical model used (especially at the non-planar parts of the cell), the small conductiv-ity effects if the intracellular media remains with a higher molarity than the extracellularsolution (which would turn into an overestimation of the dielectric constant) and theerror in the contact point determination (which would induce small changes in the hcellconsidered in the model, inducing an overestimation or underestimation of the dielectricconstant value depending on whether the true topography is higher or lower than themeasured one).
Determining the exact lateral resolution of the technique is not straightforward, as itdepends on many different factors, including pixel size, tip radius and cone angle, localgeometry and thickness, and the dielectric response of the environment. For the caseof large-scale images (like the one in Figure 3), the resolution is given by the pixel size(≈450 nm in this case). However, this is not the limit of the technique. For the case of theimage in Figure 4 (where the pixel size is drastically reduced to 23 nm), we approach suchlimit with the goal of probing the smaller cell features (i.e., cytoskeleton fibers), which arein the nanometric range. A full theoretical analysis of the electric force contributions to thetotal electric force in in-liquid SDM, similar to the one we did in the past for SDM in air [47],would be required to accurately determine the resolution limit of the technique and is stillpending. As a rule of thumb, for low polarizable environments, like air, a good estimationof the spatial resolution is the order of magnitude of the tip radius. However, for highpolarizable environments, like the case of water-based solutions, the resolution is normallycoarser, as the relative signal collected through the cone and cantilever of the tip increasesas the dielectric constant of the media is raised. For the conditions and parameters of thepresent study, we have estimated by means of the numerical calculations that the cone andtip apex parts of the probe account, respectively, for around 45% and 55% of the electricforce variations observed in the images, resulting in a lowering of the spatial resolution.That said, we have recently shown in [36] that a spatial resolution down to 50 nm can beachieved in planar samples with in-liquid SDM.
The potential of SPM mechanical and dielectric characterization to obtain subsurfaceinformation has been widely proven [48–51], and in the case of cells could be specificallyrelevant to gather knowledge of internal structure such as smaller cell organelles or internal

Nanomaterials 2021, 11, 1402 10 of 13
cell biological processes [51]. The force-volumetric approach used in this work could enableobtaining both local mechanical and dielectric information on the cell simultaneously. Tothis end, one would need to analyze the normal deflection curves in addition to theoscillation amplitude curves, acquired simultaneously. The normal deflection curves areused here to obtain the topographic image by setting a given set-point, but mechanicalinformation could also be obtained by analyzing further the contact part of the normaldeflection curves. Since fixation [52] induces hardening of the cells, as compared with livingcells, there is not real interest in the mechanical analysis in this case. In any case, like inthe quantification of the dielectric measurements, several factors can affect the mechanicalquantification [53]. Performing such a detailed and complex analysis lies outside the scopeof the present work.
The extension of the proposed approach to the case of living cells still needs furtherinvestigation. Living cells are delicate samples and need to be maintained in specificelectrolyte media to keep its structure and function, and with controlled temperature (37 °C)and CO2 (5%). Cell media for living cells experiments are normally rich in ions to avoidan osmotic shock and also in nutrients necessary to maintain cell functions. However, thepresence of large amounts of mobile charges in the electrolyte may hinder the operation ofin-liquid SDM, limited by its operation at frequencies larger than the electrolyte relaxationfrequency, which escalates quickly with solute molarity. Thus, a balance must be achievedfor the realization of the experiments between preserving cell structure and being able tomeasure its dielectric properties with in-liquid SDM. Typically, using the experimental setupwe implemented for this work, allows to reach the 10–100 MHz frequency range of appliedelectric voltage, and considering other similar implementations one can even reach the GHzrange if a refinement of the electric shielding circuitry is carried out [54]. This experimentallimitation sets a limit for the molarity of the solution to be used, which for our case is inthe order of 10–20 mM range (this number depends also on the chemical composition ofthe solute), but could possibly be extended to 100’s mM if the GHz frequencies are used.
The extension of the proposed method to the dielectric imaging of living cells comeswith other additional adversities, such as the complication of the determination of the“true-topography” of the cell or the presence of active cell movements during the scan times.If such struggles are overcome, we envision in-liquid SDM to be an excellent tool to mapboth static and slow-dynamic biological processes happening at the cellular and subcellularscale, challenging to access by means of any other state-of-the-art electrochemical, opticalor impedance-based methods, which show overwhelmingly large parasitic capacitivecontributions when implemented with sub-micrometric electrodes.
5. Conclusions
We applied the recent developments of in-liquid scanning dielectric microscopy inforce-volume mode to the challenging case of imaging the dielectric properties of fixedeukaryotic cells in electrolyte solutions. We derived local equivalent homogeneous dielec-tric constant maps of the cells with nanometric spatial resolution and showed that theyprovide information on both the water content of the cell and the dielectric properties ofthe cell membrane and cytoplasmatic content. The results presented here pave the wayfor the more interesting case of dielectric imaging of living cells at the nanoscale, wheredielectric changes during biological functional processes could be potentially studied.
Author Contributions: M.C. performed the experiments, analyzed the data, and co-wrote themanuscript; R.M.-S. implemented the experimental setup for in-liquid SDM, developed and per-formed the quantification procedure; A.G.M. and S.P. prepared the samples; G.G. co-wrote themanuscript and supervised the work. All authors have read and agreed to the published version ofthe manuscript.
Funding: Spanish Ministerio de Economıa, Industria y Competitividad and EU FEDER throughGrant No. PID2019-111376RA-I00. Generalitat de Catalunya through Grants No. 2017-SGR1079, andthe CERCA Program. “la Caixa” Foundation (ID 1000010434), with code LCF/BQ/DI17/11620054,

Nanomaterials 2021, 11, 1402 11 of 13
co-funded by the European Union’s Horizon 2020 research and innovation program under the MarieSkłodowska-Curie grant agreement No. 713673.
Data Availability Statement: The data presented in this study are available on request from thecorresponding author.
Acknowledgments: This work was partially supported by the Spanish Ministerio de Economıa, In-dustria y Competitividad and EU FEDER through Grant No. PID2019-111376RA-I00, the Generalitatde Catalunya through Grants No. 2017-SGR1079, and the CERCA Program. AGM acknowledges afellowship from “la Caixa” Foundation (ID 1000010434), with code LCF/BQ/DI17/11620054. Thisproject has received also funding from the European Union’s Horizon 2020 research and innova-tion program under the Marie Skłodowska-Curie grant agreement No. 713673. We acknowledgethe contributions of G. Gramse, M. A. Edwards and L. Fumagalli in the original development ofin-liquid SDM.
Conflicts of Interest: The authors declare no conflict of interest.
References1. Gascoyne, P.R.C.; Wang, X.; Huang, Y.; Becker, F.F. Dielectrophoretic separation of cancer cells from blood. IEEE Trans. Ind. Appl.
1997, 33, 670–678. [CrossRef]2. Patel, P.; Markx, G.H. Dielectric measurement of cell death. Enzym. Microb. Technol. 2008, 43, 463–470. [CrossRef]3. Wang, X.; Becker, F.F.; Gascoyne, P.R.C. Membrane dielectric changes indicate induced apoptosis in HL-60 cells more sensitively
than surface phosphatidylserine expression or DNA fragmentation. Biochim. Biophys. Acta 2002, 1564, 412–420. [CrossRef]4. Gentet, L.J.; Stuart, G.J.; Clements, J.D. Direct measurement of specific membrane capacitance in neurons. Biophys. J. 2000, 79,
314–320. [CrossRef]5. Devi, U.V.; Puri, P.; Sharma, N.N. Electrokinetics of cells in dielectrophoretic separation: A biological perspective. BioNanoSci.
2014, 4, 276–287. [CrossRef]6. Trainito, C.I.; Bayart, E.; Bisceglia, E.; Subra, F.; Français, O.; Le Pioufle, B. Le electrorotation as a versatile tool to estimate
dielectric properties of multi-scale biological samples: From single cell to spheroid analysis. In Proceedings of the 1st World Congresson Electroporation and Pulsed Electric Fields in Biology, Medicine and Food and Environmental Technologies, IFMBE, Portorož, Slovenia,6–10 September 2015; Springer: Singapore, 2016; Volume 53, pp. 75–78. ISBN 9789812878168.
7. Cheung, K.; Gawad, S.; Renaud, P. Impedance spectroscopy flow cytometry: On-chip label-free cell differentiation. Cytom. Part A2005, 65, 124–132. [CrossRef]
8. Signore, G.; Abbandonato, G.; Storti, B.; Sto, M. Imaging the static dielectric constant in vitro and in living cells by bioconjugableGFP chromophore analog. Chem. Commun. 2013, 49, 2–4. [CrossRef]
9. Knöpfel, T.; Song, C. Optical voltage imaging in neurons: Moving from technology development to practical tool. Nat. Rev.Neurosci. 2019, 20, 719–727. [CrossRef]
10. Grienberger, C.; Konnerth, A. Imaging calcium in neurons. Neuron 2012, 73, 862–885. [CrossRef]11. Miccoli, B.; Lopez, C.M.; Goikoetxea, E.; Putzeys, J.; Sekeri, M.; Krylychkina, O.; Chang, S.W.; Firrincieli, A.; Andrei, A.; Reumers,
V.; et al. High-density electrical recording and impedance imaging with a multi-modal CMOS multi-electrode array chip. Front.Neurosci. 2019, 13, 1–14. [CrossRef]
12. Lee, G.H.; Pyun, J.C.; Cho, S. Electrical impedance characterization of cell growth on interdigitated microelectrode array. J. Nanosci.Nanotechnol. 2014, 14, 8342–8346. [CrossRef] [PubMed]
13. Kyndiah, A.; Leonardi, F.; Tarantino, C.; Cramer, T.; Millan-Solsona, R.; Garreta, E.; Montserrat, N.; Mas-Torrent, M.; Gomila, G.Bioelectronic recordings of cardiomyocytes with accumulation mode electrolyte gated organic field effect transistors. Biosens.Bioelectron. 2020, 150, 111844. [CrossRef]
14. Beaulieu, I.; Kuss, S.; Mauzeroll, J.; Geissler, M. Biological scanning electrochemical microscopy and its application to live cellstudies. Anal. Chem. 2011, 83, 1485–1492. [CrossRef]
15. Chen, F.; Panday, N.; Li, X.; Ma, T.; Guo, J.; Wang, X.; Kos, L.; Hu, K.; Gu, N.; He, J. Simultaneous mapping of nanoscaletopography and surface potential of charged surfaces by scanning ion conductance microscopy. Nanoscale 2020, 12, 20737–20748.[CrossRef]
16. Shkirskiy, V.; Kang, M.; McPherson, I.J.; Bentley, C.L.; Wahab, O.J.; Daviddi, E.; Colburn, A.W.; Unwin, P.R. Electrochemicalimpedance measurements in scanning ion conductance microscopy. Anal. Chem. 2020, 92, 12509–12517. [CrossRef]
17. Asami, K. Simulation for the dielectric images of single biological cells obtained using a scanning dielectric microscope. J. Phys. DAppl. Phys. 2008, 41, 085501. [CrossRef]
18. Asami, K. Dielectric imaging of biological cells. Colloid Polym. Sci. 1995, 273, 1095–1097. [CrossRef]19. Novak, P.; Li, C.; Shevchuk, A.I.; Stepanyan, R.; Caldwell, M.; Hughes, S.; Smart, T.G.; Gorelik, J.; Ostanin, V.P.; Lab, M.J.; et al.
Nanoscale live-cell imaging using hopping probe ion conductance microscopy. Nat. Methods 2009, 6, 279–281. [CrossRef][PubMed]
Nanomaterials 2021, 11, 1402 12 of 13
20. Tselev, A.; Velmurugan, J.; Ievlev, A.V.; Kalinin, S.V.; Kolmakov, A. Seeing through walls at the nanoscale: Microwave microscopyof enclosed objects and processes in liquids. ACS Nano 2016, 10, 3562–3570. [CrossRef] [PubMed]
21. Farina, M.; Jin, X.; Fabi, G.; Pavoni, E.; Donato, A.; Mencarelli, D.; Piacenza, F.; Al Hadi, R.; Zhao, Y.; Hwang, J.C.M.; et al. Invertedscanning microwave microscope for in vitro imaging and characterization of biological cells. Appl. Phys. Lett. 2019, 114, 093703.[CrossRef]
22. Fumagalli, L.; Gomila, G. Probing dielectric constant at the nanoscale with scanning probe microscopy. In Capacitance Spectroscipyof Semiconductors; Pan Stanford Publishing: Singapore, 2018; ISBN 9789814774543.
23. Valavade, A.V.; Date, K.S.; Press, M.R.; Kothari, D.C. Scanning dielectric constant microscopy for imaging single biological cells.Biomed. Phys. Eng. Express 2018, 4, 055023. [CrossRef]
24. Valavade, A.V.; Kothari, D.C.; Löbbe, C. Dielectric constant microscopy for biological materials. Am. Inst. Phys. 2013, 1512, 1–3.[CrossRef]
25. Birkenhauer, E.; Neethirajan, S. Characterization of electrical surface properties of mono- and co-cultures of Pseudomonasaeruginosa and methicillin-resistant Staphylococcus aureus using Kelvin probe force microscopy. RSC Adv. 2014, 4, 42432–42440.[CrossRef]
26. Checa, M.; Millan-Solsona, R.; Mares, A.G.; Pujals, S.; Gomila, G. Fast label-free nanoscale composition mapping of eukaryoticcells via scanning dielectric force volume microscopy and machine learning. Small Methods 2021, 2100279. [CrossRef]
27. Checa, M.; Millan-Solsona, R.; Blanco, N.; Torrents, E.; Fabregas, R.; Gomila, G. Mapping the dielectric constant of a singlebacterial cell at the nanoscale with scanning dielectric force volume microscopy. Nanoscale 2019, 11, 20809–20819. [CrossRef][PubMed]
28. Collins, L.; Kilpatrick, J.I.; Kalinin, S.V.; Rodriguez, B.J. Towards nanoscale electrical measurements in liquid by advanced KPFMtechniques: A review. Rep. Prog. Phys. 2018, 81, 086101. [CrossRef]
29. Umeda, K.I.; Kobayashi, K.; Oyabu, N.; Hirata, Y.; Matsushige, K.; Yamada, H. Practical aspects of Kelvin-probe force microscopyat solid/liquid interfaces in various liquid media. J. Appl. Phys. 2014, 116, 134307. [CrossRef]
30. Collins, L.; Jesse, S.; Kilpatrick, J.I.; Tselev, A.; Varenyk, O.; Okatan, M.B.; Weber, S.A.L.; Kumar, A.; Balke, N.; Kalinin, S.V.; et al.Probing charge screening dynamics and electrochemical processes at the solid-liquid interface with electrochemical forcemicroscopy. Nat. Commun. 2014, 5, 1–8. [CrossRef]
31. Collins, L.; Jesse, S.; Kilpatrick, J.I.; Tselev, A.; Okatan, M.B.; Kalinin, S.V.; Rodriguez, B.J. Kelvin probe force microscopy in liquidusing electrochemical force microscopy. Beilstein J. Nanotechnol. 2015, 6, 201–214. [CrossRef]
32. Collins, L.; Kilpatrick, J.I.; Vlassiouk, I.V.; Tselev, A.; Weber, S.A.L.; Jesse, S.; Kalinin, S.V.; Rodriguez, B.J. Dual harmonic Kelvinprobe force microscopy at the graphene-liquid interface. Appl. Phys. Lett. 2014, 104, 133103. [CrossRef]
33. Kobayashi, N.; Asakawa, H.; Fukuma, T. Dual frequency open-loop electric potential microscopy for local potential measurementsin electrolyte solution with high ionic strength. Rev. Sci. Instrum. 2012, 83, 033709. [CrossRef]
34. Gramse, G.; Edwards, M.A.; Fumagalli, L.; Gomila, G. Theory of amplitude modulated electrostatic force microscopy for dielectricmeasurements in liquids at MHz frequencies. Nanotechnology 2013, 24, 415709. [CrossRef] [PubMed]
35. Gramse, G.; Edwards, M.A.; Fumagalli, L.; Gomila, G. Dynamic electrostatic force microscopy in liquid media. Appl. Phys. Lett.2012, 101, 213108. [CrossRef]
36. Millan-Solsona, R.; Checa, M.; Fumagalli, L.; Gomila, G. Mapping the capacitance of self-assembled monolayers atmetal/electrolyte interfaces at the nanoscale by in-liquid scanning dielectric microscopy. Nanoscale 2020, 12, 20658–20668.[CrossRef] [PubMed]
37. Kyndiah, A.; Checa, M.; Leonardi, F.; Millan-Solsona, R.; Di Muzio, M.; Tanwar, S.; Fumagalli, L.; Mas-Torrent, M.; Gomila, G.Nanoscale mapping of the conductivity and interfacial capacitance of an electrolyte-gated organic field-effect transistor underoperation. Adv. Funct. Mater. 2021, 31, 1–8. [CrossRef]
38. Di Muzio, M.; Millan-Solsona, R.; Borrell, J.H.; Fumagalli, L.; Gomila, G. Cholesterol effect on the specific capacitance ofsubmicrometric DOPC bilayer patches measured by in-liquid scanning dielectric microscopy. Langmuir 2020, 36, 12963–12972.[CrossRef] [PubMed]
39. Gramse, G.; Dols-Perez, A.; Edwards, M.A.; Fumagalli, L.; Gomila, G. Nanoscale measurement of the dielectric constant ofsupported lipid bilayers in aqueous solutions with electrostatic force microscopy. Biophys. J. 2013, 104, 1257–1262. [CrossRef]
40. Di Muzio, M.; Millan-Solsona, R.; Dols-Perez, A.; Borrell, J.H.; Fumagalli, L.; Gomila, G. Dielectric properties and lamellarity ofsingle liposomes measured by in-liquid scanning dielectric microscopy. J. Nanobiotechnol.. (accepted for publication).
41. Wright, C.J.; Francis, L.W.; Gonzalez, D.; Ryder, T.; Baer, K.; Rees, M.; White, J.O.; Conlan, R.S. Optimized sample preparation forhigh-resolution AFM characterization of fixed human cells. J. Microsc. 2010, 240, 111–121. [CrossRef]
42. Checa, M.; Millan-Solsona, R.; Gomila, G. Frequency-dependent force between ac voltage biased plates in electrolyte solutions.Phys. Rev. E 2019, 100, 022604. [CrossRef]
43. Benítez, R.; Moreno-Flores, S.; Bolós, V.J.; Toca-Herrera, J.L. A new automatic contact point detection algorithm for AFM forcecurves. Microsc. Res. Tech. 2013, 76, 870–876. [CrossRef] [PubMed]
44. Gavara, N. Combined strategies for optimal detection of the contact point in AFM force-indentation curves obtained on thinsamples and adherent cells. Sci. Rep. 2016, 6, 1–13. [CrossRef] [PubMed]
45. Riedel, C.; Arinero, R.; Tordjeman, P.; Leveque, G.; Schwartz, G.A.; Alegria, A.; Colmenero, J. Nanodielectric mapping of a modelpolystyrene-poly(vinyl acetate) blend by electrostatic force microscopy. Phys. Rev. E 2010, 81, 1–4. [CrossRef] [PubMed]

Nanomaterials 2021, 11, 1402 13 of 13
46. Van Der Hofstadt, M.; Fabregas, R.; Biagi, M.C.; Fumagalli, L.; Gomila, G. Nanoscale dielectric microscopy of non-planar samplesby lift-mode electrostatic force microscopy. Nanotechnology 2016, 27, 405706. [CrossRef] [PubMed]
47. Gomila, G.; Gramse, G.; Fumagalli, L. Finite-size effects and analytical modeling of electrostatic force microscopy applied todielectric films. Nanotechnology 2014, 25, 255702. [CrossRef]
48. Balakrishnan, H.; Millan-Solsona, R.; Checa, M.; Fabregas, R.; Fumagalli, L.; Gomila, G. Depth mapping of metallic nanowirepolymer nanocomposites by scanning dielectric microscopy. Nanoscale 2021. [CrossRef]
49. Fumagalli, L.; Esfandiar, A.; Fabregas, R.; Hu, S.; Ares, P.; Janardanan, A.; Yang, Q.; Radha, B.; Taniguchi, T.; Watanabe, K.; et al.Anomalously low dielectric constant of confined water. Science 2018, 360, 1339–1342. [CrossRef]
50. Fumagalli, L.; Esteban-Ferrer, D.; Cuervo, A.; Carrascosa, J.L.; Gomila, G. Label-free identification of single dielectric nanoparticlesand viruses with ultraweak polarization forces. Nat. Mater. 2012, 11, 808–816. [CrossRef]
51. Guerrero, C.R.; Garcia, P.D.; Garcia, R. Subsurface imaging of cell organelles by force microscopy. ACS Nano 2019, 13, 9629–9637.[CrossRef]
52. Kim, S.O.; Kim, J.; Okajima, T.; Cho, N.J. Mechanical properties of paraformaldehyde-treated individual cells investigated byatomic force microscopy and scanning ion conductance microscopy. Nano Converg. 2017, 4, 1–8. [CrossRef]
53. Garcia, R. Nanomechanical mapping of soft materials with the atomic force microscope: Methods, theory and applications. Chem.Soc. Rev. 2020, 49, 5850–5884. [CrossRef] [PubMed]
54. Gramse, G.; Kölker, A.; Škeren, T.; Stock, T.J.Z.; Aeppli, G.; Kienberger, F.; Fuhrer, A.; Curson, N.J. Nanoscale imaging of mobilecarriers and trapped charges in delta doped silicon p–n junctions. Nat. Electron. 2020, 3, 531–538. [CrossRef]